Article

Effect of Scanning Speed on Microstructure and Properties of Ni/B4C/TiC Coating

1
School of Mechanical and Civil Engineering, Jilin Agricultural Science and Technology College, Jilin 132101, China
2
International Shipping Research Institute, Jiujiang Vocational University of Science and Technology, Jiujiang 332020, China
3
School of Mechanical Engineering, Northeast Electric Power University, Jilin 132012, China
*
Author to whom correspondence should be addressed.
Coatings 2025, 15(8), 932; https://doi.org/10.3390/coatings15080932 (registering DOI)
Submission received: 13 July 2025 / Revised: 1 August 2025 / Accepted: 7 August 2025 / Published: 9 August 2025

Abstract

Ni/B4C/TiC coating was prepared using laser cladding technology with 45 steel as substrate material. The effects of different scanning speeds on phase composition, microstructure, microhardness, and tribological properties were investigated. It was found that the coating is primarily composed of Fe3B, Fe3C, B2Fe3Ni3, TiC, and solid solution of [Fe, Ni]. TiC particles are not completely dissolved, which promotes grain refinement. The microhardness increases with the increase in scanning speed and reaches the maximum value at 240 mm/min. The wear resistance test revealed that the coating exhibited the best wear resistance at 240 mm/min. The main wear mechanisms were fatigue wear, abrasive wear, and a small amount of oxidative wear.

1. Introduction

As a high-quality carbon structural steel, 45 steel has been widely used in many fields such as machinery manufacturing [1], axle parts, automobile chassis, and suspension systems. However, 45 steel also has some shortcomings, such as low hardenability, low hardness and poor wear resistance [2,3]. Therefore, repairing and strengthening surface of 45 steel is of great significance in industrial production, as it extends the service life of parts and improves their wear resistance.
Laser cladding is a surface modification technology [4]. It can improve the mechanical properties of the material surface and is essential in industries that require high-performance coatings [5]. With flexible control of laser parameters such as power, scanning speed, and powder delivery speed, the microstructure and properties of the coating can be changed to meet specific application requirements [6,7,8]. Common materials used in laser cladding include Fe-based alloy powders, Co-based alloy powders, Ni-based alloy powders, and high entropy alloy powders [9,10,11,12]. Ni-based coating has characteristics of high fluidity, good wettability, and low price [13]. However, Ni-based coating microhardness and wear resistance are relatively poor and especially under harsh working conditions, the simple Ni-based coating cannot meet the requirements of use. Therefore, how to improve the wear resistance of Ni-based coatings has become an urgent problem [14,15]. Due to their high hardness and high wear resistance, ceramic materials have received great attention to fabricating high-strength metal matrix composites [16,17]. Zhang et al. [18] used laser cladding technology to prepare Ni60, SiC, and TiC coatings on TC4 surface. It was found that coatings significantly enhanced microhardness and wear resistance of the TC4 substrate. The wear rate of the 20% SiC coating was the lowest. Han et al. [19] added different amounts of graphene to nickel-based coating. When 4 wt. % graphene was added, friction coefficient and wear volume of the coating achieved the minimum values, which were 15.44% and 36.29% lower than those of pure Ni-based alloy coating, respectively. Zhang et al. [20] prepared Ni60/WC coatings using laser cladding at different scanning speeds. It was found that the Ni60/WC coating produced at a scanning speed of 60 mm/s exhibited the best wear resistance.
In order to expand the application field of 45 steel, this study will analyze the material and structural design of Ni-based coating. Among many ceramic materials, TiC and B4C have low density, high melting points (3140 °C and 2450 °C, respectively), high hardness, high wear resistance and good corrosion resistance, and excellent bonding to nickel [21,22]. Compared with the widely studied Ni/WC or Ni/SiC composites, the Ni/B4C/TiC system selected in this study has significant advantages. Unlike the high-density WC and low-density SiC, TiC has a relatively moderate density and can be more uniformly distributed within the coating. Moreover, during laser cladding, B4C can react with the Fe elements in the substrate to form strengthening phases such as Fe3B and form an “in situ reaction strengthening + particle dispersion strengthening” synergistic effect with TiC particles. This dual strengthening mechanism is more effective than the strengthening effect of a single WC or SiC particle. In the present study, the effects of scanning speeds on phase composition, microstructure, and microhardness of the coating were investigated. The wear resistance and wear mechanism of the coating were also analyzed. These findings are expected to provide valuable insights into optimizing the laser cladding process, potentially enhancing coating quality and durability.

2. Materials and Methods

The substrate material used in the test was 45 steel, with dimensions of 50 mm × 30 mm × 10 mm. The base material is provided by Mingshang Special Steel Co., Ltd., Wuxi, China. The chemical composition of 45 steel is shown in Table 1. Ni powder (purity > 99.5%, average particle size 48 µm), B4C powder (purity > 99.5%, average particle size 150 µm), and TiC powder (purity > 99.5%, average particle size 50 nm) were used to prepare the coatings. The powders were procured from Xingtai Xinnai Metal Materials Co., Ltd., Xingtai, China. B4C and TiC are mixed in a mass ratio of 1:1 and the mixed powder was denoted as M. The 20 wt. % M powder and 80 wt. % Ni powder were mixed using the KE-0.4L grinding mill (Tianjin Zhongke Qiuren Automation Technology Co., Ltd., Tianjin, China). The rotational speed of this grinding machine is 260 r/min. The mixing time is 1 h, and the ratio of balls to powder was 3:1. The preset powder method was employed in this experiment. Before the laser cladding experiment, abrasive paper was used to remove the oxide layer and roughen the substrate, and alcohol was used to clean the dirt. Then the mixed powder with a thickness of 1 mm was spread on the surface of the 45 steel.
The laser cladding was executed using a DL-WL35 CO2 laser device (Shenyang Continental Laser Complete Equipment Co., Ltd., Shenyang, China), which can generate laser power of 2000 W. In the process of laser cladding, the laser power was 1600 W, the laser spot diameter was 3 mm, the argon protection flow rate is 6 L/min, the overlap rate is 30%, and the reciprocating scanning mode is set at room temperature. A composite powder with a thickness of 1 mm was spread on the surface of 45 steel. The laser cladding schematic diagram is shown in Figure 1.
X-ray diffractometer (TD-3500, CuKα Dandong Tongda Technology Co., Ltd., Dandong, China) was used to detect phase composition of the coating, with an angle fluctuation range of 20° to 90°. Perform grinding and polishing on the cross-section of the coating. Then chemical etching was performed in a ferric chloride hydrochloric acid etching solution (FeCl3:HCl = 1:2) for 40 s, the microstructure and element distribution of the coating cross-section were analyzed by SEM (JSM-IT200 Japan Electronics Corporation, Tokyo, Japan) and energy dispersive spectrometer (EDS).
The coating cross-section microhardness was assessed at 100 μm intervals from the coating surface to the substrate region utilizing an HXD-1000TMC/LCD microhardness tester (Wuxi Metes Precision Technology Co., Ltd., Wuxi, China). A preload of 200 gf was held for 15 s. The average microhardness at each depth was determined from the measured data of three indentations on the same level. In the tribological test, a high-speed reciprocating fatigue friction and wear tester (MGW-02 Jinan Yihua Frictional Testing Technology Co., Ltd., Jinan, China) was selected. During the wear test, GCr15 steel ball was selected as the counterpart, the frequency was 10 Hz, the wear time was 30 min, the load was 30 N, and the reciprocating distance was 5 mm. The mass of the samples before and after the wear test was measured 5 times, respectively, and the average value of the mass before and after wear was obtained to calculate the wear rate. The wear rate of the coating was calculated by Formula (1). After the wear experiment, the wear morphology was observed by SEM.
W = m 1 m 2 L
In the formula, L is the sliding distance (m); m1 is the mass of the sample before wear (g); m2 is the mass of the sample after wear (g); W is the wear rate (g/m).

3. Results and Discussion

3.1. Phase Analysis

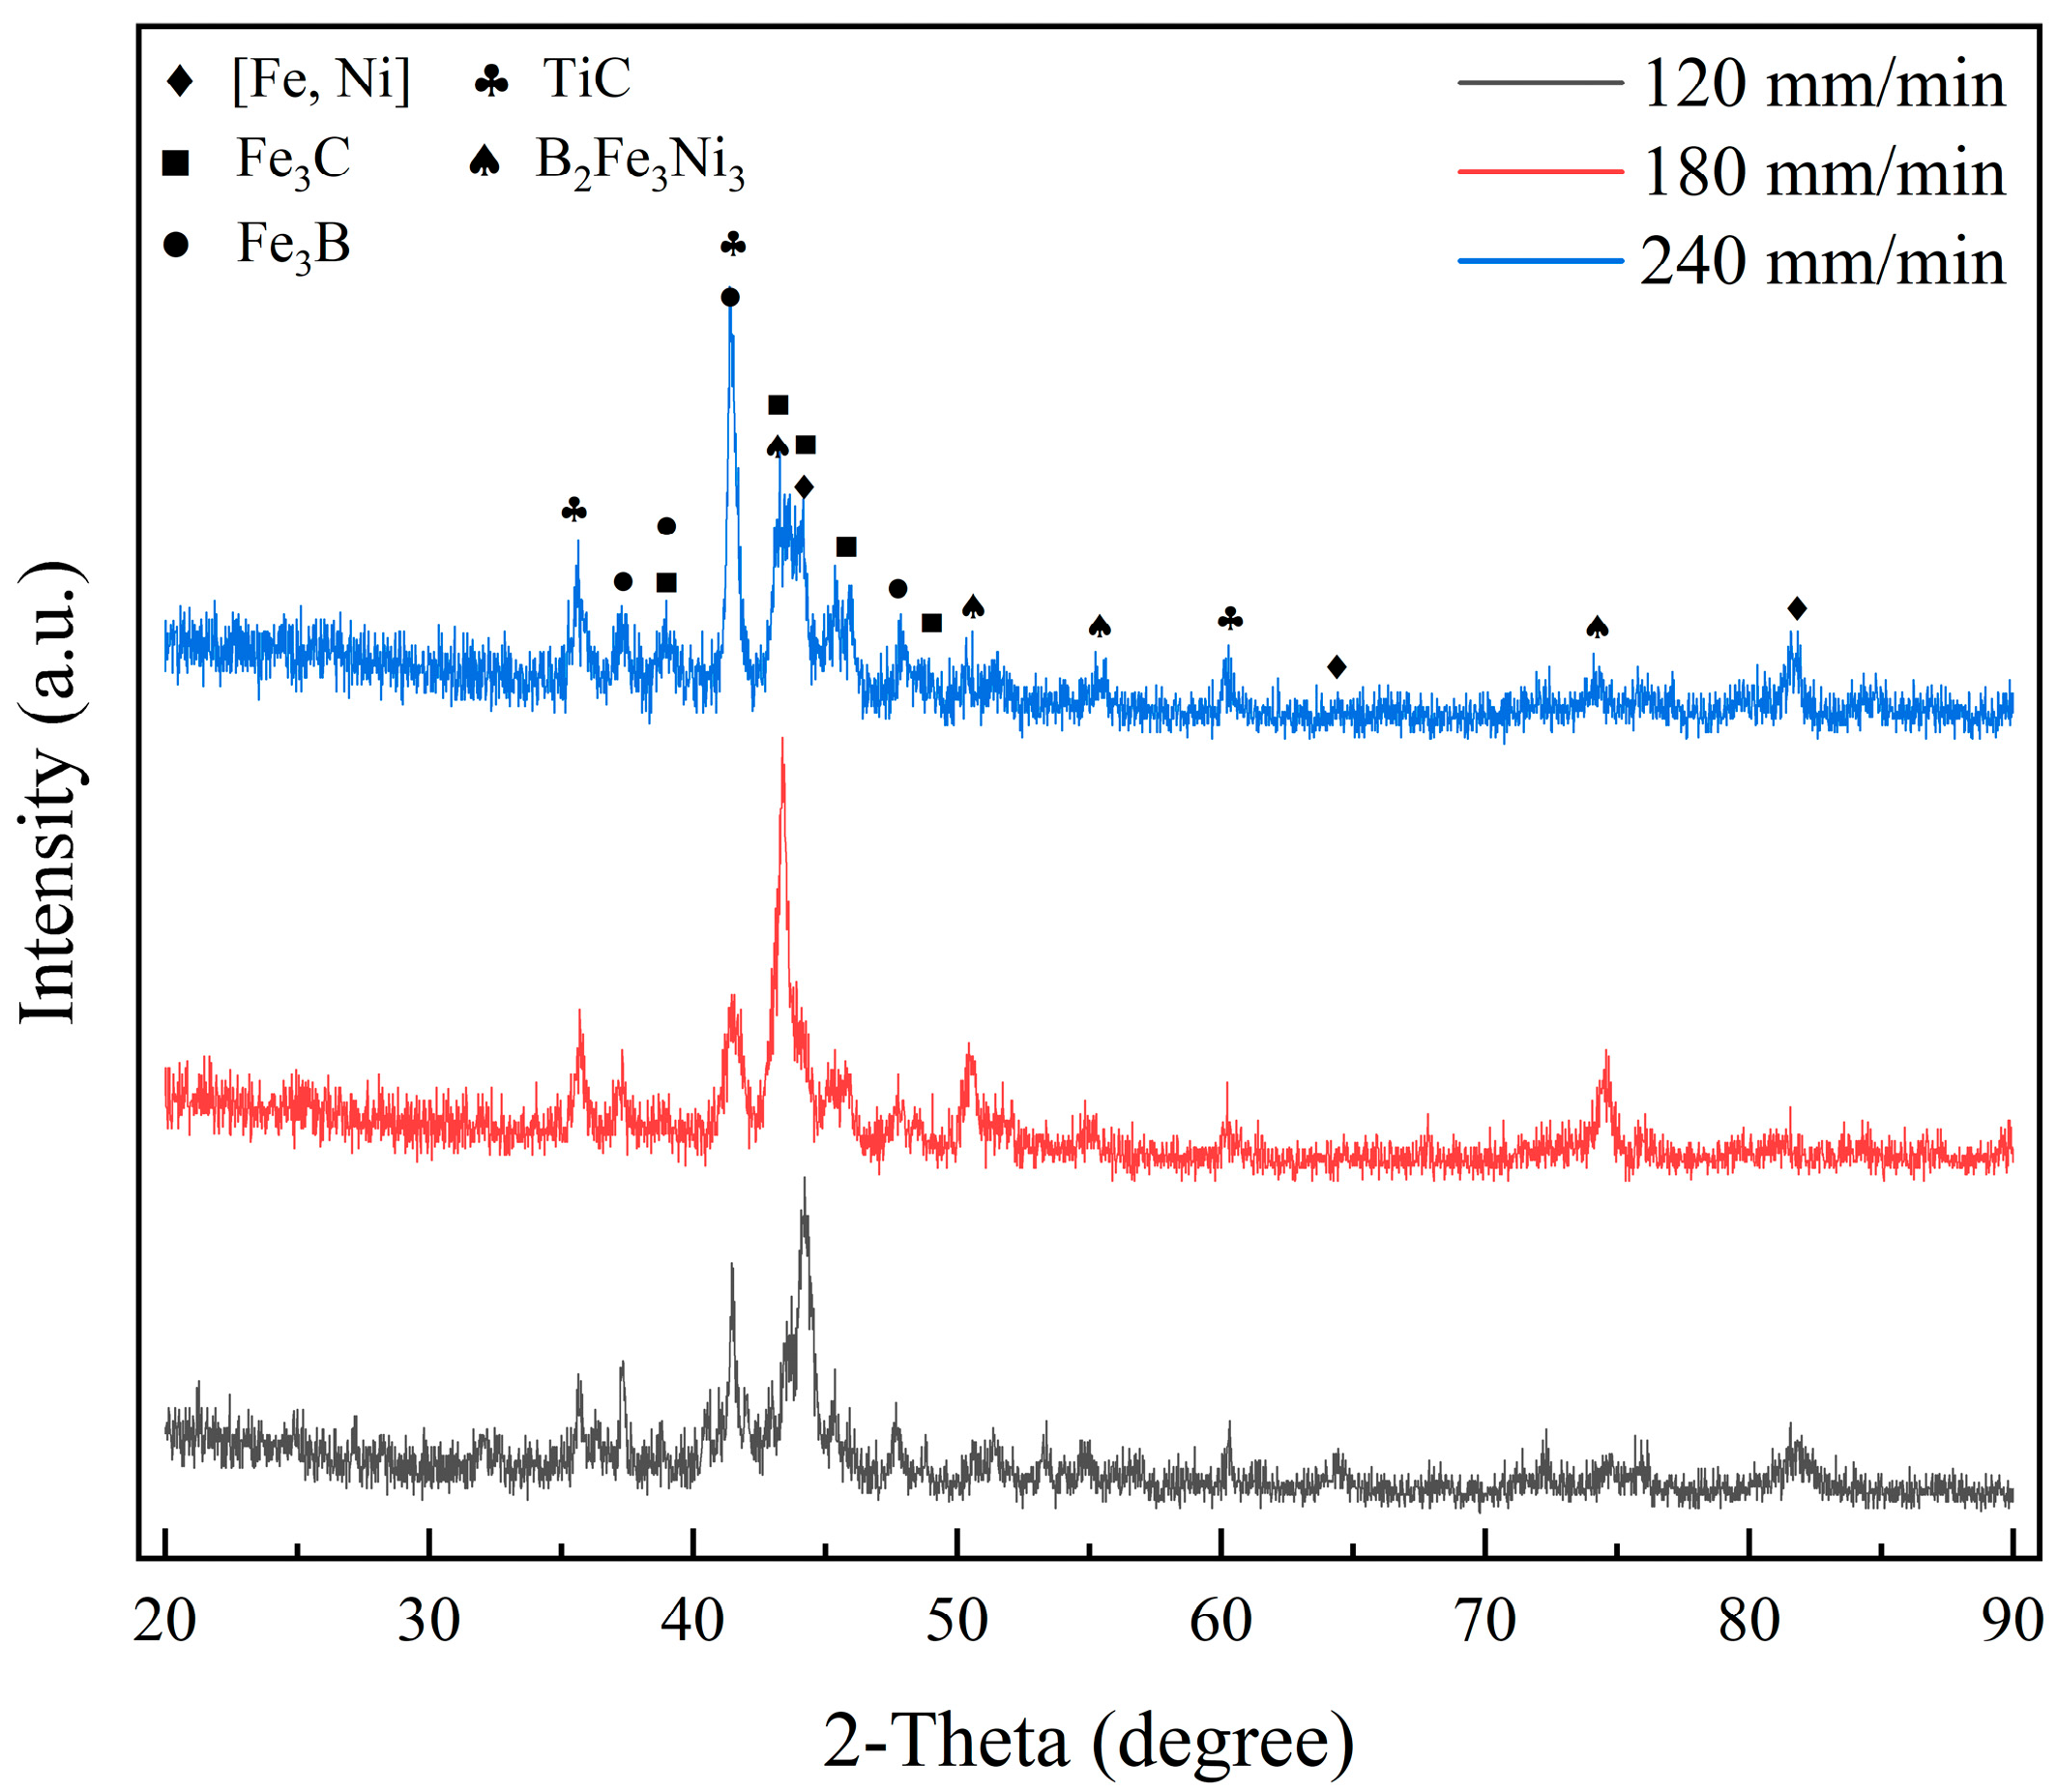
Figure 2 shows XRD results of the coating. The coating primarily consists of Fe3B, Fe3C, B2Fe3Ni3, TiC, and solid solution of [Fe, Ni]. The phase compositions of the XRD patterns of the coatings with different laser scanning speeds are the same. This result shows that the change in laser scanning speed will not change the phase composition of the coating but will affect the phase content. As the scanning speed increases, the diffraction intensities of Fe3C, Fe3B, and TiC also show an upward trend. This suggests that higher scanning speeds slow down the decomposition of TiC particles. Furthermore, no B4C phase was detected, which indicates that the B4C particles have completely decomposed and transformed into new phases such as Fe3B and Fe3C. The diffraction intensities of B2FeNi3 and the solid solution [Fe, Ni] show a trend of increasing first and then decreasing, reaching the maximum when the laser scanning speed is 180 mm/min.

3.2. Microstructure Analysis

Figure 3 shows the cross-sectional morphology of the coating at different scanning speeds. The melting depth of the coating decreases as the laser scanning speed increases. The coating shows a small penetration depth when the laser scanning speed increases to 240 mm/min. This reduction in melting depth is attributed to the increase in scanning speed, which lowers energy density. According to Formula (2), it can be concluded that the increase in laser scanning speed leads to a decrease in laser energy density, which reduces the heat input and consequently diminishes the degree of substrate melting. In addition, it was observed that a small number of pores appeared on the top of coating at the scanning speed of 120 mm/min in Figure 3a, which was caused by the metal vapor generated by irradiation of high energy laser beam in molten pool during the laser cladding process and did not have time to overflow and generate keyholes [23].
E = P D V S
where P represents the laser power (W), D is the spot diameter (mm), Vs is the scanning speed (mm/min), and E is the laser energy density (J/mm3).
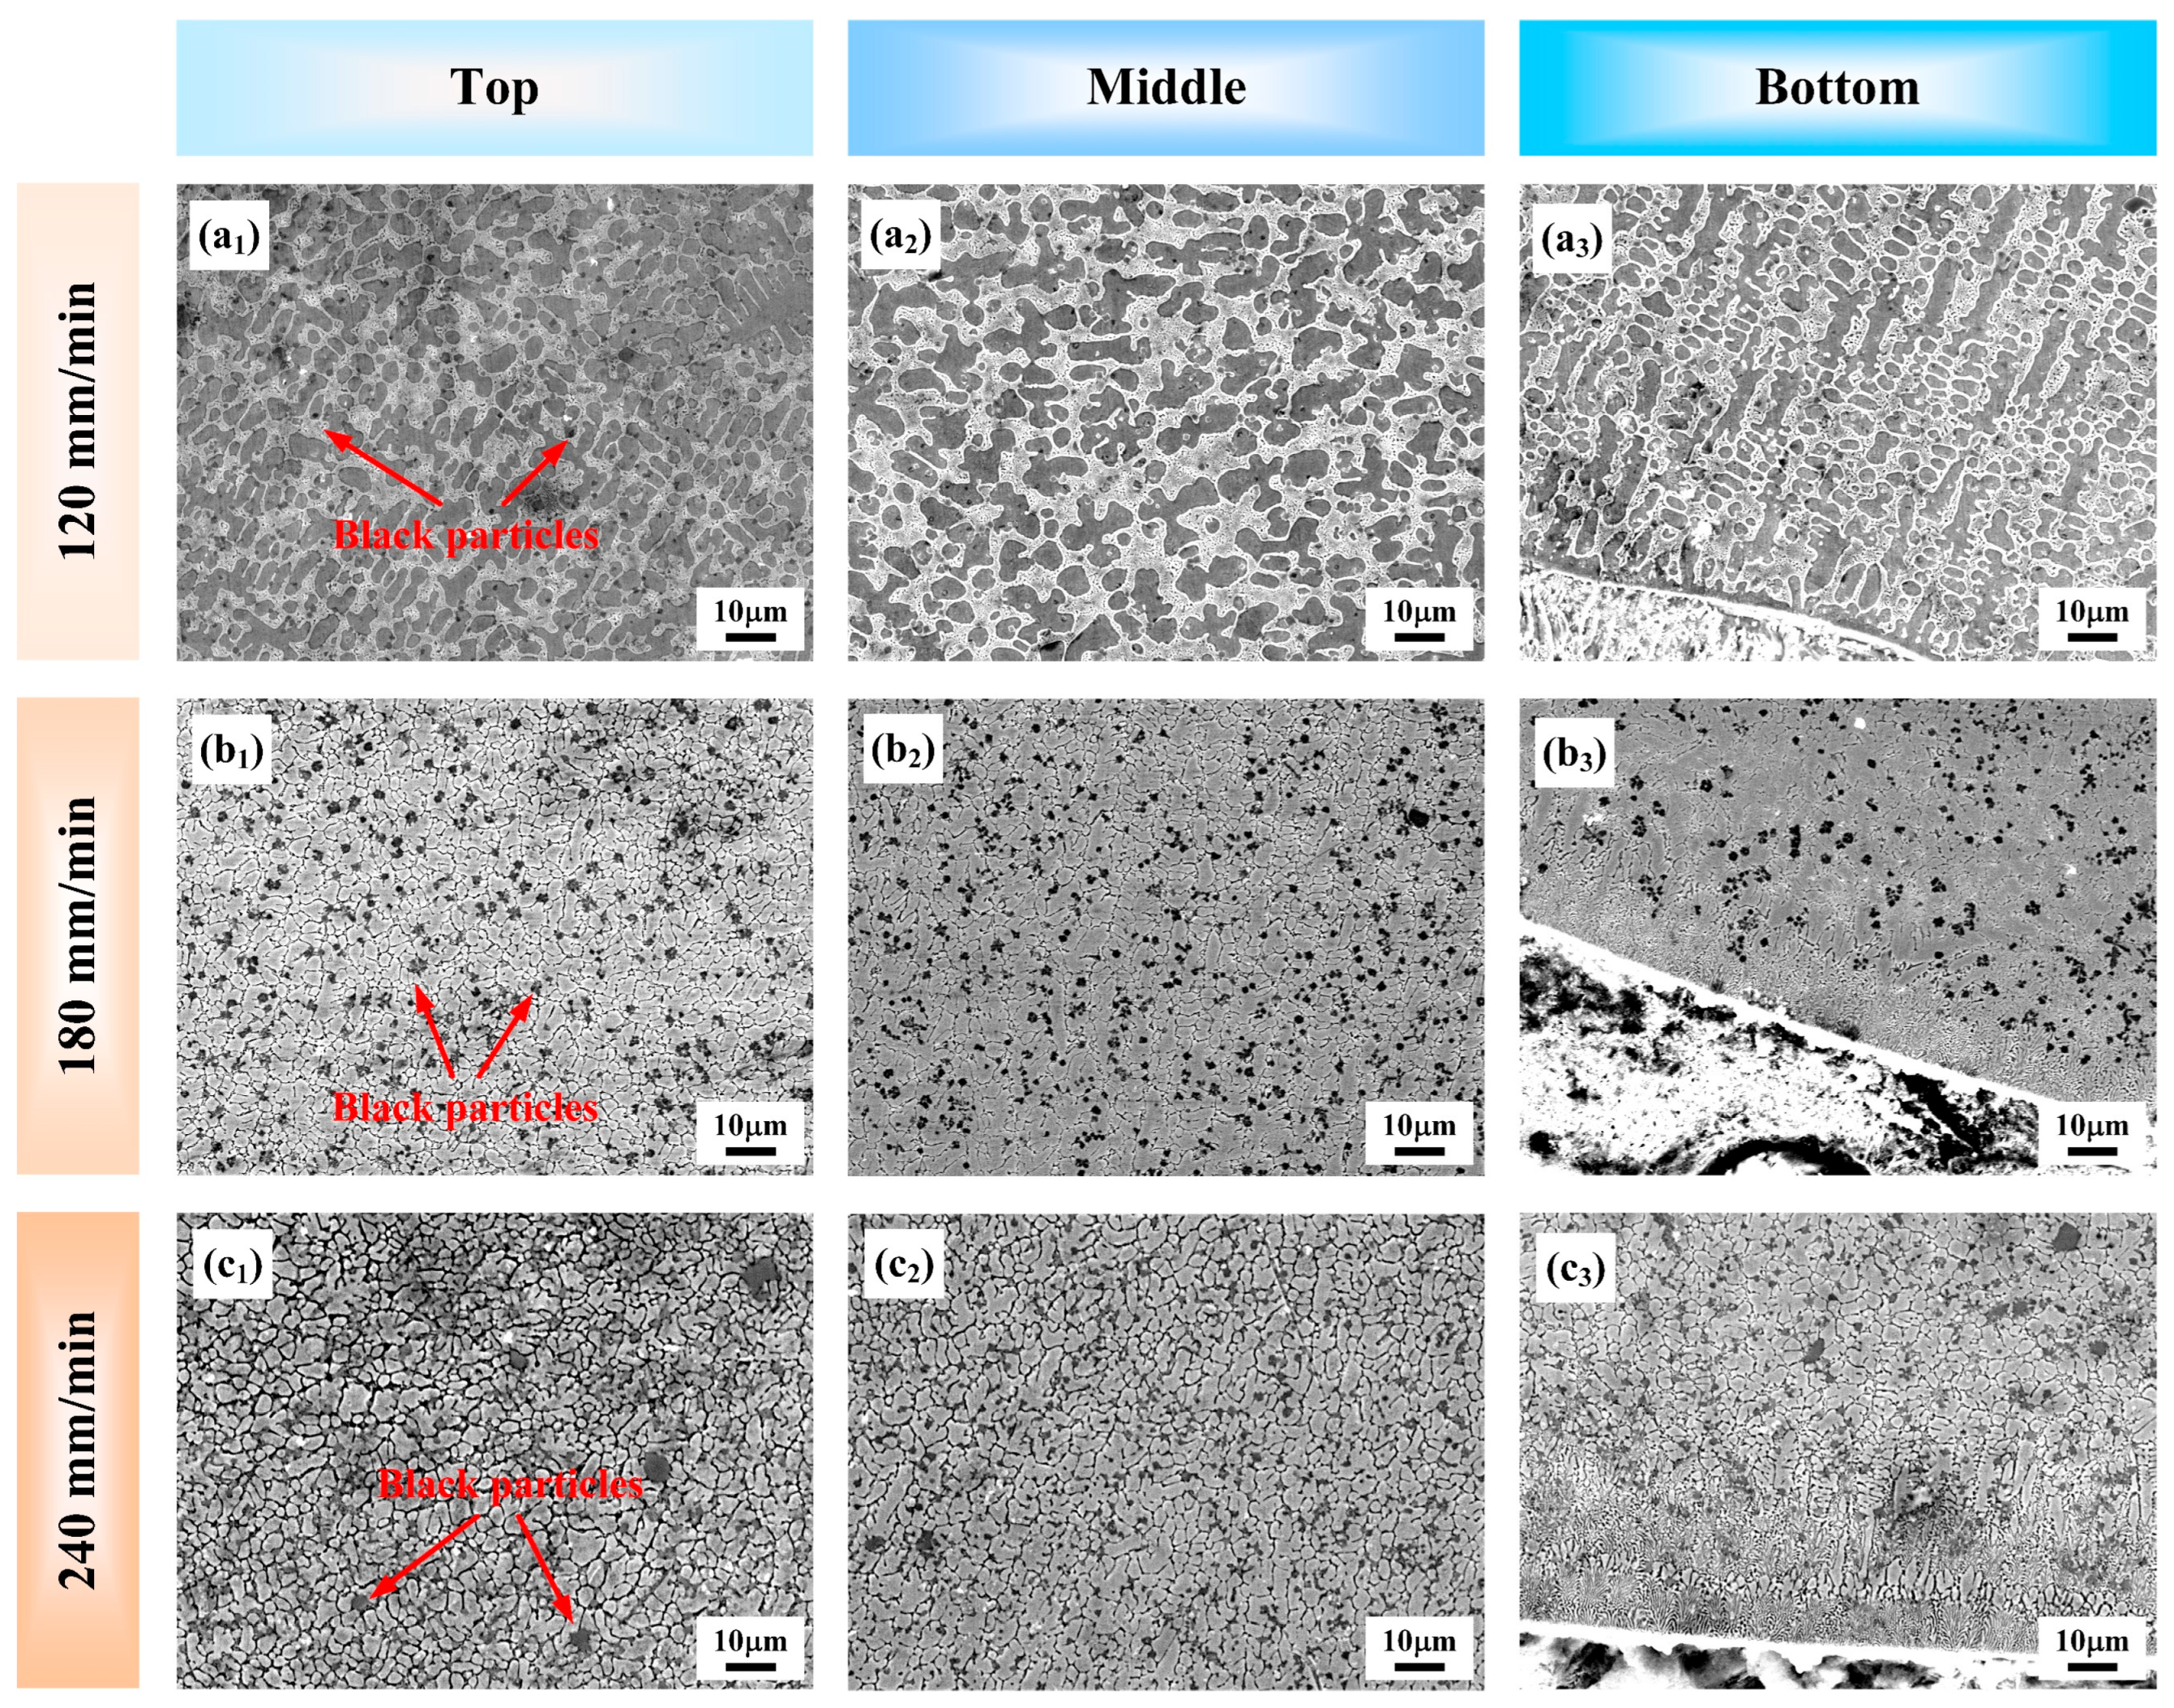
The microstructure of upper, middle and lower parts of the coating at different scanning speeds is shown in Figure 4. When scanning speed is 120 mm/min, the upper section of the coating mainly consists of equiaxial and columnar crystals, the middle part is larger than the upper part and the columnar crystals grow into primary dendrites, and the lower part mainly consists of coarse dendritic crystals and a small amount of columnar crystals. When scanning speed was 240 mm/min, the upper, middle, and lower parts of the coating showed small equiaxed crystals, and black particles were found at grain boundaries. Comparing Figure 4(a1–c1), the grain size decreases with the increase in laser scanning speed. According to Formula (2), it can be concluded that the increase in laser scanning speed leads to a decrease in laser energy density, while the solidification speed of the coating accelerates, thereby achieving grain refinement.
The surface scanning results of the coatings with different laser scanning speeds are shown in Figure 5. Among them, the Fe and B elements are uniformly distributed in the microstructure of the coating. The Ni element is predominantly distributed within the grains, which are primarily composed of B2Fe3Ni3 and solid solution [Fe, Ni]. The C element is mainly distributed in the grain boundary. Combined with XRD results, Fe3C and Fe3B are mainly distributed at grain boundaries. Ti and C elements are enriched in black particles. Combined with XRD results, the black particles are undissolved TiC particles. These undissolved TiC particles act as heterogeneous nucleation cores for crystal formation. When the temperature of the molten pool decreases, the atoms in the liquid metal are more likely to attach to the surface of the TiC particles and grow into crystals rather than form spontaneously. These undissolved TiC particles are dispersed in the molten pool, providing more nucleation sites for the crystal nuclei, ultimately resulting in an increase in the number of grains and a reduction in grain size. In addition, the size of the TiC particles increases as the laser scanning speed increases. This is due to the decrease in energy density leading to incomplete dissolution of the TiC particles.

3.3. Microhardness Analysis

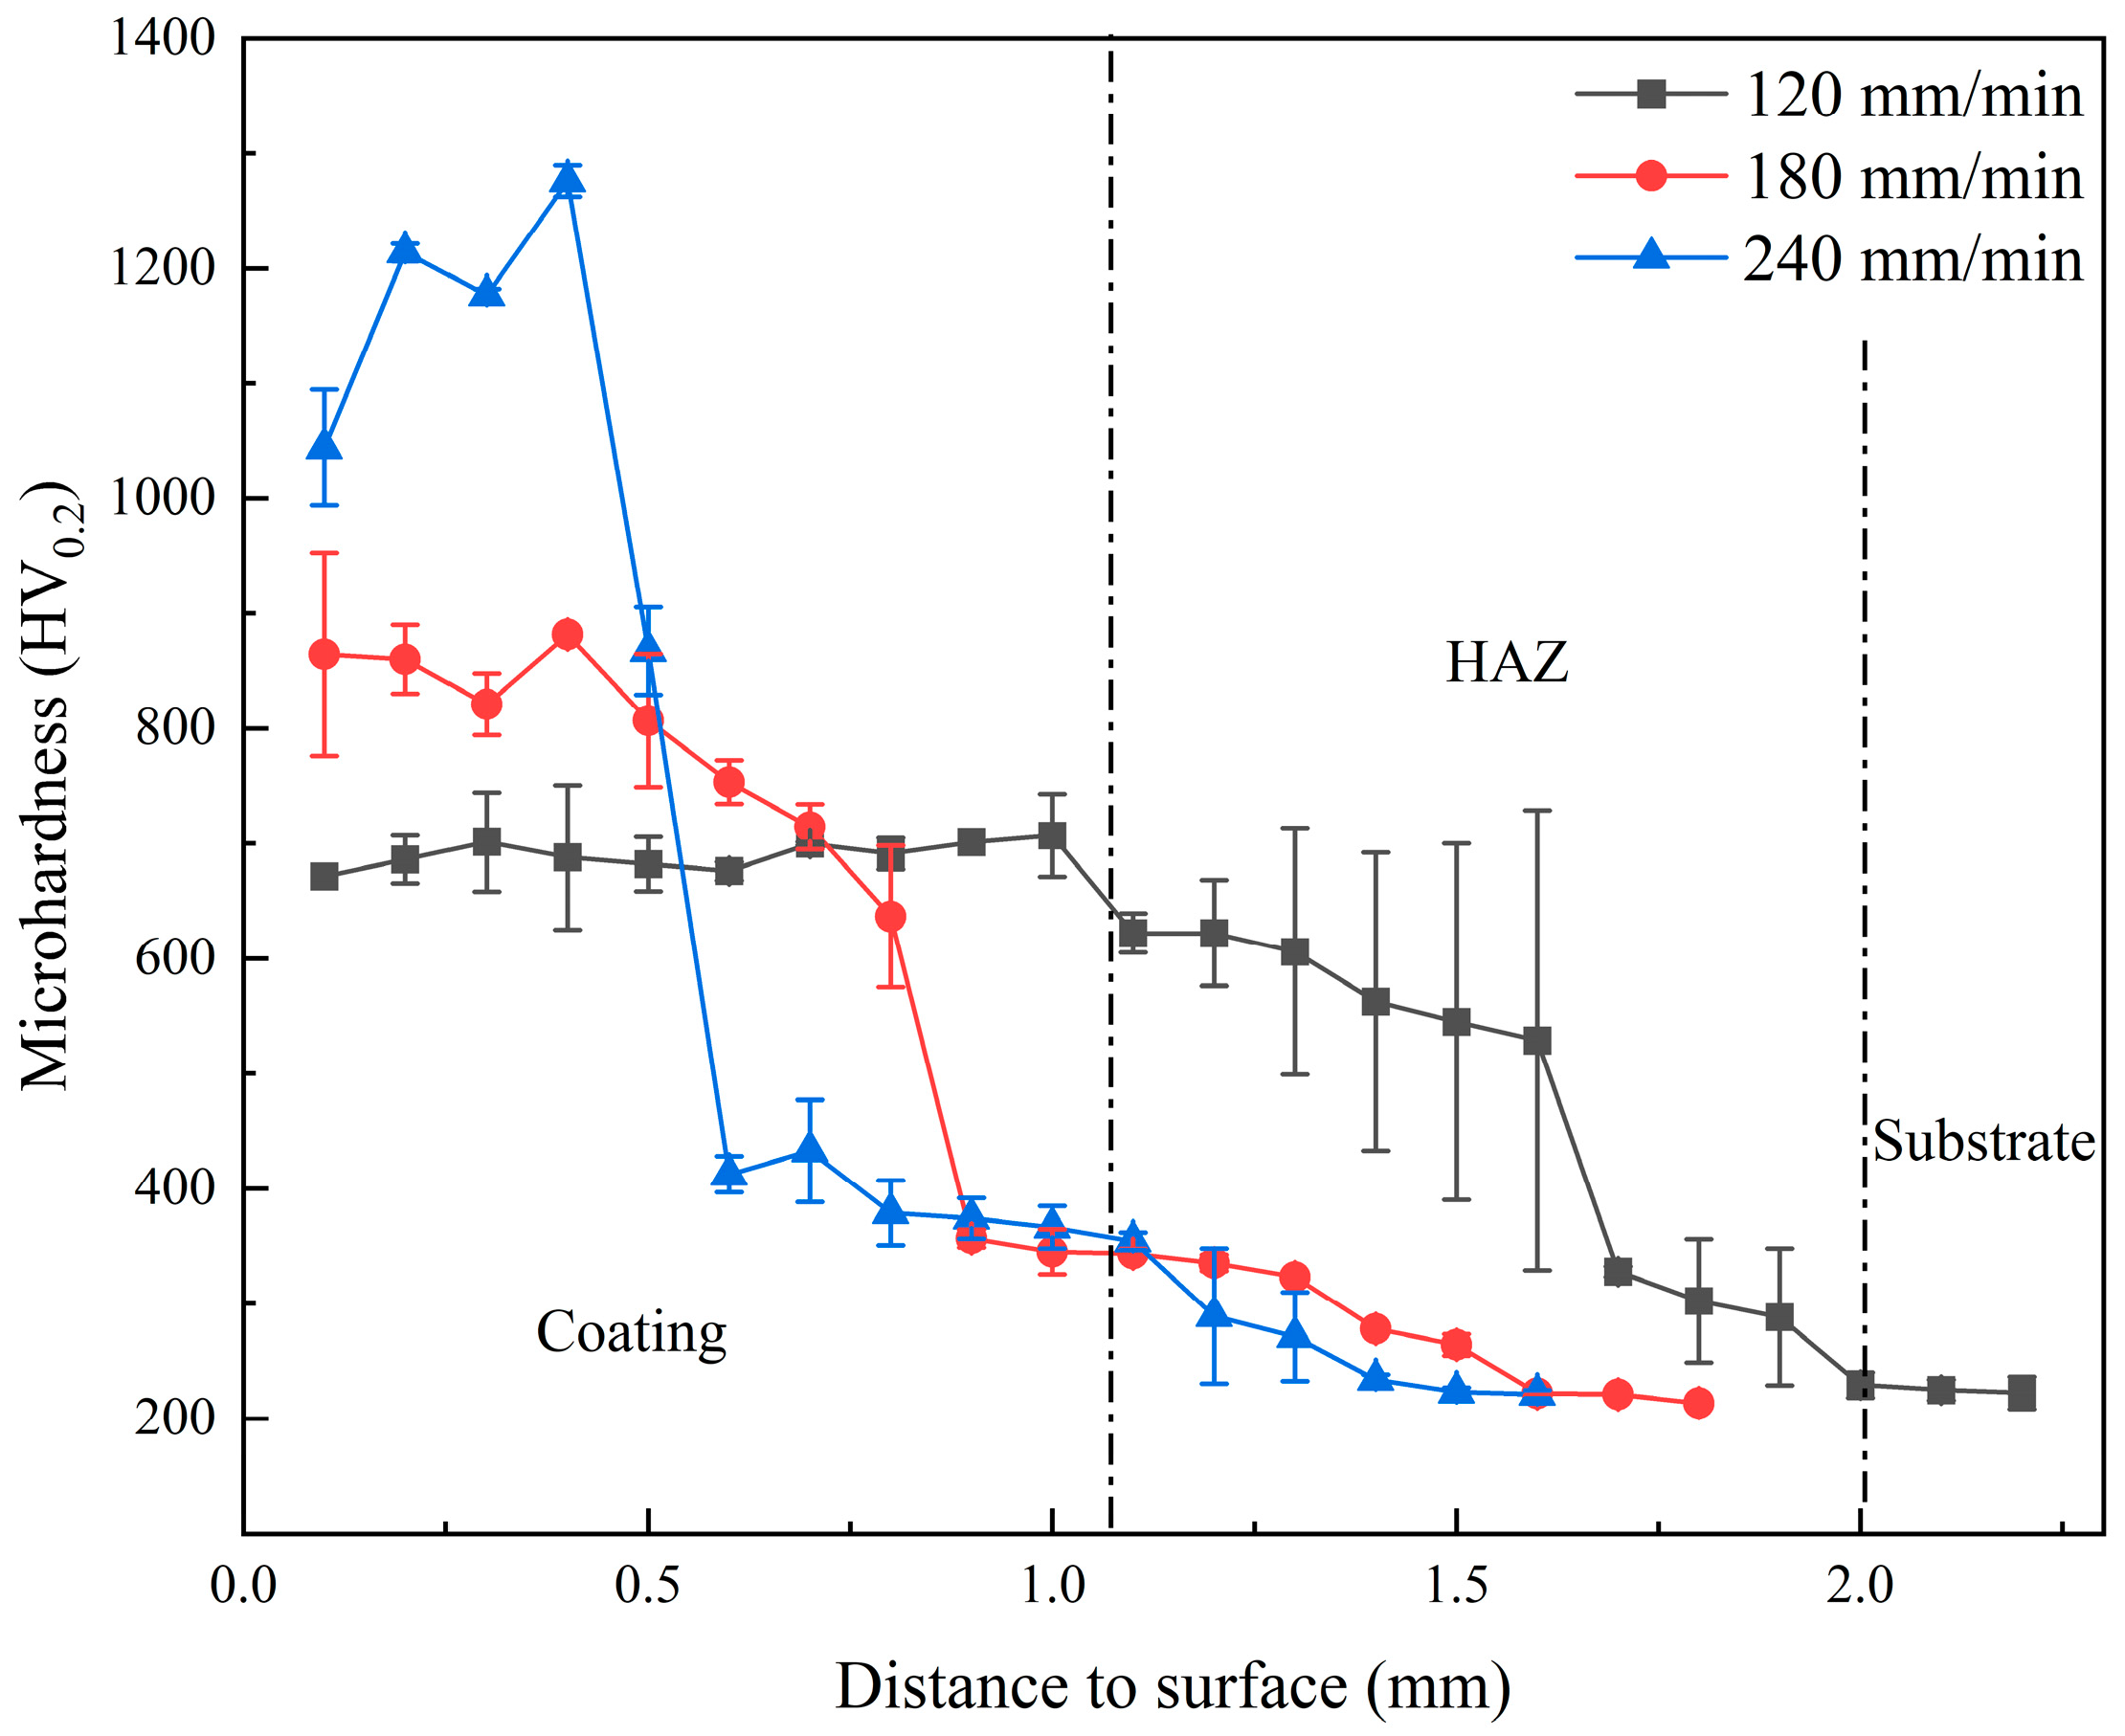
The microhardness distribution of coatings at varying scanning speeds is displayed in Figure 6. It can be seen from the figure that the microhardness of the coating increases with increase in scanning speed. Notably, the maximum microhardness of the coating is 1280 Hv0.2 when the scanning speed is 240 mm/min, which is about 5.8 times that of the substrate. The microhardness of the coating is significantly increased. Microstructure analysis reveals that a higher laser scanning rate enhances the solidification rate of the molten pool, promoting grain refinement and resulting in fine crystal strengthening. According to Hall–Petch Formula (3), the reduction in average grain diameter can increase the yield limit of the material, which can usually be expressed by microhardness [24].
σ y = σ 0 + k y d
In this formula, σy represents the yield limit of the material, which is the yield stress σ0 when the material undergoes 0.2% deformation: σ0 denotes the lattice friction resistance generated by moving a single dislocation; ky indicates that a constant is related to the type and properties of the material and the grain size; and d is the average grain diameter.

3.4. Wear Resistance Analysis

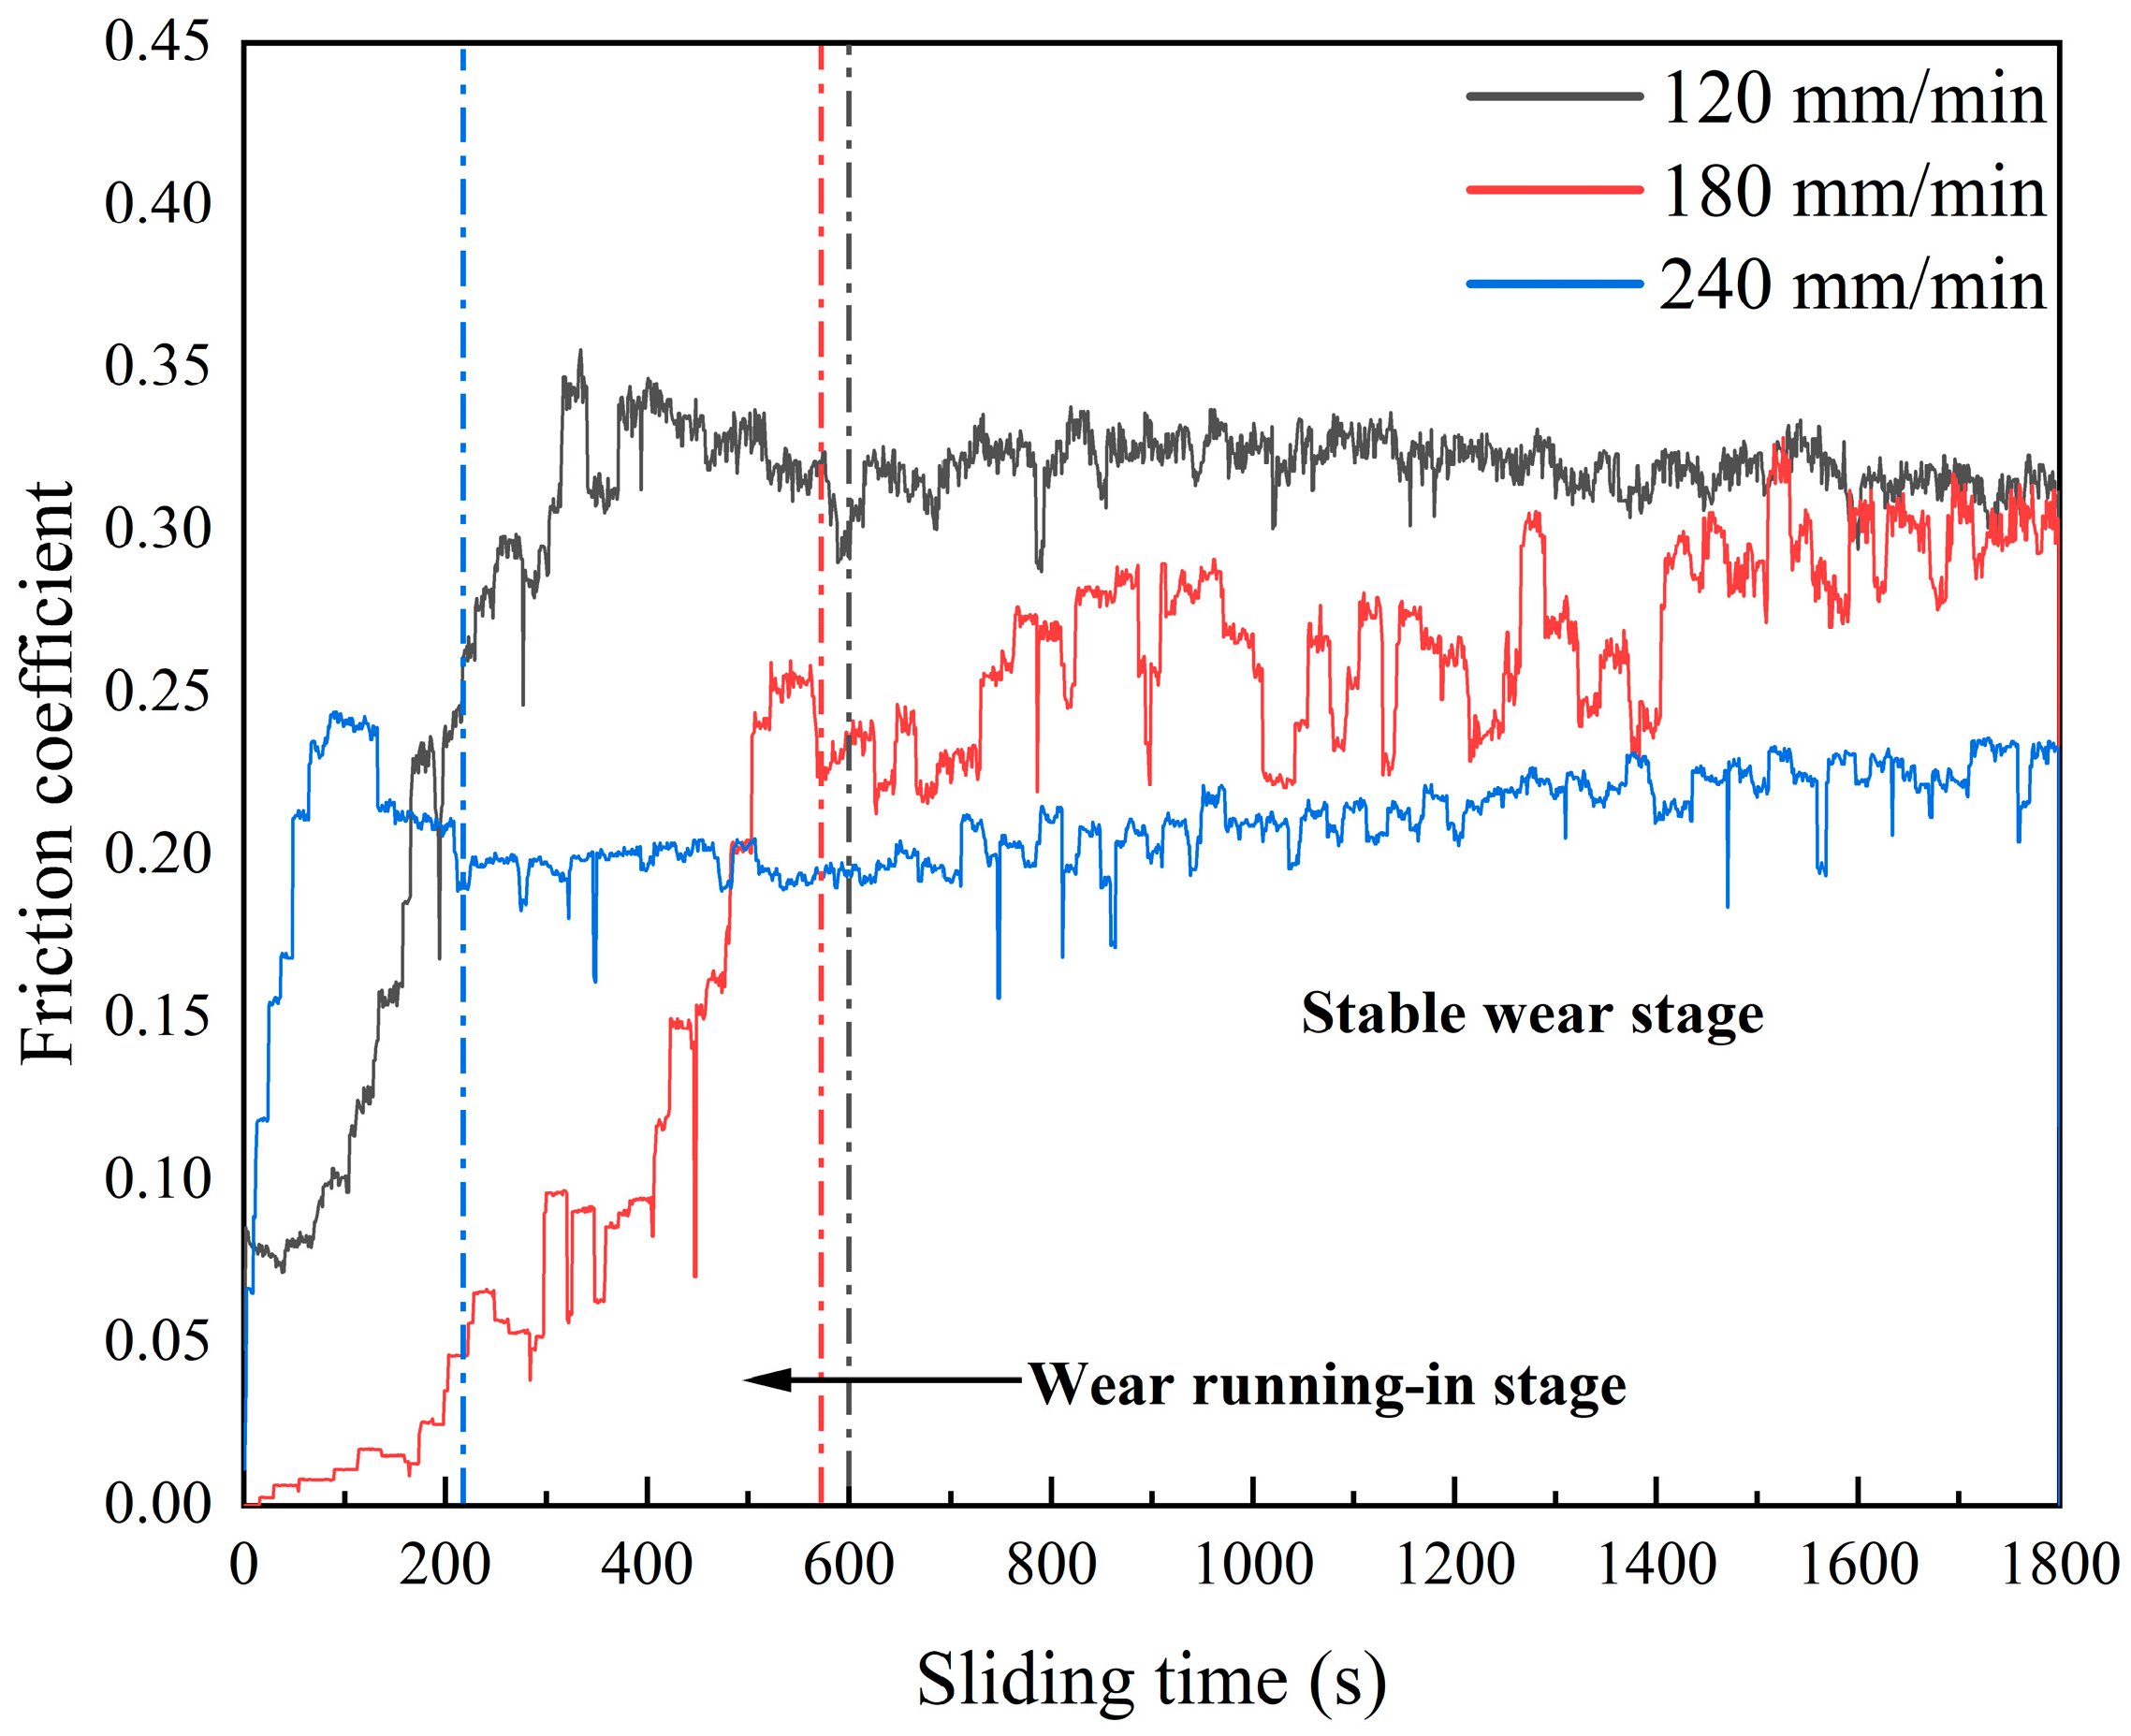
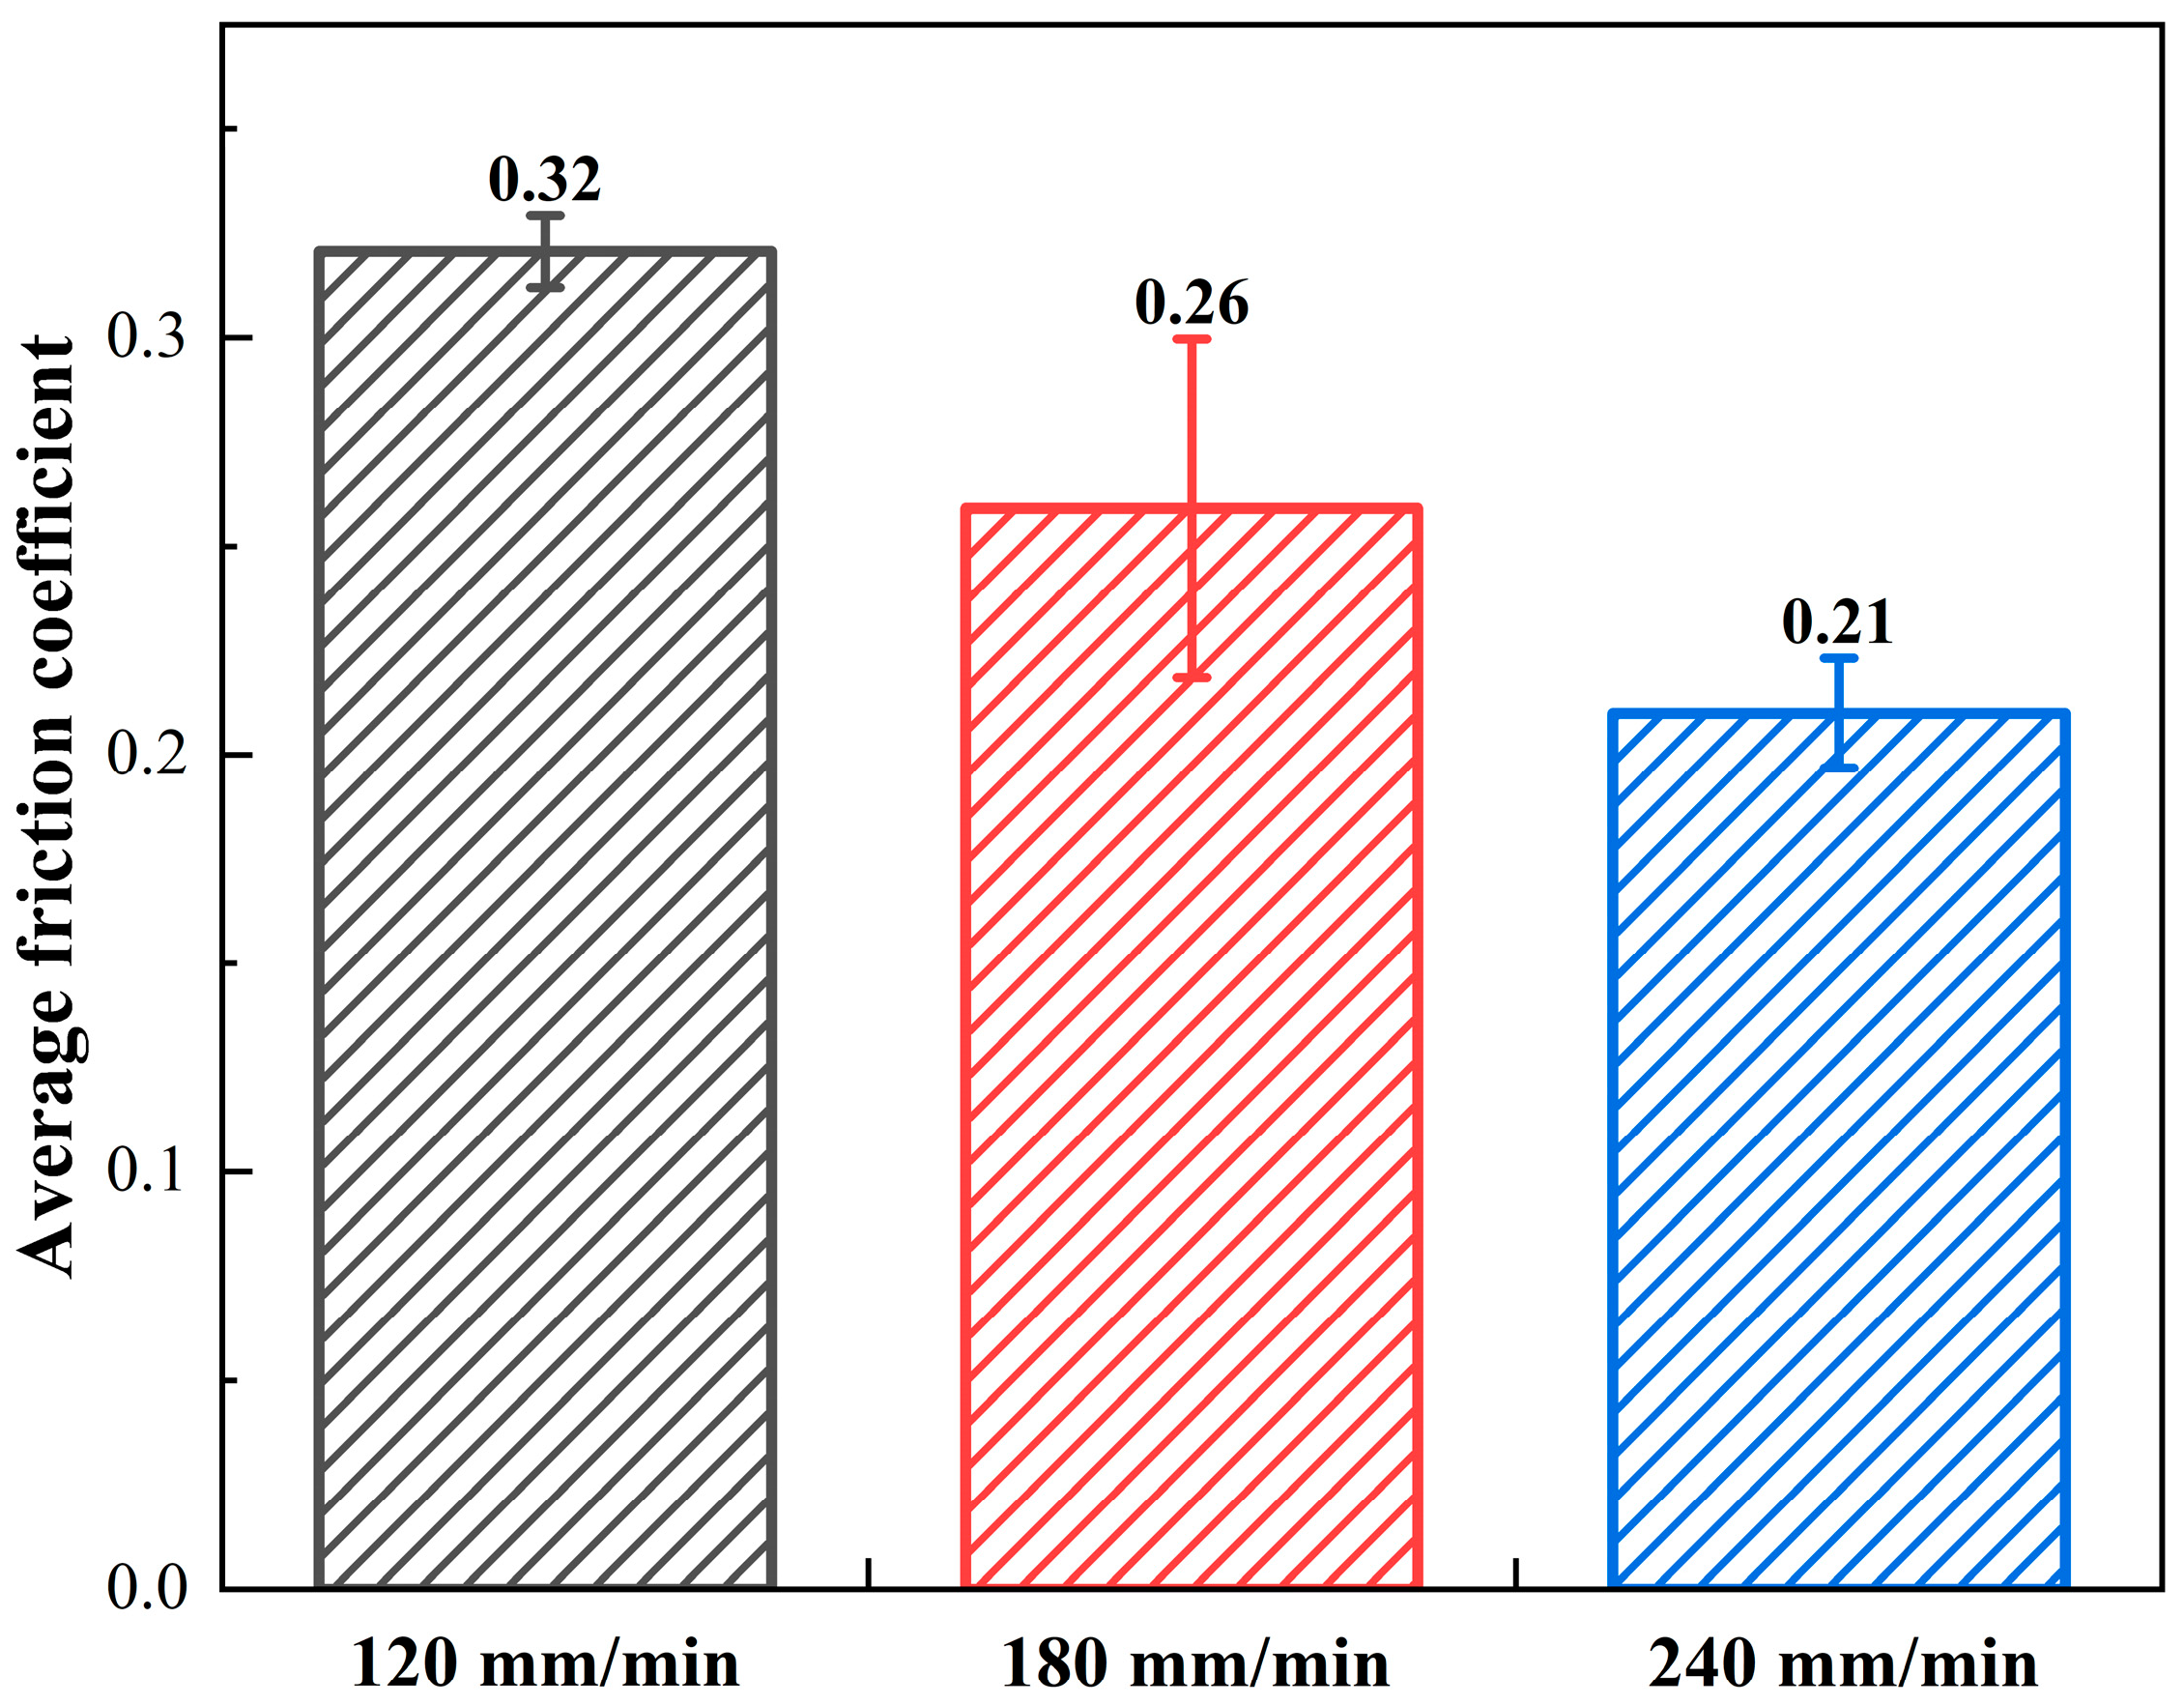
Figure 7 shows the curves of the friction coefficient changing over time for the coating under different laser scanning rates. The coating wear experiment is divided into two stages: the running-in wear stage and the stable wear stage. At the beginning of the friction experiment, the friction coefficient of the coating showed a rapid upward trend due to the rapid change in the contact area between the coating and the GCr15 grinding ball. However, as the friction experiment progressed, the friction coefficient for each coating gradually stabilized. This can be attributed to the fact that the contact area between the grinding balls and the coating experiences little change, the contact pressure diminishes, and the wear process gradually attains stability. As a result, the friction coefficient becomes more stable. The average friction coefficients of the coatings under different laser scanning speeds are shown in Figure 8. At scanning rates of 120 mm/min, 180 mm/min, and 240 mm/min, average friction coefficients of the coatings were measured at 0.32, 0.26, and 0.21, respectively.
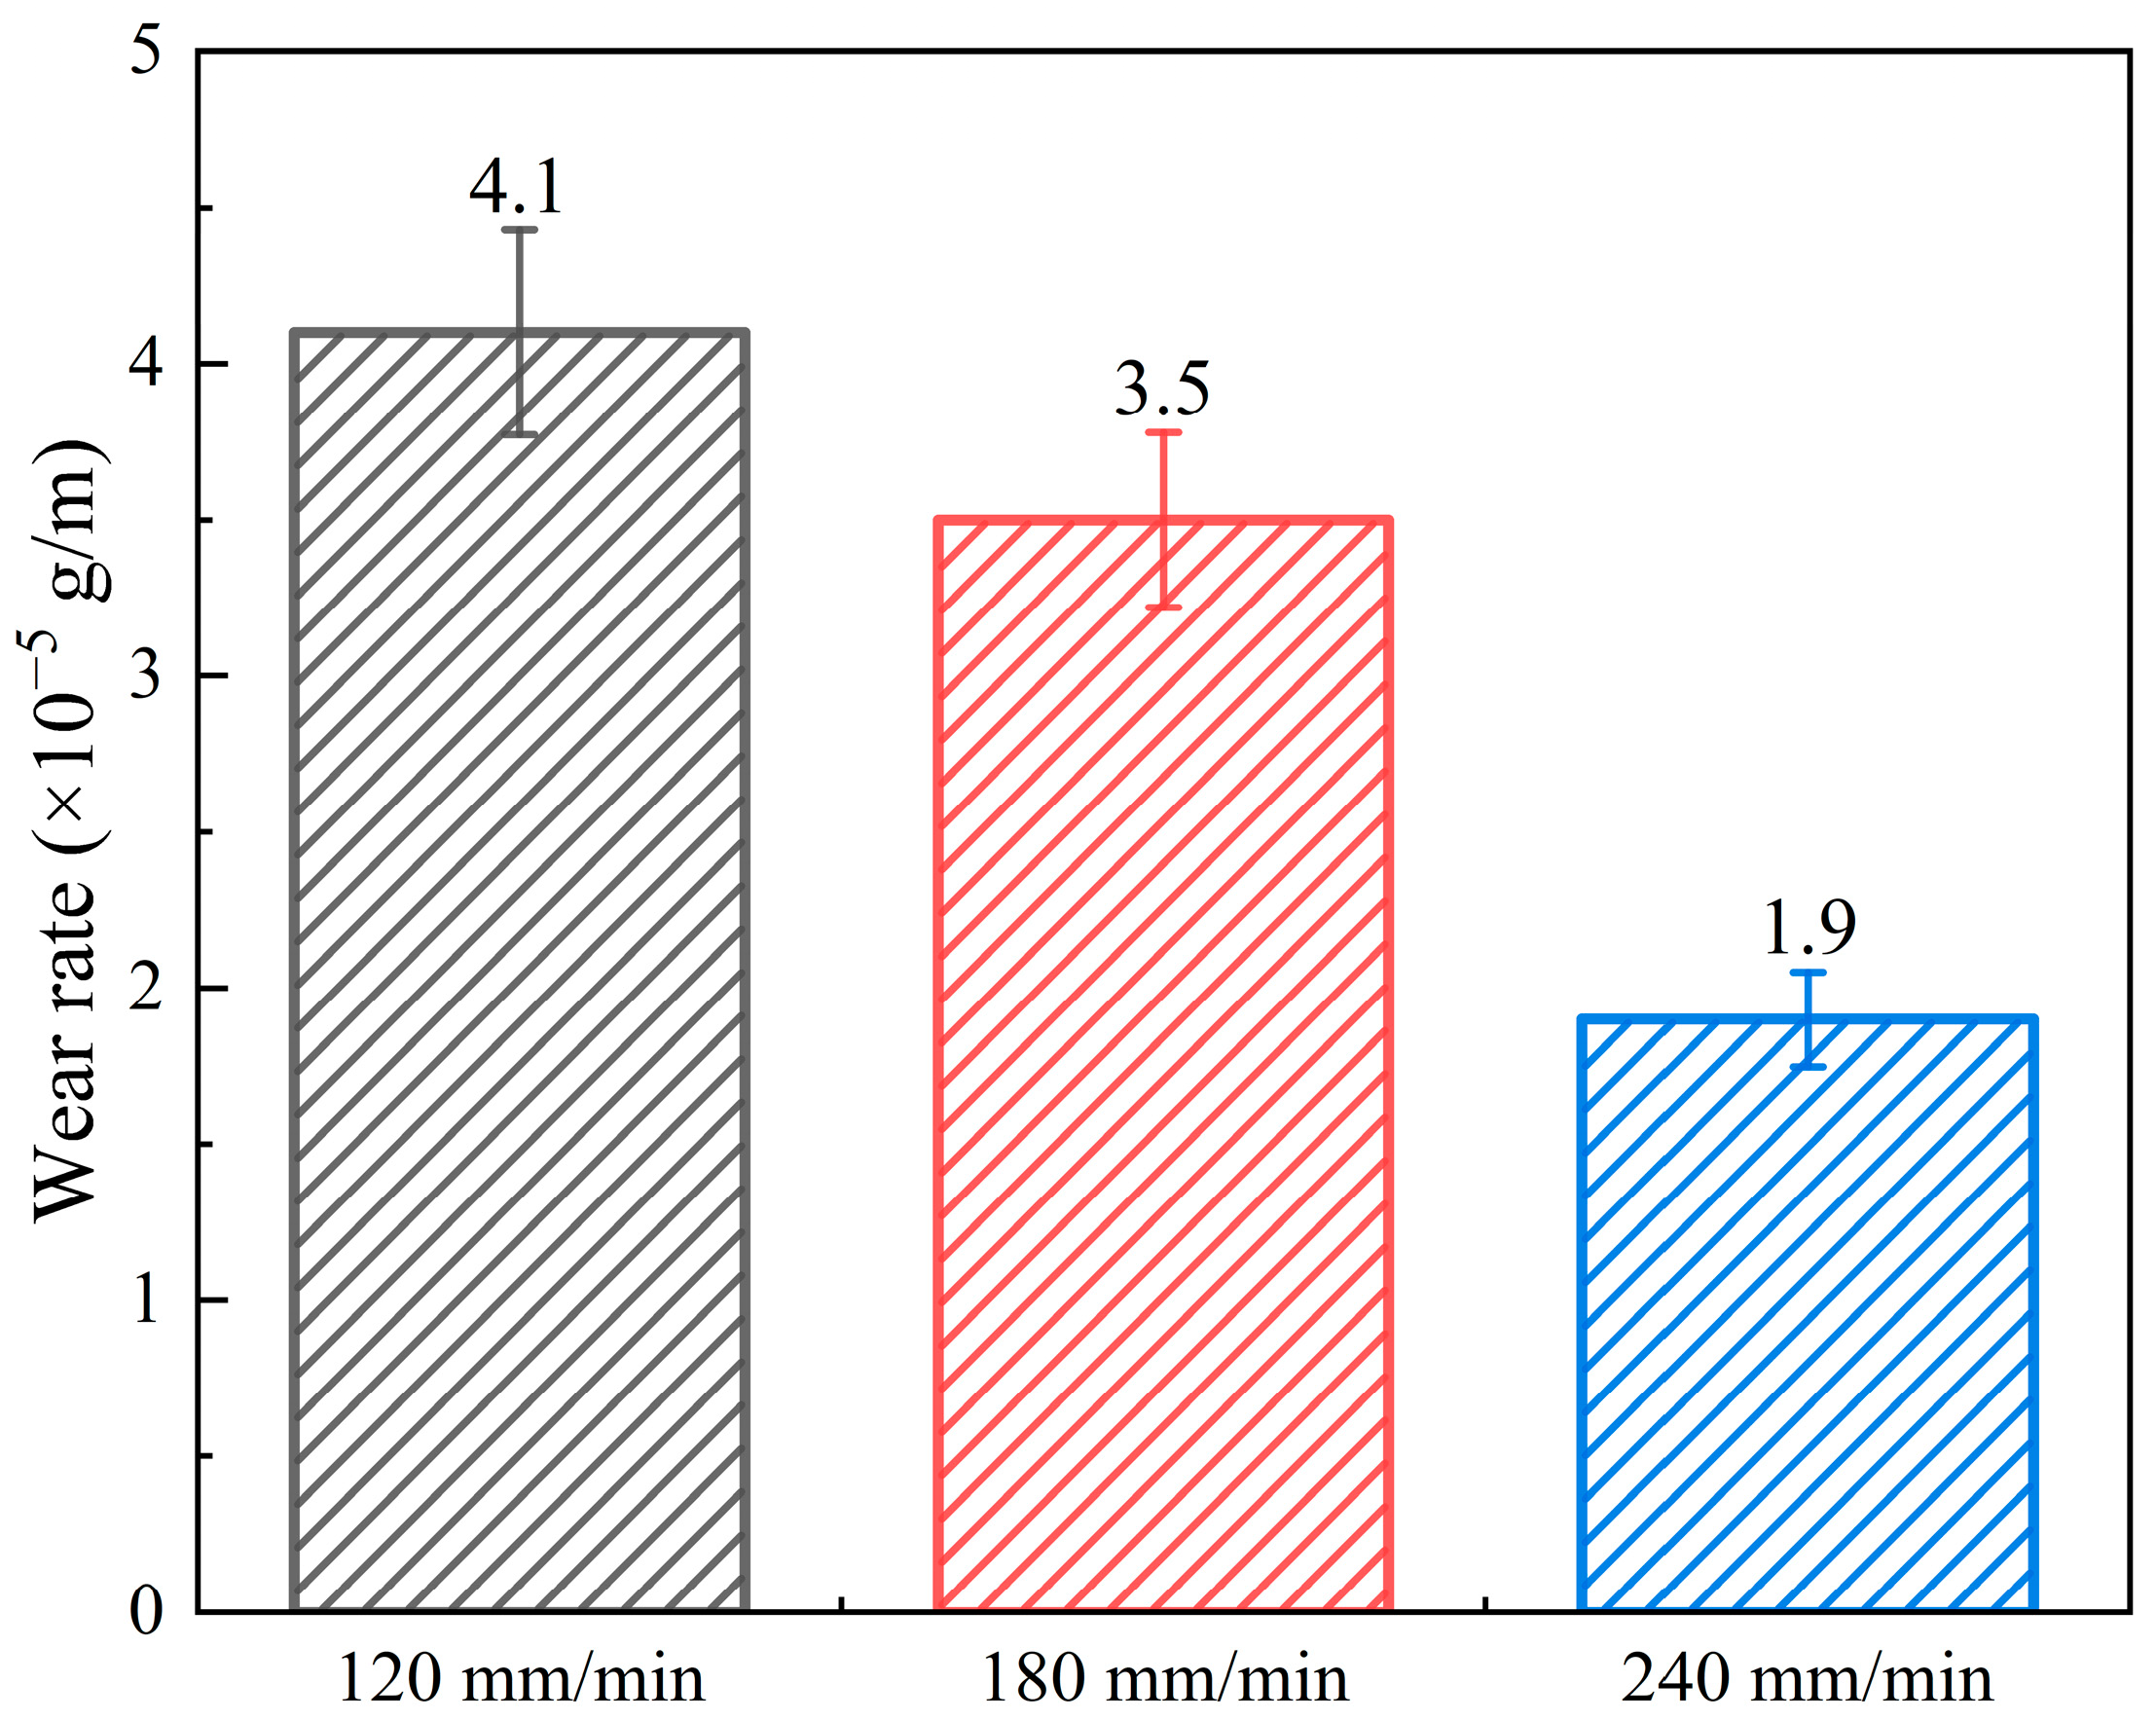
The coating wear rate at different scanning speeds is displayed in Figure 9. When the scanning speed is 120 mm/min, 180 mm/min, and 240 mm/min, wear rates of the cladding layer are 4.1 × 10⁻⁵ g/m, 3.5 × 10⁻⁵ g/m, and 1.9 × 10⁻⁵ g/m, respectively. Therefore, the wear resistance of the coating is proportional to microhardness of the coating.
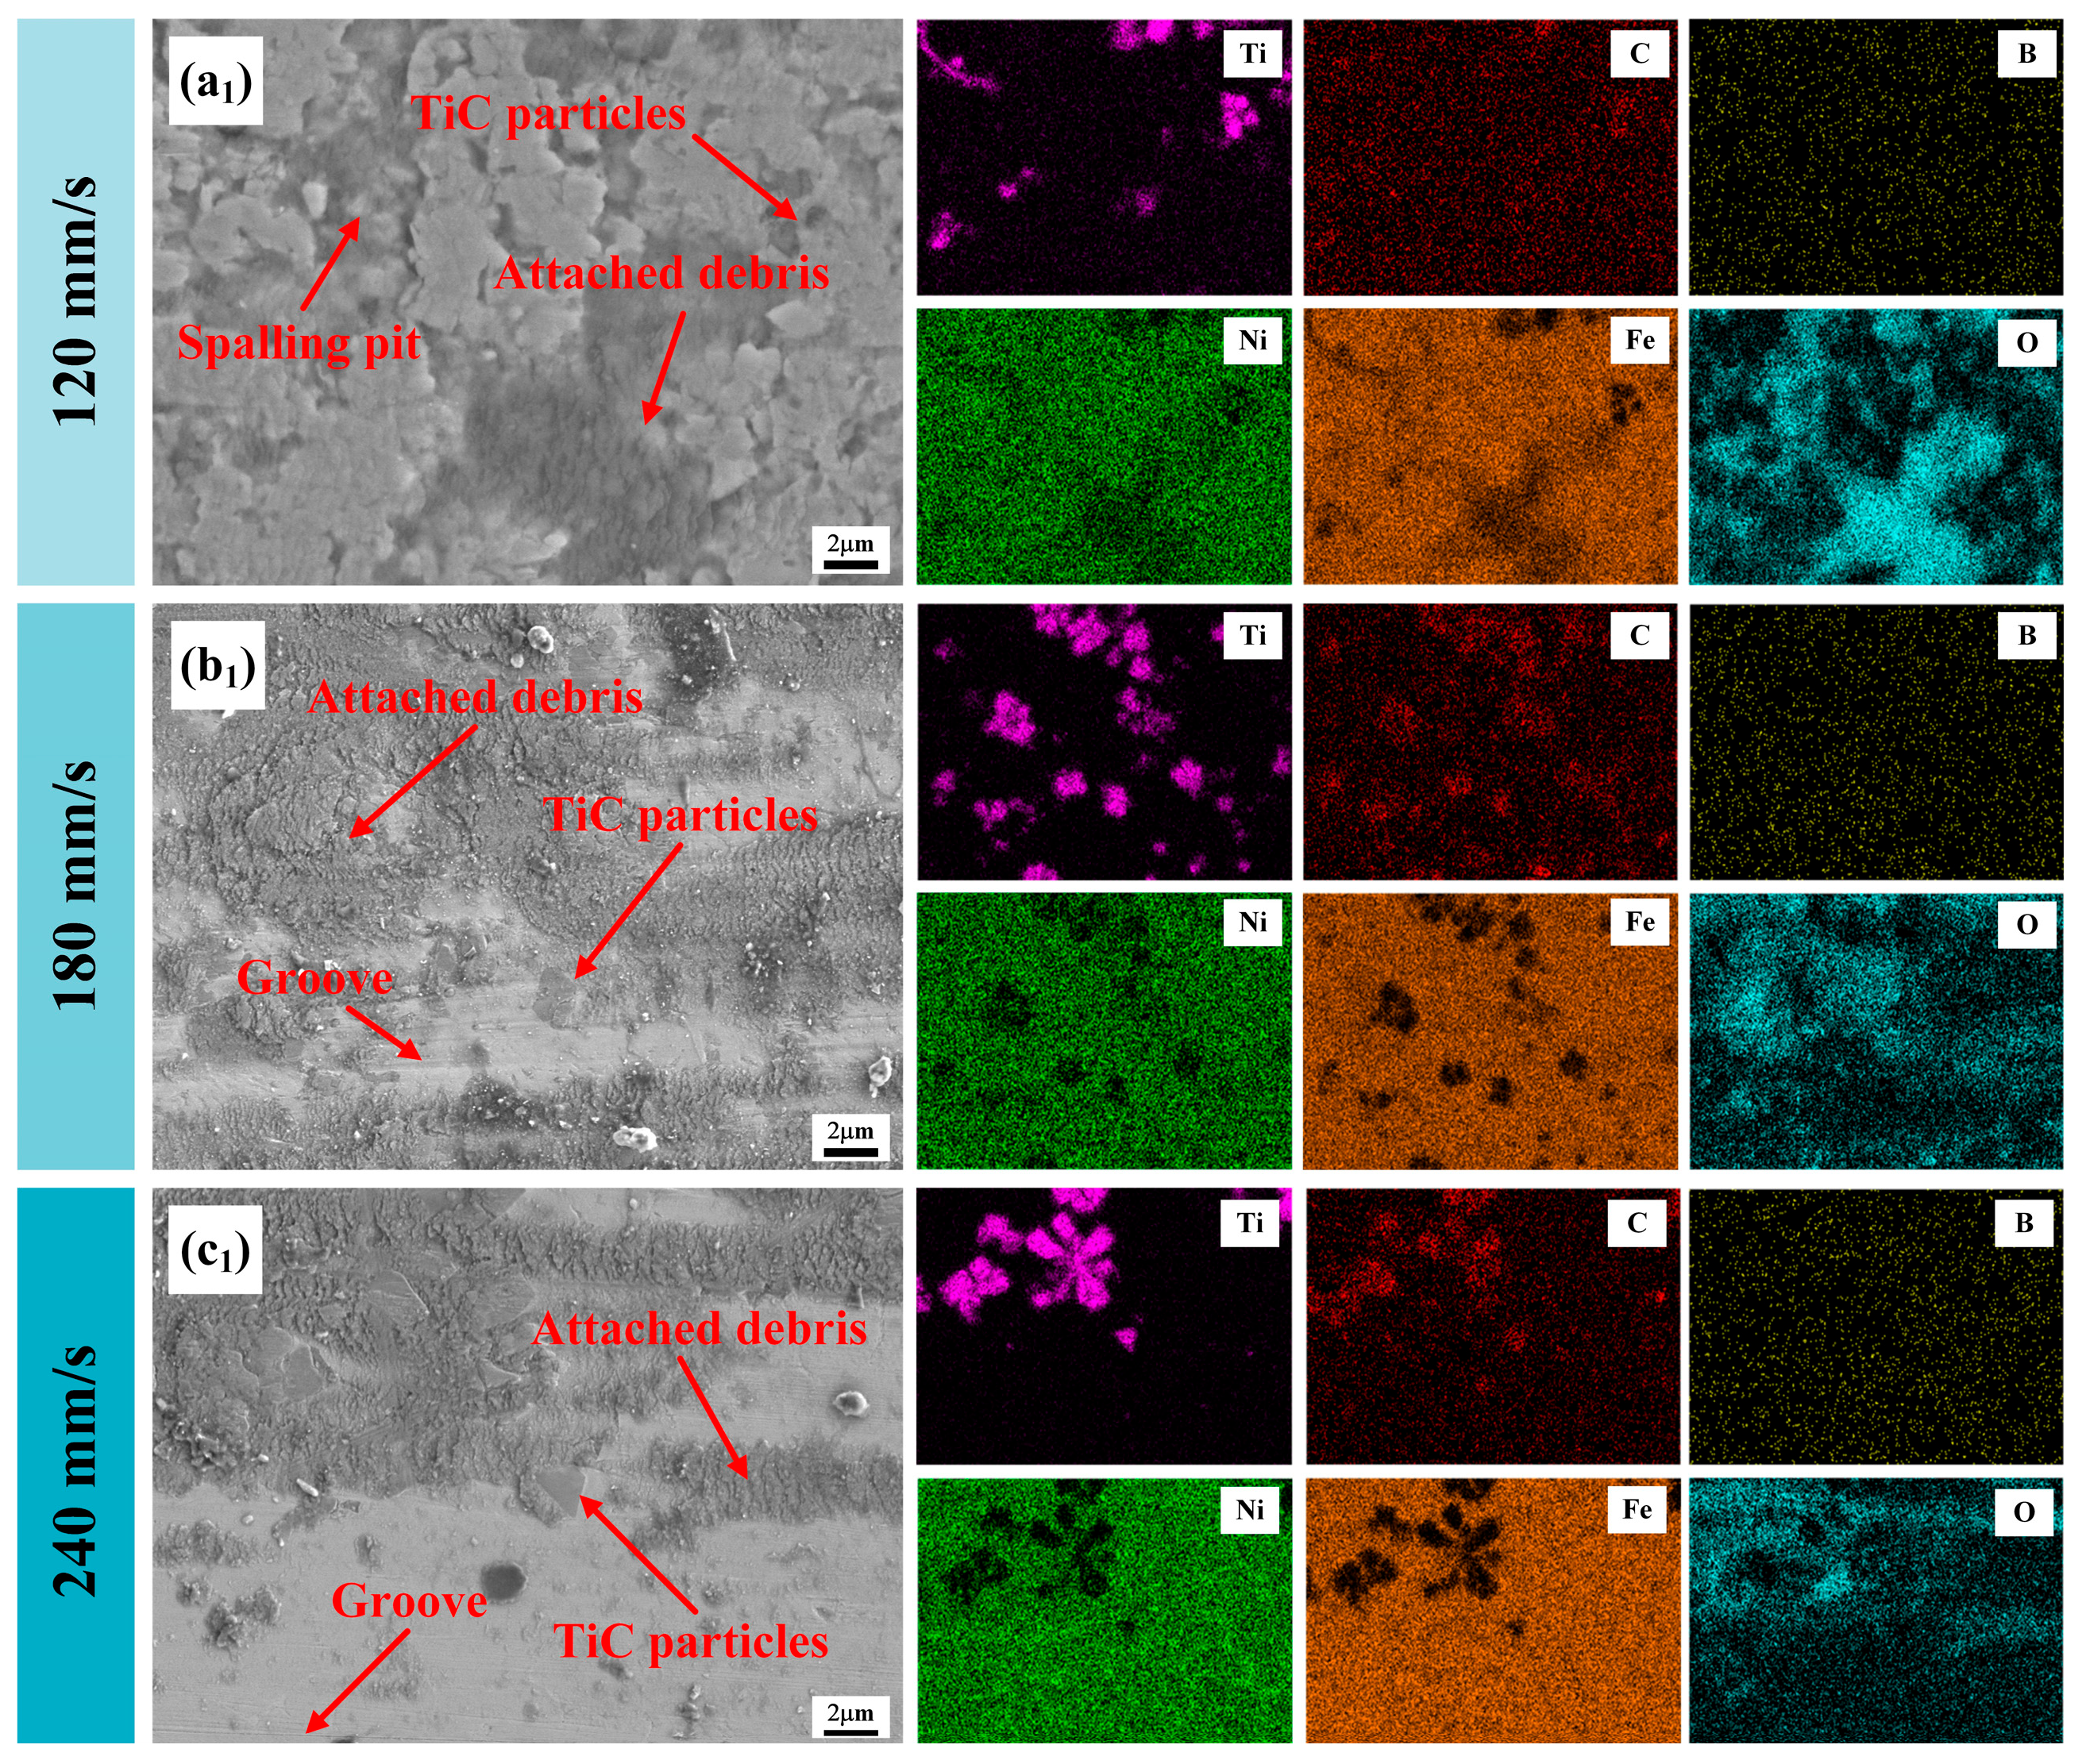
Figure 10 shows the wear morphology and element distribution of the coatings with different scanning speeds. It can be seen from Figure 10(a1) that when the scanning speed is 120 mm/min, there are spalling pits on the surface of the coating. Therefore, the wear form of the coating includes fatigue wear. It can be seen from Figure 10(b1,c1) that when the scanning speed is 180 mm/min and 240 mm/min, no peeling pits were observed on the coating surface, but grooves were found on the surface. Therefore, the wear mechanism of the coating transitions from fatigue wear to abrasive wear, and the size of the grooves decreases, thereby reducing the extent of abrasive wear. Combined with EDS results, there are oxides on the worn surface. Therefore, oxidation wear is also involved during the wear process. In addition, the content of O element is decreasing with the increase in scanning speed, which leads to the decrease in oxidation wear.
The wear mechanism of the coatings with different scanning speeds includes fatigue wear, abrasive wear, and oxidation wear based on the above wear scar analysis, as shown in Figure 11. When the scanning speed is 120 mm/min, fatigue wear is the main wear mechanism. Spalling pits will lead to rougher surfaces and eventually lead to surface failure [25], as shown in Figure 11a. When the scanning speed increases from 120 mm/min to 180 mm/min, the wear mechanism of the coating changes from fatigue wear to abrasive wear, as shown in Figure 11a,b. As the scanning speed increases to 240 mm/min, the furrows on the worn surface are further reduced, as shown in Figure 11c. This is attributed to the TiC particles within the coating and the Fe3B and Fe3C distributed at the grain boundaries, which can more effectively resist the invasion and scratching of the grinding balls, as well as reduce the initiation and propagation of cracks, and improve the fatigue resistance of the material, thereby reducing wear and extending the service life of the coating.

4. Conclusions

Ni/B4C/TiC coating was produced on the 45 steel surface by laser cladding. Effects of different scanning speeds on phase composition, microstructure, microhardness, and wear resistance of the coating were studied. The main conclusions are as follows:
  • The coating is mainly composed of Fe3B, Fe3C, B2Fe3Ni3, TiC, and solid solution [Fe, Ni]. The microstructure of the coating includes equiaxed crystals, columnar crystals, and dendritic crystals. The presence of eutectic structures at lower part of the coating was observed at scanning speeds of 180 mm/min and 240 mm/min.
  • The microhardness of the coating increases as the scanning speed increases. When the scanning speed is 240 mm/min, the microhardness of the coating is 1280 Hv0.2, which is about 5.8 times that of the substrate.
  • The wear rate decreases as the scanning speed increases. When the scanning speed is 240 mm/min, the wear rate of the coating reaches the minimum value of 1.9 × 10⁻⁵ g/m and the coating shows the best wear resistance. The wear mechanism shifts from fatigue to abrasion as the scanning speed increases.

Author Contributions

Conceptualization, Y.T. and D.Z.; investigation, Y.T. and B.C.; resources, D.Z. and Y.L. (Yu Liu); data curation, Q.L. and Y.L. (You Lv); writing—original draft preparation, Y.T., Y.T. and D.Z.; supervision, B.C. and Q.L.; funding, Y.L. (Yu Liu). All authors have read and agreed to the published version of the manuscript.

Funding

This study was supported by the Scientific Research Project of the Department of Education of Jilin Province (JJKH20241110KJ).

Institutional Review Board Statement

Not applicable.

Informed Consent Statement

Not applicable.

Data Availability Statement

Data are contained within the article.

Conflicts of Interest

The authors declare no conflicts of interest.

References

  1. Zhang, Z.-Q.; Niu, W.; Lei, Y.-W.; Zheng, Y. The Effect of SiC Content on the Microstructure and Mechanical Properties of AlCoCrFeNiTi Laser Cladding High-Entropy Alloy Coatings. J. Therm. Spray Technol. 2025, 34, 1195–1207. [Google Scholar] [CrossRef]
  2. Liu, Q.-S.; Liu, X.-B.; Wang, G.; Liu, Y.-F.; Meng, Y.; Zhang, S.-H. Effect of Cu content on microstructure evolution and tribological behaviors of Ni60 composite coatings on 45# steel by laser cladding. Opt. Laser Technol. 2022, 156, 108549. [Google Scholar] [CrossRef]
  3. Huang, G.; Qu, L.; Lu, Y.; Wang, Y.; Li, H.; Qin, Z.; Lu, X. Corrosion resistance improvement of 45 steel by Fe-based amorphous coating. Vacuum 2018, 153, 39–42. [Google Scholar] [CrossRef]
  4. Zhao, C.; Du, W.; Yu, Z.; Zhang, Z.; Zhang, H. Effect of ultrasonic radiation on the organization and mechanical properties of laser-melted Ni-based WC coatings. Alex. Eng. J. 2024, 110, 215–233. [Google Scholar] [CrossRef]
  5. Chen, S.; Liu, Q.; Chen, J.; Zhang, L.; Cui, T.; Sun, X. Microstructure and tribological performance of novel Ni-based alloy cladding with excellent high temperature wear resistance and self-lubrication performance. Surf. Coat. Technol. 2024, 494, 131395. [Google Scholar] [CrossRef]
  6. Jiang, G.-Y.; Zhang, J.-W. The influence of laser power on the microstructure and friction performance of laser-prepared TiC-NbC composite coatings on stainless steel surfaces. Mater. Today Commun. 2024, 41, 110812. [Google Scholar] [CrossRef]
  7. Zheng, Y.; Lian, G.F.; Lu, H.; Chen, C.R.; Huang, X. Defects, organization, and properties of TiB2-TiC Bi-ceramic phase by laser cladding in situ synthesis. Ceram. Int. 2024, 50, 41097–41116. [Google Scholar] [CrossRef]
  8. Wang, P.; Zhang, Y.-H.; Pang, M.; Gao, L.-H. Research of the effects of laser power variation on the properties of laser cladding Ni45/Cr3C2/MoS2 self-lubricating wear-resistant coatings on the surface of 300M ultra-high-strength steel. J. Mater. Sci. 2024, 59, 13652–13676. [Google Scholar] [CrossRef]
  9. Liu, H.; Lin, X.; Zhang, X.; Yang, T.; Yi, F.; Xu, W. Influence of structure and properties for laser cladding fe based alloy on 45 steel surface. J. Phys. Conf. Ser. 2024, 2730, 012014. [Google Scholar] [CrossRef]
  10. Zhao, Y.; Yang, C.; Wang, L.; Wu, Y.; Liu, Y.; Xie, Z.; Fang, Q.; Feng, W.; Liu, H.; Chen, H. Enhancing strength, ductility, and thermal fatigue resistance in Stellite 21 coatings via Mn alloying and Transformation-Induced Plasticity. Mater. Sci. Eng. A 2024, 918, 147448. [Google Scholar] [CrossRef]
  11. Tang, B.; Tan, Y.; Xu, T.; Sun, Z.; Li, X. Effects of TiB2 Particles Content on Microstructure, Mechanical Properties and Tribo-logical Properties of Ni-Based Composite Coatings Reinforced with TiB2 Particles by Laser Cladding. Coatings 2020, 10, 813. [Google Scholar] [CrossRef]
  12. Ma, Q.; Zhang, H.; Lv, Y.; Song, C.; Guo, N.; Xiao, G.; Zhao, W. Microstructure and properties of W0.5Ta0.3MoNbVAlTi1-xZrx high entropy alloy coatings by laser cladding on the surface of 45# steel. Ceram. Int. 2023, 49, 36416–36428. [Google Scholar] [CrossRef]
  13. Qu, C.C.; He, B.; Cheng, X.; Wang, H.M. Microstructure and wear characteristics of laser-clad Ni-based self-lubricating coating incorporating MoS2/Ag for use in high temperature. J. Mater. Res. Technol. 2024, 33, 4481–4492. [Google Scholar] [CrossRef]
  14. Zhou, L.; Ma, G.; Wang, H.; Wang, W.; Mou, H.; XianYong, Z.; Zhao, H.; Li, Y.; Tan, N. High-speed laser cladded Ni-based cermet coating with high ceramic phase content derived from core-shell structured powder. Surf. Coat. Technol. 2024, 489, 131110. [Google Scholar] [CrossRef]
  15. Li, C.; Li, J.; Yao, F. In Situ Generation of TiCN Ni-Based Coatings by Laser Cladding and Study of Their Structure and Properties. Adv. Eng. Mater. 2024, 26, 2301997. [Google Scholar] [CrossRef]
  16. Feng, M.; Lin, T.; Lian, G.; Chen, C.; Huang, X. The influence of WC content on the microstructure and properties of laser cladding CoCrFeMnNiSi1.6 high-entropy alloy coatings. Ceram. Int. 2024, 50, 55286–55306. [Google Scholar] [CrossRef]
  17. Han, J.; Tang, S.; Guan, J.; Mao, Y.; Zhu, K.; Li, Y.; Li, P. Microstructure and wear property of (TiN + NbC) double ceramic phase-reinforced in FeCrNiCoAl high-entropy alloy coating fabricated by laser cladding. Ceram. Int. 2024, 50, 49066–49084. [Google Scholar] [CrossRef]
  18. Zhang, Y.; Liu, Z.; Lv, Z.; Cao, J.; Tong, Y.; Sun, M.; Cui, C.; Wang, X. Effect of SiC and TiC content on microstructure and wear behavior of Ni-based composite coating manufactured by laser cladding on Ti–6Al–4V. Wear 2024, 552, 205431. [Google Scholar] [CrossRef]
  19. Han, M.; Zhang, J.; Dong, P.; Du, K.; Zheng, Z.; Zhang, C.; Xu, B. Tribological properties and wear mechanism of Ni@Gr reinforced Ni-based alloy coatings prepared via laser cladding. J. Mater. Res. Technol. 2024, 31, 799–809. [Google Scholar] [CrossRef]
  20. Zhang, K.W.; Kong, D.J. High-Speed Laser Cladded Ni-Based WC Coatings: Microstructure, Friction-Wear Property and Wear Mechanism. J. Therm. Spray Technol. 2024, 33, 2367–2379. [Google Scholar]
  21. Zhao, Y.; Yu, T.; Chen, L.; Chen, Y.; Guan, C.; Sun, J. Microstructure and wear resistance behavior of Ti–C–B4C-reinforced composite coating. Ceram. Int. 2020, 46, 25136–25148. [Google Scholar] [CrossRef]
  22. Cheng, Q.; Shi, H.; Zhang, P.; Yu, Z.; Wu, D.; He, S.; Tian, Y. Microstructure, oxidation resistance and mechanical properties of stellite 12 composite coating doped with submicron TiC/B4C by laser cladding. Surf. Coat. Technol. 2020, 395, 125810. [Google Scholar] [CrossRef]
  23. Qi, Z.; Chen, C.; Wang, C.; Zhou, Z.; Zhou, J.; Long, Y. Effect of different laser wavelengths on laser cladding of pure copper. Surf. Coat. Technol. 2022, 454, 129181. [Google Scholar] [CrossRef]
  24. Nie, M.; Zhang, S.; Wang, Z.; Zhang, C.; Chen, H.; Chen, J. Effect of laser power on microstructure and interfacial bonding strength of laser cladding 17-4PH stainless steel coatings. Mater. Chem. Phys. 2022, 275, 125236. [Google Scholar] [CrossRef]
  25. Li, G.; Hong, B.; Song, D.; Ma, Y.; Yuan, C. Effect of pulsed current coupled ultrasonic rolling on surface fretting friction and wear properties of Ti-6Al-4V alloy. Wear 2025, 568, 205959. [Google Scholar] [CrossRef]
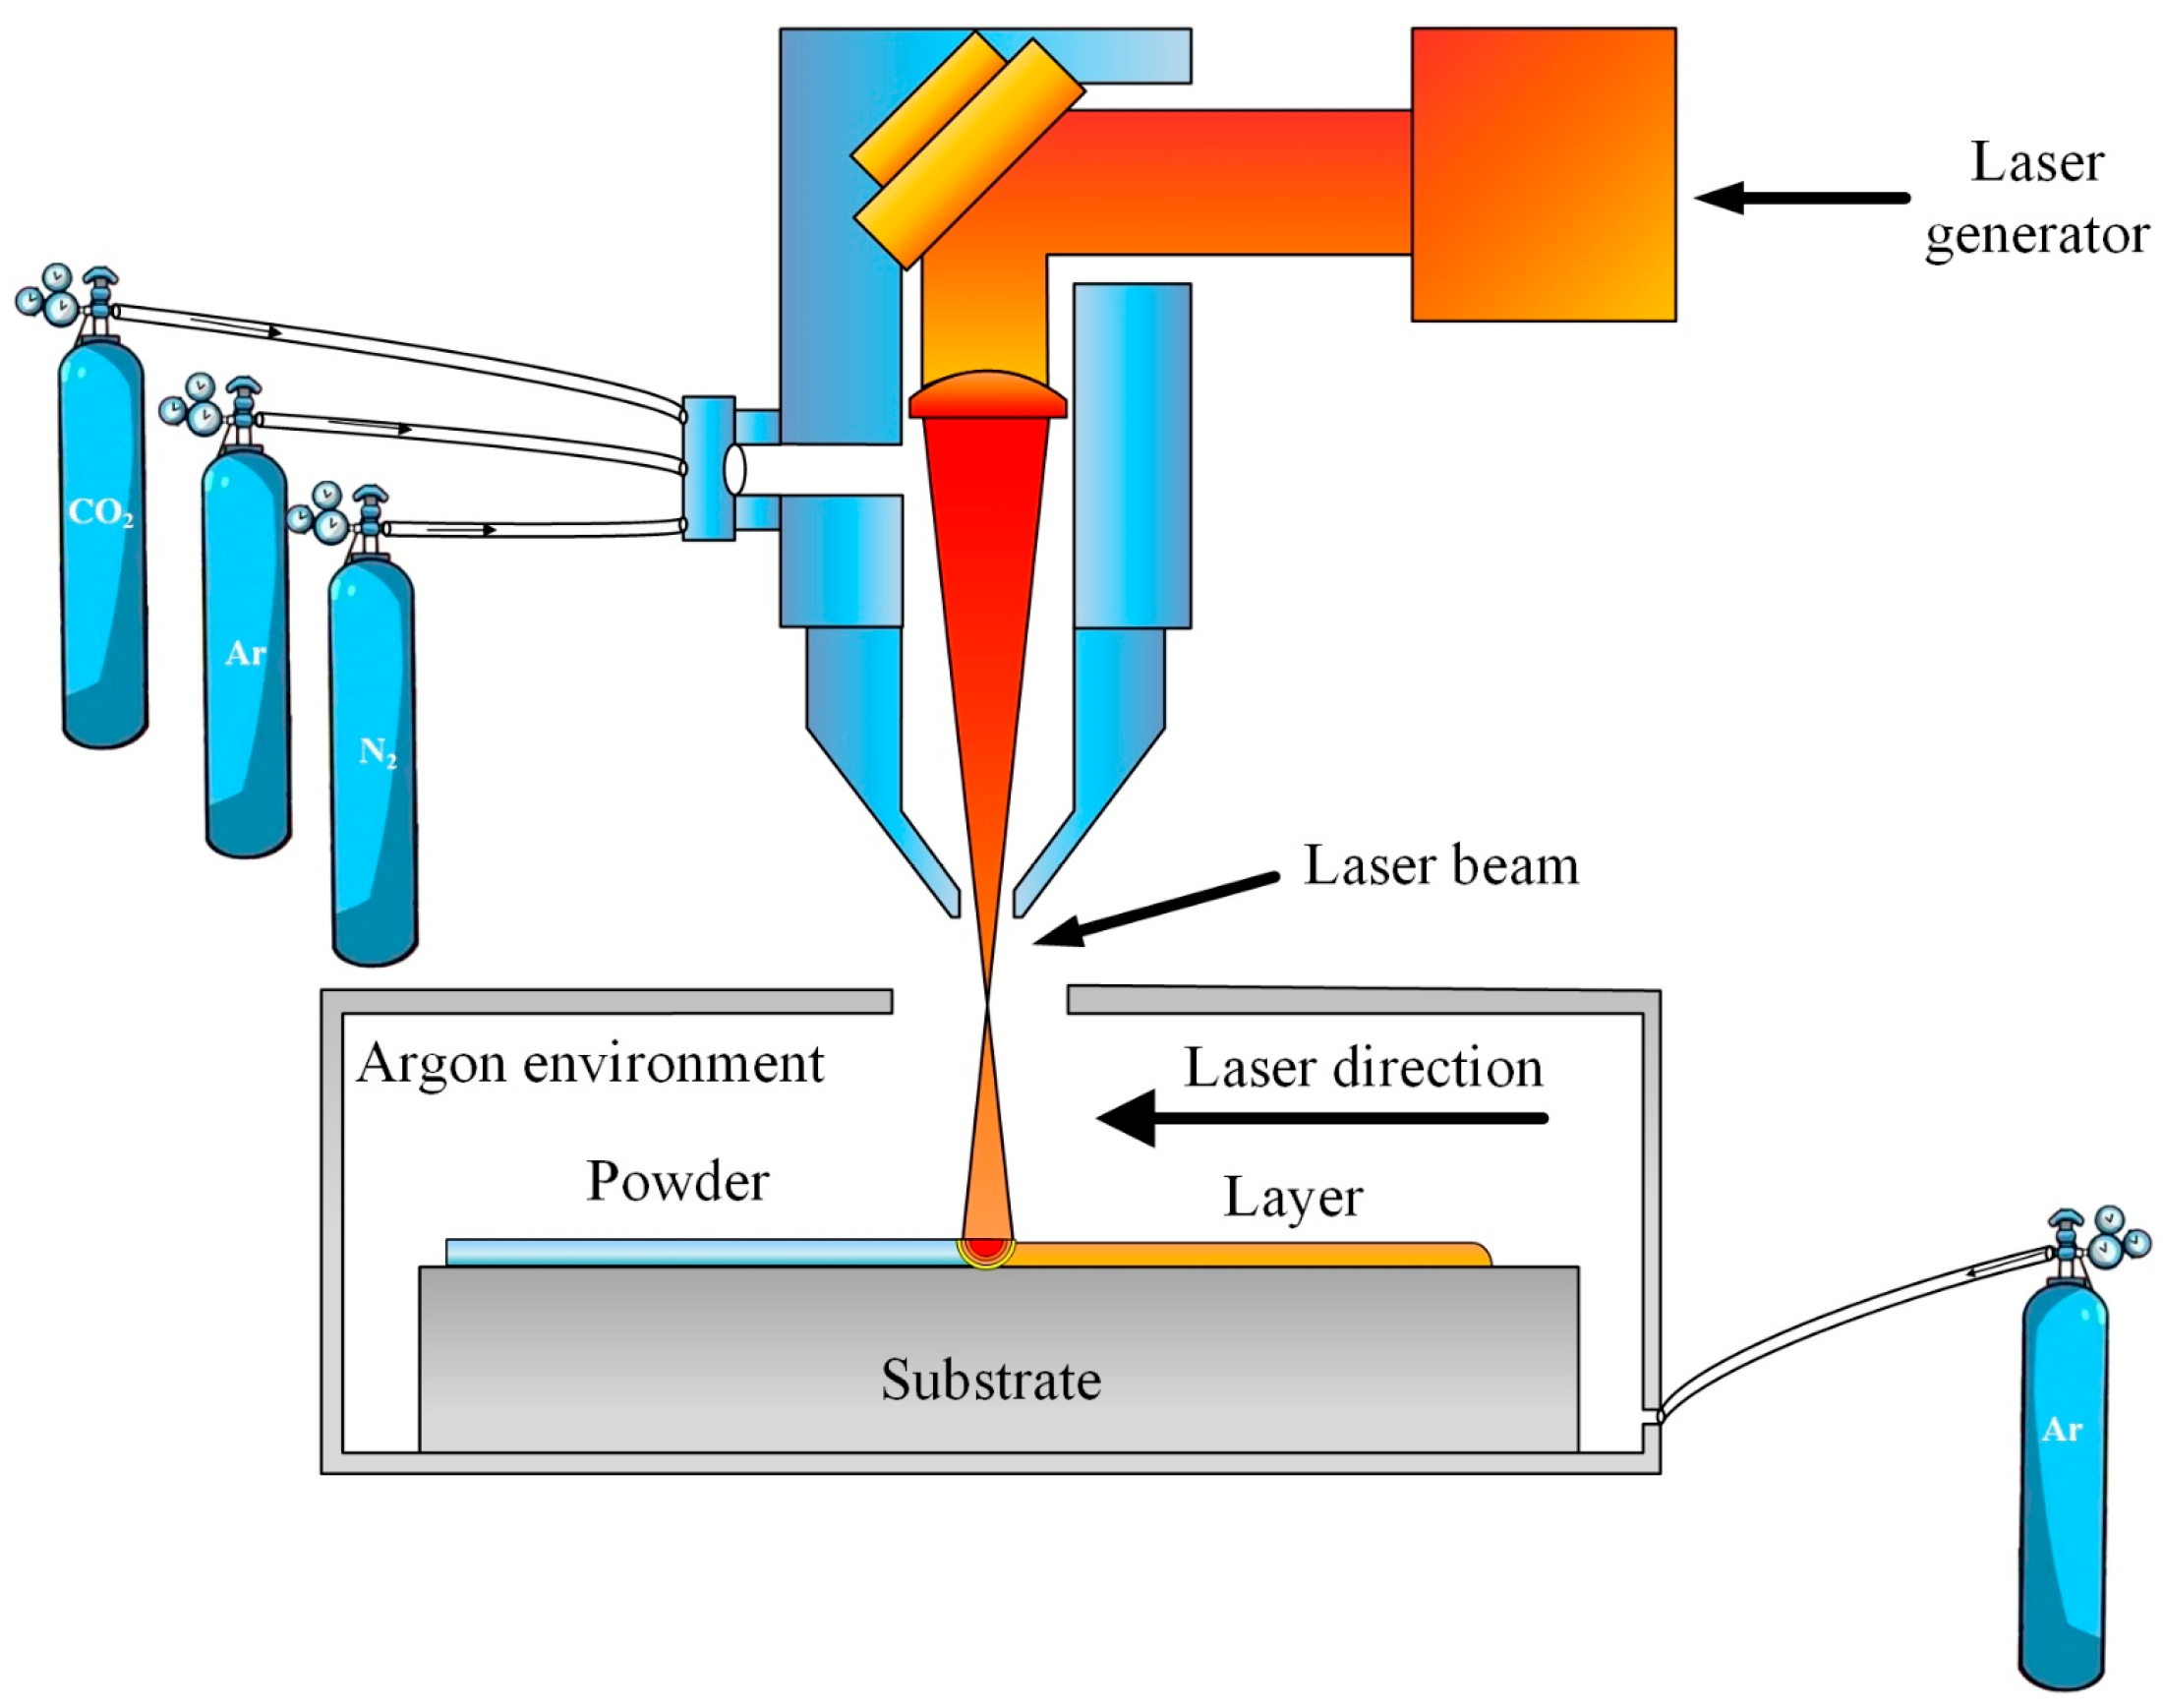
Figure 1. The schematic diagram of laser cladding technology.
Coatings 15 00932 g001
Figure 2. X-ray diffraction patterns of coatings with different scanning speeds.
Coatings 15 00932 g002
Figure 3. Cross-section morphology of coatings at different scanning speeds: (a) 120 mm/min; (b) 180 mm/min; (c) 240 mm/min.
Coatings 15 00932 g003
Figure 4. Microstructure of coatings with different scanning speeds. (a1a3) Top; (b1b3) Middle; (c1c3) Bottom.
Coatings 15 00932 g004
Figure 5. The surface scanning results of the coating with different laser scanning speeds. (a) 120 mm/min; (b) 180mm/min; (c) 240mm/min.
Coatings 15 00932 g005
Figure 6. Microhardness distribution of coatings with different laser scanning speeds.
Coatings 15 00932 g006
Figure 7. Friction coefficient curve of coatings with different laser scanning speeds.
Coatings 15 00932 g007
Figure 8. Average friction coefficient of the layer in the stable wear stage.
Coatings 15 00932 g008
Figure 9. Wear rate of the coating at different laser scanning speeds.
Coatings 15 00932 g009
Figure 10. Wear morphology and element distribution of the coating surface at different laser scanning speeds. (a1) 120 mm/min; (b1) 180mm/min; (c1) 240mm/min.
Coatings 15 00932 g010
Figure 11. The schematic diagram of wear process. (a) 120 mm/min; (b) 180 mm/min; (c) 240 mm/min.
Coatings 15 00932 g011
Table 1. Chemical composition of 45 steel (wt. %).
ElementalCSiMnNiCrCuFe
Component Content0.42–0.500.17–0.370.50–0.80≤0.30≤0.25≤0.25Bal.
Disclaimer/Publisher’s Note: The statements, opinions and data contained in all publications are solely those of the individual author(s) and contributor(s) and not of MDPI and/or the editor(s). MDPI and/or the editor(s) disclaim responsibility for any injury to people or property resulting from any ideas, methods, instructions or products referred to in the content.