Article

Numerical and Experimental Study on Deposition Mechanism of Laser-Assisted Plasma-Sprayed Y2O3 Coating

College of Intelligent Engineering, Shaoxing University, Shaoxing 312000, China
*
Author to whom correspondence should be addressed.
Coatings 2025, 15(8), 904; https://doi.org/10.3390/coatings15080904 (registering DOI)
Submission received: 3 July 2025 / Revised: 30 July 2025 / Accepted: 31 July 2025 / Published: 2 August 2025
(This article belongs to the Section Laser Coatings)

Abstract

Due to the limitations of high speed and short time in plasma-spraying experiments, this study established a simulation model of Y2O3 multi-particle deposition to discuss the influence of laser loading on coating-deposition behavior and performance. According to the simulation results, the temperature of coating particles under laser loading displays a gradient distribution, with the surface having the highest temperature. The particles deposit on the substrate to form uniform pits of a certain depth. Plastic deformation causes maximum stress to occur at the edges of the pits and maximum strain to occur on the sidewall of the pits. The deposition region had both compressive and tensile stresses, and laser loading greatly reduced the tensile stresses’ magnitude while having less of an impact on the particle strains. Laser assistance promotes further melting of particles, reduces coating thickness, lowers coating porosity to 3.94%, increases hardness to 488 MPa, reduces maximum pore size from 68 µm to 32 µm, and causes particle sputtering to gradually evolve from being disc-shaped to being finger-shaped, creating cavities at the coating edges. The comparison between the surface morphology and the cross-section pores of the experimentally prepared coating verified the rationality and viability of the simulation work.

1. Introduction

In the etching process, the fluorine-containing plasma with high chemical activity will react with the surface of the chamber and the parts of the etching equipment to produce corrosion, which shortens the equipment parts’ lifespan and may cause contamination of the wafer [1]. SiO2 was first applied as an anti-plasma coating material [2]. Due to the low cost and high mechanical strength of Al2O3, atmospheric plasma spraying (APS) of high-purity Al2O3 coating has become a common protective coating for etching equipment as plasma-spraying technology has advanced. High-energy fluorine-containing plasmas readily react with Al2O3 to produce AlxFy compounds, which contaminate wafers and cause delamination because of their high chemical activity. Lastly, Y2O3 replaces Al2O3 as a chamber coating [3]. Under the etching behavior of fluorine and carbon plasma, YF3 and AlF3 protective layers were formed on the Y2O3 and Al2O3 coatings to prevent further erosion of the surface, and the erosion resistance of the Y2O3 coatings was better than that of the Al2O3 coatings [4,5]. According to studies conducted by some scholars, the microstructure of Y2O3 coatings directly influences their adhesion, porosity, and etching resistance. Effective control of coating defects can significantly enhance coating quality [6,7]. The plasma spraying process parameters, such as spraying power, spraying distance, voltage, current, gas flow rate, and powder characteristics, are the primary factors responsible for the formation of coating defects [8,9,10].
After the advent of plasma spraying (PS) in the 1950s, the reliability of the manufactured coatings has been greatly improved, but coating defects are very obvious, with pores and unmelted particles [11]. Laser treatment is an important method that has been used to improve the performance of thermal spray coatings [12]. Laser-assisted plasma spraying (LAPS) is the use of laser irradiation deposition area in the spraying process, through the high-energy-density laser heat source on the particles and the substrate-heating/softening treatment, instantly adjusting and improving the mechanical properties of the material and the deposition state, so that the phenomenon of delamination is weakened; and the interface between the coating and the substrate becomes metallurgically bonded, improving the deposition efficiency of the spray coating, densification, and bonding strength [13]. As demonstrated by Schopphoven et al. [14], higher particle temperatures can be obtained by increasing the laser beam intensity and laser action time. Zhao et al. [15] incorporated laser coupling with varying power levels into plasma spraying and discovered through the preparation and comparison of in situ laser-assisted plasma-spraying coatings that appropriate laser power could reduce both the etching rate and porosity of coatings. Current research by most scholars primarily focuses on laser processing’s improvement of coating macro-properties, such as enhanced corrosion resistance, hardness, and wear resistance, while investigations into the microstructural evolution and underlying mechanisms of laser interaction with substrate or coating materials remain relatively insufficient [16,17,18]. This study establishes a coupled Eulerian–Lagrangian (CEL) numerical model for multi-particle deposition to simulate the temperature field, stress field, and deposition behavior under laser-coating–substrate interaction. Experimental analyses of coating microstructure and macro-properties are combined to validate simulation results, optimize process parameters, and reduce time and research costs. This study uniquely integrates the validated CEL method to simulate multi-particle deposition and laser loading, and it experimentally analyzes LAPS coating to research the influence of coating quality and thermal–mechanical properties under laser power.

2. Materials and Methods

2.1. Basic Assumptions

In order to target the analysis of the problem and the simplification of the model and to exclude the influence of secondary factors, basic assumptions are made for the numerical simulation of plasma-sprayed particles impacting on the substrate carried out in this study [19]:
Assume that all particle geometries are ideal spheres and the materials are isotropic;
It was assumed that the direction of motion of all particles during the spraying process is the same, with a vertical impact on the substrate.
It was assumed that the temperature distribution of all the particles during the spraying process was uniform, and the velocity remained constant.
It was assumed that there was no relative displacement between the particles or between the coating and substrate.

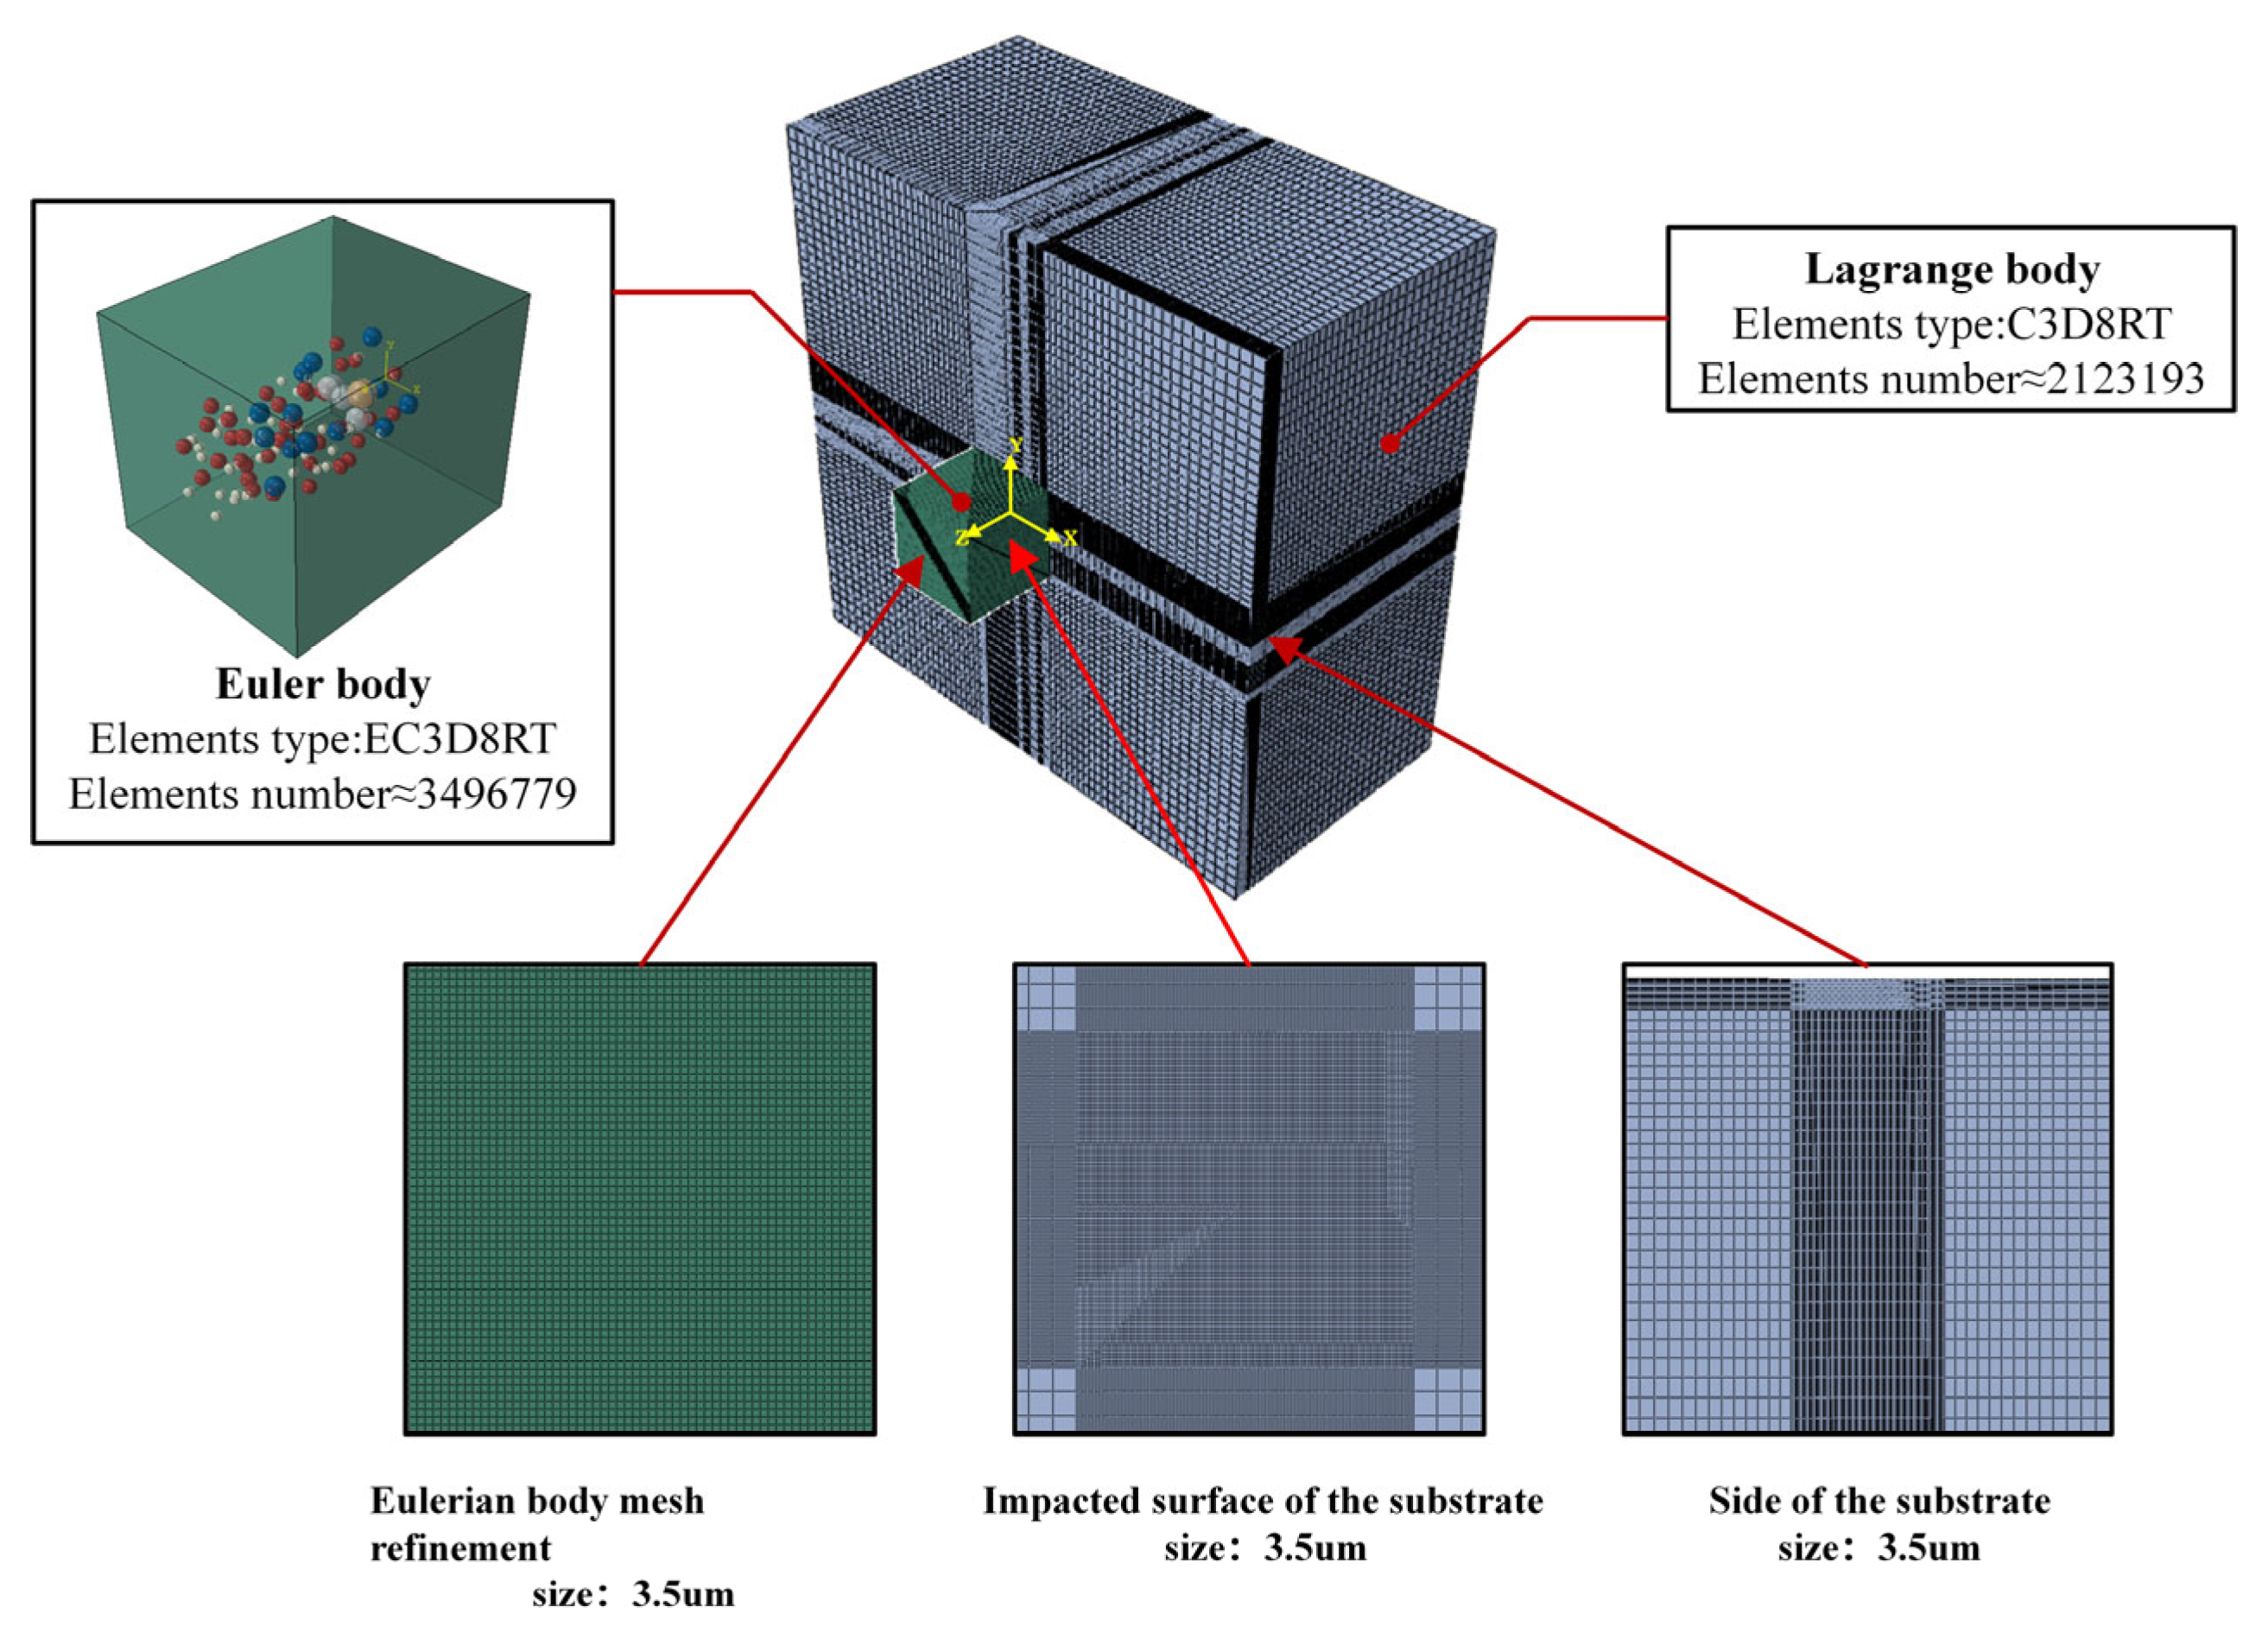
2.2. Computational Models and Methods

According to experimental requirements, this study selected a particle size of 30 µm as the average particle size and five particle sizes (20, 30, 40, 50, and 60 µm), and the total number of particles was simplified to 100, in which the distribution pattern of the particle sizes followed the lognormal function related to the particle sizes [20]:
f d p = 50 1 + e r f ln d p ln d ¯ p σ log 2
In Formula (1), f d p is the cumulative probability distribution of particle size, d p is the particle size, d ¯ p is the average particle size, and σ equals 0.36. Based on the above five particle sizes and the total number of particles, the probability distribution of the particle size was obtained, as shown in Figure 1.
The deposition deformation of plasma spraying was mainly caused by particle impact on the substrate, and numerical simulation was carried out using the FEA software Abaqus2021 to establish a 3D model of the particles and the substrate. Different numerical simulation computational methods have been explored in the study of particle–substrate interactions during thermal spraying, such as the Lagrangian method [21], Eulerian method [22], Adaptive Lagrangian–Eulerian (ALE) [23], Coupled Eulerian–Lagrangian (CEL) [24], and Smooth Particle Hydrodynamics (SPH) [25]. Xie et al. [26] compared the three methods of ALE, CEL, and SPH by studying system parameters such as impact velocity, initial particle temperature, friction coefficient, and material combinations. The CEL method was found to be more accurate, stable, and cost effective for high strain rates and in large deformation states. Zhu et al. [27] studied a coupled Eulerian–Lagrangian method for molten and semi-molten YSZ particles to impact a stainless-steel substrate, and they compared the deposition morphology and spatter trend, with experimental results verifying the reliability of the model. Song [28] used the CEL calculation method to predict and analyze the porosity of the coating after the completion of deposition, and the macroscopic pores obtained were in good agreement with the experimental results. This method allows researchers to perform a simulation of material flow and deformation in the Eulerian mesh, while maintaining the stability of the Lagrangian mesh. It can effectively capture the interaction between particles and the substrate, including particle impact, deformation, melting, and bonding with the substrate. In this study, the CEL method was used; the substrate was modeled as a Lagrangian body; the particle was modeled as a Eulerian body; and the effect of particles was inferred indirectly by analyzing the stress, strain, and temperature responses of the substrate. As shown in Figure 2, in this model, the substrate edge length was set to 3000 µm, and the stretching height was set to 1500 µm; the side length of the Eulerian body was 500 µm, and the stretching height was 600 µm. Considering the plastic deformation of the substrate and the flow of particles in the Eulerian body, the coincidence area of 100 µm height was set between the Eulerian body and the substrate. In order to balance the computational efficiency and accuracy, the mesh was refined for the critical parts of the spraying, including the Eulerian body, where the particles are located, and the impacted region of the substrate [29].

2.3. Material Model

Compared to elastic deformation, plastic deformation in plasma spraying is more significant and complex, particularly the dynamic impact process of the particles on the substrate. The Johnson–Cook material model has obvious advantages in handling the dynamic impact behavior of metal materials and is widely used. This model considers the effects of large strains, high strain rates, and high temperatures during the impact process [30].
σ = A + B ε p n 1 + C ln ε ˙ p ε ˙ 0 1 T T r T m T r m
In Formula (2), σ is the equivalent yield stress, A is the initial yield stress, B is the hardening constant, C is the strain rate constant, m is the thermal softening index, n is the hardening index, ε p is the equivalent plastic strain, ε ˙ p is the reference strain rate, ε ˙ 0 is the strain rate, T is the current temperature, T r is the reference temperature, and T m is the material melting temperature. The substrate mainly selected was Al6061 alloy, which is a common material in the semiconductor industry, and the particle material is Y2O3. The parameters describing the material properties are listed in Table 1 [31].

2.4. Laser Heat Source-Loading Model

Laser heat-source loading was implemented in the form of subroutine VDFLUX, and the influence of different power heat sources on the heat transfer and residual stresses in the substrate was studied. The energy distribution of the laser is the main factor that determines the laser heat-source model, and the heat-source model that needs to be established for laser beams with different energy distributions is also different [32]. Common heat-source models include Gaussian surface, Gaussian body, hemispherical, semi-ellipsoid, and double-ellipsoid heat-source models. For laser-assisted treatment spraying coatings, it is necessary to establish a uniform gradient distribution and act on the heat-source plane; the ideal Gaussian surface heat source is more consistent [33]. The expression for an ideal Gaussian surface heat source is given by Formula (3):
Q ( r ) = 2 A P π R q 2 exp 2 r 2 R q 2
where Q r is the heat flux at the distance, r, from the center of the circle; R q is the radius of the heat source; A is the absorption rate of the substrate material; and P is the laser power.

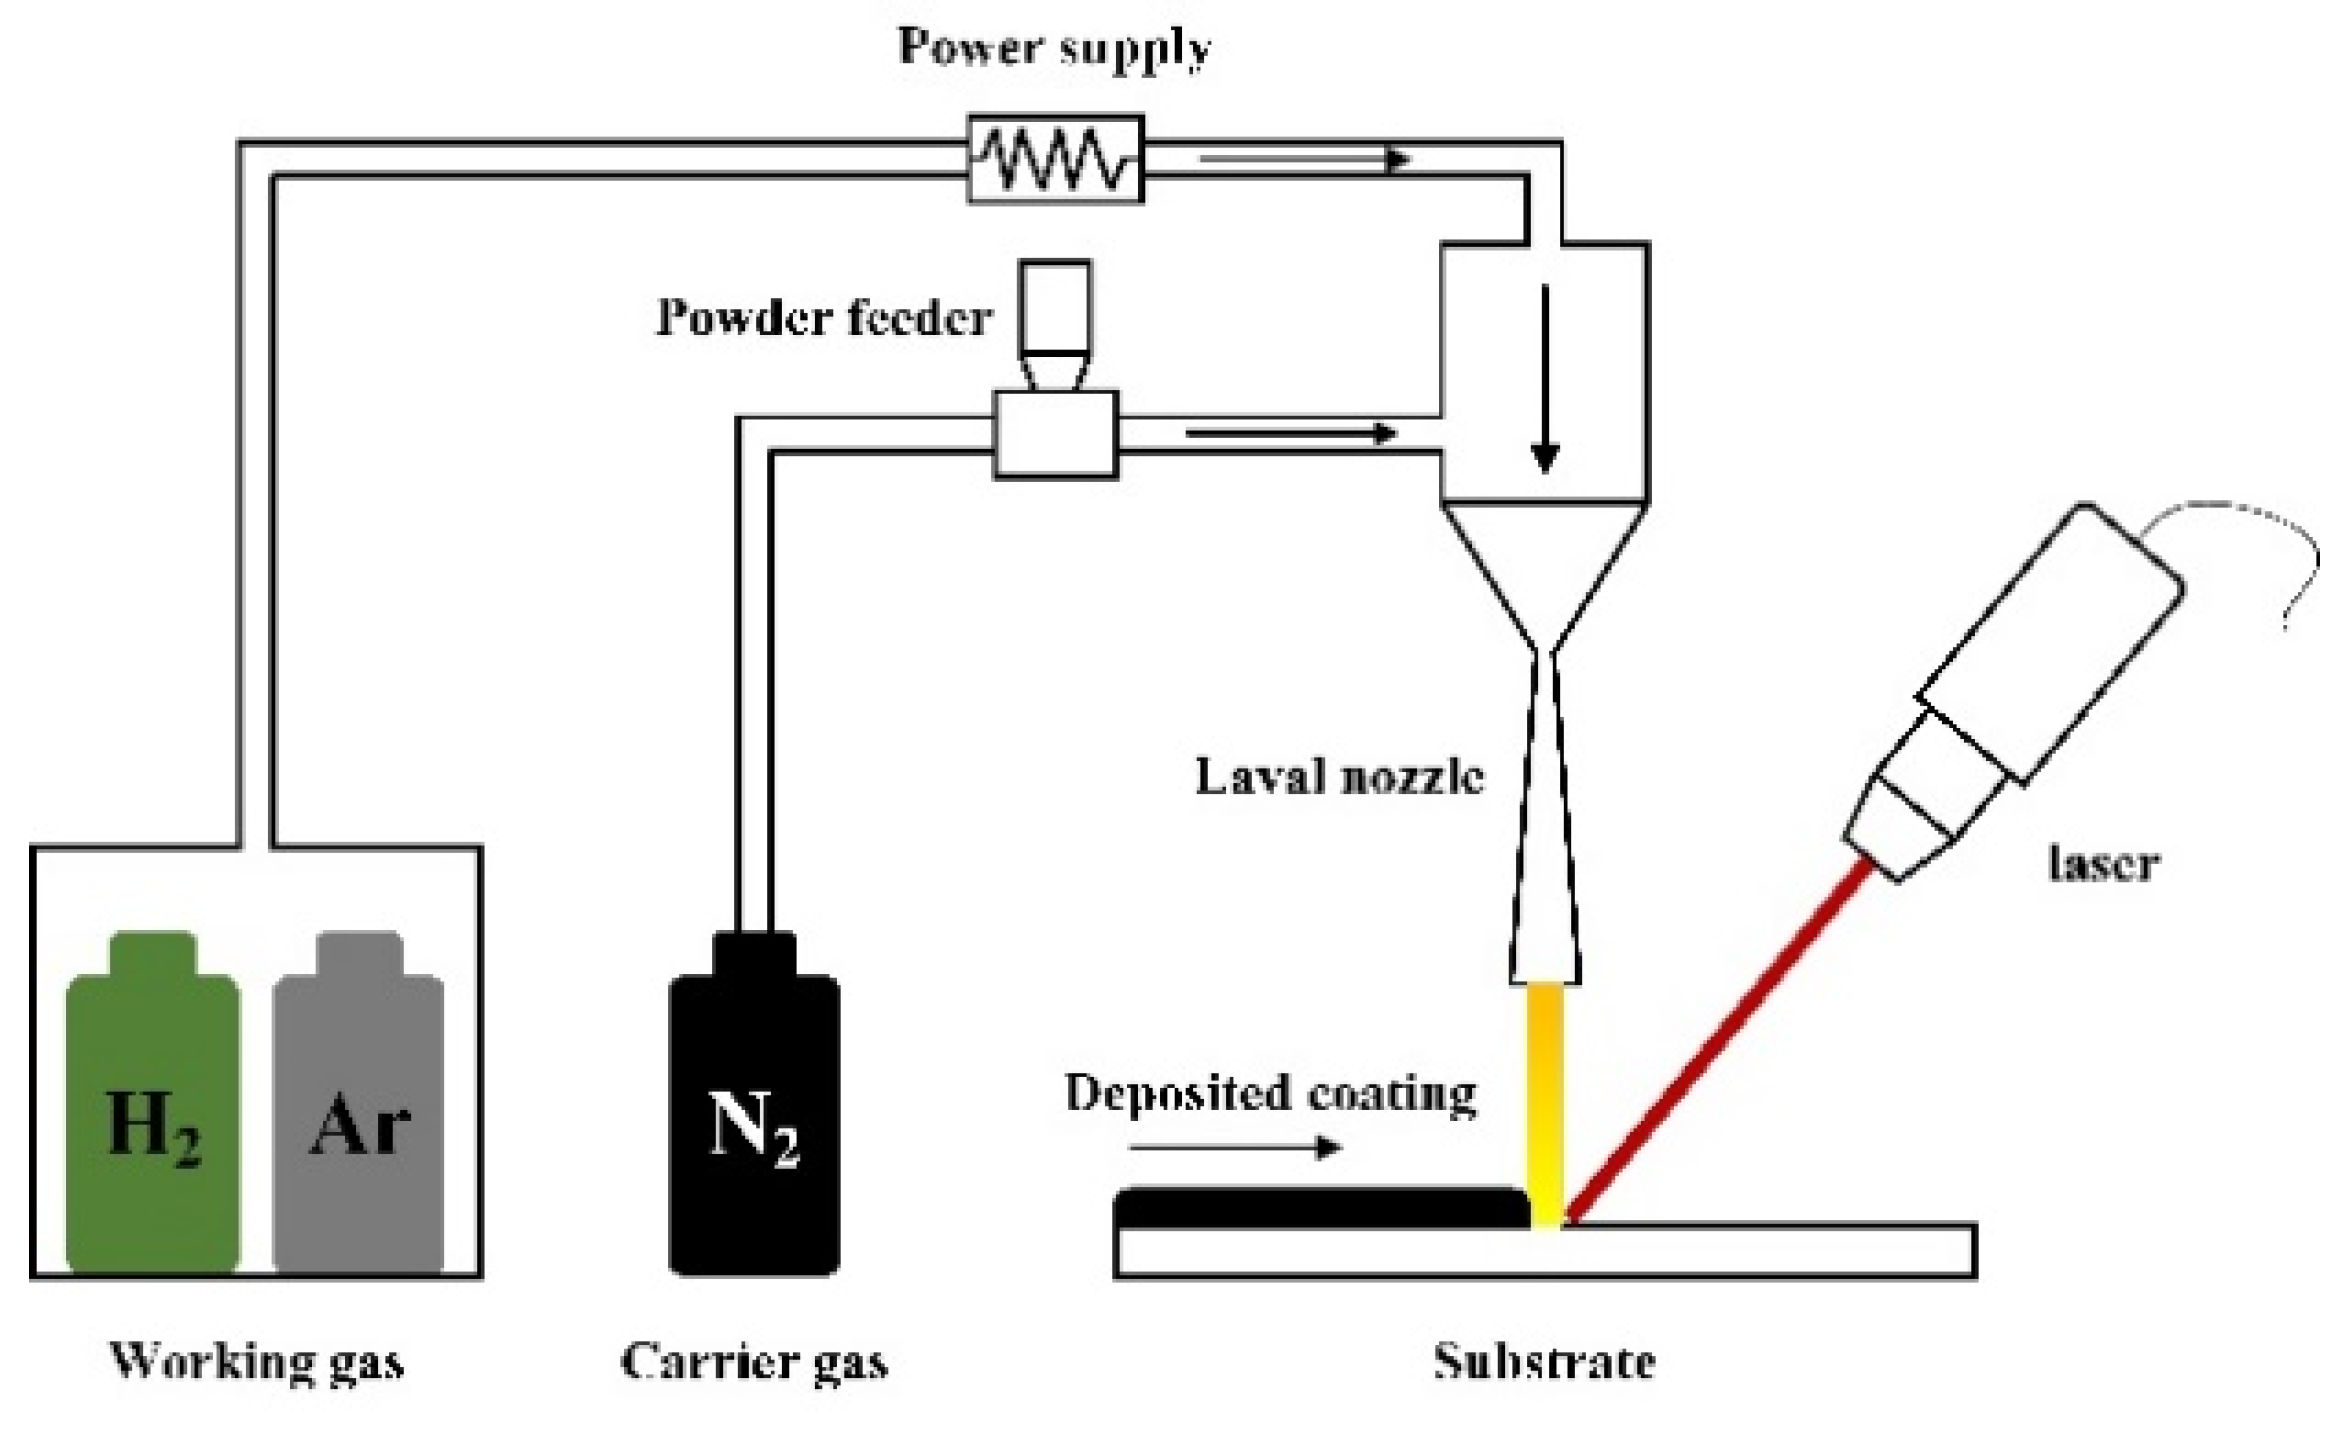
2.5. Experimental Methods

Figure 3 shows the schematic diagram of the LAPS system’s structure employed in this experiment. The experimental setup primarily consists of a plasma spray gun (XM-SG100, Xiuma Spraying Machincry, Shanghai, China) combined with a 6 KW semiconductor laser with a wavelength of 1064 nm (LDF6.000-40VGP, Laserline, Koblenz, Germany). The particle deposition area coincides with the laser spot area, where the spot diameter D is 5 mm. The spraying experiment was conducted using Y2O3 powder with an average particle size of 30 µm and purity ≥ 99.9% (Shanghai Xiangtian Nanomaterials Co., Ltd., Shanghai, China). The Al6061 alloy was cut into dimensions of 20 mm × 20 mm × 5 mm by electrical-discharge wire cutting. After cleaning to remove the surface oil and impurities, the substrate was sandblasted and roughened. The difference in laser wavelength and material properties directly affects the laser absorptivity of materials. At a laser wavelength of 1064 nm, the laser absorptivity of Y2O3 powder was 10%, and Al6061 alloy plate was 20% [34]. The laser influence factor is determined by the power density, and the laser power density, ρ, is determined according to the laser power (P) and the spot area [35], as shown in Formula (4). The experimental power settings were 400 W, 500 W, and 600 W, corresponding to power densities of 20.4 W/mm2, 25.5 W/mm2, and 30.6 W/mm2, respectively, and the other spraying-process parameters were shown in Table 2. The sprayed coating samples were cut, roughly ground, polished, and cleaned with alcohol for characterization, and the average hardness value was calculated by using an automatic microhardness tester (HMV-2T, Shimadzu, Japan) to collect multiple points of the same spacing on the surface of the coating and substrate of the metallographic specimen, with a load of 0.1 kg and a holding time of 10 s. The microstructure of the coatings was observed using a field-emission scanning electron microscope (FE-SEM, Sigma 300, Zeiss, Jena, Germany), and the porosity of the coatings was analyzed across the whole cross-section using Image J ver.1.8.0.345 software (Image J ver.1.8.0.345).
ρ = 4 P / π D 2

3. Numerical Simulation Results and Discussion

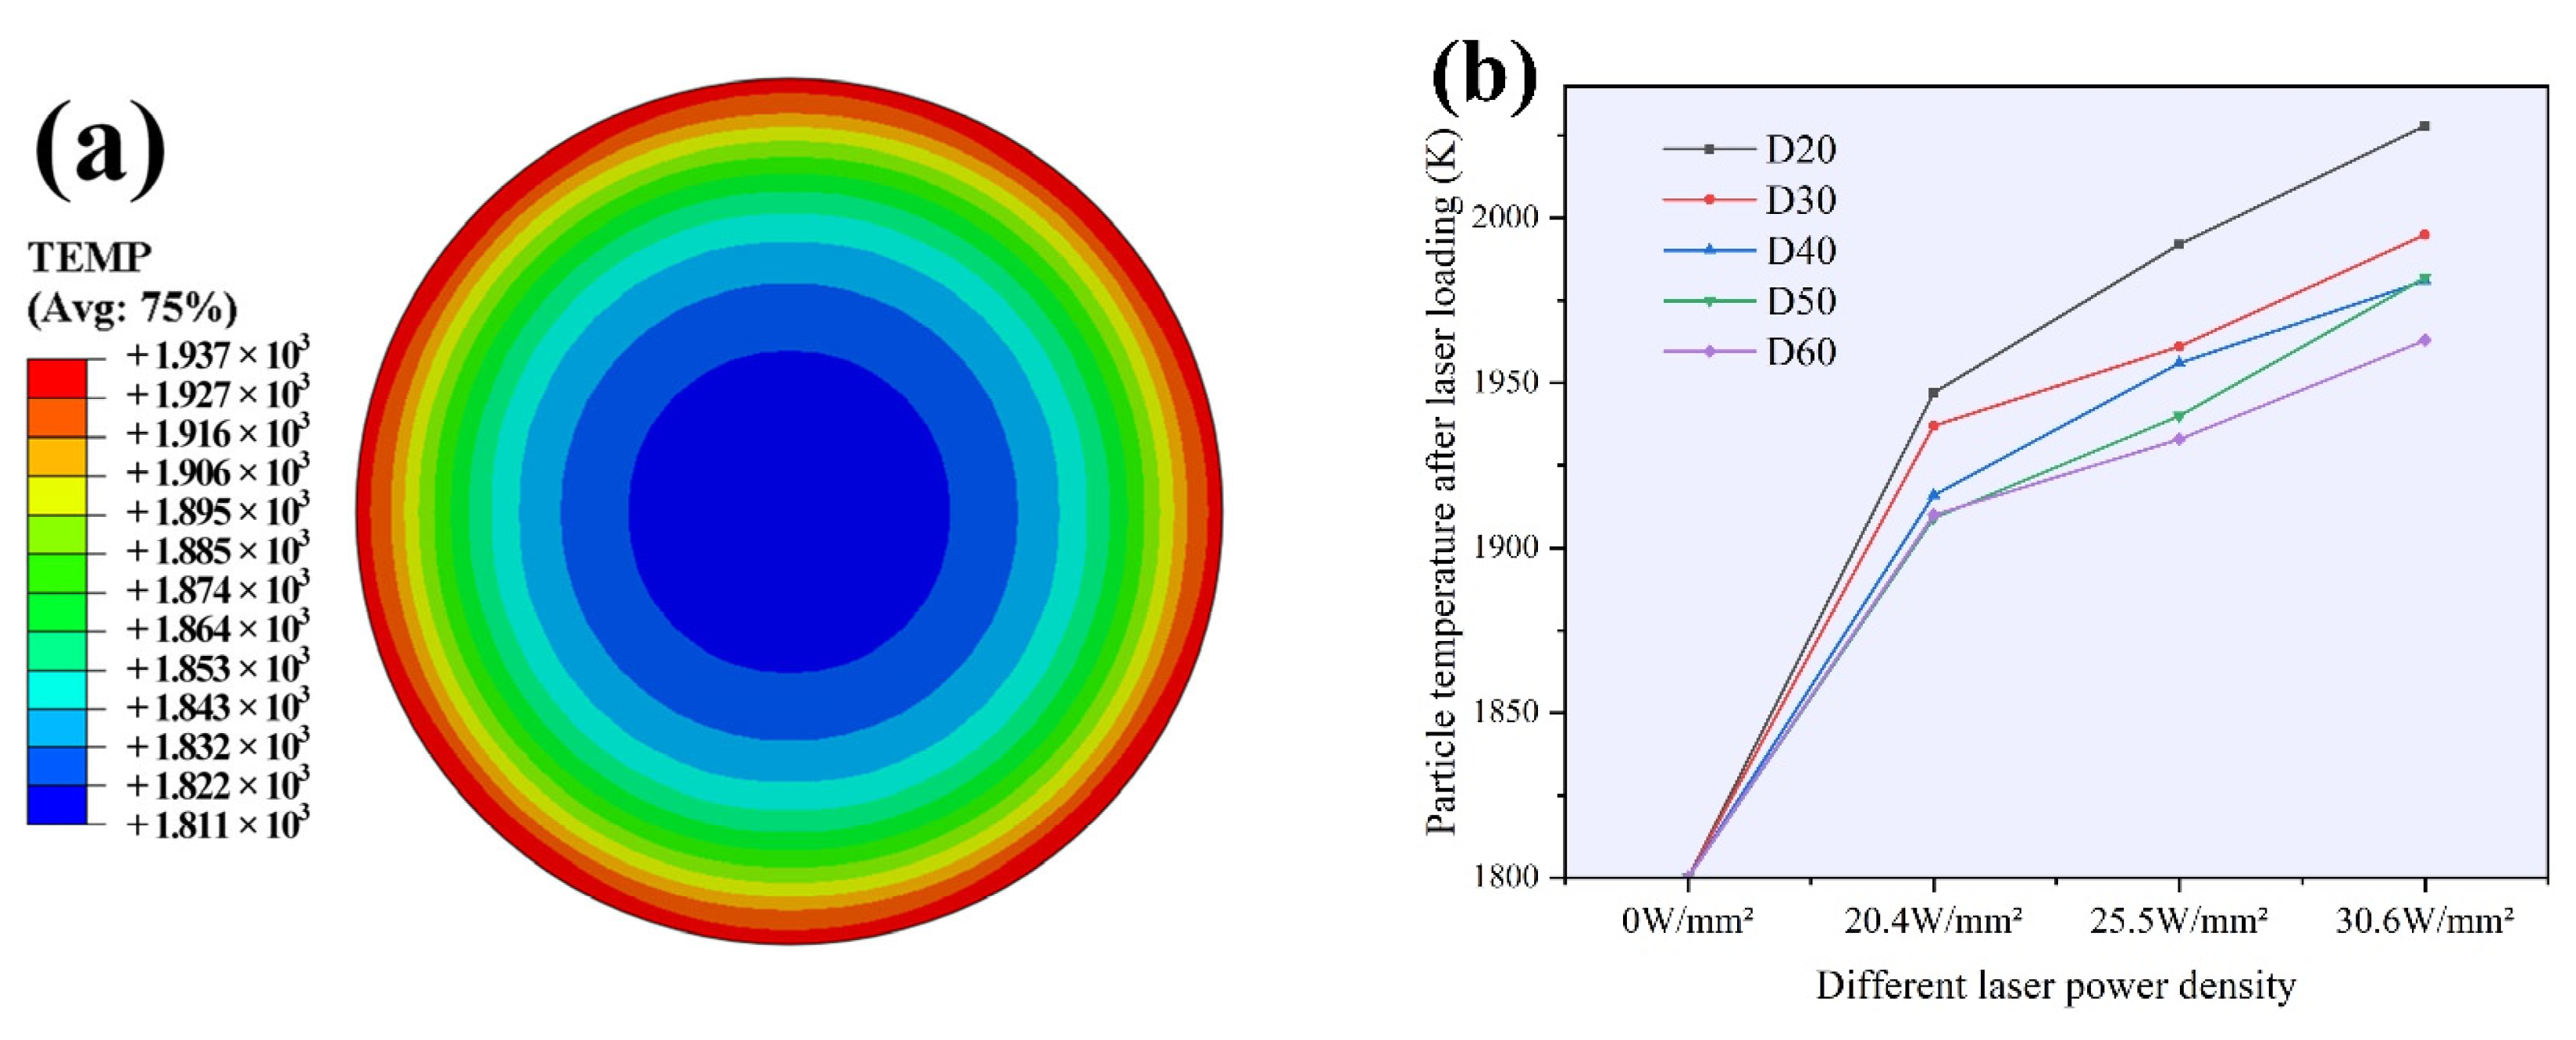
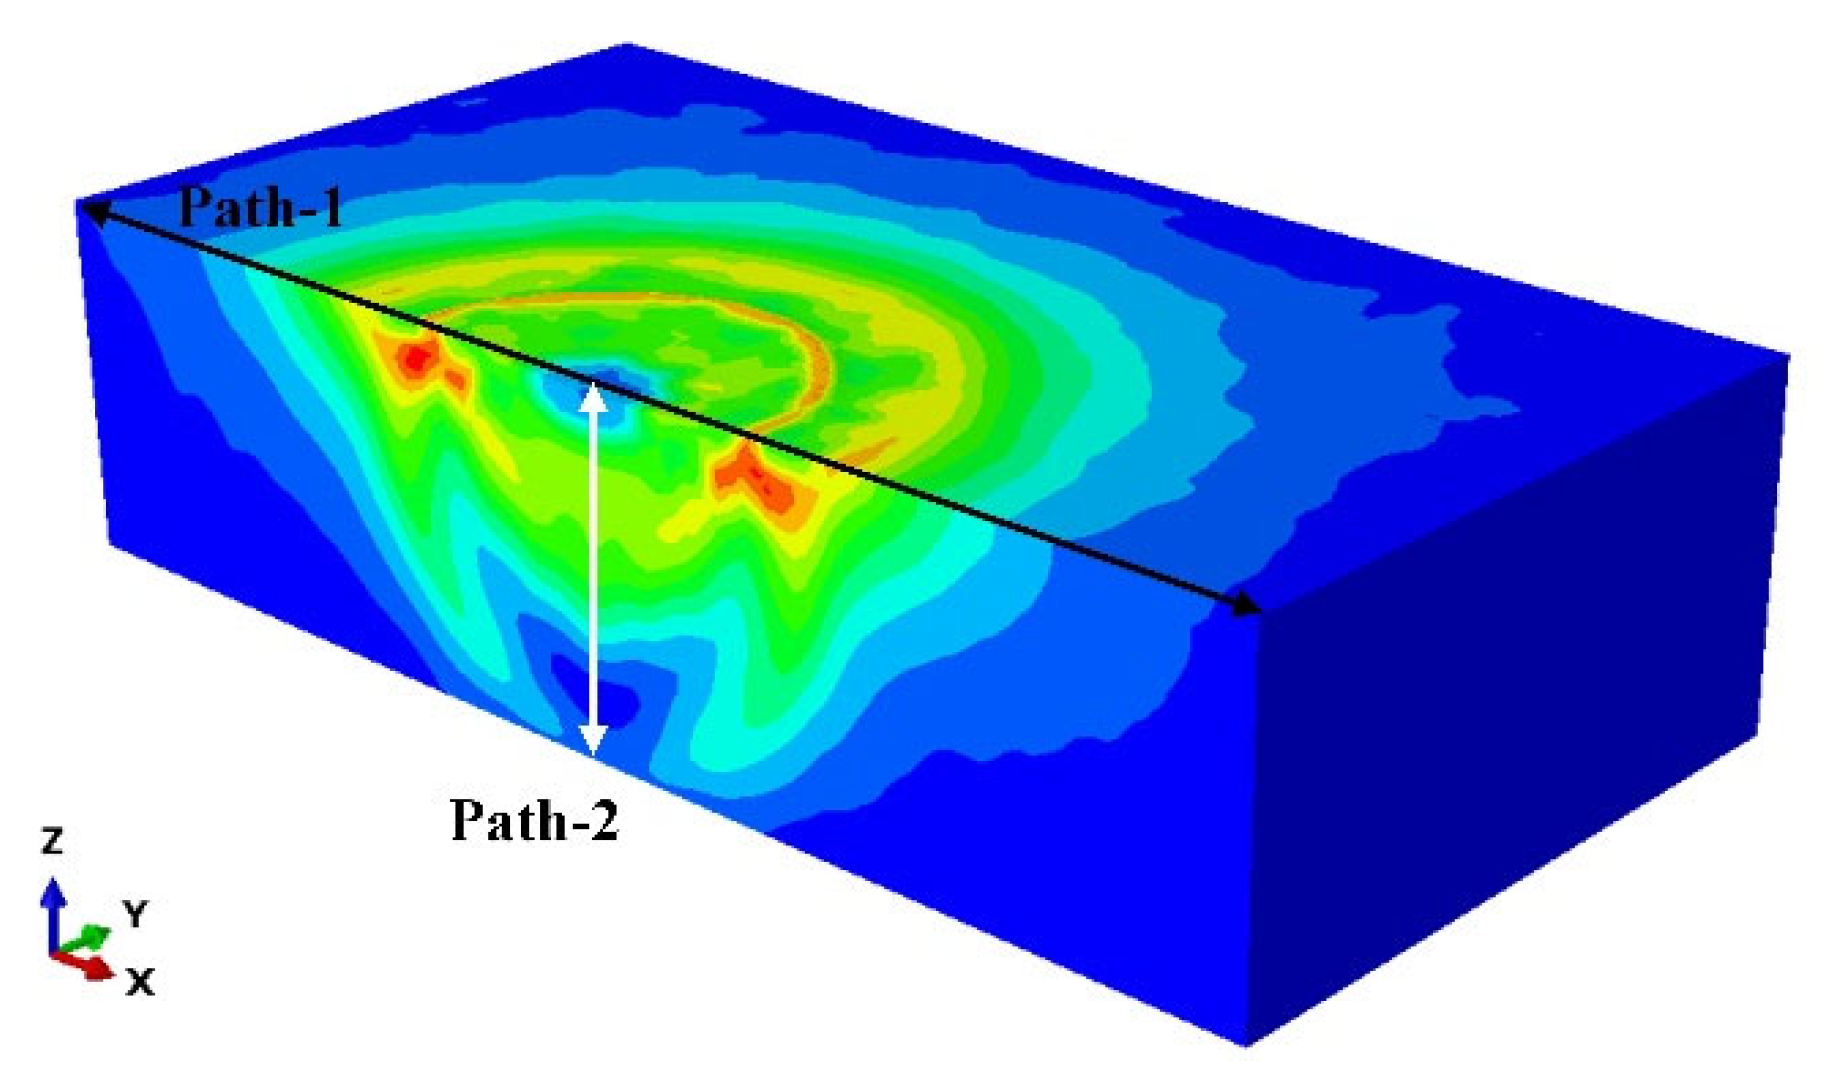
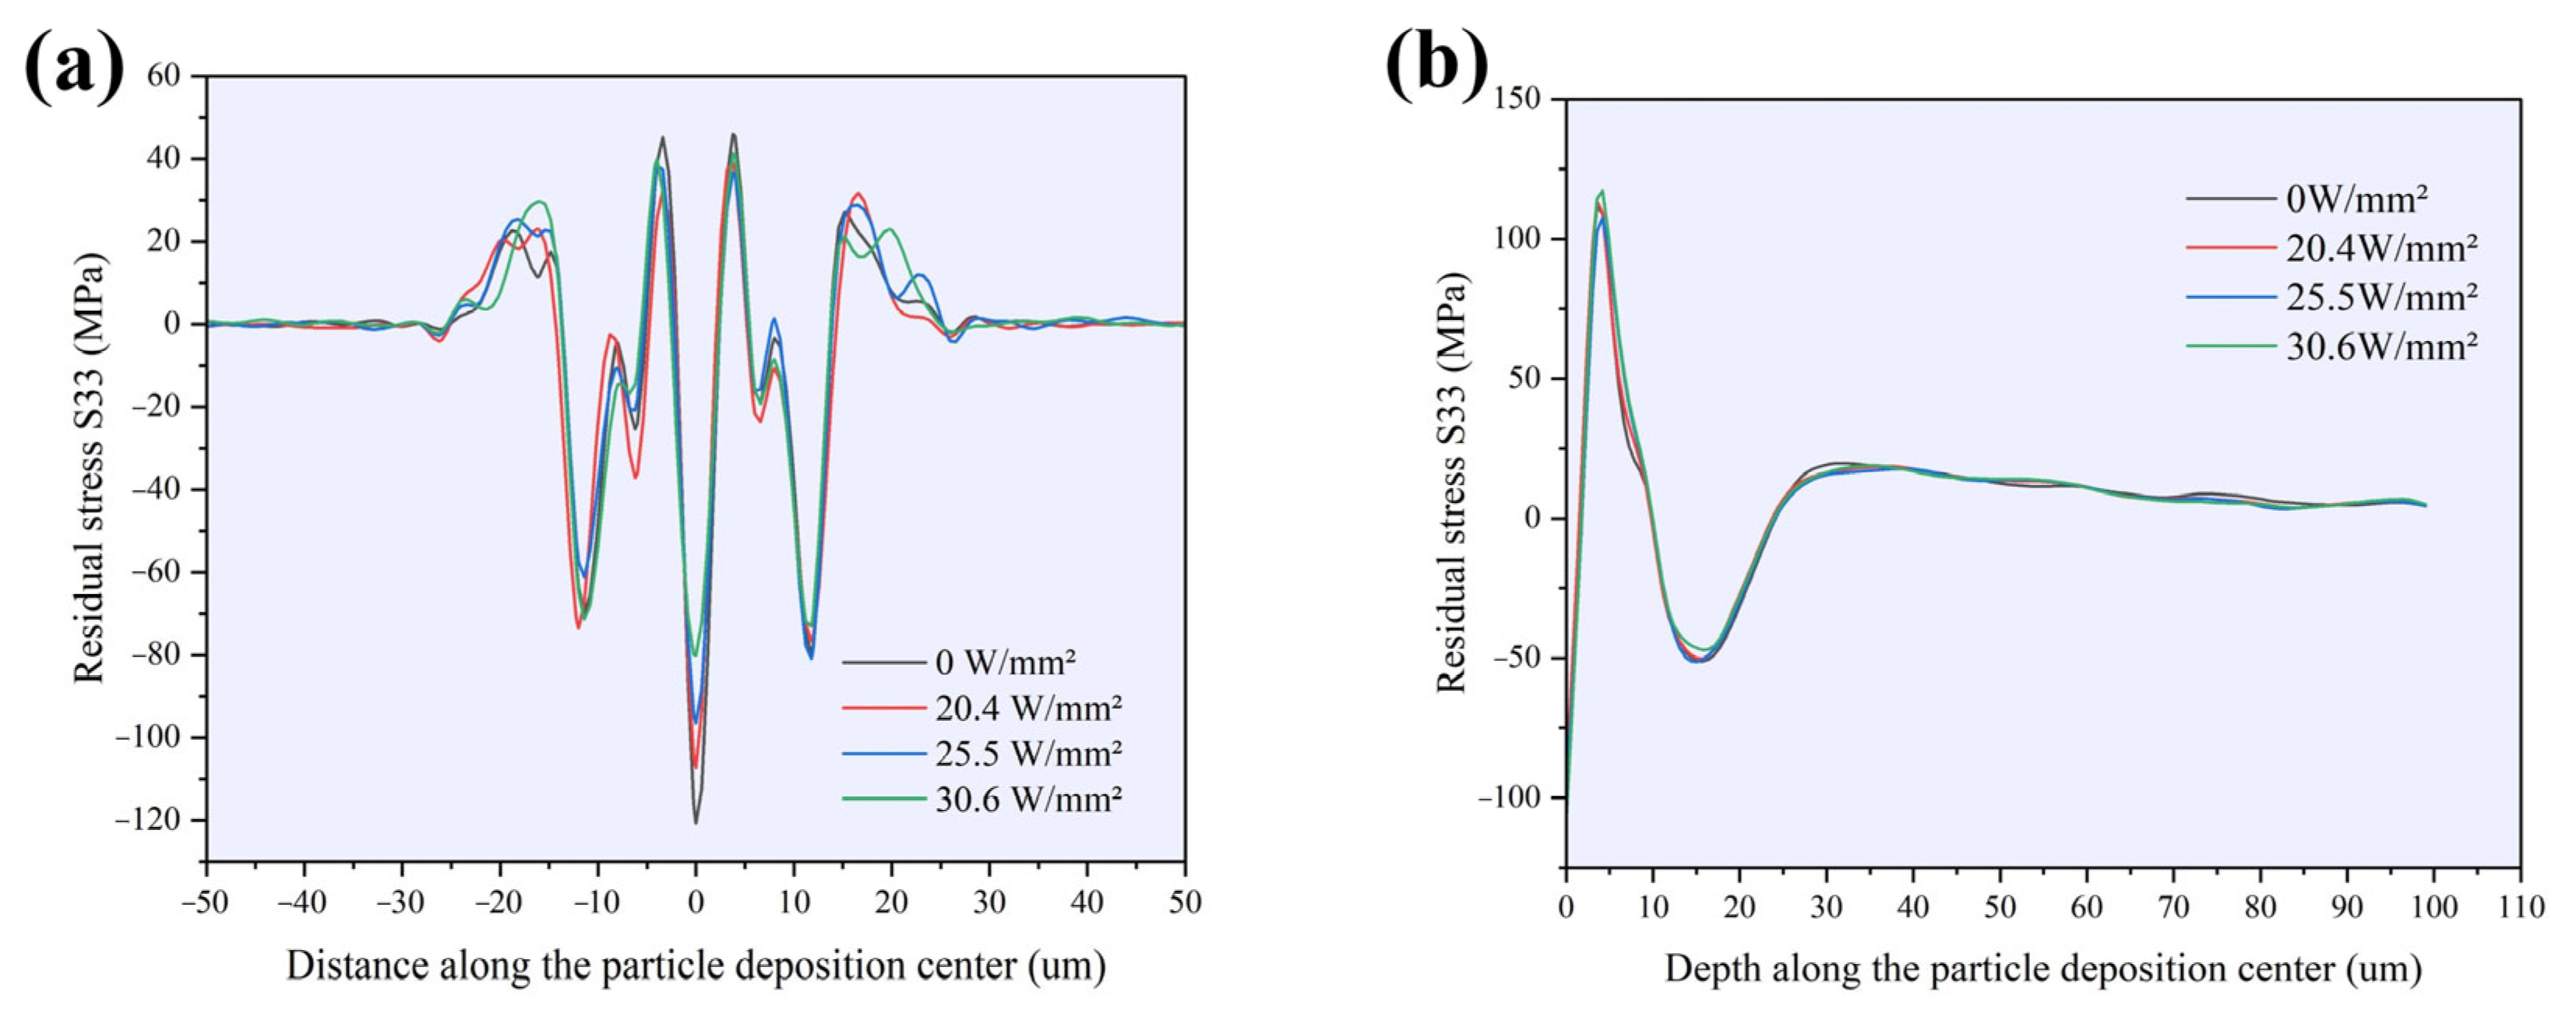
3.1. Single-Particle Laser Heat-Source Loading

The temperature of the particle deposition substrate was affected by its diameter and laser power. Figure 4a shows the temperature distribution of a single particle with a diameter of 30 µm after laser irradiation at a power density of 20.4 W/mm2, where the temperature of the particle was set to 1800 K before the particle exited the nozzle and reached the irradiation area. The maximum temperature of the particles reached 1937 K, which was much higher than the initial temperature of the particles. The temperature of the particle decreases in an isotropic gradient from the outside to the inside, which is related to the laser heat-source model. The results show that after being irradiated by the laser, the temperature of the outer surface area of the particles increased significantly, and the temperature was gradually transmitted to the core in the form of gradient changes; however, the temperature increase in the core area was not obvious. The main reason is that the thermal conductivity of Y2O3 particles is 2.32 W/m∙K, and the low thermal conductivity indicates that it is difficult to transfer temperature from high temperature to low temperature. The temperature of the core is approximately 1830 K, and the distribution area is large, which means that although the outer surface of the particles is already in a molten state during spraying, the core still exists in the form of a partial solid. Figure 4b is the temperature-rise law of particles with a diameter of 20~60 µm at 20.4 W/mm2, 25.5 W/mm2, and 30.6 W/mm2 laser power density. The results show that the temperature of particles with a small diameter increased more significantly after laser irradiation, and the temperature of particles with a diameter of 20 µm was much higher than that of particles with a diameter of 60 µm; thus, the increase in laser power density increase the temperature by approximately tens of degrees, measured in Kelvin.
Figure 5 describes the distribution law of the stress field, strain field, and temperature field of the substrate after single-particle deposition at 0 W/mm2 and 20.4 W/mm2 power-density lasers. Particles deposit on the substrate to form pits of varying diameters and depths, which are uniformly symmetrical. The pits primarily consist of three main regions: the bottom center area of the pit, the sidewall of the pit, and the edge of the pit. The bottom center area of the pit and the sidewall exhibit the greatest depth and severe plastic deformation due to direct particle impact, while the edge of the pit forms protrusions due to the substrate material being squeezed and thus protruding. The formation of pits is mainly due to the impact velocity of the particles, which come into direct contact with the pits. A larger surface area of the pits is beneficial for the adhesion of the coating to the substrate. However, in the thermal spraying process, the melting of particles and the thermal softening of the substrate result in less pronounced pits. It can be seen from the stress cloud map in Figure 5a,d that the maximum stress concentration area is at the edge of the pit, and the minimum value is in the center of the pit and the area around the pit. Owing to the high-velocity impact of the particles on the substrate during plasma spraying, the central area was first contacted and impacted. The extrusion of the particles after the impact causes local plastic deformation of the substrate; therefore, the maximum concentrated stress is distributed at the edge of the pit, which is most severely deformed by extrusion. In the process of particle compression of the substrate, some kinetic energy is converted into elastic strain energy. When the compression reached its limit, the elastic strain energy was released to rebound the particles, and the particles were separated from the substrate. Therefore, the central stress of the pit of the substrate was small, and in the deposition process, the stress of the particles on the substrate was transmitted in the form of stress waves. However, the stress attenuates with the propagation distance; therefore, the stress in the area around the pit gradually decreases. The concentrated stress of the substrate without loading laser is 255 MPa, and the maximum concentrated stress of the loaded 30.6 W/mm2 power density laser is reduced to 227 MPa. It can be seen from the equivalent plastic strain (PEEQ) cloud map in Figure 5b,e that the maximum PEEQ is located on the sidewall of the pit, the minimum value is in the bottom center area of the pit, and the PEEQ is only generated in the plastic deformation area. Figure 5c,f show that the temperature distribution is uniform, and the range is small before the laser heat source is loaded. The maximum temperature is located on the surface of the pit because of the plastic deformation of the particle deposition substrate, and the temperature diffuses to the surrounding area owing to heat transfer. After loading, the laser heat source was distributed in an equal gradient, and the range was large. The maximum temperature reached 616 K, which was much larger than the initial temperature of the substrate (300 K), and was located in the entire particle deposition area. The laser heat source could effectively act on the substrate, and the temperature increased significantly. The range of influence of the heat transfer is related to the radius of the laser heat source.
To study the change in residual stress after particle deposition under laser irradiation at different power densities, Figure 6 shows the extraction path of residual stress S33, Path 1 is the path extracted in the X-axis direction of the deposited surface, and Path 2 is the path extracted in the Z-axis direction of the depth. Tensile stress is formed between the deposited coating and the substrate due to mismatches in thermal expansion or cooling shrinkage, which may lead to cracks, interface failure, or reduced fatigue performance. Compressive stress is caused by plastic deformation or changes in phase volume, resulting in mutual compression between the coating and substrate material that can inhibit crack growth, increase binding strength, and improve durability. As shown in Figure 7a, the center of the deposition pit had the maximum compressive stress, and the edge of the pit, caused by extrusion, had the maximum tensile stress. According to the change in axial stress, it can be seen that the stress around the edge area of the pit extrusion is relatively small, and the stress in the area far away from the pit is relatively large, mainly due to the transmission of stress waves. The stress change is obvious because of the differences in the location and size of the pits caused by particle deposition, resulting in a difference in the magnitude of stress. Positive tensile and negative compressive stresses were observed. The change trend is similar to that of the oscillation transmission of the wave. The stress value was zero in the area where the stress wave was far away. The maximum compressive stress without laser loading was −80 MPa, which gradually increased after laser loading. The maximum compressive stress is −120 MPa at 30.6 W/mm2 power density, which is more conducive to the combination of particles and coatings. Figure 7b shows that the change in the influence of different power density laser loadings on the residual stress in the depth direction is basically the same, from the maximum compressive stress to the maximum tensile stress; it then transforms into compressive stress, and it finally tends toward to 0. At the beginning of the deposition, owing to the compression of the substrate via particle deposition, the plastic deformation has a maximum compressive stress of approximately −100 MPa, but the influence depth is shallow. With an increase in depth, the local thermal expansion and elastic constraint of the material led to tensile stress, and the maximum tensile stress was approximately 120 MPa at the highest temperature (5 µm). In the depth range of 5–10 µm, with the decrease in the temperature effect and the transmission of the compressive stress wave, the tensile stress decreases and the compressive stress increases to −50 MPa. After 15 µm, owing to the influence of the transmission attenuation of the compressive stress wave, the compressive stress gradually decreases and tends toward 0.

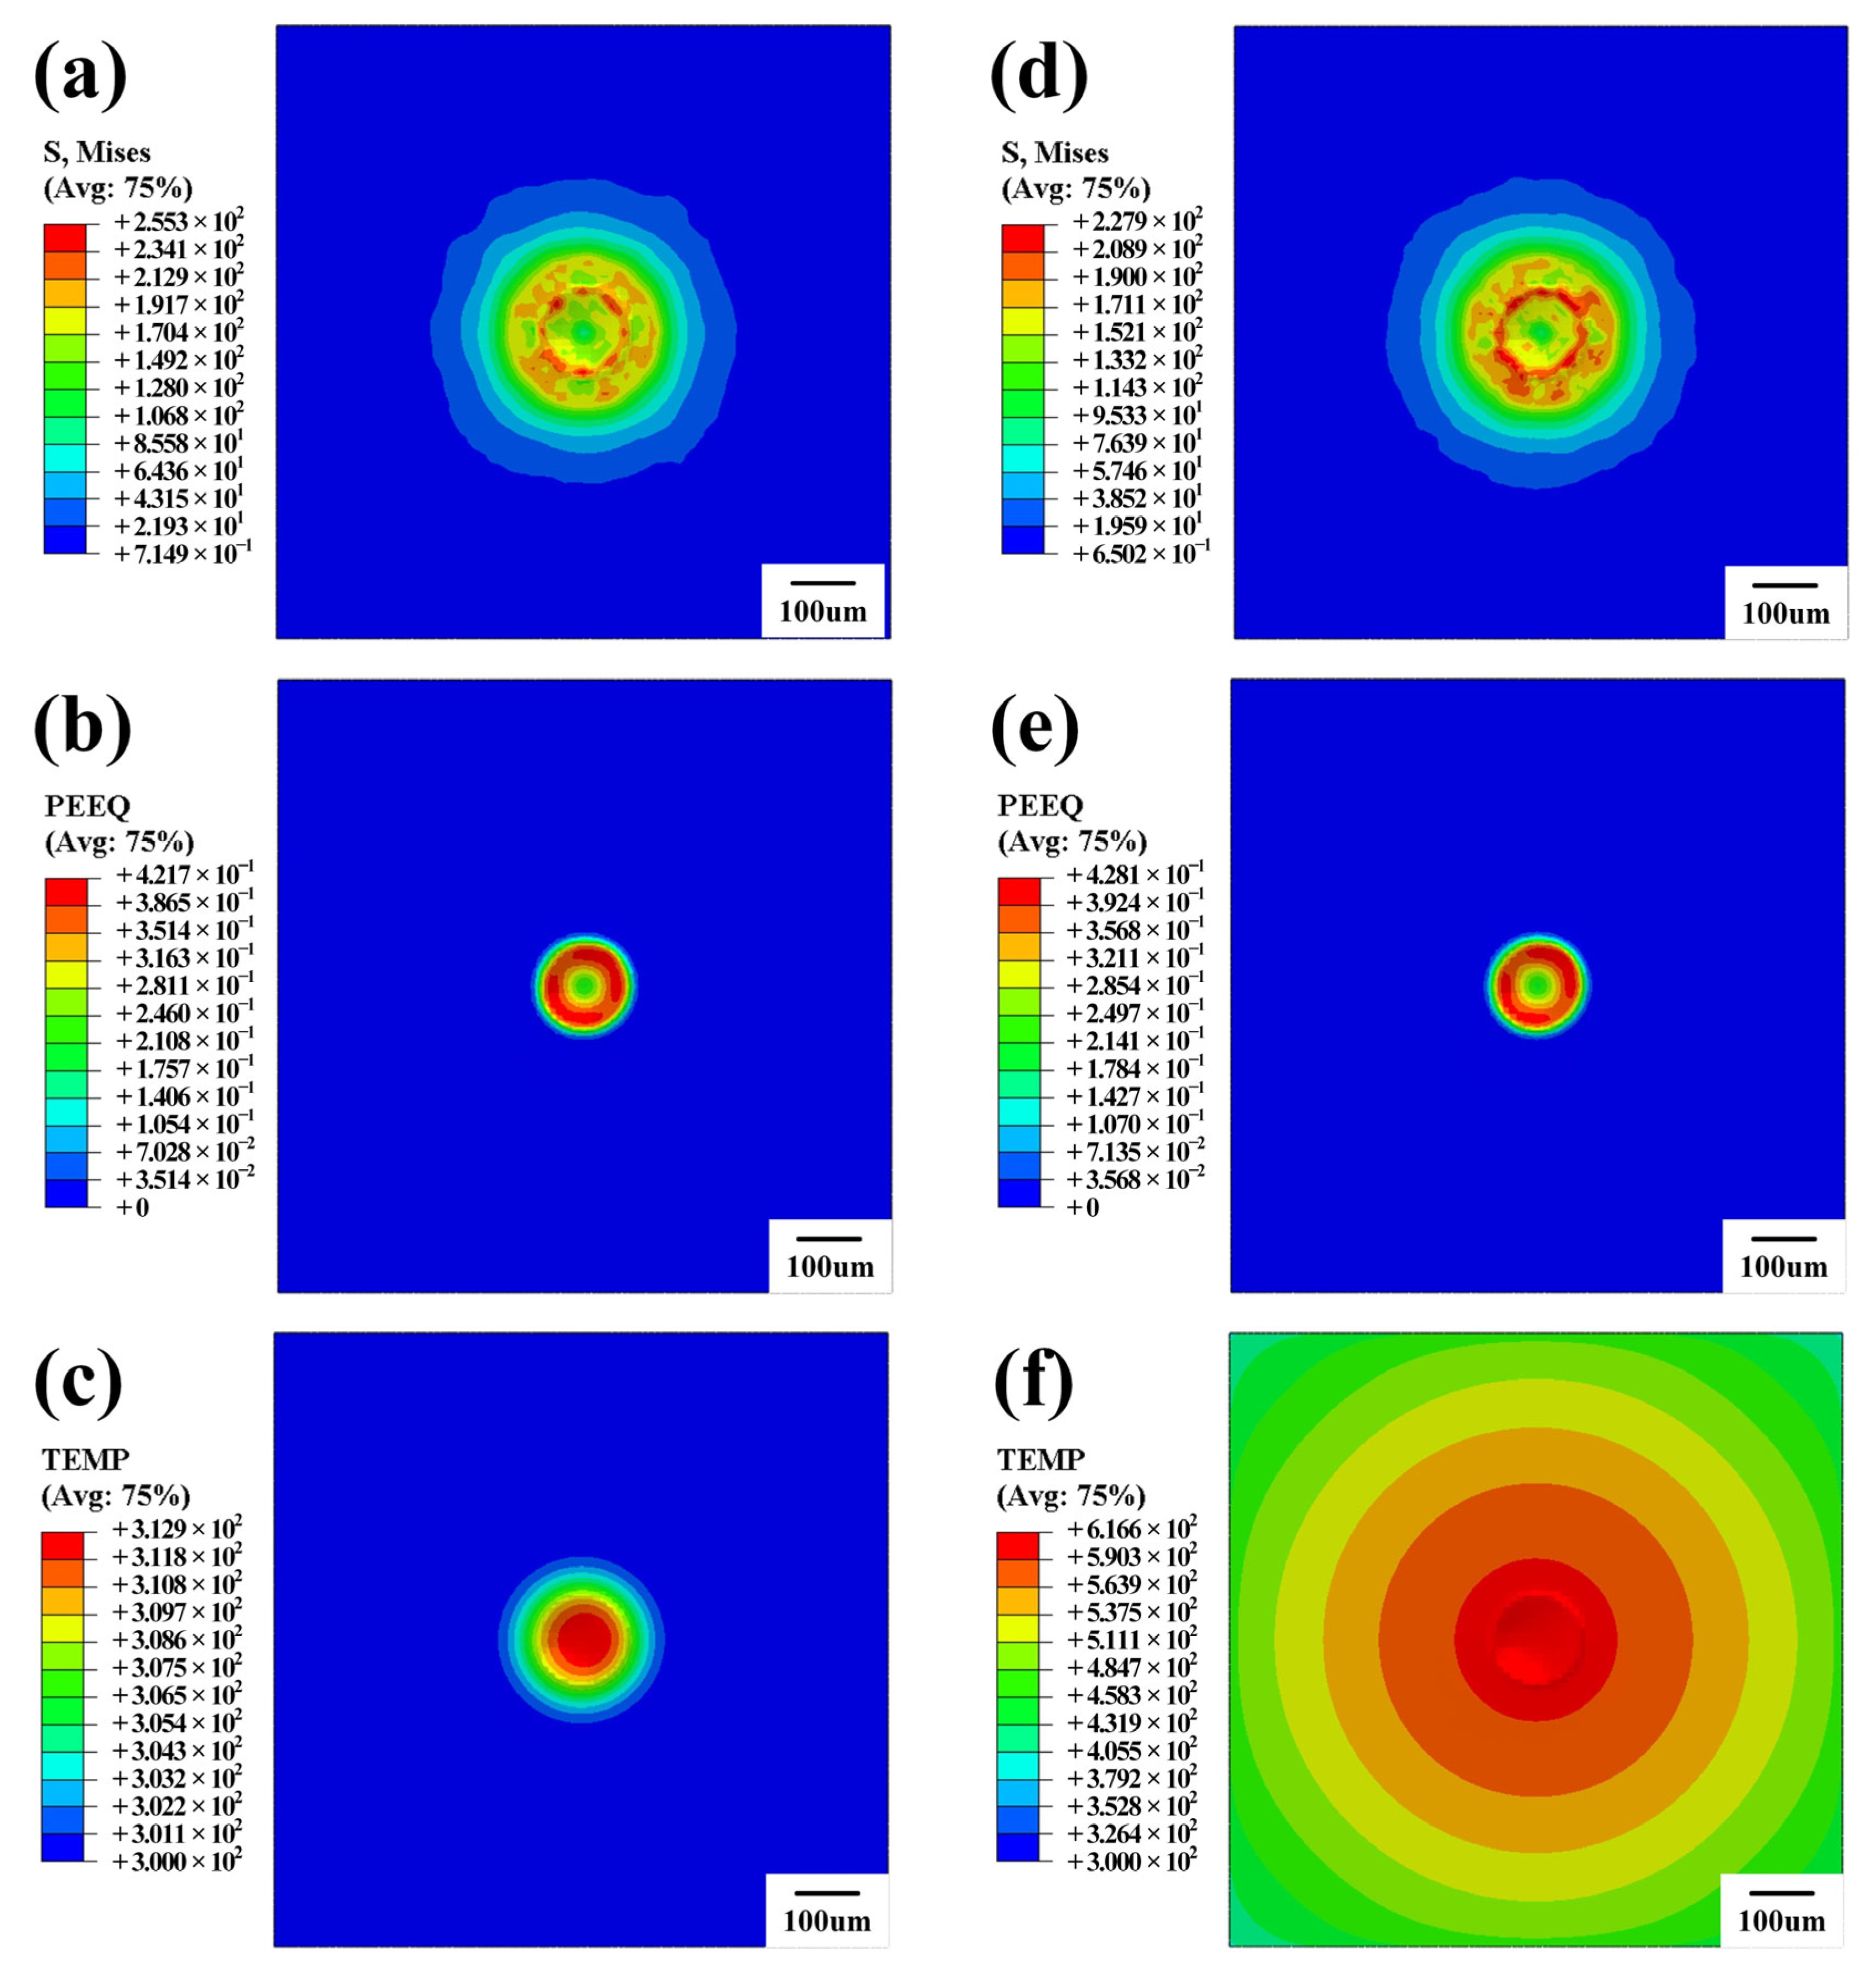
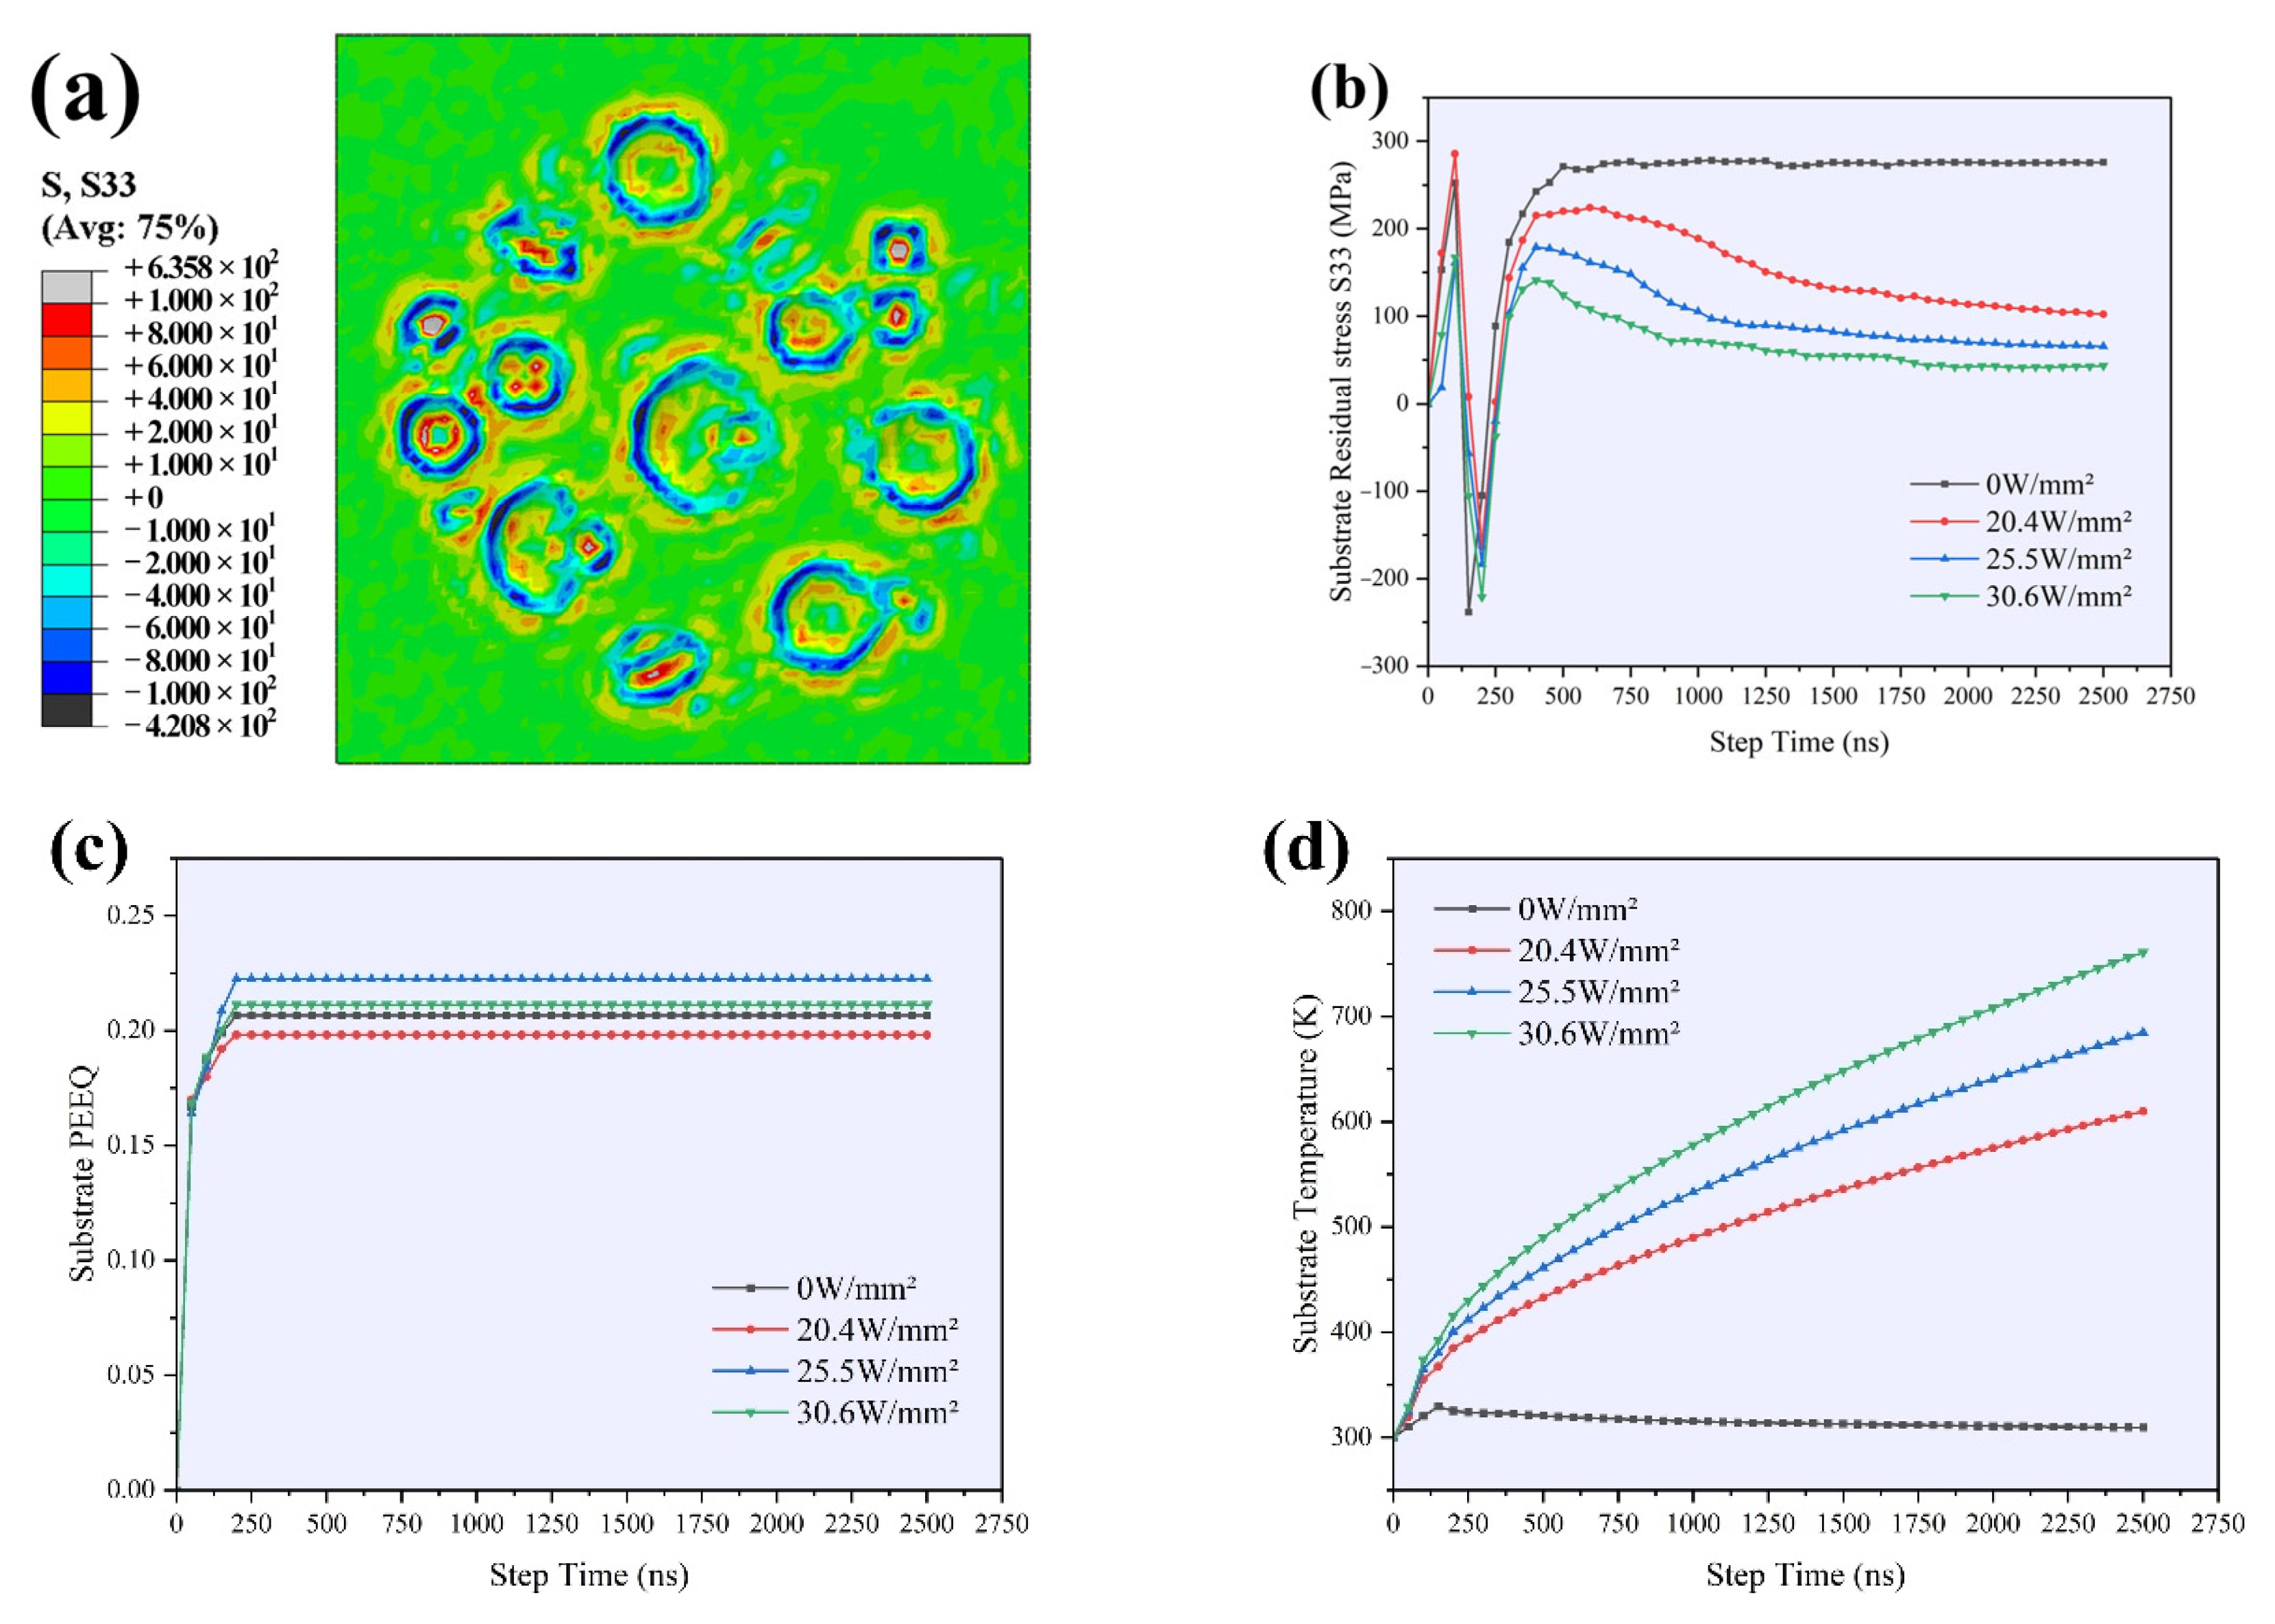
3.2. Multi-Particle Laser Thermal Source Loading

As can be seen in Figure 8, the surface morphology and thickness of the coatings deposited by multiple particles under laser irradiation at different power densities change significantly. Without laser-assisted spraying, the coating was deposited with particles spreading with different diameters, and the edge sputtering shape was mainly manifested as a disc shape marked by a blue circle. There are obvious grooves between the particles which are mainly due to the non-uniformity of the spreading of single particles on the substrate or coating when they are deposited, with the particles being thicker in the middle and thinner on the edges, and particles cannot be fused well together owing to the joint action of surface tension and tensile stress. The formation of cavities on the surface of the coating due to thermal expansion and cooling contraction stresses, such as those marked by the red circle, may be filled by subsequent deposition of particles, or they may persist as pore defects. The thickness of the coating under 0 W/mm2 was 46 µm, and the particles were stacked on top of each other to form the coating. The particles in the lower layer have a large diameter and thin thickness owing to the extruded spreading of the particles. As indicated by the arrows, the upper layer of incompletely melted particles exhibits the original spherical and hemispherical morphology, with pores between the particles owing to lap defects. As the laser power density increased, the coating surface exhibited more cavities with larger diameters, and the sputtering shape of the coating edges evolved mainly from disc-shaped to finger-shaped, mainly because of the concentration of shrinkage stresses during particle solidification. The cross-sectional morphology shows that the thicknesses of the coatings under 20.4 W/mm2, 25.45 W/mm2, and 30.6 W/mm2 power densities loading are 41 µm, 39 µm, and 35 µm, respectively, and the unmelted particles in the upper layer of the coatings are gradually heated by the laser for further melting, which reduces the increase in the thicknesses due to the defects in the coatings. With the increase in laser power density, the pores near the interface between the coating and the substrate are gradually reduced, but several small pores in the middle region of the coating gradually evolve and aggregate to form a larger pore.
Figure 9a shows the stress-distribution cloud map, which shows that the multi-particle deposition is mainly compressive stress in the edge area of the pit, approximately −100 MPa, and the bottom of the pit is mainly tensile stress or no stress, approximately 80 MPa or more. Figure 9b shows that when the deposition began, the maximum tensile stress increased gradually, owing to the temperature difference between the substrate and the particles, reaching a maximum at 100 ns. When the substrate produces a large compressive stress on the particles, the tensile stress gradually decreases, and the maximum compressive stress can reach −200 MPa. With the expansion and elastic recovery of the temperature transfer material, the tensile stress gradually increased and tended to stabilize. With an increase in laser power density, the maximum tensile stress decreased from 250 MPa at 0 W/mm2 to approximately 80 MPa at 30.6 W/mm2. Thermal stress constitutes the predominant origin of residual tensile stress in coatings, arising from temperature gradients and thermal expansion coefficient (CTE) mismatch between the coating and substrate. Laser-assisted heating reduces the temperature gradient between the substrate and the coating, while the reduced cooling rate promotes more synchronous contraction between the coating and substrate, thereby diminishing tensile stress. Since the CTE of the Y2O3 coating is lower than that of the Al6061 alloy substrate, the coating undergoes less contraction upon cooling. The consequent compressive stress partially counteracts the tensile stress, leading to an overall reduction in residual tensile stress. It can be observed from Figure 9c that an increase in the laser power density leads to an increase in the equivalent plastic strain of the substrate, which is approximately 0.2. The temperature variation in the loading of the laser heat source is shown in Figure 9d, where the substrate temperature initially increased and then decreased, rising by approximately 10 to 30 K, as it was mainly affected by the particle temperature, and it continued to increase after loading the thermal source. At the end of deposition at 2500 ns, the temperature reached 610 K at a power density of 20.4 W/mm2, 680 K at 25.5 W/mm2, and 760 K at 30.6 W/mm2. This suggests that the effect of particle temperature on the substrate temperature after loading the thermal source was smaller.

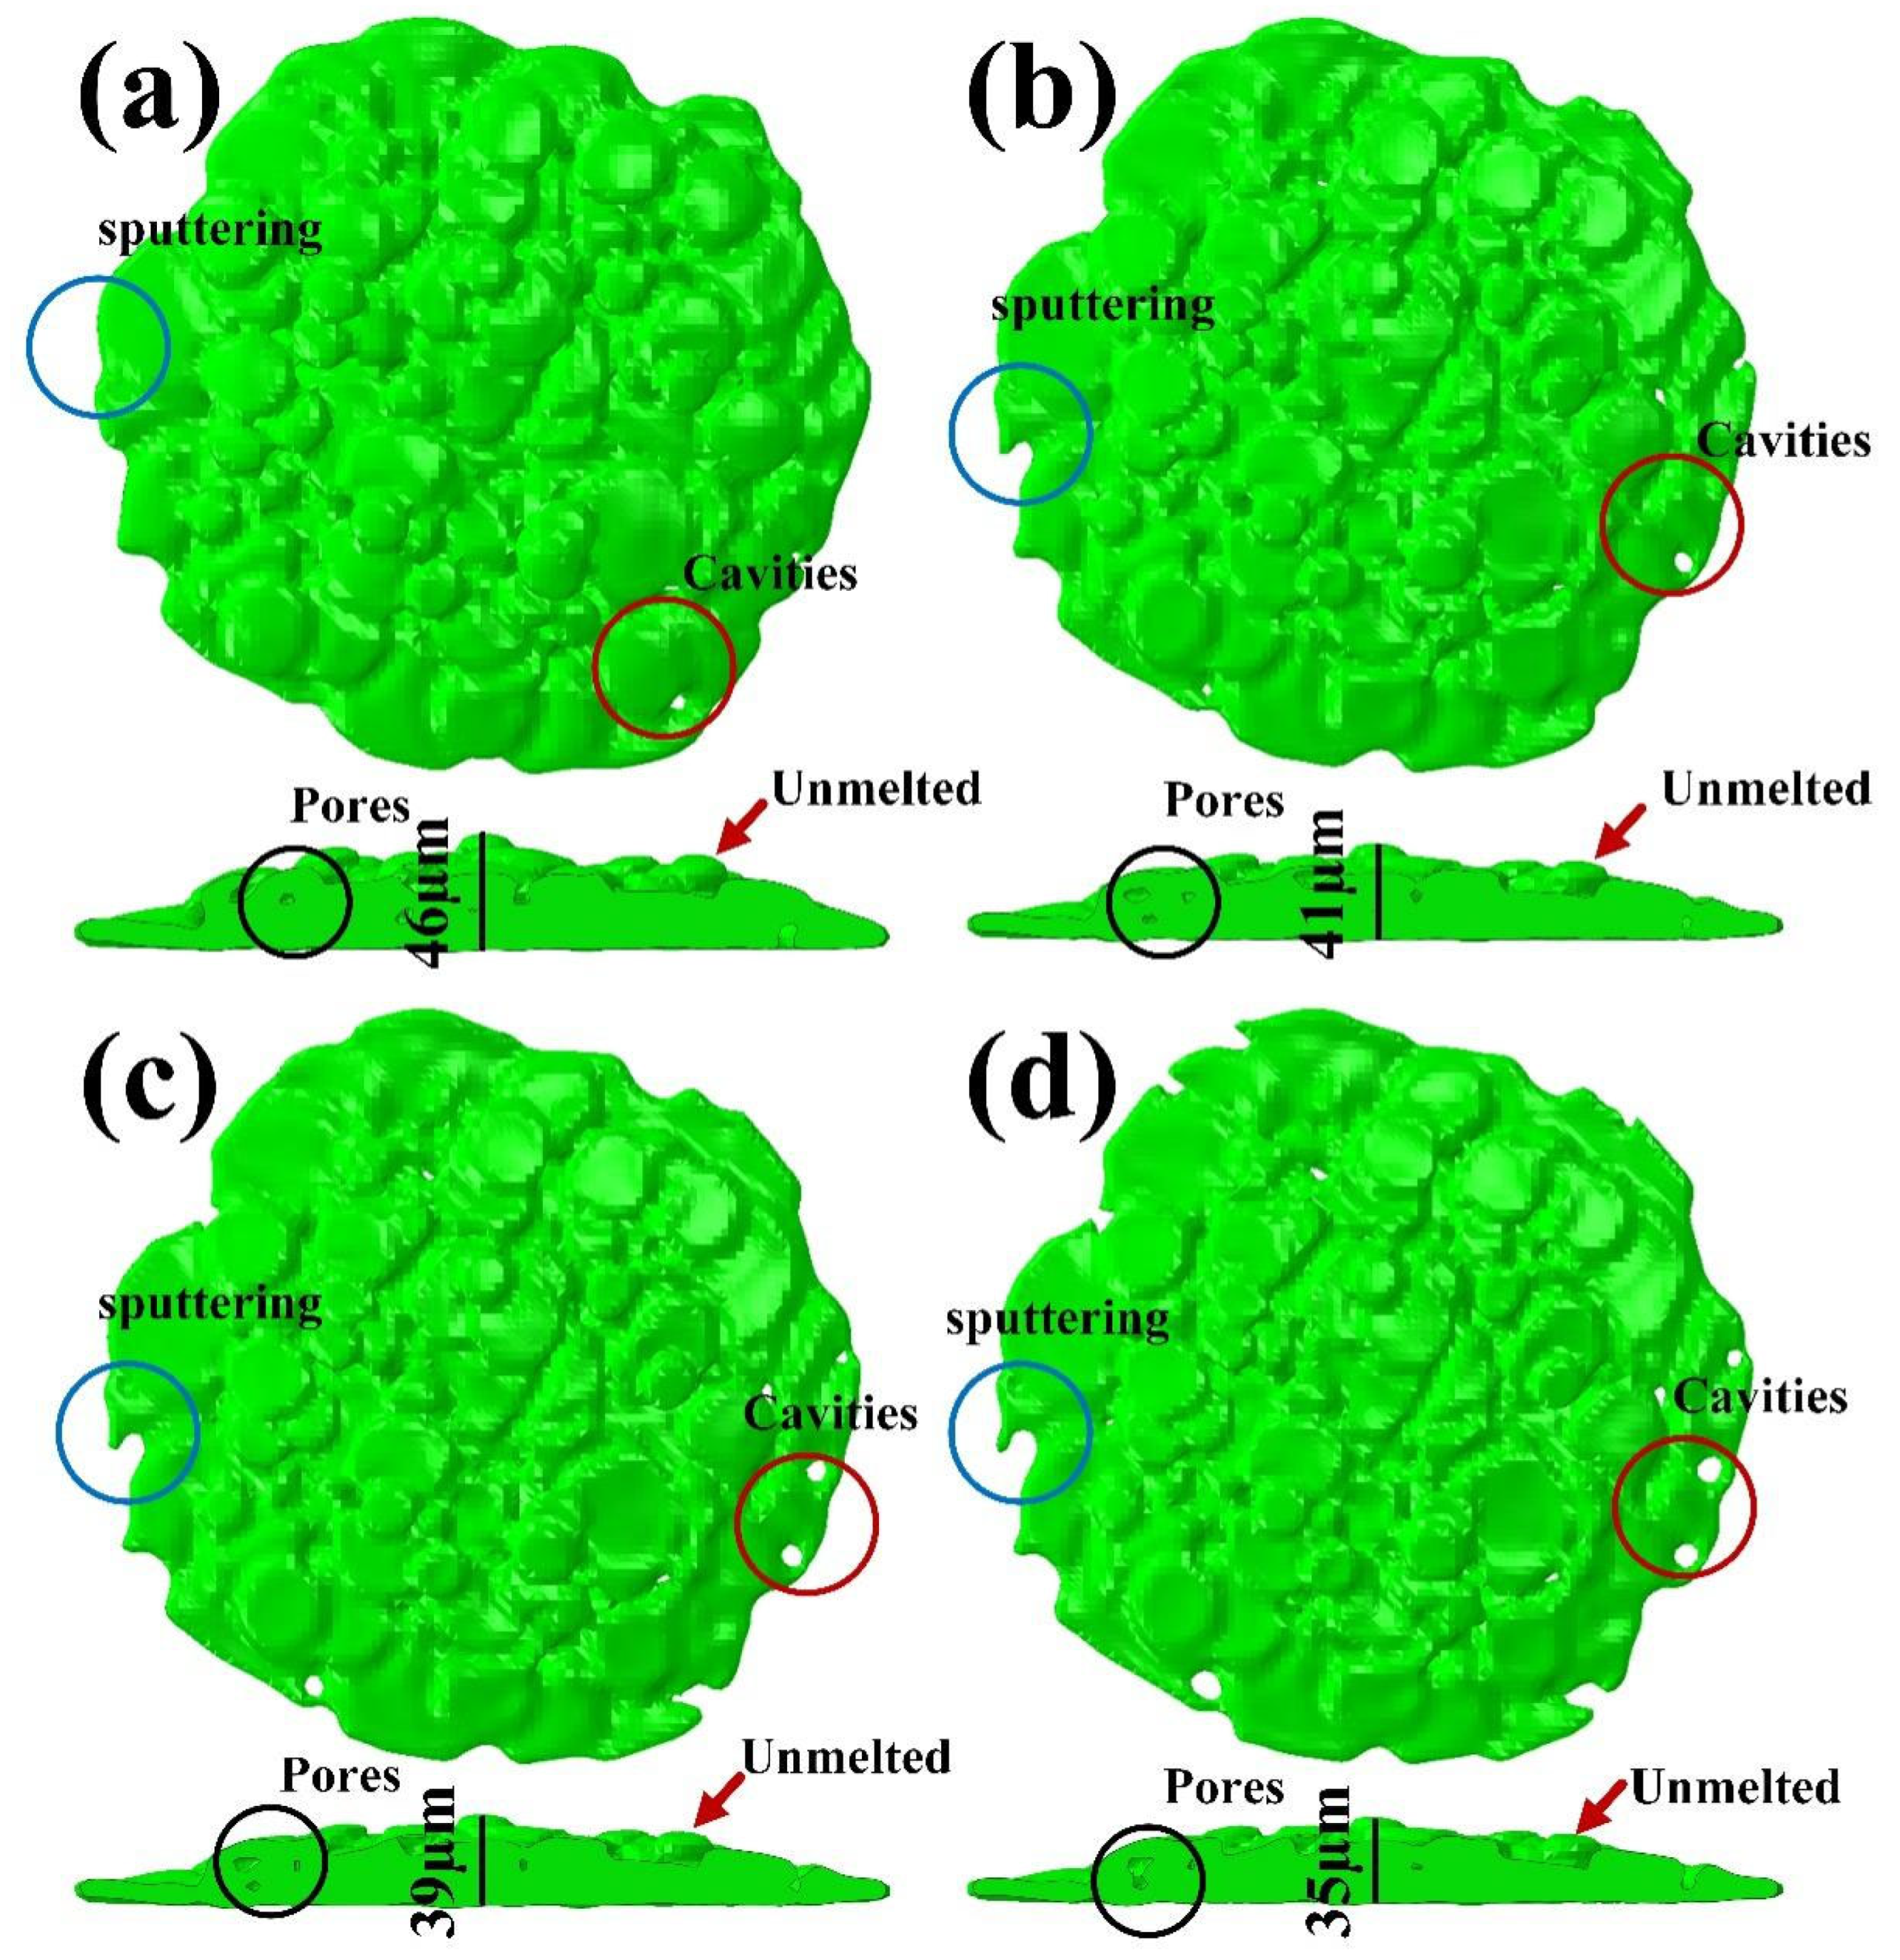
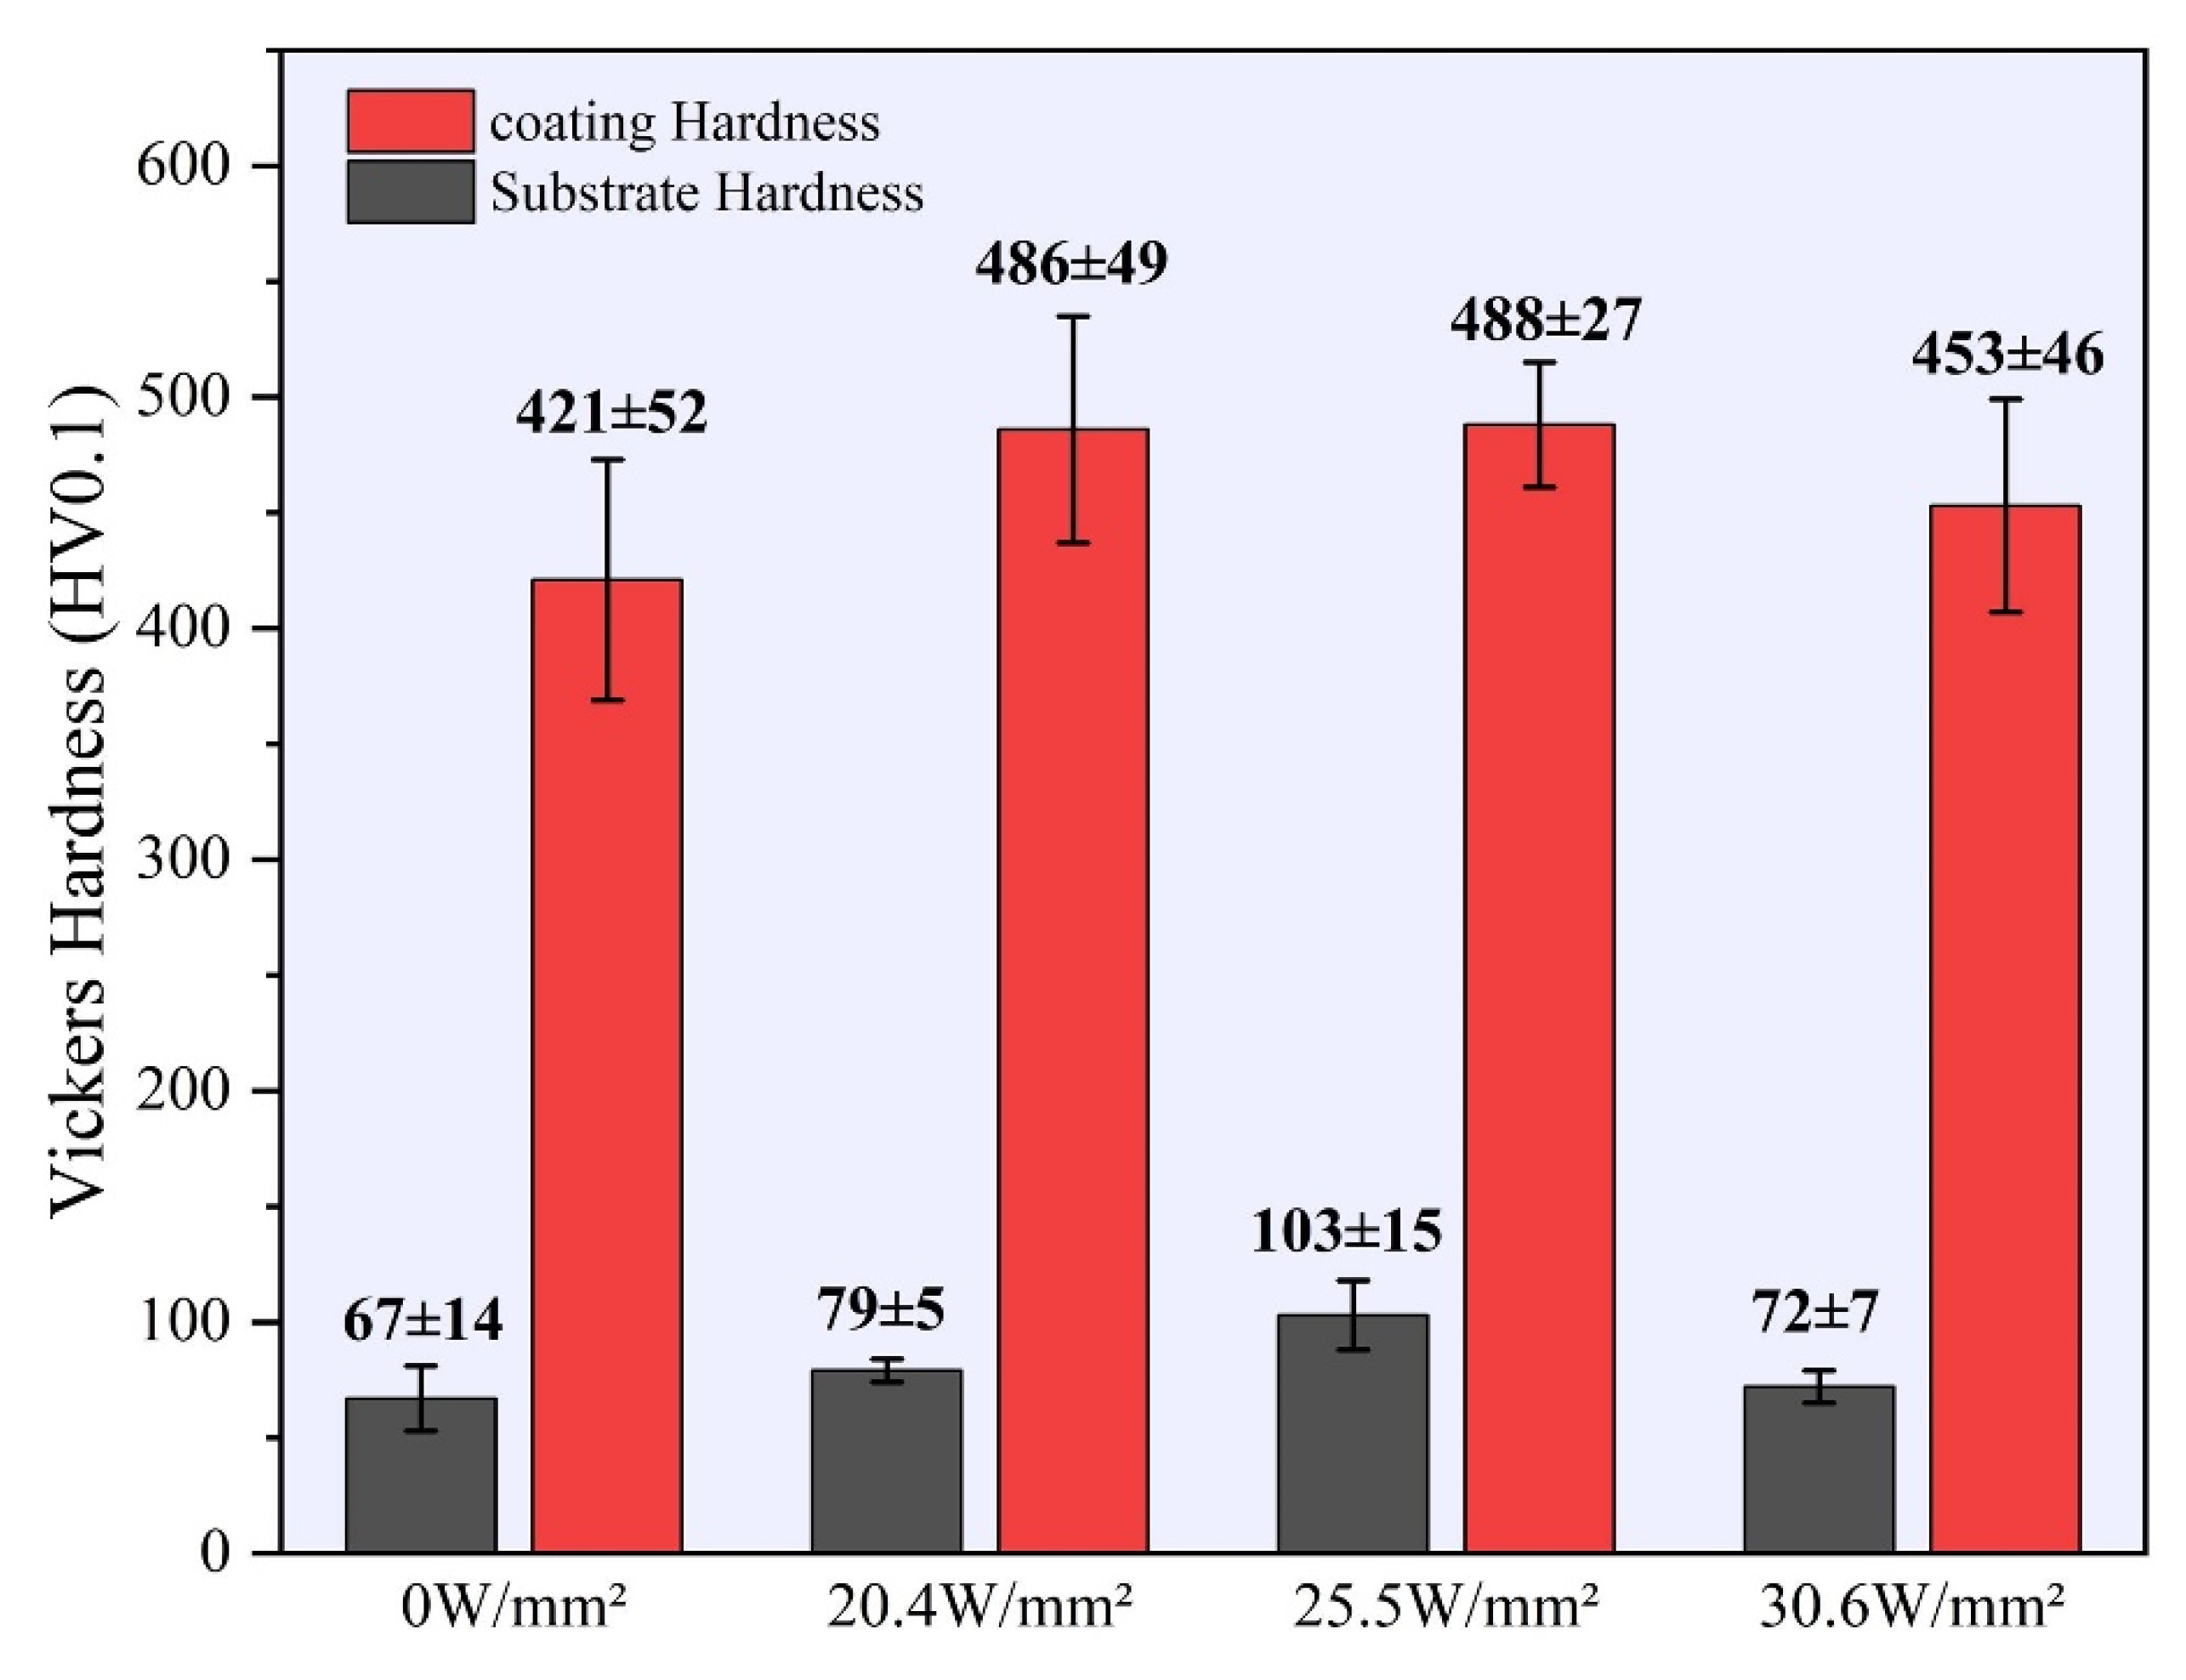
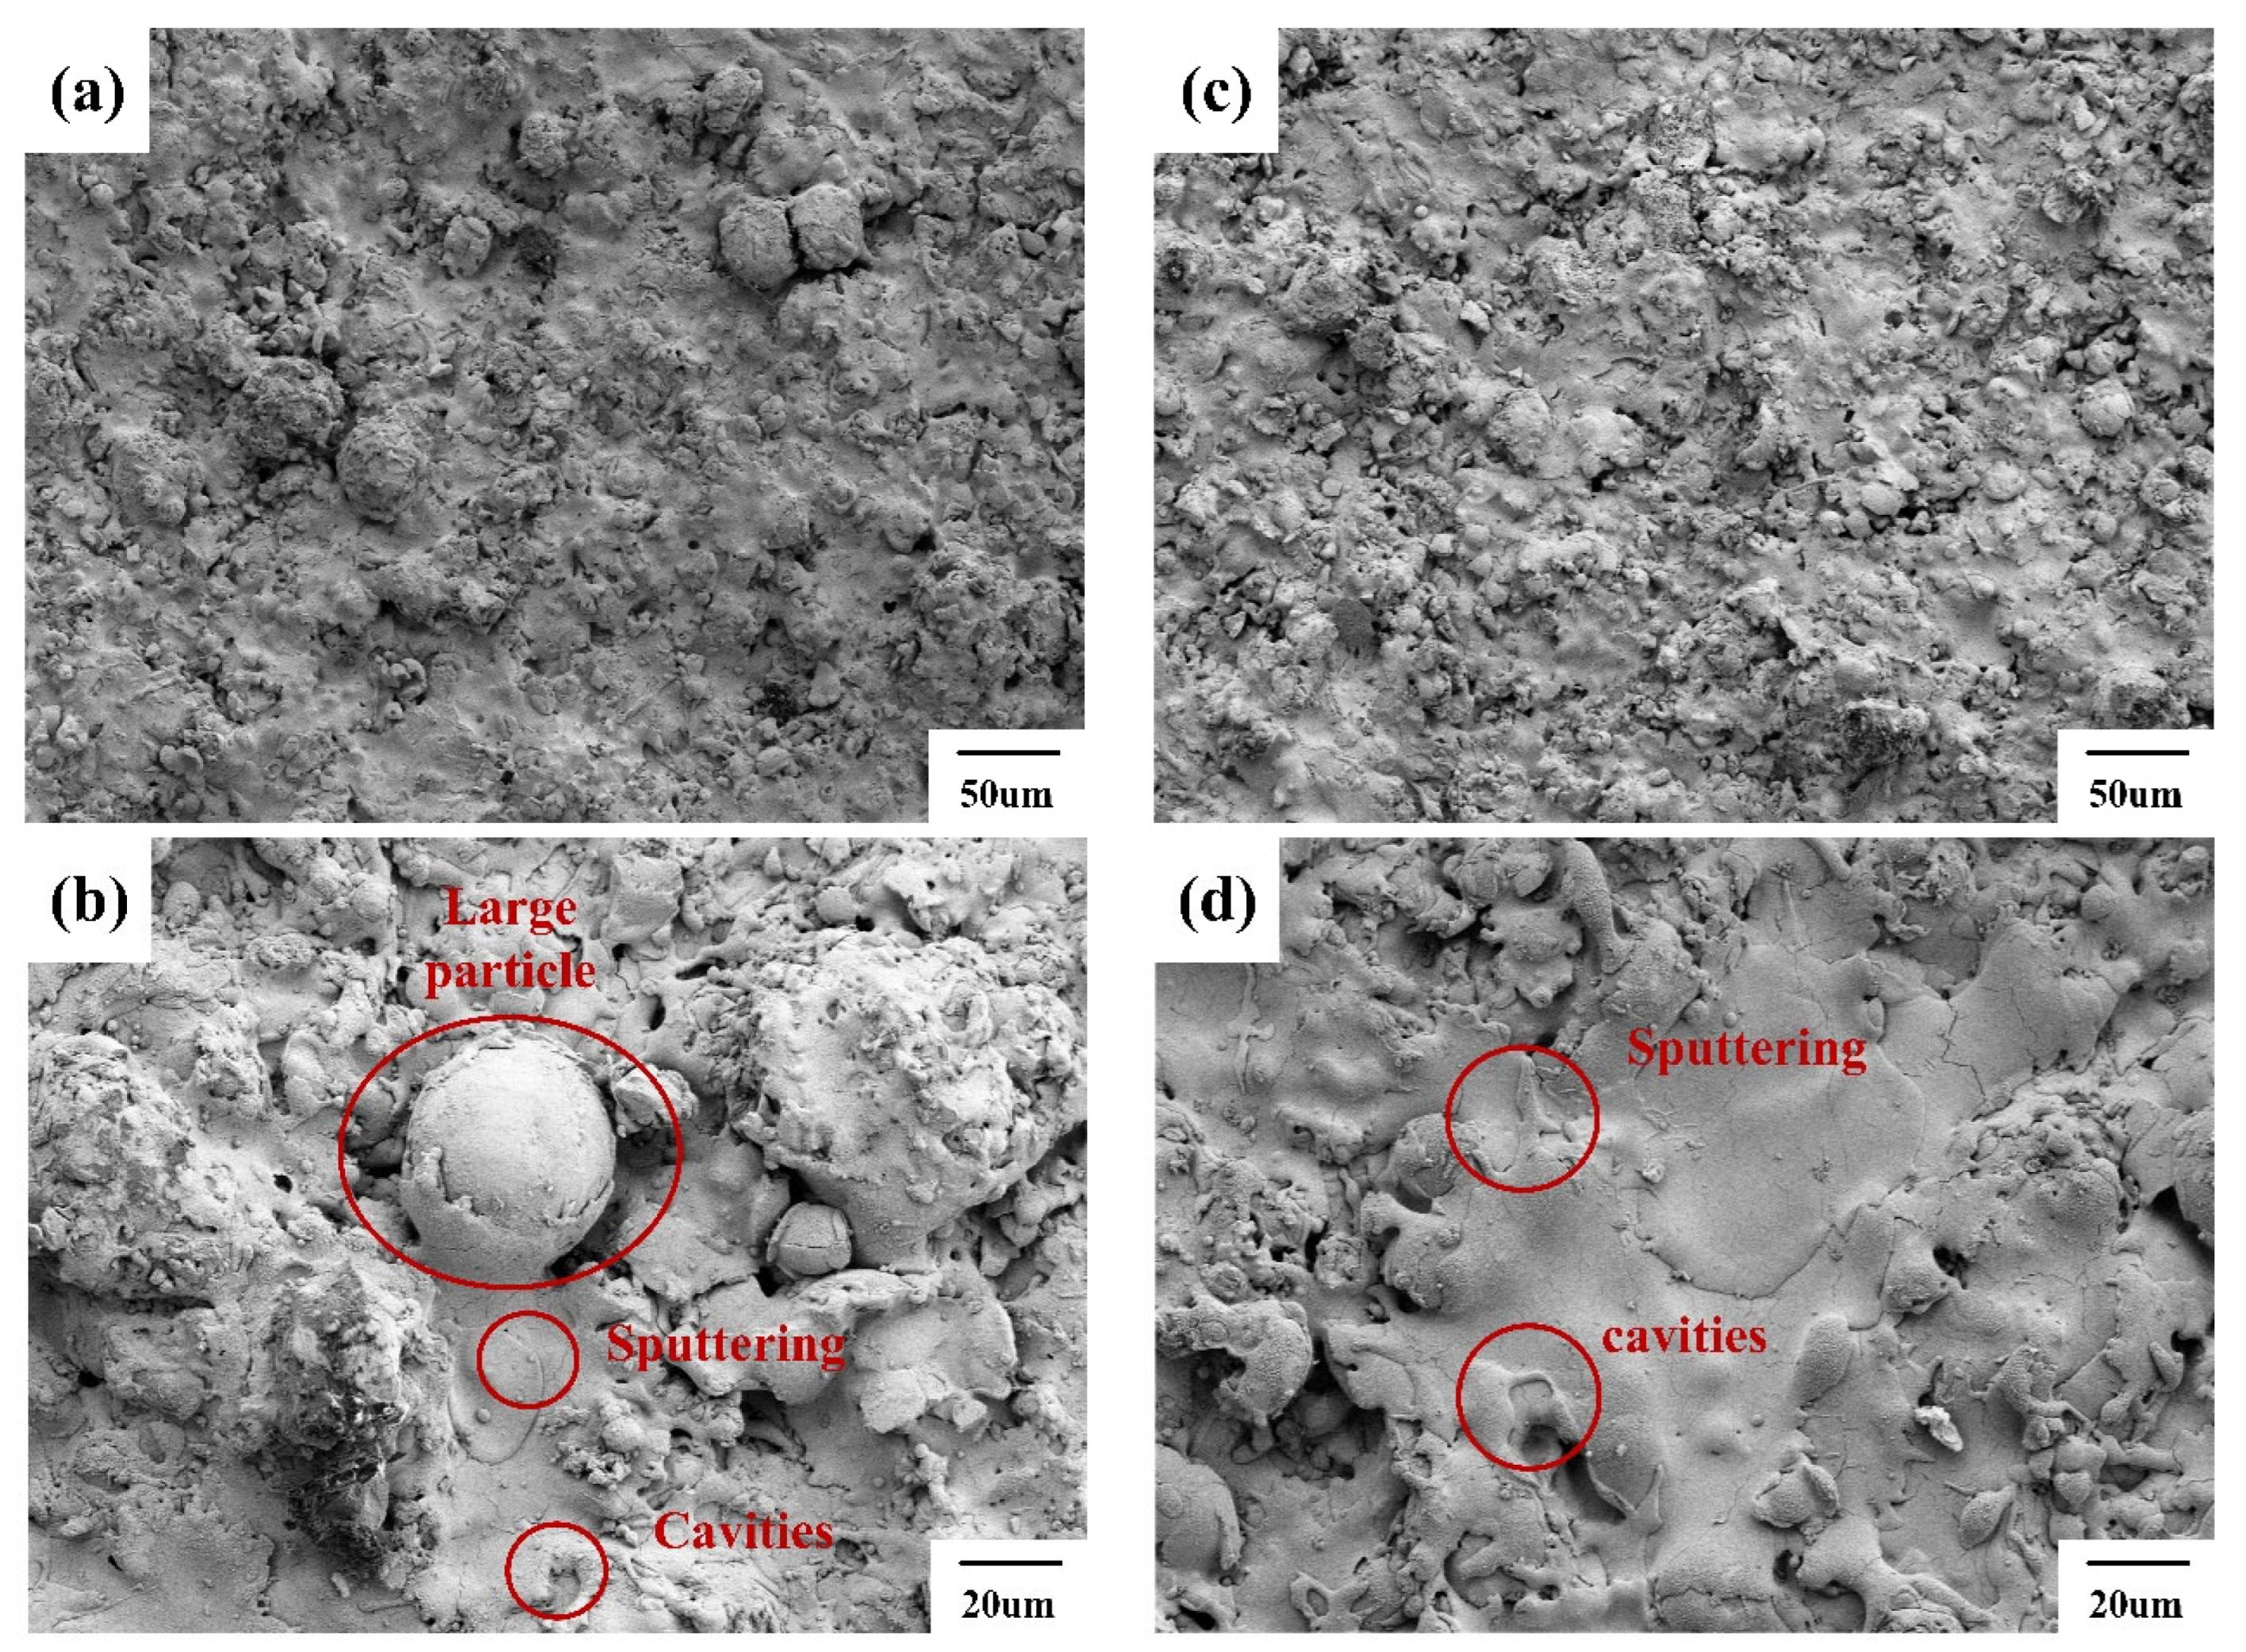
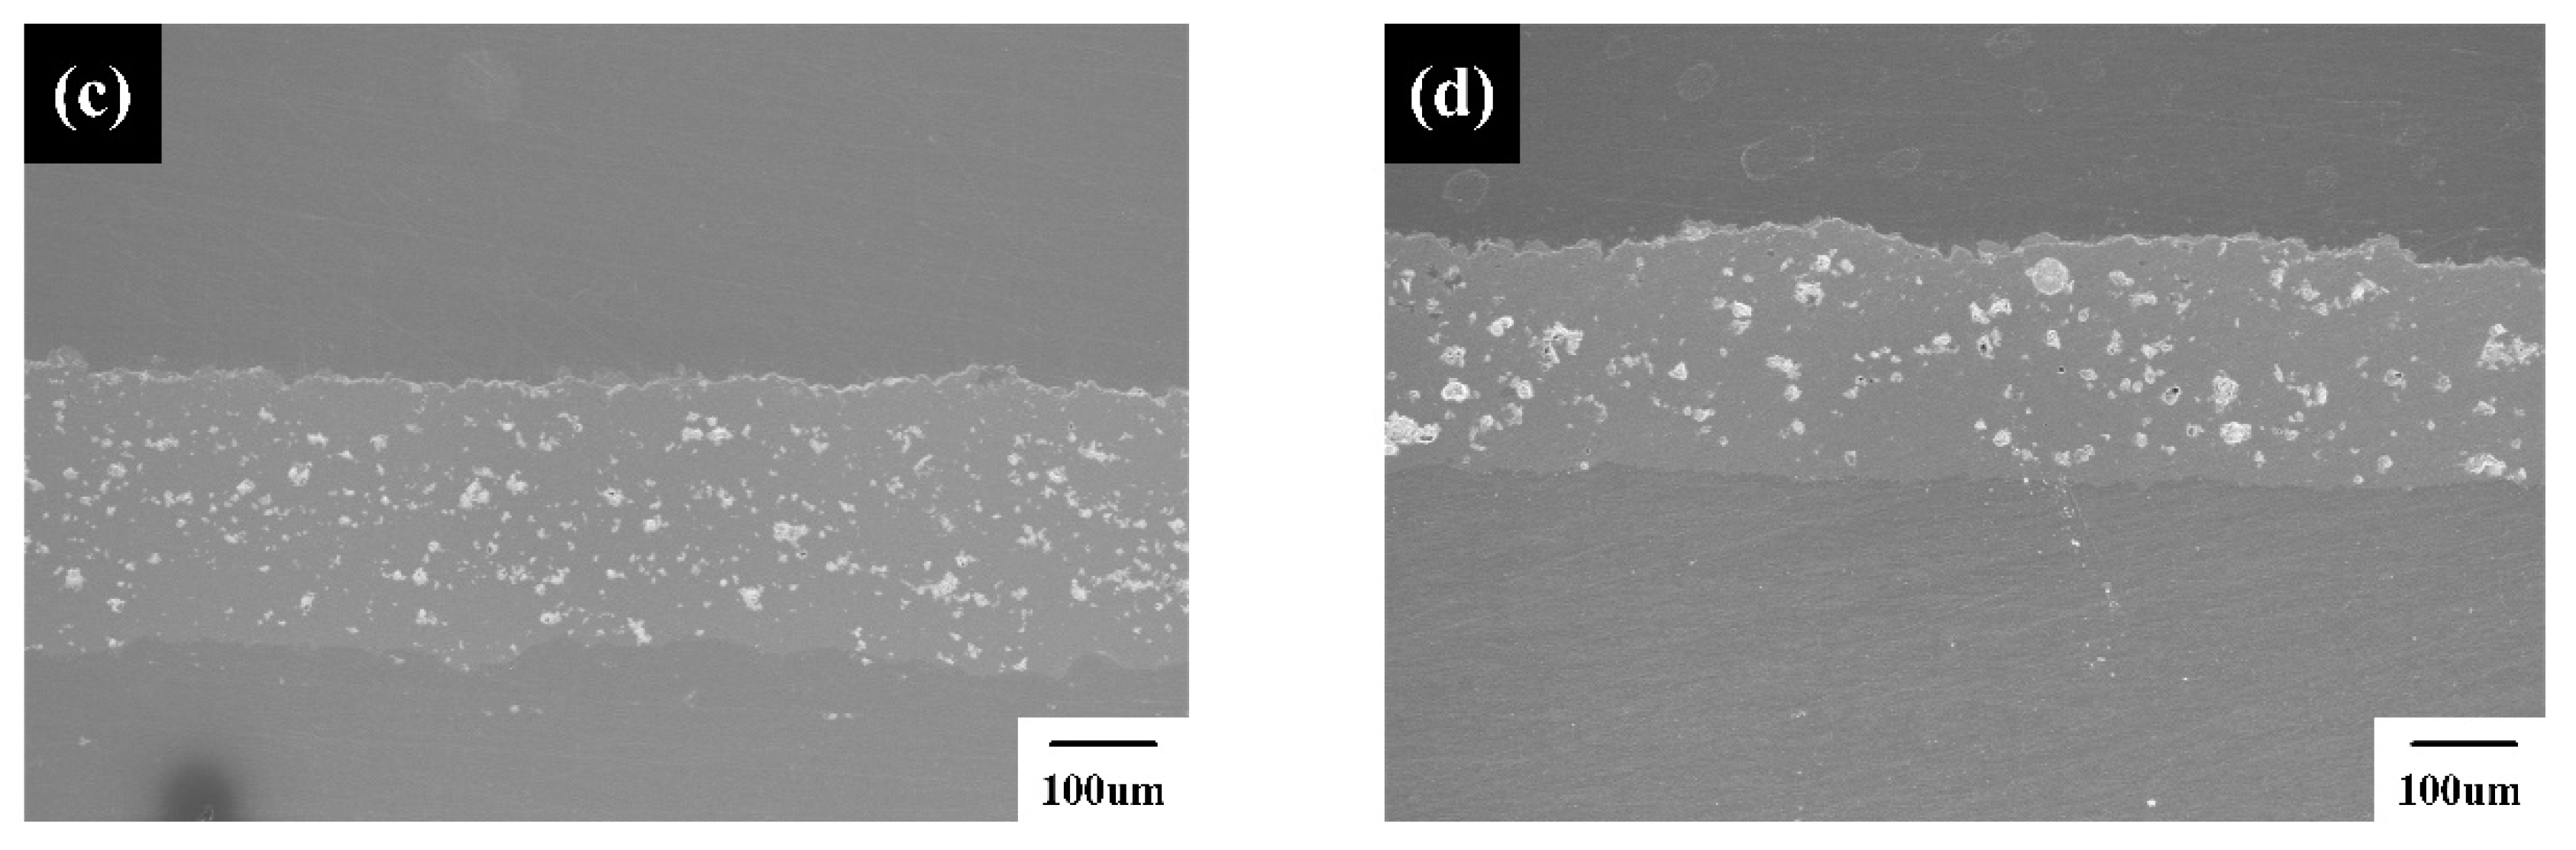
4. Experimental Results and Discussion

Figure 10 shows that laser treatment can effectively increase the hardness of the coating, with the hardness increasing as the laser power density increases, reaching a maximum of 488 HV0.1. However, at a power density of 30.6 W/mm2, the coating hardness decreases to 453 HV0.1, primarily due to excessive laser exposure, causing the coating to overheat. This results in a reduced bonding strength at the interface between the coating and substrate due to differences in thermal expansion coefficients, leading to a decreased load-bearing capacity during macro hardness testing. Laser-assisted plasma spraying has a significant effect on improving the performance of Y2O3 coatings and also increases the hardness of the substrate to a certain extent.
Through analysis of the surface morphology of the coating, it can be seen that the sputtering shape of the particles is that of a disc shape, finger shape, and fragment shape, and there are obvious pores between the particles. Some unmelted and semi-melted particles were wrapped in completely melted flowing particles, a situation that was basically the same as in the simulation. As shown in Figure 11a, the PS-coating surface contained a large number of semi-molten and unmelted Y2O3 particles. There were more protrusions of small particles, and the particles did not combine well with each other, resulting in the formation of many larger pores and cracks. As seen in Figure 11c, the LAPS coating’s overall surface was smoother and denser than that of the PS coating, and there were no semi-melted and unmelted particles with larger diameters. As the laser power density increases, the thermal gradient reduces the interface cooling rate, which decreases the formation of interface pores and increases the plastic flow of Y2O3, thereby enhancing particle fusion. This causes the simple mechanical bonding between coating particles to gradually evolve into metallurgical bonding. From the local particle morphology in Figure 11b, it can be seen that the large particles present on the surface of the PS coating are the whole single particles that have not melted, and the sputtering shape exhibits a disc shape. In Figure 11d, there are no single unmelted particles, and the sputtering shape gradually evolves from a disc shape to a finger shape, with the particles being more flattened in their deposition, and with tight inter-particle bonding. Cavities due to the uneven flow of particles were observed on all surfaces of the coatings, as is consistent with the defects produced by the surface morphology of the coatings in the simulations.
The cross-sectional morphology of the coating is presented in Figure 12. Irregular pores with varying dimensions were observed within the coating, primarily attributed to the spraying process and impurity incorporation. Laser power density significantly influenced both the deposition thickness and porosity of the coating, with corresponding statistical analysis data summarized in Table 3. Without laser loading, the coating has the highest porosity, and defects cause an increase in coating thickness. As the laser power density increases, the coating and substrate are further heated. The reduction in semi-melted and unmelted particles, along with a decrease in temperature gradients, leads to a significant reduction in porosity and deposition thickness within the coating, with the size of irregular pores also notably decreasing. However, at the maximum laser power density of 30.6 W/mm2, the porosity and maximum pore size of the coating increase. This phenomenon is principally ascribed to excessive melting induced by high-energy laser irradiation, which subsequently trapped air and gases produced within the solidifying coating during the cooling process, forming pore defects, as illustrated in Figure 12d.

5. Conclusions

The effect of different power densities of lasers on the deposition mechanism of coatings was studied by simulating the impact of Y2O3 single particles and multi-particles on an Al6061 substrate under laser assistance. Under laser loading, the surface temperature of the particles increases significantly, with a gradient decreasing distribution from the outer surface to the central core region. The particle surface melts, but the central core remains in a solid state. The temperature increase is more pronounced for particles with smaller diameters. The laser has the greatest effect on the temperature of the center of the substrate, with a gradient decreasing distribution from the inside to the outside. After particle deposition, the maximum stress occurs at the edge of the pits, and the maximum strain occurs on the sidewall of the pits. Axial-stress changes indicate that the maximum compressive stress occurs in the bottom area of the pits, while the maximum tensile stress appears at the edge of the pits. As the laser power density increases, the coating develops more cavities due to thermal stress and cooling-shrinkage stress, and the sputtering at the coating edge evolves from a disc shape to a finger shape, consistent with the experimental results. The primary source of residual tensile stress in coatings stems from thermal stress caused by temperature gradients and mismatched thermal expansion coefficients, and laser treatment can significantly suppress the generation of tensile stress. The increase in temperature causes the particles to melt further. The reduction in pore defects within the coating makes it denser, increases its hardness, and reduces its thickness and porosity, but excessive laser power density will reduce the coating performance.

Author Contributions

Conceptualization, B.F., H.Z., and X.Z.; data curation, H.Z.; formal analysis, B.F. and H.Z.; funding acquisition, B.F. and H.Y.; investigation, H.Z. and C.S.; project administration, B.F. and X.Z.; supervision, B.F.; writing—original draft, H.Z.; writing—review and editing, B.F. All authors have read and agreed to the published version of the manuscript.

Funding

This research was supported by Zhejiang Provincial Natural Science Foundation of China under Grant (No. LQN25E010012).

Institutional Review Board Statement

Not applicable.

Informed Consent Statement

Not applicable.

Data Availability Statement

Data are contained within the article.

Conflicts of Interest

The authors declare no conflicts of interest.

References

  1. Nunomura, S.; Tsutsumi, T.; Takada, N.; Fukasawa, M.; Hori, M. Radical, ion, and photon’s effects on defect generation at SiO2/Si interface during plasma etching. Appl. Surf. Sci. 2024, 672, 160764. [Google Scholar] [CrossRef]
  2. Choi, J.H.; Yoon, J.; Jung, Y.; Min, K.W.; Im, W.B.; Kim, H.J. Analysis of plasma etching resistance for commercial quartz glasses used in semiconductor apparatus in fluorocarbon plasma. Mater. Chem. Phys. 2021, 272, 125015. [Google Scholar] [CrossRef]
  3. Kreethi, R.; Hwang, Y.J.; Lee, H.Y.; Park, J.H.; Lee, K.A. Stability and plasma etching behavior of yttrium-based coatings by air plasma spray process. Surf. Coat. Technol. 2023, 454, 129182. [Google Scholar] [CrossRef]
  4. Cao, Y.C.; Zhao, L.; Luo, J.; Wang, K.; Zhang, B.P.; Yokota, H.; Yoshiyasu, I.; Li, J.F. Plasma etching behavior of Y2O3 ceramics: Comparative study with Al2O3. Appl. Surf. Sci. 2016, 366, 304–309. [Google Scholar] [CrossRef]
  5. Li, Q.; Hu, J.; Xie, J.; Wang, X.; Yu, C.; Jiang, S.; Jiang, X.; Li, E.; Deng, L. Influence of High-Enthalpy Atmospheric Plasma Spraying Process Parameters on Microwave Dielectric Properties of Y2O3 Coatings. J. Therm. Spray Technol. 2021, 30, 898–906. [Google Scholar] [CrossRef]
  6. Wang, H.; Zhao, Y.; Li, W.; Xu, S.; Zhong, N.; Liu, Y.; Yin, Z.; Zhang, J. Optimization on the bonding strength and microstructure of atmospheric plasma sprayed Y2O3 coatings by response surface methodology. Ceram. Int. 2024, 50, 20055–20067. [Google Scholar] [CrossRef]
  7. Lee, D.S.; Yun, S.; Han, J.W.; Song, M.; Kim, Y.; Lee, J.; Choi, J.; Chang, S.; Hong, S.; Kim, J. Microstructural evolution and mechanical properties of atmospheric plasma sprayed Y2O3 coating with state of in-flight particle. Ceram. Int. 2021, 47, 3853–3866. [Google Scholar] [CrossRef]
  8. Kim, M.; Choi, E.; Lee, D.; Seo, J.; Back, T.S.; So, J.; Yun, J.Y.; Suh, S.M. The effect of powder particle size on the corrosion behavior of atmospheric plasma spray-Y2O3 coating: Unraveling the corrosion mechanism by fluorine-based plasma. Appl. Surf. Sci. 2022, 606, 154958. [Google Scholar] [CrossRef]
  9. Madhura, B.; Patel, P.R.; Vetrivendan, E.; Rao, C.J.; Ningshen, S. Experimental study and numerical simulation of Y2O3 coatings deposited by plasma spraying at different torch powers. J. Therm. Spray Technol. 2023, 32, 2661–2682. [Google Scholar] [CrossRef]
  10. Sun, K.; Zhong, W.; Qiu, S.; Cai, W.; Xie, X.; Wang, H.; Zhang, S.; Li, W. Study on the microstructure, corrosion resistance and dielectric properties of atmospheric plasma-sprayed Y2O3 ceramic coatings. Coatings 2024, 14, 377. [Google Scholar] [CrossRef]
  11. Dong, T.; Liu, L.; Li, G.; Wang, R.; Yuan, J.; Feng, Y. Effect of induction remelting on microstructure and wear resistance of plasma sprayed NiCrBSiNb coatings. Surf. Coat. Technol. 2019, 364, 347–357. [Google Scholar] [CrossRef]
  12. Garcia-Alonso, D.; Serres, N.; Demian, C.; Costil, S.; Langlade, C.; Coddet, C. Pre-/during-/post-laser processes to enhance the adhesion and mechanical properties of thermal-sprayed coatings with a reduced environmental impact. J. Therm. Spray Technol. 2011, 20, 719–735. [Google Scholar] [CrossRef]
  13. Li, S.Y.; He, P.F.; Cheng, Y.H.; Liang, X.B.; Sun, C. Research Status of Ceramic-based Coatings Prepared by Laser-hybrid Thermal Spraying Technology. Surf. Technol. 2023, 52, 23–38. [Google Scholar]
  14. Schopphoven, T.; Gasser, A.; Wissenbach, K.; Poprawe, R. Investigations on ultra-high-speed laser material deposition as alternative for hard chrome plating and thermal spraying. J. Laser Appl. 2016, 28, 022501. [Google Scholar] [CrossRef]
  15. Zhao, X.; Xie, T.; Zhang, P.; Yao, Z.; Zhang, Q.; Deng, J.; Sui, Y.; Yao, J. The Effect of In Situ Laser-Assisted Plasma Spraying on the Plasma Etching Resistance of Yttrium Oxide Coating. Coatings 2024, 14, 1427. [Google Scholar] [CrossRef]
  16. Gao, Y.; Lu, P.; Bai, S.; Qin, B.; Zhang, D. Influence of laser power on microstructure and properties of Al-Si+ Y2O3 coating. Coatings 2023, 13, 1289. [Google Scholar] [CrossRef]
  17. Jia, D.; Shi, W.; Zhang, H.; Wu, T.; Diao, Y.; Li, K.; Lu, C. Effects of Y2O3 content on wear resistance and corrosion resistance of 316L/TiC coating fabricated by laser cladding. Coatings 2023, 13, 1348. [Google Scholar] [CrossRef]
  18. Liu, X.Y.; Sui, Y.; Li, J.B.; Yue, J.Y.; Sun, X.H.; Yang, L.F.; Liu, C.S. Dimension effect of Y2O3 nanomaterial on microstructure and tensile properties of laser metal deposited stainless steel coatings. Surf. Coat. Technol. 2021, 419, 127259. [Google Scholar] [CrossRef]
  19. Gu, Y.; Pan, J.; Lu, H.; Xiao, J.; Ma, C.; Yu, N. Numerical and Experimental Study on the Deposition Mechanisms of Plasma Spraying on 7075 Aluminum Alloy. J. Mater. Eng. Perform. 2024, 33, 1071–1080. [Google Scholar] [CrossRef]
  20. Lin, E.; Chen, Q.; Ozdemir, O.C.; Champagne, V.K.; Müftü, S. Effects of interface bonding on the residual stresses in cold-sprayed Al-6061: A numerical investigation. J. Therm. Spray Technol. 2019, 28, 472–483. [Google Scholar] [CrossRef]
  21. Vincent, S.; Le Bot, C.; Sarret, F.; Meillot, E.; Caltagirone, J.P.; Bianchi, L. Penalty and Eulerian-Lagrangian VOF methods for impact and solidification of metal droplets plasma spray process. Comput. Fluids 2015, 113, 32–41. [Google Scholar] [CrossRef]
  22. Yang, X.; Meng, T.; Su, Y.; Chai, X.; Guo, Z.; Ma, T.; Yin, S.; Li, W. Particle deformation and coating deposition behavior in cold spray additive manufactured aluminum deposit on copper substrate by simulation and experiment. J. Mater. Res. Technol. 2024, 30, 2879–2890. [Google Scholar] [CrossRef]
  23. Wang, Q.; Luo, X.; Tsutsumi, S.; Sasaki, T.; Li, C.; Ma, N. Measurement and analysis of cold spray residual stress using arbitrary Lagrangian-Eulerian method. Addit. Manuf. 2020, 35, 101296. [Google Scholar]
  24. Zhang, M.; Chen, L.; Shan, L.; Li, H. Analysis of semi-molten hollow particle spreading and deformation in plasma spraying. J. Phys. D Appl. Phys. 2024, 57, 235201. [Google Scholar] [CrossRef]
  25. Subedi, K.K.; Kong, S.C. Particle-based approach for modeling phase change and drop/wall impact at thermal spray conditions. Int. J. Multiph. Flow 2023, 165, 104472. [Google Scholar] [CrossRef]
  26. Xie, J.; Nélias, D.; Walter-Le Berre, H.; Ogawa, K.; Ichikawa, Y. Simulation of the cold spray particle deposition process. J. Tribol. 2015, 137, 041101. [Google Scholar] [CrossRef]
  27. Zhu, Z.; Kamnis, S.; Gu, S. Numerical study of molten and semi-molten ceramic impingement by using coupled Eulerian and Lagrangian method. Acta Mater. 2015, 90, 77–87. [Google Scholar] [CrossRef]
  28. Song, X.; Ng, K.L.; Chea, J.M.K.; Sun, W.; Tan, A.W.Y.; Zhai, W.; Li, F.; Marinescu, I.; Liu, E. Coupled Eulerian-Lagrangian (CEL) simulation of multiple particle impact during Metal Cold Spray process for coating porosity prediction. Surf. Coat. Technol. 2020, 385, 125433. [Google Scholar] [CrossRef]
  29. Tang, W.; Zhang, J.; Li, Y.; Yu, B.; Zhao, J. Numerical simulation of the cold spray deposition of copper particles on polyether ether ketone (PEEK) substrate. J. Therm. Spray Technol. 2021, 30, 1792–1809. [Google Scholar] [CrossRef]
  30. Jang, T.J.; Kim, J.B.; Shin, H. Identification of plastic constitutive Johnson-Cook model parameters by optimization-based inverse method. J. Comput. Des. Eng. 2021, 8, 1082–1097. [Google Scholar] [CrossRef]
  31. Xiao, J.; Pan, J.; Gu, Y.; Lu, H.; Yu, N.; Lv, M.; Chen, X. Study on construction mechanism of ceramic-metal thermal barrier coating system by plasma spraying. Metall. Mater. Trans. A 2023, 54, 2827–2840. [Google Scholar] [CrossRef]
  32. Wang, G.W.; Ding, Y.; Guan, Y.C.; Wang, Y.; Yang, L.J. Model heat source using actual distribution of laser power density for simulation of laser processing. J. Cent. South Univ. 2022, 29, 3277–3293. [Google Scholar] [CrossRef]
  33. Li, B.; Du, J.; Sun, Y.; Zhang, S.; Zhang, Q. On the importance of heat source model determination for numerical modeling of selective laser melting of IN625. Opt. Laser Technol. 2023, 158, 108806. [Google Scholar] [CrossRef]
  34. Yan, S.; Zhang, A.; Liang, S.; Wang, T. Measurement of laser light absorptivity of commonly used metals in laser additive manufacturing technique. Aeronaut. Manuf. Technol. 2017, 536, 97–100. [Google Scholar]
  35. Wu, Y.; Du, J.; Choy, K.L.; Hench, L.L. Laser densification of alumina powder beds generated using aerosol assisted spray deposition. J. Eur. Ceram. Soc. 2007, 27, 4727–4735. [Google Scholar] [CrossRef]
Figure 1. Particle size probability distribution and modeling schematic diagram of multi-particles.
Coatings 15 00904 g001
Figure 2. Computational model and mesh refinement using CEL method.
Coatings 15 00904 g002
Figure 3. Schematic diagram of laser-assisted plasma-spraying (LAPS) system’s structure.
Coatings 15 00904 g003
Figure 4. The effect of laser irradiation on the temperature of single-particles of different diameters: (a) Particle temperature distribution cloud map; (b) Maximum surface temperature of particles at different power densities.
Coatings 15 00904 g004
Figure 5. The distribution of stress field, strain field, and temperature field in the substrate after single-particle deposition at 0 W/mm2 and 20.4 W/mm2 laser power densities: (ac) 0 W/mm2; (df) 20.4 W/mm2.
Coatings 15 00904 g005
Figure 6. Residual stress extraction path.
Coatings 15 00904 g006
Figure 7. Changes in residual stress on the substrate during laser-assisted single-particle deposition at different power densities: (a) Residual stress S33 along path 1; (b) Residual stress S33 along path 2.
Coatings 15 00904 g007
Figure 8. Surface morphology and cross-sectional morphology of multi-particle coatings deposited by laser loading at different power densities: (a) 0 W/mm2; (b) 20.4 W/mm2; (c) 25.5 W/mm2; (d) 30.6 W/mm2.
Coatings 15 00904 g008
Figure 9. The effect of laser-assisted multi-particle deposition with different power densities on the substrate: (a) Residual stress distribution cloud map; (b) Residual stress S33; (c) Equivalent plastic strain; (d) Temperature.
Coatings 15 00904 g009
Figure 10. Hardness values of coatings and substrates under laser-assisted spraying with different power densities.
Coatings 15 00904 g010
Figure 11. The overall surface morphology and local particle morphology of the coating: (a,b) PS coating; (c,d) LAPS coating.
Coatings 15 00904 g011
Figure 12. The cross-section morphology of the coating under laser-assisted spraying with different power densities: (a) 0 W/mm2; (b) 20.4 W/mm2; (c) 25.5 W/mm2; (d) 30.6 W/mm2.
Coatings 15 00904 g012aCoatings 15 00904 g012b
Table 1. Relevant material properties of substrate and particles.
PropertyParameter, Symbol (Unit)Al6061Y2O3
GeneralDensity, ρ ( kg / m 3 )27005010
Specific heat,  C p (J/kg•K)1009656
Thermal conductivity, (W/m•K)1552.32
Melting temperature, T m (K)9252683
Inelastic heat fraction, β0.90.9
Coefficient of thermal expansion, (1/K)22.3 × 10−68 × 10−6
ElasticElastic modulus, (GPa)69.11290
Poisson’s ratio0.3310.3
PlasticStatic yield strength, A (MPa)270401
Hardening modulus, B (MPa)154.3288
Strain rate coefficient, C0.0020.07
Hardening   exponent ,   n 0.2390.2
Thermal   softening   exponent ,   m 1.420.09
Reference   strain   rate ,   ε ˙ 0   (1/s)11
Reference   temperature ,   T r (K)298298
Table 2. Parameters of laser-assisted plasma-spraying process.
Current
(A)
Voltage (V)Primary Gas, Ar
(SLPM)
Primary Gas, H2
(SLPM)
Spraying Distance
(mm)
Powder Feed Rate
(g/min)
Gun Speed
(mm/min)
7005845310015100
Table 3. Effect of different laser power densities on porosity and pore average size of Y2O3 coatings.
0 W/mm220.4 W/mm225.5 W/mm230.6 W/mm2
Laser power (W)0400500600
Average coating thickness (µm)355 ± 22301 ± 18259 ± 10229 ± 14
Porosity7.48 ± 0.51%4.21 ± 0.41%3.94 ± 0.37%5.29 ± 0.36%
Maximum pore size (µm)68433258
Disclaimer/Publisher’s Note: The statements, opinions and data contained in all publications are solely those of the individual author(s) and contributor(s) and not of MDPI and/or the editor(s). MDPI and/or the editor(s) disclaim responsibility for any injury to people or property resulting from any ideas, methods, instructions or products referred to in the content.

