Article

Performance Optimization of Stacked Weld in Hydrogen Production Reactor Based on Response Surface Methodology–Genetic Algorithm

1
Innovation Center of Major Machine Manufacturing in Liaoning, Dalian University of Technology, Dalian 116024, China
2
School of Mechanical Engineering, Dalian Jiaotong University, Dalian 116028, China
*
Author to whom correspondence should be addressed.
Coatings 2025, 15(8), 889; https://doi.org/10.3390/coatings15080889 (registering DOI)
Submission received: 17 June 2025 / Revised: 20 July 2025 / Accepted: 23 July 2025 / Published: 31 July 2025

Abstract

To address the issues of hydrogen embrittlement, creep, and fatigue that commonly occur in the welds of hydrogen production reactor operating under hydrogen exposure, high temperature and high pressure, this study proposes adding Si and Mo as reinforcing elements to the welding materials to enhance weld performance. Given the varying performance requirements of different weld layers in the stacked weld, a gradient performance optimization method for the stacked weld of hydrogen production reactors based on the response surface methodology (RSM)–genetic algorithm (GA) is proposed. Using tensile strength, the hydrogen embrittlement sensitivity index, fatigue strain strength, creep rate and weld performance evaluation indices, a high-precision regression model for Si and Mo contents and weld performance indices was established through RSM and analysis of variance (ANOVA). A multi-objective optimization mathematical model for gradient improvement of the stacked weld was also established. This model was solved using a GA to obtain the optimal element content combination added to the welding wire and the optimal weld thickness for each weld layer. Finally, submerged arc welding experiments of the stacked weld were conducted according to the optimization results. The results show that the tensile strength of the base layer, filling layer and cover layer of the stacked weld increased by 5.60%, 6.16% and 4.53%, respectively. Hydrogen embrittlement resistance increased by 70.56%, 52.40% and 45.16%, respectively. The fatigue and creep resistance were also improved. The experimental results validate the feasibility and accuracy of the proposed optimization method.

1. Introduction

As the global energy demand continues to grow and the climate crisis intensifies, the development of low-carbon and clean energy sources has garnered worldwide attention. Hydrogen has emerged as a promising alternative energy carrier that is essential for achieving climate neutrality [1,2]. The hydrogen production reactor plays a crucial role in this process. However, the welds represent the weakest structural links, and the performance of the weld material is directly related to the safety and reliability of the reactor [3]. Under the extreme operating conditions of high temperature, high pressure and hydrogen exposure [4], stacked welds must exhibit high strength, resistance to hydrogen embrittlement, fatigue resistance and creep resistance. Conventional welds often fail to meet the demanding performance requirements. This study proposes the addition of Si and Mo as composite reinforcing elements to improve the weld’s resistance to hydrogen embrittlement, fatigue and creep. The stacked weld is divided into multiple layers based on the performance requirements of different weld zones to optimize overall performance. Accordingly, varying the content of composite elements in the welding wire for each weld layer enables tailored mechanical properties across layers, enhancing resistance to specific failure modes. This stratified approach ultimately improves the overall performance of the stacked weld. The key challenge lies in determining the optimal content of composite elements added to the welding wire for each weld layer and the corresponding weld layer thickness to maximize the overall performance of the stacked weld.
Scholars have conducted a lot of research on weld performance optimization. Leng et al. [5] studied the influence of surface roughness and surface residual compressive stress on the hydrogen permeation resistance of hydrogen production reactor materials, and proposed machining parameters to improve the hydrogen permeation resistance of materials. Liu et al. [6] studied the influence of submerged arc welding process parameters on the weld hardness and impact resistance of hydrogen production reactor materials, optimized the welding parameters through orthogonal welding tests and comprehensive balance method, and obtained the optimal welding parameters. Zhang et al. [7] established a multi-grain grinding simulation model to improve the surface processing integrity of 06Cr18Ni11Ti stainless steel welds in hydrogen production reactors, laying the foundation for optimizing grinding process parameters. In order to improve the load-bearing capacity of aluminum alloy, Davoodi et al. [8] prepared a NiP/TiN double-layer coating consisting of an electroless plating intermediate layer and a physical vapor deposition top layer. Lv et al. [9] optimized the alloy system of deposited metal in welding wires. Through response surface analysis, they established a regression equation between alloying elements and the mechanical properties of the deposited metal, ultimately determining the optimal alloy composition for toughness. Shalimov and Votinova [10] proposed a method for optimizing the elemental composition of welding rod coatings based on simulations of the metal–slag–gas interaction process. Jindal et al. [11] applied constrained mixture design and extreme vertex design methods to develop a quantitative relationship between flux components and weld chemistry, achieving an optimal weld metal composition by adjusting the flux. Adeyeye and Oyawale [12] introduced a novel method for optimizing weld metal properties based on flux composition, combining hybrid experimental design with mathematical programming to enhance weld performance. Zhang et al. [13] investigated the effect of the silicon-to-titanium mass ratio on the performance of laser-welded joints. By comparing weld quality across different ratios, they identified the optimal Si-Ti mixing ratio.
Many researchers have investigated the effects of Si and Mo on hydrogen embrittlement, fatigue, creep, strength and other properties of welds and structural metals. Regarding hydrogen embrittlement, Li et al. [14] studied the effect of Si content on the mechanical properties of ferritic/martensitic steel after hydrogen charging. They found that the material’s resistance to hydrogen embrittlement first increased and then decreased with rising Si content, reaching a maximum at 0.7% Si. Martin et al. [15] evaluated the influence of various alloying elements on the hydrogen embrittlement sensitivity of 304 austenitic stainless steel, revealing that increased Si, Mn and Cr contents significantly enhanced the material’s ductility. Nomura and Hasegawa [16] investigated hydrogen embrittlement in several hydrogen-charged commercial austenitic stainless steels and identified a strong correlation between embrittlement susceptibility and nickel content. In terms of fatigue, Chen et al. [17] explored the improvement in low-cycle fatigue behavior of 9Cr-1Mo steel by adding Si. Their results showed that a Si content of 1.2% led to a significantly longer fatigue life compared to 0.38%. Liu et al. [18] examined the effect of Mo on the high-temperature fatigue behavior of ferritic stainless steel and found that both fatigue resistance and fatigue limit were enhanced by Mo. Liu et al. [19] also conducted fatigue–creep tests on 15CrNbTi and 15Cr0.5MoNbTi steels, concluding that 15Cr0.5MoNbTi exhibited superior cyclic deformation resistance and a longer fatigue life. In terms of creep, Lu et al. [20] developed a new silicon-containing austenitic stainless steel and investigated the effect of Si (1.0 wt%–2.0 wt%) on its creep life at 550 °C. The results showed that the creep life increased progressively with higher Si content. Zhu et al. [21] examined the influence of Si on the creep behavior of ERNiMo-2 deposited metal and found that the Si-containing specimens exhibited greater creep elongation. Hirata et al. [22] studied the effect of molybdenum on the creep performance of austenitic stainless steel and reported that Mo reduced the minimum creep rate after solution treatment, while the creep life increased with Mo content. Regarding strength, Zhang et al. [23] investigated the role of silicon in ferritic heat-resistant stainless steel and found that it enhanced both tensile and yield strength. In addition, molybdenum is an essential alloying element in duplex stainless steel flux-cored welding wire, contributing to the improved high-temperature strength of stainless steel [24].
The above scholars used experimental or simulation methods to optimize weld performance in terms of welding parameters, weld surface condition, welding wire ratio, flux ratio, metal powder composition, coating, etc. At the same time, these studies also demonstrate that Si and Mo elements play a positive role in enhancing the hydrogen embrittlement resistance, fatigue resistance, creep resistance and other properties of stainless steel welds. However, no existing study has reported the effects of Si and Mo elements on the performance of 321 stainless steel welds, nor has any study investigated the performance optimization of the stacked weld using a stratified approach. Therefore, this paper adds Si and Mo elements into the welding wire as reinforcing elements to improve weld performance by optimizing the element content.
In this study, Si and Mo were selected as reinforcing elements to enhance the strength, hydrogen embrittlement resistance, fatigue resistance and creep resistance of the stacked weld in a hydrogen production reactor. A gradient performance optimization method for the stacked weld based on response surface methodology (RSM) and a genetic algorithm (GA) was proposed. Using tensile strength, hydrogen embrittlement sensitivity index, fatigue strain strength and creep rate as performance evaluation indices, the response relationships between the content of reinforcing elements and the weld performance indices were analyzed, and corresponding regression equations were established. An exhaustive method was applied to determine the optimal weight coefficients for each evaluation index in different weld layers. A multi-objective optimization mathematical model for gradient improvement of the stacked weld was then developed and solved using a genetic algorithm. Based on the optimization, the content of reinforcing elements added to the welding wire for each weld layer and the weld thickness were determined to achieve optimal overall weld performance. Finally, welding experiments were conducted to verify the accuracy of the optimization results. This study provides a theoretical and process foundation for improving the stability and reliability of hydrogen production reactor welds and offers guidance for the reliable manufacturing of such reactors.

2. Materials and Methods

2.1. Subsection

The hydrogen production reactor is made of 321 stainless steel, and the weld is produced using GWS-347 welding wire. The 321 stainless steel used in this study was produced by Shanxi Taigang Stainless Steel Co., Ltd. (Taiyuan, China), and its chemical composition (Table 1) was obtained from the product test report. GWS-347 welding wire was supplied by Kunshan Jingqun Welding Material Technology Co., Ltd. (Kunshan, China) The chemical composition of the welding wire (Table 2) and the chemical composition of the deposited metal (Table 3) are derived from the product test report.

2.2. Experimental Design

Si and Mo were selected as composite reinforcing elements and added to the welding wire in varying contents. The effects of different content combinations of Si and Mo on the weld’s tensile strength, hydrogen embrittlement sensitivity index, fatigue strain strength and creep rate were investigated. Based on relevant previous studies and preliminary experimental work in this study [25], the content ranges for Mo and Si were determined to be 0.5 wt%–1.5 wt% for Mo and 1.0 wt%–2.0 wt% for Si.
In the experiment, Mo and Si were used as two factors, each with six different levels. The factor level table is shown in Table 4. According to the full factorial design method, a total of 36 element content combinations were designed. The full factorial experimental design table is presented in Table 5.

2.3. Calculation of Mechanical Properties of Weld

JMatPro software Version 7.0 provides reliable predictions of the properties of metallic materials and has been widely used by researchers to estimate the mechanical properties of metals [26,27,28]. In particular, it is effective in predicting fatigue and creep behavior, significantly reducing experimental time and cost. The weld is primarily formed by the re-solidification of the melted welding wire, and its chemical composition is close to that of the welding wire [29,30]. As shown in Table 2 and Table 3, the chemical compositions of the welding wire and the deposited metal are close. In subsequent tests, the position where the weld tensile specimen was pulled apart was the center of the weld, which was far away from the fusion zone, and the degree of dilution of the weld center by the parent material was low. Therefore, in this study, the chemical composition of the welding wire was used to approximate that of the weld. The weld properties under different combinations of Si and Mo contents can be predicted based on the elemental composition of the welding wire.
  • Tensile strength.
Tensile strength reflects the material’s resistance to fracture. A higher tensile strength indicates a greater ultimate load-bearing capacity of the weld, contributing to the overall safety of the hydrogen production reactor.
  • Hydrogen embrittlement sensitivity index.
The hydrogen embrittlement sensitivity index is characterized by tensile strength, and its calculation is shown in Formula (1) [31]. This index reflects the material’s resistance to hydrogen embrittlement; the lower the index, the better the resistance. Since high-temperature hydrogen charging tests are dangerous and difficult to perform, and the primary objective of this study is to verify the proposed optimization method, both the tensile strength and hydrogen embrittlement sensitivity index are evaluated at room temperature to compare the software predictions with experimental results.
T S H E = T S 0 T S H T S 0 × 100 %
where TSHE is the hydrogen embrittlement sensitivity index characterized by tensile strength, TS0 is the original tensile strength of the weld, and TSH is the tensile strength of the weld after hydrogen filling.
  • Fatigue strain strength.
In this study, fatigue strain strength refers to the maximum strain value that the material can withstand over one million cycles. The calculation temperature is 670 °C, the strain amplitude is 0.5, and the frequency is 1 Hz. A higher fatigue strain strength indicates better fatigue resistance of the weld.
  • Creep rate.
Creep rate in this study refers to the steady-state rate during the secondary stage of creep. The calculated temperature is 670 °C. It reflects the creep life of the material; a lower creep rate indicates a longer creep life and better creep resistance of the weld.

3. Results and Discussion

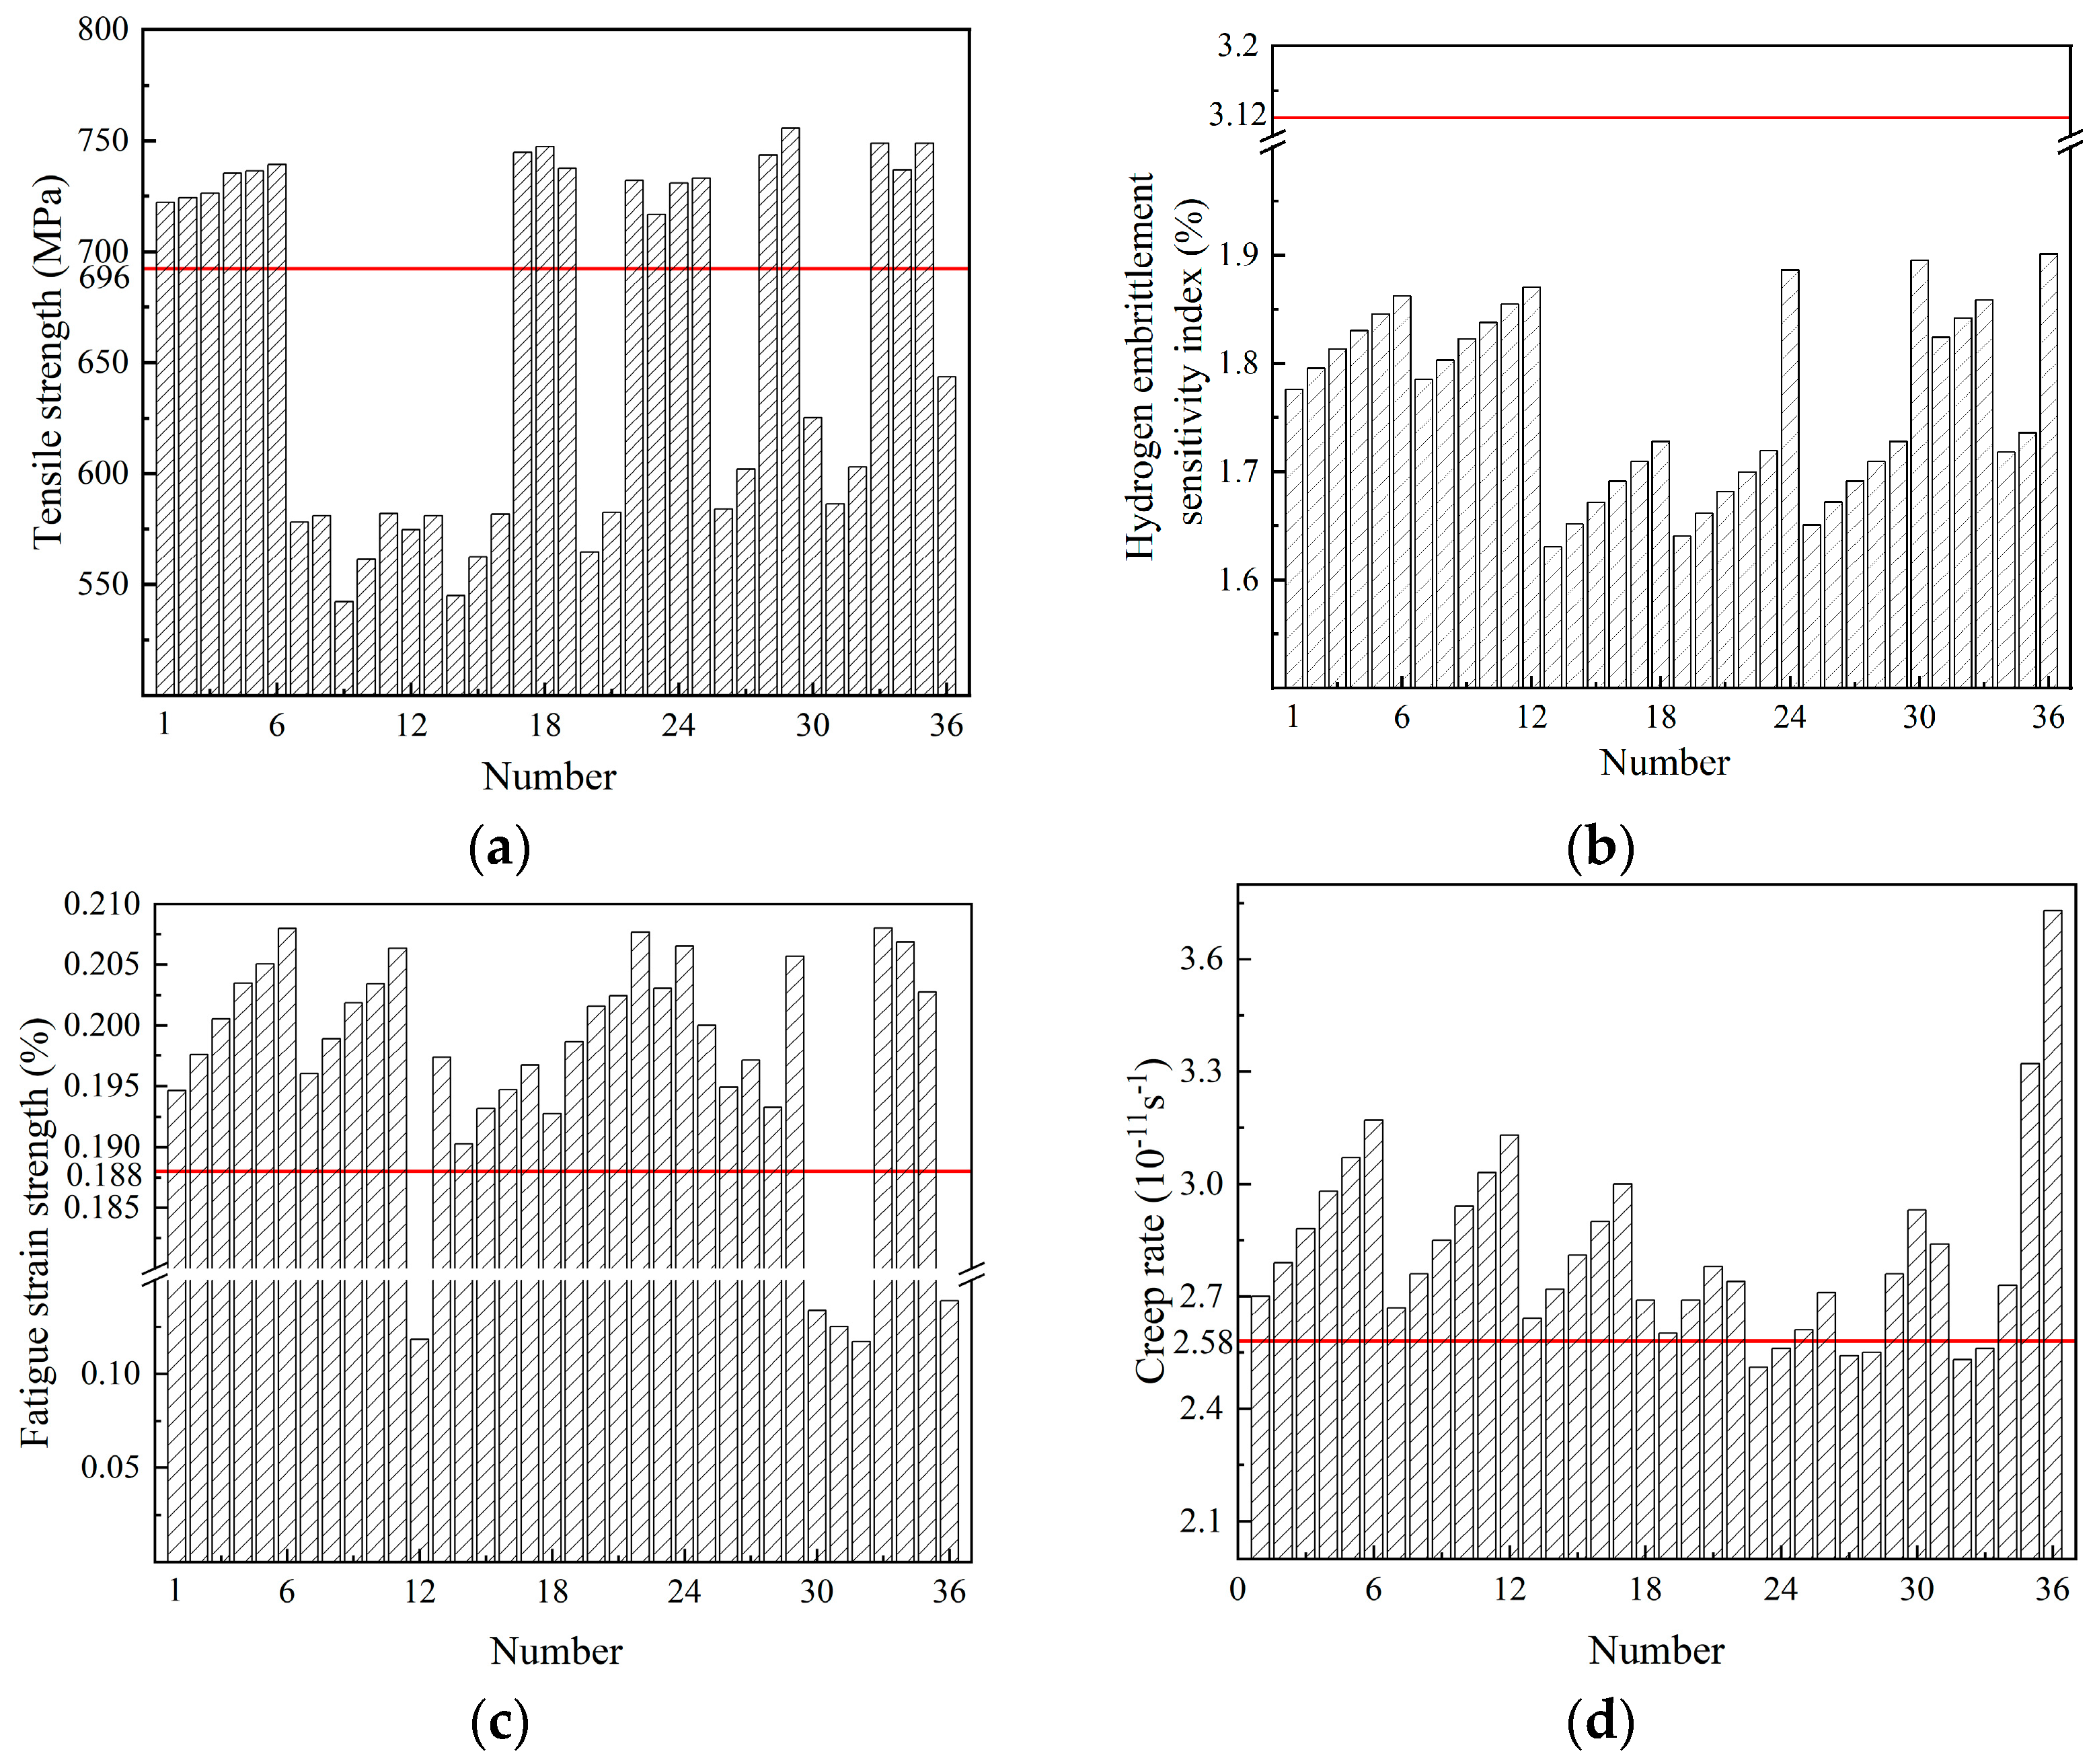
3.1. Calculation Results of Weld Properties

The original weld properties of 321 stainless steel can be calculated using JMatPro software Version 7.0, as shown in Table 6.
The weld properties are predicted for different combinations of Si and Mo content based on the full factorial experimental design table. The calculation results for tensile strength, hydrogen embrittlement sensitivity index, fatigue strain strength and creep rate are shown in Figure 1. Among them, the x-axis represents the 36 sets of element content combinations in Table 5, and the y-axis represents the weld performance after adding element content combinations to the welding wire. The red line represents the performance of the original weld.
Figure 1a presents the tensile strength of the weld under various element content combinations. It can be observed that 18 combinations result in improved tensile strength compared to the original weld. Figure 1b illustrates the hydrogen embrittlement sensitivity index for different element content combinations, showing a reduction across all groups, indicating enhanced hydrogen embrittlement resistance. Figure 1c shows the fatigue strain strength, where 31 combinations exhibit improved fatigue resistance. Figure 1d displays the creep rate of the weld under different element content combinations. A reduction in creep rate is observed in six combinations, indicating improved creep resistance. These results demonstrate that appropriate additions of Si and Mo can effectively enhance the tensile strength, hydrogen embrittlement resistance, fatigue resistance and creep resistance of the weld.

3.2. Establishment of Regression Model for Weld Performance and Variance Analysis

Response surface methodology (RSM) is an effective approach for solving multi-factor optimization problems. Its core principle is to establish a mathematical model describing the relationship between independent variables and response variables. To evaluate the practicality and effectiveness of the regression model developed by RSM, a significance test is necessary, typically conducted using analysis of variance (ANOVA) [32,33]. In this study, the independent variables are the Si and Mo contents, while the response variables include tensile strength, the hydrogen embrittlement sensitivity index, fatigue strain strength and creep rate. The full factorial experimental combinations and response values are input into Design-Expert Version 13 software, and ANOVA is performed on the experimental data.
The F-value from the F-test and the p-value obtained from ANOVA are jointly used to evaluate the significance of the overall regression model. If the F-value exceeds the critical value, it indicates that the regression model fits the experimental data well. In this study, the critical F-value for the regression model is 2.33. The F-test is conducted at a 95% confidence level. A p-value less than 0.05 suggests that the model’s predictions are statistically significant and reliable. The coefficient of determination (R2) is a key metric for assessing the goodness of fit of the regression model. The closer the R2 value is to 1, the better the model explains the relationship between the independent and response variables.

3.2.1. Tensile Strength

The ANOVA of the regression model for tensile strength is shown in Table 7. The F-value is 5.9, which exceeds the critical value, indicating that the regression model fits the experimental data well. The p-value obtained from the F-test is 0.005, which is significantly lower than 0.05, confirming that the model is significant. The coefficient of determination, R2 = 0.9273, is close to 1, indicating that approximately 92.73% of the variation in tensile strength can be explained by the independent variables. This suggests that the model has high reliability and strong predictive capability. Therefore, the regression model can be effectively used to analyze and predict the tensile strength under different combinations of Si and Mo content.
For each term in the variance analysis, a larger F-value indicates a greater influence on tensile strength. A p-value less than 0.01 indicates an extremely significant effect, while a p-value less than 0.05 indicates a significant effect. Considering both F-values and p-values, the terms xMo2xSi2, xMo4, xMo2xSi, xSi, xMo4xSi and xMoxSi3 have a significant effect on tensile strength. Among them, xMo2xSi2 has the highest F-value and a p-value less than 0.01, indicating that it has a statistically significant effect and should be included in the regression model. This demonstrates that the interaction between Si and Mo significantly affects the tensile strength of the weld. Physically, the addition of Si and Mo alters grain size and promotes the formation of M23C6 carbides and σ-phase precipitates [23], leading to substantial changes in weld tensile strength.
Therefore, RSM is employed to analyze the 36 groups of experimental data, and a significant regression model for tensile strength is established through ANOVA and significance testing. The model effectively captures the relationship between the response variable (tensile strength) and the independent variables (Si and Mo content). The specific form of the regression equation is given below:
Y 1 = 27688.32372 + 53985.39971 x M o + 69282.39097 x S i 1.24770 E + 05 x M o x S i 27218.8915 x M o 2 56055.31112 x S i 2 + 56733.07398 x M o 2 x S i + 85093.23602 x M o x S i 2 + 9775.89086 x M o 3 + 19973.89086 x S i 3 13638.8508 x M o 2 x S i 2 24923.80436 x M o 3 x S i 29180.15253 x M o x S i 3 + 137.15898 x M o 4 2104.30287 x S i 4 2594.30287 x M o 3 x S i 2 + 4216.03733 x M o 2 x S i 3 + 8409.3564 x M o 4 x S i + 3156.67783 x M o x S i 4 1805.42535 x M o 5 125.65104 x S i 5
where Y1 represents tensile strength, xMo represents Mo content, and xSi represents Si content.

3.2.2. Hydrogen Embrittlement Sensitivity Index

The ANOVA of the regression model for the hydrogen embrittlement sensitivity index is shown in Table 8. The F-value is 13.01, which exceeds the critical value, indicating that the regression model fits the data well. The p-value obtained from the F-test is less than 0.0001, demonstrating that the model reaches an extremely significant level. The model’s coefficient of determination is R2 = 0.9817, which is very close to 1, indicating that the independent variables explain 98.17% of the variation in the response variable. This model shows a high degree of reliability and can effectively predict the hydrogen embrittlement sensitivity index. Therefore, this model can be used to analyze and predict the hydrogen embrittlement sensitivity index for different combinations of Si and Mo content.
Based on the F-values and p-values, the terms xMo5, xMo3, xMo2, xMo3xSi, xMo4 and xMo have a greater impact on the hydrogen embrittlement sensitivity coefficient. Among them, xMo5 has the highest F-value and a p-value less than 0.01. Statistically, xMo5 has a significant influence on the hydrogen embrittlement sensitivity coefficient and should therefore be included in the regression model. From a physical perspective, the addition of Mo alters the weld microstructure [25], leading to substantial changes in the hydrogen embrittlement sensitivity coefficient.
Therefore, RSM is employed to analyze the 36 groups of experimental data, and a significant regression model for the hydrogen embrittlement sensitivity index is established through ANOVA and significance testing. The model effectively captures the relationship between the response variable (hydrogen embrittlement sensitivity index) and the independent variables (Si and Mo content). The specific form of the regression equation is given below:
Y 2 = 8.62889 + 103.10801 x M o 25.4126 x S i 25.9209 x M o x S i 202.29979 x M o 2 + 39.68917 x S i 2 12.42102 x M o 2 x S i + 36.37436 x M o x S i 2 + 213.66138 x M o 3 31.9704 x S i 3 3.96852 x M o 2 x S i 2 + 13.95862 x M o 3 x S i 16.14781 x M o x S i 3 11.39638 x M o 4 + 12.42952 x S i 4 2.17144 x M o 3 x S i 2 + 2.34135 x M o 2 x S i 3 2.35602 x M o 4 x S i + 2.21893 x M o x S i 4 22.36894 x M o 5 1.83042 x S i 5
where Y2 represents hydrogen embrittlement sensitivity index, xMo represents Mo content, and xSi represents Si content.

3.2.3. Fatigue Strain Strength
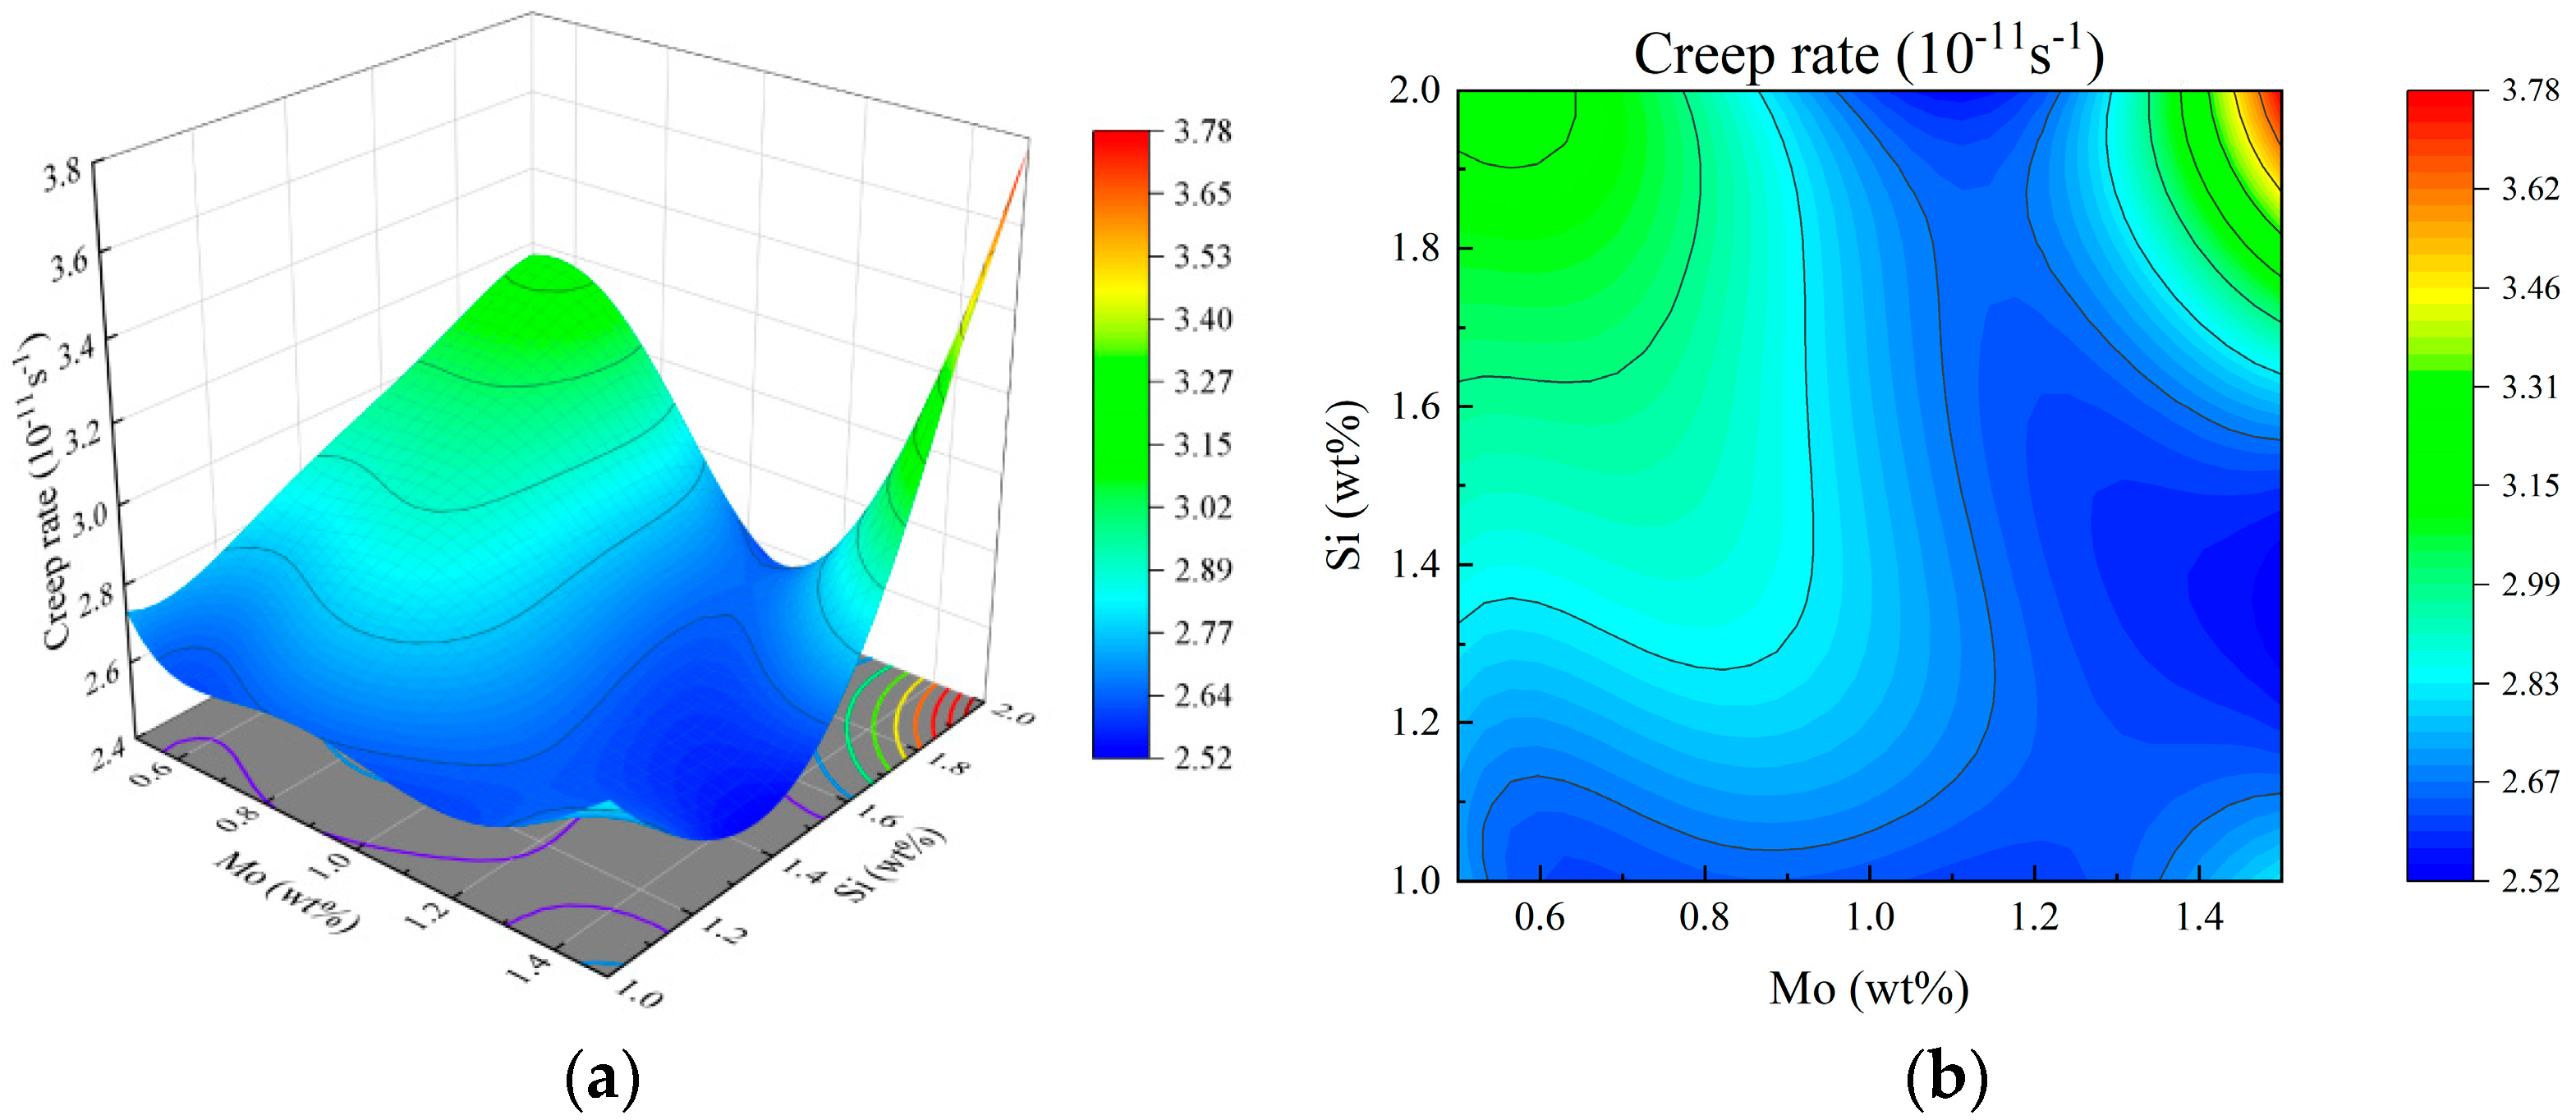
The ANOVA of the regression model for fatigue strain strength is shown in Table 9. The F-value is 5.07, which exceeds the critical value, indicating that the regression model fits the data well. The p-value obtained from the F-test is 0.0039, which is less than 0.005, demonstrating that the fatigue strain strength regression model reaches a significant level. The model’s coefficient of determination is R2 = 0.9045, which is close to 1, indicating that the independent variables explain 90.45% of the variation in the response variable. The model exhibits a high degree of reliability and can effectively predict fatigue strain strength. Therefore, this model can be used to analyze and predict fatigue strain strength for different combinations of Si and Mo content.
Based on the F-values and p-values, the terms xMo4xSi, xMo2xSi and xMo3xSi2 have a greater impact on fatigue strain strength. Among them, xMo4xSi has the highest F-value, with a corresponding p-value less than 0.01. Statistically, xMo4xSi significantly influences fatigue strain strength and should be included in the regression model. These results indicate that the interaction between Si and Mo has a pronounced effect on the fatigue strain strength of the weld. Physically, the addition of Si and Mo inhibits the formation of Fe3Nb3C precipitates [19], leading to substantial changes in fatigue strain strength.
Therefore, RSM is employed to analyze the 36 groups of experimental data, and a significant regression model for fatigue strain strength is established through ANOVA and significance testing. The model effectively captures the relationship between the response variable (fatigue strain strength) and the independent variables (Si and Mo content). The specific form of the regression equation is given below:
Y 3 = 11.68205 + 18.57472 x M o 52.77477 x S i 8.49931 x M o x S i 34.29477 x M o 2 + 77.26963 x S i 2 + 3.16826 x M o 2 x S i + 6.07334 x M o x S i 2 + 35.19171 x M o 3 54.95692 x S i 3 + 9.63935 x M o 2 x S i 2 11.96223 x M o 3 x S i 6.39643 x M o x S i 3 13.86973 x M o 4 + 19.74338 x S i 4 2.20998 x M o 3 x S i 2 0.781353 x M o 2 x S i 3 + 4.66974 x M o 4 x S i + 1.2607 x M o x S i 4 + 1.47227 x M o 5 2.80751 x S i 5
where Y3 represents fatigue strain strength, xMo represents Mo content, and xSi represents Si content.

3.2.4. Creep Rate

The ANOVA of the regression model for creep rate is shown in Table 10. The F-value is 13.54, which exceeds the critical value, indicating that the regression model fits the data well. The p-value obtained from the F-test is less than 0.0001, demonstrating that the model reaches an extremely significant level. The model’s coefficient of determination is R2 = 0.9475, which is close to 1, indicating that the independent variables explain 94.75% of the variation in the response variable. The model shows a high degree of reliability and can effectively predict the creep rate. Therefore, the model can be reliably used to analyze and predict the creep rate under different combinations of Si and Mo content.
Based on the F-values and p-values, the terms xMo2xSi2, xMo3xSi, xMo2xSi and xMo have a greater impact on the creep rate. Among them, xMo2xSi2 has the highest F-value, with a corresponding p-value less than 0.01. Statistically, xMo2xSi2 significantly affects the creep rate and should therefore be included in the regression model. These results indicate that the interaction between Si and Mo has a significant effect on the creep rate of the weld. Physically, the addition of Si and Mo increases the content of deformation twins [20], enhances structural stability, and leads to substantial changes in the creep rate.
Therefore, RSM is employed to analyze the 36 groups of experimental data, and a significant regression model for creep rate is established through ANOVA and significance testing. The model effectively captures the relationship between the response variable (creep rate) and the independent variables (Si and Mo content). The specific form of the regression equation is given below:
Y 4 = 76.46111 121.61642 x M o 185.51094 x S i + 132.79449 x M o x S i + 148.24169 x M o 2 + 219.06724 x S i 2 35.5849 x M o 2 x S i 100.20322 x M o x S i 2 129.93304 x M o 3 132.46733 x S i 3 + 1.32999 x M o 2 x S i 2 + 11.8347 x M o 3 x S i + 41.65137 x M o x S i 3 + 60.38566 x M o 4 + 39.73834 x S i 4 + 7.48698 x M o 3 x S i 2 3.46706 x M o 2 x S i 3 7.06845 x M o 4 x S i 5.84077 x M o x S i 4 9.89583 x M o 5 4.77431 x S i 5
where Y4 represents fatigue strain strength, xMo represents Mo content, and xSi represents Si content.

3.3. Response Surface Interaction Analysis

The response surface and contour plots can visually illustrate the influence of the interaction between factors on the response value [34]. A steeper response surface and denser contour lines indicate a more significant influence, while contour lines that are closer to an elliptical shape suggest a stronger interaction between the variables. To investigate the interactive effects of Si and Mo content on tensile strength, the hydrogen embrittlement sensitivity index, fatigue strain strength, and creep rate, response surface and contour plots are generated.

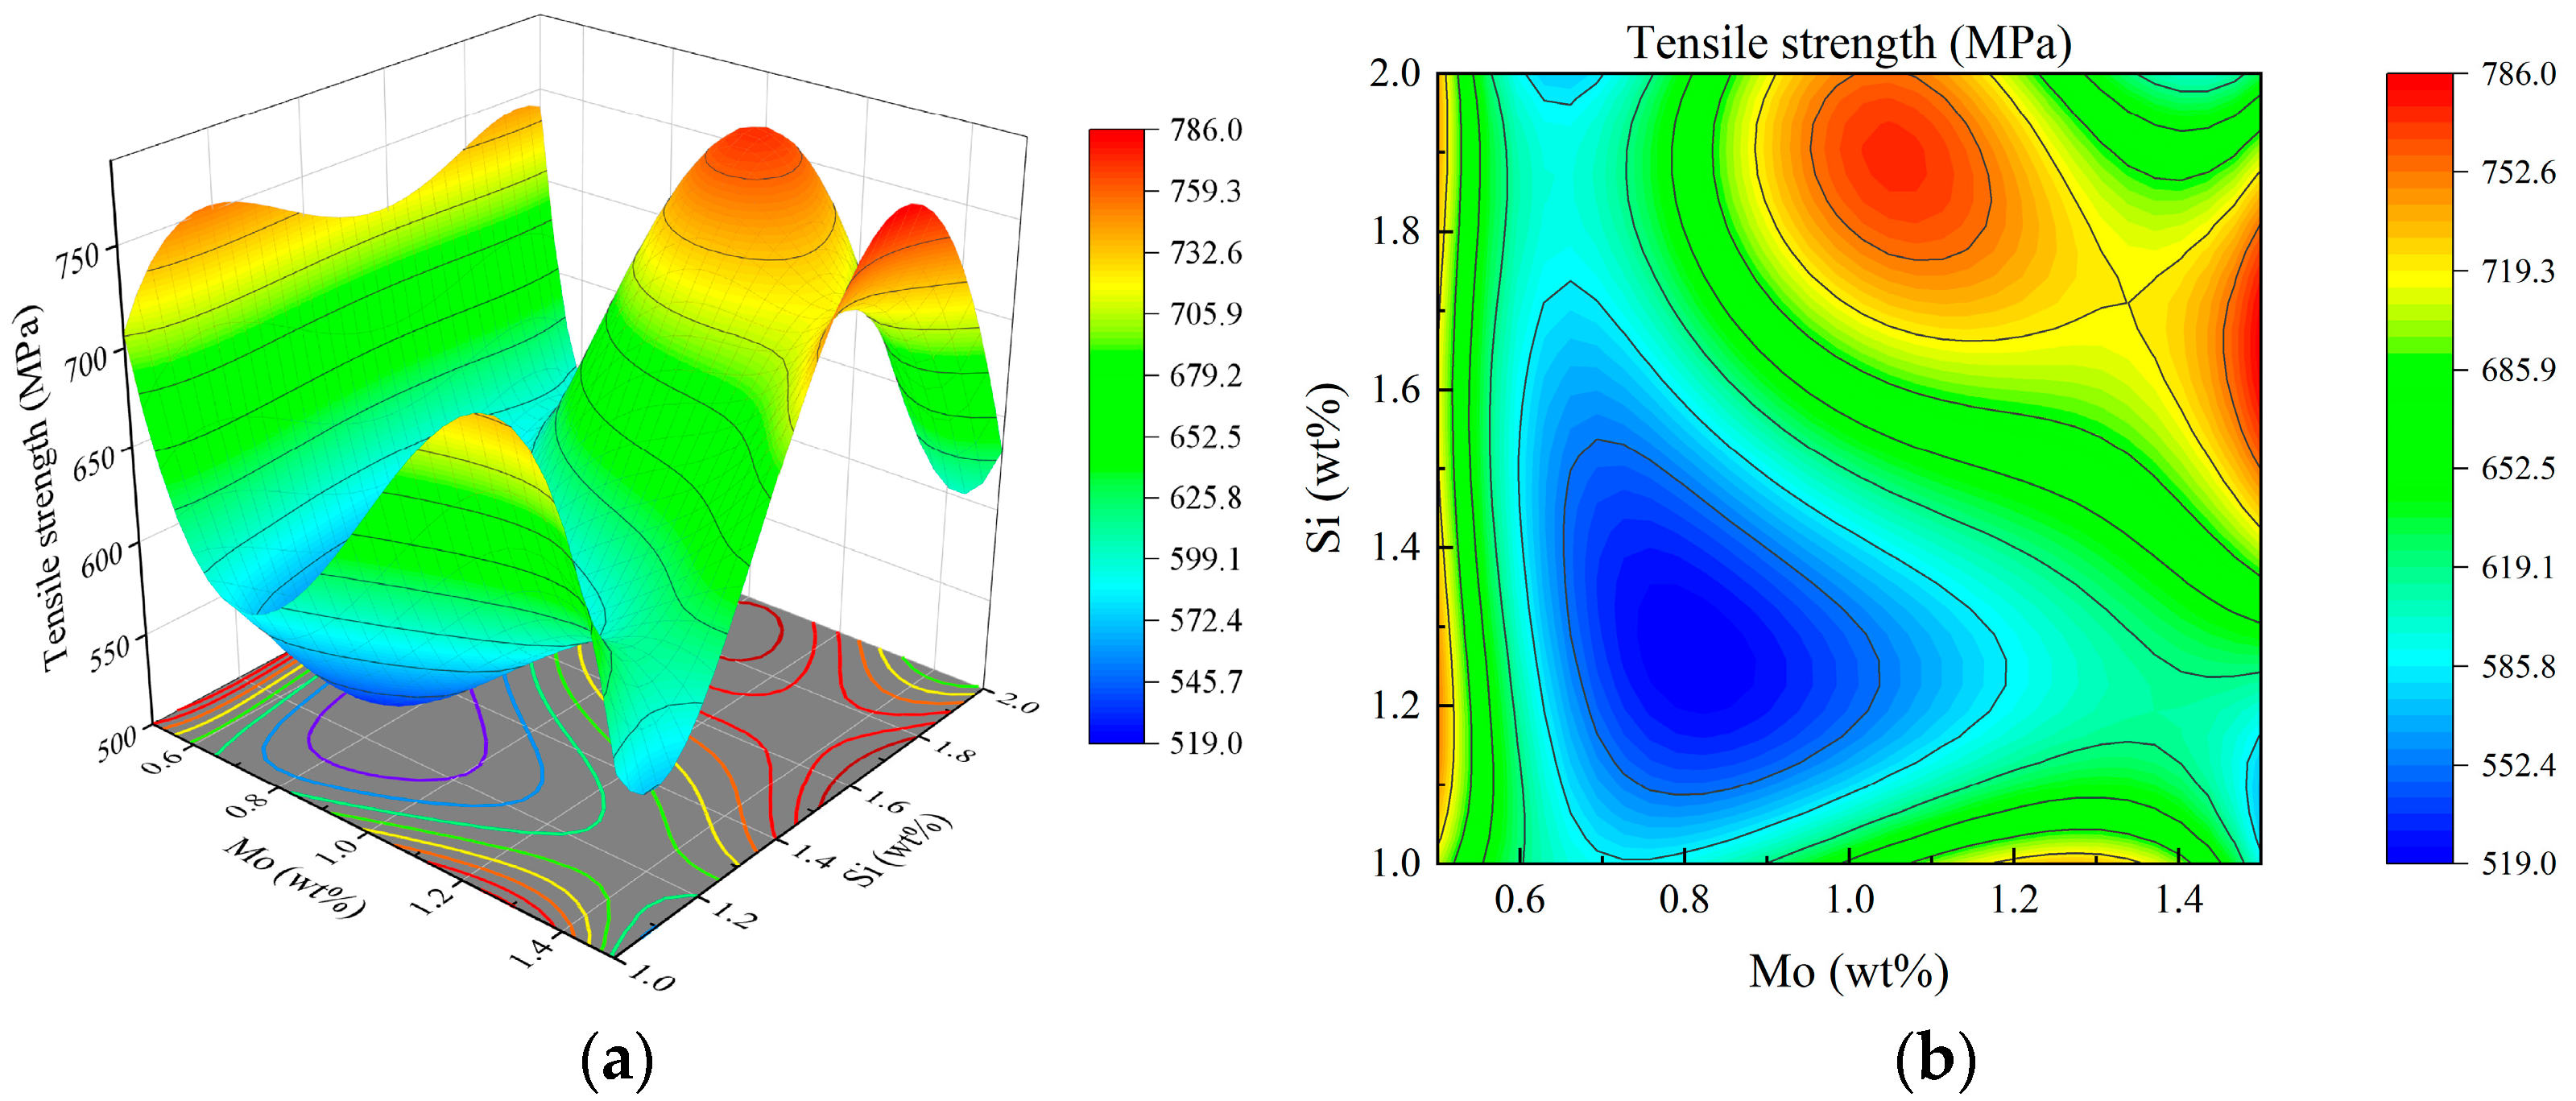
3.3.1. Tensile Strength

Figure 2 illustrates the variation trend of tensile strength under the interaction between Si and Mo content. As shown in Figure 2a, the influence of Si and Mo on tensile strength exhibits interval-dependent characteristics. With increasing Si and Mo content, their effects on tensile strength vary across different content ranges. The maximum tensile strength is observed when the Si content is between 1.7 wt% and 2.0 wt% and the Mo content is between 0.9 wt% and 1.2 wt%, under the interaction of the two elements. Conversely, the minimum tensile strength occurs when the Si content is in the range of 1.1 wt%–1.5 wt% and the Mo content is in the range of 0.6 wt%–1.0 wt%. As shown in Figure 2b, the contour lines exhibit an elliptical shape, indicating that the interaction between Si and Mo content has a highly significant effect on tensile strength.

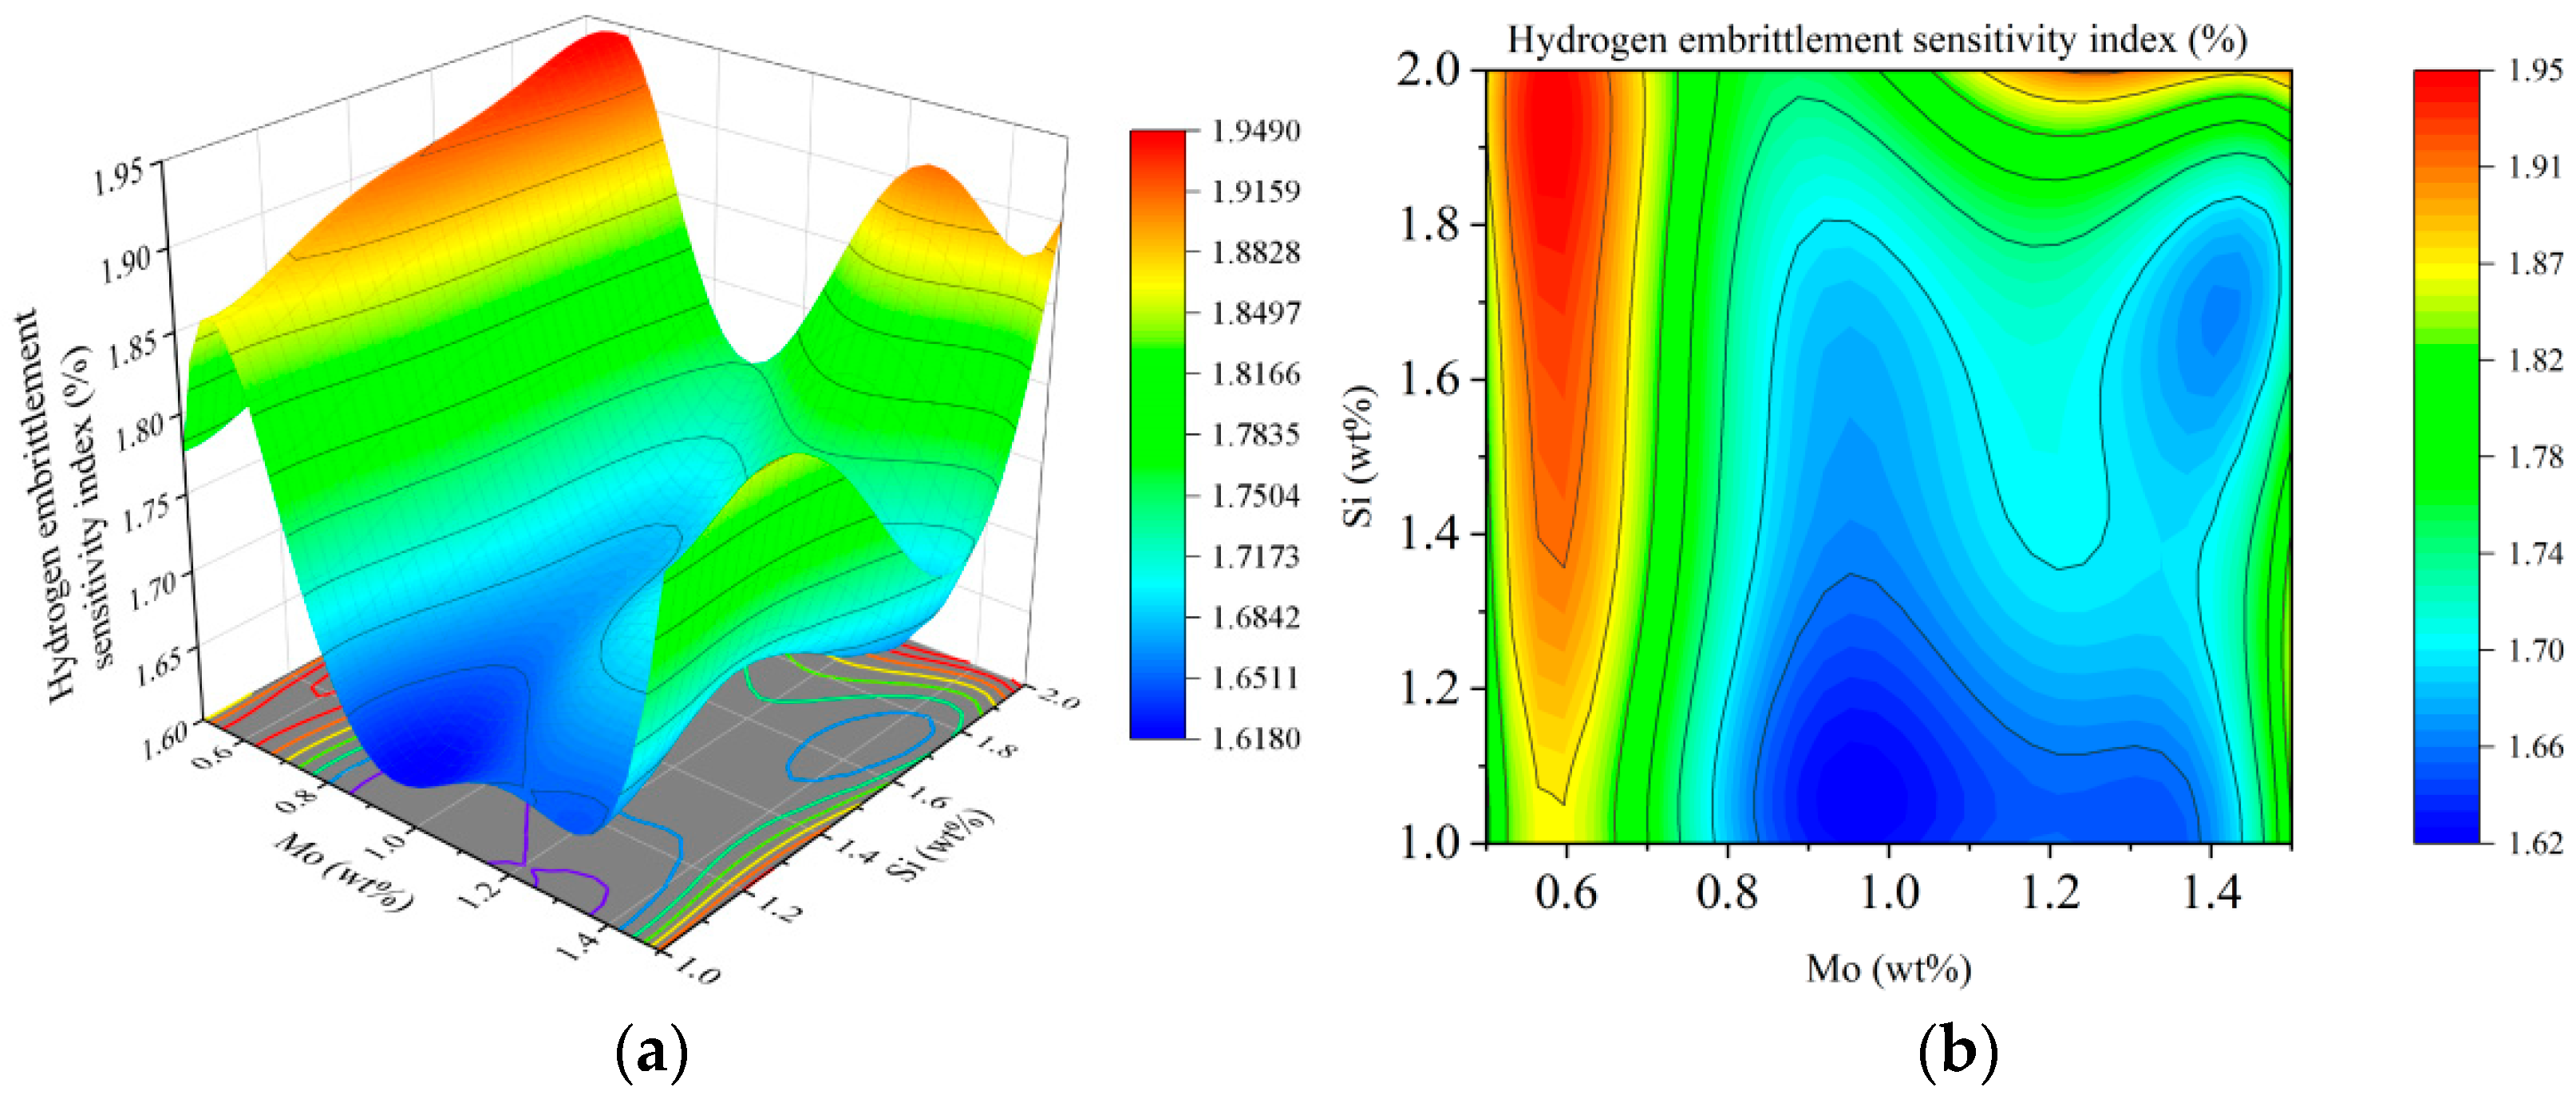
3.3.2. Hydrogen Embrittlement Sensitivity Index

Figure 3 illustrates the variation trend of the hydrogen embrittlement sensitivity index under the interaction between Si and Mo contents. As shown in Figure 3a, the influence of Si and Mo on the hydrogen embrittlement sensitivity index exhibits interval-dependent characteristics. With increasing Si and Mo contents, their effects on the index vary across different compositional ranges. The maximum hydrogen embrittlement sensitivity index occurs when the Si content is between 1.8 wt% and 2.0 wt% and the Mo content is between 0.5 wt% and 0.7 wt%. In contrast, the minimum value is observed when the Si content is between 1.0 wt% and 1.2 wt% and the Mo content is between 0.8 wt% and 1.1 wt%. As shown in Figure 3b, the contour lines are elliptical in shape, indicating that the interaction between Si and Mo contents has a significant effect on the hydrogen embrittlement sensitivity index.

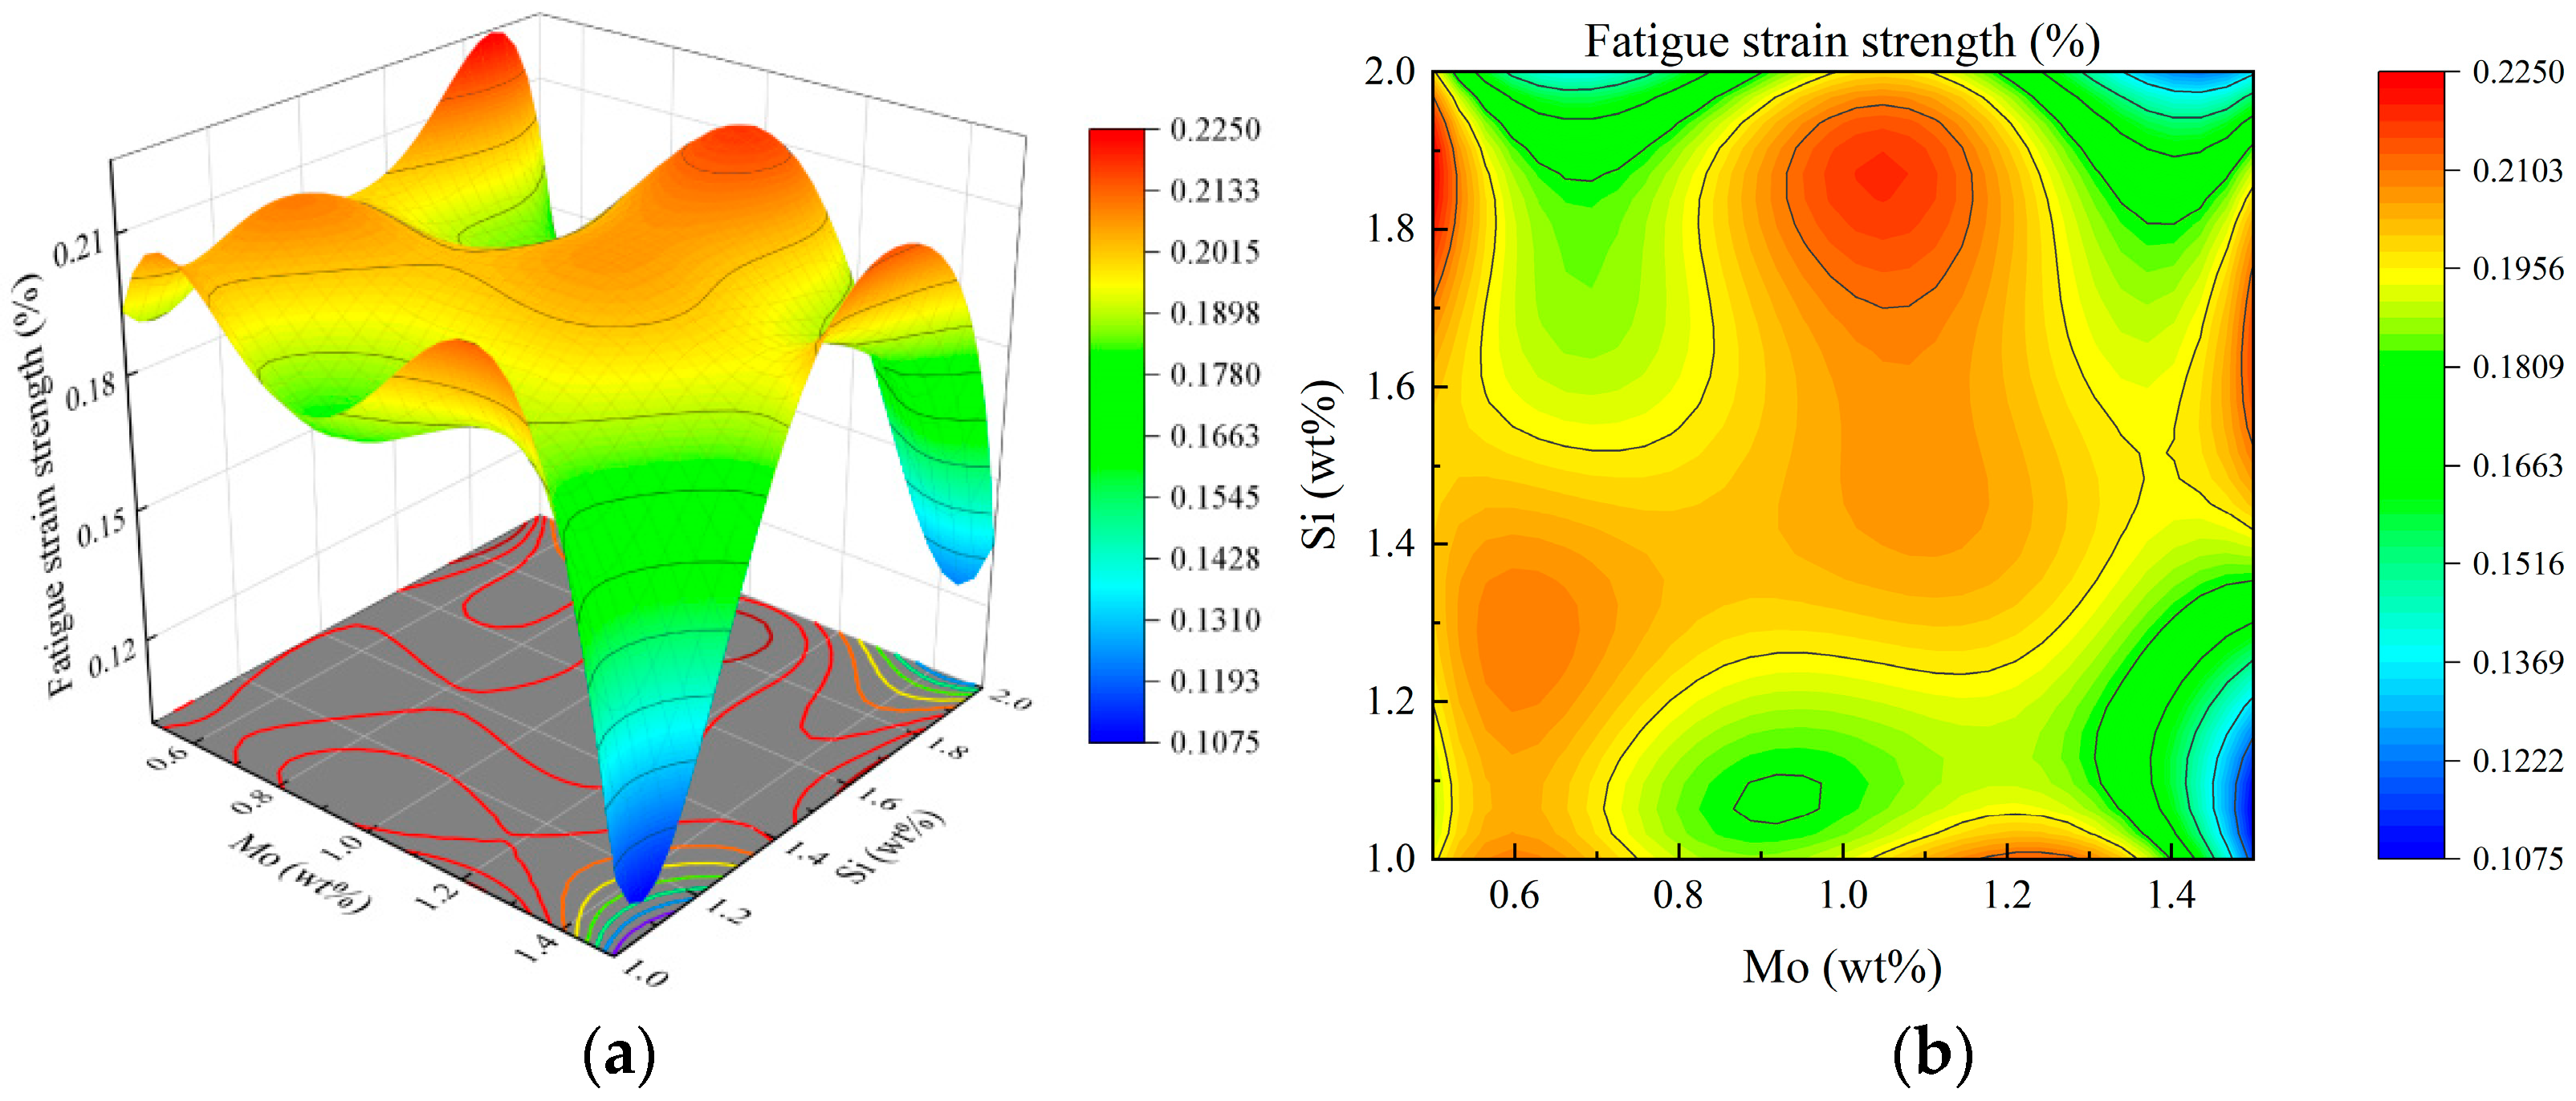
3.3.3. Fatigue Strain Strength

Figure 4 illustrates the variation trend of fatigue strain strength under the interaction between Si and Mo contents. As shown in Figure 4a, the effect of Si and Mo contents on fatigue strain strength exhibits interval-dependent characteristics. With increasing Si and Mo levels, their influence on fatigue strain strength varies across different compositional ranges. The maximum fatigue strain strength is observed when the Si content is between 1.7 wt% and 1.9 wt% and the Mo content is between 0.9 wt% and 1.2 wt%. As shown in Figure 4b, the contour lines are elliptical in shape, indicating that the interaction between Si and Mo contents has a highly significant impact on fatigue strain strength.

3.3.4. Creep Rate

Figure 5 illustrates the changing trend of the creep rate under the interaction between Si and Mo contents. As shown in Figure 5a, the effects of Si and Mo contents on the creep rate exhibit different trends. With increasing Si content, the creep rate gradually increases. In contrast, with increasing Mo content, the creep rate initially decreases and then increases. The minimum creep rate is observed when the Si content is between 1.2 wt% and 1.5 wt% and the Mo content is between 1.4 wt% and 1.5 wt%. As shown in Figure 5b, the contour lines are approximately elliptical, indicating that the interaction between Si and Mo contents has a significant effect on the creep rate.

4. Multi-Objective Optimization and Experimental Verification of Stacked Weld Performance

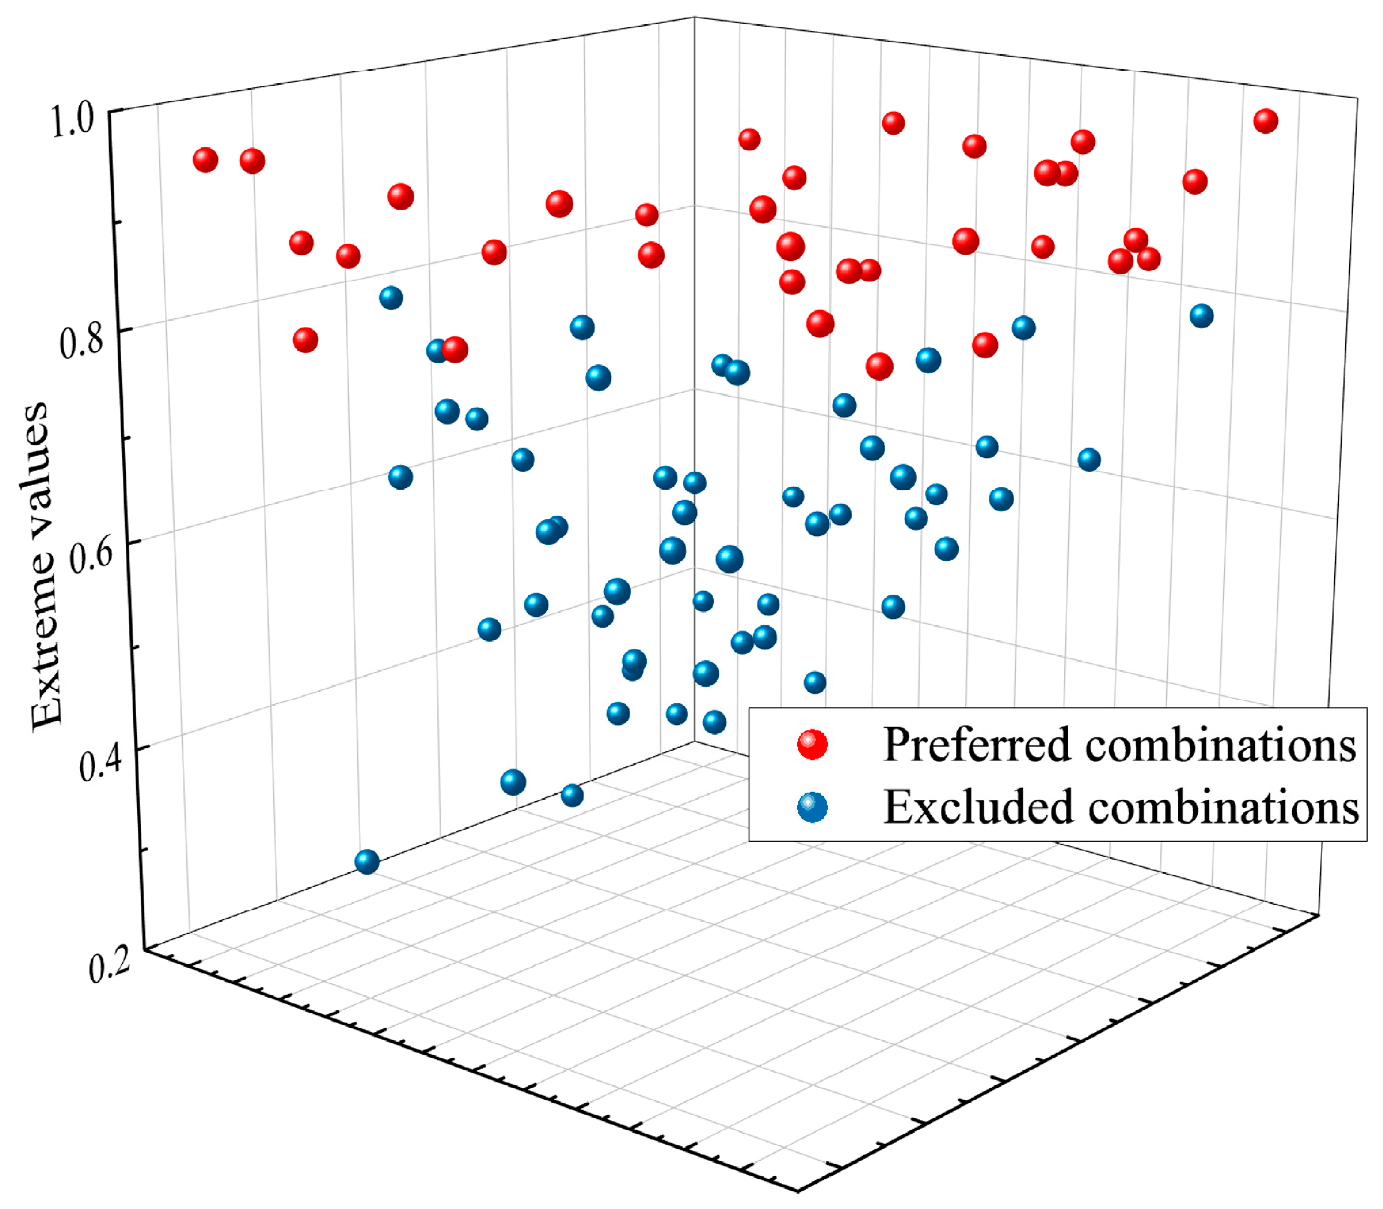
4.1. Determination of Combination of Weld Layer Performance Weight Coefficients

Under conditions of high temperature, high pressure and hydrogen exposure, the weld layers of the hydrogen production reactor are required to exhibit different resistance properties, including high tensile strength, hydrogen embrittlement resistance, fatigue resistance and creep resistance. In the stacked weld structure investigated in this study, the weld is divided into four layers. Tensile strength, the hydrogen embrittlement sensitivity index, fatigue strain strength and creep rate are selected as the performance evaluation indices. Each weld layer has different performance requirements, and accordingly, the weight coefficients of the evaluation indices vary by layer. Let θ1, θ2, θ3 and θ4 represent the weight coefficients for tensile strength, the hydrogen embrittlement sensitivity index, fatigue strain strength and creep rate, respectively. The sum of the weight coefficients for each weld layer is equal to 1.
The exhaustive method is used to identify the optimal solution by enumerating all possible weight coefficient combinations. Compared with other weighting methods, it does not rely on model assumptions, thereby avoiding subjective bias and directly determining the optimal weight set based on data. In this study, the weight coefficient step size is set to 0.1, resulting in a total of 84 possible weight combinations. When the Mo content is within 0.5 wt%–1.5 wt% and the Si content is within 1.0 wt%–2.0 wt%, the regression equations for each weld performance evaluation index are normalized. The normalized regression models for tensile strength, the hydrogen embrittlement sensitivity index, fatigue strain strength and creep rate are denoted as y1, y2, y3 and y4, respectively. To determine the optimal weight combination, each set of weight coefficients is substituted into Formula (6) for calculation. For each weight combination, a corresponding extreme value is obtained to evaluate overall performance.
θ 1 + θ 2 + θ 3 + θ 4 = 1 m a x f x S i , x M o = θ 1 y 1 θ 2 y 2 + θ 3 y 3 θ 4 y 4
Figure 6 illustrates the extreme values corresponding to all weight coefficient combinations. These extreme values are used to identify the optimal weight configuration for each weld layer. Among the 84 combinations, those with extreme values greater than 0.80 are considered preferable. The stacked weld is divided into four layers: base layer, first filling layer, second filling layer and cover layer. The selection principle for the weight coefficients is to maximize the other performance indicators without compromising the tensile strength of the weld. For the base layer, the primary focus is on enhancing hydrogen embrittlement resistance. For the first filling layer, priority is given to improving creep resistance, with hydrogen embrittlement resistance as a secondary consideration. For the second filling layer, creep resistance remains the main target, while fatigue resistance is considered a secondary objective. For the cover layer, the emphasis is on fatigue resistance. Based on the performance requirements of each layer, the final optimal weight coefficient combination for each weld layer is summarized in Table 11.

4.2. Multi-Objective Optimization of Stacked Weld Performance

Based on the results obtained from the RSM, a multi-objective optimization mathematical model for gradient improvement of the stacked weld is established, and it is solved using a genetic algorithm (GA). The optimization objective is to improve the overall performance of the stacked weld and give it specific resistance according to the performance requirements of different weld layers. From the perspective of performance evaluation indices, the optimization aims to enhance tensile strength and fatigue strain strength, while reducing the hydrogen embrittlement sensitivity index and creep rate.

4.2.1. Establishment of Mathematical Model for Multi-Objective Optimization

In this optimization, a total of 12 optimization variables are considered, including the Si content, Mo content, and welding thickness for each weld layer.
X = x Z 1 x Z 2 x 21 x 22 x 11 x 12 , W = w Z w 2 w 1 , θ = θ Z 1 θ 21 θ 11 θ Z 2 θ 22 θ 12 θ Z 3 θ 23 θ 13 θ Z 4 θ 24 θ 14
where xz1 and xz2 represent the Mo and Si contents added to the welding wire of the Z-layer weld, wz denotes the welding thickness of the Z-th layer, and θz1, θz2, θz3 and θz4 are the weight coefficients corresponding to the tensile strength, hydrogen embrittlement sensitivity index, fatigue strain strength and creep rate, respectively, of the Z-th layer.
In the optimization process, variables including element content, weld layer thickness, weight coefficients, and the total weld thickness are all subject to specific constraint ranges. The constraints for each variable are defined as follows:
Z is the number of weld layers, and the weld is divided into 4 layers:
Z 1,2 , 3,4
The constraints on the Si and Mo content added to the welding wire are defined as follows:
0.5   wt % x Z 1 1.5   wt % 1.0   wt % x Z 2 2.0   wt %
According to the actual welding situation, the constraint of each layer of weld thickness is as follows:
1   m m w Z 3   m m
The sum of the weight coefficients of the performance evaluation indices for each weld layer is equal to 1, and the constraints are defined as follows:
θ Z 1 + θ Z 2 + θ Z 3 + θ Z 4 = 1
The overall thickness of the stacked weld is 10 mm, and the constraints are as follows:
w 1 + w 2 + w 3 + w 4 = 10
The overall score of the stacked weld is calculated based on the performance scores of different element combinations and the thickness of each weld layer. The combination of variables that yields the maximum overall score represents the optimal solution. The objective function is defined as follows:
f Z x Z 1 , x Z 2 = θ Z 1 y 1 x Z 1 , x Z 2 θ Z 2 y 2 x Z 1 , x Z 2 + θ Z 3 y 3 x Z 1 , x Z 2 θ Z 4 y 4 x Z 1 , x Z 2 m a x h x = ω 1 f 1 x 11 , x 12 + ω 2 f 2 x 21 , x 22 + ω 3 f 3 x 31 , x 32 + ω 4 f 4 x 41 , x 42
where y1, y2, y3 and y4 represent the normalized regression equations for tensile strength, the hydrogen embrittlement sensitivity index, fatigue strain strength and creep rate, respectively. fz denotes the performance score of the element combination in the Z-th weld layer, and h(x) represents the overall performance score of the stacked weld.
The above equations collectively constitute the multi-objective optimization mathematical model for gradient improvement of the stacked weld in a hydrogen production reactor.

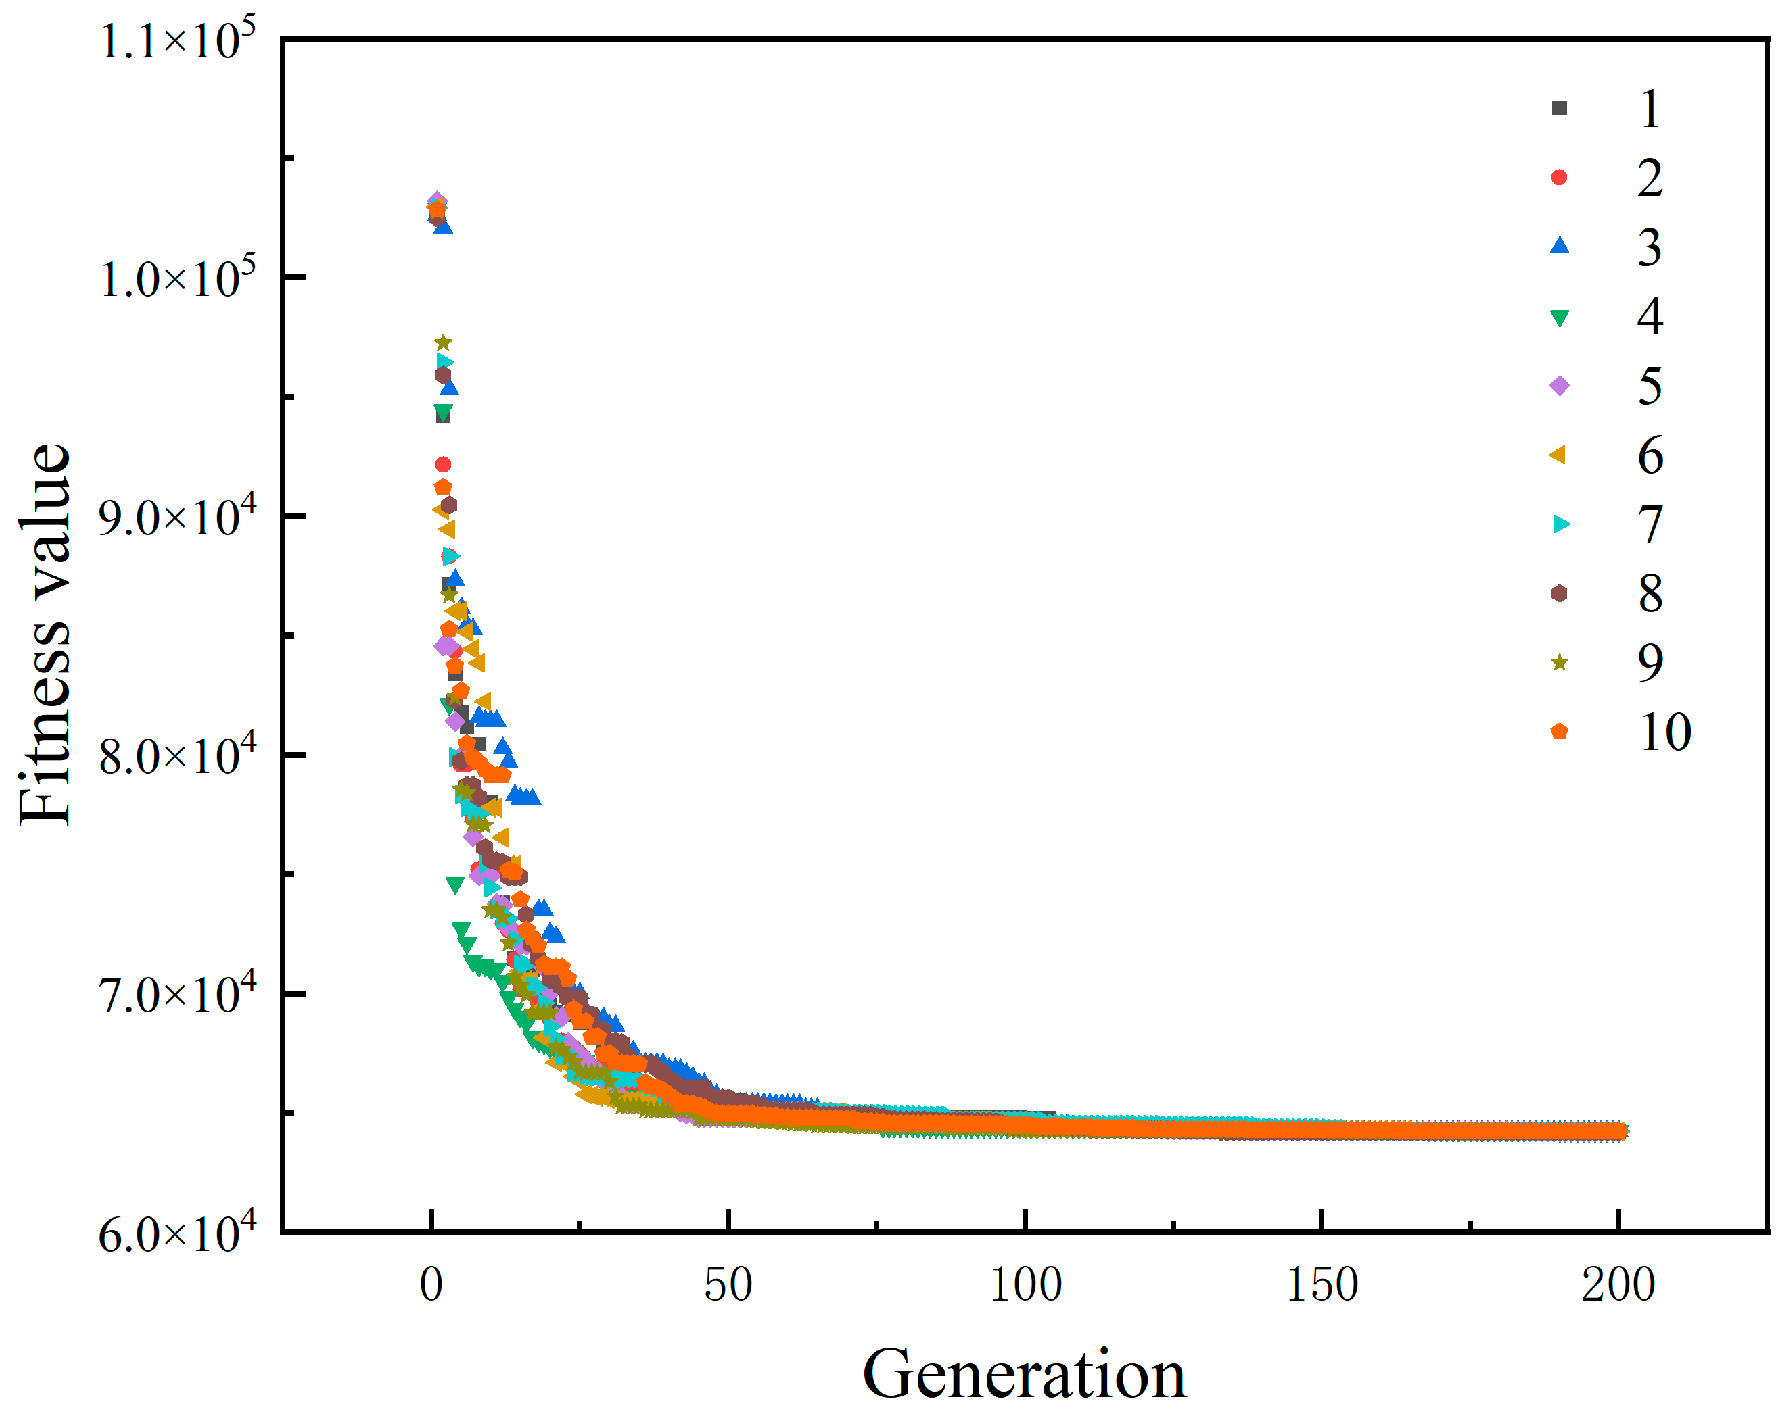
4.2.2. Multi-Objective Optimization Results

To obtain the optimal solution of the multi-objective optimization mathematical model for the gradient improvement of the stacked weld, a genetic algorithm (GA) [35,36] is employed. The genetic algorithm function in MATLAB R2016b is coded based on the previously established objective function and the defined variable constraints. The algorithm parameters are set as follows: an initial population size of 50, a crossover probability of 0.6, a mutation probability of 0.01 and 200 iterations. The fitness value iteration is shown in Figure 7. As illustrated, the fitness value reaches its minimum at the 161st iteration and remains unchanged thereafter. This minimum fitness value represents the optimal solution.
To further verify the accuracy of the genetic algorithm optimization results, a secondary optimization is performed using the particle swarm optimization (PSO). The particle swarm optimization function is implemented in MATLAB R2016b, with the number of iterations also set to 200. The fitness value iteration of the particle swarm algorithm is shown in Figure 7. As observed, the fitness value reaches its minimum at the 20th iteration and remains unchanged thereafter, indicating convergence to the optimal solution. The minimum fitness value obtained by the particle swarm optimization is identical to that of the genetic algorithm, confirming the consistency of the optimization results. However, the particle swarm optimization converges more quickly, identifying the optimal solution in fewer iterations. Based on the results, the optimized Si and Mo content for each weld layer and the corresponding weld layer thicknesses are summarized in Table 12.
According to the element content combination added in each layer of welding wire presented in Table 12, the corresponding performance metrics are calculated using the weld performance regression equations, and the results are summarized in Table 13. It can be observed that, from the base layer to the cover layer, the tensile strength of the weld gradually decreases, the hydrogen embrittlement sensitivity index increases, the fatigue strain strength increases, and the creep rate first decreases and then increases. Overall, each weld layer not only exhibits specific resistance but also achieves a gradient in performance properties. The smooth transition of different performance indicators across layers enhances the comprehensive performance of the stacked weld. The multi-objective optimization method successfully achieves the intended performance enhancement goals.
Compared with the performance of the original 321 stainless steel weld, the improvement rates of each performance for the optimized stacked weld are presented in Table 14. It can be observed that the tensile strength, hydrogen embrittlement resistance, and fatigue resistance of different weld layers have improved to varying extents, while the creep resistance shows both increases and decreases. Specifically, the creep resistance of the base layer and the cover layer slightly declines, whereas the first and second filling layers exhibit slight improvements. This outcome is attributed to the differing weight coefficients assigned to the performance evaluation indicators for each weld layer. The base layer is primarily optimized for hydrogen embrittlement resistance, the cover layer for fatigue resistance and the filling layers for creep resistance. The content of reinforcing elements added in the base and cover layer welding wire is not conducive to enhancing creep resistance. Nevertheless, in order to balance the performance requirements of different weld layers and improve the overall performance of the stacked weld, a slight reduction in creep resistance in the base and cover layers is considered acceptable.

4.3. Welding Experiment Verification of Stacked Welds

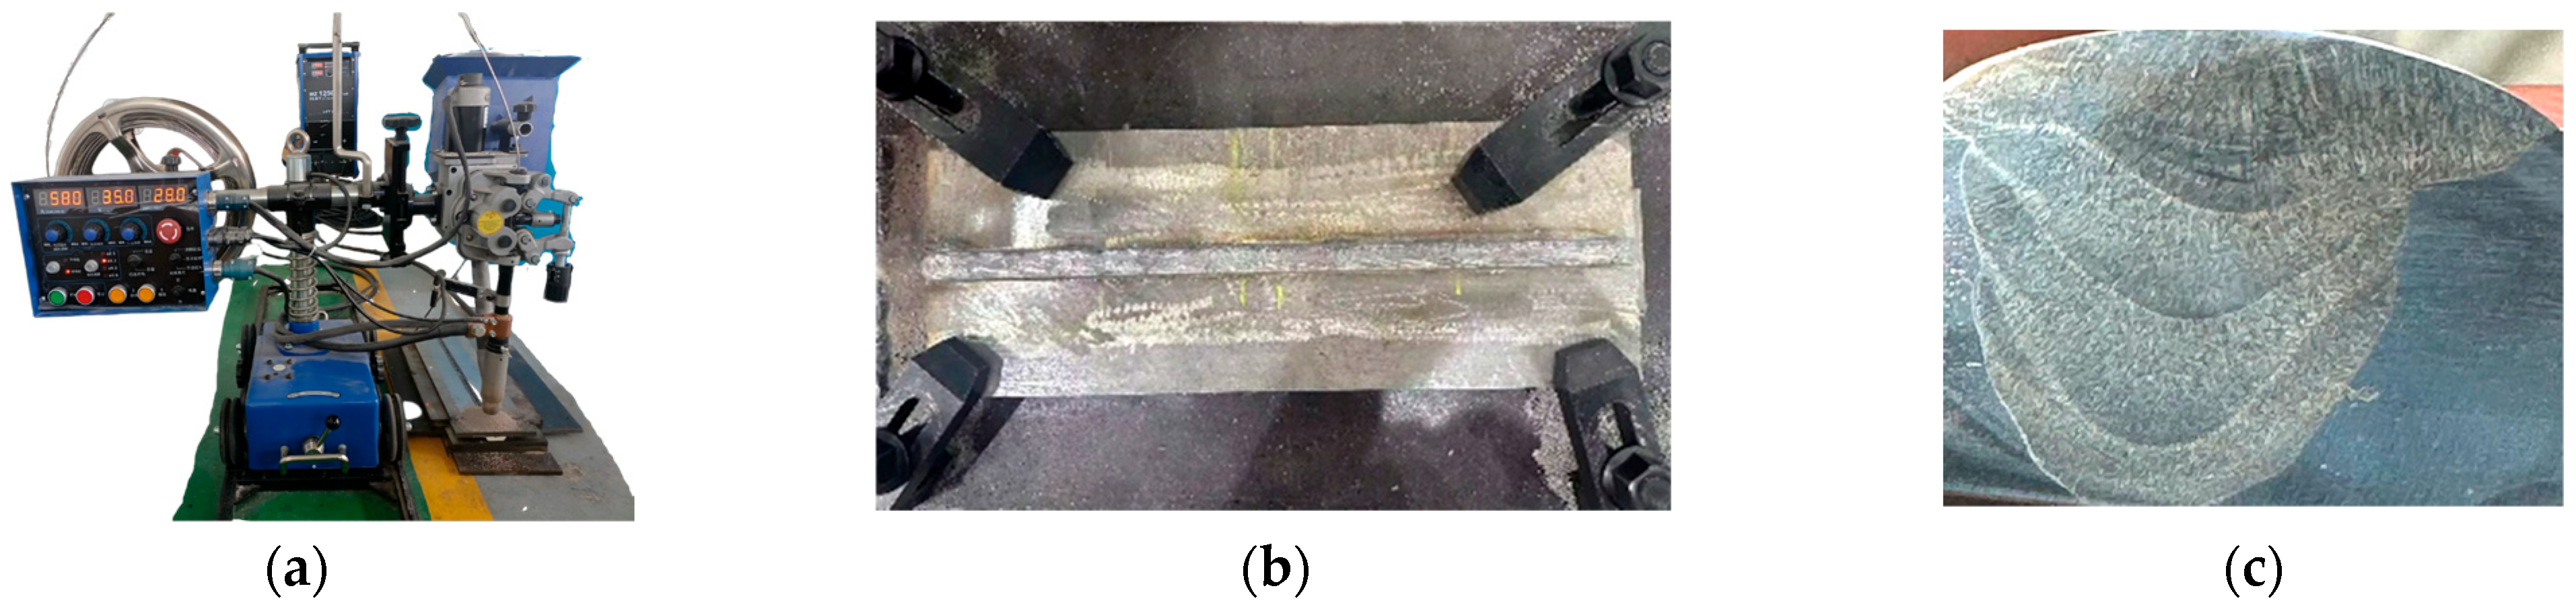
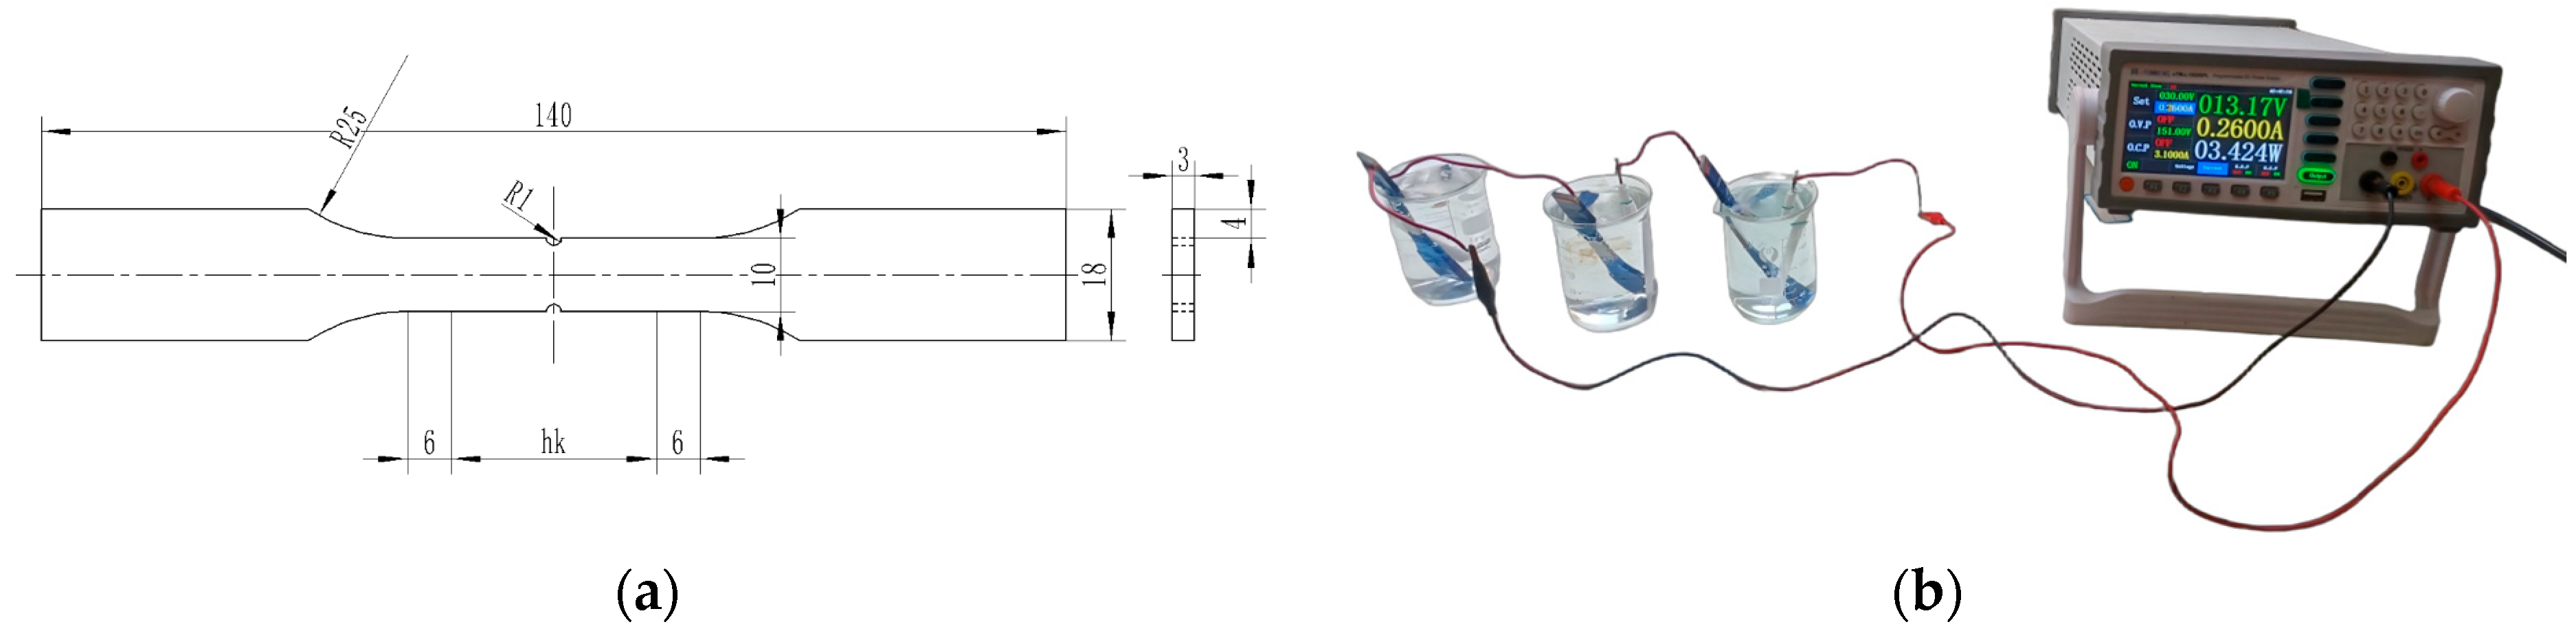
4.3.1. Welding Experiment and Inspection

Based on the optimized element content added in the optimized stacked weld wire and the optimal welding thickness of the stacked weld, a welding experiment is conducted to validate the proposed optimization scheme. Considering the difficulty of welding large-size welds, this experiment primarily aims to verify the feasibility of the research through small-size stacked welds. The welding method adopted is submerged arc welding (SAW). The base material is 321 stainless steel with a thickness of 10 mm. The welding wire and flux are GWS-347 and GXS-340, respectively. The stacked weld consists of four layers, with one pass per layer. In accordance with “ISO 9692-2:2024, Welding and Allied Processes-Joint Preparation-Part 2: Submerged Arc Welding of Steels” [37], a V-groove butt joint is selected with a groove angle of 50° and a root gap of 8 mm. Referring to practical welding experience and parameters recommended by the welding wire manufacturer, the welding parameters for each layer of the stacked weld are listed in Table 15. The welding equipment, the stacked weld and the stacked weld cross-section are shown in Figure 8. Both the original stacked weld and the optimized stacked weld are fabricated for comparison. In the original stacked weld, the welding wire composition remains unchanged throughout all layers. In contrast, for the optimized stacked weld, Si and Mo elements are selectively added to the welding wire of each layer according to the optimized design.
After the stacked weld is completed, sampling and performance testing are carried out. A layered sampling method is used to prepare tensile specimens from different weld layers to evaluate tensile strength. Considering the difficulty of specimen preparation, the thickness of each tensile specimen is set to 3 mm, with dimensions shown in Figure 9a. Based on the total thickness of the stacked weld, three tensile specimens are obtained, corresponding to the base layer, the filling layer and the cover layer. The hydrogen embrittlement resistance of the welds is evaluated using a pre-charging hydrogen tensile test. The electrochemical hydrogen charging setup is illustrated in Figure 9b. Several specimens are subjected to hydrogen charging in parallel by connecting multiple electrolytic cells in series. The electrolyte used is a mixed solution containing 0.492 g/L anhydrous sodium pyrophosphate (Na4P2O7) and 0.5 mol/L dilute sulfuric acid (H2SO4). The current density during hydrogen charging is maintained at 50 mA/cm2, and the charging duration is 24 h. Following hydrogen charging, the tensile strength of each specimen is tested, and the hydrogen embrittlement sensitivity index is calculated using Equation (1). Due to the high cost and long duration of fatigue and creep tests, the corresponding performance values are obtained through JMatPro simulations instead of physical testing.

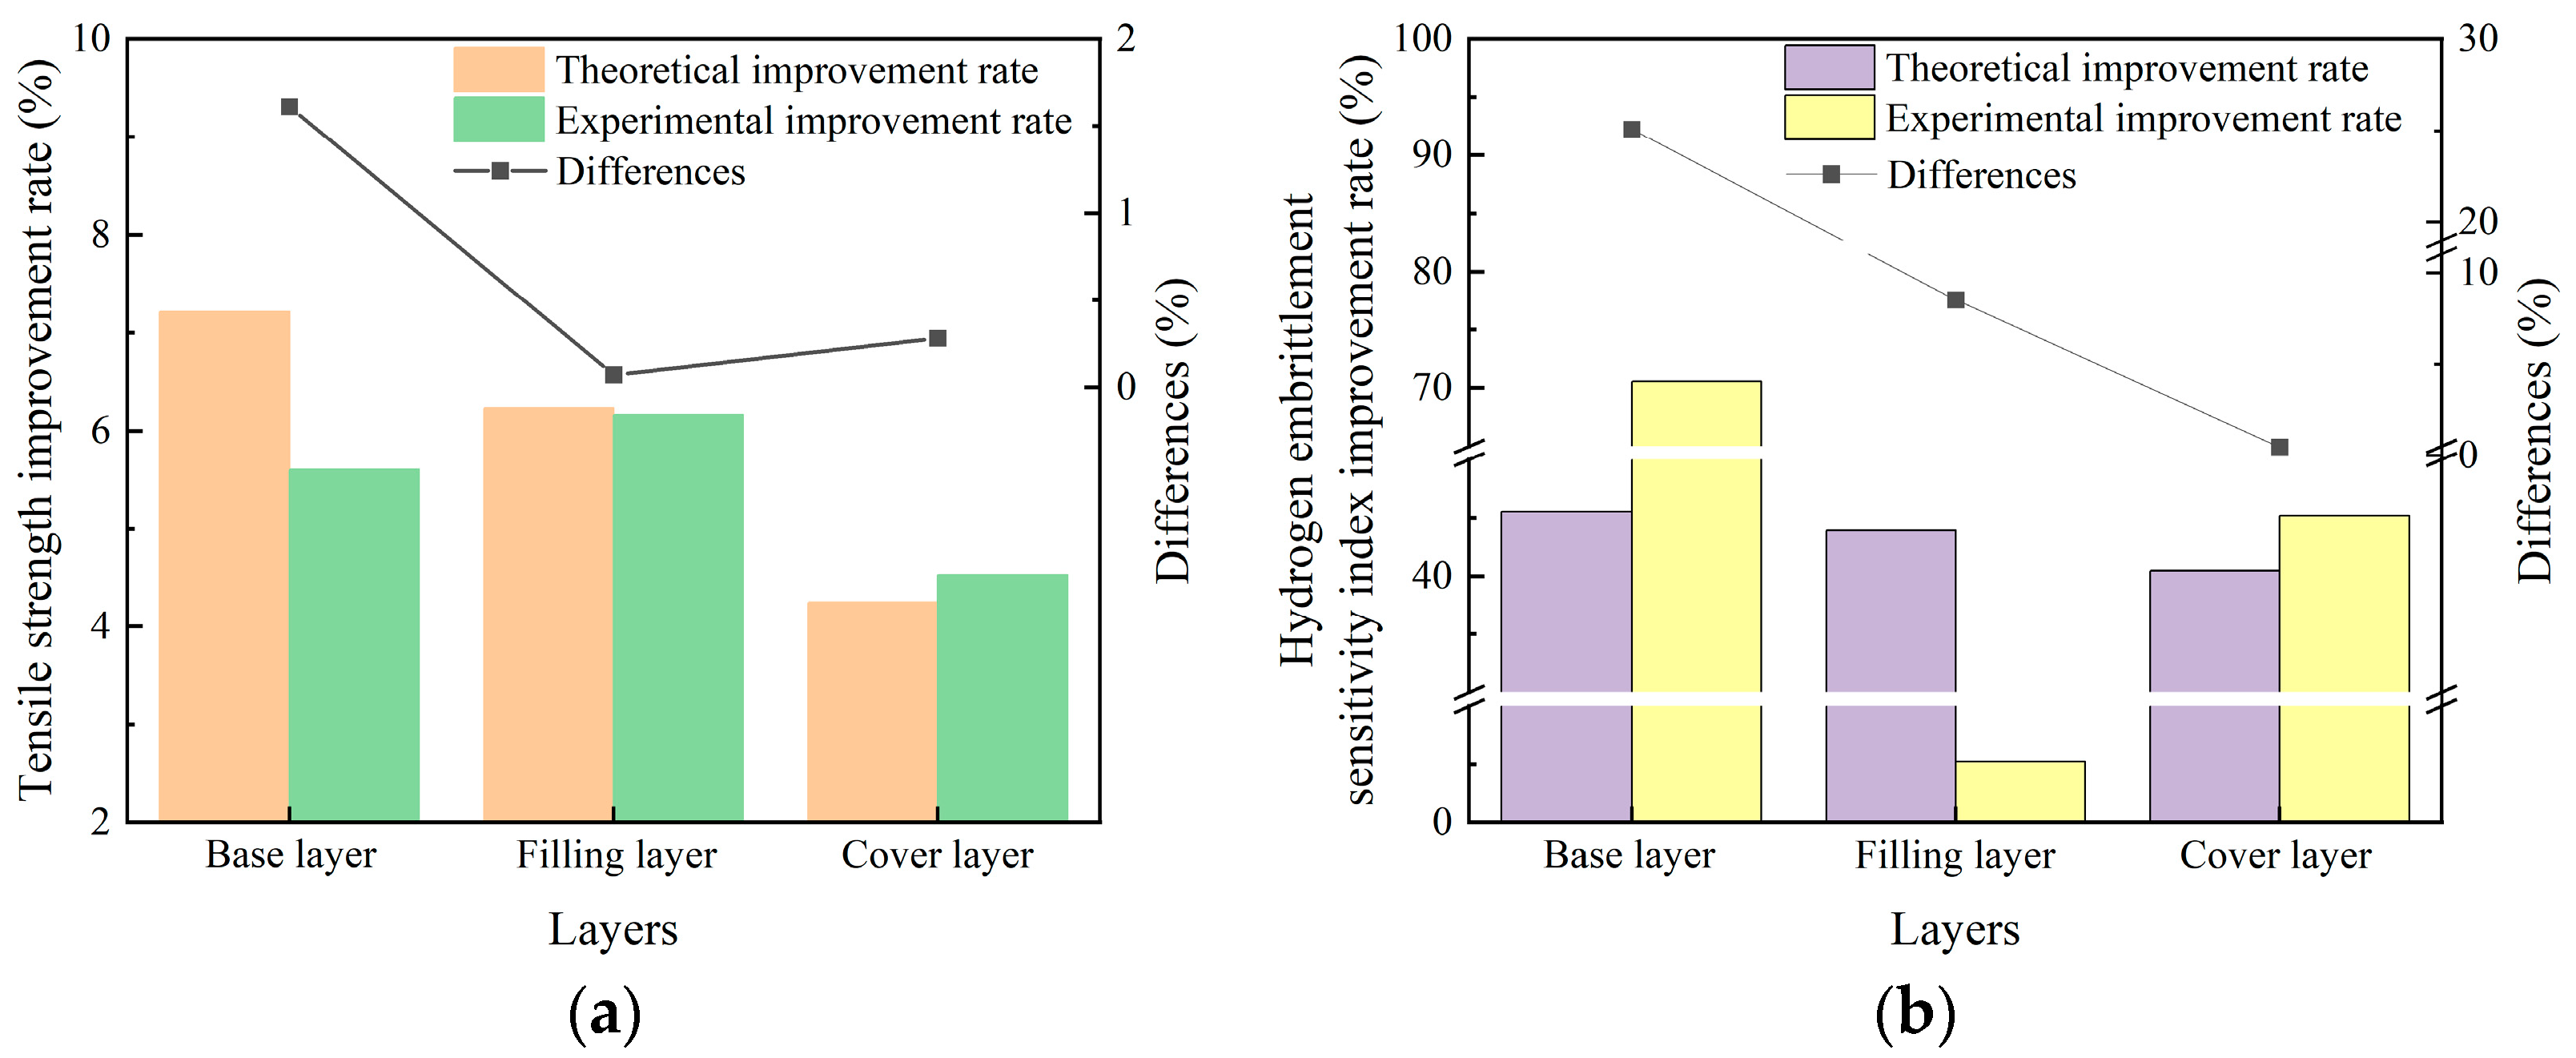
4.3.2. Performance Analysis of Stacked Weld

The tensile strength and hydrogen embrittlement sensitivity index of each weld layer for both the original and optimized stacked weld are presented in Table 16. Compared with the original stacked weld, the optimized stacked weld exhibits significant improvements in both tensile strength and hydrogen embrittlement resistance. Specifically, the tensile strength of the base layer, filling layer and cover layer increases by 5.60%, 6.16% and 4.53%, respectively, while the hydrogen embrittlement resistance improves by 70.56%, 52.40% and 45.16%, respectively. These results demonstrate that the optimized content combination of Si and Mo effectively enhances the tensile strength and hydrogen embrittlement resistance of the weld.
Based on existing data, PANG et al. [38] established a quantitative relationship between fatigue strength and tensile strength which effectively predicts the fatigue strength of various materials, including conventional metals, newly developed alloys and engineering components. When the tensile strength is below 800 MPa, fatigue strength is approximately linearly correlated with the tensile strength. As the tensile strength increases, fatigue strength also increases accordingly. Therefore, the fatigue strength of the base layer, filling layers and cover layer in the optimized stacked weld is expected to improve. Furthermore, as shown in Table 13, the fatigue resistance of the base layer, first filling layer, second filling layer and cover layer increases by 4.26%, 8.24%, 7.29% and 11.01%, respectively. These results confirm that the optimized content combination of Si and Mo can effectively enhance the fatigue resistance of the weld.
According to Table 13, the creep resistance of the filling layer in the optimized stacked weld is improved, while the creep resistance of the base layer and cover layer shows a slight decrease. The element combination for the base layer is 1 wt% Mo and 2 wt% Si, and for the cover layer, it is 1.5 wt% Mo and 1.5 wt% Si. As shown in Figure 5, the minimum creep rate under the interaction of Si and Mo occurs when the Si content is between 1.2 wt% and 1.5 wt% and the Mo content is between 1.4 wt% and 1.5 wt%. Clearly, the compositions added to the base and cover layers fall outside or lie at the edge of this range, leading to a slight reduction in their creep resistance. According to the design principle for assigning weight coefficients to each layer, the filling layer primarily focuses on enhancing creep resistance, while the base and cover layers prioritize hydrogen embrittlement resistance and fatigue resistance, respectively. The optimization results show that the creep resistance of the filling layer has been effectively improved, fulfilling the optimization objective. From a comprehensive performance perspective, the base and cover layers exhibit improvements in tensile strength, hydrogen embrittlement resistance and fatigue resistance. Therefore, a slight decrease in creep resistance is acceptable when balanced against significant gains in other key properties.
A theoretical and experimental error analysis is conducted on the tensile strength and hydrogen embrittlement sensitivity index of the optimized stacked weld. Since only three-layer tensile specimens can be prepared, the data of the first and second filling layers in the optimization results are merged. The theoretical and experimental improvement rates of the tensile strength and hydrogen embrittlement sensitivity index of the optimized stacked weld are calculated, as shown in Figure 10. The results indicate consistent performance improvement trends. It can be seen from Figure 10a that the difference between the theoretical and experimental improvement rates for tensile strength across different weld layers ranges from 0.07% to 1.61%, which is minimal. This demonstrates that the optimization method presented in this study can effectively predict the tensile strength of the weld.
It can be seen from Figure 10b that the differences between the theoretical and experimental improvement rates of the hydrogen embrittlement sensitivity index are 25.05%, 8.49% and 4.70% for the base layer, filling layer and cover layer, respectively. The largest discrepancy occurs in the base layer, primarily because JMatPro software has low sensitivity to hydrogen-induced performance changes, resulting in only minor changes in tensile strength before and after adding hydrogen to the weld. In addition, when welding the filler layer and the cover layer, there is a multiple heat-treatment effect on the base layer, and the software cannot accurately simulate this process. However, the hydrogen embrittlement sensitivity index of the weld decreases gradually from the base layer to the cover layer, and the theoretical and experimental improvement rates follow the same decreasing trend. Therefore, the optimization method proposed in this study can, to a certain extent, predict the hydrogen embrittlement sensitivity index of the weld.

5. Conclusions

To enhance the comprehensive performance of the stacked weld in a hydrogen production reactor, this study employs Si and Mo as reinforcement elements in the welding wire. According to the performance requirements of different weld layers, a gradient performance optimization method for the stacked weld of a hydrogen production reactor based on the response surface methodology (RSM)–genetic algorithm (GA) is proposed. A multi-objective optimization mathematical model is established using the results of the response surface method and exhaustive analysis, and solved using a genetic algorithm. Finally, welding experiments are conducted to verify the accuracy of the optimization results. The main conclusions are as follows:
  • The weld performance of 321 stainless steel under different combinations of Si and Mo content is calculated using JMatPro software. Through analysis of variance, high-precision regression models are established to describe the relationships between element content and tensile strength, hydrogen embrittlement sensitivity, fatigue strain strength and creep rate. These models can accurately predict weld performance. Response surface analysis further confirms that the interaction between Si and Mo has a significant effect on various weld properties.
  • Based on the performance requirements of different weld layers, the exhaustive method is used to determine the optimal weight coefficient combinations for the performance evaluation indices of each weld layer. Combined with the response surface methodology results, a multi-objective optimization mathematical model for the gradient enhancement of the laminated weld is established. This model is solved using a genetic algorithm, yielding the optimal Si and Mo content combinations in the welding wire and the corresponding thickness of each weld layer.
  • Welding experiments are conducted on the stacked welds. The results show that, compared with the original stacked weld, the tensile strength of the base layer, filling layer and cover layer of the optimized weld increases by 5.60%, 6.16% and 4.53%, respectively, while the hydrogen embrittlement resistance improves by 70.56%, 52.40% and 45.16%, respectively. Additionally, the results indirectly confirm that the fatigue resistance and creep resistance of the optimized stacked weld are also enhanced. Overall, the comprehensive performance of the stacked weld meets the optimization objectives. Welding experiments verify the feasibility of the gradient performance optimization method for stacked weld in a hydrogen production reactor, based on the response surface methodology–genetic algorithm proposed in this study.

Author Contributions

Writing—review and editing, Y.L.; writing—original draft preparation, H.G.; methodology, J.Z.; validation, Z.L.; investigation, Z.W.; project management, S.Z. All authors have read and agreed to the published version of the manuscript.

Funding

This research was funded by the National Key R&D Program of China (2020YFA0714403).

Institutional Review Board Statement

Not applicable.

Informed Consent Statement

Not applicable.

Data Availability Statement

The data used to support the findings of this study are available from the corresponding author upon request.

Conflicts of Interest

The authors declare no conflicts of interest.

References

  1. Ahad, M.T.; Bhuiyan, M.M.H.; Sakib, A.N.; Becerril, C.A.; Siddique, Z. An overview of challenges for the future of hydrogen. Materials 2023, 16, 6680. [Google Scholar] [CrossRef] [PubMed]
  2. Xu, X.; Zhou, Q.; Yu, D. The future of hydrogen energy: Bio-hydrogen production technology. Int. J. Hydrogen Energy 2022, 47, 33677–33698. [Google Scholar] [CrossRef]
  3. Zhang, X.; Lu, Y. Hydrogen production by coal gasification in a supercritical water fluidized bed: Dynamic modeling of an industrial-scale reactor. Ind. Eng. Chem. Res. 2022, 61, 16153–16165. [Google Scholar] [CrossRef]
  4. Xie, X.; Wang, X.; Zhao, P.; Hao, Y.; Xie, R.; Liu, H. Learning time-aware multi-phase flow fields in coal-supercritical water fluidized bed reactor with deep learning. Energy 2023, 263, 125907. [Google Scholar] [CrossRef]
  5. Leng, Z.; Zhang, S.; Wang, W.; Gu, H.; Yin, J.; Wang, Z.; Liu, Y. Study on the influence of surface integrity on hydrogen permeation resistance of hydrogen production reactor materials. Appl. Sci. 2023, 13, 10461. [Google Scholar] [CrossRef]
  6. Liu, Y.; Gu, H.; Leng, Z.; Peng, C.; Wang, Z.; Zhang, S. Study on the Optimization of Process Parameters for Submerged Arc Welding of Hydrogen Production Reactor Material. Coatings 2024, 14, 1548. [Google Scholar] [CrossRef]
  7. Zhang, S.; Leng, Z.; Duan, Q.; Gu, H.; Lu, M.; Wang, Z.; Liu, Y. Experimental Determination and Simulation Validation: Johnson-Cook Model Parameters and Grinding Simulation of 06Cr18Ni11Ti Stainless Steel Welds. Machines 2024, 12, 660. [Google Scholar] [CrossRef]
  8. Davoodi, F.; Ashrafizadeh, F.; Atapour, M.; Rikhtehgaran, R. A novel approach for evaluation of load bearing capacity of duplex coatings on aluminum alloy using PLS and SVR models. Trans. Nonferrous Met. Soc. China 2022, 32, 1834–1851. [Google Scholar] [CrossRef]
  9. Lv, M.; Zhang, T.; Sun, W.; Ma, Q.; Shang, Z.; Zhang, J. Research on the optimal Design of the deposited metal alloy system for Welding with Design-Expert Ultra-High Strength steel powder core Welding Wire. Mech. Manuf. Abstr. Weld. Vol. 2020, 2, 7–16+21. [Google Scholar]
  10. Shalimov, M.P.; Votinova, E.B. Optimization of welding electrode coating composition based on simulation of interaction processes in metal-slag-gas system. Mater. Sci. Forum 2016, 870, 593–597. [Google Scholar] [CrossRef]
  11. Jindal, S.; Chhibber, R.; Mehta, N.P. Modeling flux chemistry for submerged arc weldments of high-strength low-alloy steel. Proc. Inst. Mech. Eng. Part B J. Eng. Manuf. 2014, 228, 1259–1272. [Google Scholar] [CrossRef]
  12. Adeyeye, A.D.; Oyawale, F.A. Weld-metal property optimization from flux ingredients through mixture experiments and mathematical programming approach. Mater. Res. 2009, 12, 339–343. [Google Scholar] [CrossRef]
  13. Zhang, L.; Yu, H.; Zeng, X.; Sun, G.; Ding, X.; Sun, Y. Influences of Si-Ti combined alloying on microstructures and properties of laser welded socket joints of molybdenum. Opt. Laser Technol. 2024, 175, 110749. [Google Scholar] [CrossRef]
  14. Li, D.; Liu, M.; Li, G.; Wang, H.; Jiao, L.; Xu, L. Effect of H on Mechanical Properties and Corrosion Resistance of Ferritic/Martensitic Steels with Different Si Contents. J. Mater. Eng. Perform. 2024. [Google Scholar] [CrossRef]
  15. Martin, M.; Weber, S.; Theisen, W.; Michler, T.; Naumann, J. Effect of alloying elements on hydrogen environment embrittlement of AISI type 304 austenitic stainless steel. Int. J. Hydrogen Energy 2011, 36, 15888–15898. [Google Scholar] [CrossRef]
  16. Ohmiya, S.; Fujii, H. Effects of Ni and Cr contents on fatigue crack growth properties of SUS316-based stainless steels in high-pressure gaseous hydrogen. ISIJ Int. 2012, 52, 247–254. [Google Scholar] [CrossRef]
  17. Chen, G.; Zhang, Z.; Feng, S.; Jiang, K.; Yu, J.; Wu, H.; Shi, S.; Lin, Q. Improvement of low-cycle fatigue behavior of modified 9Cr-1Mo steels at 450 C in liquid LBE environment by the addition of Si element. Nucl. Eng. Des. 2023, 413, 112570. [Google Scholar] [CrossRef]
  18. Liu, T.; Chen, L.; Bi, H.; Che, X. Effect of Mo on high-temperature fatigue behavior of 15CrNbTi ferritic stainless steel. Acta Metall. Sin. (Engl. Lett.) 2014, 27, 452–456. [Google Scholar] [CrossRef]
  19. Liu, T.; Zhu, X.; Chen, L.; Bi, H.; Lin, Y.; Long, J. Fatigue-creep behavior of two ferritic stainless steels in simulated automotive exhaust gas and argon. J. Mater. Sci. 2020, 55, 3684–3699. [Google Scholar] [CrossRef]
  20. Lu, C.; Yi, H.; Chen, M.; Xu, Y.; Wang, M.; Hao, X.; Ma, Y. Effects of Si on the stress rupture life and microstructure of a novel austenitic stainless steel. J. Mater. Res. Technol. 2023, 25, 3408–3424. [Google Scholar] [CrossRef]
  21. Zhu, Y.; Kou, J.; Wang, S.; Zhu, Q.; Jiang, L.; Wang, J.; Li, Z. The effects of Si content in ERNiMo-2 deposited metals on deformation and fracture behavior during creep process. Mater. Sci. Eng. A 2025, 923, 147673. [Google Scholar] [CrossRef]
  22. Hirata, S.; Ito, T.; Mitsuhara, M.; Nishida, M. Effect of cold-working and Mo addition on creep behavior in high Mn austenitic stainless steels. Tetsu--Hagane/J. Iron Steel Inst. Jpn. 2015, 101, 51–58. [Google Scholar] [CrossRef]
  23. Zhang, Y.; Zou, D.; Wang, Q.; Zhang, X.; Li, Y. The influence of silicon on the microstructure and properties of ferritic heat-resistant stainless steel. Iron Steel 2021, 56, 71–76+110. [Google Scholar]
  24. Zhang, D.; Ma, D.; Wang, Y.; Xie, Q. The development of flux-cored welding wire for Super duplex stainless steel welding. Weld. Technol. 2022, 51, 78–83. [Google Scholar]
  25. Huang, Y. Research on the Strength, Toughness and Hydrogen Resistance of Weld Metals in Hydrogen-Adjacent Pressure Vessels. Master’s Thesis, Dalian Jiaotong University, Dalian, China, 2023. [Google Scholar]
  26. Chen, Z.; Yu, Y.; Hou, J.; Zhu, P.; Zhang, J. Microstructure and properties of iron-based surfacing layer based on JmatPro software simulation calculation. Vibroeng. Procedia 2023, 50, 180–186. [Google Scholar] [CrossRef]
  27. Su, F.; Wang, D.; Xue, J.; Deng, X.; Gong, Q.; Xia, X.; Shu, D. Data-driven optimization of material composition and casting processes for large ferritic nodular cast iron components in wind turbines. In Proceedings of the International Conference on Materials Engineering and Intelligent Manufacturing, Xiamen, China, 18–20 October 2024. [Google Scholar]
  28. Zhao, Z.; Zhang, P.; Li, S.; Zhang, J.; Shi, W.; Zhang, C.; Zhang, C. Fatigue-creep behaviors of Ni-Fe based superalloy under various testing conditions. J. Mater. Res. Technol. 2021, 15, 4694–4701. [Google Scholar] [CrossRef]
  29. Yang, W. Research on Abnormal Microstructure Analysis and Process Improvement of P355GH Welded Joints after Quenching. Weld. Technol. 2025, 54, 96–100. [Google Scholar]
  30. Ren, D.; Xiao., F.; Tian, P.; Wang, X.; Liao, B. Effects of welding wire composition and welding process on the weld metal toughness of submerged arc welded pipeline steel. Int. J. Miner. Metall. Mater. 2009, 16, 65–70. [Google Scholar] [CrossRef]
  31. Arniella, V.; Álvarez, G.; Belzunce, J.; Rodríguez, C. Hydrogen embrittlement of 2205 duplex stainless steel in in-situ tensile tests. Theor. Appl. Fract. Mech. 2023, 124, 103794. [Google Scholar] [CrossRef]
  32. Gutema, E.; Gopal, M.; Lemu, H. Tribological Study of Multi-Walled Carbon Nanotube-Reinforced Aluminum 7075 Using Response Surface Methodology and Multi-Objective Genetic Algorithm. J. Compos. Sci. 2025, 9, 137. [Google Scholar] [CrossRef]
  33. Al-Sabur, R. Tensile strength prediction of aluminium alloys welded by FSW using response surface methodology-Comparative review. Mater. Today Proc. 2021, 45, 4504–4510. [Google Scholar] [CrossRef]
  34. Ahmadi, A.; Rezaei, M.; Sadeghieh, S.M. Interaction effects of flotation reagents for SAG mill reject of copper sulphide ore using response surface methodology. Trans. Nonferrous Met. Soc. China 2021, 31, 792–806. [Google Scholar] [CrossRef]
  35. Sreenivasan, K.; Kumar, S.; Katiravan, J. Genetic algorithm based optimization of friction welding process parameters on AA7075-SiC composite. Eng. Sci. Technol. Int. J. 2019, 22, 1136–1148. [Google Scholar] [CrossRef]
  36. Geng, D.; Lan, X.; He, H.; Liu, C. Welding quality inspection method based on genetic algorithm to optimize BP neural network. In Proceedings of the IEEE 2nd International Conference on Big Data, Artificial Intelligence and Internet of Things Engineering, Nanchang, China, 26–28 March 2021. [Google Scholar]
  37. ISO 9692–2: 2024; Welding and Allied Processes-Joint Preparation-Part 2: Submerged arc Welding of Steels. ISO: Geneva, Switzerland, 2016.
  38. Pang, J.; Li, S.; Wang, Z.; Zhang, Z. Relations between fatigue strength and other mechanical properties of metallic materials. Fatigue Fract. Eng. Mater. Struct. 2014, 37, 958–976. [Google Scholar] [CrossRef]
Figure 1. Prediction results of weld properties under different element content combinations. (a) tensile strength; (b) hydrogen embrittlement sensitivity index; (c) fatigue strain strength; (d) creep rate.
Coatings 15 00889 g001
Figure 2. Variation trend of tensile strength under interaction of Si and Mo content. (a) Response surface; (b) contour plots.
Coatings 15 00889 g002
Figure 3. Variation trend of hydrogen embrittlement sensitivity index under interaction of Si and Mo contents. (a) Response surface; (b) contour plots.
Coatings 15 00889 g003
Figure 4. Variation trend of fatigue strain strength under interaction of Si and Mo contents. (a) Response surface; (b) contour plots.
Coatings 15 00889 g004
Figure 5. Variation trend of creep rate under interaction of Si and Mo contents. (a) Response surface. (b) contour plots.
Coatings 15 00889 g005
Figure 6. The extreme value of all weight combinations.
Coatings 15 00889 g006
Figure 7. Iterative graphs of fitness values for genetic algorithm and particle swarm optimization algorithm.
Coatings 15 00889 g007
Figure 8. (a) Welding equipment; (b) stacked weld; (c) stacked weld cross-section.
Coatings 15 00889 g008
Figure 9. (a) Tensile specimen; (b) electrochemical hydrogen charging setup.
Coatings 15 00889 g009
Figure 10. (a) Tensile strength improvement rate; (b) hydrogen embrittlement sensitivity index improvement rate.
Coatings 15 00889 g010
Table 1. Chemical composition of 321 stainless steel.
Chemical CompositionCSiMnNiCrTiPS
Weight/(wt%)≤0.08≤1.00≤2.009~1217~190.4~0.7≤0.045≤0.03
Table 2. Chemical composition of GWS-347 welding wire.
Chemical CompositionCMnSiCrNiMoPS
Weight/(wt%)0.0381.720.6119.710.60.0070.0230.001
Table 3. Chemical composition of GWS-347 welding wire deposited metal.
Chemical CompositionCMnSiCrNiMoPS
Weight/(wt%)0.0471.400.7519.59.80.0220.0250.003
Table 4. Factor-level table.
FactorsLevels
123456
Mo/(wt%)0.50.70.91.11.31.5
Si/(wt%)1.01.21.41.61.82.0
Table 5. Full factorial experimental design table.
No.Content
Combinations
No.Content CombinationsNo.Content CombinationsNo.Content Combinations
Mo/(wt%)Si/(wt%)Mo/(wt%)Si/(wt%)Mo/(wt%)Si/(wt%)Mo/(wt%)Si/(wt%)
10.51.0100.71.6191.11.0281.31.6
20.51.2110.71.8201.11.2291.31.8
30.51.4120.72.0211.11.4301.32.0
40.51.6130.91.0221.11.6311.51.0
50.51.8140.91.2231.11.8321.51.2
60.52.0150.91.4241.12.0331.51.4
70.71.0160.91.6251.31.0341.51.6
80.71.2170.91.8261.31.2351.51.8
90.71.4180.92.0271.31.4361.52.0
Table 6. Performance of original 321 stainless steel weld.
Tensile Strength
/(MPa)
Hydrogen Embrittlement
Sensitivity Index/(%)
Fatigue Strain Strength
/(%)
Creep Rate
/(10−11s−1)
696.063.120.18802.58
Table 7. ANOVA results of tensile strength regression model.
SourceSum of SquaresDegrees of FreedomMean SquareF-Valuep-Value
Model2.014 × 1052010,071.395.900.0005
Mo (xMo)5008.8315008.832.940.1072
Si (xSi)15,838.25115,838.259.280.0082
xMo xSi1689.4511689.450.99040.3354
xMo23341.2713341.271.960.1820
xSi21457.4711457.470.85440.3699
xMo2 xSi16,689.70116,689.709.780.0069
xMo xSi2750.221750.220.43980.5173
xMo380.75180.750.04730.8307
xSi3742.961742.960.43550.5193
xMo2 xSi22140.212140.212.550.0030
xMo3 xSi2514.6912514.691.470.2435
xMo xSi39489.7619489.765.560.0323
xMo417,528.74117,528.7410.280.0059
xSi415.19115.190.00890.9261
xMo3 xSi21667.311667.30.97740.3385
xMo2 xSi34403.3214403.322.580.1290
xMo4 xSi10,427.69110,427.696.110.0259
xMo xSi41469.3411469.340.86140.3681
xMo5114.441114.440.06710.7991
xSi50.554310.55430.00030.9859
Residual25,587.35151705.82
Cor Total2.270 × 10535
R2 = 0.9273
Table 8. ANOVA results of hydrogen embrittlement sensitivity index regression model.
SourceSum of SquaresDegrees of FreedomMean SquareF-Valuep-Value
Model0.2390200.011913.01<0.0001
Mo (xMo)0.001610.00166.490.0367
Si (xSi)0.000210.00023.760.4874
xMo xSi0.000010.00001.750.8038
xMo20.025610.025617.40<0.0001
xSi20.000110.00011.510.5052
xMo2 xSi0.000210.00021.840.4822
xMo xSi20.000110.00011.820.5370
xMo30.013110.013127.44<0.0001
xSi30.000310.00030.07670.3443
xMo2 xSi20.000010.00002.280.8560
xMo3 xSi0.011410.011414.92<0.0001
xMo xSi30.009910.00994.48<0.0001
xMo40.012010.012010.46<0.0001
xSi40.001110.00110.70760.0769
xMo3 xSi20.001210.00120.03050.0659
xMo2 xSi30.001410.00142.500.0493
xMo4 xSi0.000810.00080.02310.1175
xMo xSi40.000710.00070.30540.1387
xMo50.017610.017631.08<0.0001
xSi50.000110.00010.05970.5385
Residual0.0045150.0045
Cor Total0.243435
R2 = 0.9817
Table 9. ANOVA results of fatigue strain strength regression model.
SourceSum of SquaresDegrees of FreedomMean SquareF-Valuep-Value
Model0.0207200.00105.070.0039
Mo (xMo)0.000110.00010.27610.6069
Si (xSi)1.759 × 10−811.759 × 10−80.00010.9935
xMo xSi0.000310.00031.080.3146
xMo20.000310.00031.050.3227
xSi20.000010.00000.06280.8056
xMo2 xSi0.001310.00135.120.0389
xMo xSi28.088 × 10−618.088 × 10−60.03190.8607
xMo30.000110.00010.27540.6074
xSi30.000210.00020.67070.4256
xMo2 xSi20.000910.00093.610.0769
xMo3 xSi0.000010.00000.08610.7732
xMo xSi30.000510.00051.780.2015
xMo40.000310.00031.230.2856
xSi43.449 × 10−613.449 × 10−60.01360.9088
xMo3 xSi20.001210.00124.770.0453
xMo2 xSi30.000210.00020.59590.4521
xMo4 xSi0.003210.003212.670.0029
xMo xSi40.000210.00020.92340.3518
xMo50.000110.00010.29980.5920
xSi50.000310.00031.090.3129
Residual0.0038150.0003
Cor Total0.024535
R2 = 0.9045
Table 10. ANOVA results of creep rate regression model.
SourceSum of SquaresDegrees of FreedomMean SquareF-Valuep-Value
Model2.09200.104613.54<0.0001
Mo (xMo)0.058310.05837.560.0149
Si (xSi)0.001310.00130.16260.6925
xMo xSi0.026910.02693.490.0816
xMo20.000210.00020.02450.8777
xSi20.000210.00020.02340.8806
xMo2 xSi0.043610.04365.650.0312
xMo xSi20.007710.00770.99090.3353
xMo30.007710.00770.99310.3348
xSi30.000910.00090.11980.7340
xMo2 xSi20.239310.239330.99<0.0001
xMo3 xSi0.105310.105313.630.0022
xMo xSi30.000310.00030.04030.8436
xMo40.000110.00010.01510.9038
xSi40.004610.00460.59690.4518
xMo3 xSi20.013910.01391.800.1999
xMo2 xSi30.003010.00300.38560.5439
xMo4 xSi0.007410.00740.95410.3442
xMo xSi40.005010.00500.65140.4322
xMo50.003410.00340.44520.5147
xSi50.000810.00080.10360.7520
Residual0.1158150.0077
Cor Total2.2135
R2 = 0.9475
Table 11. Weight coefficient combination of each layer of stacked weld.
LayersWeight Coefficient
Tensile StrengthHydrogen
Embrittlement
Sensitivity Index
Fatigue Strain StrengthCreep Rate
Base layer0.50.30.10.1
First filling layer0.50.20.10.2
Second filling layer0.40.10.20.3
Cover layer0.50.10.30.1
Table 12. Stacked weld optimization results.
LayersMo/(wt%)Si/(wt%)Thickness/(mm)
Base layer1.02.01.8
First filling layer1.21.82.9
Second filling layer1.41.62.5
Cover layer1.51.52.8
Table 13. Optimized stacked weld performance.
LayersTensile Strength
/(MPa)
Hydrogen Embrittlement
Sensitivity Index/(%)
Fatigue Strain Strength
/(%)
Creep Rate
/(10−11s−1)
Base layer746.281.700.19052.66
First filling layer741.681.720.20352.56
Second filling layer737.201.780.20172.53
Cover layer725.641.870.20872.64
Table 14. The improvement rates of each performance metric for the optimized stacked weld.
LayersTensile StrengthHydrogen embrittlement
Resistance
Fatigue ResistanceCreep Resistance
Base layer7.21%45.51%4.26%−3.10%
First filling layer6.55%44.87%8.24%0.78%
Second filling layer5.91%42.95%7.29%1.94%
Cover layer4.25%40.06%11.01%−2.33%
Table 15. Welding parameters of stacked weld.
LayersWelding Current/(A)Welding Voltage/(V)Welding Speed/(cm/min)
Base layer4403038
Filling layer4703240
Cover layer4203034
Table 16. Performance of original and optimized stacked welds.
LayersOptimized Stacked WeldOriginal Stacked Weld
Tensile Strength
/(MPa)
Hydrogen Embrittlement
Sensitivity Index/(%)
Tensile Strength
/(MPa)
Hydrogen Embrittlement
Sensitivity Index/(%)
Base layer718.20.63680.12.14
Filling layer697.20.99656.72.08
Cover layer680.91.36651.42.48
Disclaimer/Publisher’s Note: The statements, opinions and data contained in all publications are solely those of the individual author(s) and contributor(s) and not of MDPI and/or the editor(s). MDPI and/or the editor(s) disclaim responsibility for any injury to people or property resulting from any ideas, methods, instructions or products referred to in the content.

