Abstract
The inferior electrical conductivity and elevated hardness of AgSnO2 electrical contact materials have impeded their development. To investigate the effects of Co, Bi, and La doping on the stability and electrical properties of AgSnO2, this study established interfacial models of doped AgSnO2 based on first-principles calculations initiated from the atomic structures of constituent materials, subsequently computing electronic structure parameters. The results indicate that doping effectively enhances the interfacial stability and bonding strength of AgSnO2 and thereby predicted improved electrical contact performance. Doped SnO2 powders were prepared experimentally using the sol–gel method, and AgSnO2 contacts were fabricated using high-energy ball milling and powder metallurgy. Testing of wettability and electrical contact properties revealed reductions in arc energy, arcing time, contact resistance, and welding force post-doping. Three-dimensional profilometry and scanning electron microscopy (SEM) were employed to characterize electrical contact surfaces, elucidating the arc erosion mechanism of AgSnO2 contact materials. Among the doped variants, La-doped electrical contact materials exhibited optimal performance (the lowest interfacial energy was 1.383 eV/Å2 and wetting angle was 75.6°). The mutual validation of experiments and simulations confirms the feasibility of the theoretical calculation method. This study provides a novel theoretical method for enhancing the performance of AgSnO2 electrical contact materials.
1. Introduction
Electrical contacts constitute pivotal components within electrical apparatuses, governing circuit switching and current transmission, directly affecting the operational reliability, stability, and service life of electrical systems. AgCdO materials, designated as “universal contacts” [1,2], find extensive application in high- and low-voltage switching devices. However, the toxicity of Cd has driven the development of alternative materials, with AgSnO2 emerging as a preeminent successor. Following the incorporation of diverse trace additives, AgSnO2 demonstrates exceptional anti-welding properties [3], augmented thermal stability, and prolonged service life [4,5]. Notwithstanding these merits, inherent limitations persist, including suboptimal wettability, deficient conductivity, and elevated contact resistance [6,7], leading researchers worldwide to pursue optimization efforts in various directions.
Another important direction in current electrical contact material research is silver conservation. The majority of silver resources consumed in the field of electrical and electronic engineering are used for manufacturing low-voltage electrical contacts [8]. The demand for low-cost contact materials is closely related to the development of silver-saving technologies. Reducing silver content not only lowers production costs but also promotes sustainable development.
Research indicates that certain additives markedly enhance the wettability of AgSnO2 contacts, reduce contact resistance and thermal instability, and improve mechanical properties [9,10]. Li et al. [11] demonstrated that the addition of Ni reduces the evaporation and decomposition of SnO2, significantly improving resistance to arc corrosion. Yang et al. [12] found that within the doping range of 0–3 wt% La2O3, higher La2O3 content leads to lower density in Ag-SnO2-La2O3 electrical contact materials. Liu et al. [13] established that larger-sized ITO (Indium Tin Oxide) reinforcement phases can improve mechanical properties such as density and tensile strength. Wang et al. [14] ascertained that using TiO2 as an additive for contact materials enhances wettability and electrical contact performance.
Metals and oxides are two types of materials with fundamentally disparate chemical bonding properties, manifesting substantial divergences in crystal structure and related characteristics [15]. Within the AgSnO2 composite matrix, the interfacial properties between Ag and SnO2 are crucial. This study selected Co, Bi, and La for doping modification of AgSnO2 electrical contact materials. The combined approach of first-principles simulation and experimental analysis was employed to investigate the electrical and arc erosion performance of doped AgSnO2 electrical contact materials. Initially, the interfacial electronic structure and energy of AgSnO2 were calculated using the first-principles method based on density functional theory (DFT), predicting material wettability and electrical contact performance. Subsequently, doped AgSnO2 electrical contact samples were experimentally prepared to obtain material properties such as wettability. X-ray diffraction experiments were conducted to verify the match between the prepared samples and the simulated models. Finally, the electrical contact characteristics were analyzed post-experiment to validate the accuracy of the simulation results. Additionally, a three-dimensional profilometer was used to scan and analyze the surface morphology of the electrical contacts. Contrasted to conventional unit cell models, the AgSnO2 interface model constructed in this study accurately reflects complex phenomena such as atomic arrangement and charge transfer at the interface. Investigating the electronic structure and interfacial stability at the AgSnO2 interface provides new insights for designing AgSnO2 electrical contact materials with high stability and excellent electrical performance.
2. Methods
2.1. Interface Model Construction and Parameter Settings
Owing to the near immiscibility of Ag and SnO2 in the solid state within AgSnO2 alloys and the dominance of interfacial bonding strength on material performance, this study proposes constructing an AgSnO2 interface model for performance simulation. Initially, the structures of pure Ag and SnO2 unit cells were optimized to obtain the stable structure with the lowest energy. Based on the optimized unit cell models, the Ag(111) and SnO2(100) free surfaces with the largest absolute binding energy [16] were selected to construct 9-layer and 10-layer Ag surfaces and a 6-layer SnO2 surface, respectively. Ref. [17] indicates that reducing Ag content increases the hardness of AgSnO2 contact materials while decreasing conductivity and density. To explore the feasibility of silver reduction under doping conditions, the mass ratio of Ag to SnO2 was set to 88%:12% for the undoped system, and the mass ratio of Ag to SnO2-X was set to 85.5%:14.5% for doped systems. After calculation and matching analysis, a 1 × 3 × 1 Ag(111) surface model and a 1 × 3 × 1 SnO2(100) surface model were constructed without applying any strain to meet the requirements of mismatch less than 10% and SnO2 mass percentages of 12% (undoped) or 14.5% (doped). A 6-layer SnO2(100) slab with a 10-layer Ag(111) slab was used to build the AgSnO2(12) interface model, while a 6-layer SnO2(100) slab combined with a 9-layer Ag(111) slab was used for the AgSnO2(14.5) interface model. Convergence testing of the interface spacing determined that a spacing of 2.2 Å minimized the system energy. A 15 Å vacuum layer was added along the z-direction to avoid periodic boundary effects. Figure 1 shows the undoped, Co-doped, Bi-doped, and La-doped AgSnO2 interface models.
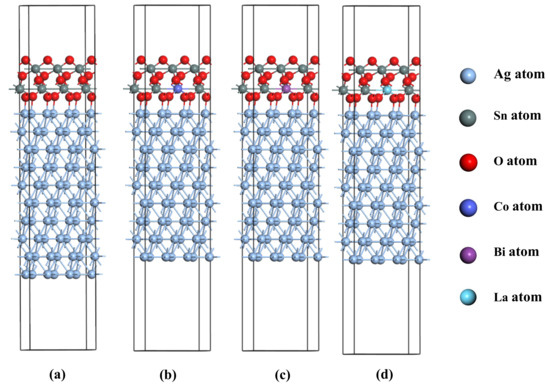
Figure 1.
Interface model: (a) AgSnO2; (b) AgSnO2-Co; (c) AgSnO2-Bi; (d) AgSnO2-La.
Simulations were performed in reciprocal space using the CASTEP module within Materials Studio 2020 software. Ultrasoft pseudopotentials were used to describe the interaction between valence electrons and ionic cores [18]. The exchange-correlation energy was approximated using the PBE (Perdew–Burke–Ernzerhof) functional within the Generalized Gradient Approximation (GGA) [19]. The BFGS (Broyden–Fletcher–Goldfarb–Shanno) algorithm was used for geometry optimization of the interface models. Calculation parameters were set as follows: The cutoff energy in reciprocal space and k-points in the Brillouin zone were selected. Self-consistent field (SCF) convergence criterion for total energy was <1.0 × 10⁻⁵ eV/atom; atomic forces were converged below 0.5 eV/nm; displacement tolerance was <0.02 nm; and maximum stress deviation was 0.1 GPa. Cutoff energy and k-points were determined through convergence testing. The parameter settings are listed in Table 1. The valence electron configurations considered in the calculations are Ag: 4d105s1, Sn: 5s25p2, O:2s22p4, Co: 3d74s2, Bi: 6s26p3, and La: 5s25p65d16s2.

Table 1.
Calculation parameter settings.
2.2. AgSnO2 Samples Preparation
Dopant elements were incorporated into SnO2 unit cell via sol–gel methodology [20]. To match the atomic substitution doping model used in the simulation, sol–gel synthesis was employed to prepare SnO2 powders doped with Co, Bi, and La. Tin tetrachloride (SnCl4) was used as the raw material for preparing SnO2 powder, with lanthanum chloride (LaCl3), cobalt chloride (CoCl2), and bismuth chloride (BiCl3) as additives. An ethanol-distilled water solution was prepared by mixing anhydrous ethanol and distilled water as the solvent. Weak alkaline ammonia water (NH3·H2O) was used as the precipitant. Polyethylene glycol 400 (PEG-400) was used as the dispersant. The core steps involve the following: (1) dispersing metal salts in a solvent to form a homogeneous solution; (2) forming a sol through hydrolysis and polycondensation reactions; (3) aging the sol to allow colloidal particle aggregation forming a non-flowing gel; and (4) finally obtaining the target powder through evaporation, drying, and sintering. The preparation process flow is shown in Figure 2.
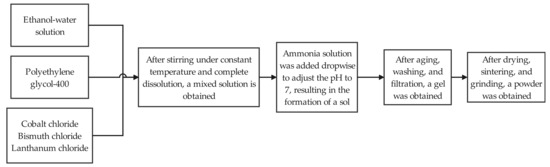
Figure 2.
Preparation process of sol–gel method.
The mass of each electrical contact sample prepared in this experiment was 10 g. The mass ratios and atomic ratios of the main components are listed in Table 2. Powder metallurgy was employed to fabricate the electrical contact samples. Firstly, silver powder and the sol–gel prepared doped SnO2 powder were weighed according to Table 2 ratios and thoroughly mixed using a high-energy ball mill. The mixed powder underwent processes including initial pressing, primary sintering, re-pressing, secondary sintering, and final re-pressing. A 769YP-60E (Tianjin KEQI High & New Technology Corpoartion, Tianjin, China) powder tablet press was used for initial pressing and re-pressing, with an initial pressure of 10 MPa (17.6 T), holding for 15 min, and re-pressing pressure of 20 MPa (35.2 T), holding for 15 min. Sintering was conducted in a SKGL 1200C (Shanghai Jvjing Precision Instrument Manufacturing Co., Ltd., Shanghai, China) vacuum tube furnace, with the primary sintering temperature set at 500 °C, holding time 120 min, and secondary sintering temperature set at 800 °C, holding time 120 min. Subsequently, the samples were ground and polished, and finally wire-cut to produce electrical contacts with a diameter of 3.2 mm and a thickness of 2.5 mm. The preparation process for the electrical contact samples is depicted in Figure 3.
Table 2.
Main raw material ratios.
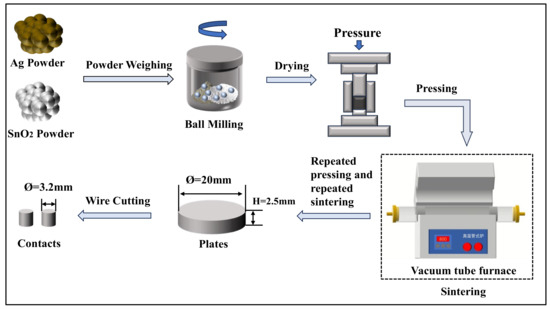
Figure 3.
Flowchart for the preparation of AgSnO2 electrical contact samples.
3. Results and Discussion
3.1. Simulation Results
Following geometric optimization of the undoped and doped AgSnO2 interface models, energy and electronic structure properties were systematically computed to analyze interfacial bonding strength and stability.
3.1.1. Interfacial Bonding Strength and Wettability Prediction
The work of separation (Wsep) evaluates interfacial bonding strength [21]. It represents the minimum energy required to separate the two-phase interface into free surfaces. A positive value indicates stability, and a larger value signifies stronger interfacial bonding forces and higher interfacial bonding strength. The Wsep for AgSnO2 is expressed as Equation (1):
where is the energy of the Ag surface within the AgSnO2 interface model, ESnO2 is the energy of the SnO2 surface within the AgSnO2 interface model, EAgSnO2 is the total energy of the AgSnO2 interface model, and S is the interfacial area.
Interfacial energy () reflects the energy change due to atomic distortion, chemical bond alteration, and structural strain during interface formation, used to assess interfacial stability [22]. A positive value indicates stability; a smaller value signifies higher stability. The for AgSnO2 is expressed as Equation (2):
where is the surface energy of the free Ag surface, is the surface energy of the free SnO2 surface, and Wsep is the interfacial separation work at the AgSnO2 interface.
The calculated Wsep and γint for all systems are listed in Table 3. Both values are positive, confirming the stability of the constructed interface models. The interfacial energies in Table 3 show that Co-, Bi-, and La-doped systems have lower γint than the undoped system, indicating that doping enhances the bonding force between interfacial atoms, increases interfacial bonding strength, and thereby enhances interfacial stability. The interfacial work of separation and interfacial energy of the undoped AgSnO2 interface model are 0.119 eV/Å2 and 1.784 eV/Å2. La doping exhibits the highest Wsep (0.149 eV/Å2) and the lowest γint (1.383 eV/Å2), indicating its optimal interfacial stability. Low interfacial energy means stronger interfacial bonding ability and better wettability. Strong interfacial bonding facilitates the formation of a continuous and uniform metal film, reducing local current concentration. This helps the current to distribute evenly throughout the contact area, reducing arc erosion. Good wettability allows more SnO2 particles to uniformly disperse into the Ag melt pool under arc action, forming a stable AgSnO2 alloy, thereby lowering electrical contact resistance and improving arc performance. Differences in atomic radius and electronegativity between the dopant atoms and SnO2 unit cell properties lead to lattice distortion at the AgSnO2 interface upon doping, consequently affecting interfacial stability. Interfacial bonding strength can predict wettability; higher interfacial bonding strength corresponds to better wettability. La doping resulted in the highest interfacial bonding strength, and simulations predict that La doping provides the best wettability.
Table 3.
Interfacial separation work and interfacial energy.
3.1.2. Density of States (DOS) Analysis
DOS analysis reveals the interaction between dopant atoms and other atoms and the bonding mechanism within the crystal [23]. The total density of states (TDOS) reflects the energy distribution of all electrons in the system, while the partial density of states (PDOS) describes the bonding characteristics of electrons in different orbitals. As shown in Figure 4a, undoped AgSnO2 exhibits high electronic density near the Fermi level, indicating good conductivity. The conduction band is primarily contributed by Sn atomic orbitals, while the valence band is formed by the combined action of Ag, Sn, and O atomic orbitals. The peak of −18 to −15 eV originates from the bonding orbitals of O-s and Sn. The peak in the range of −8 to 0 eV arises from the bonding orbitals of Ag-d, O-p, and Sn atoms. Within the −4 eV to −2 eV range, significant overlapping peaks are observed for Ag-d,O-p and Sn-p orbitals. The hybridization intensity reflects the formation of metallic bonds, and the strength of hybridization is positively correlated with bond stability.
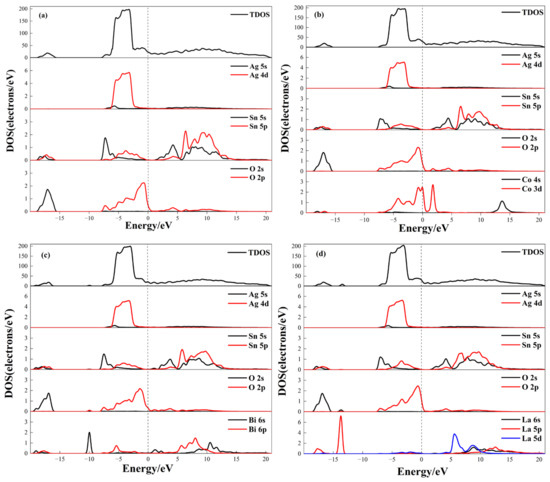
Figure 4.
Density of states of doped AgSnO2: (a) AgSnO2; (b) AgSnO2-Co; (c) AgSnO2-Bi; (d) AgSnO2-La.
For doped systems, Co doping enhances the O-2p electronic states. In the range of −8 eV–0 eV, new orbitals contributed by Co-d appear. Hybridization between Co-d orbitals and the matrix increases the electronic density of states near the Fermi level. The valence band extends across the Fermi level, and the increased number of carriers in the Co-doped system indicates more carriers participating in conduction, thereby improving overall electrical performance. Multiple hybridizations among Ag-d, Co-d, O-p, and Sn-p orbitals within the −4 eV to −2 eV range further enhance interatomic bonding, strengthening the metallic bonds. Peaks in the 0 eV–20 eV range mainly originate from the bonding orbitals of Sn and Co elements. Bi doping accentuated the interaction between Sn 5s/5p orbitals, promoting hybridization between Bi-s and O-p orbitals to form deep-level states, increasing lattice covalency. In Figure 4c, peaks of DOS within the −6 eV to −2 eV region are mainly contributed by hybridization of Bi-p, Ag-d, and Sn-p orbitals. Bi-p orbitals form extended states at the bottom of the conduction band, hybridizing with Sn-s and O-p orbitals, broadening the conduction band width, increasing the electron density at the bottom of the conduction band, and consequently affecting the material conductivity. In the 0 eV–20 eV region, peaks mainly originate from O-p orbitals and bonding orbitals of Sn and Bi elements. The La-doped system manifested the most optimized electronic structure: TDOS peak intensity increased; Ag atomic DOS in the valence band shifted towards lower energy; and with elevated electronic density at the Fermi level. Vigorous hybridization between La-p and O-p orbitals in the valence band established deep-level states, effectively inhibiting Sn-O bond breakage and enhancing conductivity. Between −6 eV and 0 eV, La-p and La-d orbitals hybridize pairwise with Ag-d, Sn-p, and O-p orbitals to form bonding orbitals. Additionally, the combined action of La-s, p, and d orbitals forms a complex band structure, further optimizing carrier transport paths and augmenting electrical performance. Distinct doping elements reconstruct interfacial bonding through orbital hybridization: Co strengthens metallic bonding, Bi enhances covalent characteristics, while La achieves conduction band structure extension through multi-orbital synergy, providing theoretical support at the electronic level for improving the electrical contact performance of AgSnO2. In the 0 eV–20 eV region, peaks mainly originate from O-p orbitals and bonding orbitals of Sn and La elements.
3.1.3. Mulliken Population Electronic Structure Analysis
Interfacial bonding strength and stability are ultimately determined by electronic structure characteristics, which influence material performance. Mulliken population analysis was performed to quantitatively describe bond strength [24], with bond strength judged based on the numerical values.
Charge population characterizes electron transfer between atoms. A positive value indicates an atom is prone to losing electrons, while a negative value indicates a tendency to gain electrons. A larger absolute value signifies a stronger ability to lose or gain electrons. The simulated charge population values in Table 4 show that the ability of atoms to lose or gain electrons changes after doping with different elements. In the undoped AgSnO2 system, Ag and Sn atoms displayed positive charge populations, while O atoms exhibited strong negative charge characteristics, confirming significant charge transfer phenomena in the interfacial region. Co, Bi, and La atoms possessed positive charge populations, indicating their role as electron donors participating in interfacial electronic reconstruction. Co doping intensified the electron-gaining ability of O and the electron-losing ability of Ag. Bi doping partially weakens the electron gain/loss abilities of O and Sn. La doping enhances the electron-losing ability of Ag and Sn and the electron-gaining ability of O, strengthening interatomic interactions. Electron transfer phenomena at the AgSnO2 interface are most pronounced in the La-doped case, favoring enhanced interfacial bonding stability, thereby improving material wettability and electrical contact performance.
Table 4.
Mulliken charge population of undoped and doped AgSnO2.
Bond overlap population reflects the nature of bonding between atoms. Larger absolute values signify greater overlap of electron clouds, stronger bonding capability, and more stable chemical bonds [25]. The simulation calculated bond overlap population values in Table 5 show that the Ag-O and O-Sn bonds in the AgSnO2 interface model have population values greater than zero, indicating a certain degree of covalency. Calculations based on the interface model reveal, from an electronic structure perspective, that Ag-O and O-Sn chemical bonds may form at the Ag/SnO2 interface at the atomic scale, despite near insolubility at room temperature, which is beneficial for enhancing AgSnO2 interfacial stability. This phenomenon arises because the structure in the interfacial region between Ag and SnO2 differs significantly from the crystal structures of elemental Ag or SnO2, and there are numerous unsaturated bonding sites in the two-phase region, making the formation of these chemical bonds possible at the atomic scale. Bonds form between the dopant atoms and O atoms, strengthening the bonding strength at the AgSnO2 interface. After Co doping, the O-Sn and O-O bond populations increased, enhancing the ionic character of the O-O bonds, and the degree of electron transfer between atoms increased. Post-La doping, all bond population values elevated, indicating strengthened bonding capability. The synergistic hybridization effect of La potentiated the electronic interactions between atoms, corroborating its optimal effect on enhancing interfacial stability.
Table 5.
Bond populations and average values of undoped and doped AgSnO2.
3.2. Experimental Results
To validate the reliability of the simulation results, this study systematically conducted experiments on the performance characterization of doped AgSnO2 contact materials.
3.2.1. X-Ray Diffraction (XRD) Experiment
The phase structure of the samples was analyzed using a Bruker D8 DISCOVER X-ray diffractometer (Cu Kα radiation, λ = 0.15405 nm). Testing conditions were as follows: scanning range 10°–90°, scanning speed 6°/min, and power 4 kW. If the main diffraction peak positions in the XRD spectra of doped AgSnO2 contacts coincide with those of the undoped sample and no new diffraction peaks appear [26], it indicates that the dopant elements have entered the SnO2 unit cell via substitution, consistent with the simulated interface model. The XRD results, shown in Figure 5, indicate that the XRD pattern of undoped AgSnO2 electrical contact material mainly includes eight distinct diffraction peaks, among which 26.70°, 33.98°, and 51.86° are phase peaks of SnO2, and 38.20°, 44.36°, 64.48°, 77.42°, and 81.58° are phase peaks of Ag. The XRD patterns of the doped AgSnO2 materials illustrate that the diffraction peak positions remain essentially unchanged compared to the undoped material, with only slight deviations in diffraction angle after doping, primarily attributed to lattice distortion induced by doping. This corresponds to the change in lattice constant caused by the difference in atomic radius of dopant atoms in the simulation. Furthermore, no new diffraction peaks are observed in the XRD patterns before and after doping, indicating that doping did not introduce other substances or generate new phases. This confirms the successful doping of Co, Bi, and La elements into the AgSnO2 material via sol–gel and powder metallurgy processes. Dopant elements entered the SnO2 unit cell in the form of atomic substitution, verifying the accuracy of the atomic substitution doping model constructed in the simulation.
Figure 5.
X-ray diffraction pattern.
The crystal size can be estimated using the Scherrer equation from the peak spreading of the XRD pattern (Full Width at Half Maximum (FWHM) of the peaks). The Scherrer equation is shown as Equation (3):
where D is crystal size, K is the Scherrer constant, λ is the X-ray wavelength, β is the peak width after instrumental effects, and θ is the Bragg diffraction angle.
The calculated crystal size of AgSnO2 before and after Co, Bi, and La doping is shown in Table 6. The results show that the Co, Bi, and La doping of AgSnO2 forms a stable transition metal phase, which leads to an increase in lattice strain and promotes grain refinement, resulting in a smaller crystal size.
Table 6.
Crystal size of AgSnO2 materials.
3.2.2. Wettability Analysis
During interface formation, the wettability of liquid metal on a solid surface is governed by surface energy and interfacial energy [27]. The degree of wettability can evaluate interfacial bonding strength. This study employed the sessile drop method using a DSAHT12 contact angle measuring instrument to test the wettability between intrinsic and doped SnO2 solid substrate and Ag. The silver content was kept consistent at 0.3 g, and the droplet was deposited on the substrate for 24 h before wetting angle measurement. For each sample, the wetting angle was measured three times, and the average value was reported. Figure 6 shows the wetting angle measurement results. The average wetting angle for the undoped system was 97.4°, where molten Ag did not completely spread on the SnO2 substrate, and infiltration was not obvious, indicating poor wettability between the two phases. Doping effectively improves wettability—wetting angles decreased to 82.4°, 83.7°, and 75.6°, respectively, with the La-doped system exhibited the best wettability. Dopant elements promote diffusion between Ag and the oxide substrate, enhancing Ag infiltration onto the substrate. This facilitates the dispersion of SnO2 in the Ag melt pool under arc action rather than accumulating on the contact surface. A wettability experiment validated the correctness of the simulated interfacial bonding strength results.
Figure 6.
The results of wetting angle: (a) AgSnO2; (b) AgSnO2-Co; (c) AgSnO2-Bi; (d) AgSnO2-La.
Dopant elements significantly better improve the wettability between SnO2 and Ag, making SnO2 less likely to form enrichment zones in the Ag melt pool, reducing solid–liquid interfacial tension. Increased actual contact area and number of contact points reduce contact resistance between contacts. Simultaneously, the dispersion of SnO2 in the melt pool increases the viscosity of the melt pool, preventing Ag from splashing, and improving the arc erosion resistance of AgSnO2. In practical use, contact materials with good wettability allow more SnO2 particles to disperse into the Ag melt pool under arc action, forming a uniformly dispersed AgSnO2 alloy, which helps improve the arc performance of the contact material.
3.2.3. Electrical Contact Experiment
The JF04D electrical contact material testing system was employed to simulate actual operating conditions for electrical contact experiments. The structure of the testing system is shown in Figure 7, where the movable contact is the anode and the stationary contact is the cathode. Experimental parameters were set as follows: protection voltage ±40 V, operating current DC 15 A, test voltage DC 24 V, operating frequency 60 cycles/min, contact force 86 cN, and switching cycles 100,000 times. This device acquired parameters such as arc energy, arc duration, welding force, and contact resistance, providing multi-faceted data for comprehensive material evaluation. Elevated arc energy and duration indicate more severe arc erosion. Excessively high contact resistance causes localized temperature escalation, leading to material melting or contact failure. Reducing contact resistance and improving its stability are key to optimizing material electrical contact performance. Smaller welding force indicates better anti-welding performance of the electrical contact material [28,29,30,31,32]. Studying the performance and erosion degree of electrical contact materials during arc erosion holds significant theoretical and practical importance.
Figure 7.
JF04D electrical contact testing system.
Arc energy and arc duration are key parameters for evaluating the arc erosion resistance of electrical contact materials. Higher values make contact materials more prone to welding, exacerbate surface metal loss, and abbreviate service life. The doped AgSnO2 materials were tested using a symmetric anode configuration. Measurement data was divided into 100 data points (averaging every 1000 operations per data point), and the mean value and standard deviation (S.D.) were calculated for each group. Figure 8 demonstrates that arc energy increases with the number of operations, with the undoped system showing the largest increase and the highest mean and S.D. values. Figure 9 exhibits analogous trends for arc duration. Doped systems manifested distinct optimization: Co and La doping simultaneously reduced the mean and S.D. of arc energy, while the fluctuation in arc duration decreases, becoming more stable. This indicates that doping improves the arc stability of AgSnO2 electrical contact materials. Bi doping slightly increases the average arc duration due to the material melting caused by its low melting point. Experiments confirm that elemental doping effectively enhances arc erosion resistance and arc stability, with La doping being the most effective for reducing arc energy and improving arc stability.
Figure 8.
Arc energy variation curve with the number of operations.
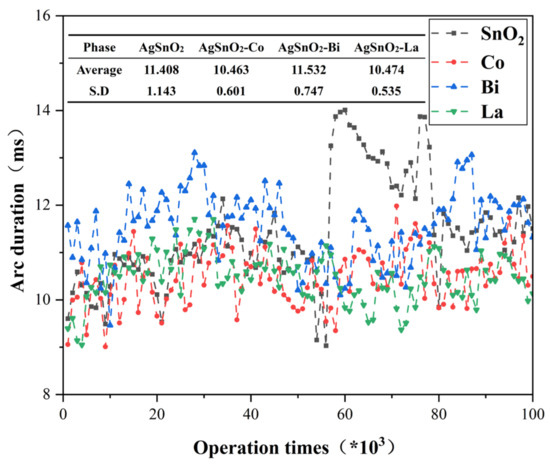
Figure 9.
Arc duration variation curve with the number of operations.
Welding force is a core indicator for evaluating the anti-welding performance of contacts. Its value is directly related to material composition homogeneity and interfacial stability. Lower welding force denotes better anti-welding properties. Figure 10 depicts the variation curve of welding force with the number of operations. Undoped AgSnO2 exhibited a sudden change at 50,000 operations, with a mean welding force of 70.341 cN and severe fluctuation. Conversely, La- and Co-doped systems perform favorably. The La-doped system registered minimal mean welding force (68.431 cN) and S.D. (1.063), followed by Co doping systems. Both are lower than the undoped system, and the welding force curve is smoother with fewer abrupt changes. This indicates that La and Co doping make AgSnO2 contact material more stable. Doping promotes the uniform dispersion of SnO2 particles, filling voids in the Ag matrix, improving interfacial wettability, inhibiting interfacial motion, and enhancing the anti-welding performance of the contacts. Bi doping may slightly increase welding force due to surface inhomogeneity. Experiments confirm that doping effectively improves the anti-welding performance of AgSnO2 contact materials, with La doping showing the best overall performance.
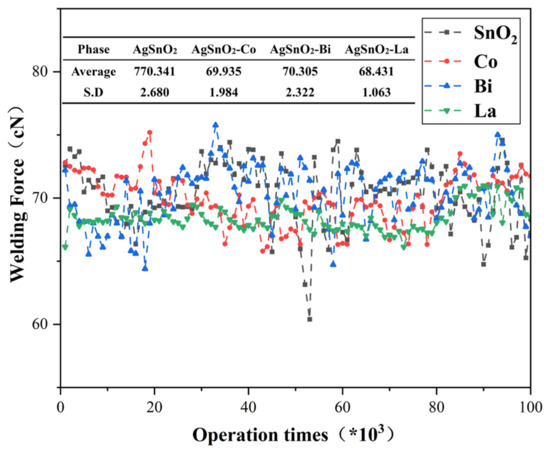
Figure 10.
Welding force variation curve with the number of operations.
Contact resistance affects material performance, as the high contact resistance characteristic of AgSnO2 contacts not only intensifies temperature rise at the contact interface but also aggravates arc erosion on the contact surface, shortening contact component life. Figure 11 illustrates the variation in contact resistance with the number of operations: an initial decline followed by ascent and eventual stabilization. The undoped system exhibits severe fluctuations, with resistance values significantly increased after 78,800 operations, attributed to SnO2 detachment from the Ag melt pool and floating up to agglomerate on the contact surface due to arc erosion, resulting in a mean resistance of 4.329 mΩ. Doped samples exhibited lower contact resistance and showed less volatility. This indicates that the introduction of dopant elements improves the stability of the contact interface, thereby enhancing current transmission efficiency and reducing contact resistance. Co doping effectively reduces the contact resistance of AgSnO2 materials through multiple mechanisms such as increasing carrier concentration, optimizing lattice structure and interface bonding, and refining grains. The La-doped system exhibited the most stable contact resistance fluctuation and the smallest mean value. This is because La doping leads to uniform distribution of additives in the matrix, effectively inhibiting SnO2 particle agglomeration, improving material homogeneity. It also alters arc diffusion characteristics, enhancing arc stability and reducing concentrated discharge.
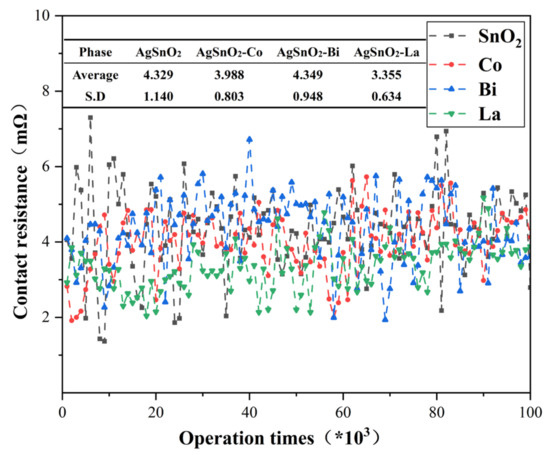
Figure 11.
Contact resistance variation curve with the number of operations.
3.2.4. Material Transfer Analysis
During arc discharge, evaporation and splashing occur on the electrical contact surface, leading to contact damage and material loss. Material transfer and material loss are key indicators for evaluating the lifespan of electrical contacts. After completing the electrical contact test experiment of 100,000 switching operations, the mass change of the contacts was measured using a Sartorius Genius series ME235S electronic balance, Sartorius AG (Göttingen, Germany). Figure 12 shows the mass change of the anode and cathode contact materials and the total mass loss caused by arc erosion. Before doping, the material transfer and total mass loss of AgSnO2 electrical contacts were high, while the total mass loss of doped samples decreased. This is attributed to the improved wettability between SnO2 and Ag due to the introduction of dopant elements, promoting the dispersion of SnO2 particles in the metal melt pool. High-melting-point, strongly thermally stable SnO2 covers the molten Ag, effectively inhibiting the splashing of Ag in the melt pool, thereby reducing the arc erosion of the material. Co and La doping reduced material transfer from anode to cathode. In particular, AgSnO2-La electrical contact material exhibited the least material transfer and material loss, indicating that it has better electrical performance and higher thermal stability, and is less likely to degrade under arc influence. The experiment confirmed that doping effectively improves the thermal stability of AgSnO2 contact materials.
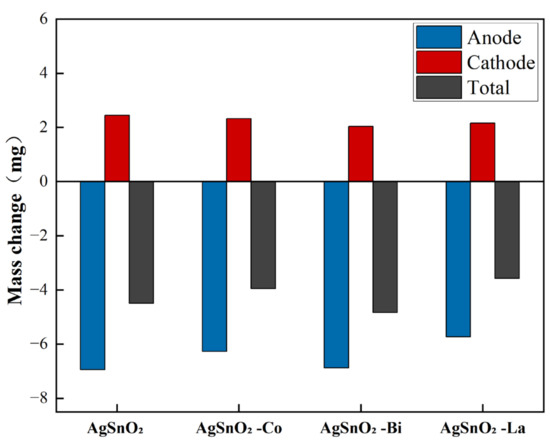
Figure 12.
Mass change of the electrical contact material after 100,000 operations.
3.2.5. Arc Erosion Morphology Analysis
When movable and stationary contacts touch, initial contact occurs at micro-asperity peaks, forming gaps in non-contact areas. After 100,000 electrical contact test cycles, the anode contact surfaces were scanned using an Olympus DSX1000 digital microscope, Olympus Corporation (Tokyo, Japan). The 2D macroscopic morphology is shown in Figure 13. Undoped AgSnO2 surface shows localized concentrated erosion; black areas are oxidation products of molten Ag droplets. In contrast, doped systems exhibit more uniform erosion morphologies due to the uniform distribution of dopants in the matrix. Among them, the La-doped sample demonstrated minimal erosion diameter and flattest contact surface, followed by the Co-doped sample. La doping enhanced interfacial bonding strength, inhibiting SnO2 agglomeration induced by arcs. Its low contact resistance and potent arc stability reduce localized Joule heating. Increased melt pool viscosity (wetting angle 75.6°) inhibits the formation of large arc craters and the possibility of severe erosion. This morphological feature provides multi-scale validation for the optimal interfacial stability of the La system predicted by simulation.
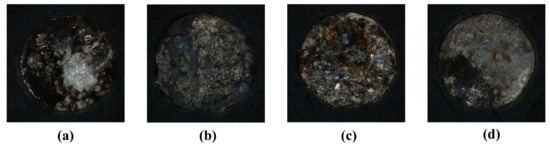
Figure 13.
Two-dimensional topography scan of electrical contact. (a) AgSnO2; (b) AgSnO2-Co; (c) AgSnO2-Bi; (d) AgSnO2-La.
While 2D macro-morphology intuitively visualizes planar features of arc erosion in the X and Y directions, it struggles to characterize parameters like erosion pit depth and width or peak height and width. Therefore, the 3D macroscopic topography of the contacts was scanned and plotted using the Olympus DSX1000 digital microscope, shown in Figure 14. After arc erosion, undoped AgSnO2 contact surface developed large-diameter, deep craters, indicating severe localized arc erosion. Co- and La-doped systems showed significantly flattened surfaces. The La-doped system has the smallest ablation area and shallowest ablation depth, while the Co-doped system exhibits dispersed shallow surface ablation. Doping effectively suppressed molten metal splashing. Lower arc energy after doping reduces thermal penetration depth. The 3D morphology data confirm that La doping profoundly enhances the arc erosion resistance of AgSnO2 electrical contacts by altering interfacial bonding and arc thermodynamic behavior.
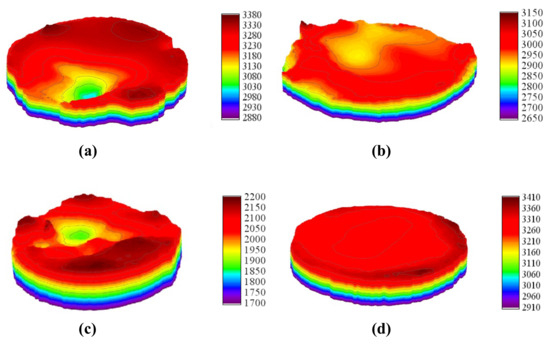
Figure 14.
Three-dimensional topography scan of electrical contact. (a) AgSnO2; (b) AgSnO2-Co; (c) AgSnO2-Bi; (d) AgSnO2-La.
Relying solely on 2D and 3D macroscopic morphology observations after arc erosion may not accurately represent the extent of erosion in electrical contact materials. For more precise quantitative analysis, parameters characterizing the contact surface morphology were extracted to analyze the contact morphology. Four surface roughness parameters, Ssk, Sz, Smr1, and Vmp, were introduced to characterize the erosion features of the contact surface [33,34]. The calculation formulas for Ssk and Sz are shown as Equations (4) and (5):
Skewness (Ssk) reflects the symmetry of the height distribution relative to the mean line. Ssk > 0 indicates a surface with more peaks, and Ssk < 0 indicates a surface with more valleys:
Maximum height (Sz) is the sum of the absolute values of the maximum peak height and the maximum valley depth:
Material ratio curve intercept 1 (Smr1) represents the interception of the material ratio curve at 10% height. Smr1 reflects the proportion of the surface area below 10% Sz. An increase in Smr1 value indicates an increase in low-lying surface areas. Mean peak material volume (Vmp) represents the average material volume of the peak portions of the surface. By scanning to obtain the surface morphology information matrix of the electrical contacts, the least squares method was used to calculate the corresponding surface roughness parameters for each electrical contact material, constructing a reference plane to analyze the roughness of the electrical contact surface and judge the arc erosion resistance of doped AgSnO2 materials. The surface roughness parameters of the contact materials are shown in Table 7. The Sz of doped samples is smaller than that of the undoped sample, indicating that the protrusion height and pit depth of doped samples are smaller; Ssk is significantly reduced, indicating a more symmetric height distribution and reduced skewness compared to undoped. As ablation proceeds, pits and molten protrusions gradually form on the surface, and the Smr1 value will decrease, indicating a reduction in effective contact area. A higher Smr1 value means more peak regions participate in contact, helping to improve contact stability and reduce contact resistance. The data shows that the Smr1 values of the three doped materials are significantly larger than that of the undoped sample. A decrease in Vmp value indicates that fewer sharp peaks exist, helping to reduce contact resistance. This is consistent with the results of the three-dimensional macroscopic morphology analysis. It indicates that doping causes SnO2 particles to suspend in the molten Ag system, increasing the viscosity of the Ag melt pool, reducing the tendency of SnO2 agglomeration, and resulting in a flatter surface morphology for doped AgSnO2 contact materials. This further confirms that doping can improve the arc erosion morphology of AgSnO2 contact materials and enhance the material’s arc erosion resistance, providing an effective approach and analytical method for studying how doping improves the arc corrosion resistance of contact materials.
Table 7.
Surface roughness.
During electrical contact, the high-temperature arc between movable and stationary contacts causes metal melting and droplet splashing, leading to surface erosion of AgSnO2. Figure 15 depicts SEM scans (5000X magnification) of the erosion features on the anode contacts before and after doping. Figure 15a shows that the undoped material surface exhibits large pores and traces of molten metal flow. This originates from the significantly higher oxygen solubility in liquid silver compared to solid silver. Oxygen absorbed by molten silver under arc action partially escapes due to the sudden pressure drop upon contact separation. Residual oxygen trapped during rapid solidification forms pores, degrading electrical contact performance.
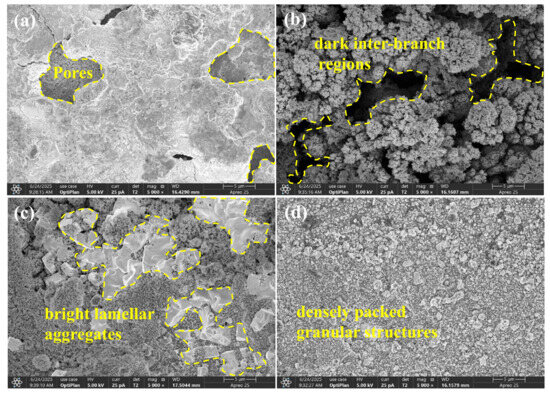
Figure 15.
Erosion morphology of doped AgSnO2. (a) AgSnO2; (b) AgSnO2-Co; (c) AgSnO2-Bi; (d) AgSnO2-La.
Co doping altered SnO2 lattice parameters and surface energy, forming a unique coral-like structure. Grains preferentially grow along specific directions, forming a network of pores between coral branches upon cooling and contraction. This structure splits the concentrated arc into multiple micro-arcs, increasing the arc propagation path and dispersing energy over a larger surface area, thereby reducing localized temperature and inhibiting deep melt pool development. The pore and branch structure reduces localized stress concentration. Molten silver infiltrates the pore network, inhibiting its flow and resulting in a relatively flat erosion surface.
Bi, with its low melting point, melts first under arcing and migrates along SnO2 grain boundaries driven by capillary forces. Molten Bi encapsulates SnO2 particles, forming white flake-like aggregates. Bi vapor has low ionization energy and ionizes preferentially, forming a metal-phase arc plasma with high conductivity and low energy density. This expands and homogenizes the arc root region, avoiding localized energy concentration and preventing deep pores in the melt pool.
La-doped AgSnO2 exhibits a dense granular structure. La occupies oxygen vacancies in SnO2, inhibiting anisotropic grain growth and promoting the refinement and uniform distribution of Ag and tin oxide particles. Under arc action, uniformly distributed particles accelerate heat diffusion, preventing localized overheating and erosion. La doping also improves material wettability and thermal stability, reduces arc energy, blocks interconnected paths for molten metal connectivity, causing viscous flow characteristics that inhibit non-uniform spreading. Particle filling increases density, making macro-surface flatter and enhancing the anti-welding performance of the contact material.
3.2.6. Arc Erosion and Material Transfer Behavior Mechanism
The flow of liquid metal within the melt pool is key to determining the erosion mode and transfer characteristics of electrical contact materials. When current flows through the melt pool, the generated annular magnetic field interacts with the current, producing a Lorentz force that influences the liquid metal. Figure 16 illustrates the change in melt pool flow direction induced by the Lorentz force. When current passes through the melt pool, it drives a characteristic flow pattern: downward in the central region and upward along the sidewalls. Constrained by the current direction, the anode melt pool flows overall towards the cathode, while the cathode melt pool flows in the opposite direction. This phenomenon causes more significant splashing in the anode region. La doping increases the viscosity of the molten metal, slowing down the flow within the melt pool. A high-viscosity melt pool is less prone to splashing, reducing material loss and allowing metal to spread uniformly and slowly within the contact zone, forming a flatter surface. High-viscosity melt pools cool slower during solidification, promoting the formation of finer and more uniform grain structures and reducing shrinkage-induced depressions. Additionally, the internal stress generated during the solidification of a high-viscosity melt pool is smaller, reducing surface depressions caused by stress concentration. Furthermore, the addition of La may form stable La-Sn-O oxides. The oxide film creates a protective layer on the melt pool surface, inhibiting excessive expansion of the melt pool under arc action and maintaining AgSnO2 melt pool stability.
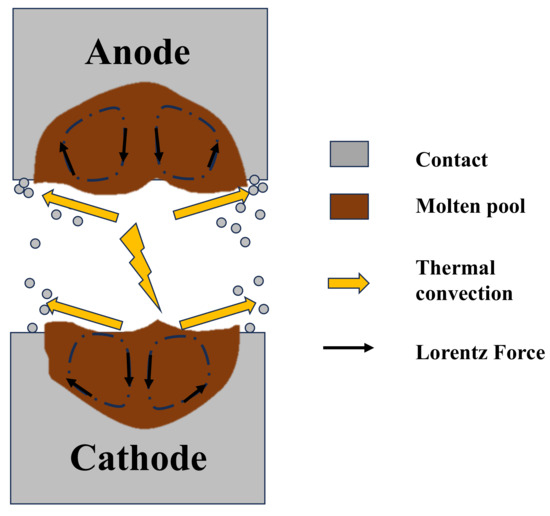
Figure 16.
Physical modeling of AgSnO2 molten pool.
4. Conclusions
(1) The AgSnO2 interface model was constructed based on density functional theory, enabling the design of silver-reduced doped systems and overcoming the limitations of traditional unit cell models in simulating interface effects. First-principles calculations show that the work of separation and interfacial energy for both undoped and Co-, Bi-, and La-doped AgSnO2 are positive, indicating stable interfaces after doping. Among them, La doping exhibits the highest interfacial stability and optimal wettability. Interfacial bonding analysis reveals the possible formation of Ag-O bonds at the atomic scale in the two-phase interfacial region. Simulations predict that La doping offers the best comprehensive performance.
(2) Doped SnO2 powders were synthesized using the sol–gel method. XRD phase analysis confirmed elemental substitution doping. AgSnO2 electrical contact materials fabricated by high-energy ball milling and powder metallurgy processes; their structural characteristics align with the simulated interface models. Experimentally measured wettability is consistent with the simulated interfacial bonding strength. Compared to the undoped material, doping significantly improves arc energy, arc duration, contact resistance, and welding force. Morphological analysis shows that doping effectively reduces surface defects such as cracks, pores, and protrusions and significantly decreases the degree of arc erosion. Doping markedly enhanced the electrical performance and arc erosion resistance of the contact materials.
(3) Combined with micro-morphological analysis, the microscopic mechanism by which doping improves performance was elucidated. La doping provides the most significant performance enhancement: it increases material conductivity, exhibits optimal arc erosion resistance and thermal stability, and results in a more uniform erosion morphology on the material surface without significant cracks or pores, providing an effective solution for high-performance contacts.
The “atomic interface model-experimental validation” methodology established in this study provides a basis for electrical contact material design. Doping effectively improves the contact material’s performance, enhances anti-welding properties and arc erosion resistance, and extends the working life of electrical contacts. This study provides theoretical support for developing environmentally friendly and high-performance AgSnO2 contact materials. The method combining theoretical simulation and experimental validation can save experimental materials, shorten material development cycles, reduce research costs, and simultaneously provide new ideas for developing environmentally friendly and high-performance AgSnO2 contact materials. This enables AgSnO2 contact materials to be more widely used in low-voltage electrical appliances, adapt to complex service environments, and meet engineering application requirements. The consistency between simulation theory and experimental validation offers new insights for optimizing multi-element doping systems.
Author Contributions
Conceptualization, J.W.; methodology, J.W. and Y.L.; software, J.W.; validation, Y.L.; investigation, Y.L. and Y.W.; writing—original draft, Y.L. and Y.W.; writing—review and editing, Y.L., J.W. and Y.Z. (Ying Zhang); visualization, Y.L.; supervision, J.W. and Y.Z. (Yancai Zhu). All authors have read and agreed to the published version of the manuscript.
Funding
This research was funded by [Local Science and Technology Development Fund Project guided by the Central Government], grant number [216Z1011G].
Institutional Review Board Statement
Not applicable.
Informed Consent Statement
Not applicable.
Data Availability Statement
All data generated or analyzed during this study are included in this published article.
Acknowledgments
Thanks to J.W. for providing the materials and equipment required for the experiments. Thanks to all authors for their contributions to this article. We appreciate the constructive comments from anonymous reviewers. The authors assume full responsibility for this article.
Conflicts of Interest
The authors declare that the research was conducted in the absence of any commercial or financial relationships that could be construed as a potential conflict of interest.
References
- Jacimovic, J.; Felberbaum, L.; Giannini, E.; Teyssier, J. Electro-mechanical properties of composite materials for high-current contact applications. J. Phys. D Appl. Phys. 2014, 47, 125501. [Google Scholar] [CrossRef]
- Bai, X.; Lin, W.; Zhang, M. Contact Materials for Low Voltage Electric Apparatus. Electr. Eng. Mater. 2007, 3, 12–16. [Google Scholar] [CrossRef]
- Zhang, M. Development Situation of AgSnO2 Contact Materials and Their Applications in Relays. Electr. Eng. Mater. 2004, 4, 20–26. [Google Scholar] [CrossRef]
- Zheng, J.; Jiang, F.; Li, S.L. Study on New Types of Environmental Protection AgSnO2 Electrical Contact Materials. Adv. Mater. Res. 2013, 815, 400–403. [Google Scholar] [CrossRef]
- Wu, Q.; Xu, G.; Huang, R.; Yu, L.; Wu, C. The influence of Sb2O3 on the interface wettability between Ag and SnO2. J. Alloys Compd. 2024, 1008, 176587. [Google Scholar] [CrossRef]
- Guo, D.; Hu, C. First-principles study on the electronic structure and optical properties for SnO2 with oxygen vacancy. Appl. Surf. Sci. 2012, 258, 6987–6992. [Google Scholar] [CrossRef]
- Li, Z.; Wang, Z.; Chen, K.; Li, Y.; Shang, S. Review of Comparison of Silver Tin Oxide Contact Preparation Process and Arc Erosion Characteristics. Electr. Eng. Mater. 2021, 4, 3–9. [Google Scholar] [CrossRef]
- Shi, J. Review of Technological Evolution and Silver Conservation in Electrical Contact Materials. Powder Metall. Ind. 1999, 3, 33–36. [Google Scholar]
- Zhao, C.; Xu, G.; Yuan, M.; Wu, C. Research Progress of Silver Metal Oxide Electrical Contact Materials. Electr. Eng. Mater. 2025, 1, 39–47. [Google Scholar] [CrossRef]
- Jingqin, W.; Jingting, X.; Yancai, Z.; Delin, H.; Ningyi, L.; Defeng, C.; Peijian, G. Properties of AgSnO2 Contact Materials Doped with Different Concentrations of Cr. Materials 2022, 15, 4793. [Google Scholar] [CrossRef]
- Li, H.; Wang, X.; Hu, Z.; Qiu, Y. Effect of Ni addition on the arc-erosion behavior of Ag-4 wt.%SnO2 electrical contact material. J. Alloys Compd. 2020, 829, 154487. [Google Scholar] [CrossRef]
- Yang, F.; Tang, J.; Zheng, X.; Zhang, L.; Shen, T. Preparation and Properties of La2O3 Doped AgSnO2 Electrical Contact Materials. Rare Met. Mater. Eng. 2018, 47, 182–187. [Google Scholar]
- Liu, X.; Wu, X.; Zhou, G.; Wang, J.; Huang, X.; Meng, L. Effect of Particle Size of ITO-Enhanced Phase on the Performance of AgSnO2 Contact Materials. Electr. Eng. Mater. 2025, 1, 5–8. [Google Scholar] [CrossRef]
- Wang, H.; Liu, W.; Yang, M.; Zhu, Y. Effect of Particle Size of Second Phase on Wettability and Electrical Contact Properties of AgSnO2 Contact Materials. Rare Met. Mater. Eng. 2022, 51, 24–29. [Google Scholar] [CrossRef]
- Xu, Y.; Li, J.; Teng, W.; Cui, D.; Zhou, X. Adhesion, Stability and Electronic Properties of Ag/SnO2 Interface from First-Principles Calculation. Cryst. Res. Technol. 2024, 59, 202400126. [Google Scholar] [CrossRef]
- Liu, Z.; Wang, J.; Zhu, Y.; Chen, L.; Yu, S. First-principles Study on Interface Bonding Stability of Ag/SnO2 Composites. Chin. J. Rare Met. 2020, 44, 729–734. [Google Scholar] [CrossRef]
- Wang, J.; Qiao, H.; Song, F.; Yuan, Y.; Liu, S.; Matsumoto, N.H. Effect of SnO2 content on properties and microstructure of Ag/SnO2 electric contact materials. In Materials Science and Engineering, Proceedings of the IOP Conference Series, Qingdao, China, 10–12 July 2020; IOP Publishing: Bristol, UK, 2020; Volume 770, p. 012063. [Google Scholar] [CrossRef]
- Zhao, Y.; Zhang, H.; Zhang, G.; Wei, Q.; Yuan, Y. First-principles investigation on elastic and thermody-namic properties of Pnnm-CN under high pressure. Aip Adv. 2016, 6, 1–11. [Google Scholar] [CrossRef]
- Li, C.; Jiao, L.; Chen, Z.; Wang, J.; Hu, M.; Chen, Z. Elasticity, hardness and anisotropies of bc-BnCN (n = 1, 2, 4). Sci. Sin. 2016, 46, 1–13. [Google Scholar] [CrossRef]
- Khechba, M.; Bouabellou, A.; Hanini, F. Effect of Al Doping on the Structural and Optical Properties of SnO2 Thin Films Elaborated by Sol-Gel Technique. J. New Technol. Mater. 2017, 7, 72–75. [Google Scholar] [CrossRef]
- Liu, J.D.; Wang, X.; Du, X.M.; Xie, M.; Li, J.G.; Zhao, S.Q.; Zhou, Y.Z.; Zhang, Q.; Fang, J.H. Structural and elastic properties of AgNi10 alloy studied with ab-initio calculations. Mater. Technol. 2022, 56, 149–157. [Google Scholar] [CrossRef]
- Cao, Y.X.; Wang, Y.H.; Li, H.; Chen, W.X. Study of Asphalt Behavior on Pre-Wet Aggregate Surface Based on Molecular Dynamics Simulation and Surface Energy Theory. Coatings 2023, 13, 1799. [Google Scholar] [CrossRef]
- Xu, Y.X.; Chen, L.; Pei, F.; Chang, K.K.; Du, Y. Effect of the modulation ratio on the interface structure of TiAlN/TiN and TiAlN/ZrN multilayers: First-principles and experimental investigations. Acta Mater. 2017, 130, 281–288. [Google Scholar] [CrossRef]
- Carbó-Dorca, R.; Bultinck, P. Quantum Mechanical Basis for Mulliken Population Analysis. J. Math. Chem. 2004, 36, 231–239. [Google Scholar] [CrossRef]
- Tian, W.; Chen, H. Insight into the mechanical, thermodynamics and superconductor properties of NbRuB via first-principles calculation. Sci. Rep. 2016, 6, 19055. [Google Scholar] [CrossRef] [PubMed]
- Guo, M.; Yang, H.; Gao, M.; Zhang, E.; Liang, Z.; Han, P. Enhanced photoelectric performance of (2Al, S) co-doped rutile SnO2. RSC Adv. 2017, 7, 42940–42945. [Google Scholar] [CrossRef]
- Dou, J.; Liu, H.; Mao, D.; Li, Y. First-principle Calculations of Interfacial Properties and Wettability of WC/Cu and W/Cu Composites. Spec. Cast. Nonferrous Alloys 2025, 45, 547–554. [Google Scholar] [CrossRef]
- Zhang, X.; Zhang, Y.; Tian, B.; An, J.; Zhao, Z.; Volinsky, A.A.; Liu, Y.; Song, K. Arc erosion behavior of the Al2O3-Cu/(W, Cr) electrical contacts. Compos. Part B Eng. 2019, 160, 110–118. [Google Scholar] [CrossRef]
- Diego, G.; Marcus, H.; Frank, B.; Peter, S. Investigation on Contact Resistance Behavior of Switching Contacts Using a Newly Developed Model Switch. IEEE Trans. Compon. Packag. Manuf. Technol. 2018, 8, 939–949. [Google Scholar] [CrossRef]
- Wu, C.; Zhao, Q.; Li, N.; Wang, H.; Yi, D.; Weng, W. Influence of fabrication technology on arc erosion of Ag/10SnO2 electrical contact materials. J. Alloys Compd. 2018, 766, 161–177. [Google Scholar] [CrossRef]
- Jiang, N.; Feng, Y.; Fan, X.; Liu, Z.; Yu, M.; Zhang, T.; Wang, J. Anti-arc erosion capability and mechanism of Ag-Ni-La2Sn2O7 composites in different atmospheres. Trans. Mater. Heat Treat. 2024, 45, 39–54. [Google Scholar] [CrossRef]
- Fan, Y.; Han, X.; Chen, L.; Peng, Y.; Liang, Y.; Li, G. Effect of Ni and NiO Additives on the Electrical Contact Property of AgSnO2 Composites. Electr. Eng. Mater. 2025, 2, 17–21. [Google Scholar] [CrossRef]
- He, B.; Wei, C.; Liu, B.; Ding, S.; Shi, Z. Three-dimensional surface roughness characterization and application. Opt. Precis. Eng. 2018, 26, 1994–2011. [Google Scholar] [CrossRef]
- Gold, G.; Helmreich, K. A physical surface roughness model and its applications. IEEE Trans. Microw. Theory Tech. 2017, 65, 3720–3732. [Google Scholar] [CrossRef]
Disclaimer/Publisher’s Note: The statements, opinions and data contained in all publications are solely those of the individual author(s) and contributor(s) and not of MDPI and/or the editor(s). MDPI and/or the editor(s) disclaim responsibility for any injury to people or property resulting from any ideas, methods, instructions or products referred to in the content. |
© 2025 by the authors. Licensee MDPI, Basel, Switzerland. This article is an open access article distributed under the terms and conditions of the Creative Commons Attribution (CC BY) license (https://creativecommons.org/licenses/by/4.0/).