Abstract
Transition-metal and rare-earth element co-doped ZnO nanoparticles have attracted significant attention due to their potential applications in spintronics and optoelectronics. In this study, Zn0.95Co0.01EuxO (x = 0.01–0.05) nanoparticles were synthesized using the sol–gel technique. The estimated stress, strain, and crystallite sizes of the synthesized Co/Eu co-doped ZnO nanoparticles were calculated using the Williamson–Hall method, and their electron spin resonance (ESR) properties were investigated to examine the effect on their magnetic and structural properties. X-ray diffraction (XRD) analysis confirmed the presence of a single-phase structure. Surface morphology, elemental composition, crystal quality, defect types, density, and magnetic behavior were characterized using scanning electron microscope (SEM), electron-dispersive spectroscopy (EDS), and ESR techniques, respectively. The effect of Eu concentration on the linewidth (ΔBpp) and g-factor in the ESR spectra was studied. By correlating ESR results with the obtained structural properties, room-temperature ferromagnetic behavior was identified.
Keywords:
zinc oxide; nanoparticles; ESR; sol–gel method; photoluminescence; defects; magnetic properties 1. Introduction
In recent decades, the investigation of transition metal (TM)-doped ZnO systems—where TMs denote the d-block elements of the periodic table—has garnered significant attention due to their versatile optical and magnetic properties, offering potential applications in optoelectronic devices, spintronics, biomedical systems, sensors, and surface acoustic wave technologies [1,2,3,4,5,6,7,8].
The theoretical forecast of room-temperature ferromagnetism (RT-FM) in p-type Mn-doped GaN and ZnO by Dietl et al. [9] has since been experimentally supported, with similar phenomena observed in ZnO, GaN, and AlN doped with transition metals like Mn, Co, and Cu [10,11,12,13]. Notably, Cu-doped semiconductors are distinctive, as neither metallic Cu nor its secondary phases (except nanocrystalline CuO [14]) significantly contribute to ferromagnetism, effectively eliminating secondary phase contributions.
Electron paramagnetic resonance (EPR) is a powerful technique capable of precisely analyzing the structural and magnetic properties of magnetic nanoparticles. Parameters such as the g-factor, resonance field, and line width reveal information about the core structure and surface anisotropy [15]. It has proven to be an extremely effective method for investigating the magnetic properties of such doped systems and has been widely used in the study of TM-doped ZnO and AlN systems.
Despite ongoing research, the precise role of intrinsic defects—particularly oxygen vacancies (V0)—in governing the magnetic behavior of ZnO remains incompletely understood. Increasing experimental evidence suggests that defect-induced ferromagnetism may arise even in the absence of magnetic dopants, underscoring the importance of defect engineering in non-magnetic oxide systems [15,16,17,18,19,20,21]. Controlled defect introduction through ion implantation offers a promising route to systematically modulate the magnetic properties of ZnO nanostructures.
In this study, the structural properties of Zn0.95Co0.01EuxO (x = 0.00–0.05) nanoparticles were analyzed using X-ray diffraction (XRD). ZnO was co-doped with the transition metal Co and the rare-earth element Eu to investigate its structural and magnetic behaviors. Structural parameters, including stress, strain (deformation), and crystallite size, were calculated using the Williamson–Hall method and compared with values obtained from the Debye–Scherrer equation. Morphological characteristics were examined by scanning electron microscopy (SEM). The g-factor values were determined from electron spin resonance (ESR) measurements, and the correlation between the structural parameters and magnetic properties was systematically evaluated.
2. Materials and Methods
Zn0.95−xCo0.05EuxO nanoparticles were synthesized through a sol–gel process by varying the Eu doping concentration within the range of x = 0.00 to 0.05. The precursor materials included zinc acetate dihydrate (Zn(CH3CO2)2 2H2O, Sigma Aldrich, Saint Louis, MO, USA), cobalt(II) acetate tetrahydrate (Co(CH3CO2)2·4H2O, Alfa Aesar, Haverhill, MA, USA), and europium acetate tetrahydrate (Eu(CH3COO)2·4H2O, Alfa Aesar). Methanol (CH3OH) and acetylacetone (C5H8O2) were used as solvents and chelating agents to achieve homogenous, transparent solutions. Following precise weighing, all reagents were combined and stirred at 300 rpm for a minimum of five hours at room temperature without the application of heat.
The solvents were then evaporated, and the resulting gels were preheated in air at temperatures ranging from 200 °C to 450 °C for 10 min to initiate phase formation, as reported in previous studies [3,4,8,22] (the optimum preheating condition was determined to be 400 °C for 10 min). Finally, each composition was annealed at 600 °C to obtain the desired crystalline phase and physical properties [23].
Structural phase identification of the synthesized nanoparticles was carried out using a Rigaku X-ray diffractometer equipped with a Cu Kα radiation source. Surface morphology and microstructural features were characterized with a JEOL JSM-5910LV (JEOL Ltd., Tokyo, Japan) scanning electron microscope (SEM).
For magnetic property analysis, electron spin resonance (ESR) spectra were collected using a Jeol Mark-JES-FA300 (JEOL Ltd., Japan) Series X-band spectrometer operating at a frequency of 9.45 GHz, with a modulation amplitude of 0.5 mT and capable of generating DC magnetic fields up to 2 T. A TE102 cavity was used for the measurements. The microwave power was set to 5 mW, the amplification (gain) level was adjusted to 50 arbitrary units, and the time constant was set to 0.03 s. During ESR measurements, the static magnetic field was swept from 0 to 1000 mT. To ensure measurement accuracy, background magnetic signals arising from the quartz sample tubes and the spectrometer cavity were eliminated from the data.
3. Results
3.1. Structural Characterization
The XRD patterns of Zn0.95−xCo0.05EuxO (x = 0.00–0.05) nanoparticles were recorded in the range of 20° ≤ 2θ ≤ 80° (Figure 1). The dominant diffraction peak corresponding to the (101) plane indicates a strong preferential crystallographic orientation along this direction, characteristic of the wurtzite ZnO structure. The absence of secondary phases in all samples confirms the high phase purity and crystallinity of the synthesized Co/Eu co-doped ZnO nanoparticles.
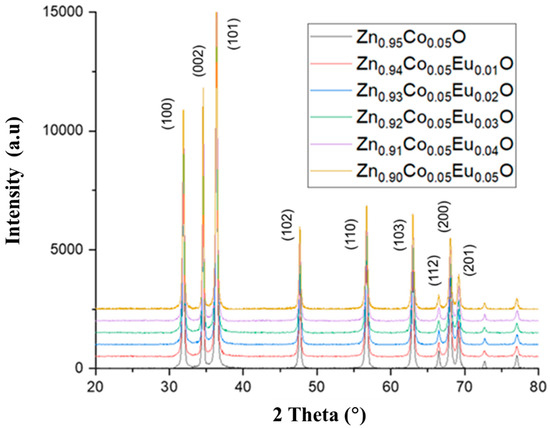
Figure 1.
XRD patterns of Zn0.95−xCo0.05EuxO nanoparticles (x = 0.00–0.05).
Structural parameters, including crystallite size (D), lattice constants (a, c), bond length (L), and unit cell volume (V), were calculated from the XRD data and are summarized in Table 1 and Table 2. The calculation procedures for dislocation density (δ), stress (σ), microstrain (ε), bond length (L), atomic displacement parameter (u), and crystallite size (D) were adopted from Guler et al. [17].

Table 1.
The average crystallite sizes, lattice parameters, atomic packing factor (c/a), and unit cell volume of Zn0.95−xCo0.05EuxO nanoparticles.

Table 2.
Microstrain (ε), stress (σ), dislocation density (δ), atomic displacement (u), and bond length (L) in Zn0.95−xCo0.05EuxO nanoparticles.
The Zn–O bond length was calculated as follows:
where the internal parameter u for the wurtzite structure is as follows:
The lattice constants were determined from the following equation:
The crystallite size was calculated using the Debye–Scherrer equation as follows:
where βₕₖₗ is the integral breadth, K = 0.90, λ = 0.1540 nm (Cu Kα), and θ is the Bragg angle.
As shown in Figure 2, both the a and c lattice parameters exhibit a similar oscillating pattern as a function of Eu concentration, indicating no significant distortion in the crystal structure due to Eu incorporation.
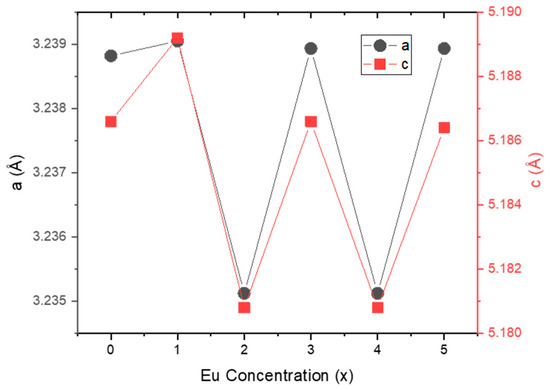
Figure 2.
Lattice parameters (a and c) versus Eu concentration for Zn0.95−xCo0.05EuxO structures.
Microstrain (ε) and stress (σ) values versus Eu concentration are plotted in Figure 3. Apart from 0% and 2% Eu doping levels, an inverse relationship between ε and σ is observed. Figure 4a illustrates the changes in lattice distortion factor (c/a) and Zn–O bond length (L) with Eu concentration. Figure 4b shows an inverse correlation between crystallite size (D) and microstrain (ε), implying that internal strain increases with decreasing crystallite size. The direct relationship between microstrain and dislocation density is consistent with the values reported in Table 2. Figure 4c demonstrates the correlation between crystallite size (D) and stress (σ), while Figure 5 presents the inverse trend between c/a ratio and unit cell volume as a function of Eu concentration.
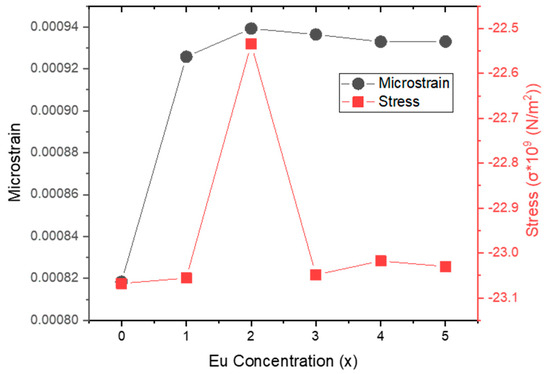
Figure 3.
Microstrain (ε) and stress (σ) versus Eu concentration for Zn0.95−xCo0.05EuxO structures.
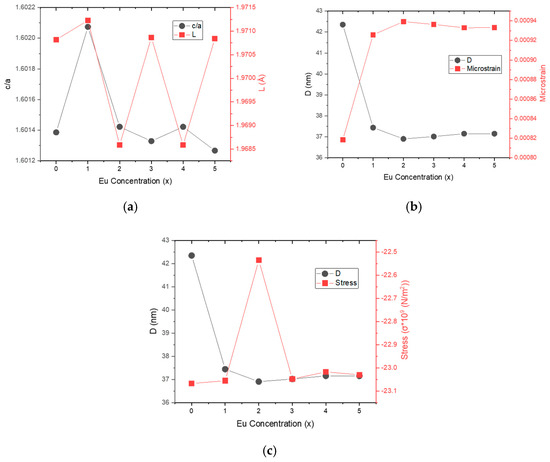
Figure 4.
(a) Lattice distortion factor (c/a) and Zn-O bond length (L) versus Eu concentration, (b) Crystallite size (D) and microstrain (ε) versus Eu concentration, (c) Crystallite size (D) and stress (σ) versus Eu concentration.
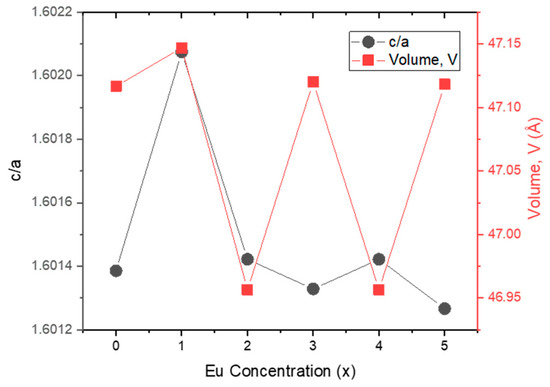
Figure 5.
Lattice distortion factor (c/a) and unit cell volume versus Eu concentration.
A comprehensive analysis was further conducted using the Williamson–Hall (W–H) approach to quantify the lattice strain and stress contributions, as discussed in the following section.
3.2. Williamson-Hall (W-H) Analysis
The Debye–Scherrer equation provides a reasonable estimation of crystallite size (D); however, it does not account for the effect of internal strain within the crystal lattice. As originally demonstrated by Stokes and Wilson [24], peak broadening arises from both crystallite size (D) and microstrain (ε) contributions.
The microstrain (ε) can be calculated using the following relation:
Small crystallite sizes primarily contribute to the observed peak broadening and strain-induced line broadening. Equations (4) and (5) indicate that D and ε have different angular dependencies with respect to θ. Therefore, the Williamson-Hall (W-H) method offers a reliable means to decouple the size and strain effects on peak broadening.
Specifically, strain-induced broadening leads to a linear dependence of the integral breadth βₕₖₗ on tan θ, while size-induced broadening varies inversely with cos θ. In order to obtain more comprehensive information about the strain and stress characteristics, three different W-H methods were employed:
Uniform Deformation Model (UDM): Assumes homogeneous deformation across all crystallites. It provides estimates of ε (microstrain) and D (crystallite size) without considering stress or energy effects.
Uniform Stress Deformation Model (USDM): Takes the elastic modulus into account and enables the calculation of internal stress. In addition to crystallite size and microstrain, it allows the determination of internal stress.
Uniform Deformation Energy Density Model (UDEDM): Evaluates the energy density caused by lattice distortions and provides a more comprehensive analysis of structural deformation.
These complementary W-H models allowed for the simultaneous evaluation of crystallite size (D), microstrain (ε), internal stress (σ), and deformation energy density (u) in Co/Eu co-doped ZnO nanoparticles.
3.2.1. Uniform Deformation Model
Williamson and Hall presented a mathematical model that connected strain-induced broadening effects to crystallite diameters. Mote et al. [25] later refined this strategy and created the equation found in Equation (6):
With βcos(θ) on the vertical axis and 4εsin(θ) on the horizontal, Figure 6 depicts the Williamson–Hall analysis based on the Uniform Deformation Model (UDM). In this linear plot, the slope represents the strain (ε), and the equation is used to obtain the crystallite size (D) from the y-intercept.
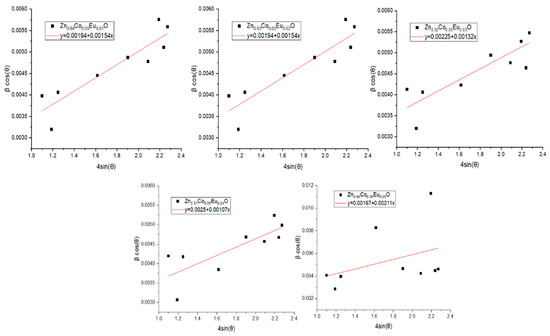
Figure 6.
Linear plots of βcos(θ) versus 4sin(θ) based on the Uniform Deformation Model (UDM) for Zn0.95−xCo0.05EuxO (x = 0.00–0.05) nanoparticles.
The crystallite sizes and lattice strain values for Co/Eu co-doped ZnO nanoparticles obtained using the UDM approach are shown in Table 3. In accordance with the information in Table 3, the crystallite size reaches its maximum value of 83.03 nm at 5% Eu doping and its minimum value of 57.93 nm at 4% Eu, as shown in Figure 6. In the Co/Eu co-doped ZnO structure, Eu doping up to 4% causes a general decreasing trend in crystallite size, which is then followed by a sudden increase. Similarly, when macrostrain is examined, the same behavior is observed, that is, the macrostrain decreases up to 4% Eu doping, and then a sudden increase occurs beyond this point.

Table 3.
Structural parameters for Co/Eu co-doped ZnO NPs, obtained via three Williamson–Hall-based models: UDM, USDM, and UDEDM.
3.2.2. Uniform Stress Deformation Model
In the Uniform Deformation Model (UDM), strain is assumed to be isotropically distributed across all crystallographic directions. However, due to the inherent anisotropy of nanoparticles, this assumption becomes inadequate for accurate modeling. The directional dependence of Young’s modulus within the crystal must be considered to provide a more realistic estimation of strain. To address this limitation, alternative models such as the Uniform Stress Deformation Model (USDM) and Uniform Deformation Energy Density Model (UDEDM) have been introduced [25].
In the modified formulation proposed by Mote et al. [25], the isotropic strain term εₕₖₗ is replaced by the ratio σ/Yₕₖₗ, where Yₕₖₗ represents Young’s modulus along specific crystallographic orientations. The W–H equation is thus rewritten as follows:
The directional Young’s modulus Yₕₖₗ for hexagonal structures is calculated as follows:
Here, S11, S13, S33, and S44 are the elastic compliance constants (in m2/N), which for hexagonal ZnO are given as follows: S11 = 7.858 × 10⁻¹² m2/N, S13 = −2.206 × 10⁻¹² m2/N, S33 = 6.94 × 10⁻¹² m2/N, and S44 = 23.57 × 10⁻¹² m2/N [4,26,27].
In the USDM approach, the uniform stress σ is assumed to be evenly distributed across all crystallographic orientations. The microstrain for each plane is computed as εₕₖₗ = σ/Yₕₖₗ. In practice, the plot of βcos θ versus yields a straight line, where the slope corresponds to the uniform stress σ, and the y-intercept provides the crystallite size (D) through D = Kλ/yintercept.
The USDM analysis results for the Co/Eu co-doped ZnO nanoparticles are presented in Figure 7, and the calculated values for stress, strain, and crystallite size are summarized in Table 3. Based on the slope analysis, the highest stress value of 0.2448 × 10⁶ N/m2 was observed at 5% Eu doping, accompanied by the largest crystallite size of 61.35 nm. The results suggest that as nanoparticle size increases, the concentration of structural defects such as vacancies and dislocations decreases, leading to a more homogeneous crystal structure capable of sustaining higher internal stress.
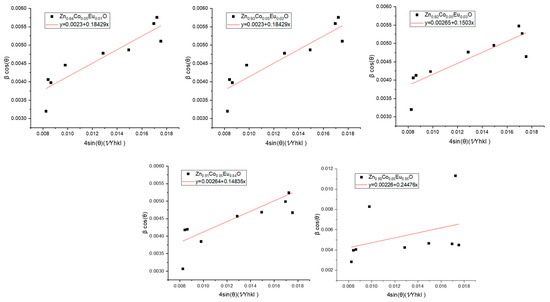
Figure 7.
Linear plots of βcos(θ) versus based on the Uniform Stress Deformation Model (USDM) for Zn0.95−xCo0.05EuxO (x = 0.00–0.05) nanoparticles.
3.2.3. Uniform Energy Density Deformation Model (UDEDM)
An alternative variant of the Williamson–Hall method, the Uniform Deformation Energy Density Model (UDEDM), was proposed by Mote et al. [25] to evaluate the elastic deformation energy density (u) in crystalline materials. This model assumes that the observed anisotropic strain arises from a uniform energy density distributed throughout the crystal structure.
The relation between energy density (u) and strain (ε) is given as follows:
Substituting this expression into the modified Williamson–Hall equation results in the following equation:
Here, the slope of the linear fit provides information on the internal deformation energy density (u), while the intercept on the βcos(θ) axis yields the crystallite size (D).
The results obtained from the UDEDM model for the Co/Eu co-doped ZnO nanoparticles are presented in Figure 8. The corresponding values of crystallite size, energy density, stress, and microstrain derived from the UDEDM analysis are listed in Table 3.
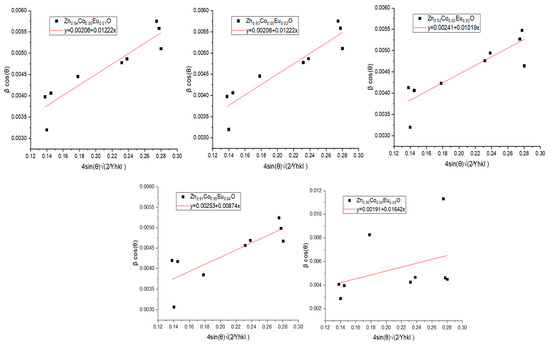
Figure 8.
Linear plots of βcos(θ) versus based on the Uniform Deformation Energy Density Model (UDEDM) for Zn0.95−xCo0.05EuxO (x = 0.00–0.05) nanoparticles.
As observed in Table 3, all structural parameters (D, u, σ, and ε) display a decreasing trend up to 4% Eu concentration, followed by a sharp increase at 5% Eu doping. The highest values recorded for 5% Eu doping were D = 72.59 nm, u = 0.2696 × 10³ J/m3, σ = 0.2108 × 10⁶ N/m2, and ε = 20.58 × 10⁻⁴.
The experimental X-ray diffraction data were validated against the JCPDS reference file (Card No. 36-1451) for wurtzite ZnO, confirming the presence of diffraction peaks corresponding to the (100), (002), (101), (102), (110), (103), (200), (112), and (201) crystallographic planes. The calculated stress and strain values for each crystallographic plane are provided in Table 4.

Table 4.
Microstrain (ε) and stress (σ) values for Co/Eu co-doped ZnO nanoparticles, evaluated using three Williamson–Hall-based models—UDM, USDM, and UDEDM—across the (100), (002), (101), (102), (110), (103), (200), (112), and (201) crystallographic planes.
Table 1 summarizes the crystallite sizes obtained via the Debye–Scherrer method, while Table 3 presents the structural parameters calculated using the UDM, USDM, and UDEDM approaches. A strong agreement is observed among the average strain values obtained from all models, while stress and energy density show a clear correlation with the average strain values.
Linear plots of βcos(θ) versus 4sin(θ) for the UDM model are shown in Figure 6. Similar linear trends are observed for βcos(θ) versus 4sin(θ)(1/Yₕₖₗ) in Figure 7 (USDM) and for βcos(θ) versus in Figure 8 (UDEDM). The consistent positive slopes in all models indicate the presence of tensile uniform stress throughout the Co/Eu co-doped ZnO samples.
Figure 9 displays the crystallite size variations calculated by the Debye–Scherrer, UDM, USDM, and UDEDM methods as a function of Eu concentration. The crystallite size decreased up to 4% Eu doping and showed a sharp increase at 5% Eu concentration, with the maximum size observed under UDM conditions (83.03 nm).
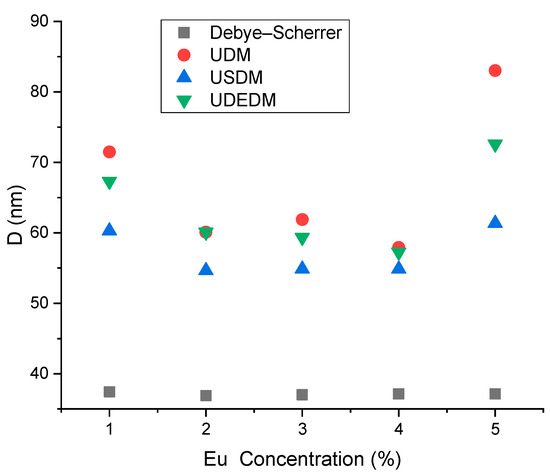
Figure 9.
Crystallite size (D) variations obtained by Debye–Scherrer, UDM, USDM, and UDEDM methods versus Eu concentration for Zn0.95−xCo0.05EuxO nanoparticles.
As shown in Figure 10a, both microstrain and stress values decrease steadily up to 4% Eu doping, followed by a significant increase at 5% Eu. The highest stress value was recorded using the USDM model (0.2448 × 10⁶ N/m2), while the highest microstrain was observed in the UDM model (21.1 × 10⁻⁴).
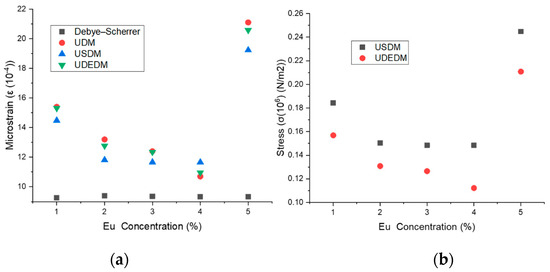
Figure 10.
(a) Microstrain values for UDM, USDM, and UDEDM and (b) stress values for USDM and UDEDM as a function of Eu concentration.
The structural properties of Co/Eu co-doped ZnO nanoparticles were analyzed using three different Williamson–Hall models: the Uniform Deformation Model (UDM), the Uniform Stress Deformation Model (USDM), and the Uniform Deformation Energy Density Model (UDEDM). Among these, the UDEDM was identified as the most reliable and comprehensive approach. Unlike UDM and USDM, which focus primarily on crystallite size, microstrain, and internal stress, the UDEDM also accounts for the elastic deformation energy density, providing a more holistic understanding of the lattice distortions caused by Eu incorporation. At 5% Eu concentration, the UDEDM yielded the highest deformation energy density (0.2696 × 10³ J/m3), reflecting significant structural modifications. Moreover, the values obtained using UDEDM demonstrated a more consistent and physically meaningful trend compared to the other models. Therefore, UDEDM was concluded to be the most accurate and reliable model for assessing the structural behavior of Co/Eu co-doped ZnO nanoparticles.
3.3. The Morphology Characteristics of Zn0.95−xCo0.05EuxO Structures
The surface morphology and elemental composition of the synthesized Zn0.95−xCo0.05EuxO nanoparticles were analyzed using Scanning Electron Microscopy (SEM (JOEL Ltd., Japan)) and Energy-Dispersive X-ray Spectroscopy (EDS (JOEL Ltd., Japan)), respectively. The SEM micrographs and corresponding EDS spectra for all samples are presented in Figure 11a, Figure 12a, Figure 13a, Figure 14a, Figure 15a, Figure 16a and Figure 11b, Figure 12b, Figure 13b, Figure 14b, Figure 15b, Figure 16b. The EDS spectra reveal the presence of Zn, Co, Eu, and O elements only, confirming the successful incorporation of Co and Eu into the ZnO lattice without any impurity phases or additional elemental contamination.

Figure 11.
(a) SEM micrograph, (b) corresponding EDS spectrum, and (c) particle analysis of Zn0.95Co0.05O NPs.

Figure 12.
(a) SEM micrograph, (b) corresponding EDS spectrum, and (c) particle analysis of Zn0.94Co0.05Eu0.01O NPs.

Figure 13.
(a) SEM micrograph, (b) corresponding EDS spectrum, and (c) particle analysis of Zn0.93Co0.05Eu0.02O NPs.

Figure 14.
(a) SEM micrograph, (b) corresponding EDS spectrum, and (c) particle analysis of Zn0.92Co0.05Eu0.03O NPs.

Figure 15.
(a) SEM micrograph, (b) corresponding EDS spectrum, and (c) particle analysis of Zn0.91Co0.05Eu0.04O NPs.

Figure 16.
(a) SEM micrograph, (b) corresponding EDS spectrum, and (c) particle analysis of Zn0.90Co0.05Eu0.05O NPs.
The SEM images, captured at a magnification of 1 µm, demonstrate that the nanoparticles exhibit predominantly spherical morphology with varying degrees of agglomeration. The particles appear to be partially fused and form dense, sponge-like clusters as the Eu concentration increases. In Figure 11c, Figure 12c, Figure 13c, Figure 14c, Figure 15c, Figure 16c, the Gaussian distribution curves of particle sizes obtained using ImageJ software (Imaje J bundled bit Java 8) are presented. It is clearly observed that most of the particle sizes are in the range of 34.68 nm to 42.91 nm. The trend observed in the SEM micrographs is consistent with the crystallite size data previously calculated via XRD (Table 1). Specifically, higher Eu doping levels promote increased agglomeration and densification of the nanoparticle clusters. Changes in surface energy and increased grain development brought on by the addition of Eu are responsible for this morphological transformation. However, because it decreases surface area and ruins uniformity, this kind of aggregation is typically undesirable for nanoscale applications.
3.4. ESR Studies
Electron spin resonance (ESR) spectroscopy is an effective technique to investigate magnetic centers in nanomaterials. It is especially useful for identifying the locations of magnetic ions or vacancies within the lattice structure. The spin Hamiltonian that describes the magnetic centers is expressed as follows:
H = μBSgeH + Hcf + SDS + SAI + μNIgnH + SJS + JS1S2
In this equation, μB represents the Bohr magneton, S is the electron spin operator, ge denotes the electron g-factor tensor, and H is the external magnetic field. Hcf stands for the crystal field Hamiltonian, D is the zero-field splitting tensor, and A represents the hyperfine interaction tensor. I denotes the nuclear spin operator, μN is the nuclear magneton, gn is the nuclear g-factor, and J corresponds to the exchange interaction constant between spins.
In this expression, the first term corresponds to the static Zeeman effect, which determines the main resonance field position and linewidth, while the last term describes dipolar and exchange interactions between spins located at different sites. Other terms account for crystal field energy, zero-field splitting, hyperfine interactions between electron and nuclear spins, spin-orbit coupling, and nuclear Zeeman interactions [4,18,28].
The ESR spectra of Co/Eu co-doped ZnO nanoparticles were recorded at room temperature using the first derivative of the absorption signal. The samples were aligned such that the sample tubes were parallel to the microwave magnetic field and perpendicular to the DC magnetic field. The spectrometer was operated with a field modulation frequency of 100 kHz and microwave power of 5 mW [29,30]. After subtracting background signals originating from the spectrometer cavity and empty sample tubes, the ESR signals were recorded in the field range of 200–400 mT. The resulting spectra are presented in Figure 17 [31,32].
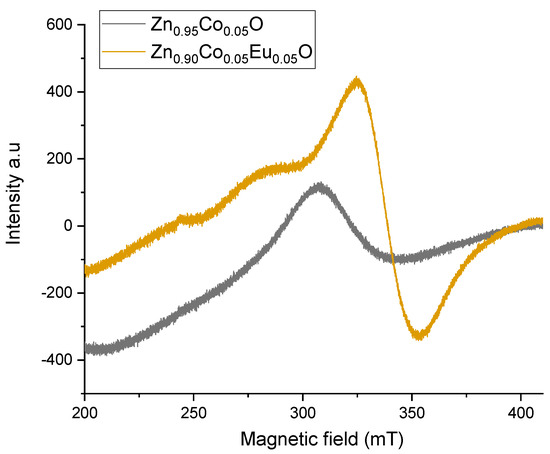
Figure 17.
ESR spectra of Zn0.95Co0.05O and Zn0.90Co0.05Eu0.05O nanoparticles at room temperature.
Figure 17 shows the ESR spectra of Zn0.95Co0.05O and Zn0.90Co0.05Eu0.05O nanoparticles recorded in the magnetic field range of 200–400 mT. Prior to analysis, background signals arising from the microwave cavity and empty sample tubes were subtracted to isolate the intrinsic resonance signals. The spin Hamiltonian introduced in Equation (11) provides a framework for interpreting the observed spectral features.
The Zeeman interaction (SgeH) plays a central role in defining the resonance peak position and line broadening. This interaction primarily governs the main resonance field. In Zn0.95Co0.05O nanoparticles, the resonance peak appears with a g-factor of approximately 2.20, which is characteristic of Co2⁺ ions under tetrahedral coordination. Upon doping with Eu3⁺, as in Zn0.90Co0.05Eu0.05O nanoparticles, the g-factor shifts to approximately 2.05, reflecting changes in the local crystal field environment induced by Eu incorporation.
The zero-field splitting term (SDS) becomes significant for Co2⁺ ions (3d7, S = 3/2). In Zn0.95Co0.05O, this splitting remains relatively moderate, but in Zn0.90Co0.05Eu0.05O, lattice distortion caused by Eu3⁺ doping leads to enhanced zero-field splitting, resulting in broader line shapes and resonance shifts toward higher fields.
Dipolar and exchange interactions (SJS, JS1S2) are also observed. In Zn0.95Co0.05O, weak dipolar coupling exists between neighboring Co2⁺ ions through Co–O–Co pathways. Eu3⁺ substitution modifies the spatial arrangement of Co2⁺ ions, enhancing Co–O–Eu–O–Co dipolar interactions. This leads to a noticeable increase in the peak-to-peak linewidth (ΔBpp) in the Eu-doped sample. The consistent observation of g > 2 in all ESR spectra is indicative of ferromagnetic behavior in Co/Eu co-doped ZnO nanoparticles. Such high g-values typically reflect localized magnetic moments and strong spin-orbit coupling effects within tetrahedrally coordinated Co2⁺ sites.
Hyperfine interactions (SAIs) are theoretically present; however, no resolved hyperfine structure is observed in either sample due to dominant spin relaxation and strong dipolar broadening effects.
Crystal field distortions (Hcf) are negligible in Zn0.95Co0.05O but become significant in Zn0.90Co0.05Eu0.05O. The incorporation of Eu3⁺ alters the local electric field distributions, which directly influence the Zeeman interaction and contribute to the observed spectral shifts and broadening.
In conclusion, the dominant resonance peak observed within 200–400 mT primarily originates from the Zeeman effect. The introduction of Eu3⁺ significantly modifies the magnetic resonance behavior by enhancing dipolar interactions, increasing crystal field distortions, and intensifying zero-field splitting effects.
3.5. Magnetic Analysis
ESR measurements were conducted at room temperature to investigate the magnetic properties of the samples. The spectra exhibited a broad single resonance peak, which is indicative of ferromagnetic behavior, as shown in Figure 17. From these ESR spectra, both the g-factor and the peak-to-peak linewidth (ΔBpp) were determined. The recorded spectra for Zn0.95Co0.05O and Zn0.90Co0.05Eu0.05O nanoparticles were scaled and analyzed using X-band ESR spectroscopy. For Zn0.90Co0.05Eu0.05O nanoparticles, a stronger and broader resonance signal was observed near 335 mT, indicating significant magnetic interaction influenced by Eu doping. The trend in g-factor values, as illustrated in Figure 18, confirms the influence of Eu doping on spin–orbit coupling and magnetic field response of the system.
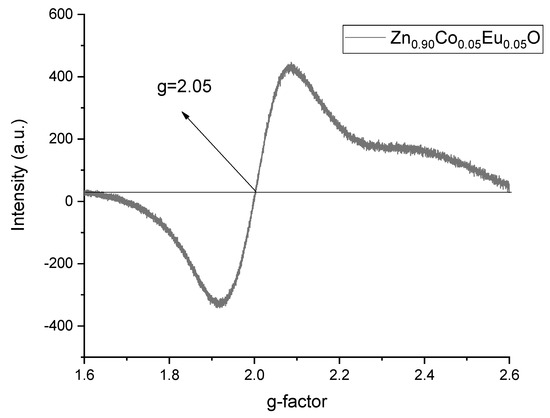
Figure 18.
Calculated g-factor from ESR spectra of Zn0.90Co0.05Eu0.05O nanoparticles.
The asymmetry factor (Pasy) was calculated using the relation:
where hL and hU represent the peak heights below and above the baseline of the ESR absorption spectrum, respectively [17]. The number of spins (Ns) was estimated using:
where is the peak-to-peak intensity and is the line width. The calculated parameters are listed in Table 5.

Table 5.
ESR parameters for Zn0.95−xCo0.05O and Zn0.95−xCo0.05Eu0.05O nanoparticles.
At 0% Eu concentration, lower and higher values were observed, whereas at 5% Eu concentration, the asymmetry factor increased and the spin population decreased. These changes reflect the influence of Eu doping on the relaxation and distribution of spins within the crystal lattice. To further explore the spin relaxation mechanisms, the g-factor and values were analyzed. As indicated in Table 5, decreased from 34.81 mT to 28.49 mT upon Eu doping.
At 0% Eu concentration, lower and higher values were found compared to 5% concentration. To understand the relaxation mechanism of the spins in the ESR spectrum, the g-factor and were analyzed. As shown in Table 5, the p values of the ESR signals were found to be in the range of 34.81 to 28.49 mT.
The g-factor values were calculated using the fundamental ESR resonance condition:
where h is Planck’s constant, ν\nuν is the operating frequency (9.45 GHz for X-band ESR), μB is the Bohr magneton, and H is the applied magnetic field. Rearranging the equation yields:
g = 71.4477 ν/H
Using this expression, the g-factor values were determined and plotted in Figure 18. A g-factor greater than 2 indicates ferromagnetic characteristics of the ZnCoEuO nanoparticles, as supported by the data in Table 5. This ferromagnetic behavior can be attributed to microstrain and internal stress within the samples. With increasing Eu content, an initial decrease in crystallite size and microstrain was observed; however, at 5% Eu doping, a significant increase in crystallite size (UDM: 83.03 nm) was accompanied by notable increases in microstrain (UDM: ε = 21.1 × 10⁻⁴), internal stress (USDM: σ = 0.2448 × 10⁶ N/m2), and deformation energy density (UDEDM: u = 0.2696 × 10³ J/m3). In ESR analysis, the g-factor decreased from 2.11 to 2.05, while the linewidth narrowed with increasing Eu content. These findings suggest that Eu doping alters crystal symmetry, enhances dipolar interactions, and increases zero-field splitting, leading to significant modifications in both structural and magnetic properties.
4. Conclusions
Zn0.95−xCo0.05EuxO (x = 0.01–0.05, with increments of 0.01) nanoparticles were successfully synthesized using the sol–gel technique. The crystallite sizes and macrostrain values of Co/Eu co-doped ZnO nanoparticles were determined using four distinct methods: Debye–Scherrer, Uniform Deformation Model (UDM), Uniform Stress Deformation Model (USDM), and Uniform Deformation Energy Density Model (UDEDM). The results indicated that both crystallite size and macrostrain decreased with increasing Eu concentration up to 4%, followed by a sharp increase at 5% Eu content. The maximum crystallite size of 83.03 nm was observed in the UDM model, while the highest internal stress of 0.2448 × 10⁶ N/m2 and the maximum microstrain of 21.1 × 10⁻⁴ were obtained from the USDM and UDM models, respectively.
The ESR analyses were conducted for 0% and 5% Eu-doped samples, correlating the observed magnetic behavior with the structural data obtained from the different models. The g-factor decreased from 2.11 at 0% Eu to 2.05 at 5% Eu, accompanied by a narrowing of the resonance linewidth. These changes indicate that Eu incorporation induces lattice distortion, enhances dipolar interactions, and intensifies zero-field splitting, collectively altering both the structural and magnetic characteristics of the nanoparticles. The ESR data revealed ferromagnetic characteristics at room temperature, with Eu doping enhancing magnetic coupling between Co2+ ions via Co-O-Eu-O-Co linkages.
Funding
This research received no external funding.
Informed Consent Statement
Not applicable.
Data Availability Statement
The data are contained within the article.
Acknowledgments
I would like to thank L. Arda from Bahçeşehir University for his valuable contribution and discussions on the structural and physical characterizations. Moreover, I would like to thank the Photonic and Nano Devices Laboratuary of Bahcesehir University for measurements.
Conflicts of Interest
The author declares no conflict of interest.
References
- Arda, L.; Ozugurlu, E. The effects of Co/Ce co-doped ZnO thin films: An optical and defect study. J. Mater. Sci. Mater. Electron. 2025, 36, 896. [Google Scholar] [CrossRef]
- Senturk, K.; Arda, L. Effects of Fe Concentration on the Structural, Optical and Biological Properties of ZnMgO Nanoparticles. Z. Naturforsch. A 2025, 60, 2400182. [Google Scholar] [CrossRef]
- Arda, L.; Raad, Z.; Veziroglu, S.; Tav, C.; Yahsi, U. The Influence of Defects on the Structural, Optical, and Antibacterial Properties of Cr/Cu Co-Doped ZnO Nanoparticles. J. Mol. Struct. 2025, 1320, 139663. [Google Scholar] [CrossRef]
- Boyraz, C.; Seker Perez, M.M.; Arda, L. Structure, microstructure, and ESR properties of concentration-dependent Zn1-xMnxO nanoparticles. Ceram. Int. 2024, 50, 50855–50866. [Google Scholar] [CrossRef]
- Ronning, C.; Gao, P.X.; Ding, Y.; Wang, Z.L.; Schwen, D. Manganese-doped ZnO nanobelts for spintronics. Appl. Phys. Lett. 2004, 84, 783–785. [Google Scholar] [CrossRef]
- Wolf, S.A.; Awschalom, D.; Buhrman, R.A.; Daughton, J.M.; Molnar, S.V.; Roukes, M.L.; Chtchelkanova, A.Y.; Treger, D.M. Spintronics: A Spin-Based Electronics Vision for the Future. Science 2001, 294, 1488. [Google Scholar] [CrossRef]
- Tosun, M.; Senol, S.D.; Arda, L. Effect of Mn/Cu co-doping on the structural, optical and photocatalytic properties of ZnO nanorods. J. Mol. Struct. 2020, 1212, 128071. [Google Scholar] [CrossRef]
- Lin, H.; Xing, S.; Jiang, A.; Li, M.; Chen, Q.; Wang, Z.; Jiang, L.; Li, H.; Wang, J.; Zhou, C. Controlled Synthesis of Large-Area Oriented ZnO Nanoarrays. Nanomaterials 2024, 14, 1028. [Google Scholar] [CrossRef] [PubMed]
- Dietl, T. Ferromagnetic semiconductors. Semicond. Sci. Technol. 2002, 17, 377. [Google Scholar] [CrossRef]
- Senol, S.D.; Ozugurlu, E.; Arda, L. The effect of cobalt and boron on the structural, microstructural, and optoelectronic properties of ZnO nanoparticles. Ceram. Int. 2020, 46, 7033–7044. [Google Scholar] [CrossRef]
- Tosun, M.; Arda, L. Effect of temperature and film thickness on structural and mechanical properties of c-axis oriented Zn0.95Mg0.05O thin films. Ceram. Int. 2019, 45, 16234–16243. [Google Scholar] [CrossRef]
- Fu, S.; Xi, W.; Ren, J.; Wei, H.; Sun, W. Study on the Photocatalytic Properties of Metal–Organic Framework-Derived C-, N-Co-Doped ZnO. Materials 2024, 17, 855. [Google Scholar] [CrossRef]
- Senol, S.D.; Boyraz, C.; Ozugurlu, E.; Gungor, A.; Arda, L. Band Gap Engineering of Mg Doped ZnO Nanorods Prepared by a Hydrothermal Method. Cryst. Res. Technol. 2019, 54, 1800233. [Google Scholar] [CrossRef]
- Akcan, D.; Ozharar, S.; Ozugurlu, E.; Arda, L. The effects of Co/Cu Co-doped ZnO thin films: An optical study. J. Alloys Compd. 2019, 797, 253–261. [Google Scholar] [CrossRef]
- Kubiak, T.; Dobosz, B. Road Map for the Use of Electron Spin Resonance Spectroscopy in the Study of Functionalized Magnetic Nanoparticles. Materials 2025, 18, 2841. [Google Scholar] [CrossRef]
- Acosta-Humánez, M.F.; Magon, C.J.; Montes-Vides, L.; Jiménez, J.; Almanza, O. Structural, Magnetic, Optical and Photocatalytic Properties of Co-Doped ZnO Nanocrystals. Int. J. Mol. Sci. 2025, 26, 2117. [Google Scholar] [CrossRef]
- Guler, A.; Arda, L.; Dogan, N.; Boyraz, C.; Ozugurlu, E. The annealing effect on microstructure and ESR properties of (Cu/Ni) co-doped ZnO nanoparticles. Ceram. Int. 2019, 45, 1737–1745. [Google Scholar] [CrossRef]
- Arda, L. The effects of Tb doped ZnO nanorod: An EPR study. J. Magn. Magn. Mater. 2019, 475, 493–501. [Google Scholar] [CrossRef]
- Xue, S.; Zhang, F.; Zhang, S.; Wang, X.; Shao, T. Electronic and Magnetic Properties of Ni-Doped Zinc-Blende ZnO: A First-Principles Study. Nanomaterials 2018, 8, 281. [Google Scholar] [CrossRef]
- Kumar, S.; Ahmed, F.; Ahmad, N.; Shaalan, N.M.; Kumar, R.; Alshoaibi, A.; Arshi, N.; Dalela, S.; Sayeed, F.; Kumari, K. Structural, Morphological, Optical and Magnetic Studies of Cu-Doped ZnO Nanostructures. Materials 2022, 15, 8184. [Google Scholar] [CrossRef] [PubMed]
- Ahmad, I.; Akhtar, M.S.; Ahmed, E.; Ahmad, M. Facile synthesis of Pr-doped ZnO photocatalyst using sol-gel method and its visible-light photocatalytic activity. J. Mater. Sci. Mater. Electron. 2020, 31, 1084–1093. [Google Scholar] [CrossRef]
- Heiba, Z.K.; Arda, L.; Mohamed, M.B.; Mostafa, N.Y.; Al-Jalali, M.A.; Dogan, N. Effect of annealing temperature on structural and magnetic properties of Zn0.94Co0.05Cu0.01O. J. Supercond. Nov. Magn. 2013, 26, 3299–3304. [Google Scholar] [CrossRef]
- Arda, L.; Karatas, O.; Alphan, M.C.; Ozugurlu, E. Electron spin resonance and photoluminescence studies of Co/Mg co-doped ZnO nanoparticles. J. Supercond. Nov. Magn. 2024, 21, 2458–2473. [Google Scholar] [CrossRef]
- Stokes, A.R.; Wilson, A.J.C. The diffraction of x rays by distorted crystal aggregates—I. Proc. Phys. Soc. 1944, 56, 174–181. [Google Scholar] [CrossRef]
- Mote, V.D.D.; Dargad, J.S.S.; Purushotham, Y.; Dole, B.N.N. Effect of doping on structural, physical, morphological and optical properties of Zn1−xMnxO nanoparticles. Ceram. Int. 2015, 41, 15153–15161. [Google Scholar] [CrossRef]
- Balzar, D.; Ledbetter, H.J. Voigt function modeling in Fourier analysis of size and strain broadened X-ray diffraction peaks. J. Appl. Crystallogr. 1993, 26, 97. [Google Scholar] [CrossRef]
- Warren, B.E.; Averbach, B.L. The effect of cold-work distortion on X-ray patterns. J. Appl. Phys. 1950, 21, 595. [Google Scholar] [CrossRef]
- Boyraz, C.; Dogan, N.; Arda, L. Microstructure and magnetic behavior of (Mg/Ni) co-doped ZnO nanoparticles. Ceram. Int. 2017, 43, 15986–15991. [Google Scholar] [CrossRef]
- Arda, L.; Acikgoz, M.; Dogan, N.; Akcan, D.; Cakiroglu, O. Synthesis, Characterization and ESR Studies of Zn1−x Co x O Nanoparticles. J. Supercond. Nov. Magn. 2014, 27, 799–804. [Google Scholar] [CrossRef]
- Cakiroglu, O.; Acikgoz, M.; Arda, L.; Akcan, D.; Dogan, N. Synthesis, structure and ESR studies of Mg doped ZnAlO nanoparticles. J. Magn. Magn. Mater. 2015, 373, 60–64. [Google Scholar] [CrossRef]
- Cieniek, B.; Stefaniuk, I.; Virt, I.; Gamernyk, R.V.; Rogalska, I. Zinc–Cobalt Oxide Thin Films: High Curie Temperature Studied by Electron Magnetic Resonance. Molecules 2022, 27, 8500. [Google Scholar] [CrossRef] [PubMed]
- Arda, L.; Acikgoz, M.; Heiba, Z.K.; Dogan, N.; Akcan, D.; Cakiroglu, O. Synthesis, characterization and ESR studies of powder Zn0.95−xMg0.05AlxO (x = 0.0, 0.01, 0.02, 0.05, and 0.1) nanocrystals. Solid State Commun. 2013, 170, 14–18. [Google Scholar] [CrossRef]
Disclaimer/Publisher’s Note: The statements, opinions and data contained in all publications are solely those of the individual author(s) and contributor(s) and not of MDPI and/or the editor(s). MDPI and/or the editor(s) disclaim responsibility for any injury to people or property resulting from any ideas, methods, instructions or products referred to in the content. |
© 2025 by the author. Licensee MDPI, Basel, Switzerland. This article is an open access article distributed under the terms and conditions of the Creative Commons Attribution (CC BY) license (https://creativecommons.org/licenses/by/4.0/).