3.1. Simulation of the Temperature Field in a Femtosecond Laser Ablation of Graphene
In this study, a thermodynamic model of the femtosecond laser irradiation on the graphite-coated/high-purity aluminum substrate system was established using the Abaqus/Standard 2023 finite element analysis software, and the temperature field evolution law and ablation mechanism during the removal process of graphene materials were deeply explored. Considering the multi-scale physical phenomena existing in the femtosecond laser processing, including transient heat conduction, convective heat transfer, and phase change, a simplified temperature field model was adopted for numerical simulation. This modeling strategy was mainly based on the following considerations: Firstly, a three-dimensional finite element model requires extremely high-density mesh units when simulating the effect of femtosecond lasers, resulting in a huge amount of computation; secondly, the action time of the laser shock wave is extremely short (femtosecond to picosecond scale), while the stable formation of the residual stress field requires a longer simulation time scale. To improve computational efficiency, the model mainly focused on the key heat transfer mechanisms, such as convective heat transfer between the material and the environment and surface heat conduction. At the same time, based on the experimental fact that graphene maintains good thermal stability at high temperatures, the minor influence of its thermal physical parameters changing with temperature was reasonably ignored. The physical parameters of graphite are shown in
Table 3.
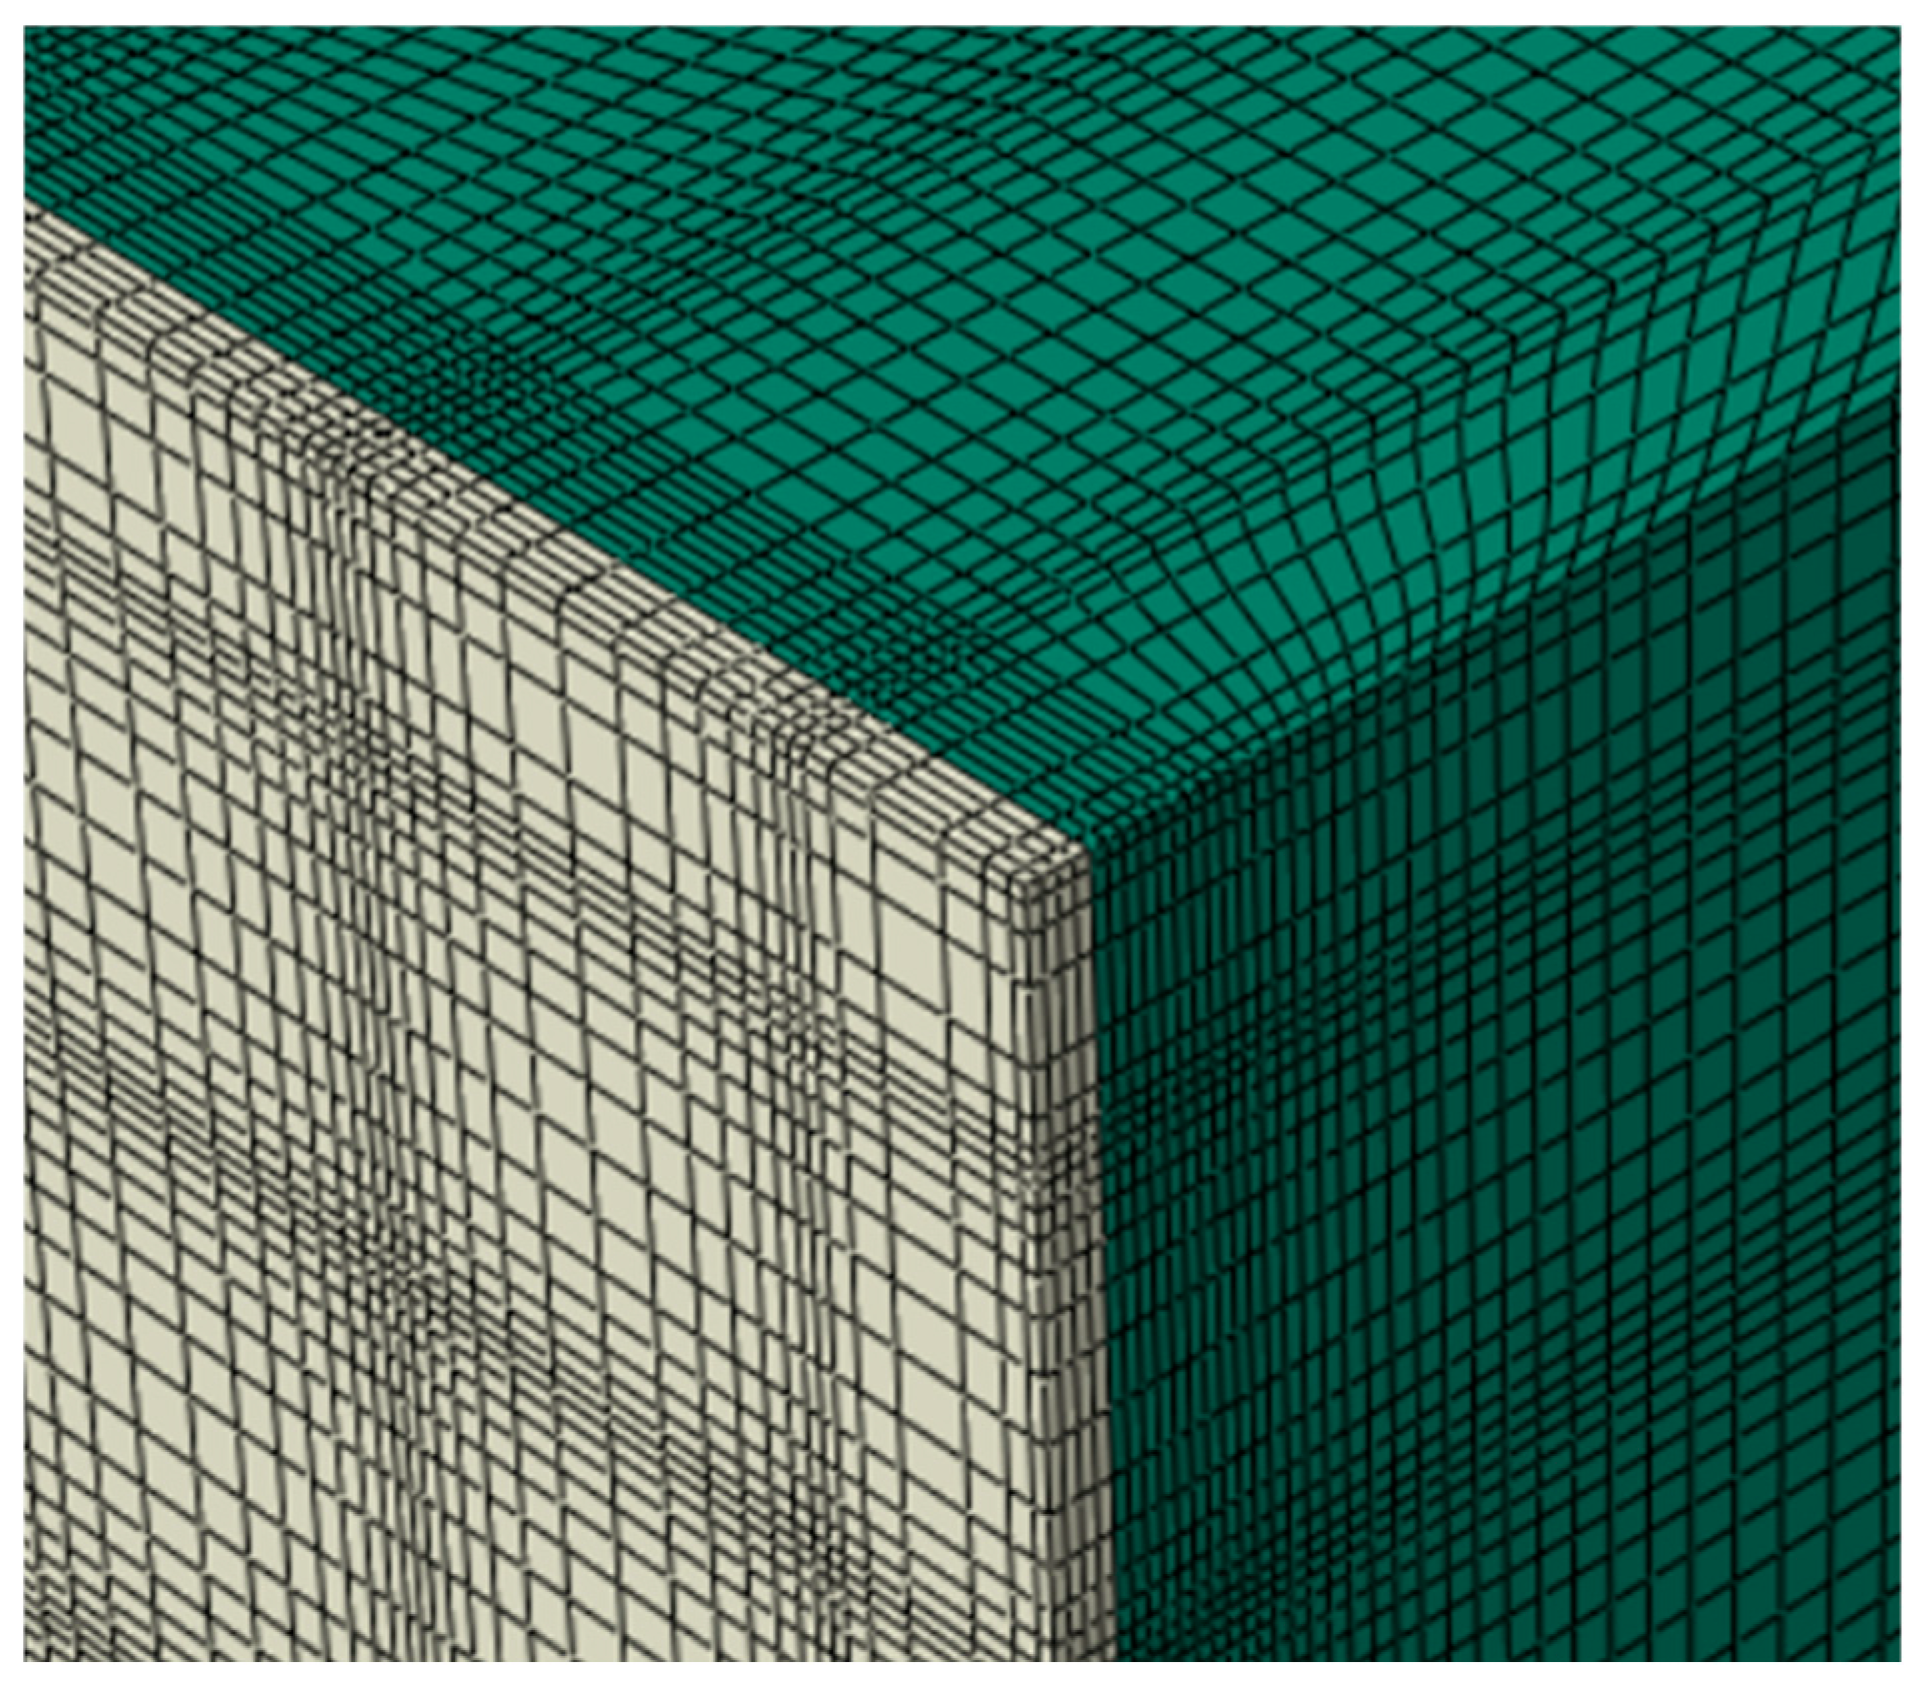
To enhance the calculation accuracy and speed, a 3D solid model of a graphite-coated aluminum ingot with dimensions of 150 μm × 150 μm × 51.5 μm was established in the component, with the graphite layer thickness being 1.5 μm. In the finite element simulation model, the element type was DC3D8R, and the global mesh size of the model was 2.4 μm, with the minimum size being 0.4 μm and the maximum being 16 μm. The mesh stacking direction was the top surface of the material. To improve the accuracy of the simulation analysis, a finer mesh was adopted in the adjacent area of the coating–substrate interface, as shown in
Figure 2. The total number of meshes was 21,469.
The model selects the top surface of the graphene material as the laser loading surface. The ambient temperature is 25 °C under one standard atmosphere, the heat dissipation coefficient of the film layer is 0.02, the Stefan–Boltzmann constant is 5.67 × 10
−8 W·m
−2·k
−4, and the bottom surface is used as the convective heat transfer interface. During the laser loading process, the heat flux required by each grid is calculated as the surface load and applied to each element. Therefore, the dynamic calculation is achieved by using the birth and death element method: when the temperature of an element exceeds the critical value of graphene, the element is deleted, and the element below it becomes the new surface for the thermal load. By calling the Deflux user subroutine, variables such as laser energy and the number of pulses are defined. The pulse width is fixed at 290 fs, and the laser spot diameter is 12 μm. The laser flux is expressed by the Gaussian heat source model as follows:
Among them, Q represents the heat flux density at any point within the laser spot; η is the laser utilization rate; r is the radius of the laser spot; P is the laser power; and R is the distance from any point to the center of the heat source.
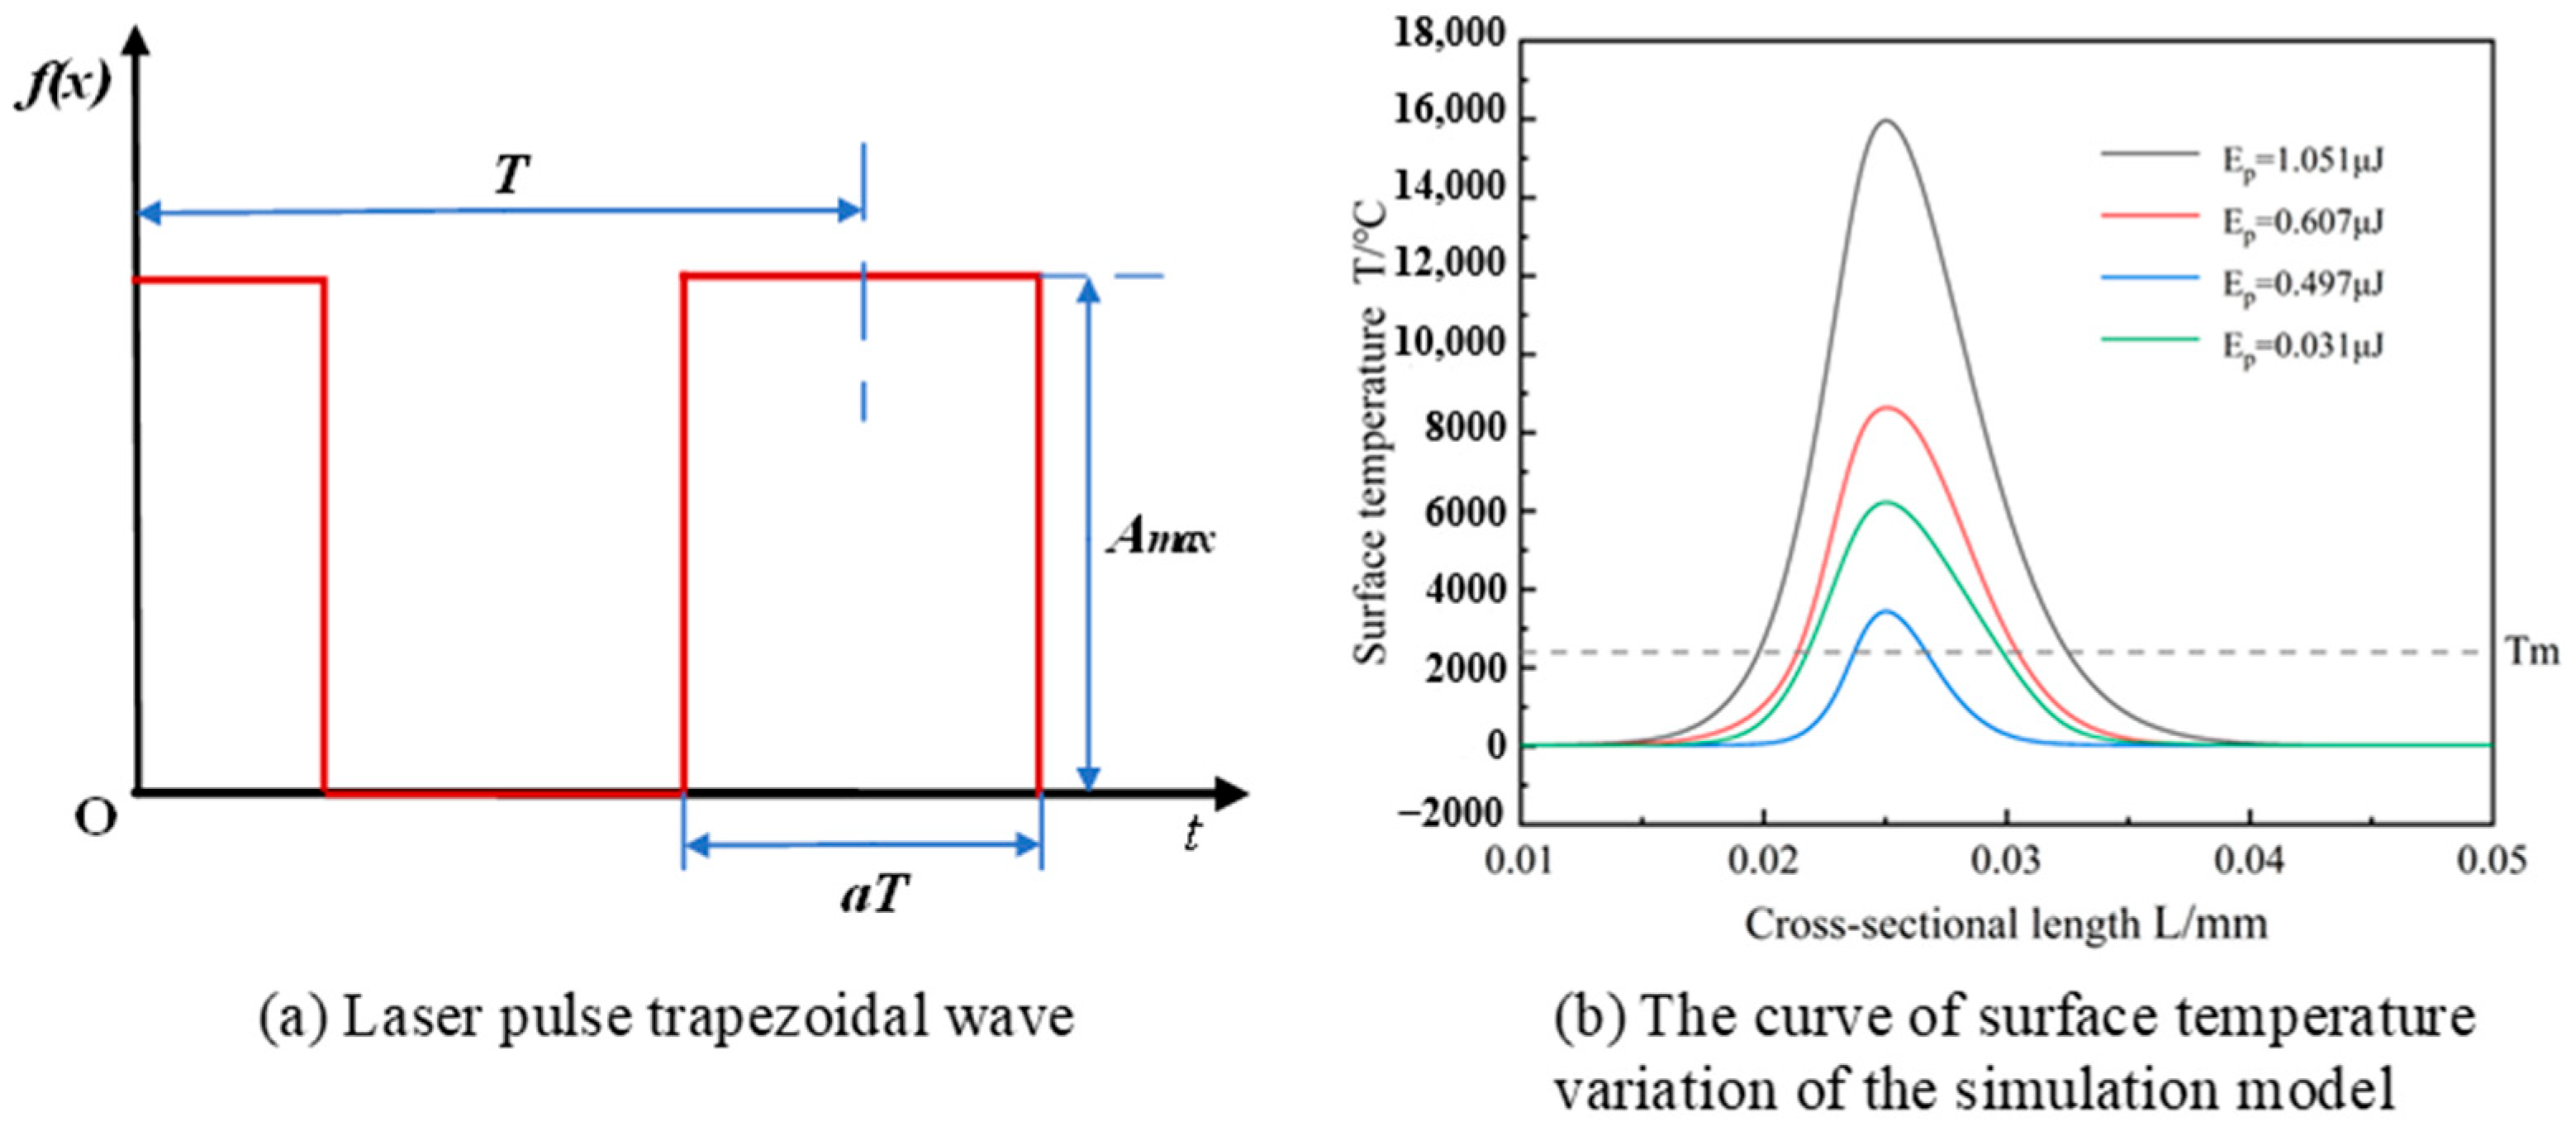
The surface temperature variations in the ablation holes in the finite element simulation under different laser pulse waveforms and laser energies are shown in
Figure 3a,b. The temperature at the center of the laser is far above the sublimation temperature Tm of the graphene material. In the experiment, the pulse wave is an even function with a period of T (the sum of the laser energy loading time and the time when the loading stops), an amplitude of A
max, and a pulse width of αT. The Fourier series expansion in the interval [−T/2, T/2] is
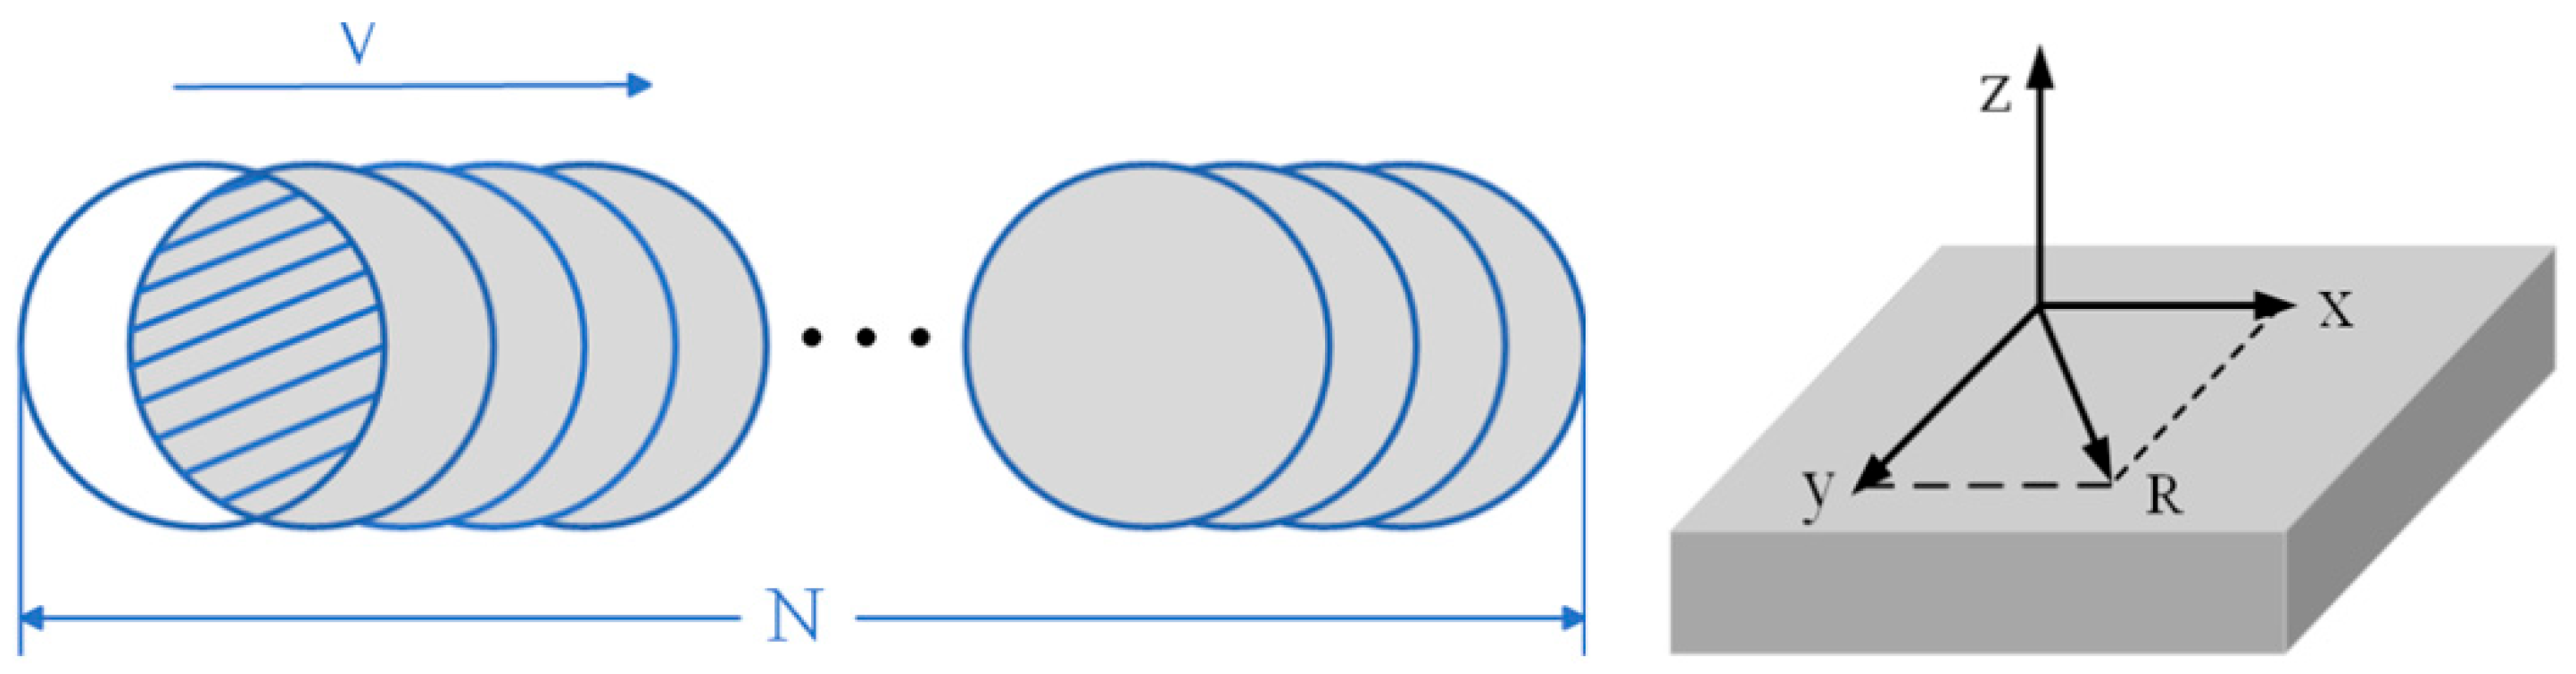
When conducting a moving heat source simulation in the graphene-coated aluminum model to study the variation in the width of the femtosecond laser ablation groove, a three-dimensional coordinate system can be established at the lower left corner of the model’s top surface. In the study of the ablation groove under the moving heat source, let R be the distance from any point to the center of the heat source, and x, y be the coordinate position of that point. Then, the formula for the movement of the heat source is defined as
The overlap rate of the light spots plays a crucial role in the femtosecond laser ablation process. To calculate the overlap rate of two adjacent light spots, the light spots can be regarded as circles with a radius of 6 μm, as shown in
Figure 4. Additionally, since the pulse duration is 290 fs, which is equivalent to the interval between adjacent pulses, the overlap rate of the light spots can be obtained through geometric calculation based on the final groove morphology. Specifically, the area of the overlapping shadow is divided by the area of the two intersecting circles, resulting in an overlap rate of 81.62%, which means that the same area will be affected by laser pulses five times.
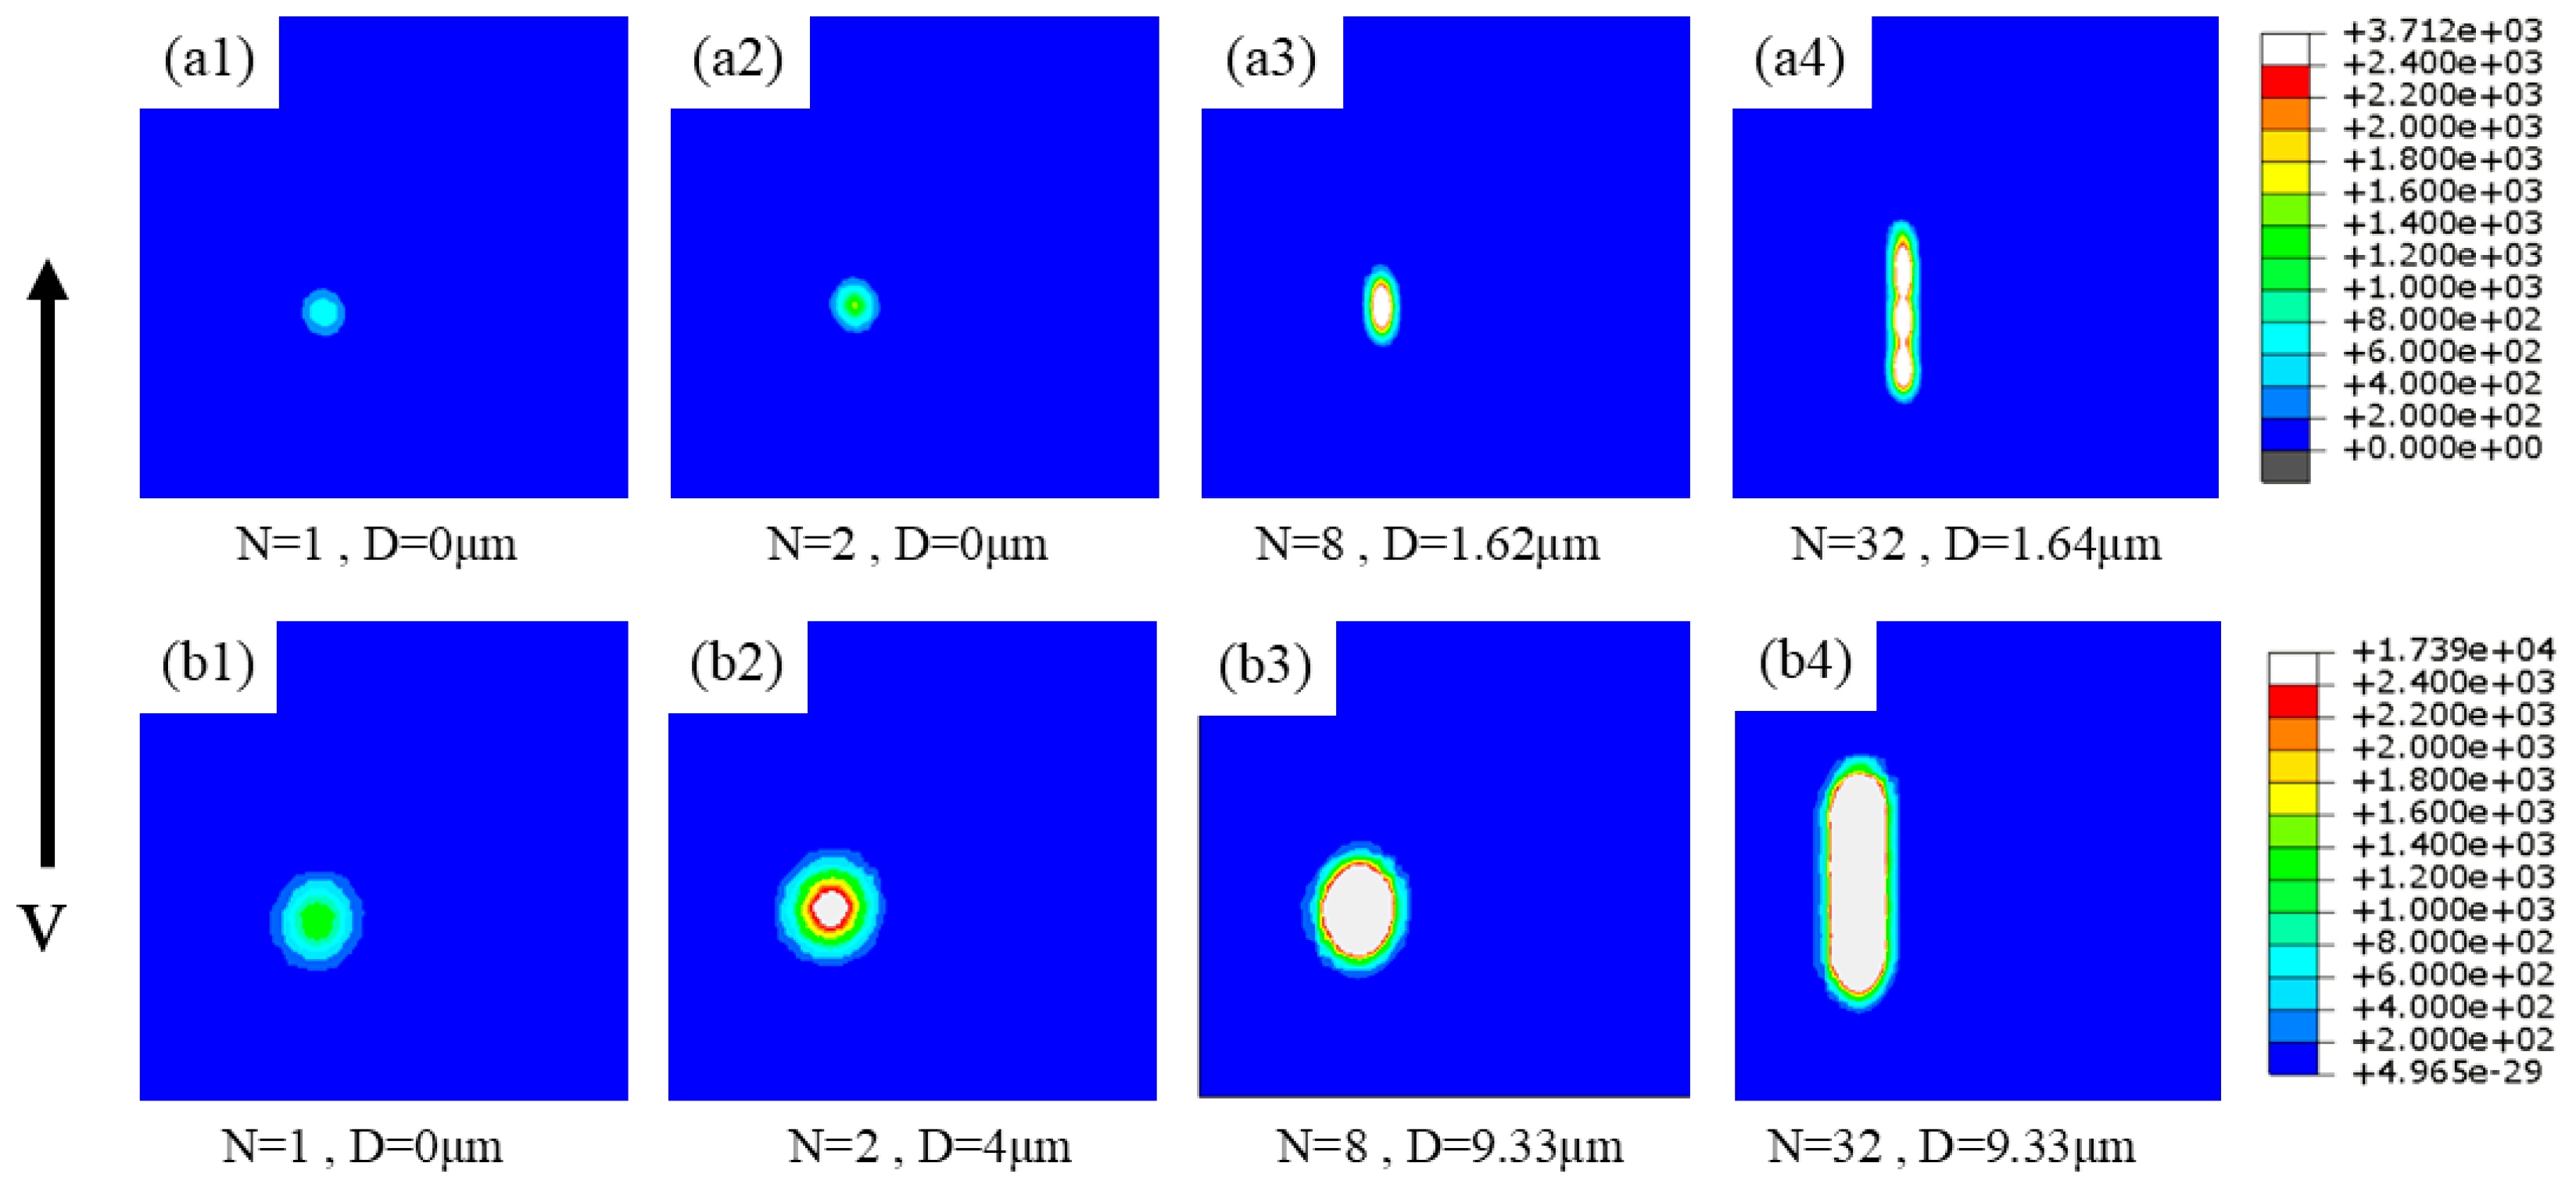
Figure 5(a1–a4) and
Figure 5(b1–b4), respectively, shows the dynamic changes in femtosecond pulsed laser ablation of materials under laser energies of 0.031 μJ and 1.051 μJ. The experimental results indicate that the morphology evolution of the laser ablation grooves exhibits significant orientation dependence, and the expansion direction is consistent with the scanning trajectory of the moving heat source (
y-axis direction). As shown in
Figure 5, in the initial ablation stage, the surface temperature of the material shows a gradient increase, resulting in a linear increase in the ablation width with the cumulative effect of the pulses. When the number of pulses reaches a critical value (about 8 pulses), the thermal accumulation and thermal diffusion reach a dynamic equilibrium, and at this time, the width of the ablation groove tends to stabilize, as shown in
Figure 5(a3,b3). This phenomenon indicates that the material has reached a thermal saturation state. It is worth noting that the saturation of the ablation width mainly depends on the balance relationship between the laser energy density and the thermal diffusion characteristics of the material.
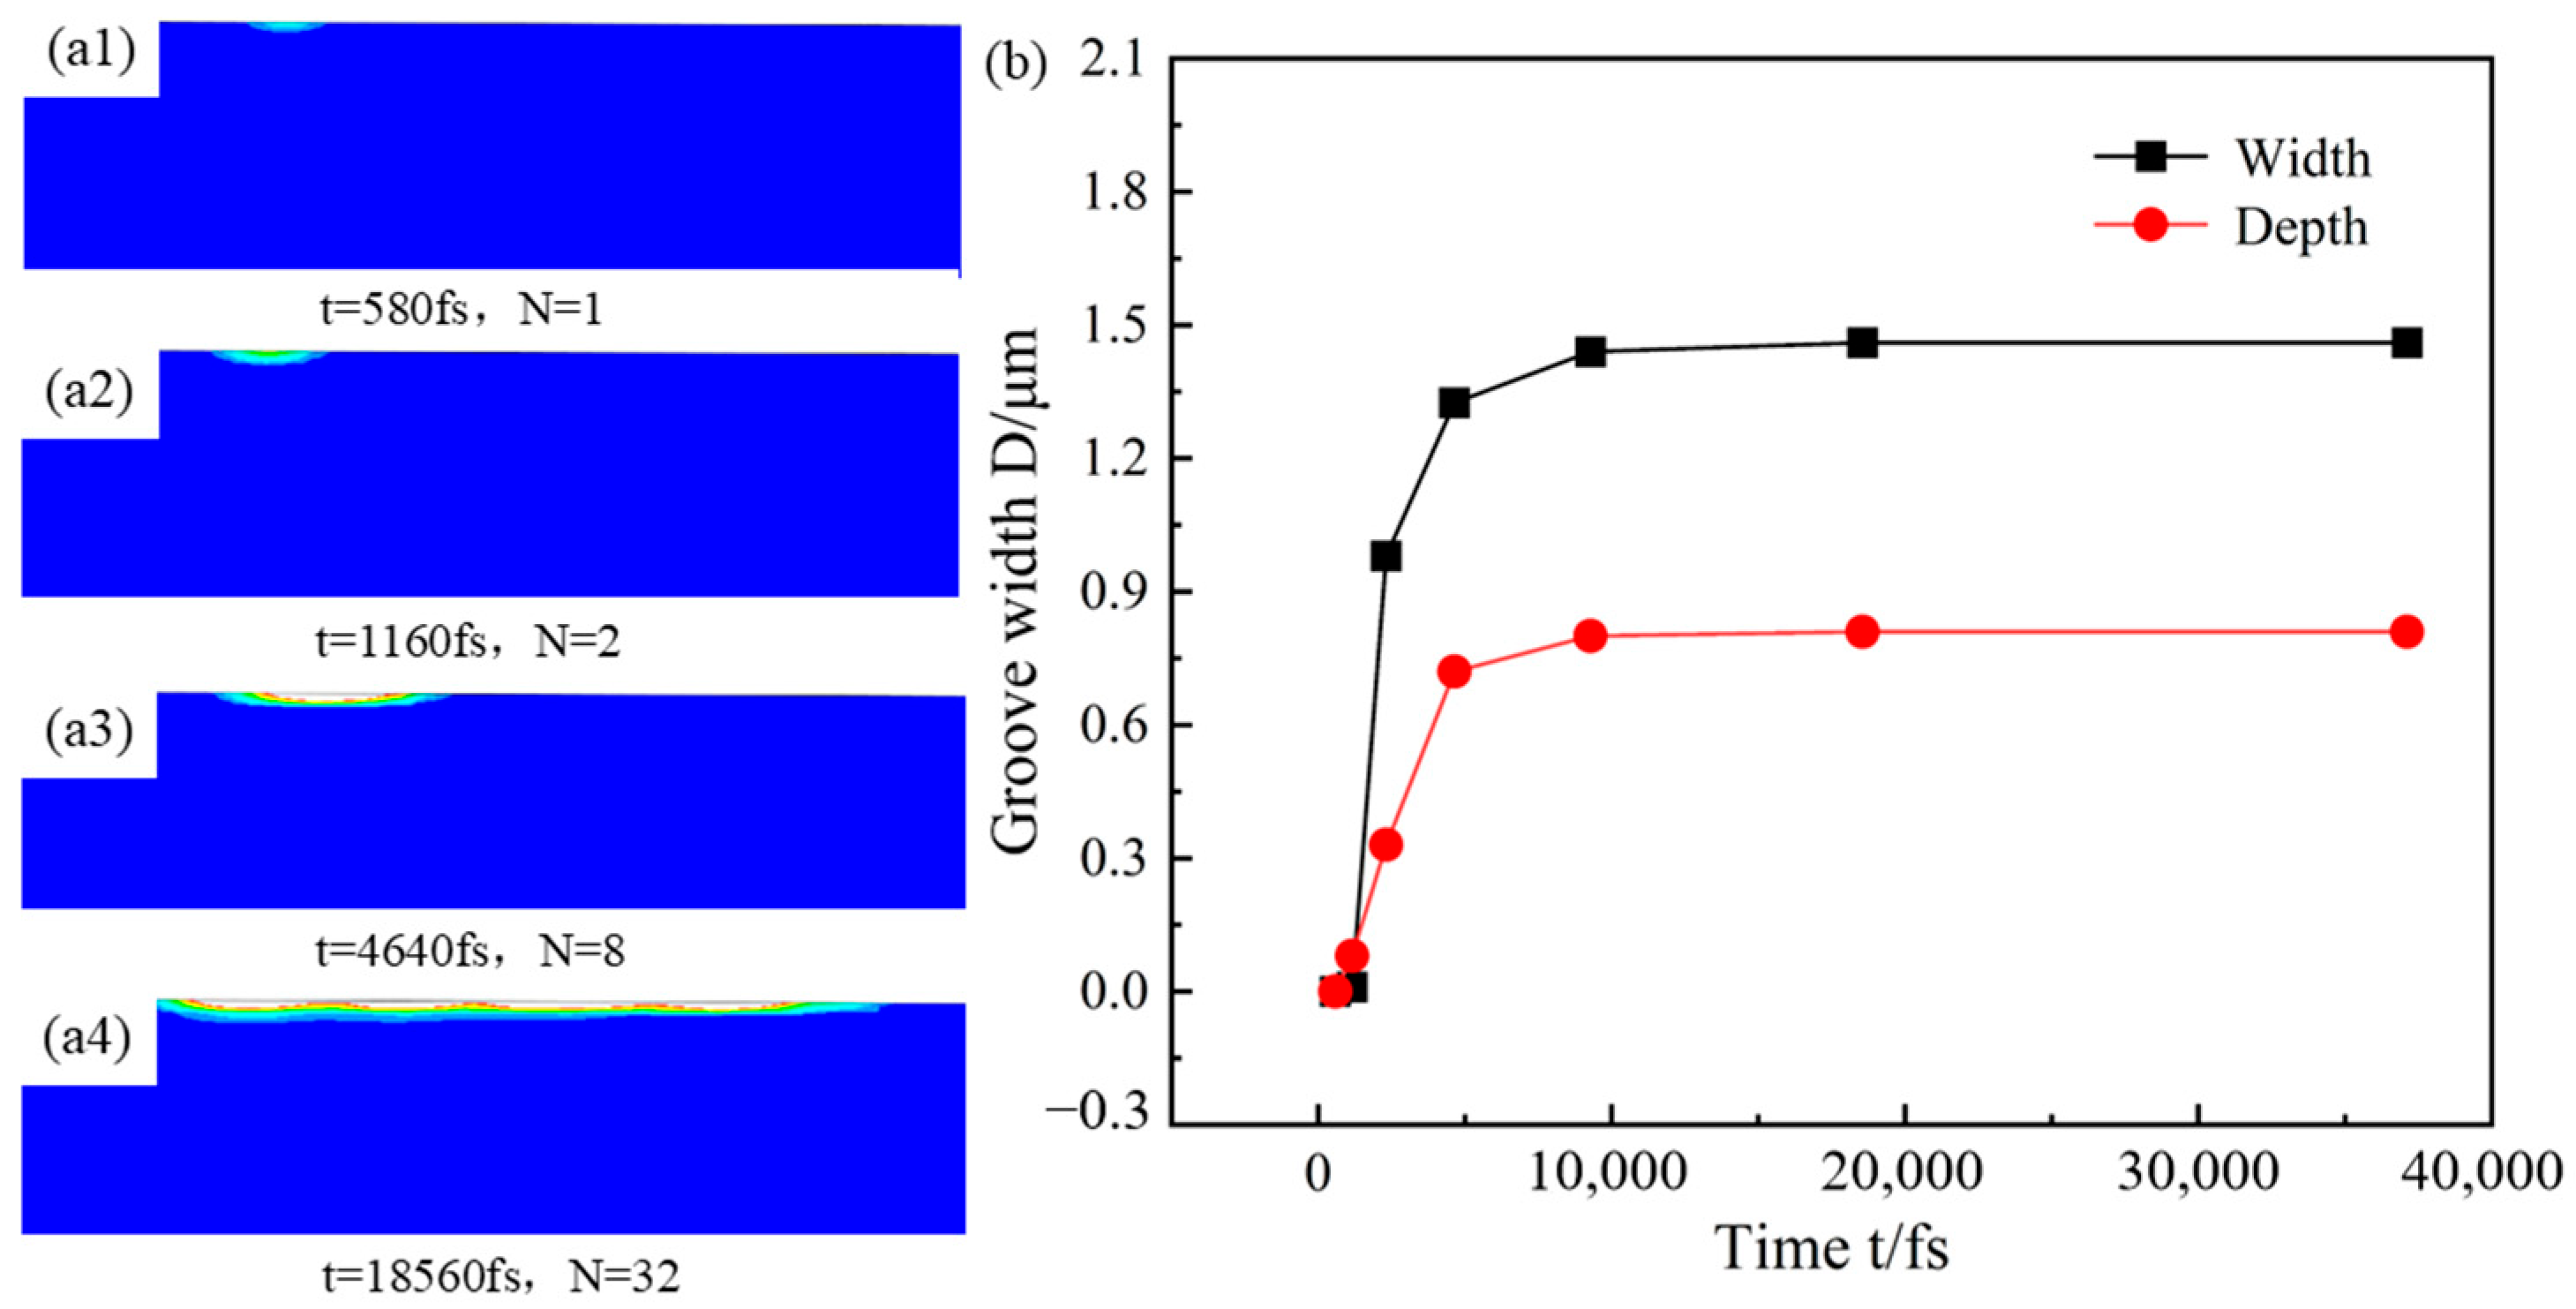
According to the simulation results, under the condition of the same laser pulse width and pulse number, different laser energies can cause significant differences in the diameter of the ablation craters in the material. When the laser energy is 0.031 μJ, by comparing
Figure 5 with
Figure 6, it can be seen that the characteristic dimensions of the ablation morphology increase with the increase in the incident pulse number and tend to stabilize after the eighth pulse. As shown in
Figure 6(a3), its width eventually reaches about 1.46 μm, approaching saturation, and the depth is about 0.81 μm, approaching saturation. This size effect mainly stems from (1) the enhancement effect of the square relationship of energy density on the efficiency of multi-photon absorption and (2) the expansion of the energy deposition area caused by the intensification of the plasma shielding effect with the increase in energy.
When the femtosecond laser energy is 1.051 μJ, the depth and morphology of the ablation groove in the temperature field simulation change with time and the number of pulses as shown in
Figure 7. As the number of pulses continuously increases, the surface temperature of the material gradually rises. Due to the spot overlap effect, the heat accumulates continuously along the direction of the heat source movement. Eventually, the bottom of the ablation pit flows toward the heat source direction before the surface, the heat-affected zone range continuously shrinks, and the depth and width of the groove gradually increase and eventually tend to saturation and stability. As shown in
Figure 7(a3), its width finally reaches about 9.33 μm, approaching saturation, and the depth is about 1.51 μm, approaching saturation.
From the simulated ablation morphologies of the energy 0.031 μJ and 1.051 μJ above, it can be seen that the depth and width of the ablation grooves do not increase infinitely but tend to stabilize after reaching a certain threshold, approximately at 4640 fs, after eight pulses. Moreover, the depth and diameter of the grooves created by the laser are linearly related to the laser pulse energy, and the variation pattern of the hole depth and diameter is basically consistent with the results obtained in reference [
14]. The establishment of the finite element simulation model is conducive to more convenient and rapid research on the influence of femtosecond laser parameters on the ablation surface graphene grooves, and the above results indicate that the numerical finite element model can be used to analyze the process of the femtosecond laser/graphene interaction.
3.2. Test Results
3.2.1. Femtosecond Laser Ablation of Graphene
In actual processing, due to the multi-layer structure of graphene, the material surface is rough and the pore size is difficult to measure directly. Therefore, a groove structure is continuously machined on the material surface instead of a hole. When the laser action time is much longer than the pulse width of the femtosecond laser, multiple laser spots will overlap in a very small area, and any point on the laser scanning path will be repeatedly scanned. At this time, the processing area will be etched due to the cumulative effect of multiple pulses [
19]. To better describe the variation law of the ablation threshold under the pulse accumulation effect, the scanning speed is converted into the effective pulse number. Assuming that the pulse accumulation effect of the linear scanning of the femtosecond laser is consistent with the effect of the pulse pair on the hole drilling, the effective pulse number N of the processing area can be calculated by the following formula:
Here, k represents the number of scans, with the experimental value set at 1. ω0 is the beam waist radius, and f is the repetition frequency. Therefore, the effective number of pulses in this experiment is 120.
When graphene is ablated, the combination of multiple processing parameters will affect the overlap of the light spots, thereby influencing the ablation effect of graphene. Therefore, improving the calculation accuracy of the light spot overlap rate can more accurately control the ablation depth. The calculation formula of the overlap rate of Gaussian light spots is as follows:
If v represents the scanning speed and f represents the laser repetition frequency, then the spot repetition rate is 99.2%.
According to the groove contour diagram formed by femtosecond laser ablation of graphene coating shown in
Figure 3 and
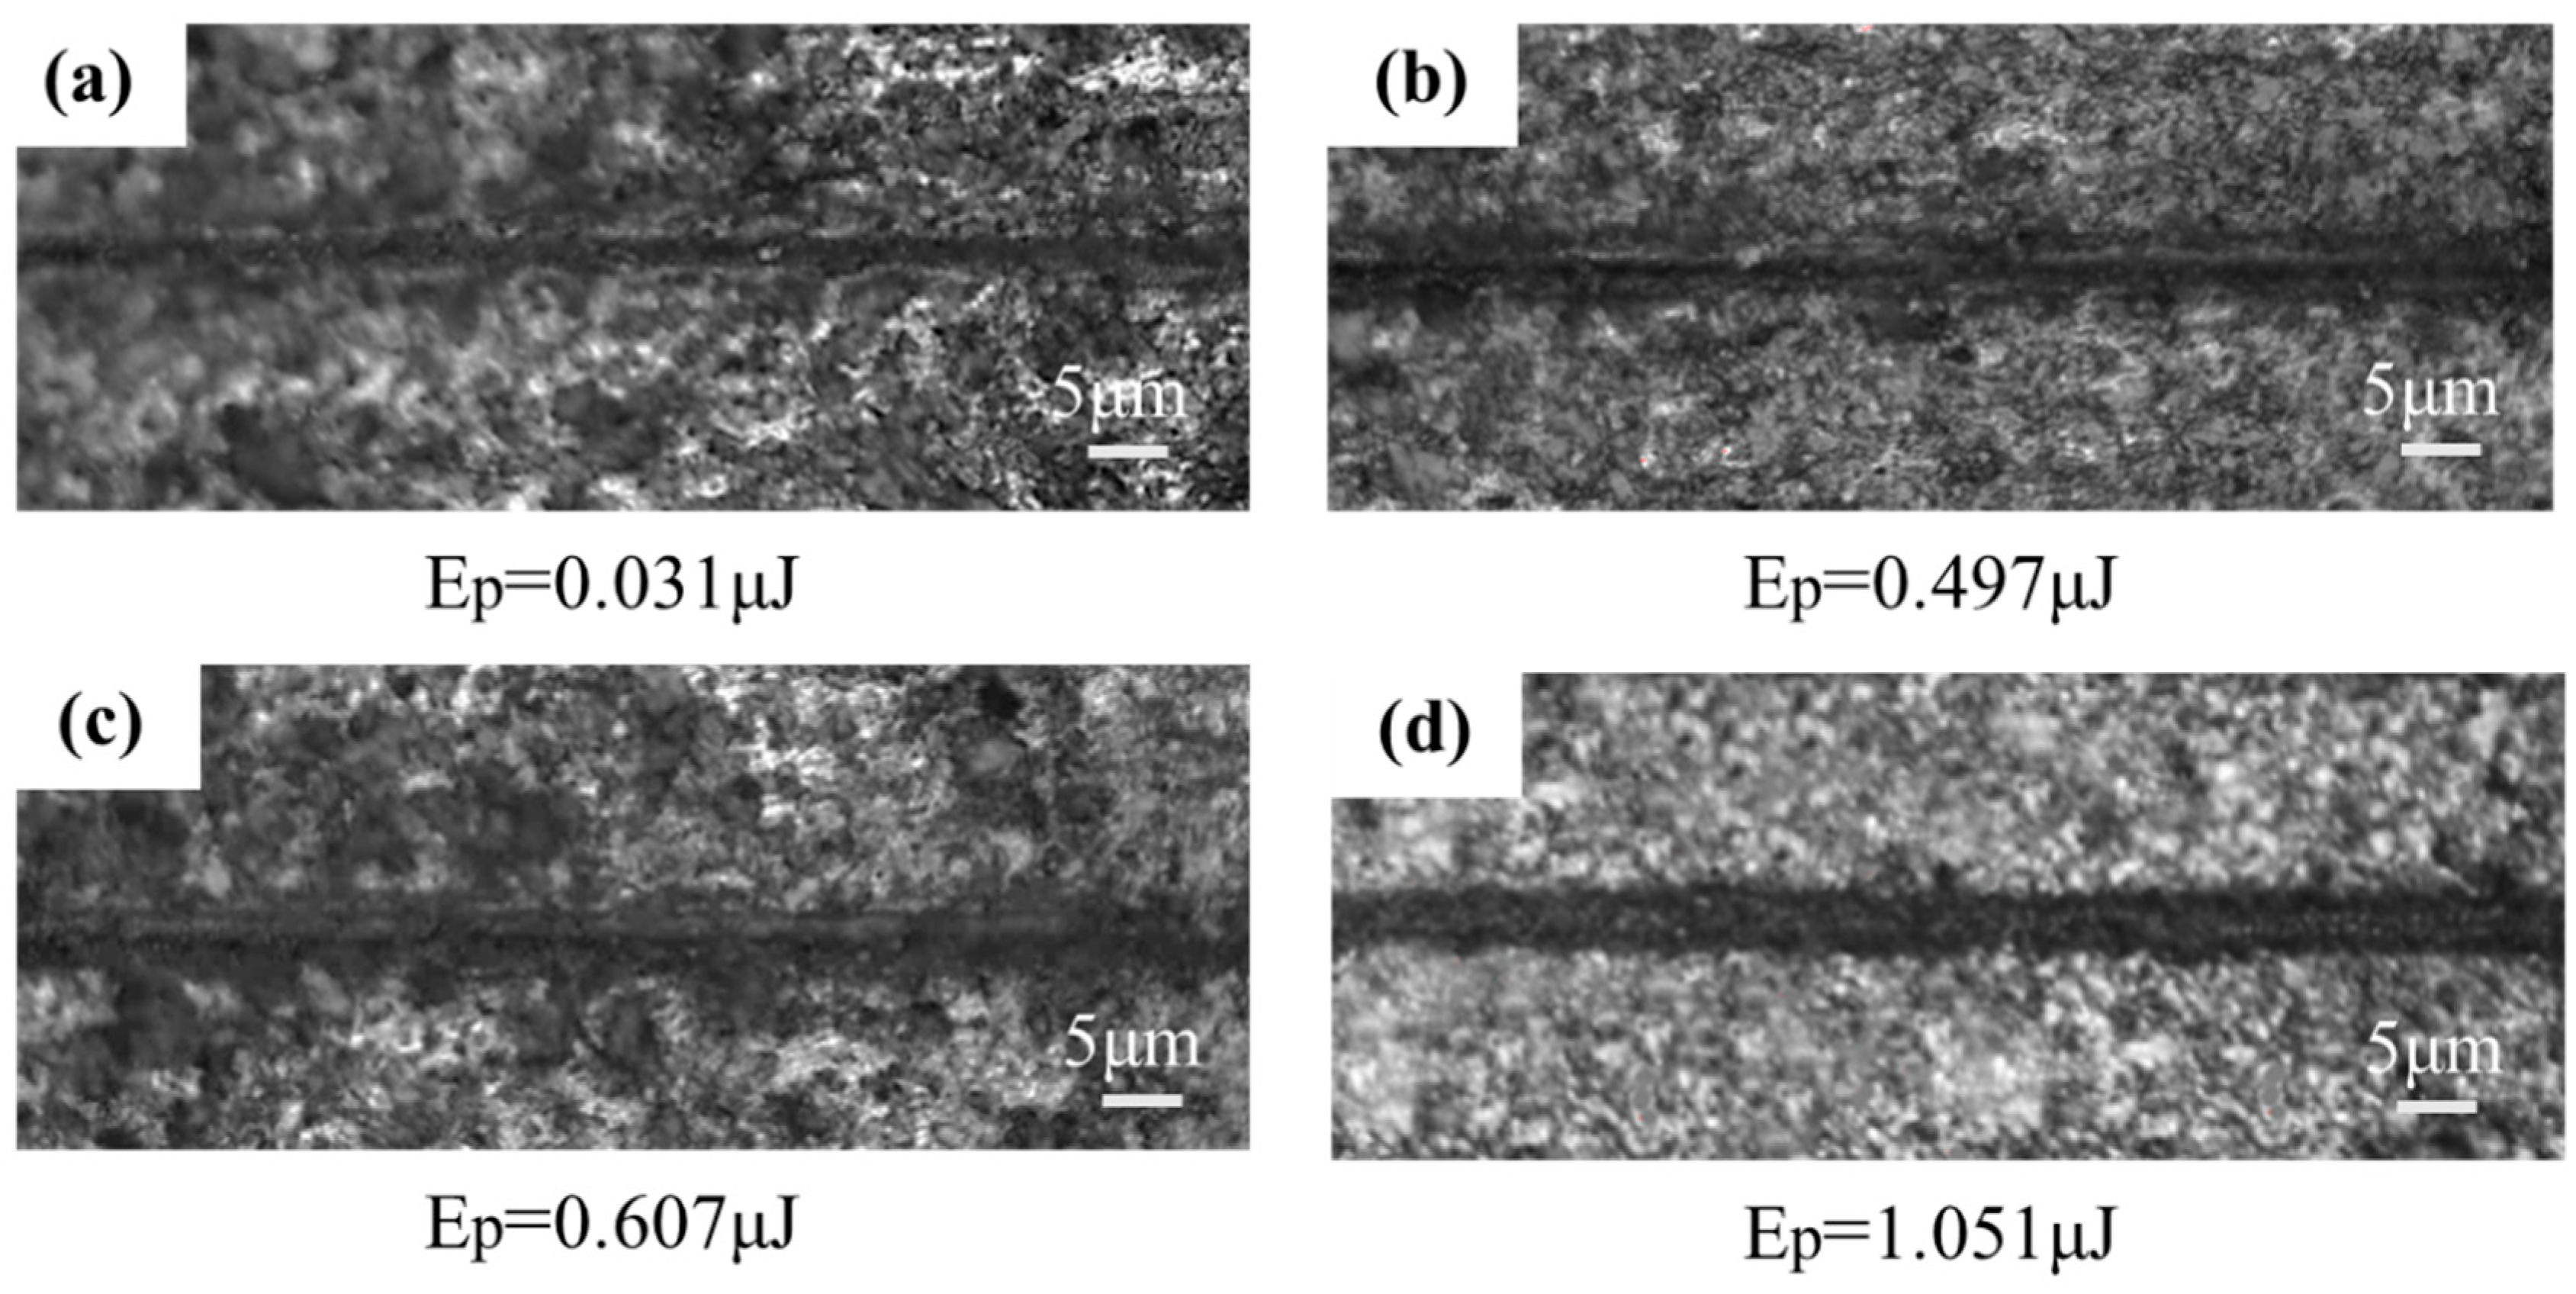
Figure 4, it can be seen that under 1030 nm laser irradiation, the graphene coating forms a relatively uniform groove structure during the ablation process. Around the ablation area, traces of ablation ripple expansion can be observed, and its surface morphology shows typical melting state ablation characteristics. Research has shown that the mechanism of action of high-energy lasers on materials is dominated by thermal effects. When graphene materials are irradiated with lasers, the surface temperature rapidly rises above the melting point, causing the material to undergo a melting phase transition, which is transmitted from the ablation center to the surrounding areas. After the laser irradiation is completed, the temperature drops, forming ablation ripples that spread. Microscopic analysis shows that there are micro scale point like structures distributed around the ablation pit, which is speculated to be due to the rupture behavior of micro defects inside the coating under thermal shock. When the laser energy starts to rise from 0.031 μJ, the contour of the ablated groove gradually becomes clearer. When the laser energy reaches 1.051 μJ, as shown in
Figure 3 and
Figure 8d, the melting and gasification of the material increase the lateral size of the processed groove. As the laser energy continues to increase, the range of surface thermal effects gradually decreases. This is because when the average laser energy is too high, the surface electrons of the material are stripped off through multiphoton ionization and avalanche ionization mechanisms, generating a dense plasma. This plasma shielding mechanism will affect thermal conduction and diffusion, thereby changing the size and shape of the heat affected area.
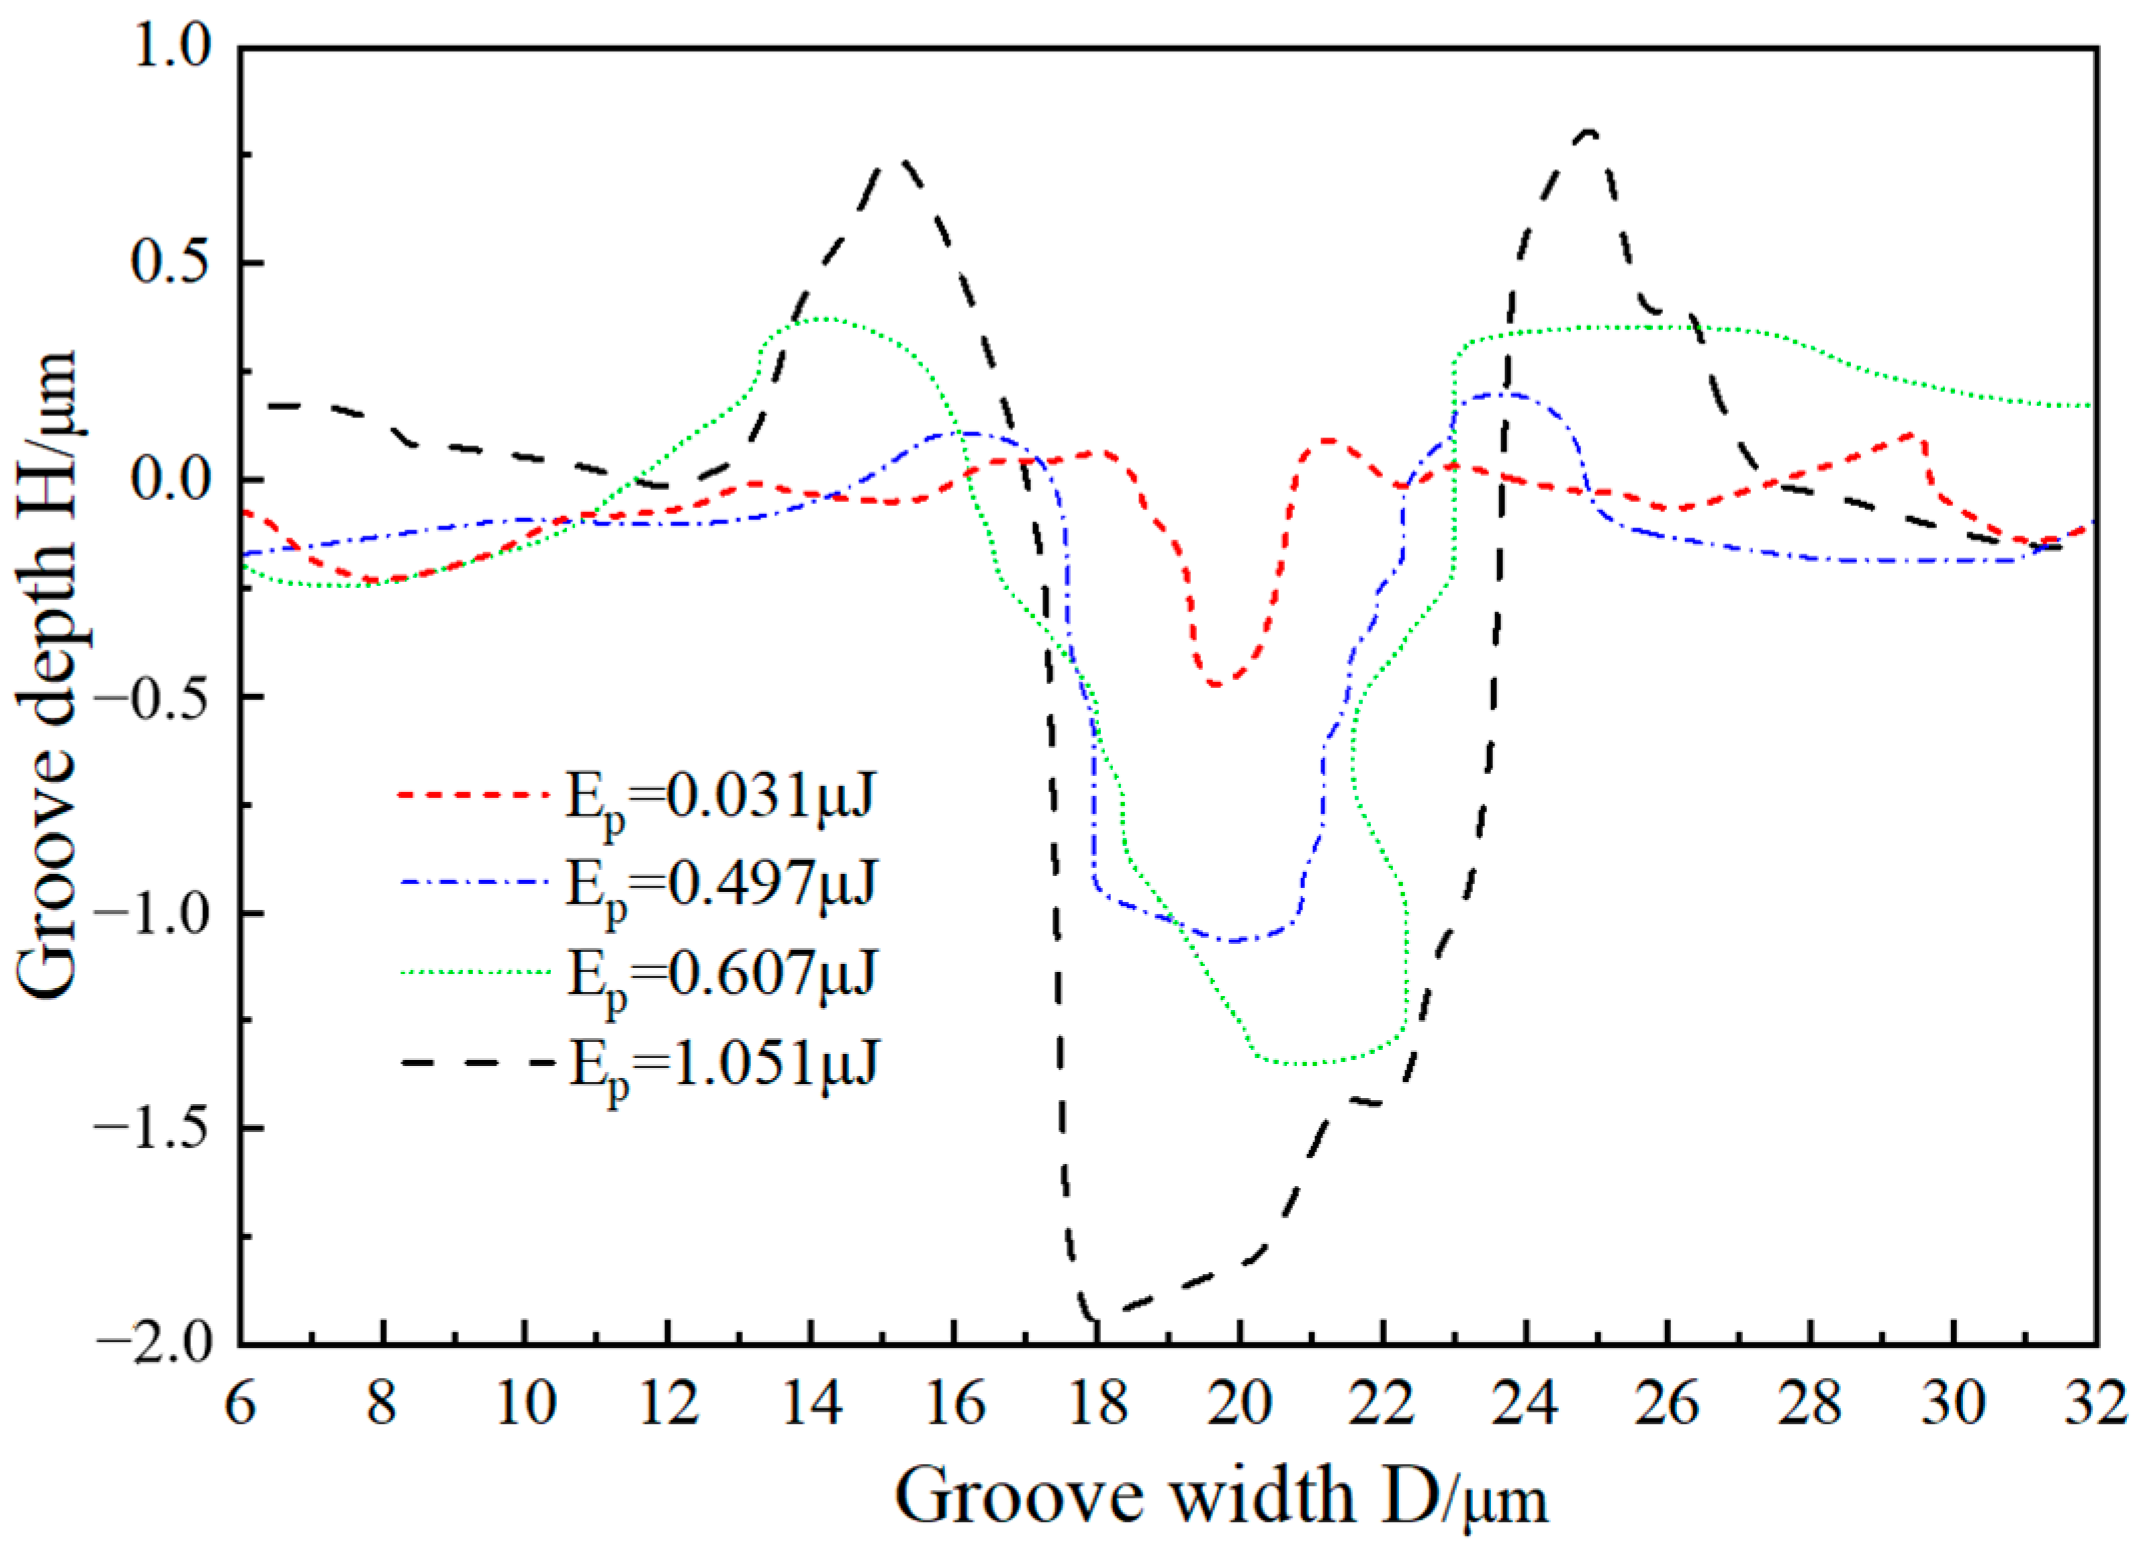
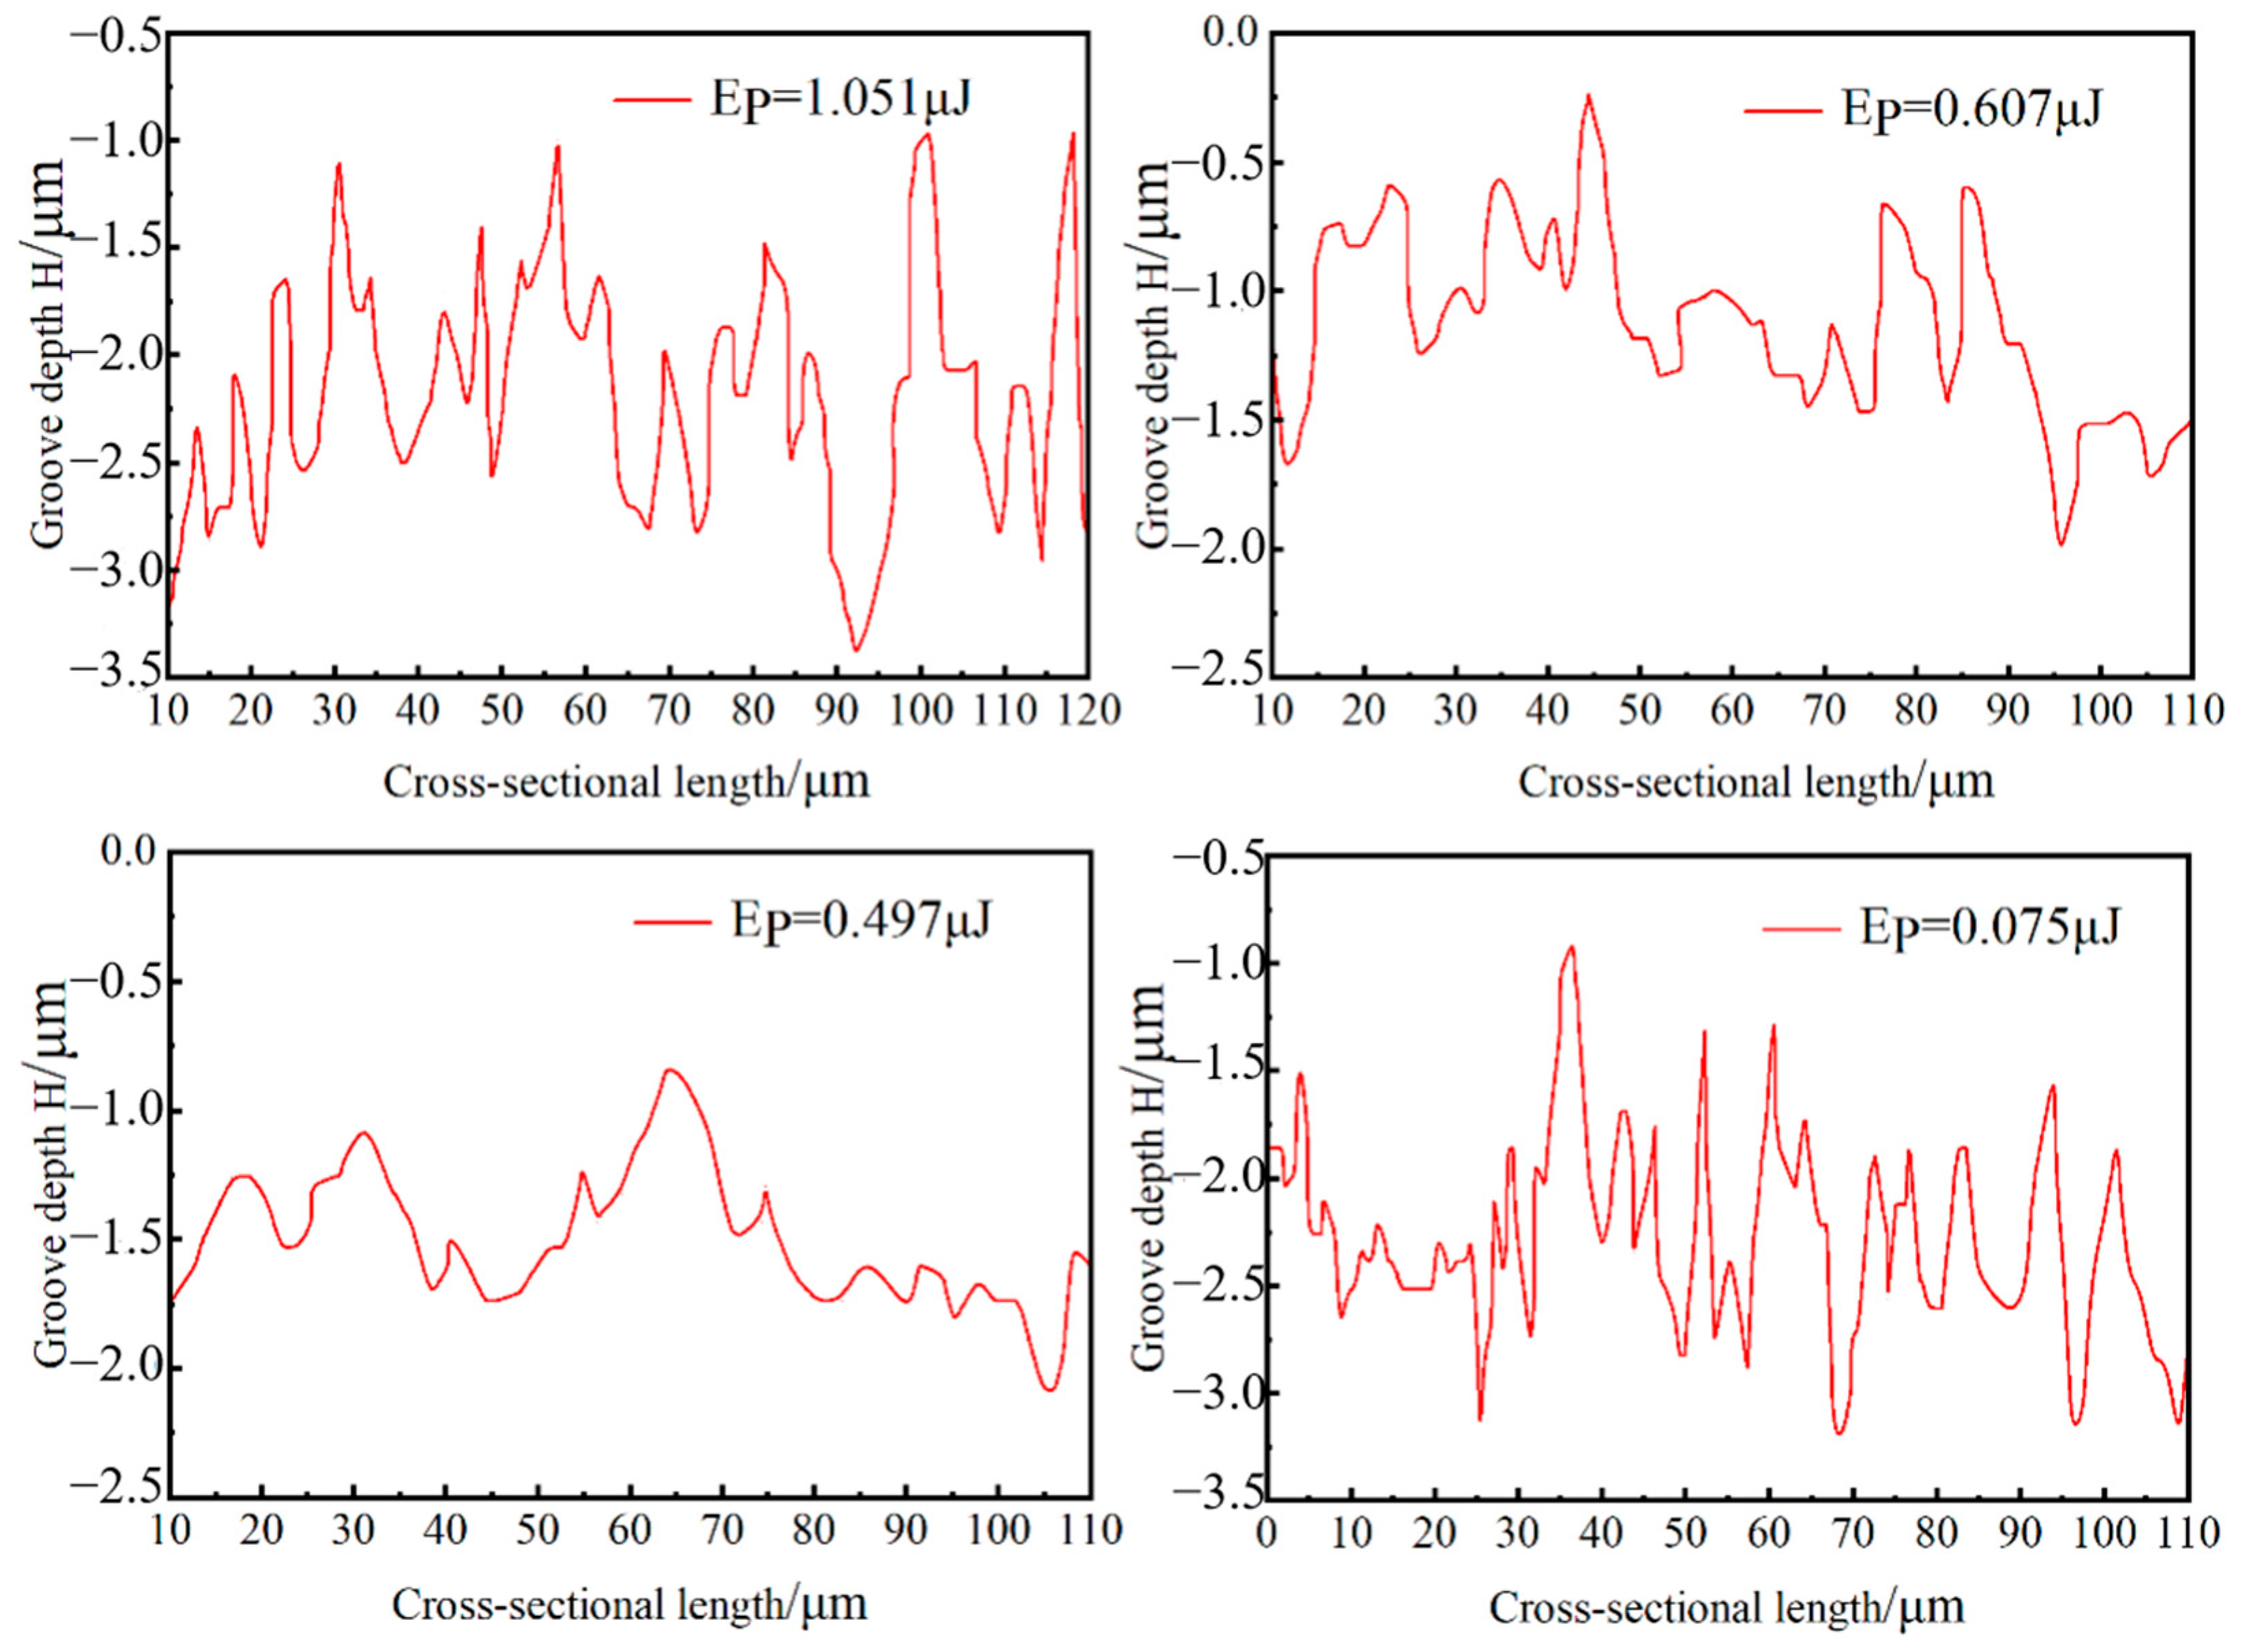
The contour diagrams of the ablation grooves produced by four different femtosecond laser energies are shown in
Figure 9. It can be seen that the cross-section of the laser-processed grooves is an inverted triangle shape. This is because the molten liquid-phase graphene inside the groove cannot be discharged in time, causing the melt to accumulate at the edge of the groove and form an uneven recast layer. As the pulse energy increases, both the width and depth of the ablation groove gradually increase. This is because, under the condition that the scanning speed and the number of scans remain the same and the interaction time between the laser and the material is the same, when the pulse energy density approaches the ablation threshold of the material, the ablation degree of the material is low and is insufficient to reach the temperature required for melting or vaporization. The volume of material removed is not large. At this time, the heat is mainly concentrated on the material surface and does not transfer downward. As the laser energy increases, the heat can be deposited downward, increasing the etching depth. At the same time, the energy absorbed by the material surface diffuses outward in the material, forming a heat-affected zone at a position away from the light spot. For a graphene coating with a thickness of 1.5 microns, 0.607 microjoules are the optimal processing energy.
The bottom cross-sections of the grooves formed by the ablation of four laser energies are shown in
Figure 10. As the laser energy continuously increases, the roughness of the bottom of the ablation pit first increases, then decreases, and gradually increases again. This phenomenon can be attributed to the fact that when the laser energy begins to act on the material surface, its energy is low and the irradiation is uneven, causing some materials not to reach the vaporization condition after absorbing energy, thus forming overheated liquids. Under the action of external disturbances, these liquids will splash, causing the height of the recast zones on both sides to increase, and the bottom of the ablation groove shows obvious peak features, increasing the roughness of the bottom. As the laser energy further increases, the material in the molten pool is significantly removed due to vaporization, and at this time, the bottom of the groove is relatively flat. However, when the laser energy continues to rise, although the depth and width of the groove are still increasing, their growth rate slows down. At the same time, as the size of the recast layer increases, its increased height and thickness will hinder the timely discharge of the plasma in the groove. This will cause scattering and absorption of the laser energy, and the splashed residues will again increase the roughness of the bottom of the groove.
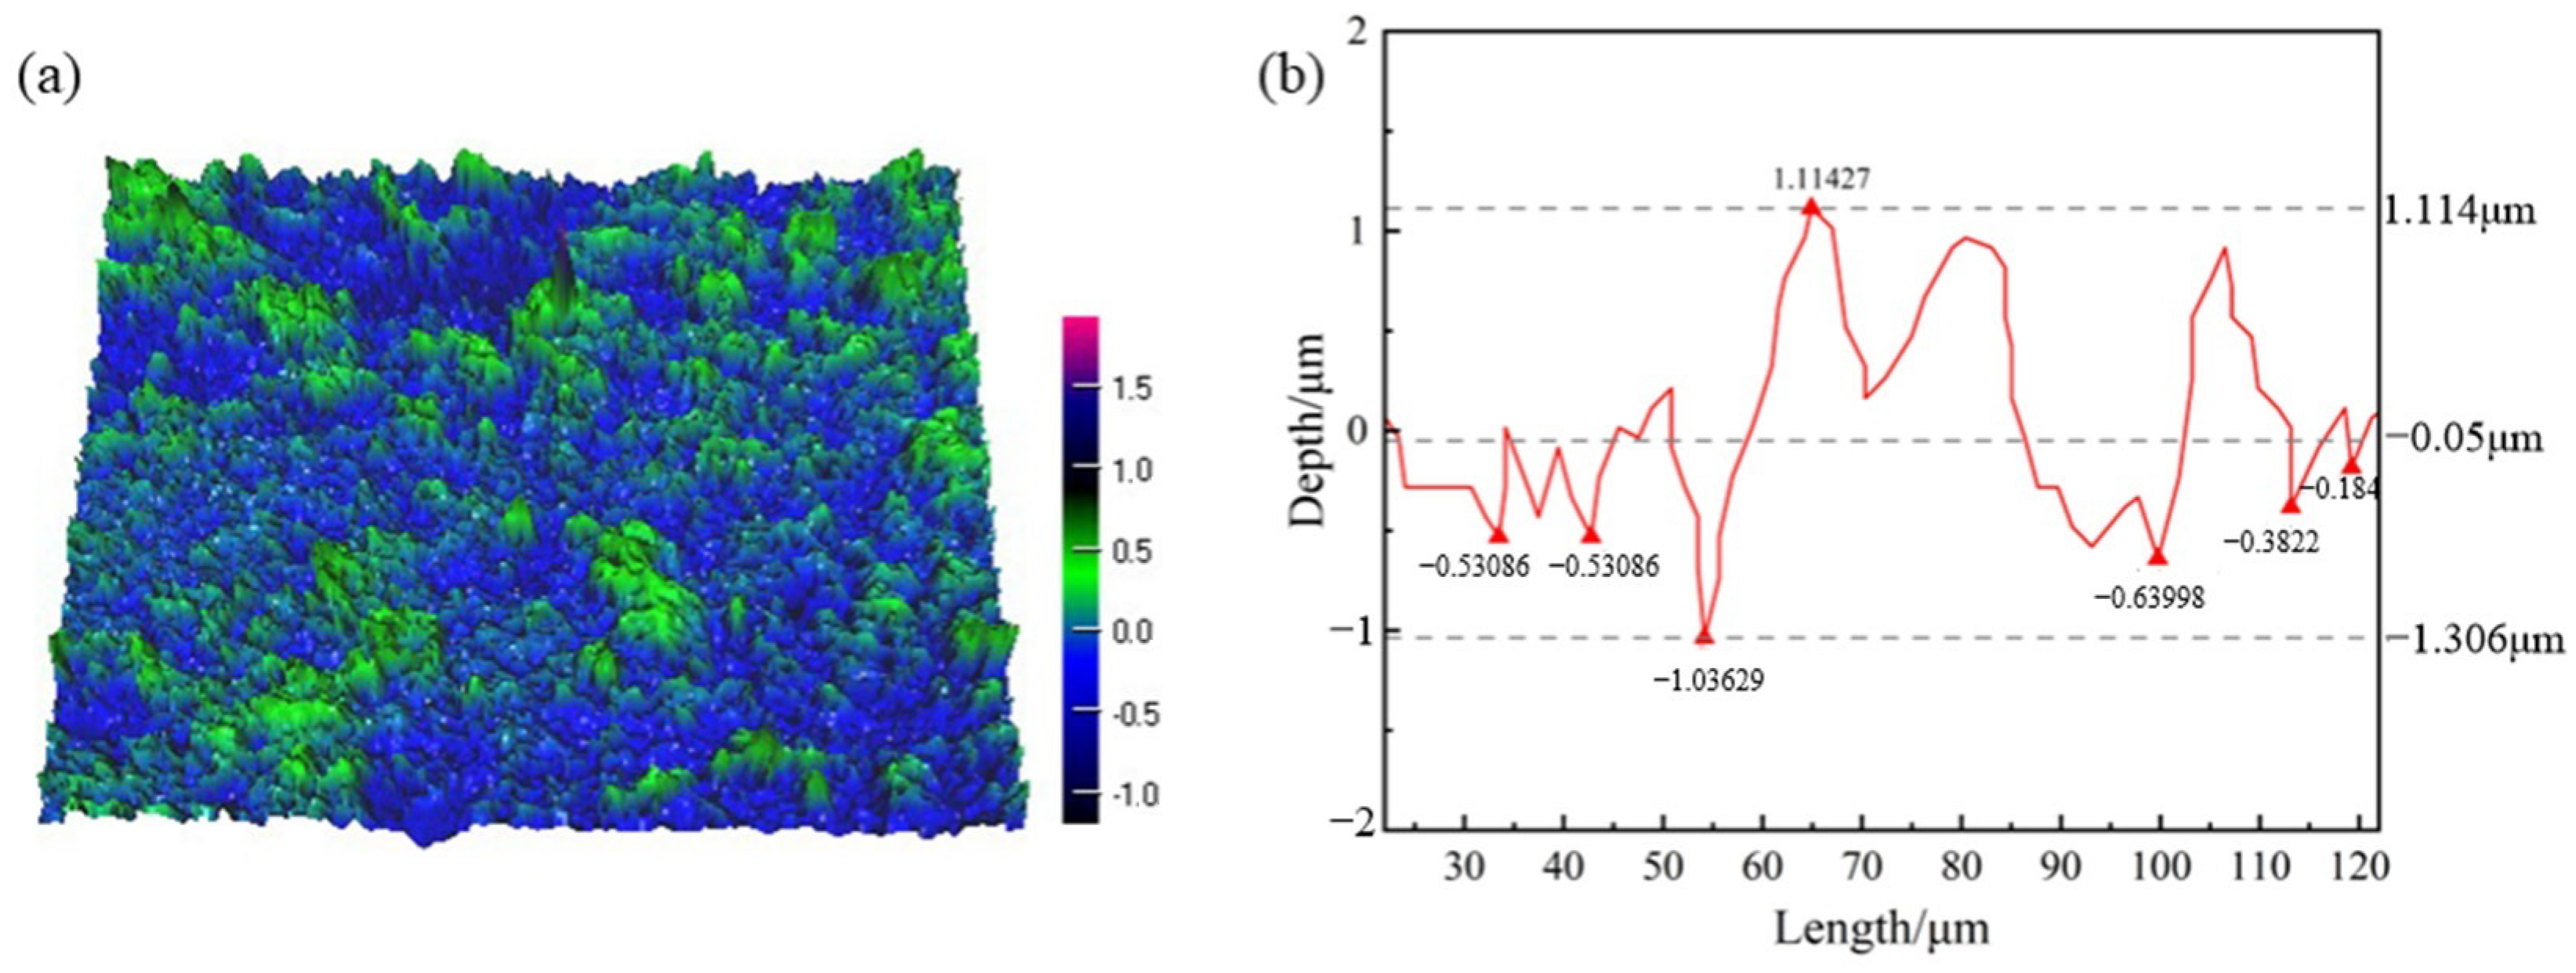
Figure 11 shows the three-dimensional topography of the graphene surface without laser ablation. The surface is relatively uniform and smooth, with a surface roughness R
α of 0.127 μm measured by a laser confocal microscope; the roughness meets the actual machining roughness requirements of capacitor electrode foil. Here, the roughness Ra is taken as the arithmetic mean deviation of the profile, and the formula can be referred to (6).
Figure 11b shows the cross-section of the surface roughness of the untreated surface.
Here, l represents the sampling length, and the ordinate value is the arithmetic mean of the absolute value of Z(x).
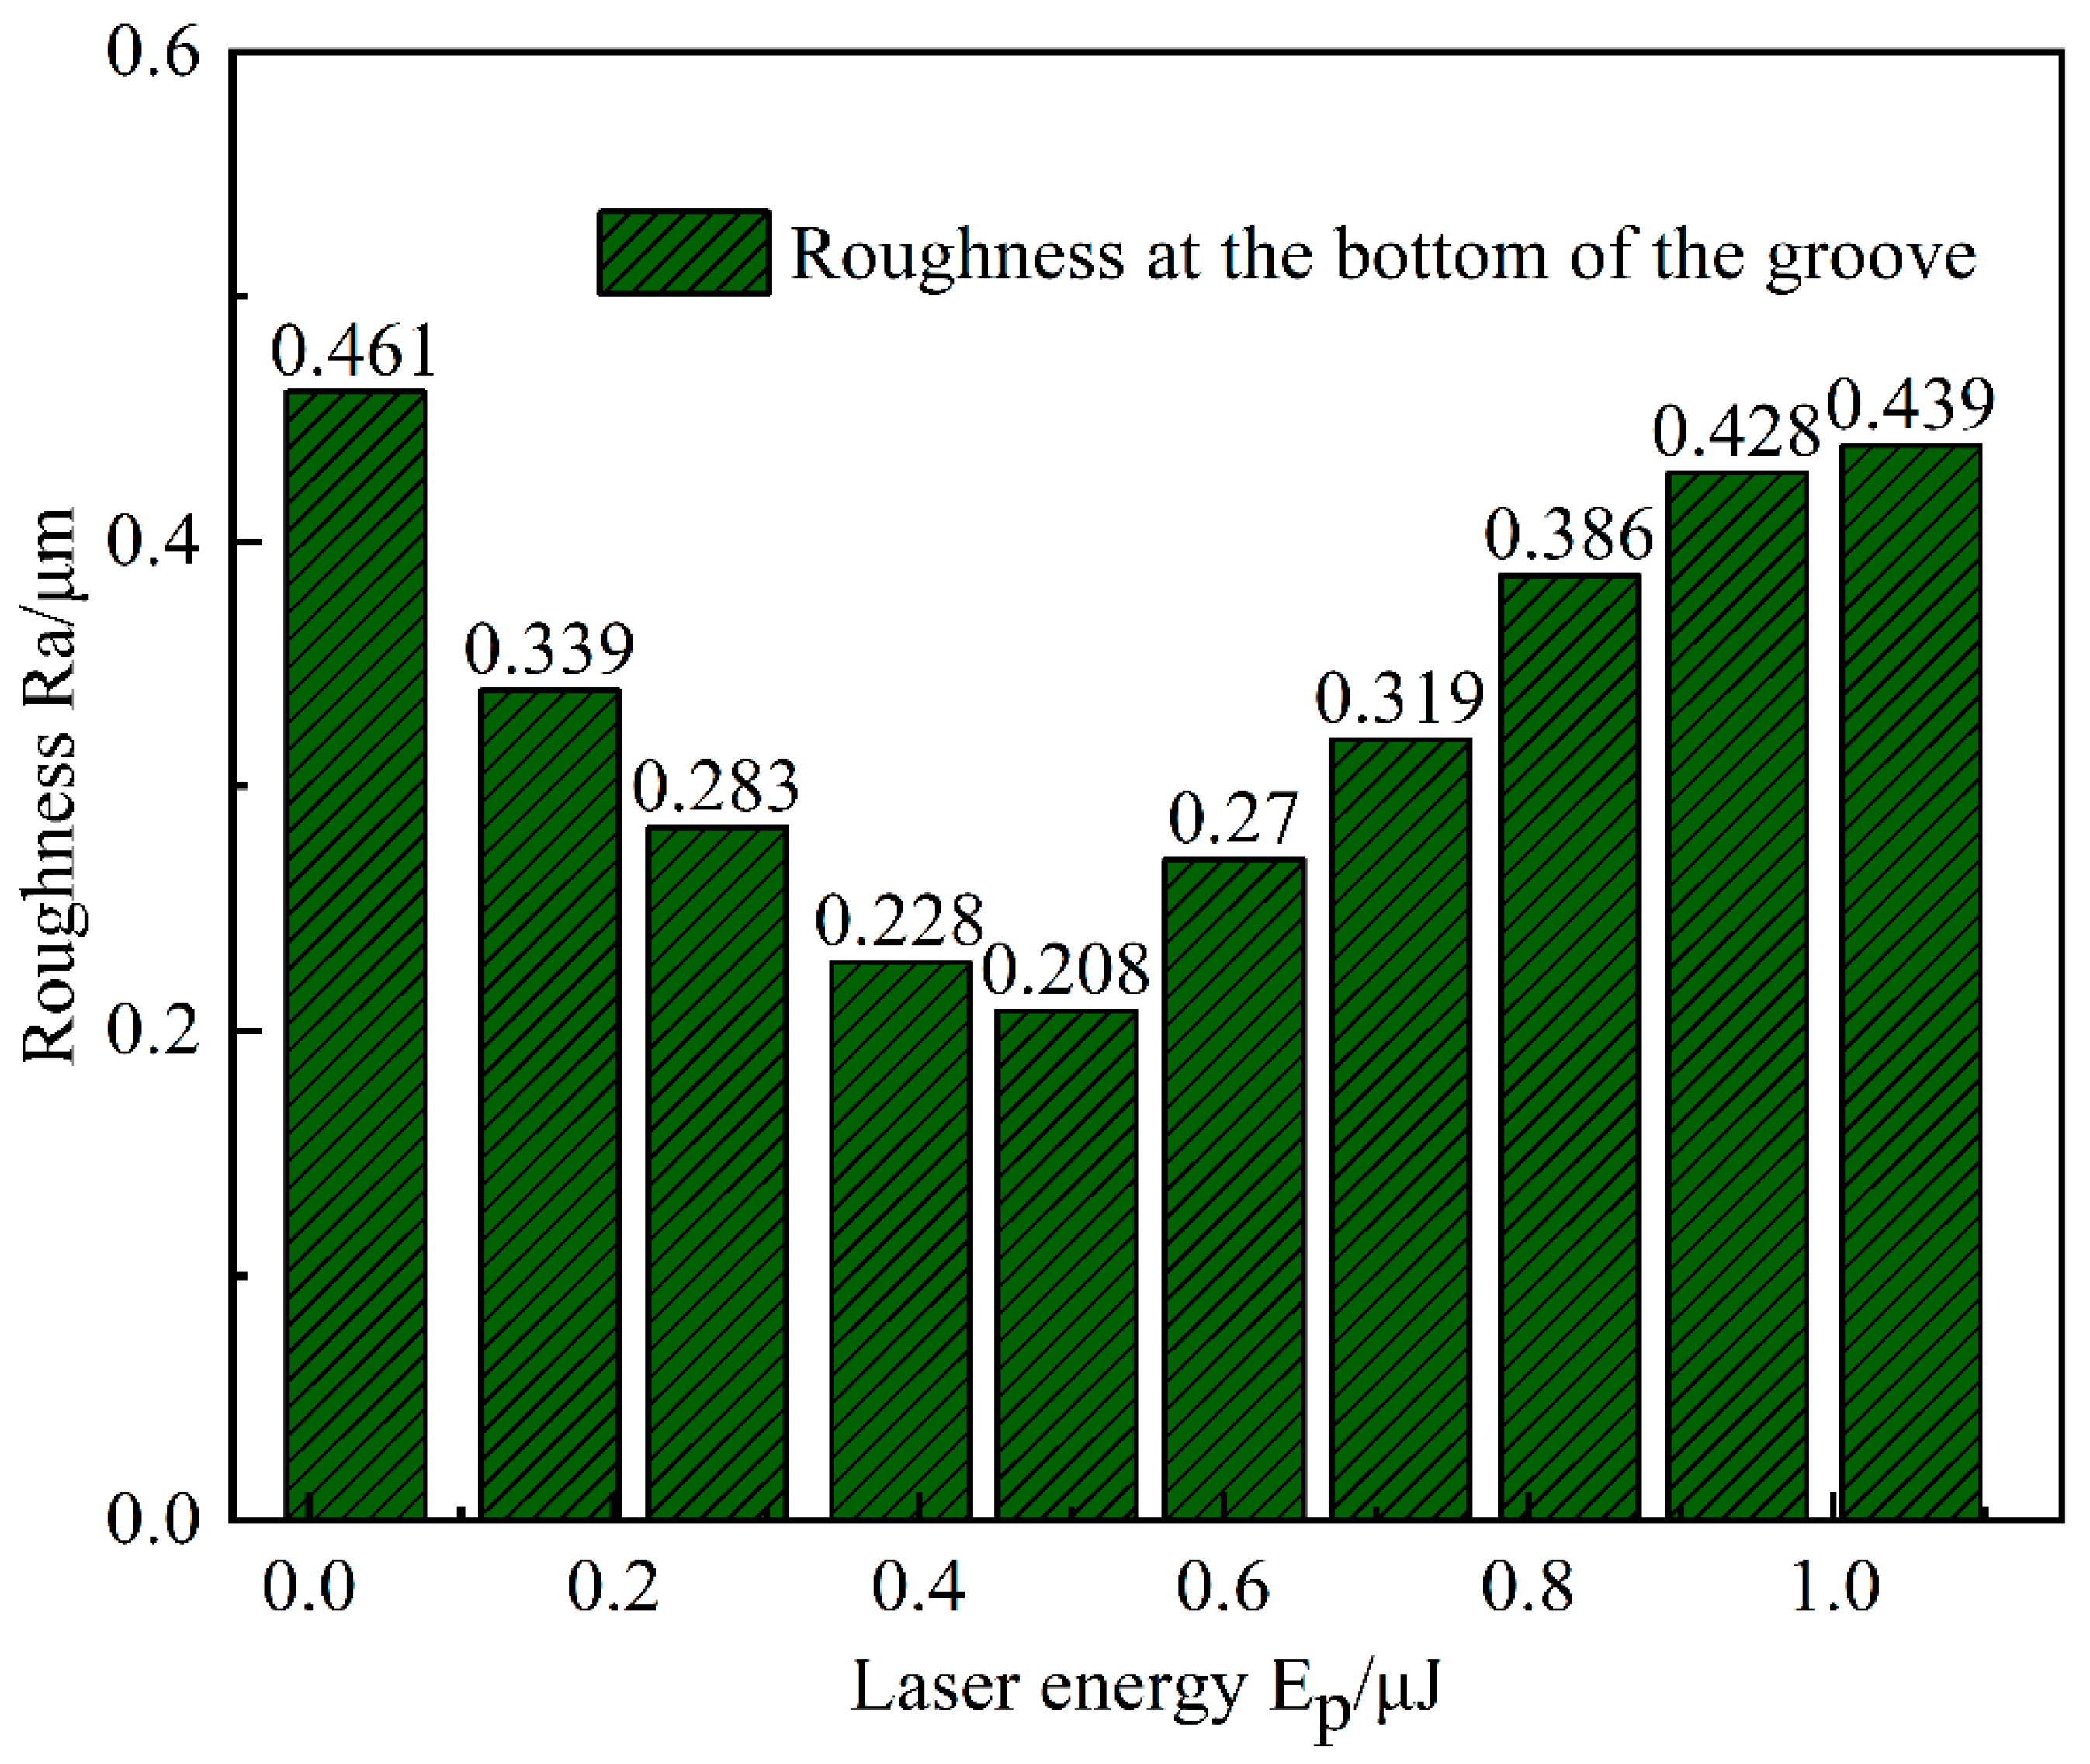
Figure 12 shows the bottom roughness of the ablation grooves under different laser energies. It can be clearly observed from the figure that when the femtosecond laser energy gradually increases from 0.031 μJ to 1.051 μJ, the bottom roughness of the ablation grooves first decreases and then gradually increases. Particularly, the sample with the lowest surface roughness corresponds to a laser energy of 0.497 μJ, at which the laser energy density is 0.879 J/cm
2. The optimal femtosecond laser parameters need to be determined based on the requirements of graphene thickness, aperture, depth, and bottom roughness.
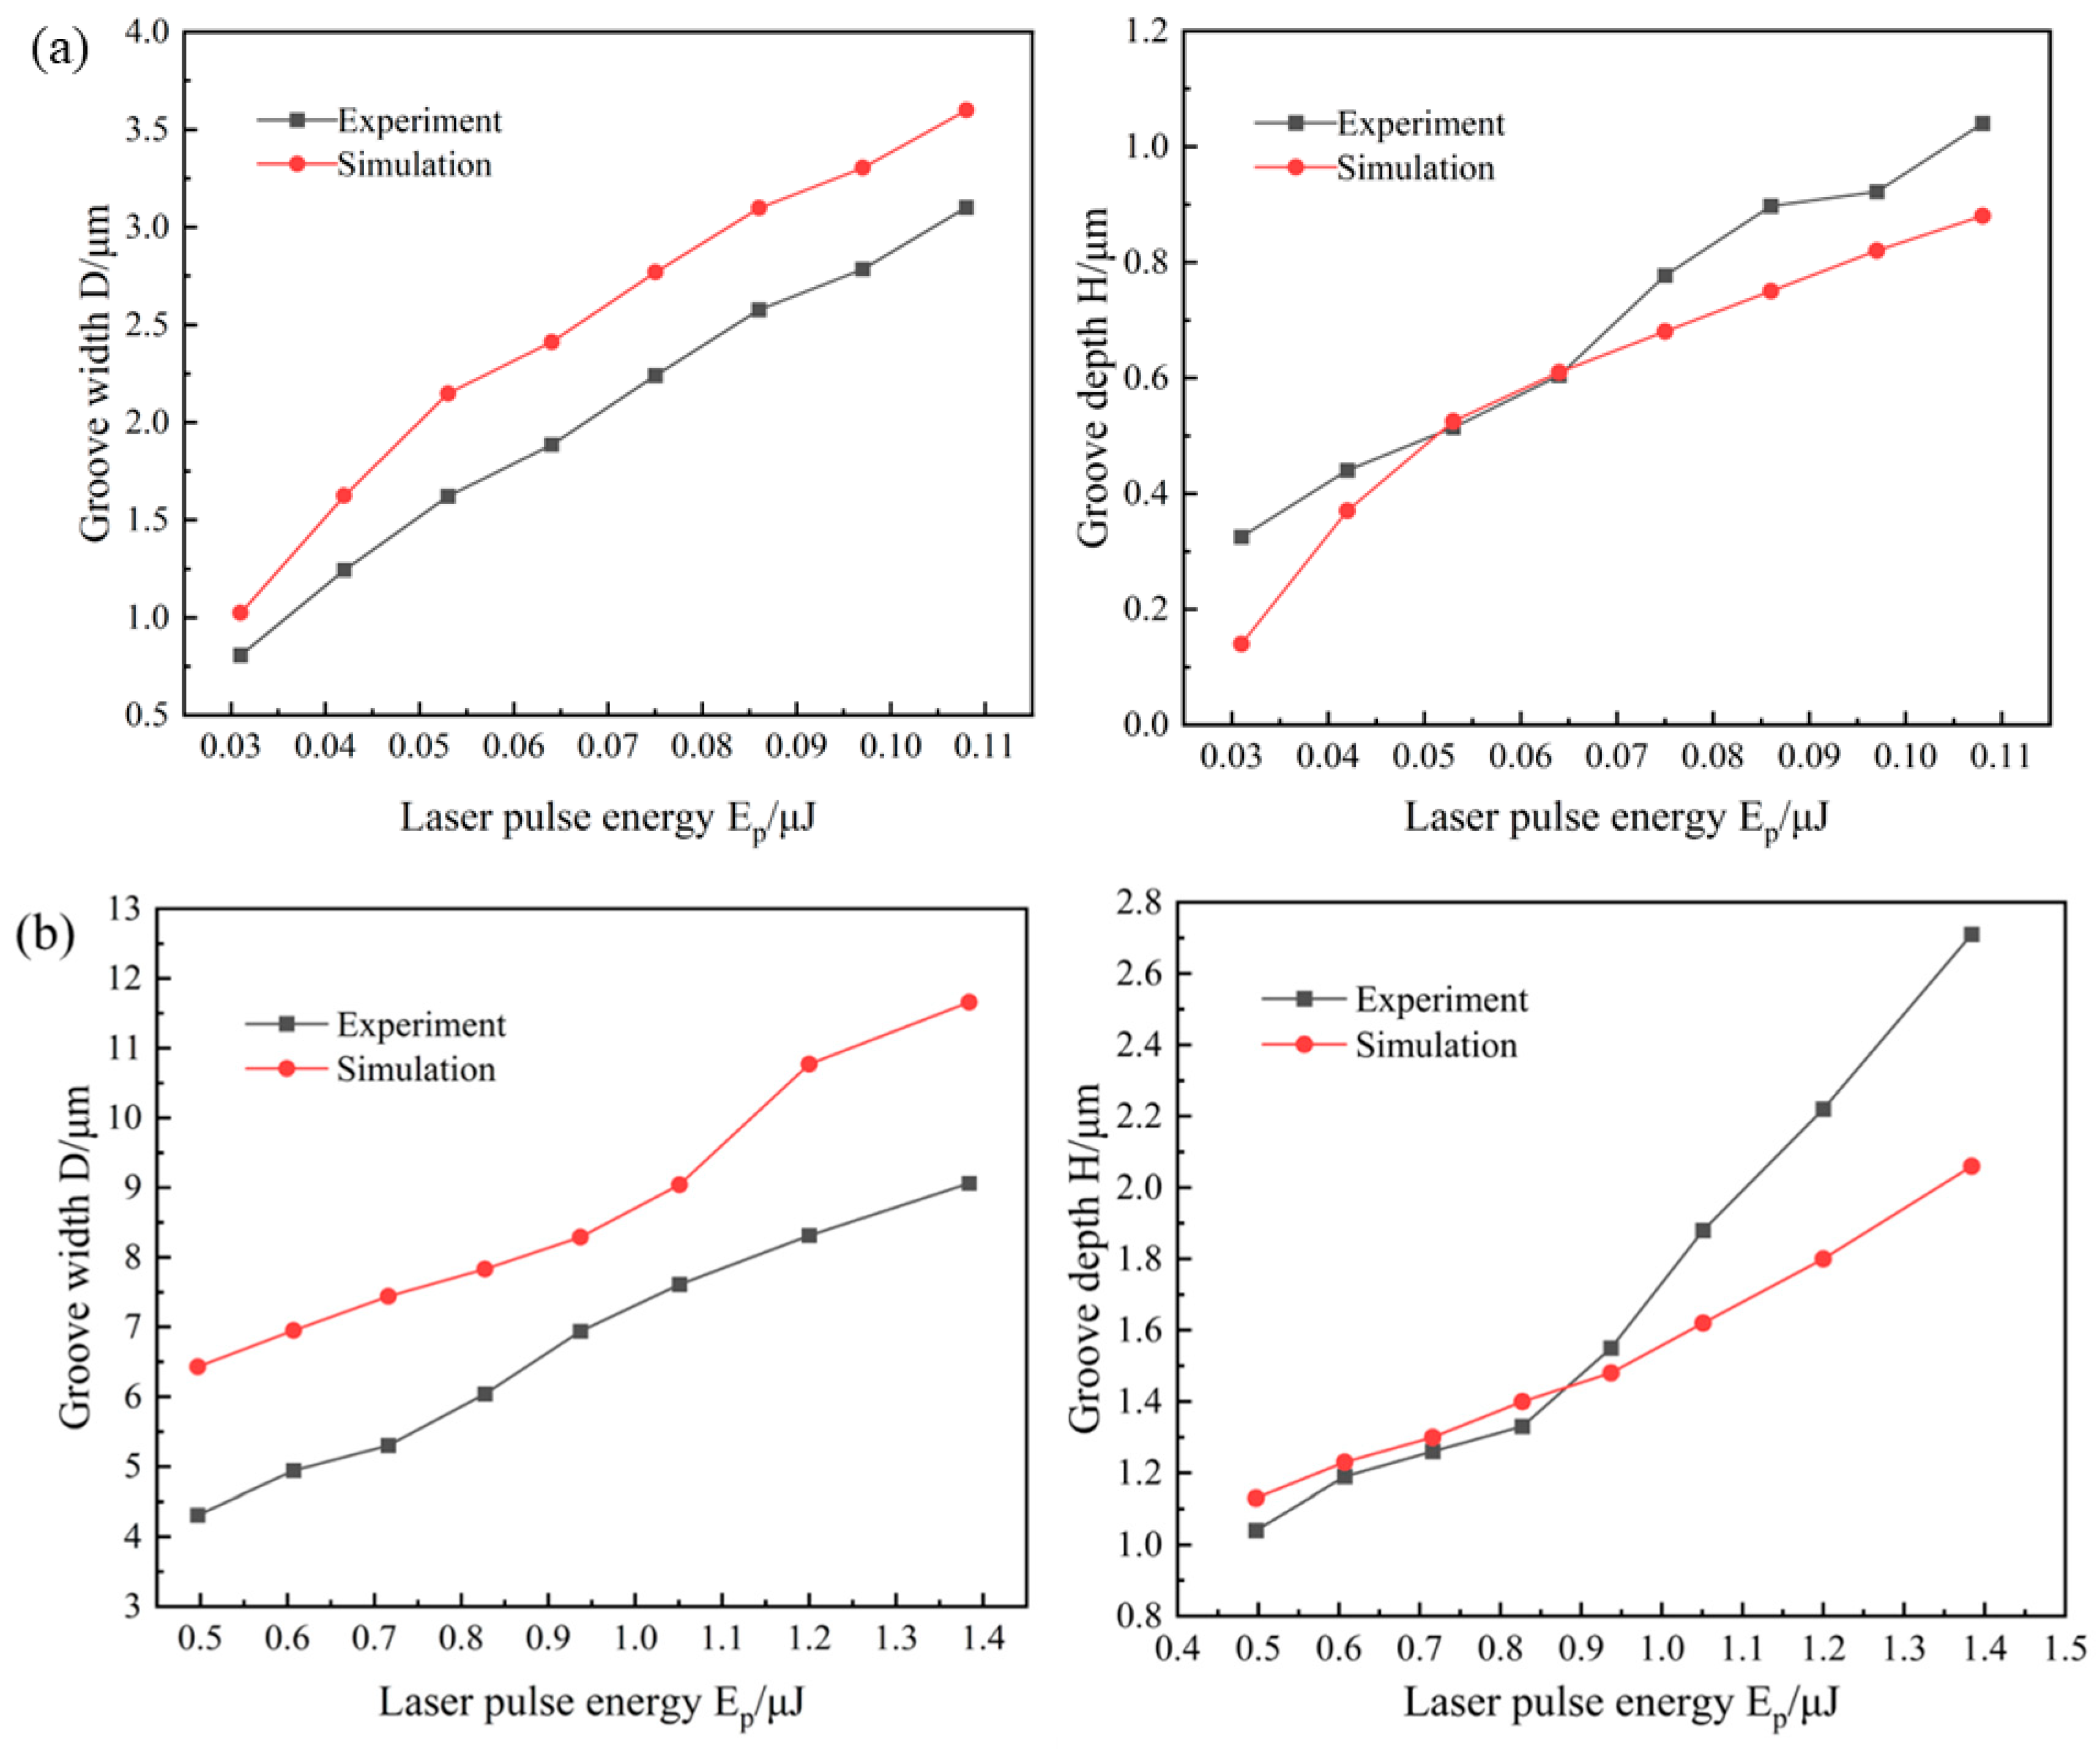
Figure 13 shows the comparison curves of the groove depth and width with the laser energy during the laser ablation of the graphene coating, between simulation and experiment. According to
Figure 13a, when the femtosecond laser starts to ablate the graphene/aluminum surface layer, both the ablation depth and groove width in the experiment and finite element simulation gradually increase as the laser energy increases. As the laser energy continues to increase, the ablation depth keeps deepening, eventually achieving complete ablation of the 1.5 μm thick graphene coating. From
Figure 13b, it can be seen that when the laser starts to ablate the substrate aluminum ingot at the interface, due to the lower melting point of aluminum than that of graphene, the ablation rate of the groove depth significantly increases compared to the beginning. The above results indicate that the numerical simulation results of laser drilling width are larger than the experimental results, while the difference in depth results is relatively small. This may be due to inconsistent constraint methods used in the simulation.
3.2.2. Threshold Calculation for the Interface Table
The minimum laser energy density required for laser removal of graphene is defined as the ablation threshold of the material. The ablation threshold (i.e., the boundary energy required for laser ablation of the material) is determined by extrapolation [
20,
21]. Only when the laser energy is much greater than the ablation threshold of graphene is the material prone to excessive burning under the superposition of laser pulses, resulting in a large number of surface defects, such as cracks and chipping. Therefore, the ablation threshold is an important characteristic index for evaluating the laser processing of graphene. The square of the laser ablation hole diameter is proportional to the laser pulse energy and the spot diameter and inversely proportional to the ablation threshold of the material. In addition, the energy density of the output laser beam follows a Gaussian distribution [
22].
The intensity distribution of the laser beam can be expressed as
Here, r represents the distance from a point in the beam to the center of the spot; φ0 is the energy density at the center of the beam; and w0 is the radius of the beam waist.
The energy of the laser pulse is
Then, the relationship between the laser power density and the single pulse energy can be derived as
Among them, Ep represents the energy of a single laser pulse.
Suppose φ
th is the ablation threshold of the laser reaching the material, and the corresponding ablation aperture at this time is D. Substituting into the previous formula, we can obtain
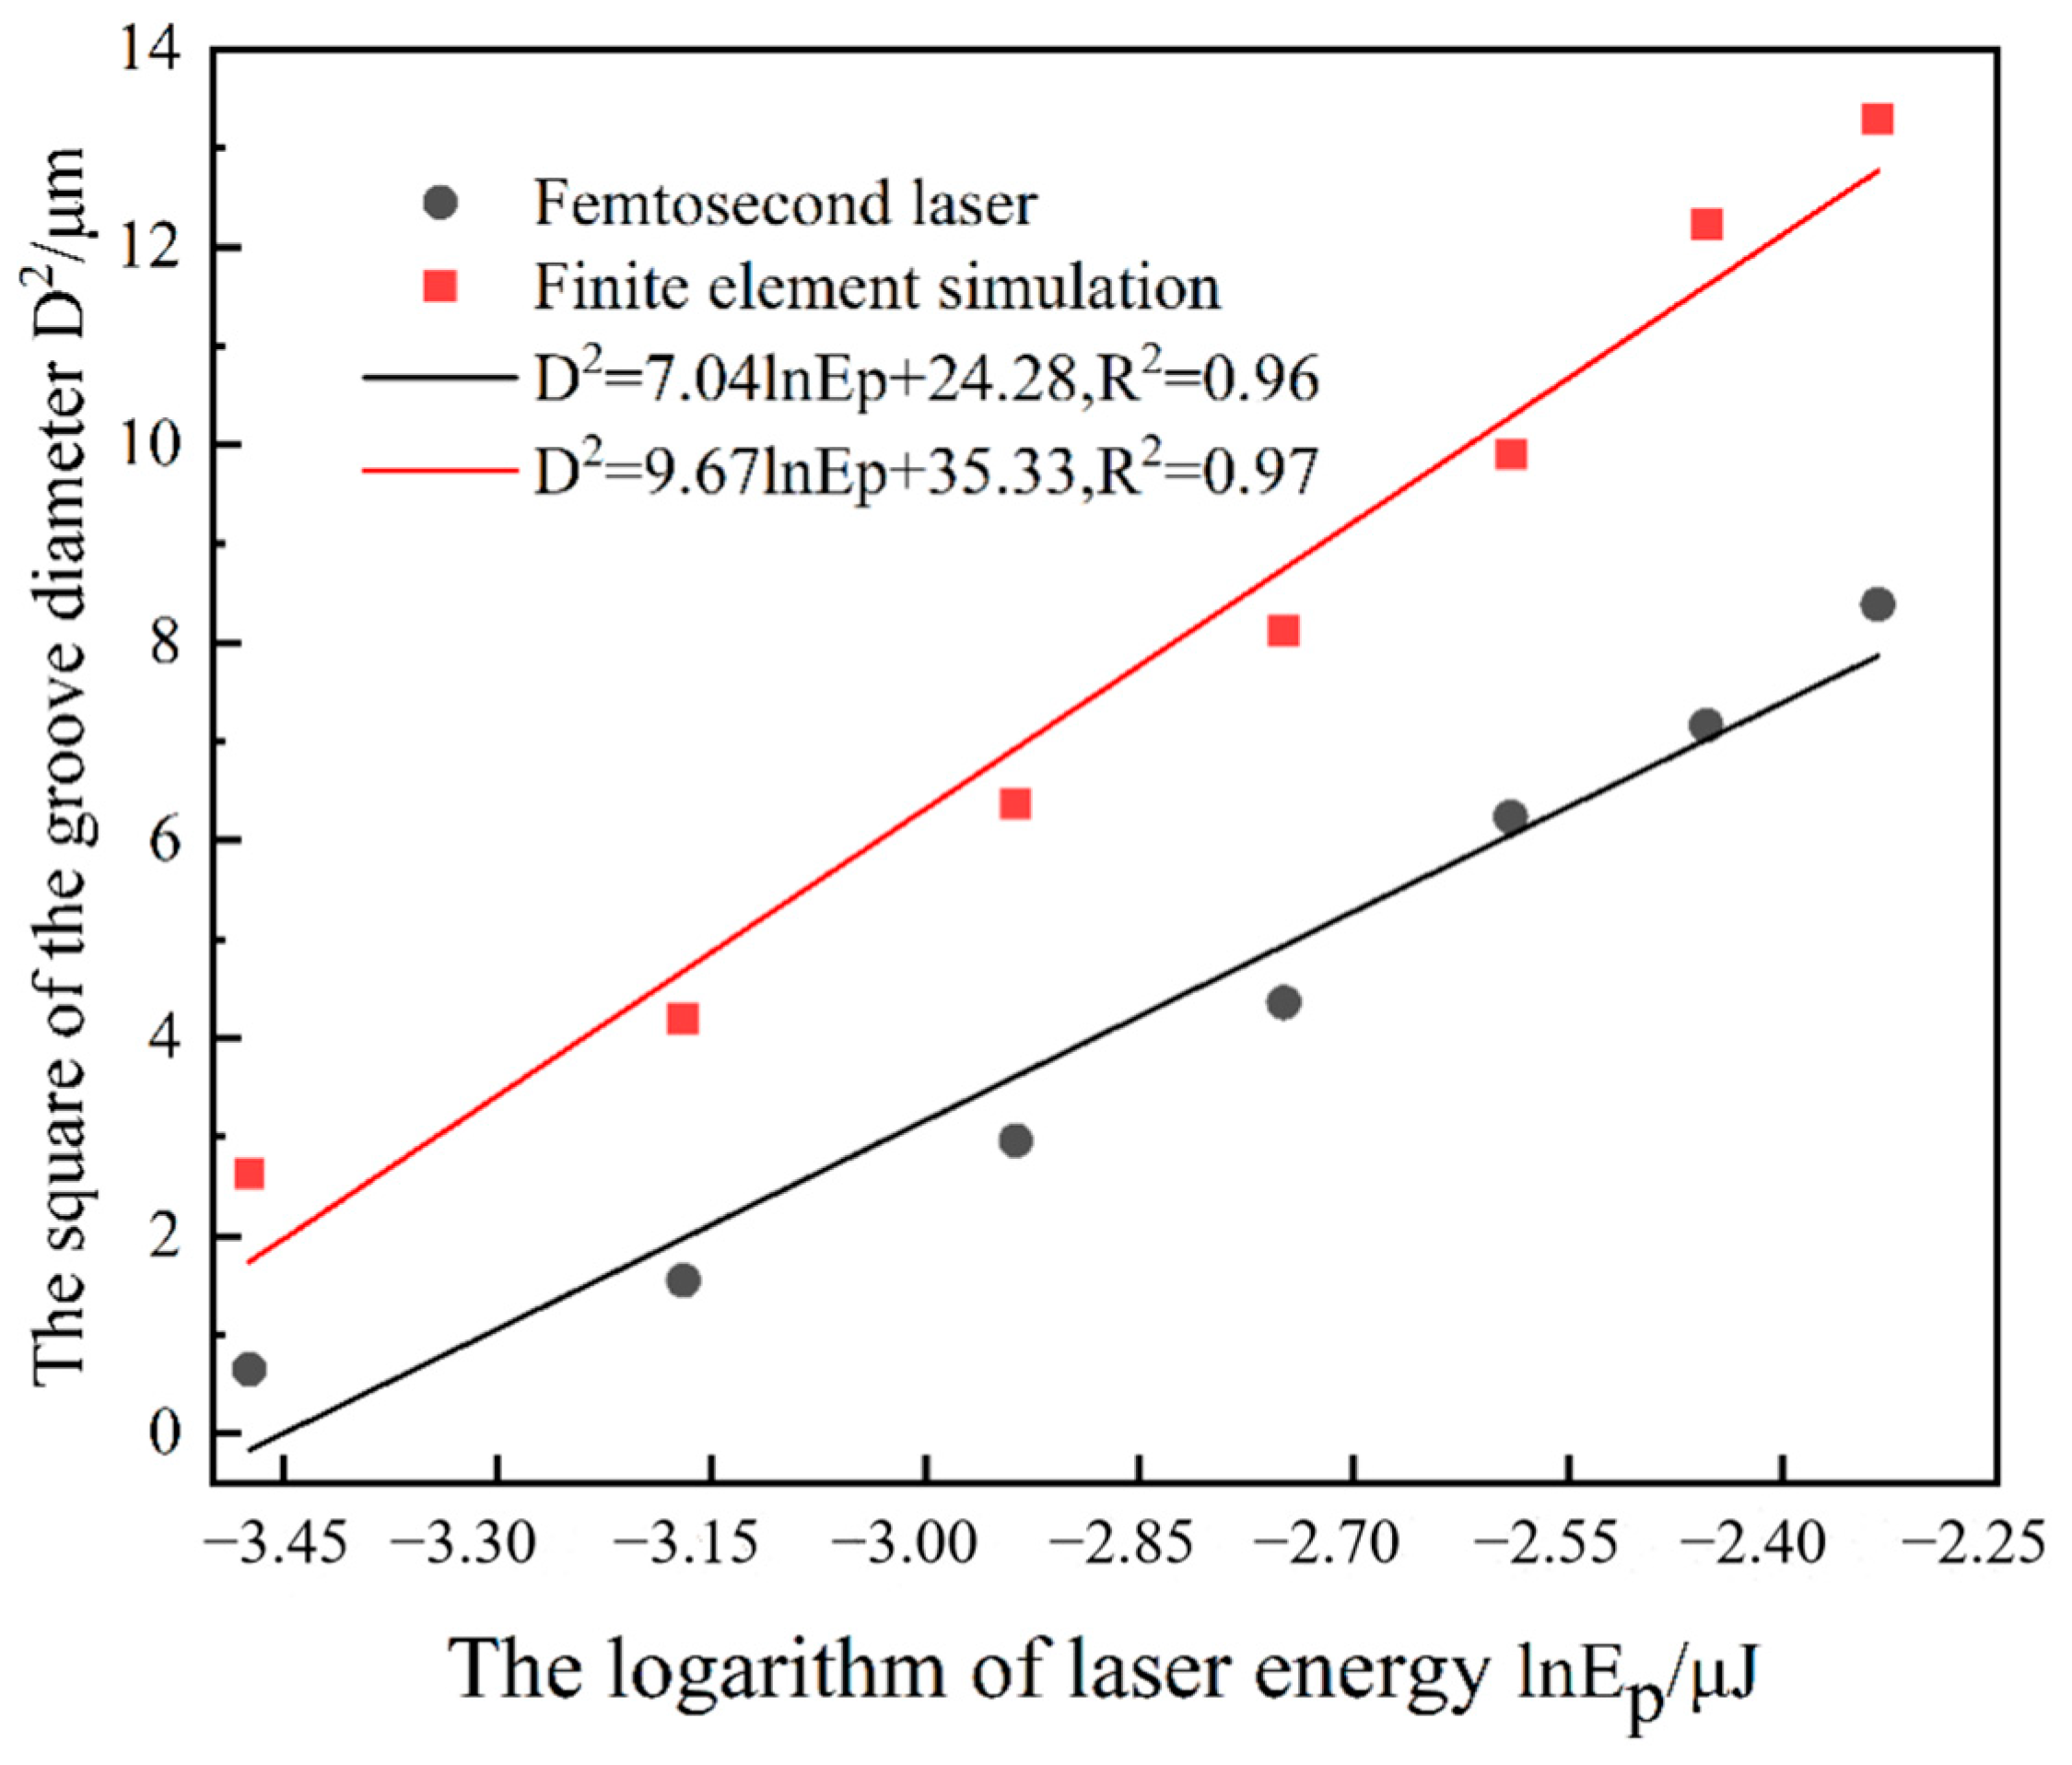
In the formula, Eth represents the minimum laser pulse energy required to remove graphene. According to Formula (10), by plotting the D2—lnEP curve and fitting the value of lnEP when D2 = 0, the minimum energy density required for ablating graphene can be derived.
Figure 14 shows the relationship curve between the square of the groove diameter and the logarithm of laser energy. The red curve represents the finite element temperature field simulation results, while the black curve is the femtosecond laser experimental curve. It can be seen that the square of the groove diameter formed by laser action on graphene and the pulse energy present a linear relationship. The diagonal line in the figure is the fitting curve. In the finite element simulation, the minimum laser energy for surface ablation of graphene was obtained as 0.026 μJ, and the surface ablation threshold was 0.046 J/cm
2. Through the femtosecond laser processing of the graphene coating surface experiment, it was determined that the minimum laser energy was 0.032 μJ, and the surface ablation threshold was 0.057 J/cm
2. The error between the numerical simulation results and experimental test results of the ablation threshold is about 15%, which is within a reasonable range. Therefore, it can be concluded that the ablation threshold of the graphene layer obtained from the numerical simulation is very close to the experimental calculation results, thereby verifying the reliability and accuracy of the simulation model.
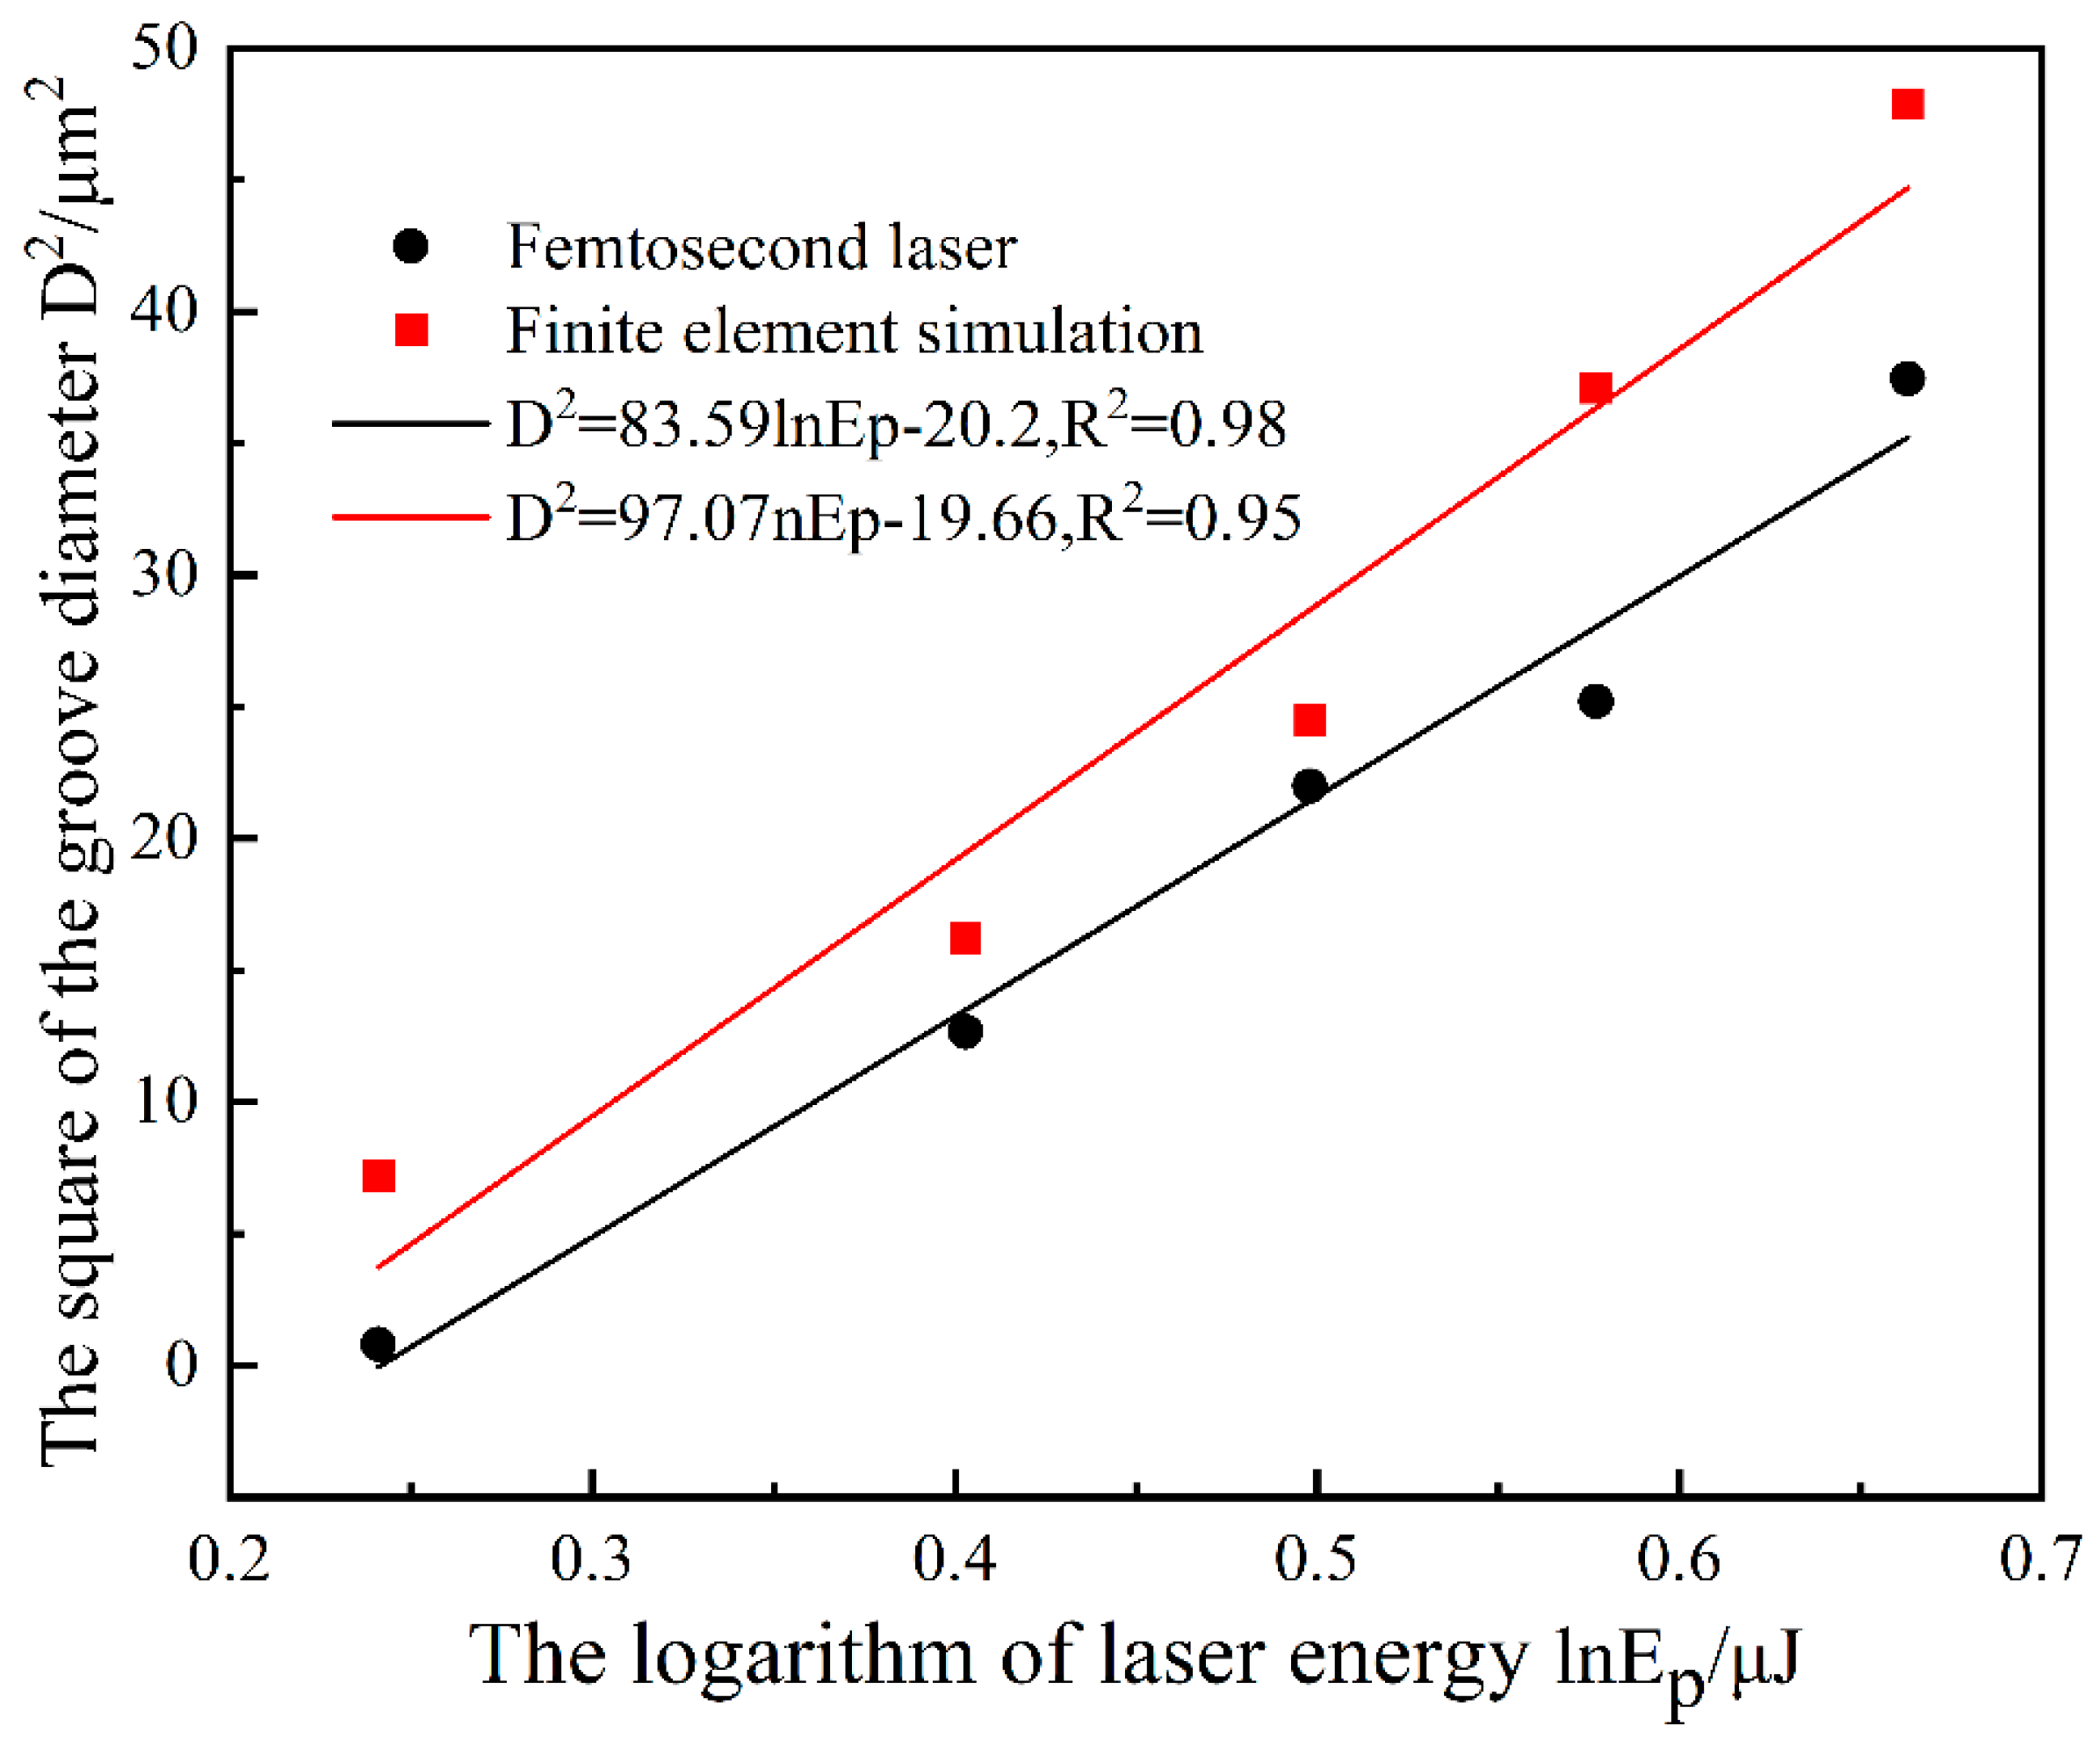
In the experimental design, the thickness of the graphene coating was 1.5 μm. The depth of the ablation groove was precisely measured by a three-dimensional profilometer to determine the characteristic width of the groove when it reached the coating thickness. Considering the conical hole feature formed by femtosecond laser ablation, the critical laser pulse energy corresponding to when the ablation depth exceeded the thickness of the graphene coating (i.e., when the square of the interface ablation pit diameter was zero), which was extrapolated by establishing a relationship curve between the square of the interface ablation groove diameter and the logarithm of the laser energy. Based on this, the interface ablation threshold could be accurately calculated.
According to
Figure 15, the finite element simulation results show that the minimum laser energy required for complete ablation of the graphene coating is 1.225 μJ, and the interface ablation threshold is 2.167 J/cm
2; whereas, in the femtosecond laser experiment, the minimum laser energy required for complete ablation of the graphene coating is 1.273 μJ, with the corresponding interface ablation threshold being 2.252 J/cm
2. The error between the two is within the allowable range.
The discrepancy between the simulation results and the experimental data mainly stems from the following key factors. Firstly, the simplified assumptions regarding the laser–material interaction in the numerical model fail to fully reflect the actual physical processes. The idealized conditions adopted in the simulation, such as 100% laser absorption efficiency and surface concentrated heat sources, fundamentally differ from the complex multiphase change behaviors observed in experiments. During the actual processing, materials under laser irradiation undergo dynamic non-equilibrium phase transitions, including molten pool formation, vapor recoil, and plasma shielding, all of which significantly affect the energy coupling efficiency. Moreover, the photo-thermal conversion efficiency of materials is essentially modulated by the laser parameters (wavelength, polarization state, incident angle) and surface conditions (roughness, oxide layer), which have not been fully incorporated into the existing models. Secondly, graphene’s unique two-dimensional electronic structure endows it with significant temperature dependence and thermal physical properties. Due to its strong covalent bonds and freely moving electrons, the internal energy of graphene significantly increases under high-temperature conditions. This leads to changes in graphene’s thermal conductivity and specific heat capacity with temperature and thickness. However, the constant thermal physical property assumption used in current simulations makes it difficult to accurately capture this dynamic thermal transport behavior. Additionally, the spatial energy distribution of the actual femtosecond laser beam (Gaussian type) differs from the idealized uniform energy deposition model in the simulation, and the possible focus drift and other process fluctuations during processing collectively contribute to the deviation in the final morphology prediction.


