Article

Research on the Friction Prediction Method of Micro-Textured Cemented Carbide–Titanium Alloy Based on the Noise Signal

Key Laboratory of Advanced Manufacturing and Intelligent Technology, Ministry of Education, Harbin University of Science and Technology, Harbin 150080, China
*
Author to whom correspondence should be addressed.
Coatings 2025, 15(7), 843; https://doi.org/10.3390/coatings15070843
Submission received: 27 June 2025 / Revised: 16 July 2025 / Accepted: 17 July 2025 / Published: 18 July 2025
(This article belongs to the Section Surface Characterization, Deposition and Modification)

Abstract

The vibration and noise of friction pairs are severe when cutting titanium alloy with cemented carbide tools, and the surface micro-texture can significantly reduce noise and friction. Therefore, it is very important to clarify the correlation mechanism between friction noise and friction force for processing quality control. Consequently, investigating the underlying mechanisms that link friction noise and friction is of considerable importance. This study focuses on the friction and wear acoustic signals generated by micro-textured cemented carbide–titanium alloy. A friction testing platform specifically designed for the micro-textured cemented carbide grinding of titanium alloy has been established. Acoustic sensors are employed to capture the acoustic signals, while ultra-depth-of-field microscopy and scanning electron microscopy are utilized for surface analysis. A novel approach utilizing the dung beetle algorithm (DBO) is proposed to optimize the parameters of variational mode decomposition (VMD), which is subsequently combined with wavelet packet threshold denoising (WPT) to enhance the quality of the original signal. Continuous wavelet transform (CWT) is applied for time–frequency analysis, facilitating a discussion on the underlying mechanisms of micro-texture. Additionally, features are extracted from the time domain, frequency domain, wavelet packet, and entropy. The Relief-F algorithm is employed to identify 19 significant features, leading to the development of a hybrid model that integrates Bayesian optimization (BO) and Transformer-LSTM for predicting friction. Experimental results indicate that the model achieves an R2 value of 0.9835, a root mean square error (RMSE) of 0.2271, a mean absolute error (MAE) of 0.1880, and a mean bias error (MBE) of 0.1410 on the test dataset. The predictive performance and stability of this model are markedly superior to those of the BO-LSTM, LSTM–Attention, and CNN–LSTM–Attention models. This research presents a robust methodology for predicting friction in the context of friction and wear of cemented carbide–titanium alloys.

1. Introduction

The rapid advancement of high-end manufacturing sectors, including the aerospace and biomedical industries, has led to the widespread utilization of titanium alloy (Ti6Al4V) in critical components, such as artificial joints and aero-engine blades. This is attributed to its superior strength-to-weight ratio, corrosion resistance, and biocompatibility [1]. However, the machining of titanium alloys presents several challenges, including high cutting forces and accelerated tool wear, which significantly impede machining efficiency and surface quality. Cemented carbide, particularly YG8, which primarily consists of WC-Co, is a commonly employed tool material; however, it is susceptible to substantial vibration and noise when in contact with titanium alloy. This interaction not only exacerbates tool wear but may also lead to surface damage on the workpiece. Recent advancements in laser surface texture technology have demonstrated efficacy in reducing both the friction coefficient and vibration amplitude by modifying the contact interface of friction pairs. Nevertheless, the underlying mechanisms linking friction noise and friction force remain inadequately understood. Furthermore, the non-stationary and multi-scale characteristics of friction noise signals pose challenges to conventional time–frequency analysis methods, complicating the characterization of tool–material interactions. Consequently, elucidating the mechanisms of friction vibration through the analysis of noise signals is crucial for optimizing titanium alloy processing techniques and extending tool longevity.
The application of surface micro-texture technology has been demonstrated to significantly improve the wear resistance of contact surfaces, thereby addressing the issue of contact wear at the interface of workpieces. Liu et al. [2] conducted an investigation into the vibrational and tribological effects associated with micro-textured surfaces. Various micro-texture configurations were applied to stainless steel samples, followed by tribological testing. The findings indicated that micro-textures effectively mitigate friction-induced vibrations and noise during sliding contact. Xue et al. [3] performed a comparative analysis of smooth surfaces, grooved surfaces, Sn-Ag-Cu-coated surfaces, and composite surfaces through experimental methods, assessing various parameters, such as the friction coefficient, noise pressure, and vibration signals, under dry friction conditions. Their results revealed that controlled surface morphologies, characterized by uniform height distribution and reduced peak–valley structures, contribute to diminished friction fluctuations and the suppression of self-excited vibrations, ultimately leading to a reduction in noise generation. Furthermore, Zhang et al. [4] examined the vibrational and acoustic properties of textured rolling bearings under conditions of insufficient lubrication. Utilizing laser technology, they created circular pit textures with varying parameters on the bearing surfaces. Their research concluded that surface texturing markedly decreases both noise and vibration levels. Notably, the texture designated as T3 (with a diameter of 100 μm and a depth of 20 μm) exhibited optimal performance, resulting in an 8.5% reduction in noise intensity and a 29.7% decrease in vibration acceleration amplitude. The texturing process was found to suppress dominant frequency noise energy and diminish harmonic responses, leading to a reduction in the dominant frequency of noise to approximately 300 Hz.
The friction and wear test serves as a critical method for assessing interface contact wear. The friction noise signal, which acts as a medium for the release of friction energy, encompasses a wealth of information that is essential for comprehending wear mechanisms and forecasting material properties. Consequently, it has emerged as a focal point in the field of friction condition monitoring. Research conducted by Lontin and Khan [1] has provided a comprehensive review of the interrelations among noise, wear, and vibration within friction systems, emphasizing that high-precision signal processing is pivotal for elucidating the friction mechanism. Furthermore, in examining the chaotic behavior of friction signals during the wear process, Chen [5] analyzed the impact of noise on chaotic signals and investigated methods for filtering noise. By employing phase space reconstruction of the friction signal, Chen was able to analyze the evolution of the phase space trajectory and the changes in the recurrence plot, thereby uncovering the chaotic characteristics of the friction signal and facilitating the monitoring and diagnosis of friction and wear states. Sadegh [6] investigated the correlation between the lubrication state of sliding bearings and the acoustic emission signals under various operational conditions. By employing continuous wavelet transform and time domain analysis techniques, the study identified the frequency range and signal characteristics of the acoustic emission signals utilized to assess the lubrication state. Du [7] utilized time–frequency analysis to extract signal features from the vibrations and noise of diesel engines. Building upon the research on signal feature extraction, the primary frequency components of the acoustic signals were analyzed using an energy feature evaluation index. The established sensitivity factor model facilitated a comprehensive understanding of the variation patterns of the diesel engine’s vibration sources and their energy characteristics. Wang Yuanyuan [8] examined the relationship between the vibrations and noise of rolling bearings, as well as the underlying mechanisms of their occurrence. The study employed empirical mode decomposition (EMD) and envelope analysis to process acoustic signals, leading to a thorough analysis of both vibration and acoustic signals, which significantly enhanced the reliability of fault diagnosis. Mo Huifang et al. [9] conducted a study in which they collected motor acoustic signals that contained extensive state information. They employed wavelet packet decomposition to analyze these signals and computed the relative entropy of the wavelet energy packets associated with both normal and fault signals using reconstruction coefficients. This methodology enabled them to ascertain the presence of faults and to identify the frequency band associated with the fault based on the calculated values, ultimately leading to the classification of the fault type. In a separate investigation. Dong et al. [10] studied the three parameters of friction coefficient, friction fluctuation coefficient, and equivalent A sound level based on the acoustic vibration test bench. The results showed that the friction noise decreases with the increase in the initial braking speed, and that it increases first and then decreases with the increase in the braking pressure. The brake friction noise is caused by the instability of the friction system, which is caused by the gully and adhesion on the surface of the friction pair. Yeonuk et al. [11] focused on extracting wavelet coefficient characteristics from the friction noise produced during metal friction and wear processes. They observed that the peak signal-to-noise ratio of the friction noise, as determined by wavelet transform, increased with rising contact pressure; conversely, for abrasive wear, the trend was reversed. This research facilitated the continuous monitoring of friction and wear in metal friction pairs.
Currently, a significant number of studies have concentrated on the signal processing and feature extraction associated with friction and wear testing. Nevertheless, there remain notable shortcomings in the comprehensive analysis and application of noise signals. Traditional approaches predominantly emphasize the elimination of noise to recover the original vibration signal, often overlooking the intrinsic value of the noise signal itself. In reality, the mechanisms underlying noise signal generation are intricately linked to various factors involved in the friction and wear process, and alterations in these characteristics may indicate microphysical changes at the friction interface as well as fluctuations in system stability. Consequently, an exclusive focus on noise reduction, while neglecting the extraction and analysis of noise signal features, may result in an incomplete understanding of the friction and wear phenomena.
This study utilizes a dataset of acoustic signals related to the friction and wear of micro-textured cemented carbide–titanium alloys as its focal point. It proposes an analytical approach that examines these signals through the lens of noise interference. To achieve effective noise reduction while preserving essential characteristics of the signals, a novel algorithm is introduced, which integrates variational mode decomposition (VMD) and wavelet packet transform (WPT), optimized through the dung beetle optimization algorithm (DBO). Following the noise reduction process, feature extraction is performed on the acoustic signals, with feature values being refined using the relevant feature-F algorithm (Relief-F). Ultimately, a friction prediction model is developed employing Bayesian optimization (BO) in conjunction with a hybrid Transformer-LSTM architecture, facilitating dynamic monitoring and forecasting of the friction and wear processes.

2. Friction and Wear Test of Cemented Carbide–Titanium Alloy

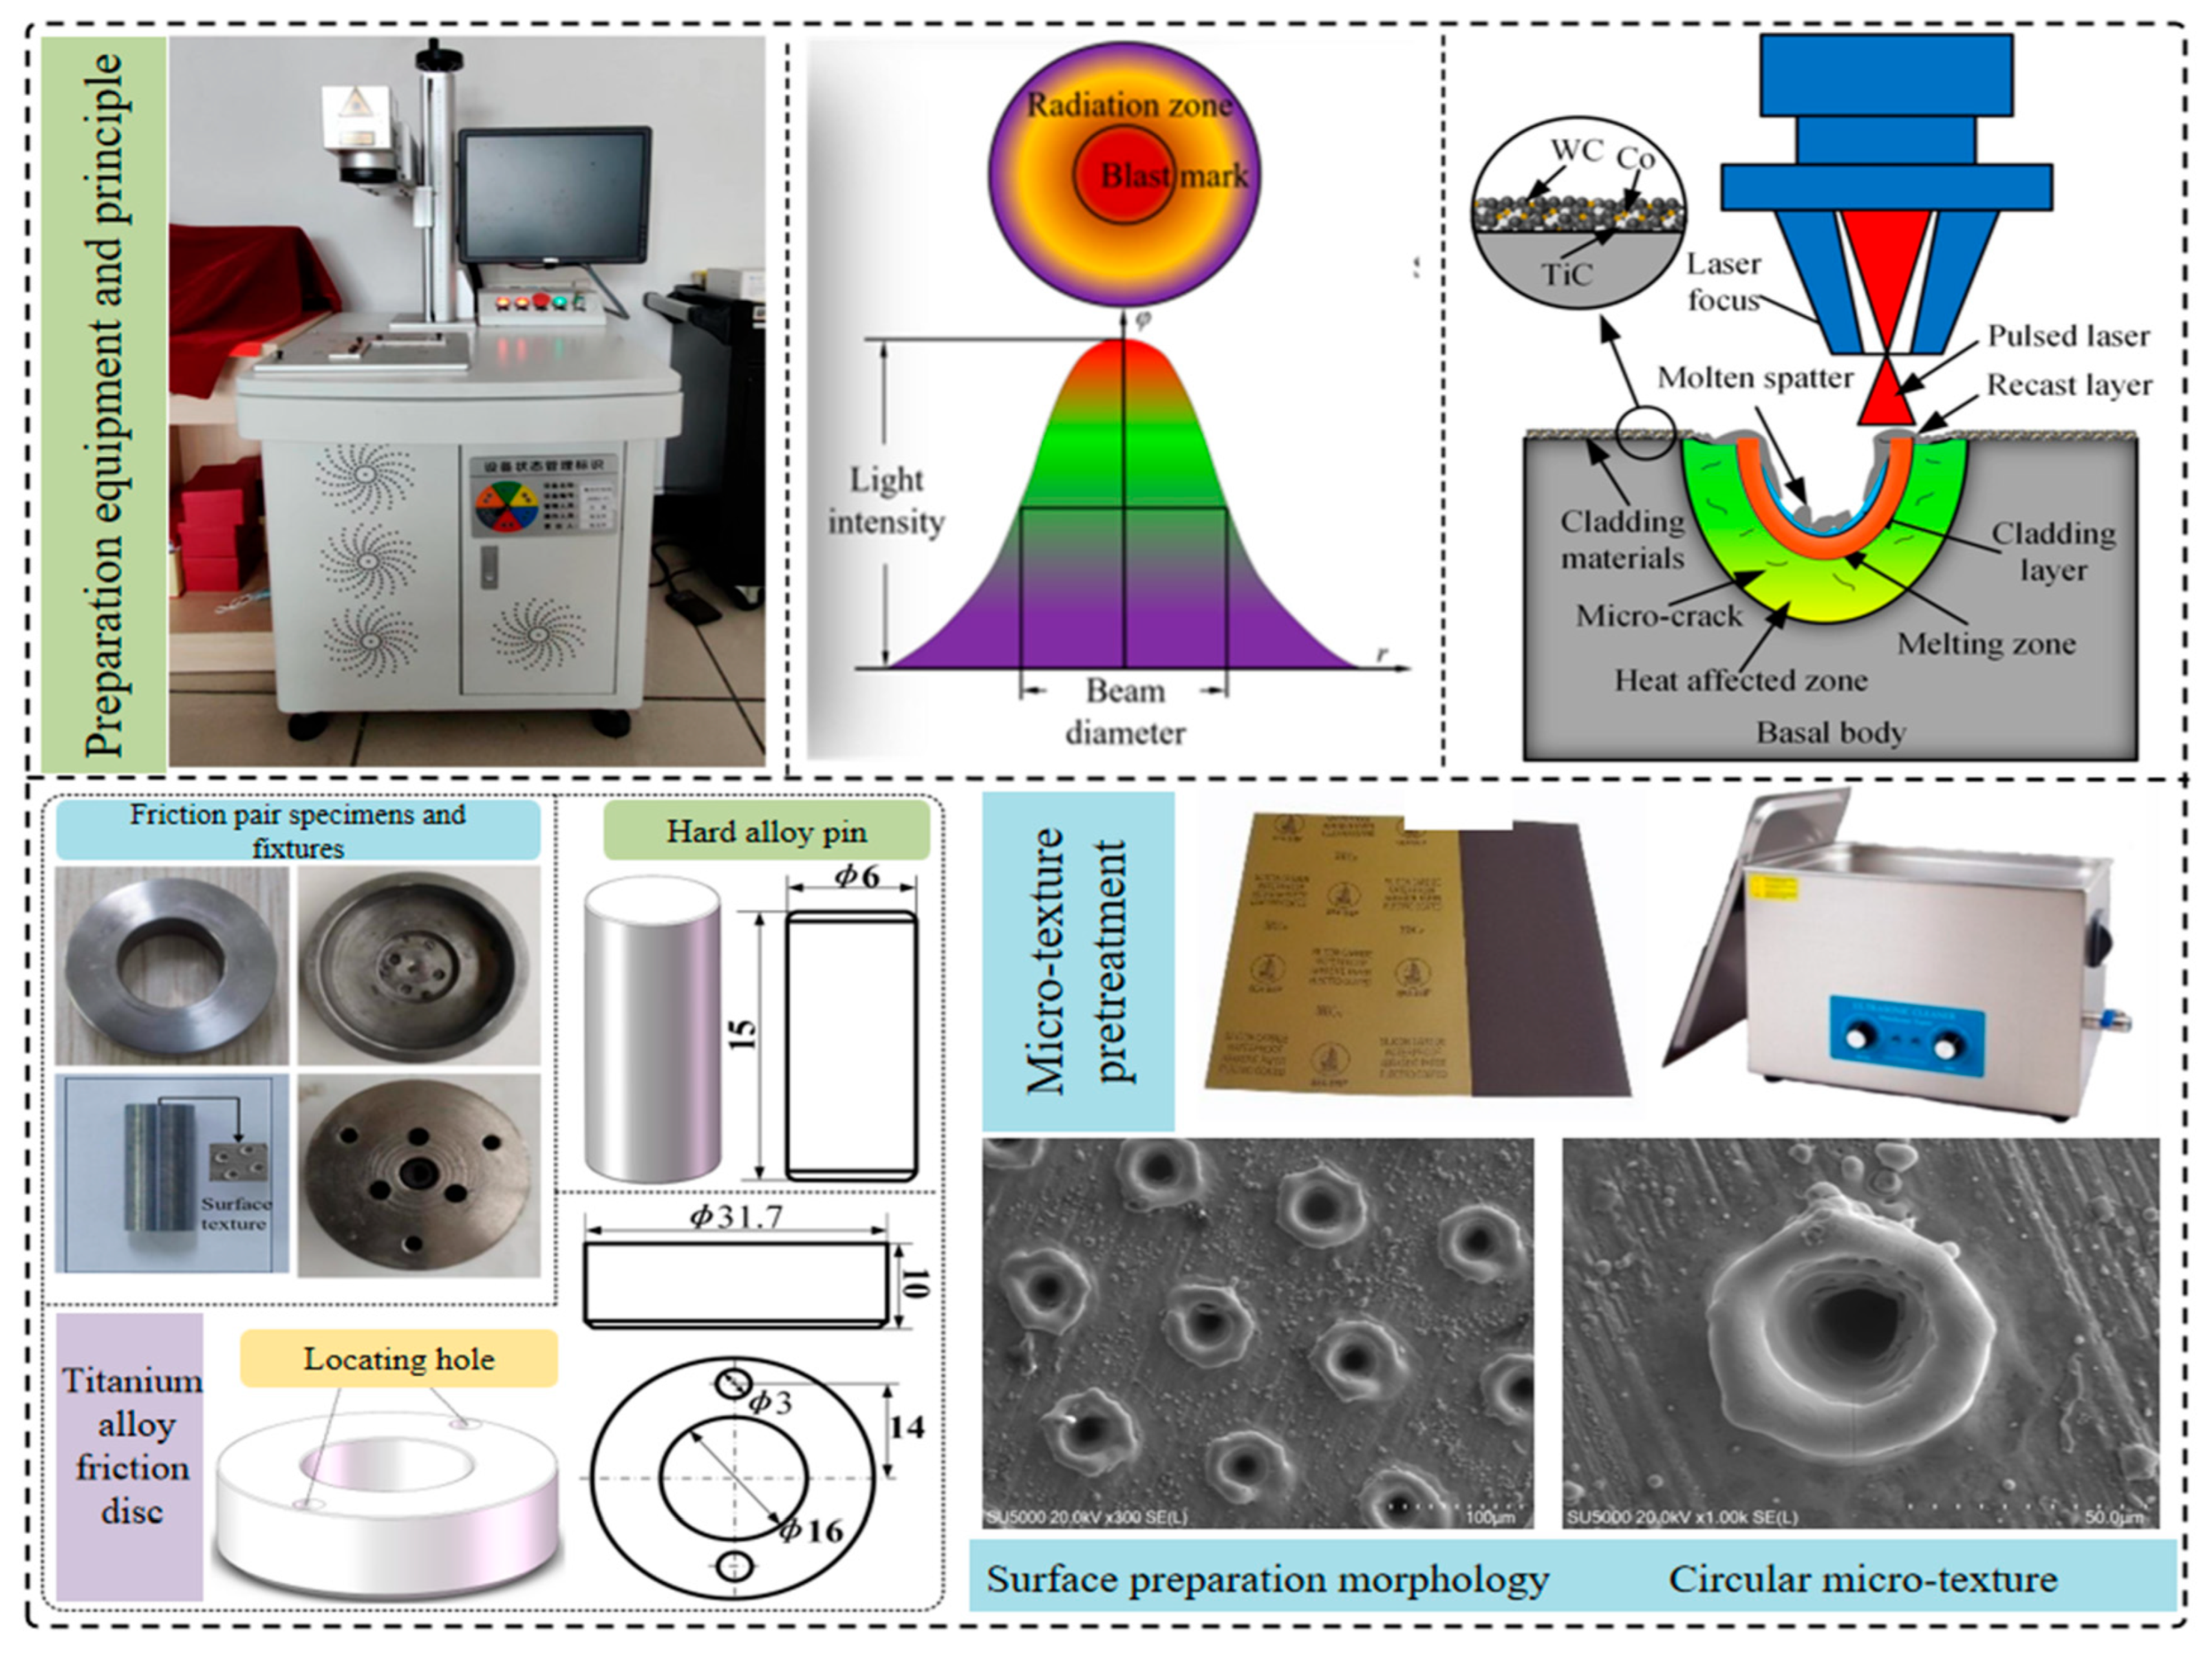
2.1. Workpiece Material Selection

In the conducted friction and wear test, the cemented carbide material utilized was YG8, characterized by a cylindrical pin with a diameter of 6 mm and a height of 15 mm. The primary constituents of this material were tungsten carbide (WC) and cobalt (Co) as the binder. The surface of the cemented carbide was subjected to laser preparation technology to create a circular micro-texture. The grinding material employed in the test was TC4 titanium alloy, specifically the Ti6Al4V variant. YG8 cemented carbide is commonly utilized as a tool for machining titanium alloy materials. The friction and wear test serves to simulate the contact wear occurring between cemented carbide and titanium alloy during the cutting process, which holds significant implications for the efficient processing of titanium alloys in subsequent applications. The preparation process and the object of the workpiece are illustrated in Figure 1.

2.2. Experimental Design

According to the different surface micro-texture parameters of cemented carbide and the thickness of cladding layer, a five-factor four-level orthogonal test was designed. The five factors were laser power p, scanning speed v, scanning times n, micro-texture spacing l, and powder thickness d. Based on the previous research of the team, four levels were designed for each factor, and the orthogonal test was designed as shown in Table 1. The rated power of the laser equipment used in the experiment was 50 W, and the spot diameter was D = d/2 + 5 (μm).

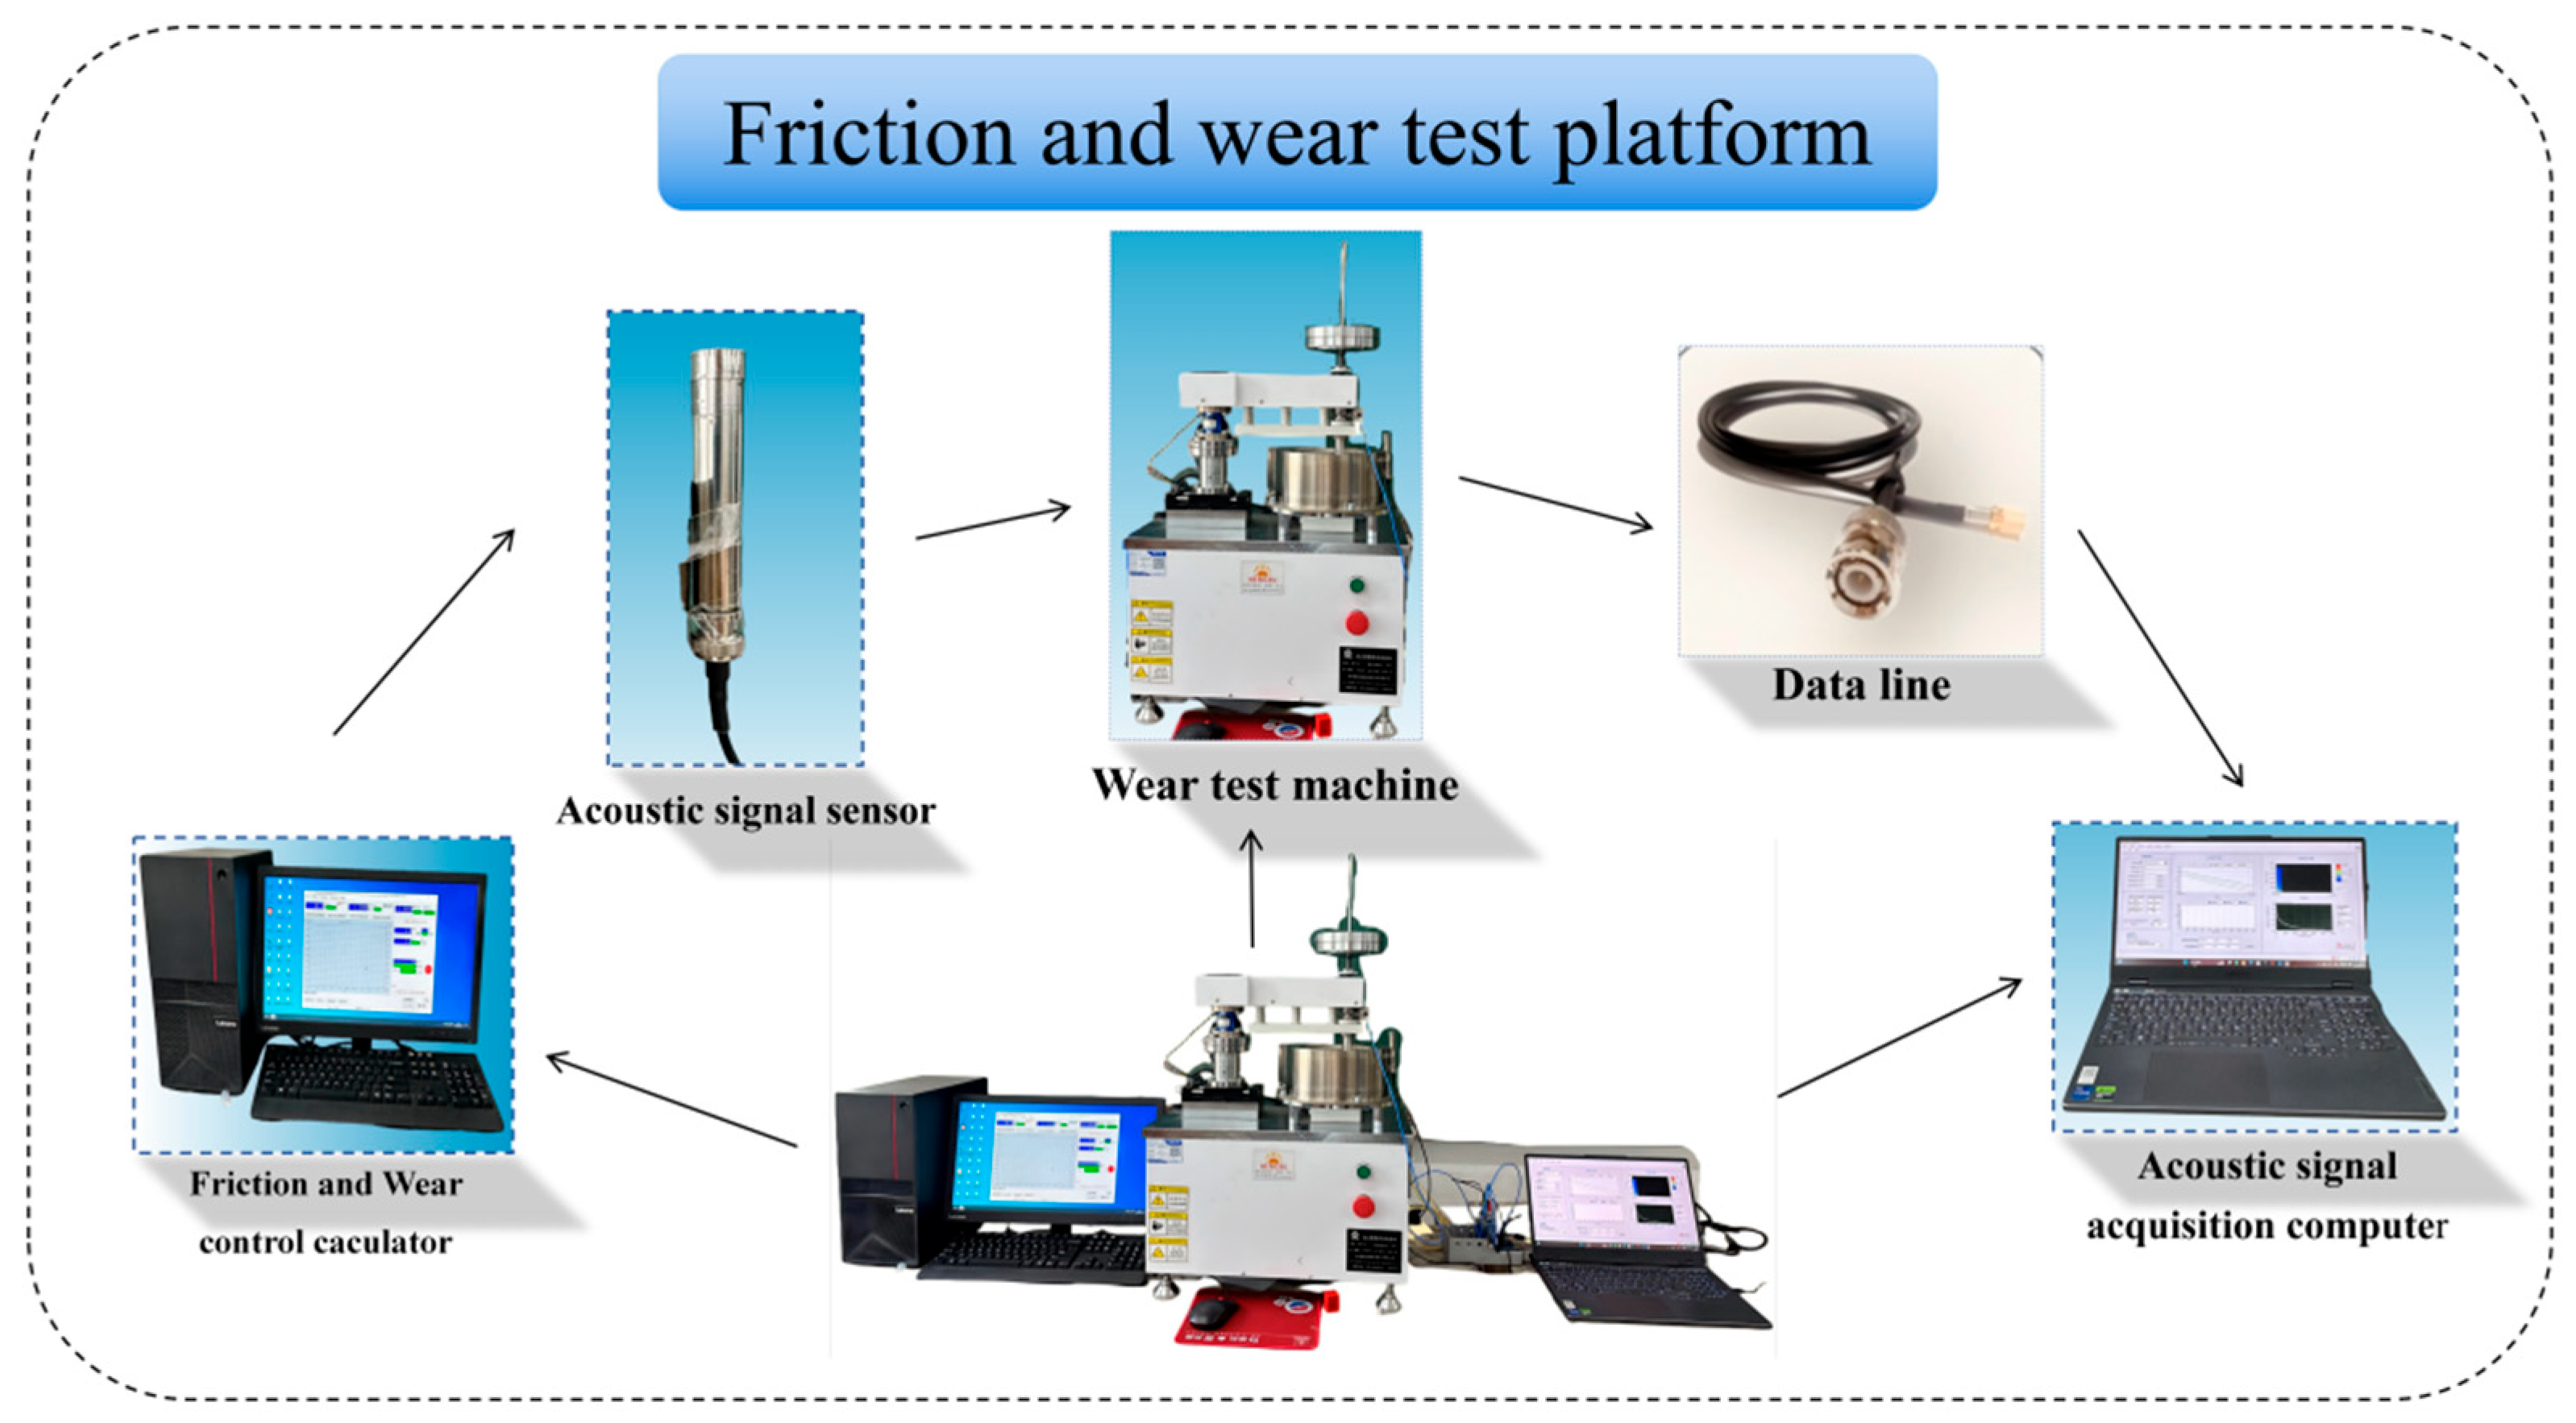
2.3. Test Platform Construction

The construction of the friction and wear testing platform is illustrated in Figure 2. The experiments were conducted under conditions of dry friction, with the relative speed of the friction pair established at 100 revolutions per minute. The length of the friction path at the center of the contact surface of the workpiece was maintained at 20 mm. Each sample underwent a grinding duration of 30 min, with a loading pressure set at 20 N. In the experimental setup, a cemented carbide column and a titanium alloy disc were securely affixed to the main working table of the high-temperature friction and wear tester, facilitating the grinding tests. During the experimentation, the sound sensor was fixed on the friction and wear platform for real-time monitoring and collection of the vibration signal and sound signal data generated during the test. The sound sensor is divided into a microphone and a preamplifier, and its working parameters are shown in Table 2.
Data acquisition was implemented using a time-division strategy, wherein acoustic signals were recorded for 60 s at intervals of 5 minutes, specifically at 1–2 min, 4–5 min, 9–10 min, 14–15 min, 19–20 min, 24–25 min, and 29–30 min, resulting in a total of seven time points. Furthermore, the micro-morphology of the sample surface was examined using an ultra-depth-of-field microscope prior to testing, and the wear surface of the cemented carbide was analyzed post-test using a scanning electron microscope.

3. The Noise Reduction Processing Method of the Friction and Wear Acoustic Signal Based on the DBO-VMD-WPT Algorithm

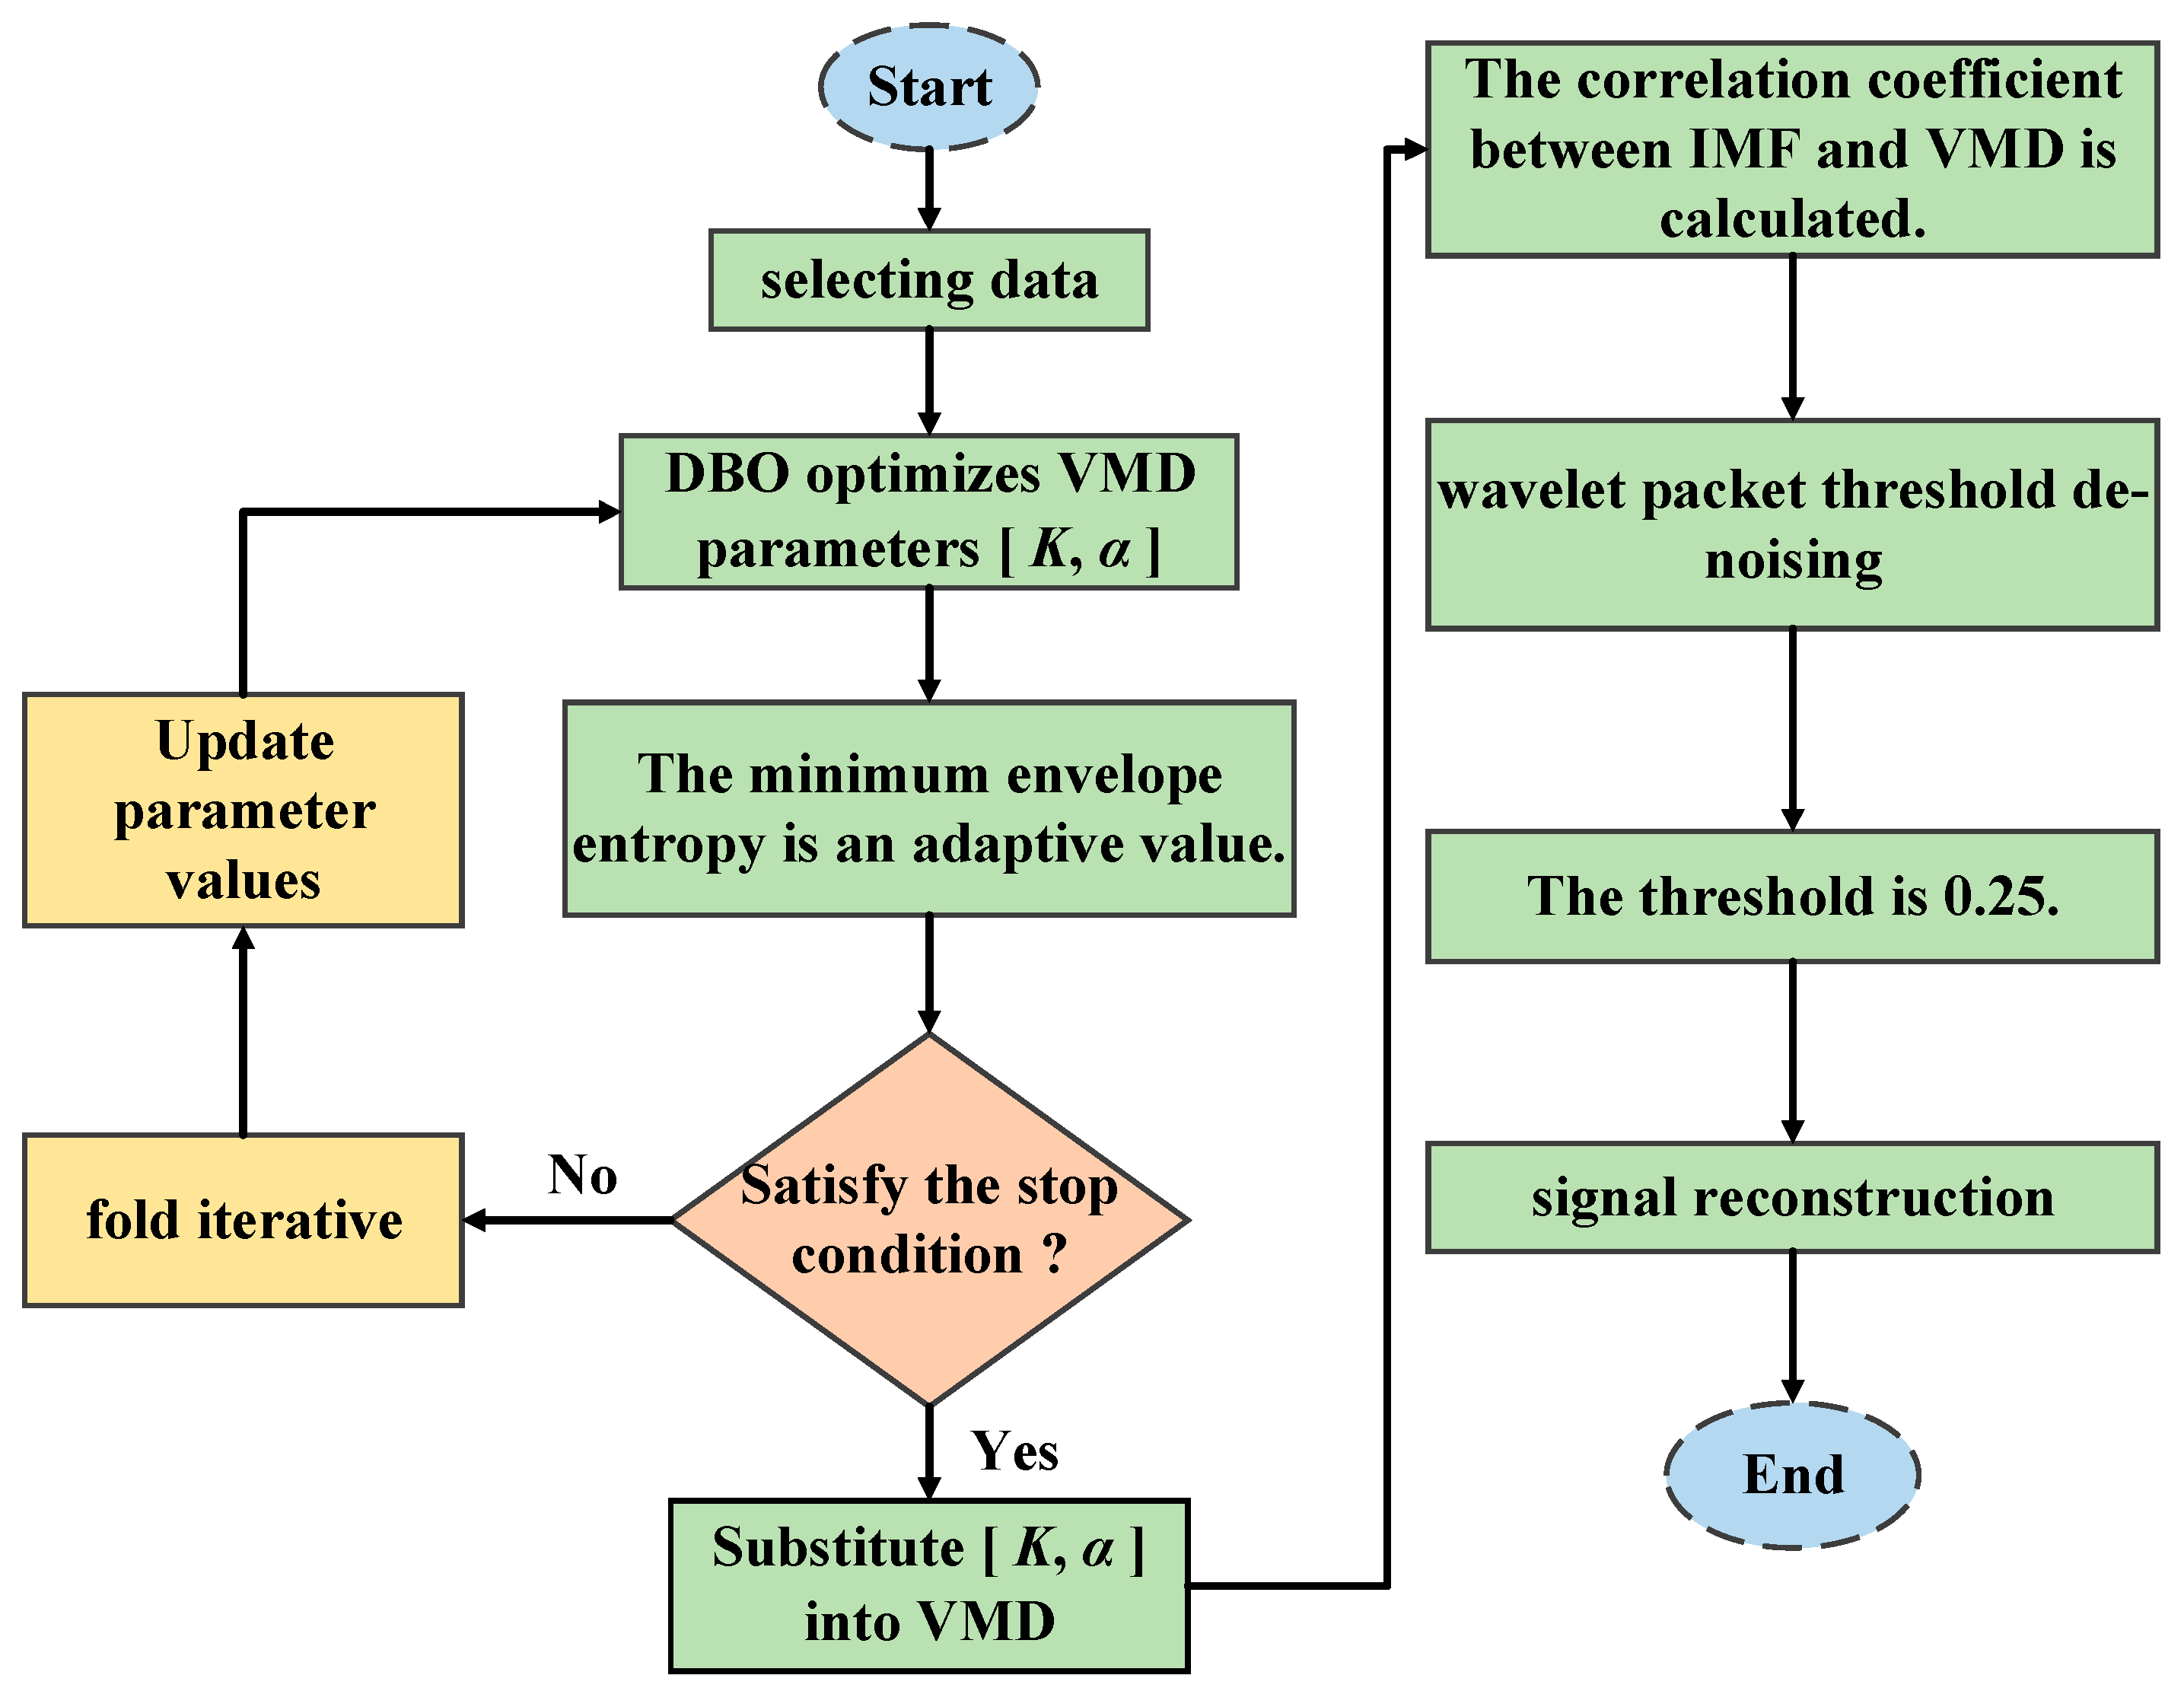
3.1. Basic Principle of the DBO-VMD-WPT Algorithm

The dung beetle optimization (DBO) algorithm primarily enhances performance by emulating a sequence of instinctual behaviors exhibited by dung beetles. This method is characterized by its robust search capabilities and rapid convergence rates [13].
Variational mode decomposition (VMD) is an adaptive and quasi-orthogonal signal decomposition technique that effectively mitigates endpoint effects and spurious components during the iterative process. It is extensively utilized in the domain of fault diagnosis, as it facilitates the transformation of complex signals into a series of component signals with constrained bandwidth, thereby enabling frequency band separation [14].
Wavelet packet transform (WPT) represents an advancement over traditional wavelet transform methodologies. It addresses the limitations associated with insufficient high-frequency resolution in wavelet decomposition by focusing on the decomposition of high-frequency components [15].
Given that the acoustic signals acquired during friction and wear testing are often contaminated with significant noise, it is imperative to decompose and reconstruct these signals to eliminate the noise. To address this challenge, the DBO-VMD-WPT noise reduction algorithm has been proposed. In this approach, DBO is employed to optimize the penalty factor (α) and the number of decomposition modes (K) within the VMD framework. Utilizing the optimized parameters, the original acoustic signal is decomposed to yield K modal components, which are subsequently filtered based on their correlation coefficients. Modes exhibiting a high correlation with friction and wear characteristics are selected for further analysis. These selected modes undergo wavelet packet decomposition and soft threshold processing. The soft thresholding technique effectively mitigates the risk of signal feature loss that may arise from excessive denoising by smoothing the signal reconstruction process. Through a series of comparative experiments involving various threshold settings, it has been determined that a threshold value of 0.25 achieves an optimal balance between noise suppression and the preservation of critical signal features. Ultimately, the processed coefficients are reconstructed into the modal components post-noise reduction, and these components are superimposed to yield the final denoised signal. The comprehensive workflow of the DBO-VMD-WPT algorithm is illustrated in Figure 3.

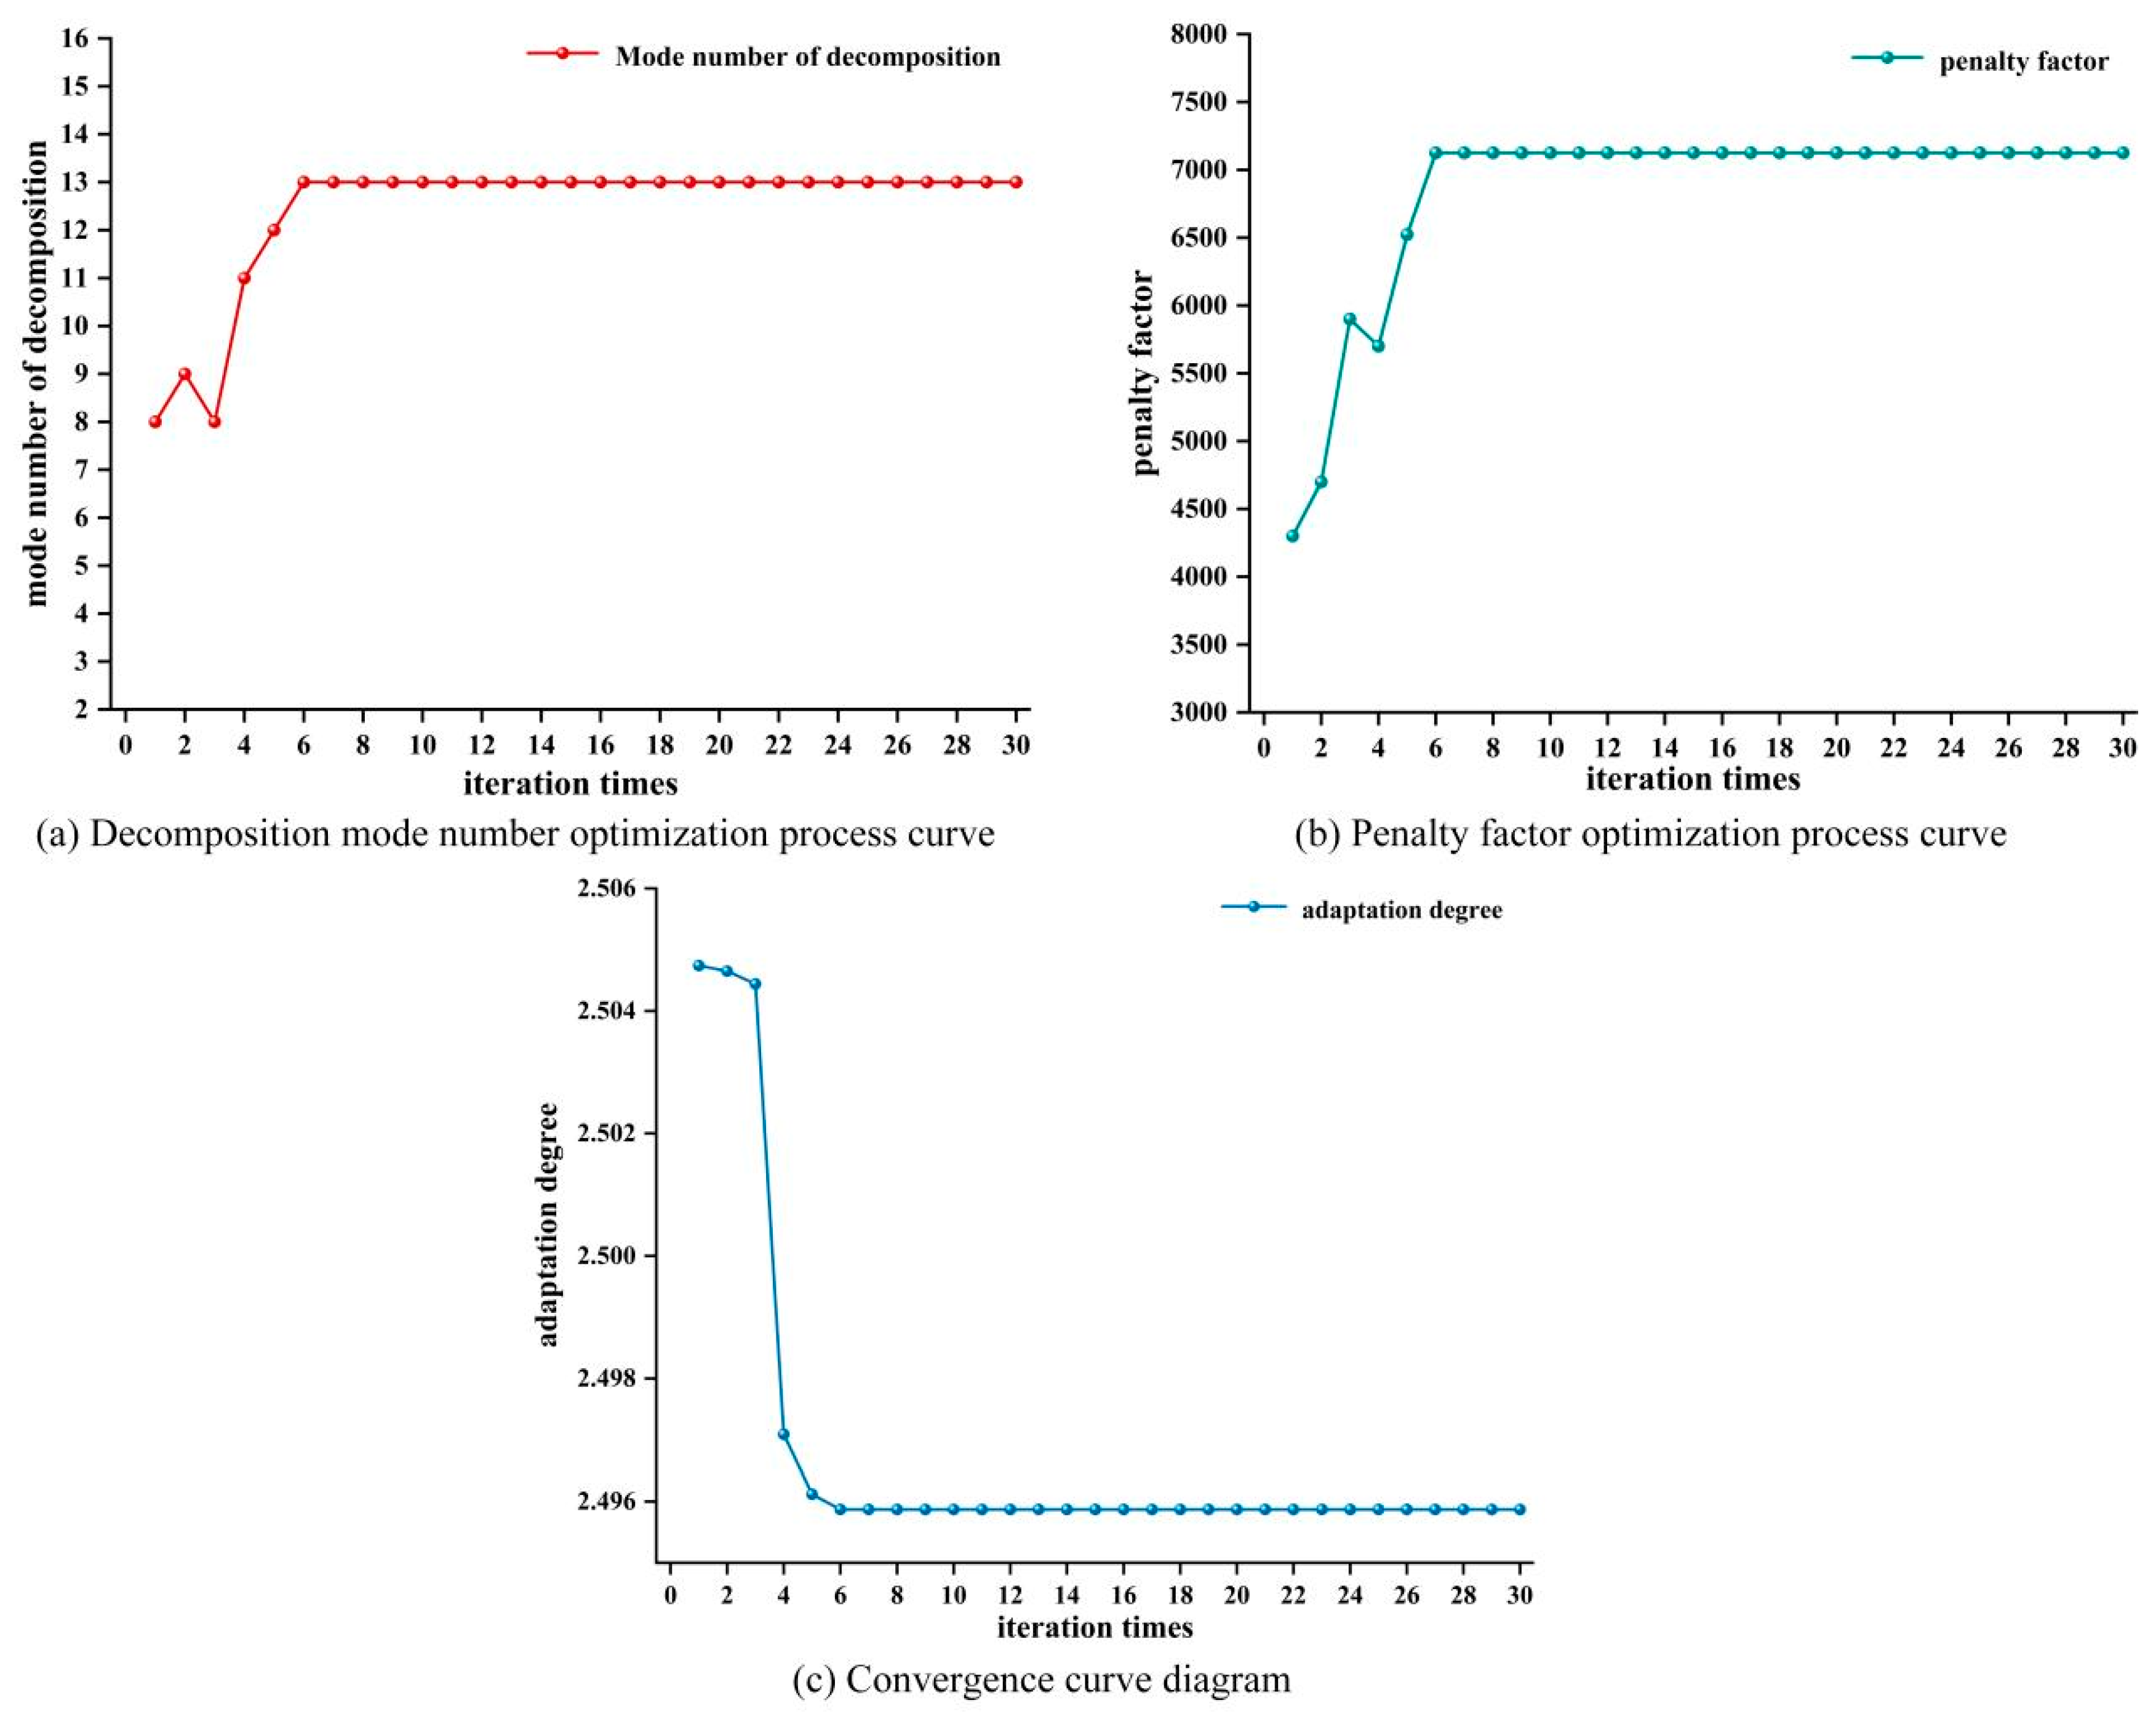
3.2. DBO-VMD-WPT Noise Reduction Processing

Initially, it is essential to establish parameters prior to the decomposition of signals using variational mode decomposition (VMD). Typically, two parameters, denoted as α and K, must be predetermined, as they significantly impact the outcomes of the decomposition process. Specifically, α is inversely related to the bandwidth of the intrinsic mode function (IMF) components; a smaller α results in a broader bandwidth, while a larger α corresponds to a narrower bandwidth. Conversely, K dictates the number of IMF components generated post-decomposition. An insufficiently small value of K may lead to mode aliasing, whereas an excessively large value can yield spurious IMF components, thereby compromising the integrity of subsequent analytical results. Consequently, this study employs the dung beetle optimization algorithm to refine the two parameters of VMD, aiming to identify the optimal parameter combinations for various friction and wear acoustic signals. In the process of optimizing the algorithm, it is necessary to establish a fitness function. A lower entropy value indicates reduced signal interference and enhances the extraction of fault feature information. Therefore, the global minimum envelope entropy is selected as the fitness function for the dung beetle optimization (DBO) algorithm. The Baoluo entropy, denoted as Ep, can be represented by the following Equation (1):
E p = j = 1 N p j lgp j P j = a j / j = 1 N a j
In this context, a(j) denotes the envelope signal, while pj represents its normalized form. After preliminary testing and regulation. During the parameter optimization process, the size of the Differential Bacterial Optimization (DBO) population is established at 10, with a total of 30 iterations conducted. Additionally, the search range for the modal component number (K) within the Variational Mode Decomposition (VMD) algorithm is constrained to the interval (2, 16), and the search range for the penalty factor (α) is restricted to (3000, 8000). Following the optimization search, the resulting optimization curve is illustrated in Figure 4. Specifically, Figure 4a depicts the optimization trajectory for the decomposition mode number (K), Figure 4b presents the optimization curve for the penalty factor (α)g, and Figure 4c shows the convergence curve of the DBO algorithm. Ultimately, the optimal parameter combination is identified as (K = 13) and (α = 7126).
In the subsequent step, the selected parameters K and α are incorporated into the variational mode decomposition (VMD) algorithm to execute modal decomposition on the original signal, thereby yielding multiple modes. Certain modes are indicative of the genuine wear characteristics, while others may encompass noise. The Pearson correlation coefficient is introduced here, as shown in the following Formula (2):
r = i = 1 N X i X ¯ σ x S i S ¯ σ s
where r represents the correlation coefficient; Xi is the i-th observed value of the variable X; X ¯ represents the mean value of variable X; Si is the i-th observed value of the variable S; S ¯ represents the mean value of variable S; σ x is the standard deviation of variable X; σ s is the standard deviation of variable S.
The Pearson correlation coefficient for each intrinsic mode function (IMF) component in relation to the original signal is illustrated in Figure 5. The modal components derived from the decomposition process are evaluated against the original acoustic signal, allowing for the retention of modes that convey significant information while discarding those associated with noise. Subsequently, the filtered variational mode decomposition (VMD) modal components undergo wavelet packet decomposition via wavelet packet transform (WPT). After several rounds of testing, the db4 wavelet is employed as the wavelet basis, with a decomposition level set to three layers and a soft threshold established at 0.25. The IMF components, post-noise reduction, are then superimposed to yield the final denoised signal. The denoising procedure is depicted in Figure 6, where Figure 6a represents the original signal, Figure 6b,c display the time domain and frequency domain waveforms of the IMF components obtained from the VMD decomposition of the original signal, and Figure 6d illustrates the reconstructed signal following wavelet packet threshold denoising.
As illustrated in Figure 7, the original signal is influenced by various factors, including friction, wear, and environmental interference, resulting in pronounced high-frequency noise characteristics. This is evidenced by significant oscillations and a discrete peak distribution within the waveform. Following the application of the DBO-VMD-WPT denoising technique, the time domain representation of the reconstructed signal exhibits a marked improvement in smoothness, with effective suppression of high-frequency noise components. The noise reduction process facilitates the separation of multiple signal components through variational mode decomposition (VMD). By integrating frequency band refinement via wavelet packet transform (WPT) and optimizing parameters through differential bacterial optimization (DBO), the method successfully preserves the essential feature components of the original signal while effectively filtering out noise. This outcome substantiates the efficacy of the proposed method in reducing noise and retaining features in acoustic signals associated with friction and wear.

3.3. Time–Frequency Analysis Based on CWT

Continuous wavelet transform (CWT) employs a collection of basis functions, referred to as wavelets, for the analysis of signals [16,17]. These wavelets are derived from a mother wavelet through processes of translation and scaling. The mother wavelet, denoted as ψ(t), is characterized by an average value of zero and typically exhibits rapid attenuation properties. By modifying the scaling factor (a) and the translation parameter (b), various wavelets can be generated, allowing for the emphasis of distinct features within the signal. The wavelet transform can be formally expressed as in the following Equation (3):
C W T a , b = 1 a = + f t ϕ * t b a d t
where f(t) represents the input signal, ϕ (t) denotes the mother wavelet, a signifies the scaling parameter (which is non-zero), and b indicates the translation parameter that determines the wavelet’s position along the time axis. The continuous wavelet transform (CWT) possesses the capability for multi-scale time–frequency localization, enabling it to concurrently capture both low-frequency trends and high-frequency transients of the signal within a unified analytical framework. By adjusting the time–frequency resolution, the frequency resolution is automatically enhanced in the low-frequency range, while the accuracy of time positioning is improved in the high-frequency range, thereby effectively accommodating the non-stationary characteristics inherent in friction and wear acoustic signals. The robustness against noise is attributed to the low correlation between the wavelet basis and the noise itself. By judiciously selecting the appropriate type of mother wavelet, it is possible to significantly suppress background noise within the time–frequency domain, thereby accentuating the feature components that are directly associated with friction. Given these advantages, this study will employ CWT to conduct time–frequency analysis on the acoustic signals obtained from friction and wear testing.
Figure 8 presents the two-dimensional time–frequency representations of the acoustic signals collected during one of the friction and wear tests, following noise reduction via DBO-VMD-WPT and subsequent transformation through CWT. Specifically, Figure 8a illustrates the time–frequency diagram corresponding to the first acquisition of acoustic signals, while Figure 8b through 8g depict the second through seventh acquisitions, respectively.
Analysis of the time–frequency distributions in Figure 8a,b reveals a continuous energy distribution in the high-frequency band exceeding 103 Hz, contrasted with relatively weak energy in the low-frequency band ranging from 101 to 102 Hz. This phase corresponds to the initial contact process between the micro-textured cylindrical pin and the titanium alloy disc. The interaction among the micro-convex peaks on the surface results in a predominance of high-frequency vibrations. Although the micro-texture on the cylindrical pin’s surface aids in reducing contact stress, the preparation of the micro-texture inevitably leads to some material deposition around the micro-pits, resulting in numerous micro-asperities at the microscale. This condition fosters collision and scratching behavior, which subsequently generates high-frequency acoustic emission signals. The high-frequency vibrations observed are fundamentally attributed to irregular contact and localized stress concentration effects induced by surface roughness.
Analysis of Figure 8c–e indicates a declining trend in high-frequency energy levels exceeding 103 Hz. In contrast, the energy within the middle and low-frequency ranges, below 103 Hz, exhibits minor fluctuations without a discernible pattern of increase or decrease. This suggests that the overall state of frictional vibration remains relatively stable. Such stability implies that as the running-in process progresses, the emergence of micro-texture debris and lubrication enhances the frictional contact between the two surfaces. Consequently, the running-in process is completed, leading to a stable wear state, a reduction in vibration, and the smooth operation of the friction and wear testing system.
Further examination of Figure 8f,g reveals a gradual increase in high-frequency energy, particularly above 103 Hz, which becomes predominant. Additionally, multiple high-energy clusters are observed near 102 Hz, with energy intensity significantly surpassing that of earlier stages. The time–frequency analysis illustrates a pattern of scattered energy distribution with increased intensity, yet it remains challenging to discern distinct frequency characteristics. These observations suggest that, at this stage, the micro-texture may be experiencing extensive damage, leading to the gradual flattening of its pits and a consequent loss of wear debris storage capacity. This results in a substantial increase in the direct contact area between the cylindrical pin and the titanium alloy disc, which in turn causes a sharp rise in the friction coefficient. Simultaneously, the generation of numerous abrasive particles that participate in the wear process contributes to the cutting and furrowing of the micro-textured surface, resulting in pronounced abrasive wear.

4. Friction Prediction Model Based on BO–Transformer–LSTM

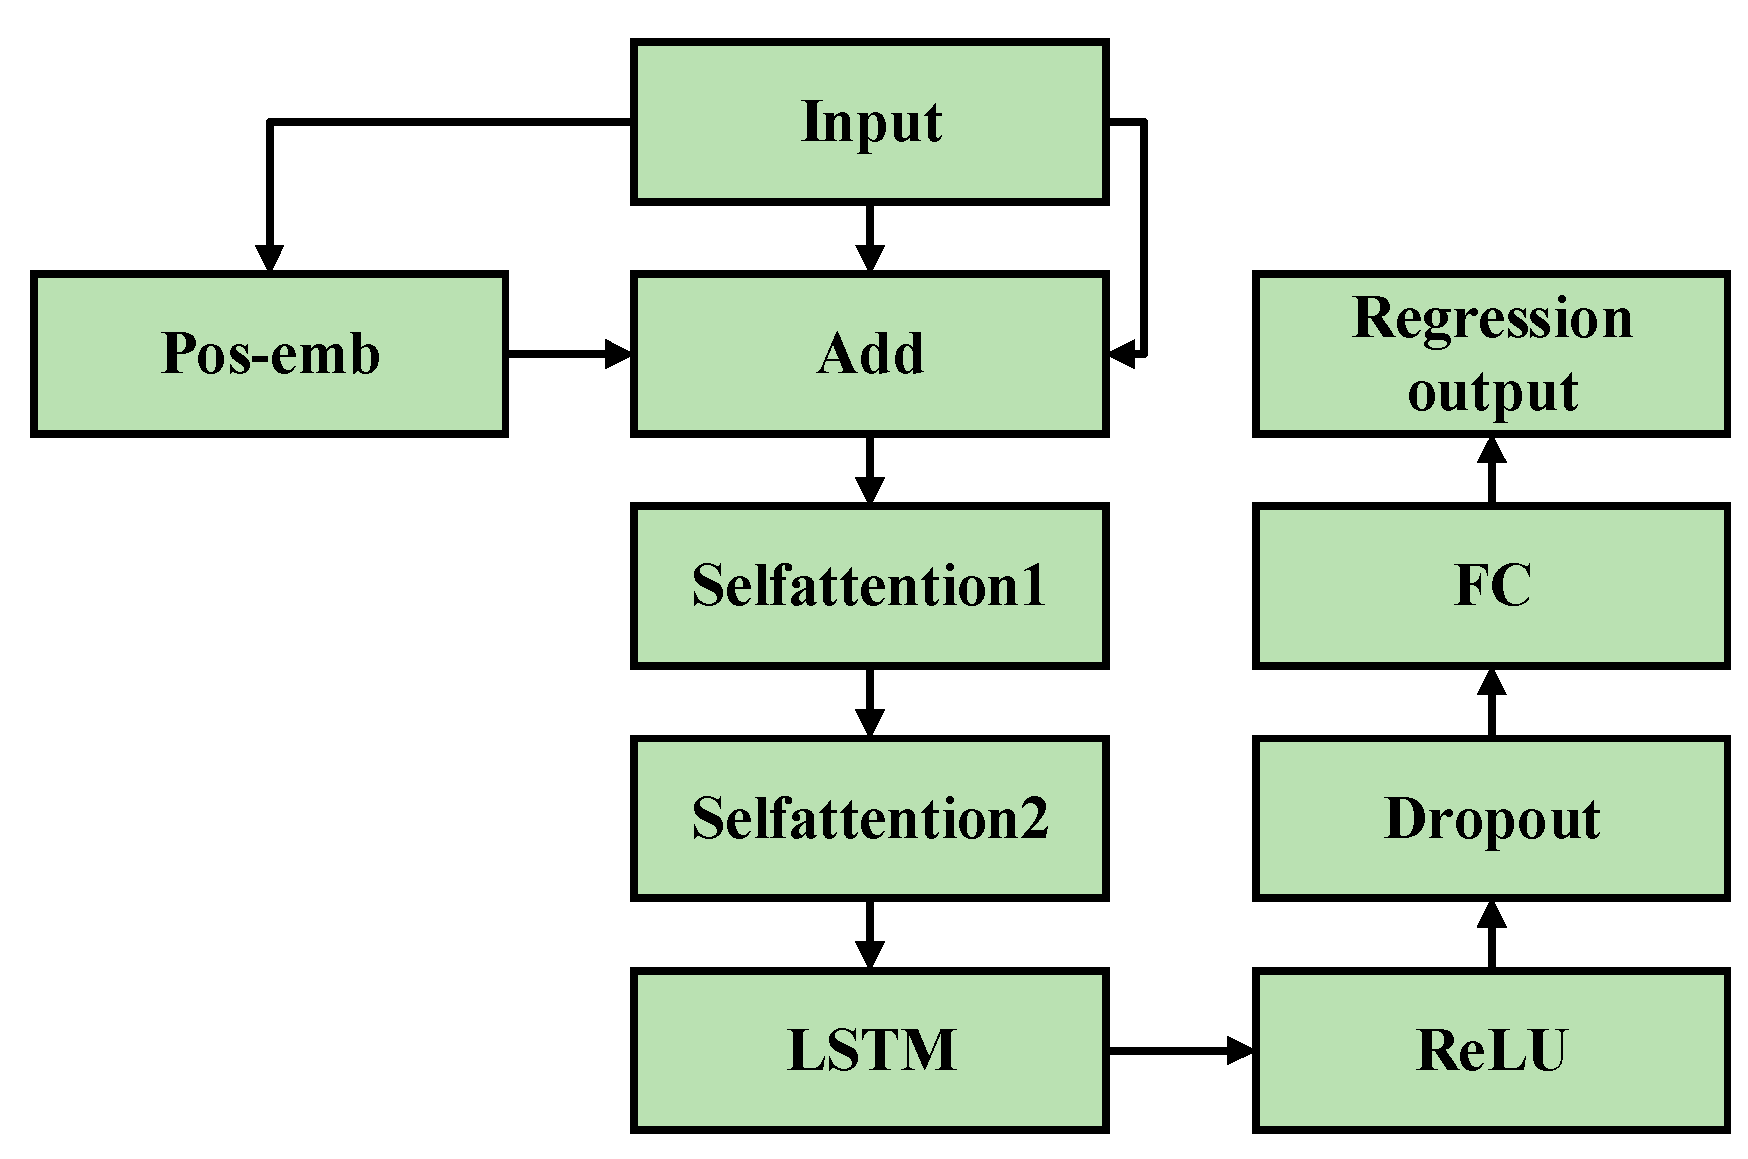
4.1. Basic Principles of the BO–Transformer–LSTM Model

Bayesian optimization (BO) is a global optimization technique that employs probabilistic models. The fundamental principle involves the development of a surrogate model for the objective function utilizing Gaussian process regression, with the aim of iteratively identifying optimal parameters through a strategic balance of exploration and exploitation as dictated by the acquisition function [18]. Acoustic signals generated during friction and wear processes often exhibit nonlinear and time-varying properties. BO enhances the model’s adaptability to these complex signals by dynamically adjusting its parameters.
The Transformer architecture was originally designed for machine translation tasks and comprises several key components, including positional encoding, an encoder, a decoder, and a feedforward network. Its primary advantage lies in its high degree of parallelization, which significantly enhances computational efficiency, as well as its ability to capture long-term dependencies, thereby addressing challenges associated with long-term dependency issues [18]. In the context of acoustic signals, wear characteristics may manifest at various temporal points, and the Transformer model is capable of capturing cross-period correlations, thereby improving predictive accuracy.
Long short-term memory (LSTM) networks represent a specialized form of recurrent neural networks (RNNs) that effectively mitigate the issues of gradient vanishing and long-term dependencies that are commonly encountered in traditional RNNs [19].
In friction and wear testing scenarios, the wear process of materials demonstrates pronounced nonlinear characteristics. The acoustic signals collected during these tests encompass multidimensional feature information within the time–frequency domain and exhibit complex interdependencies among the data. To overcome the limitations of conventional analytical methods in addressing high-dimensional nonlinear data, there is a pressing need to develop a predictive model with robust generalization capabilities. Regression analysis, as a classical data modeling approach, is adept at uncovering the underlying patterns within multi-source heterogeneous data by establishing the mapping relationships between independent and dependent variables. This method does not impose stringent requirements on the characteristics of data sequences, making it particularly suitable for complex scenarios involving multivariate interactions [20,21].
This study introduces a hybrid predictive model, designated as BO–Transformer–LSTM, which is grounded in a multivariate single-output framework. This model integrates Bayesian optimization (BO), a Transformer encoder, and a long short-term memory (LSTM) network. The architecture leverages the multi-head attention mechanism of the Transformer to effectively capture long-range dependencies among acoustic signal features, while also utilizing the memory capabilities of LSTM to address the dynamic characteristics of time-series data. Furthermore, the BO algorithm is employed to globally optimize the hyperparameters of the model. The primary objective of this approach is to achieve precise modeling of the relationship between acoustic signal features and variations in friction during wear processes, thereby providing technical support for the real-time monitoring and fault prediction of mechanical equipment wear conditions.
In the context of complex regression analysis tasks, the proposed combined model demonstrates superior performance, particularly in handling high-dimensional and nonlinear data. To optimize the core parameters of the BiLSTM model, the bayesopt function is utilized to implement a Bayesian optimization strategy. Testing has established that the optimal range for the initial learning rate of the BiLSTM is between [0.003, 0.1], which significantly enhances training efficiency while allowing for meticulous data fine-tuning. Given the limited volume of input feature data, the number of hidden layer nodes is constrained to a range of [50, 200] to mitigate the risk of overfitting, thereby enabling the model to capture deep data features while preserving its generalization capability. Additionally, the optimization range for the L2 regularization coefficient is set between [0.003, 0.1], which provides moderate constraints on model parameters and prevents excessive regularization from impairing the model’s learning capacity. The comprehensive process of the BO–Transformer–LSTM methodology is illustrated in Figure 9.
Based on the dimensions of the input and output features, a training network architecture has been developed that comprises an input layer, a Transformer component, an LSTM component, an auxiliary layer, and an output layer. The architecture of the BO–Transformer–LSTM training network is illustrated in Figure 10.

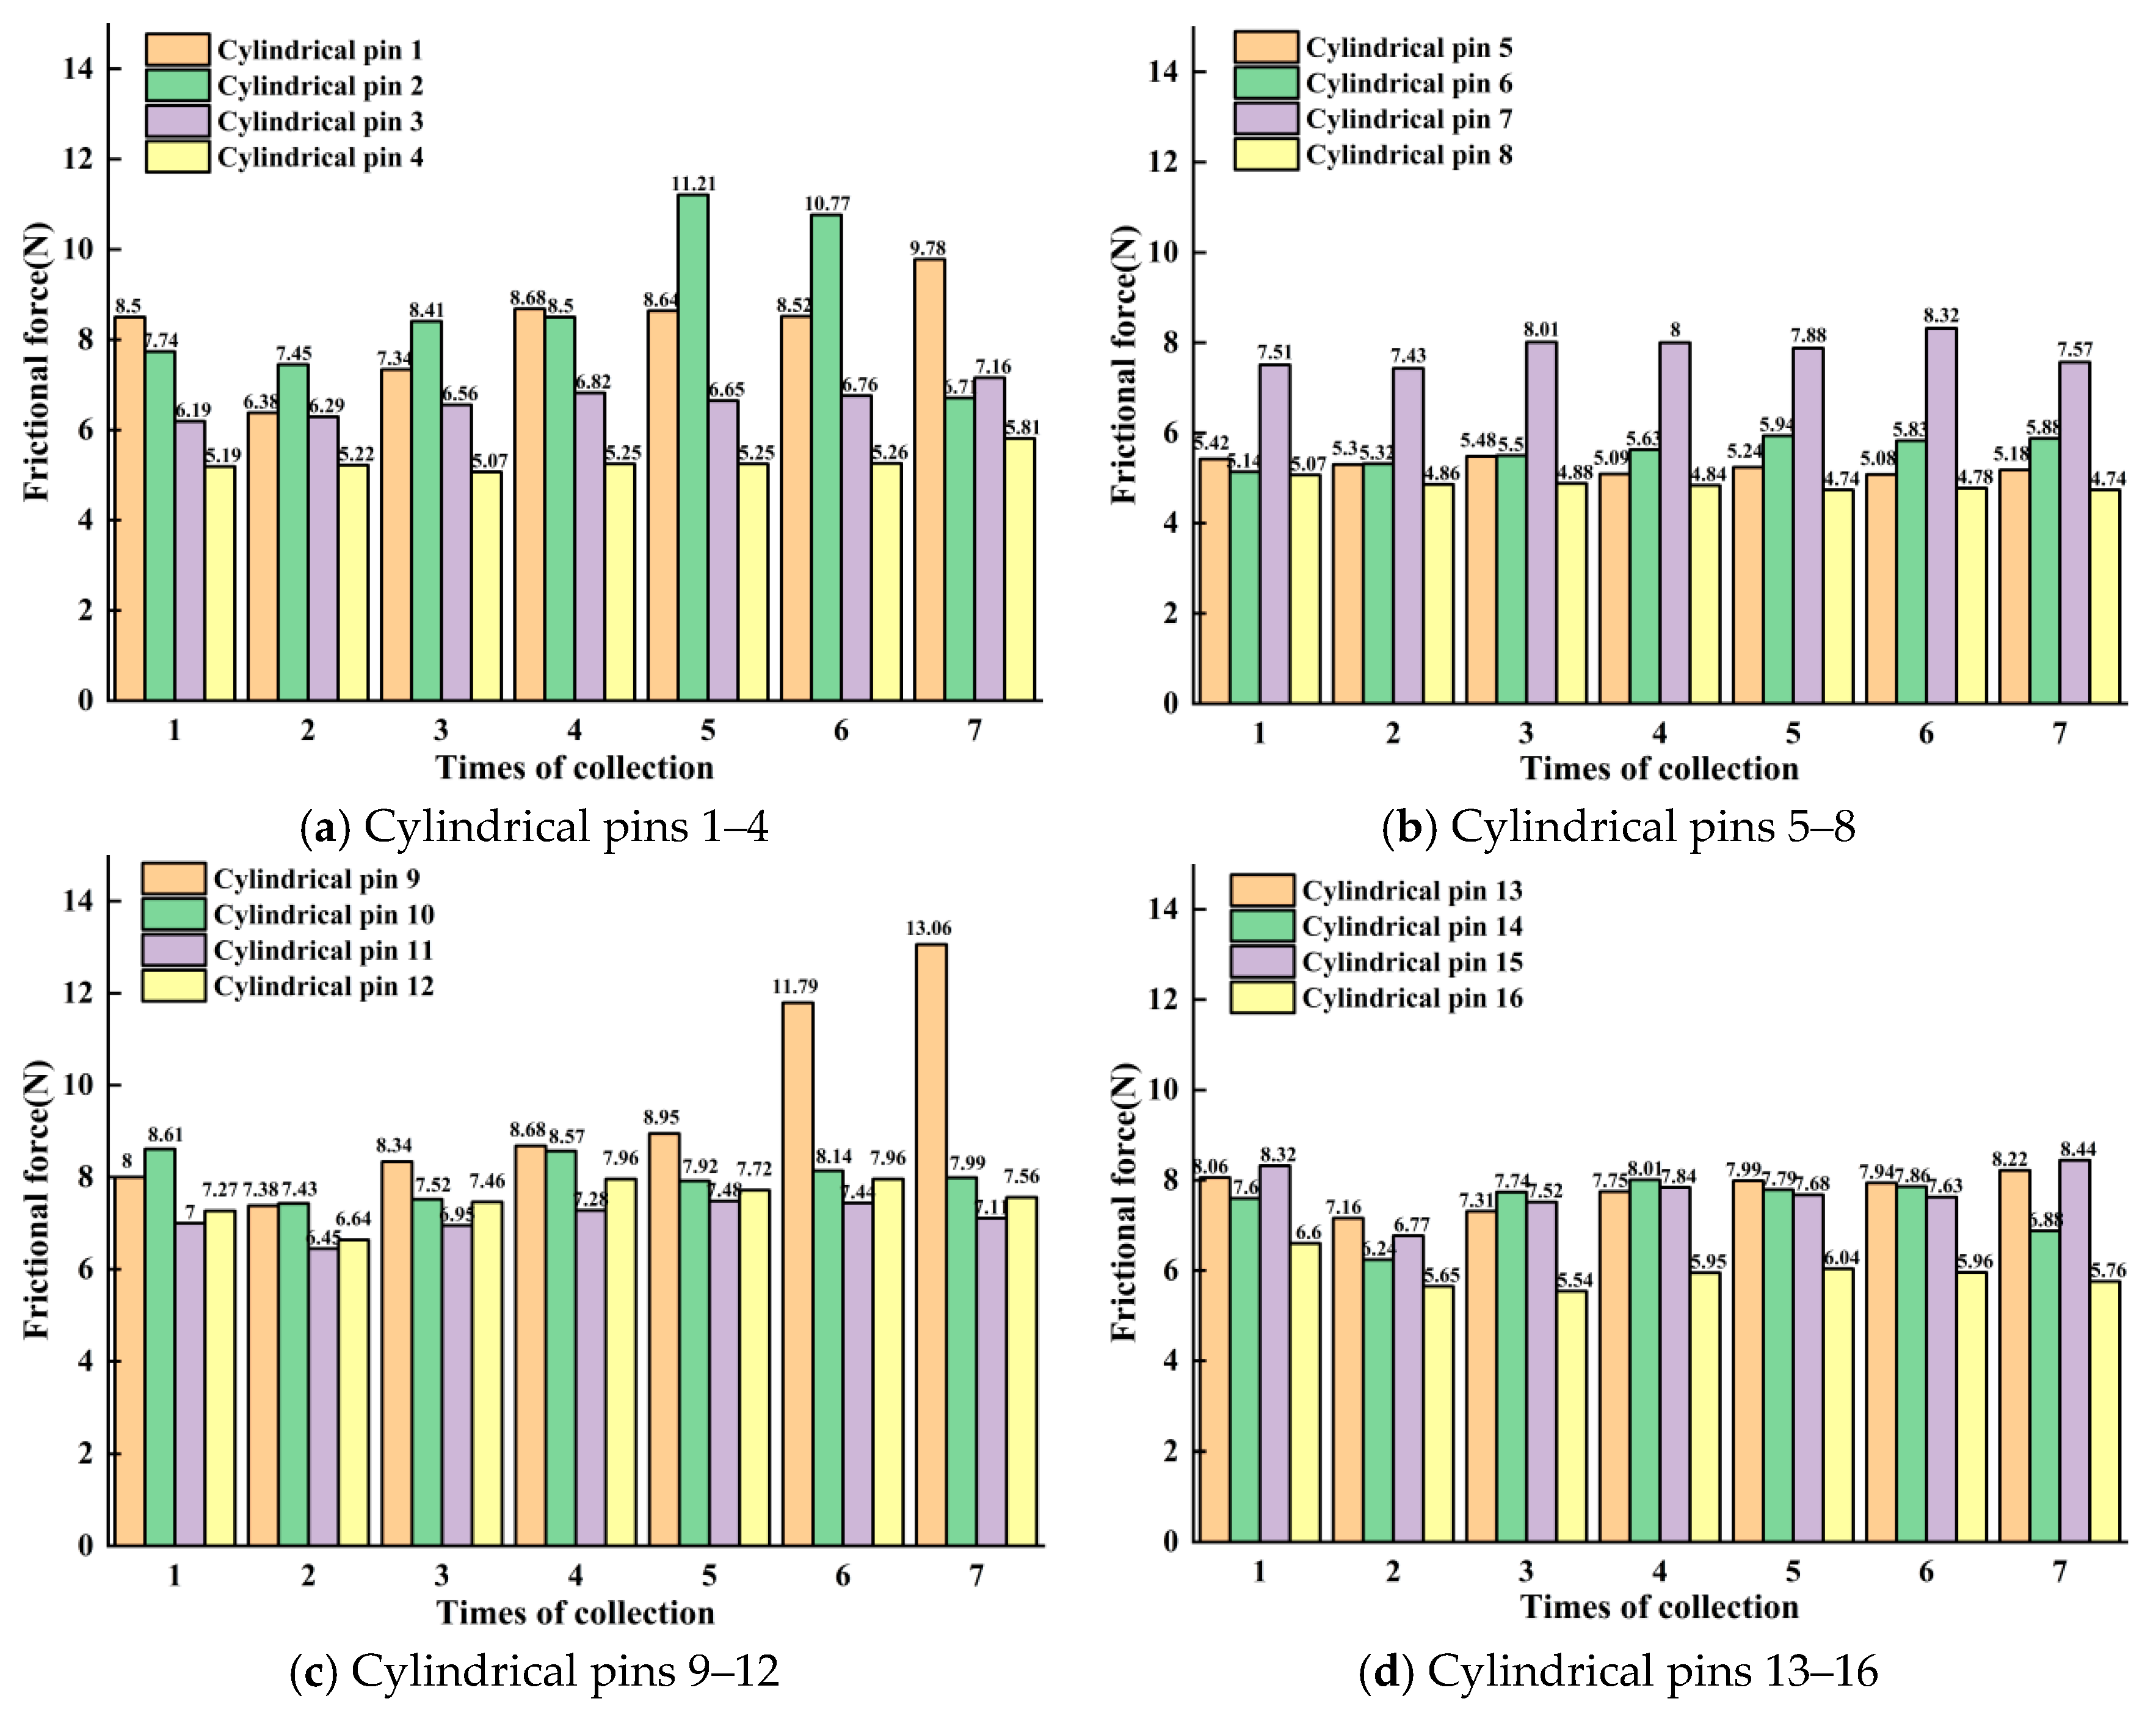
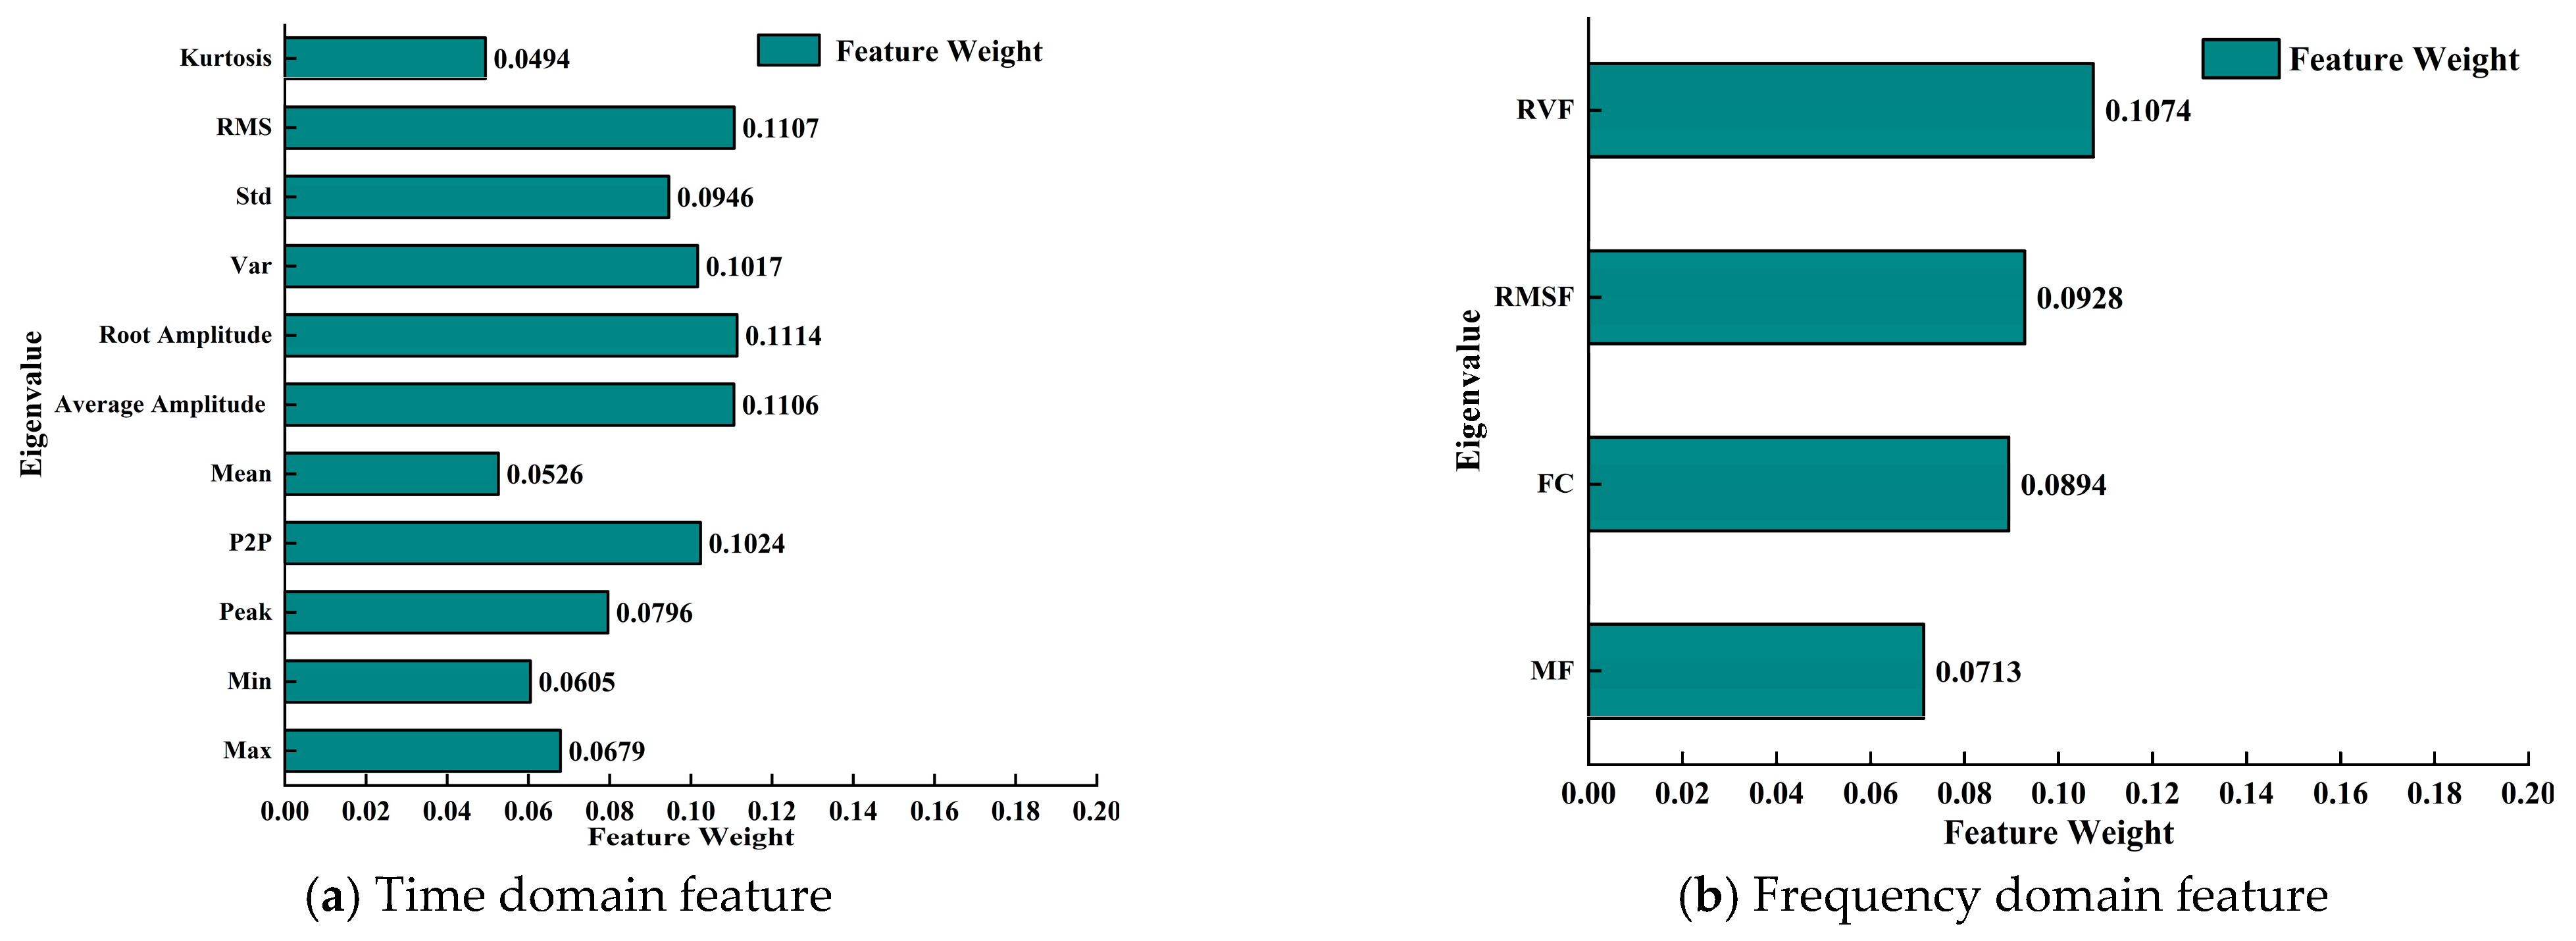
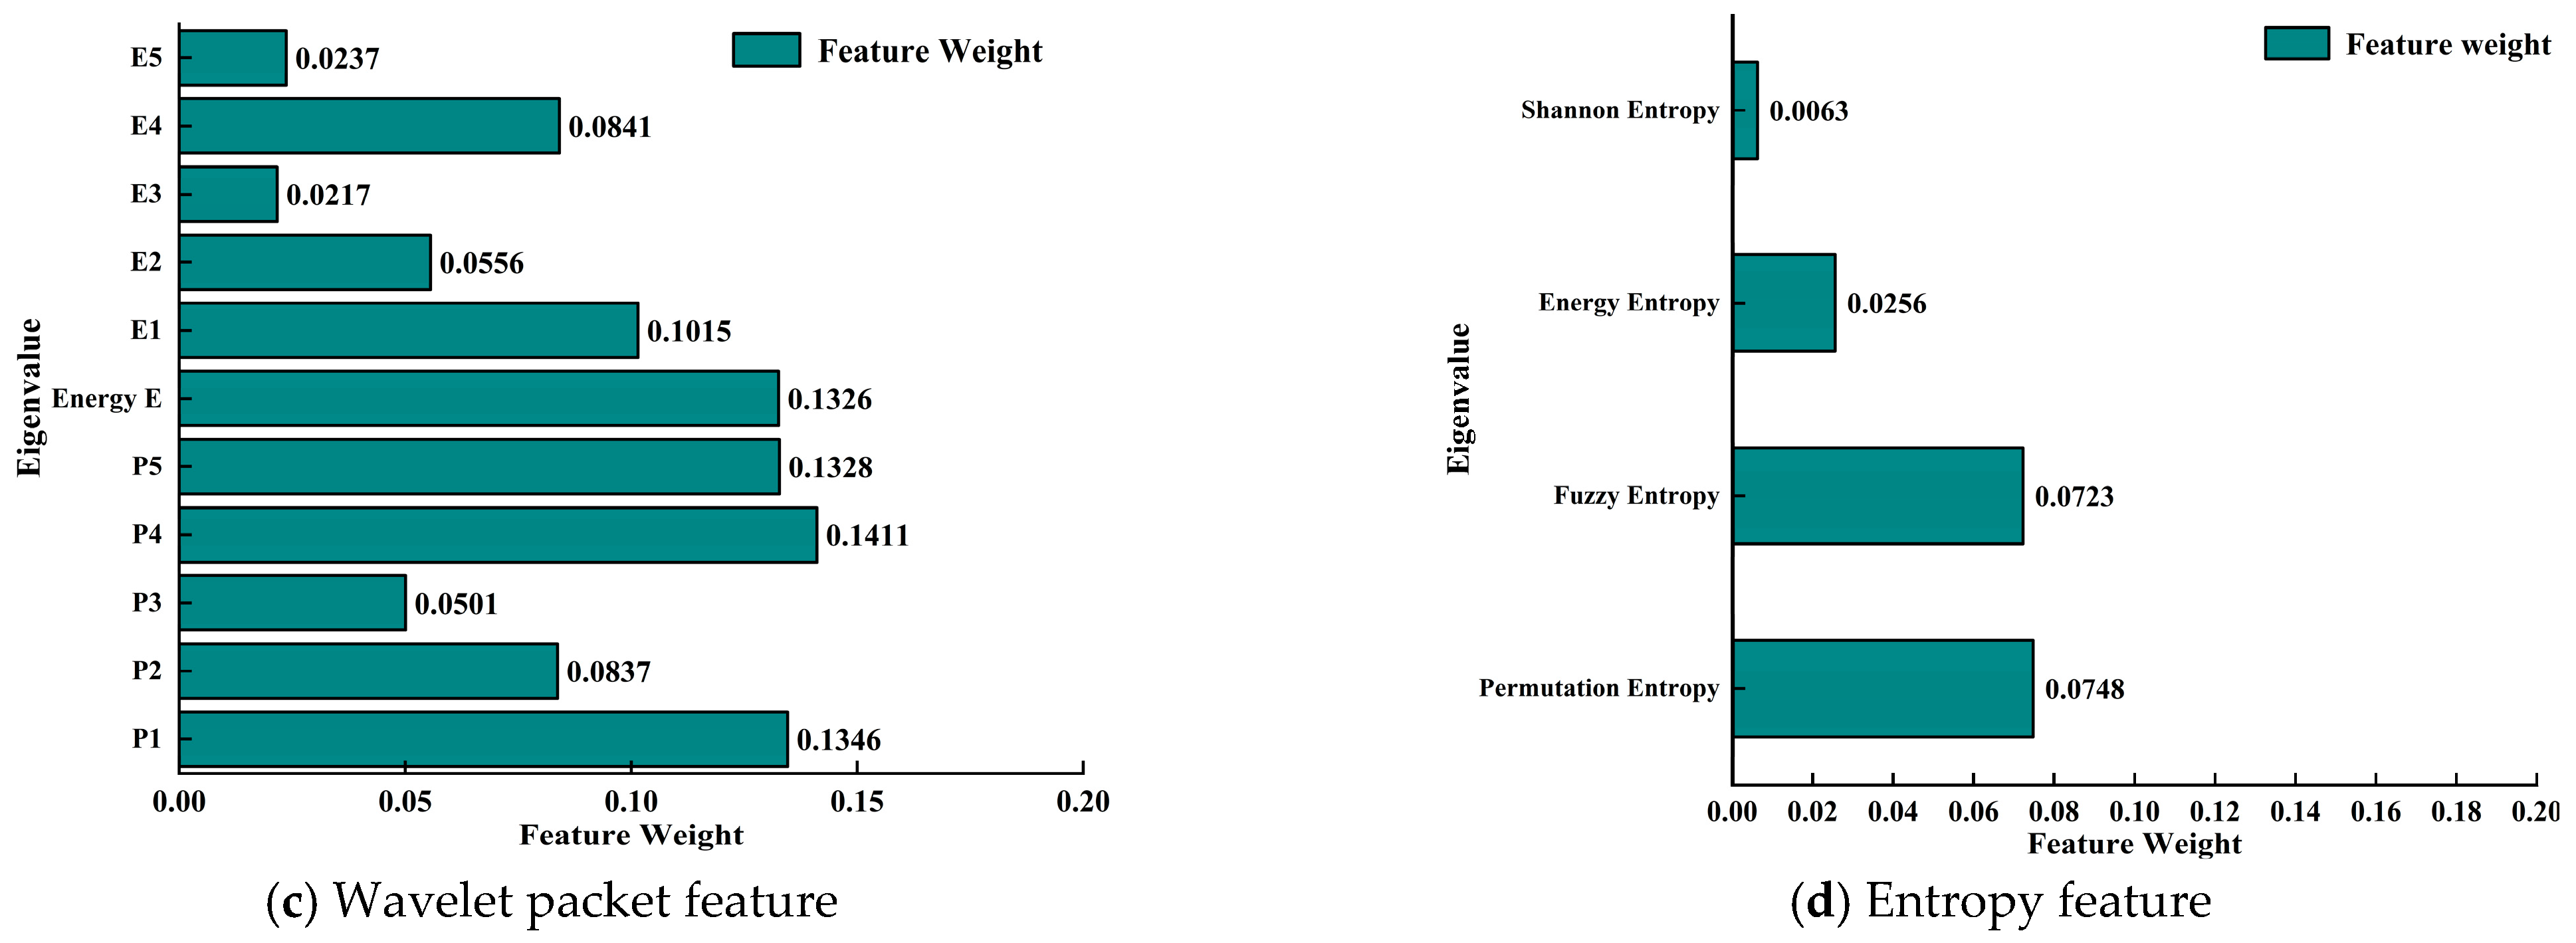
4.2. Friction Force Acquisition and Feature Extraction

A total of 112 data sets were obtained from 16 cylindrical pins, with 7 acoustic signals recorded for each grinding test. The friction force measured during these tests is illustrated in Figure 11.
In the domain of acoustic signal processing, multi-domain feature extraction has emerged as a fundamental approach for the analysis of complex signals. Time domain analysis is particularly significant for monitoring operational conditions that necessitate stringent real-time responses and exhibit relatively stable signal frequencies, as it intuitively reflects the variations in signal amplitude over time. Conversely, frequency domain analysis, facilitated by Fourier transform techniques, effectively isolates distinct frequency components within the signal, thereby serving as a critical foundation for diagnosing periodic faults. For acoustic signals characterized by pronounced non-stationarity, wavelet packet transform, with its advantages in multi-scale decomposition, adeptly captures the local mutation characteristics of signals, rendering it a potent tool for the analysis of transient phenomena. Furthermore, entropy calculation, as a quantitative measure of signal complexity and uncertainty, demonstrates heightened sensitivity to noise interference and nonlinear characteristics, thereby offering unique insights for the recognition of equipment anomalies and the classification of operational modes [22,23,24].
To thoroughly explore the feature information embedded within acoustic signals, this study develops a multi-dimensional feature analysis system that systematically integrates the joint extraction of time domain, frequency domain, wavelet packet, and entropy values. By amalgamating the strengths of various analytical methods, the study transcends the limitations inherent in single-dimensional analyses, facilitating a nuanced examination of acoustic signal characteristics. This comprehensive approach provides enhanced informational support for subsequent friction prediction. The relevant characteristic values are presented in Table 3.

4.3. BO–Transformer–LSTM Model Construction

The Relief-F algorithm, a feature-weighting technique, assigns varying weights to features based on their correlation with specific categories. Features that receive weights below a predetermined threshold are subsequently eliminated (see [25]). The correlation assessed by the Relief-F algorithm is predicated on the features’ capacity to differentiate between closely situated samples.
According to the above, the total sample size is 112 groups. A total of 30 kinds of eigenvalues are extracted from each group as input, and the feature selection based on Relief-F algorithm is carried out with the friction data as the guide output. The weight ratios of the thirty eigenvalues are illustrated in Figure 12. Specifically, Figure 12a presents the weight ratios of the time domain eigenvalues, Figure 12b depicts the weight ratios of the frequency domain eigenvalues, Figure 12c shows the weight ratios of the wavelet packet eigenvalues, and Figure 12d illustrates the weight ratios of the entropy eigenvalues.
Following multiple iterations of selecting varying quantities of features to evaluate the regression analysis model, it was determined that the model achieved the highest correct recognition rate when 19 features were utilized. At this optimal number of features, the root mean square error (RMSE) remained consistently around 0.3. An increase in the number of features corresponded with a rise in the RMSE value. Conversely, a reduction in features also led to an increase in the RMSE, accompanied by issues of non-fitting. Consequently, the study selected 19 features, discarding all original features beyond this threshold. The final set of features, after the screening process, comprises 19 eigenvalues, as detailed in Table 4.
In conclusion, the model input comprises 19 feature parameters identified through the Relief-F feature selection algorithm, while the output variable is represented by the real-time measured friction force. This framework facilitates the development of a BO–Transformer–LSTM regression prediction model, which is based on a dataset consisting of 112 samples.

4.4. Model Prediction Results Analysis and Model Comparison

To assess the efficacy of the proposed BO–Transformer–LSTM model in predicting friction, a series of experiments were conducted utilizing the previously constructed dataset. For comparative analysis, three models were selected, namely BO-LSTM, LSTM–Attention, and CNN–LSTM–Attention. The evaluation metrics employed include mean absolute error (MAE), root mean square error (RMSE), coefficient of determination (R2), and mean bias error (MBE). These metrics encompass error measurement, fitting quality, and the presence of systematic bias, thereby ensuring a comprehensive and reliable evaluation.
The model was trained using a random selection of 70% of the samples from the dataset, with the remaining 30% allocated for testing purposes. Each dataset was normalized to enhance the model’s performance and stability. The predictive outcomes of all models were analyzed for both the training and testing sets. Table 5 presents a comparison of the evaluation indices for each model on the training set, while Table 6 provides a similar comparison for the testing set. The experimental findings demonstrate the superior performance of the BO–Transformer–LSTM regression prediction model across multiple metrics. Specifically, on the training set, BO–Transformer–LSTM achieved an MAE of 0.1634 and an MBE of 0.1550, reflecting reductions in error of 25.42% and 26.16%, respectively, compared to the second-best model, CNN–LSTM–Attention. On the testing set, BO–Transformer–LSTM recorded an MAE of 0.1880 and an MBE of 0.1410, resulting in error reductions of 29% and 43.82%, respectively, when compared to the CNN–LSTM–Attention model. These results indicate a significantly enhanced performance relative to the comparative models.
Figure 13, Figure 14, Figure 15 and Figure 16 illustrate the fitting curves for each model applied to both the training and test sets. The data indicates that the BO–Transformer–LSTM model exhibits a low prediction error, effectively capturing the underlying trends within the dataset. The R2 value for the training set is recorded at 0.9774, while the R2 value for the test set is 0.9835. When compared to the second-best performing model, CNN–LSTM–Attention, the BO–Transformer–LSTM model demonstrates an accuracy improvement of 0.74% and 3.53% for the training and test sets, respectively, indicating a significant advantage over the comparative model. Figure 17, Figure 18, Figure 19 and Figure 20 present a comparative analysis of the results from each model on both the training and test sets. The RMSE value for the BO–Transformer–LSTM model is 0.2052 for the training set and 0.2271 for the test set, reflecting a high level of predictive accuracy during the training phase, with minimal deviation between the predicted and actual values. In comparison to the CNN–LSTM–Attention model, the BO–Transformer–LSTM model achieves a reduction in error of 18.44% and 38.22% for the training and test sets, respectively.
In conclusion, the results from both the training and test sets substantiate the superior predictive capability and stability of the BO–Transformer–LSTM model.

5. Conclusions

(1)
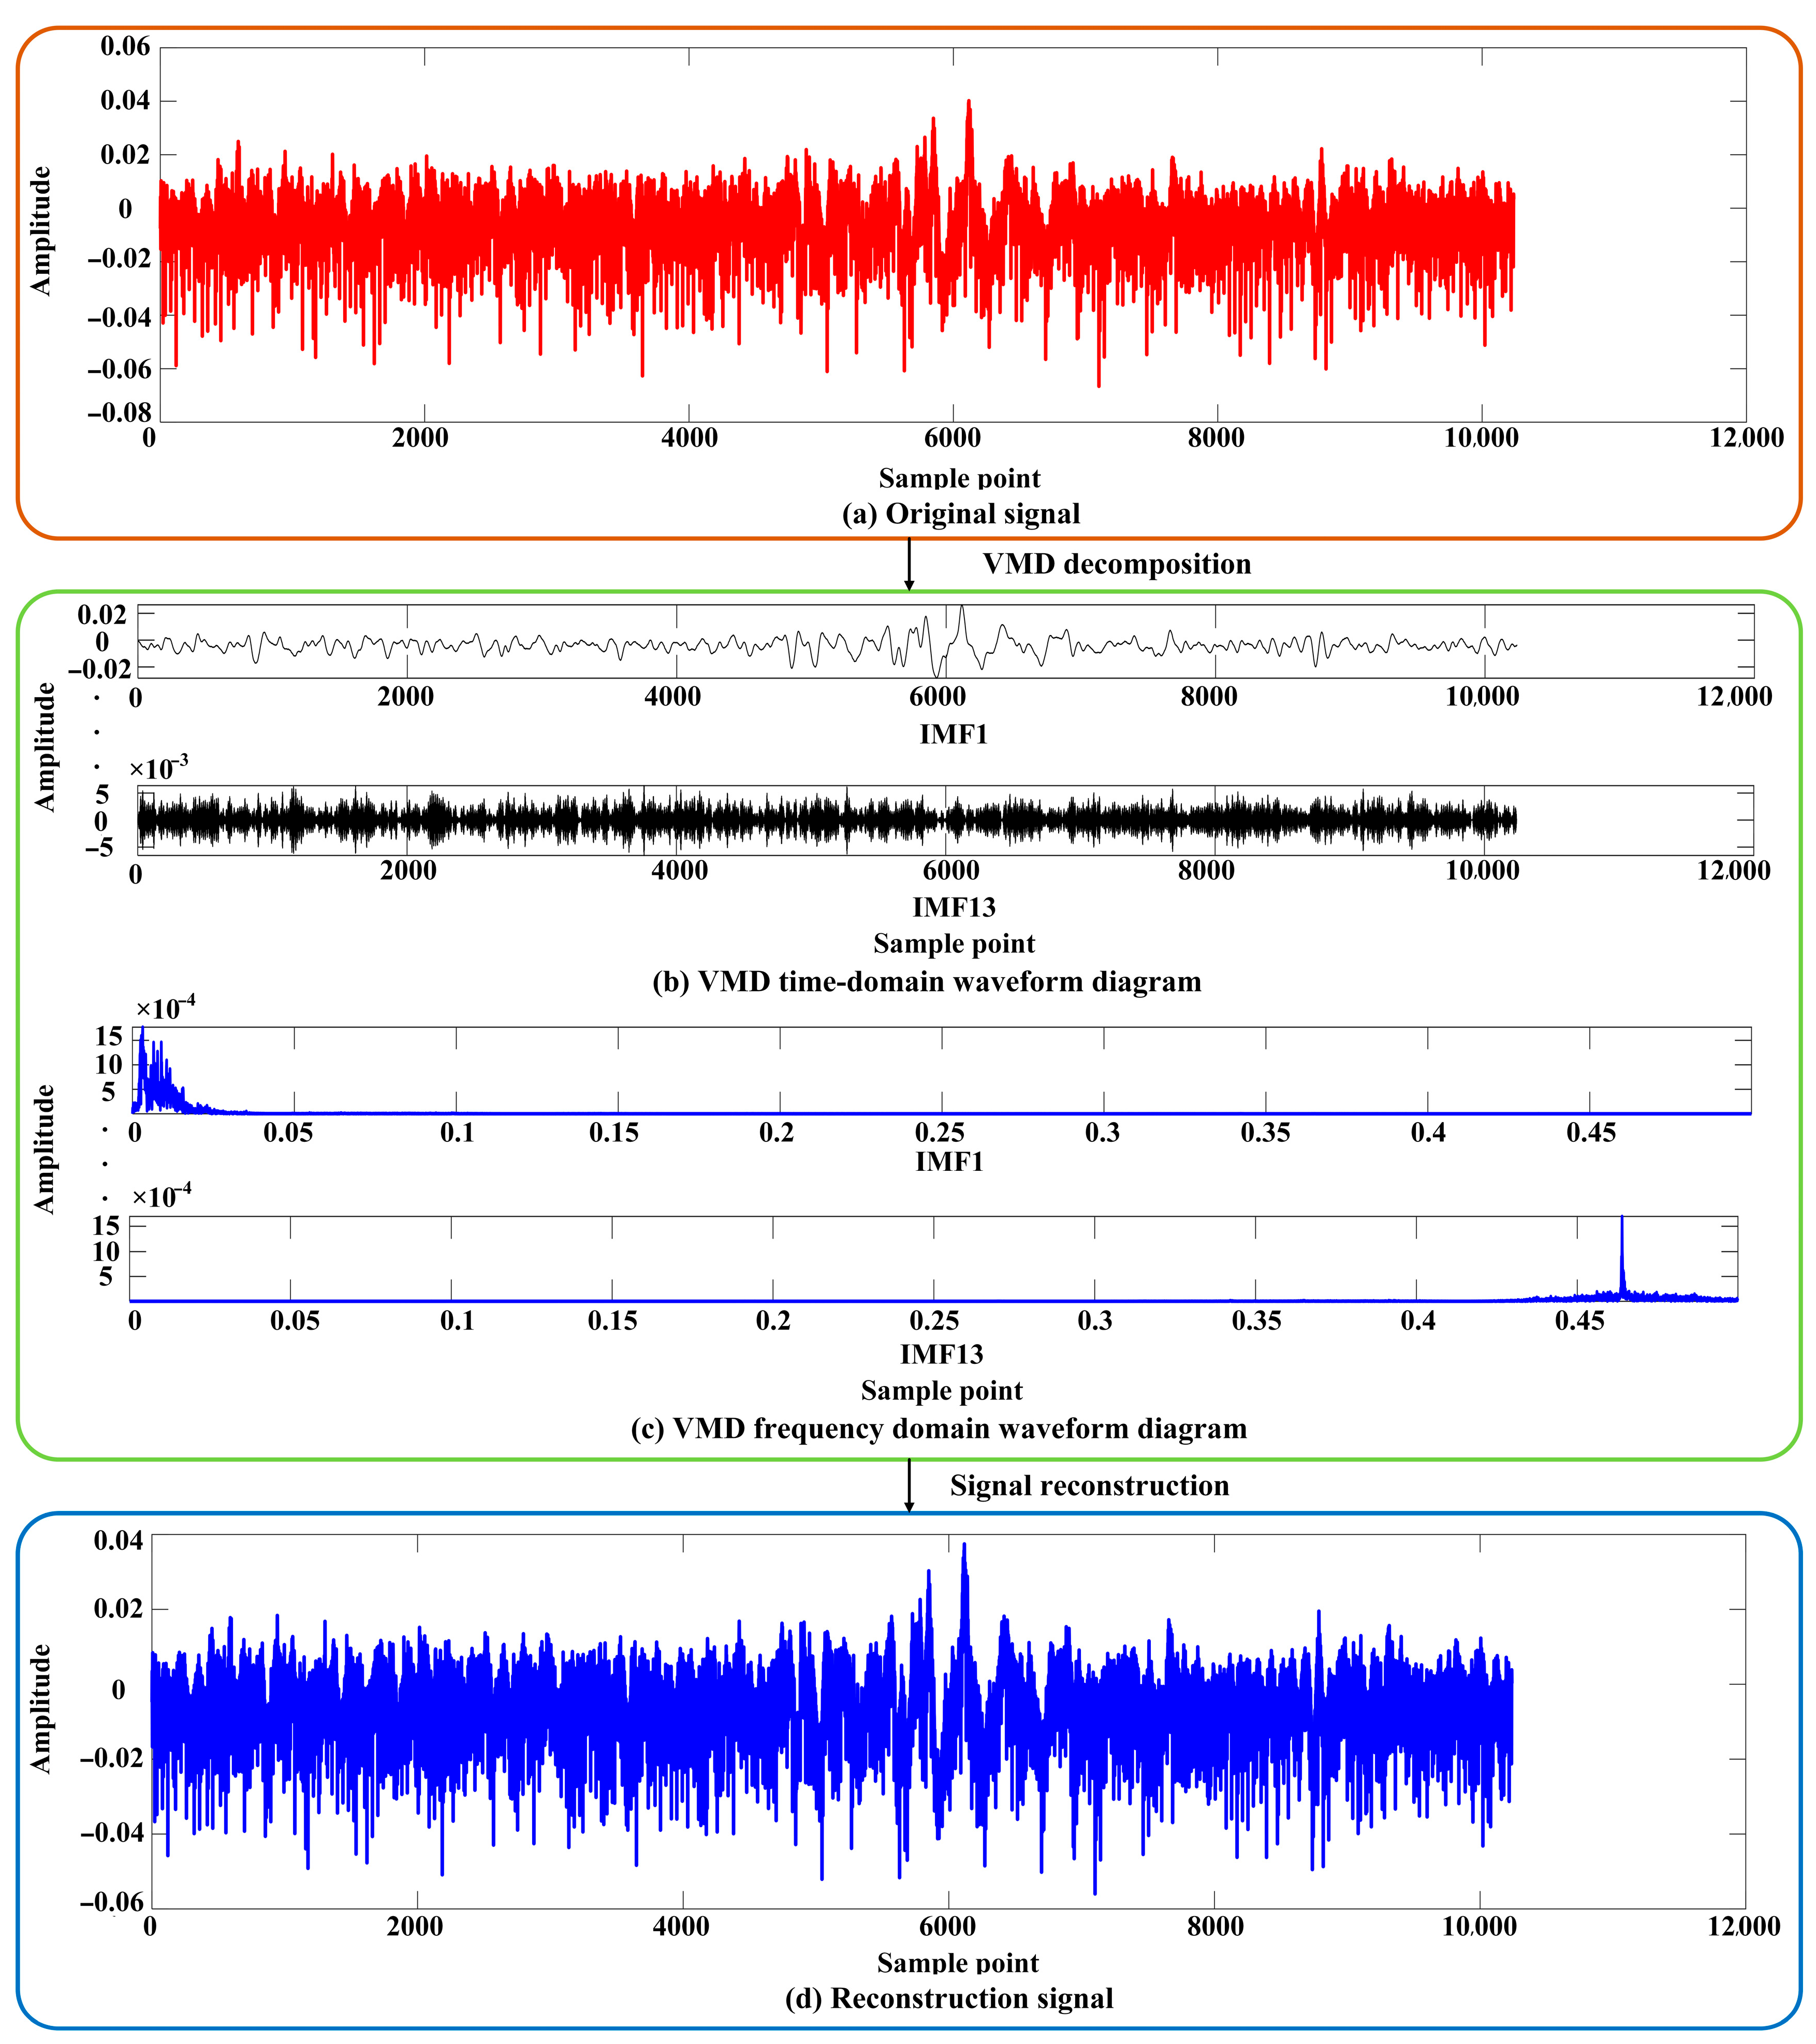
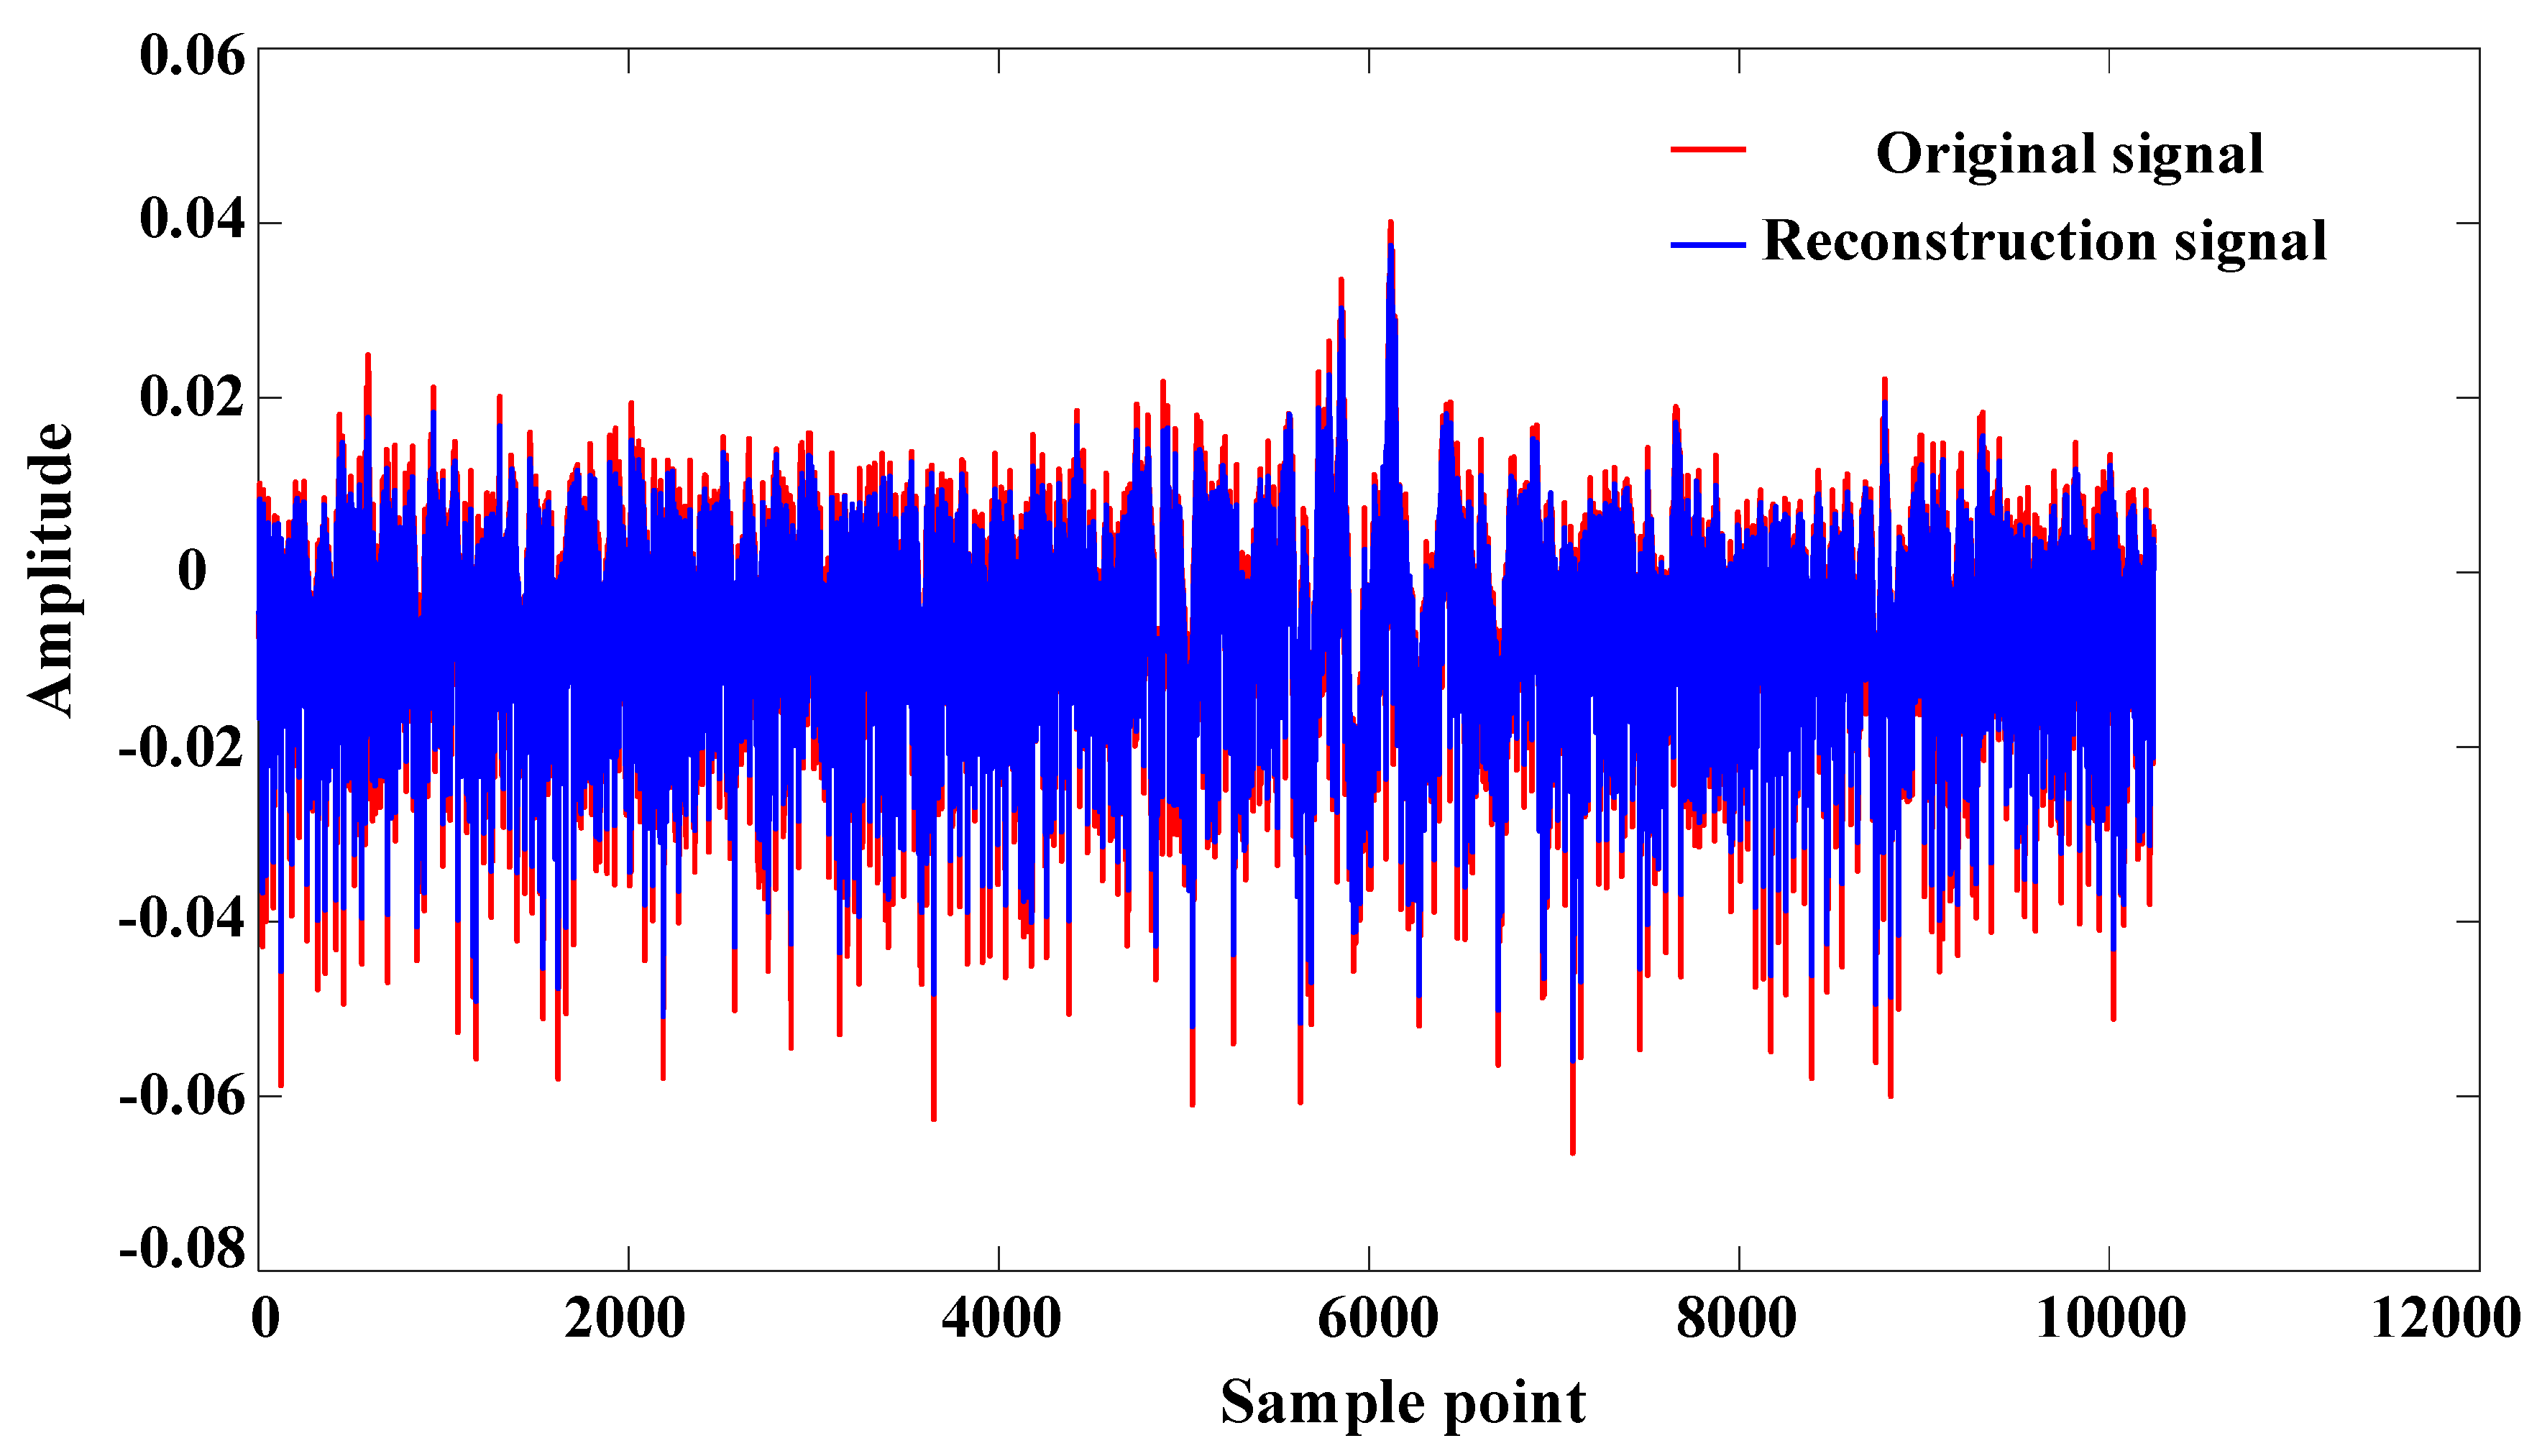
The DBO-VMD-WPT algorithm has been employed for the purpose of denoising acoustic signals. Analysis reveals that the time domain waveform of the reconstructed signal exhibits significant alterations, characterized by a smoother and more continuous fluctuation pattern. The previously observed violent oscillations and discrete spikes have been markedly diminished, resulting in a clearer and more regular signal contour.
(2)
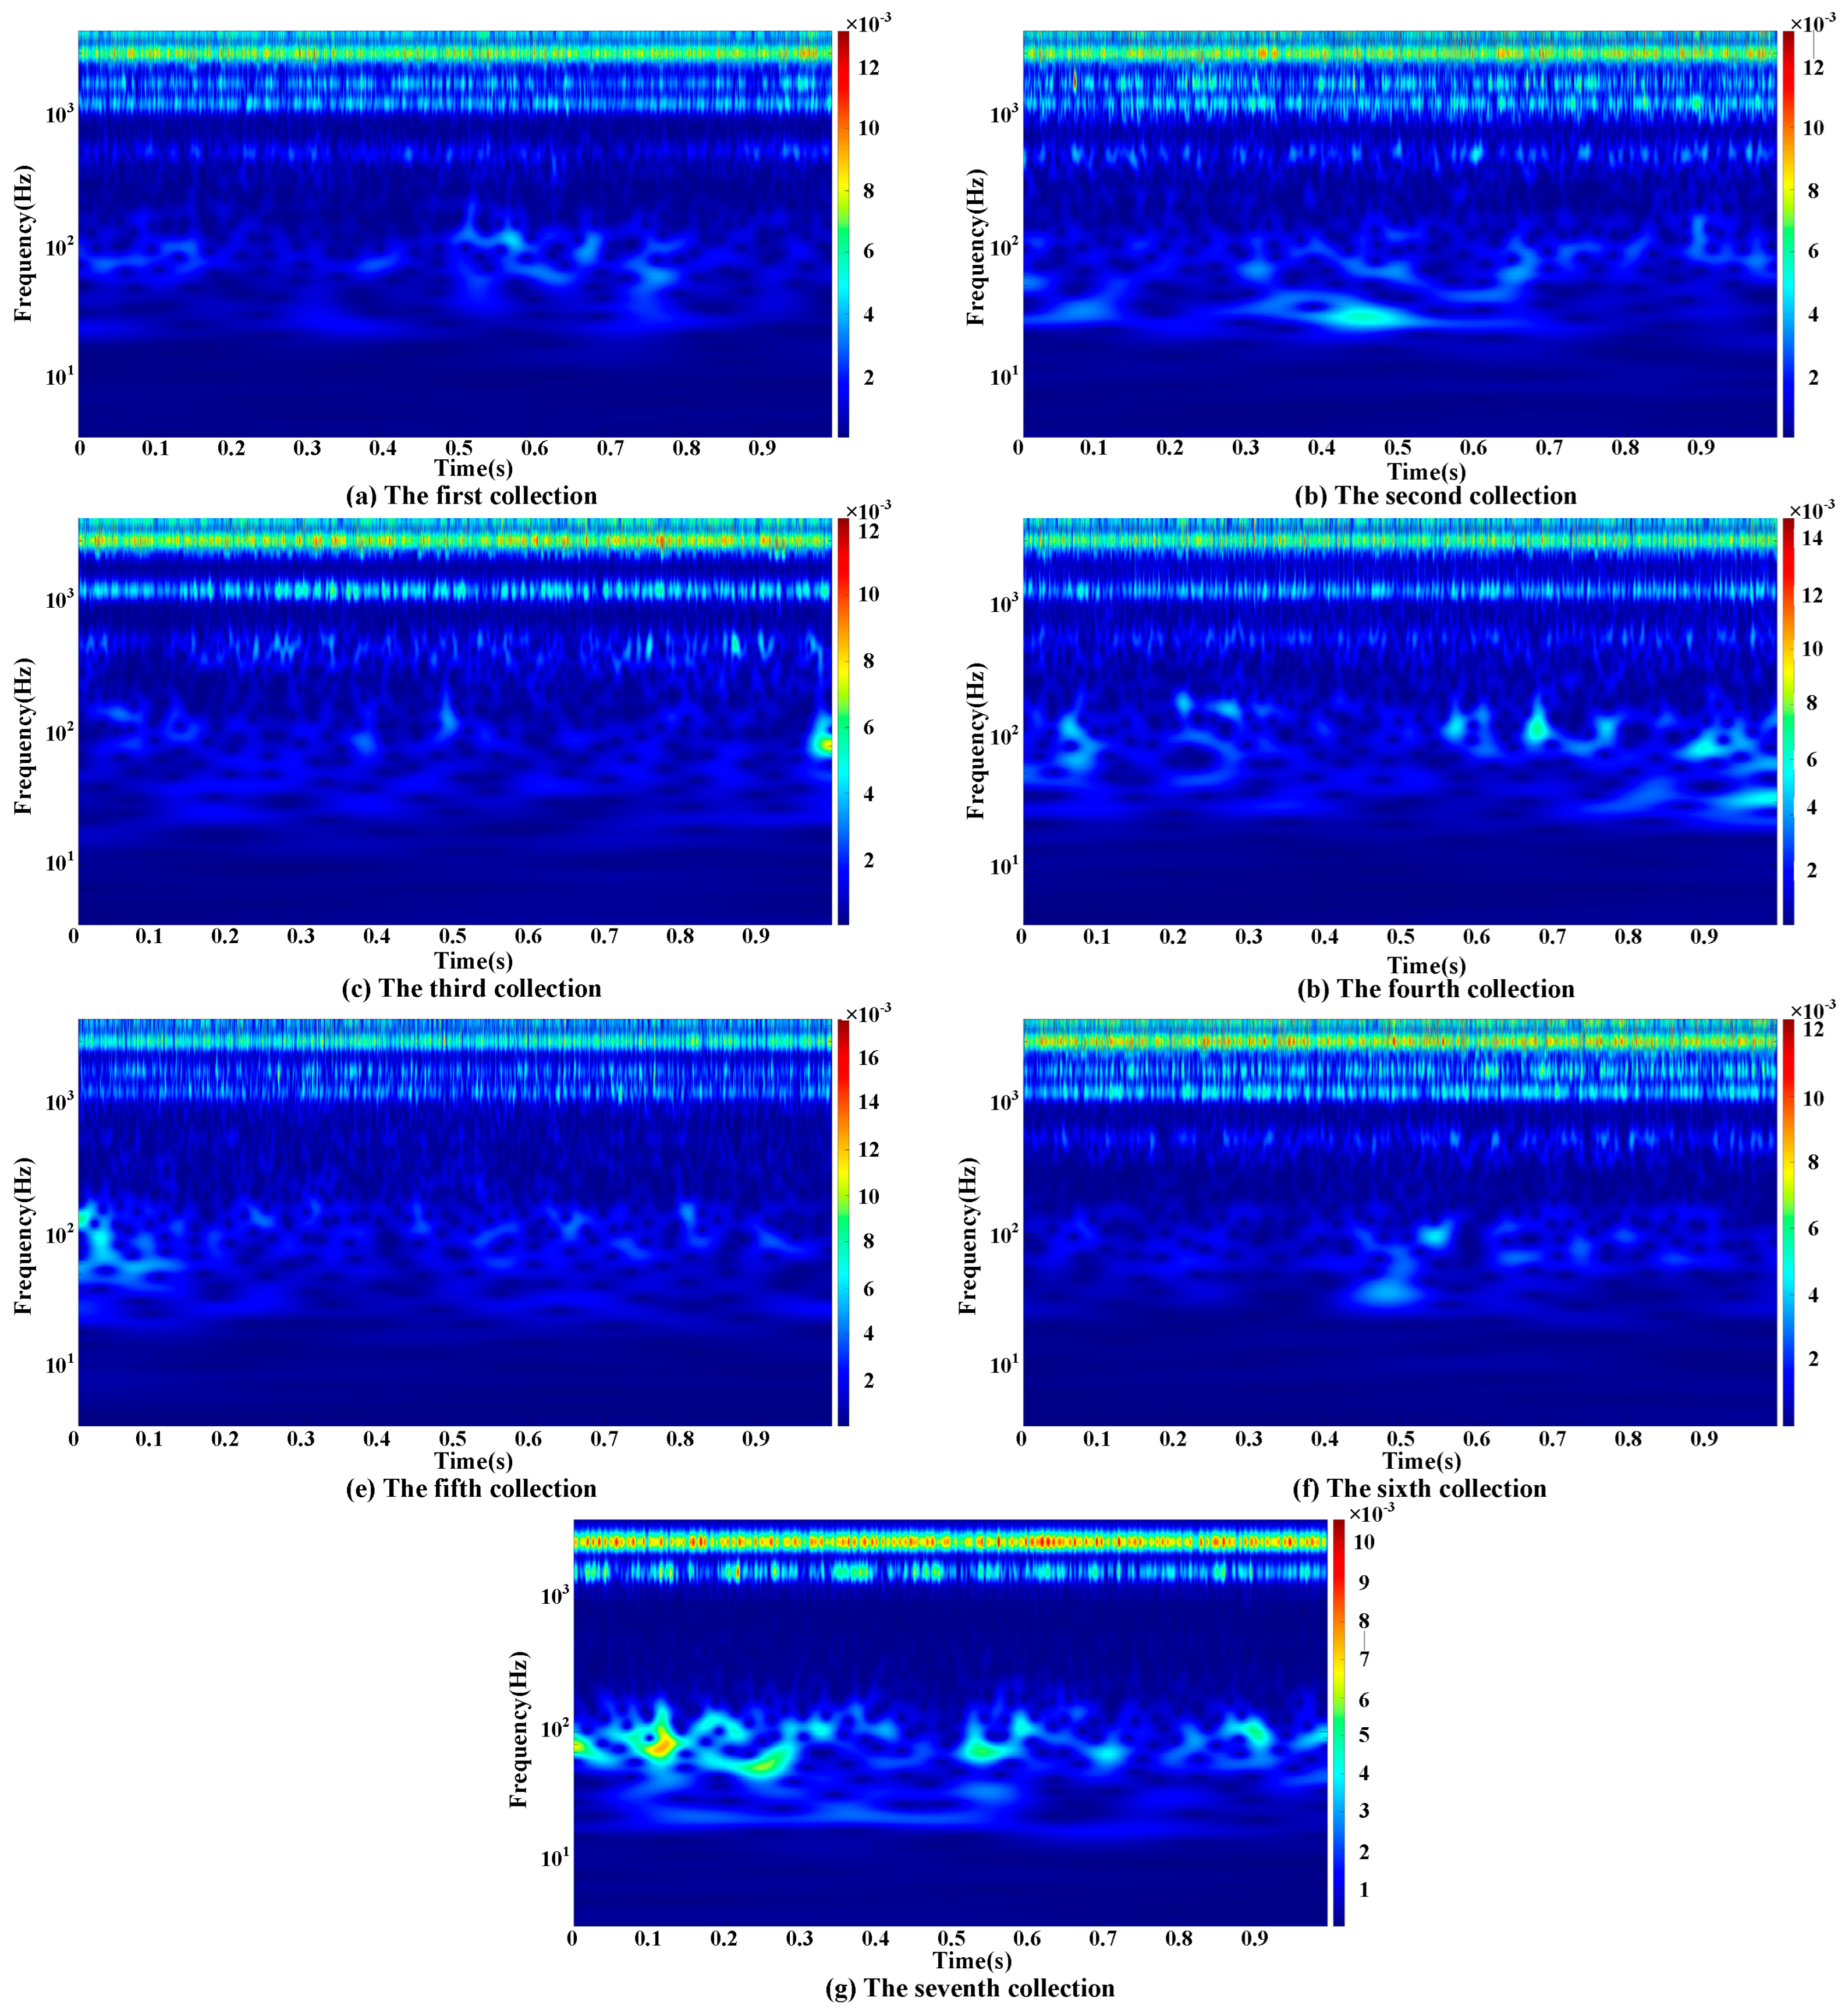
Continuous wavelet transform (CWT) time–frequency analysis indicates that the high-frequency energy of the denoised signal demonstrates a trend of evolution from attenuation to enhancement. This observation elucidates the three distinct stages of wear in the micro-texture friction pair: during the initial stage, the accumulation of material around the micro-pits leads to pronounced collisions and scraping of the asperities; following the running-in phase, the lubrication effect provided by the micro-textured chip storage enhances the contact state, thereby entering a stable wear period. In the later stages of wear, the ineffective storage of hard wear debris results in cutting and ploughing actions on the surface of the micro-texture, ultimately leading to the degradation of the micro-texture morphology and a reduction in chip lubrication capacity.
(3)
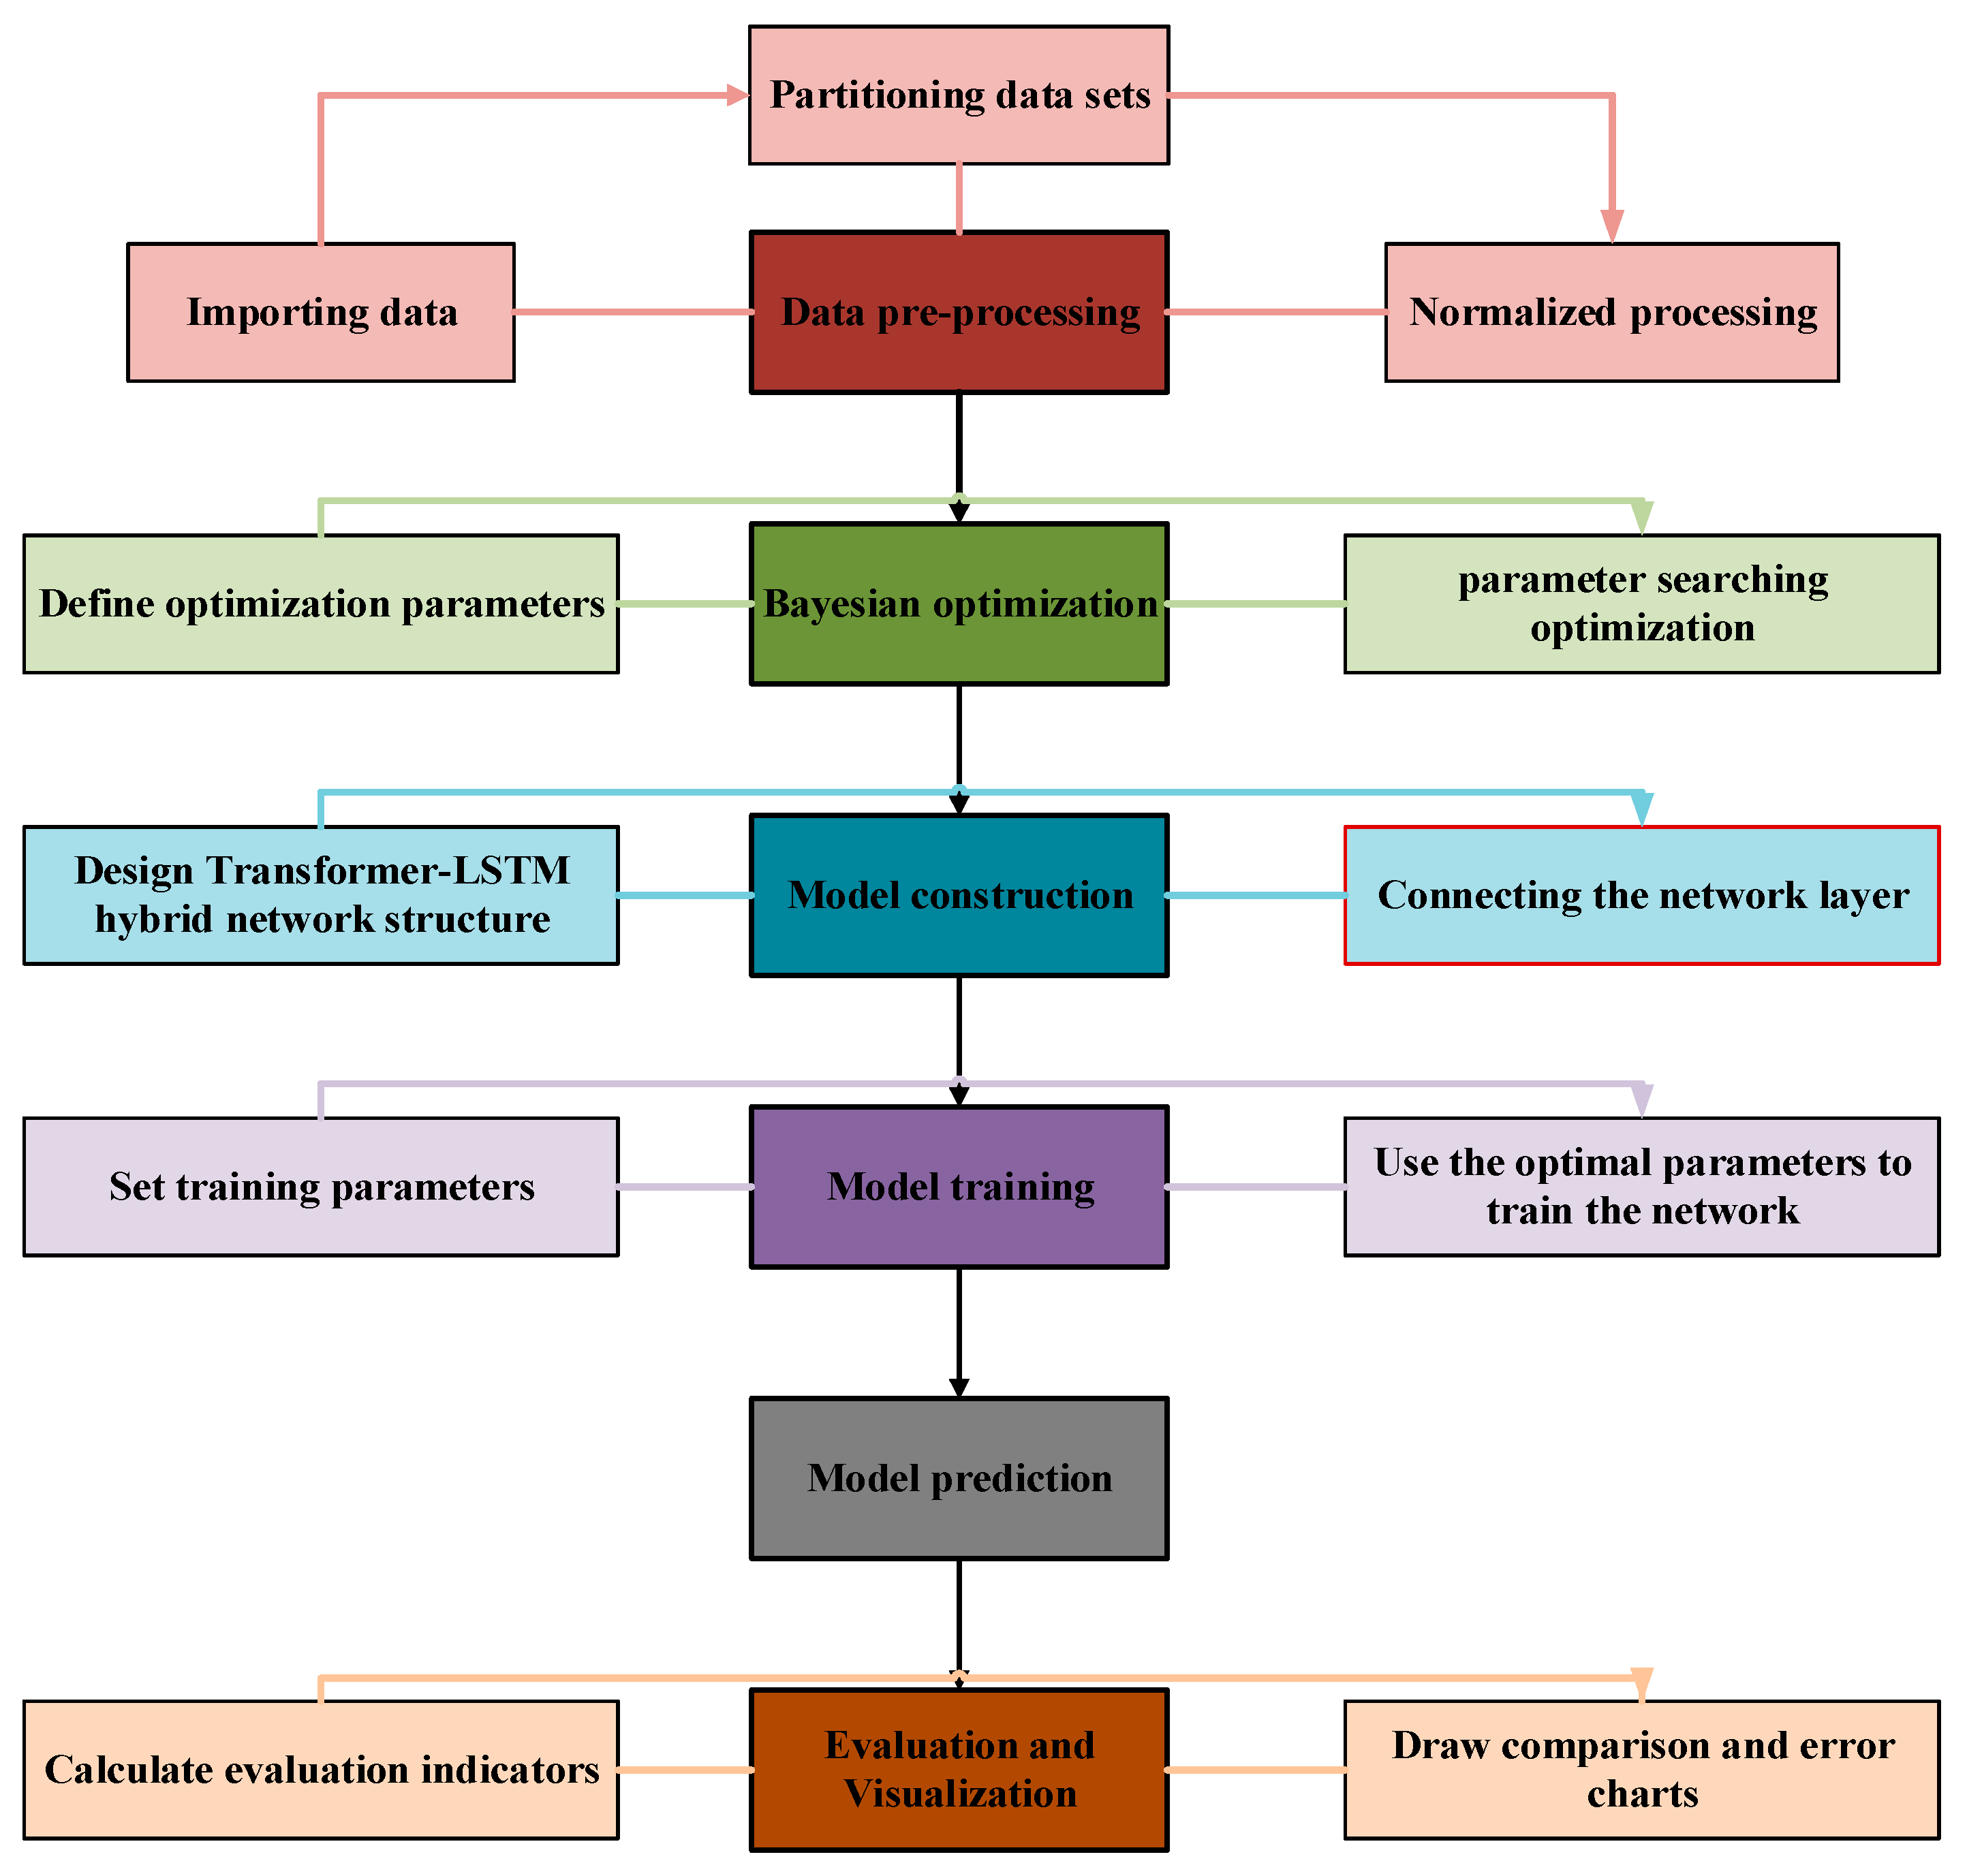
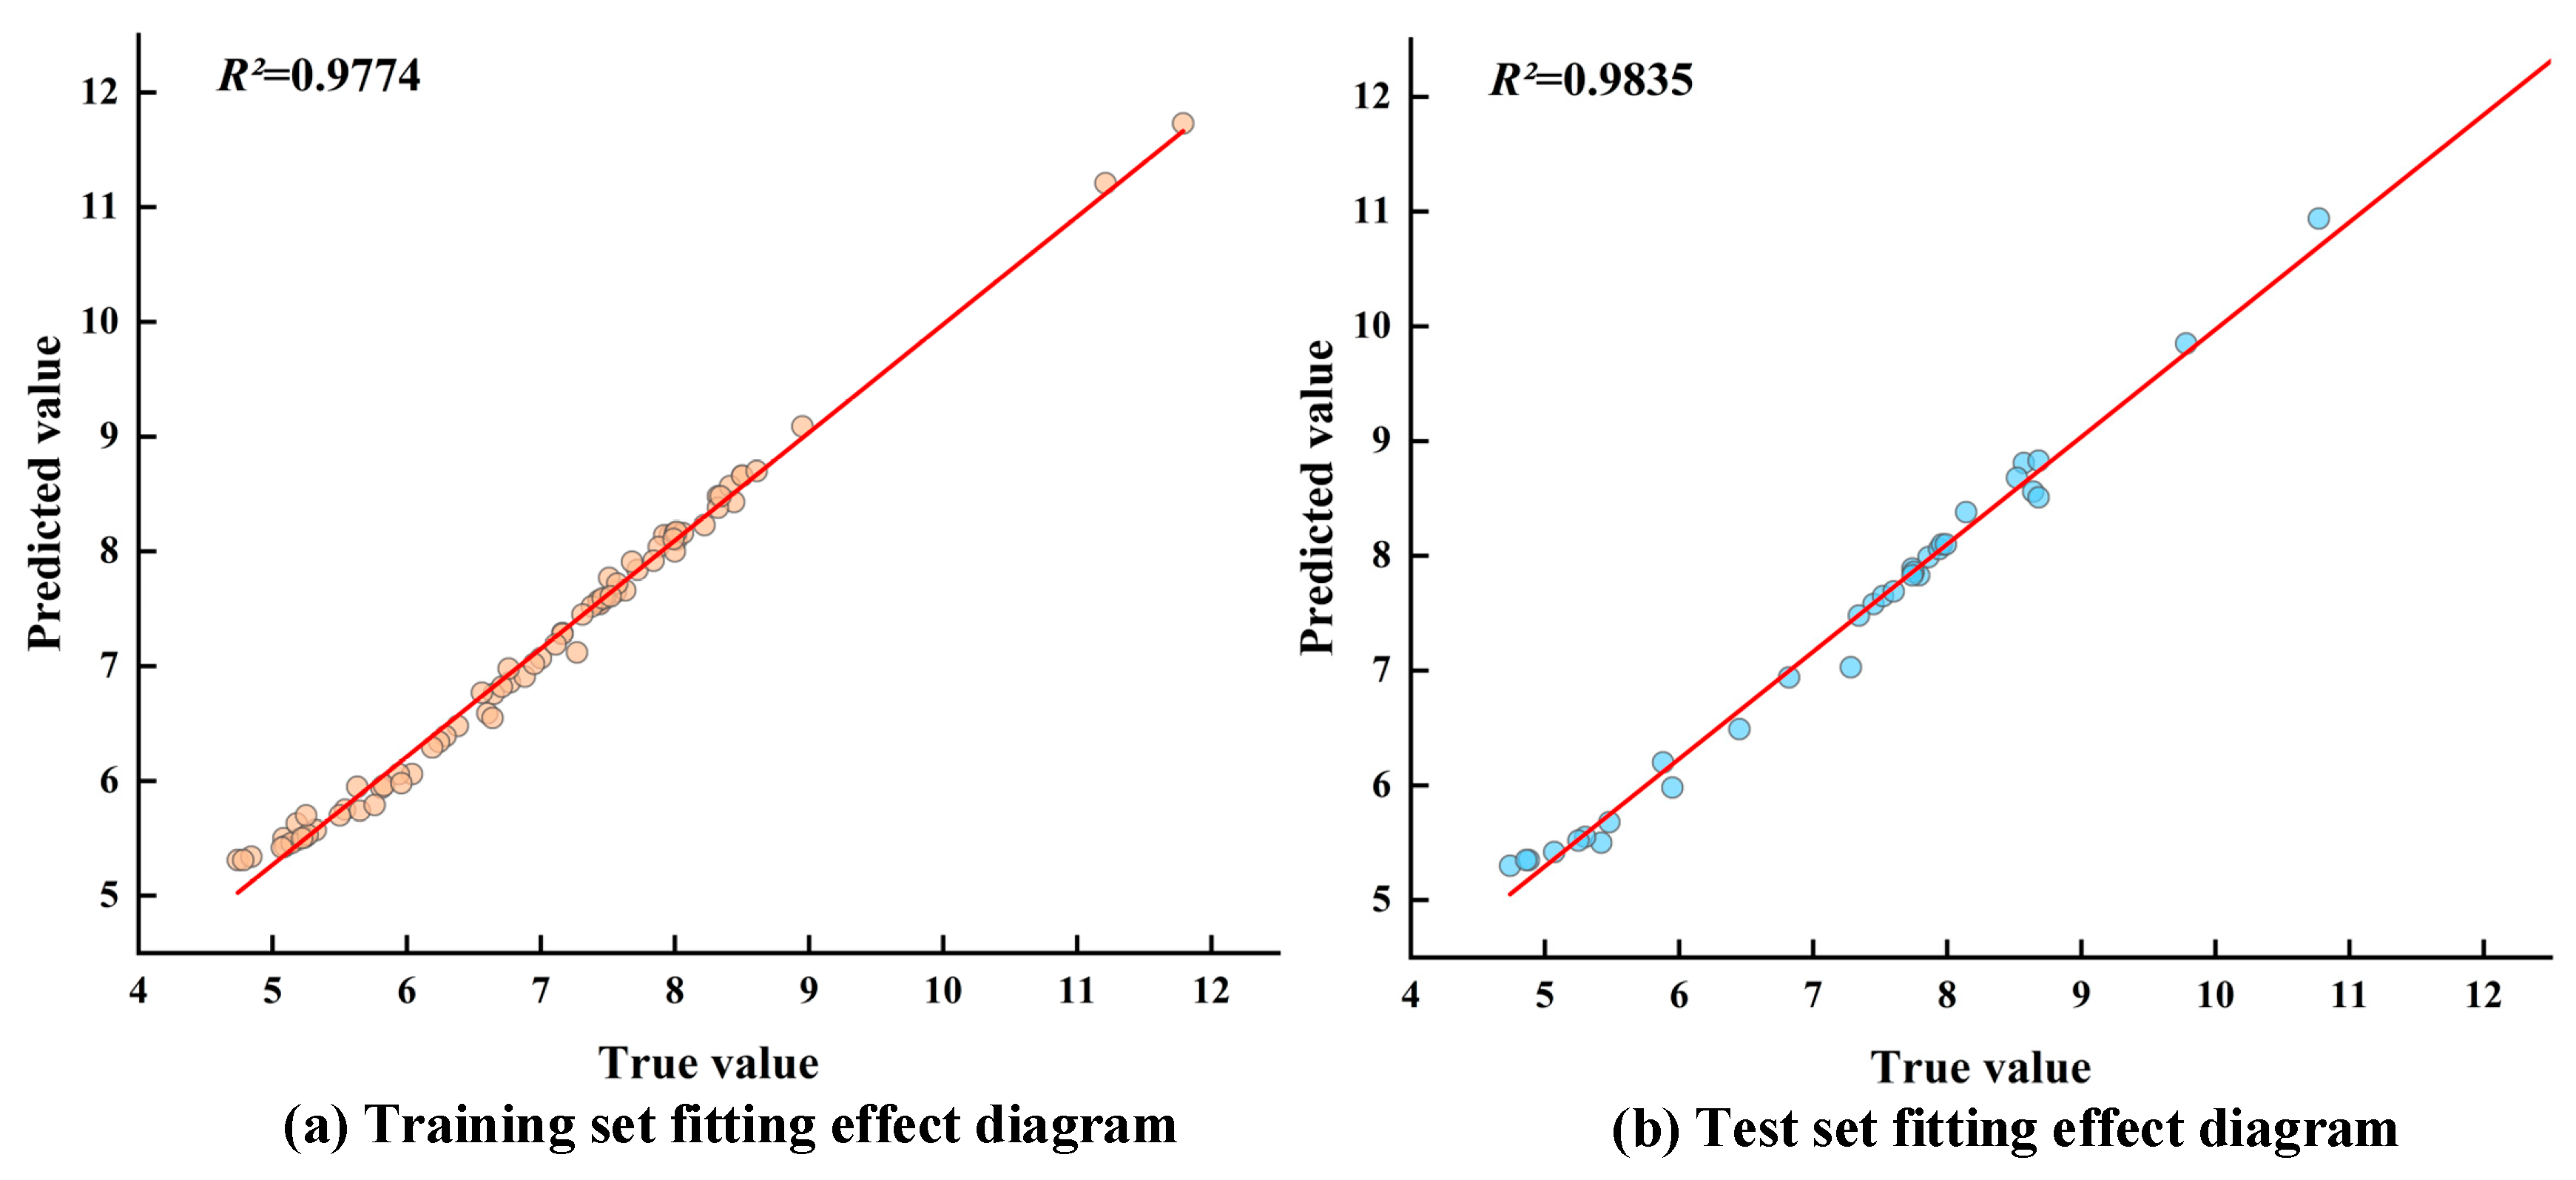
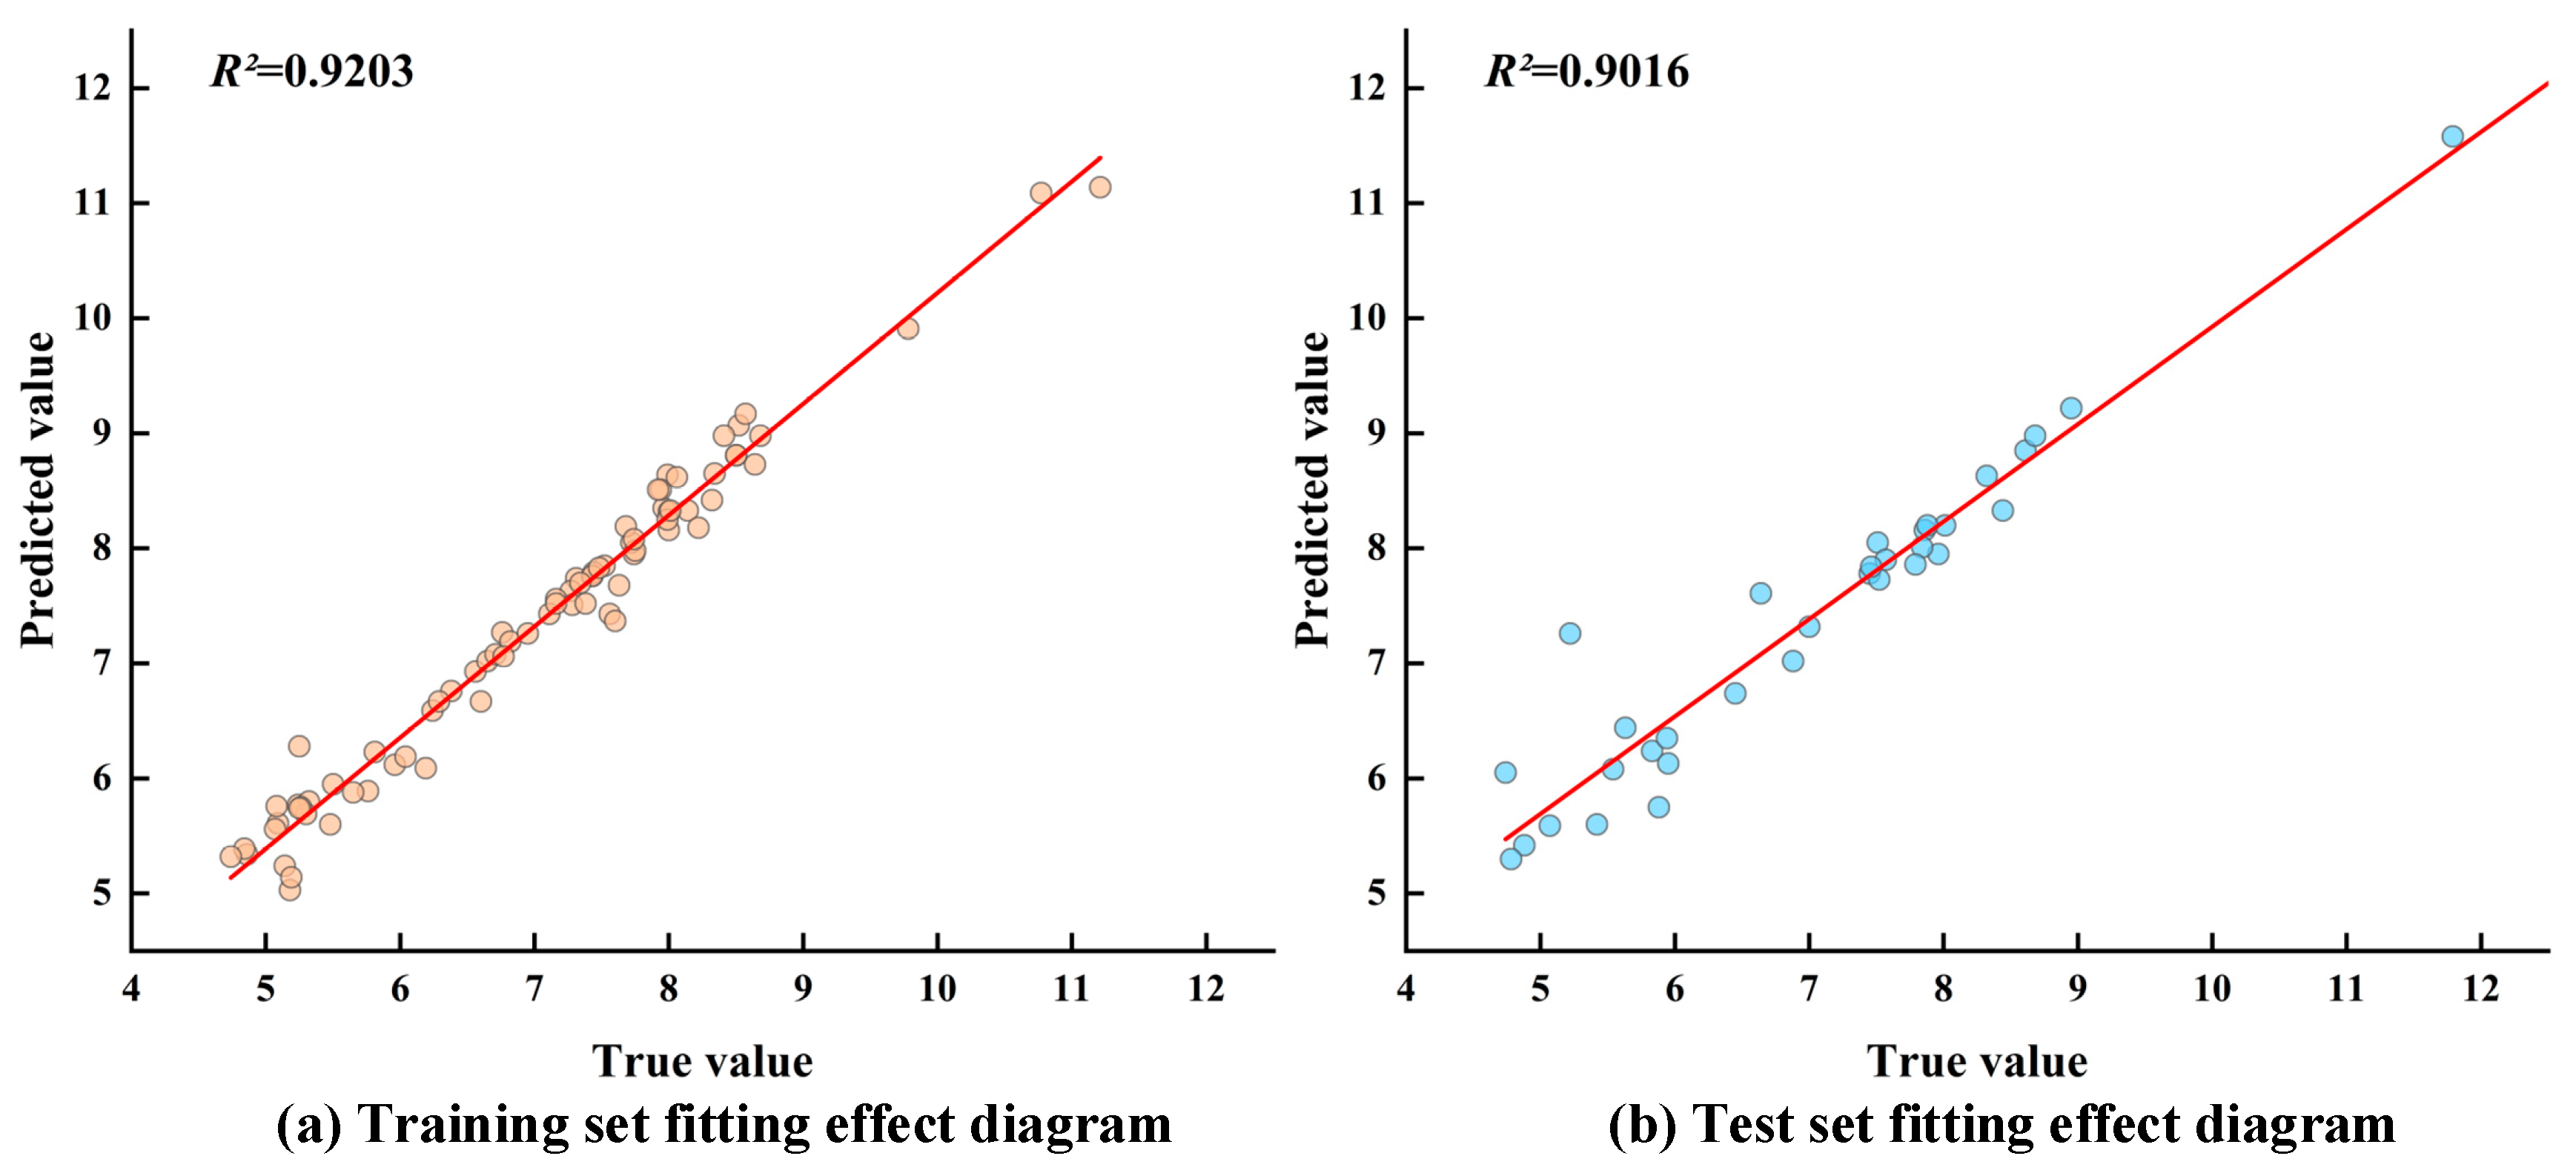
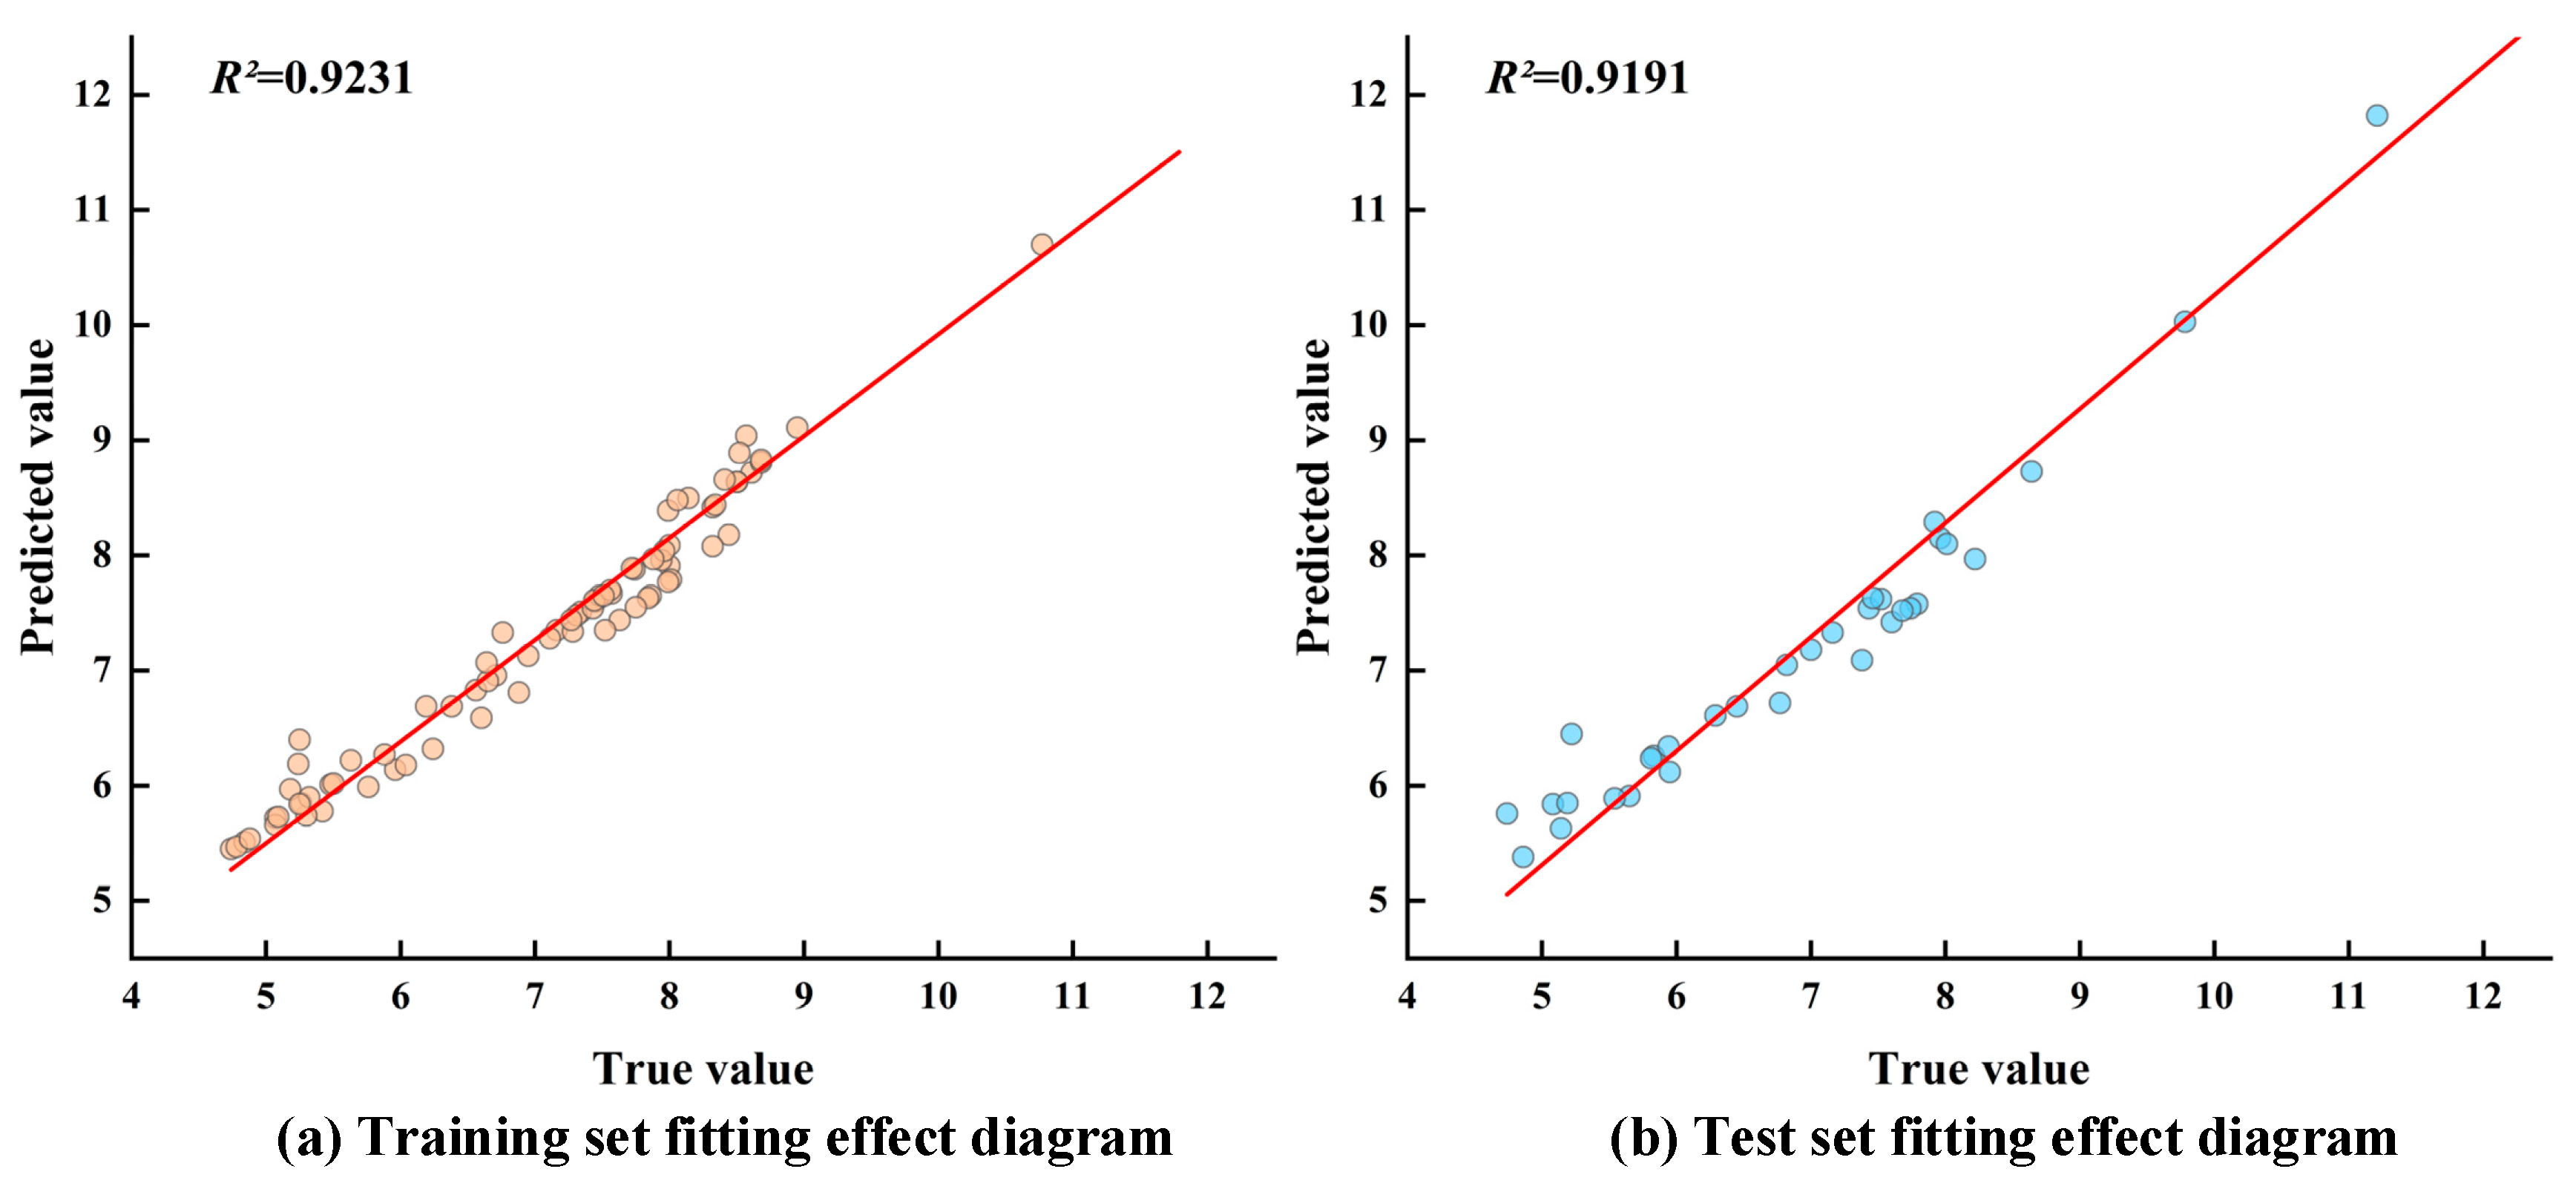
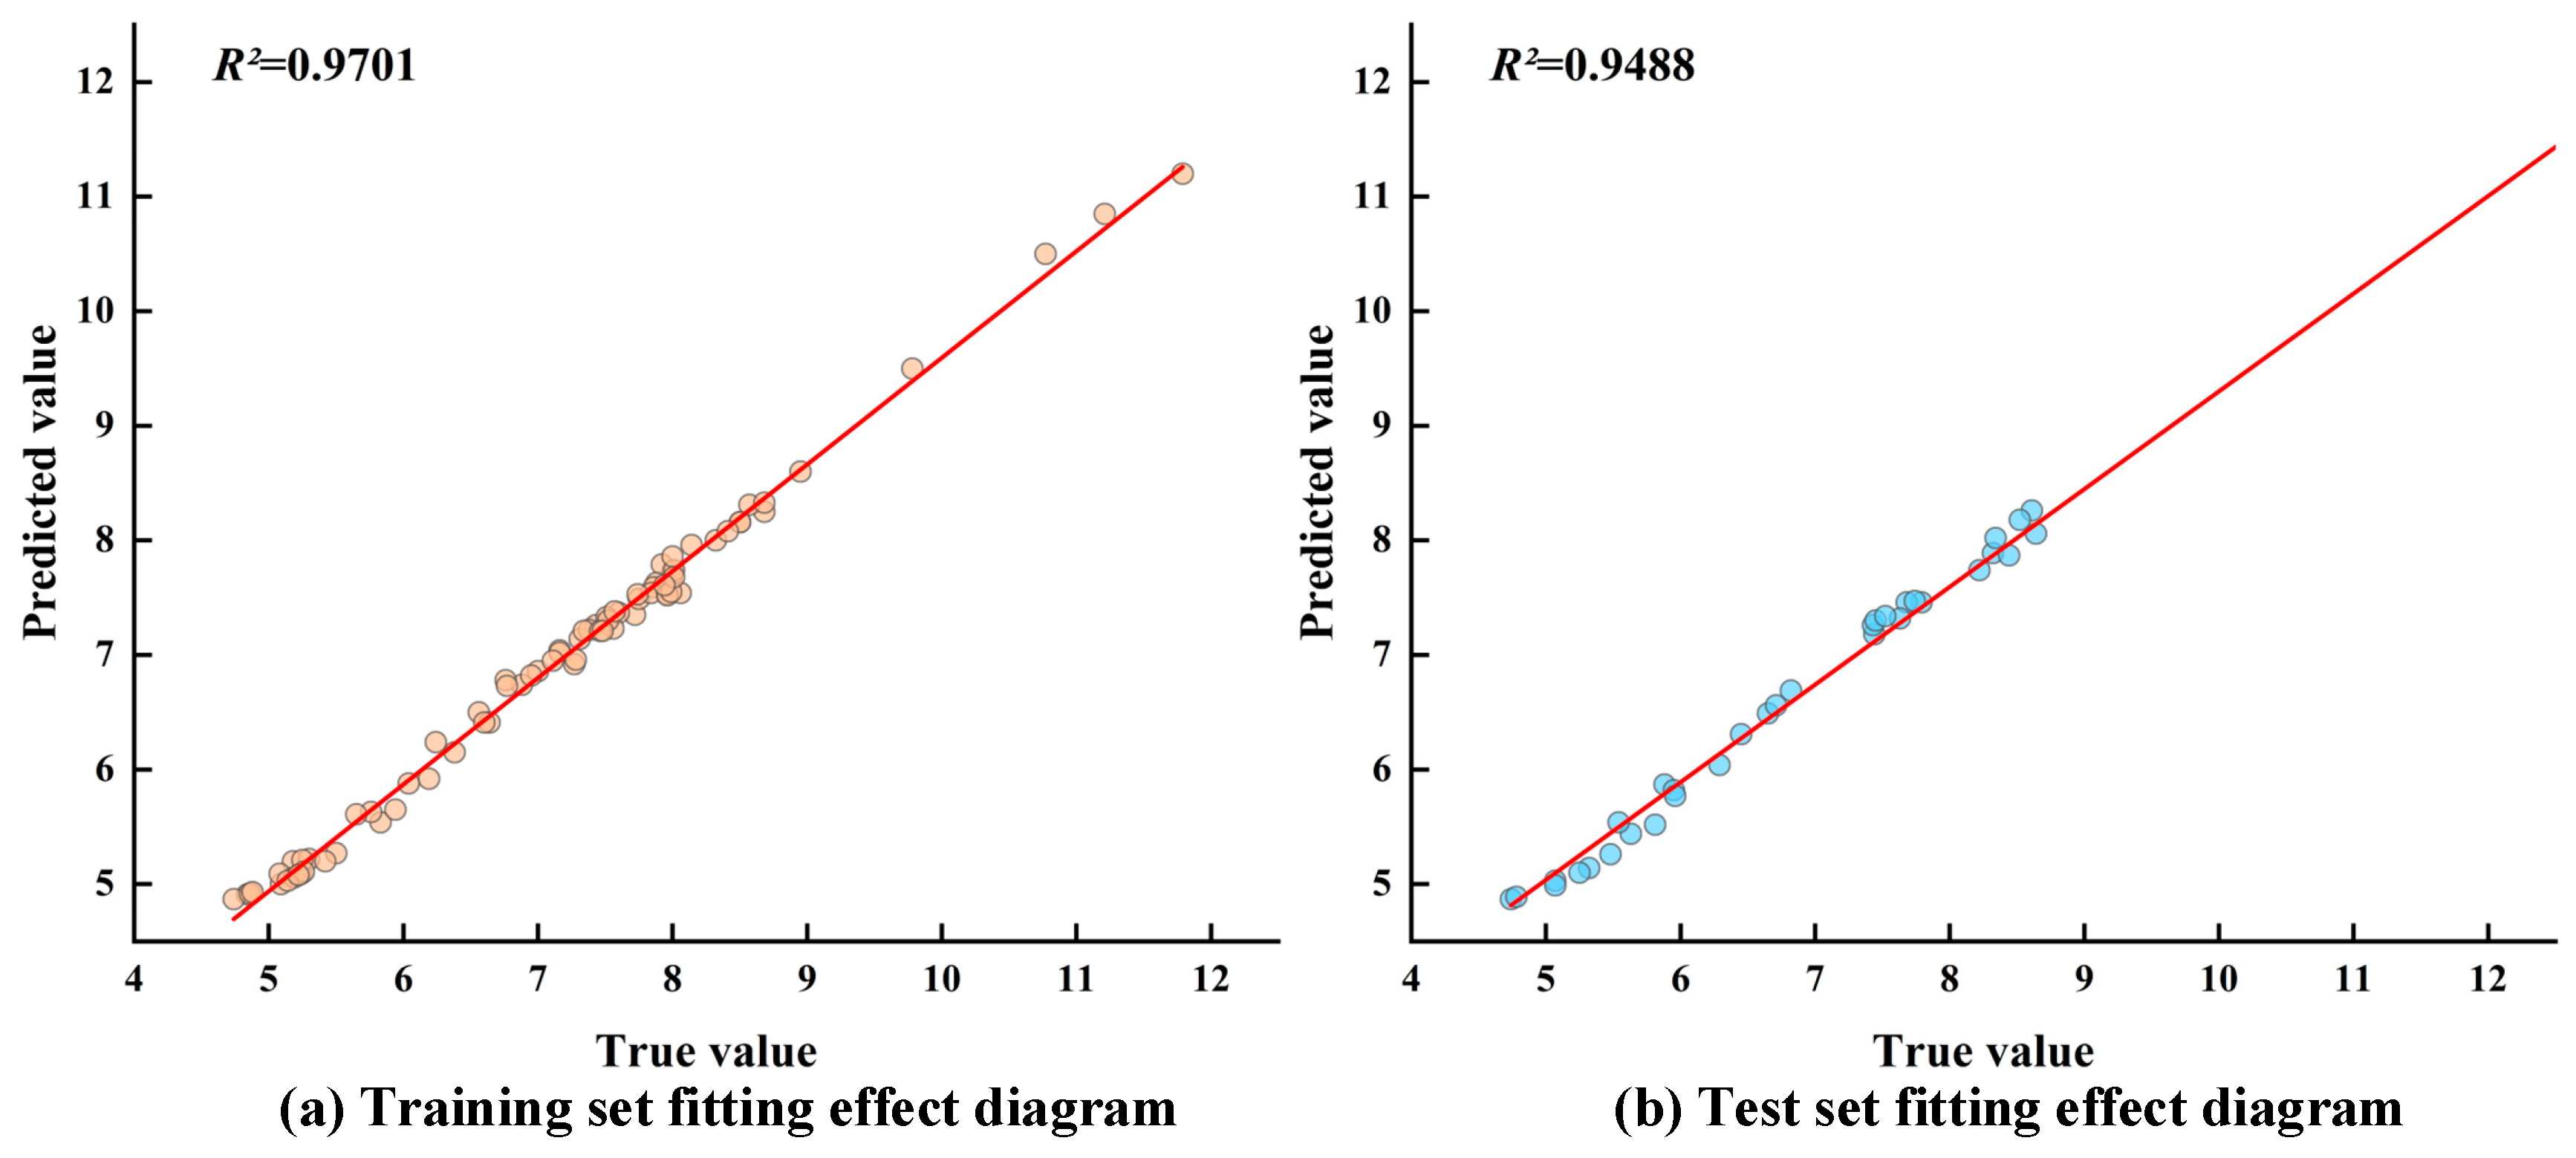
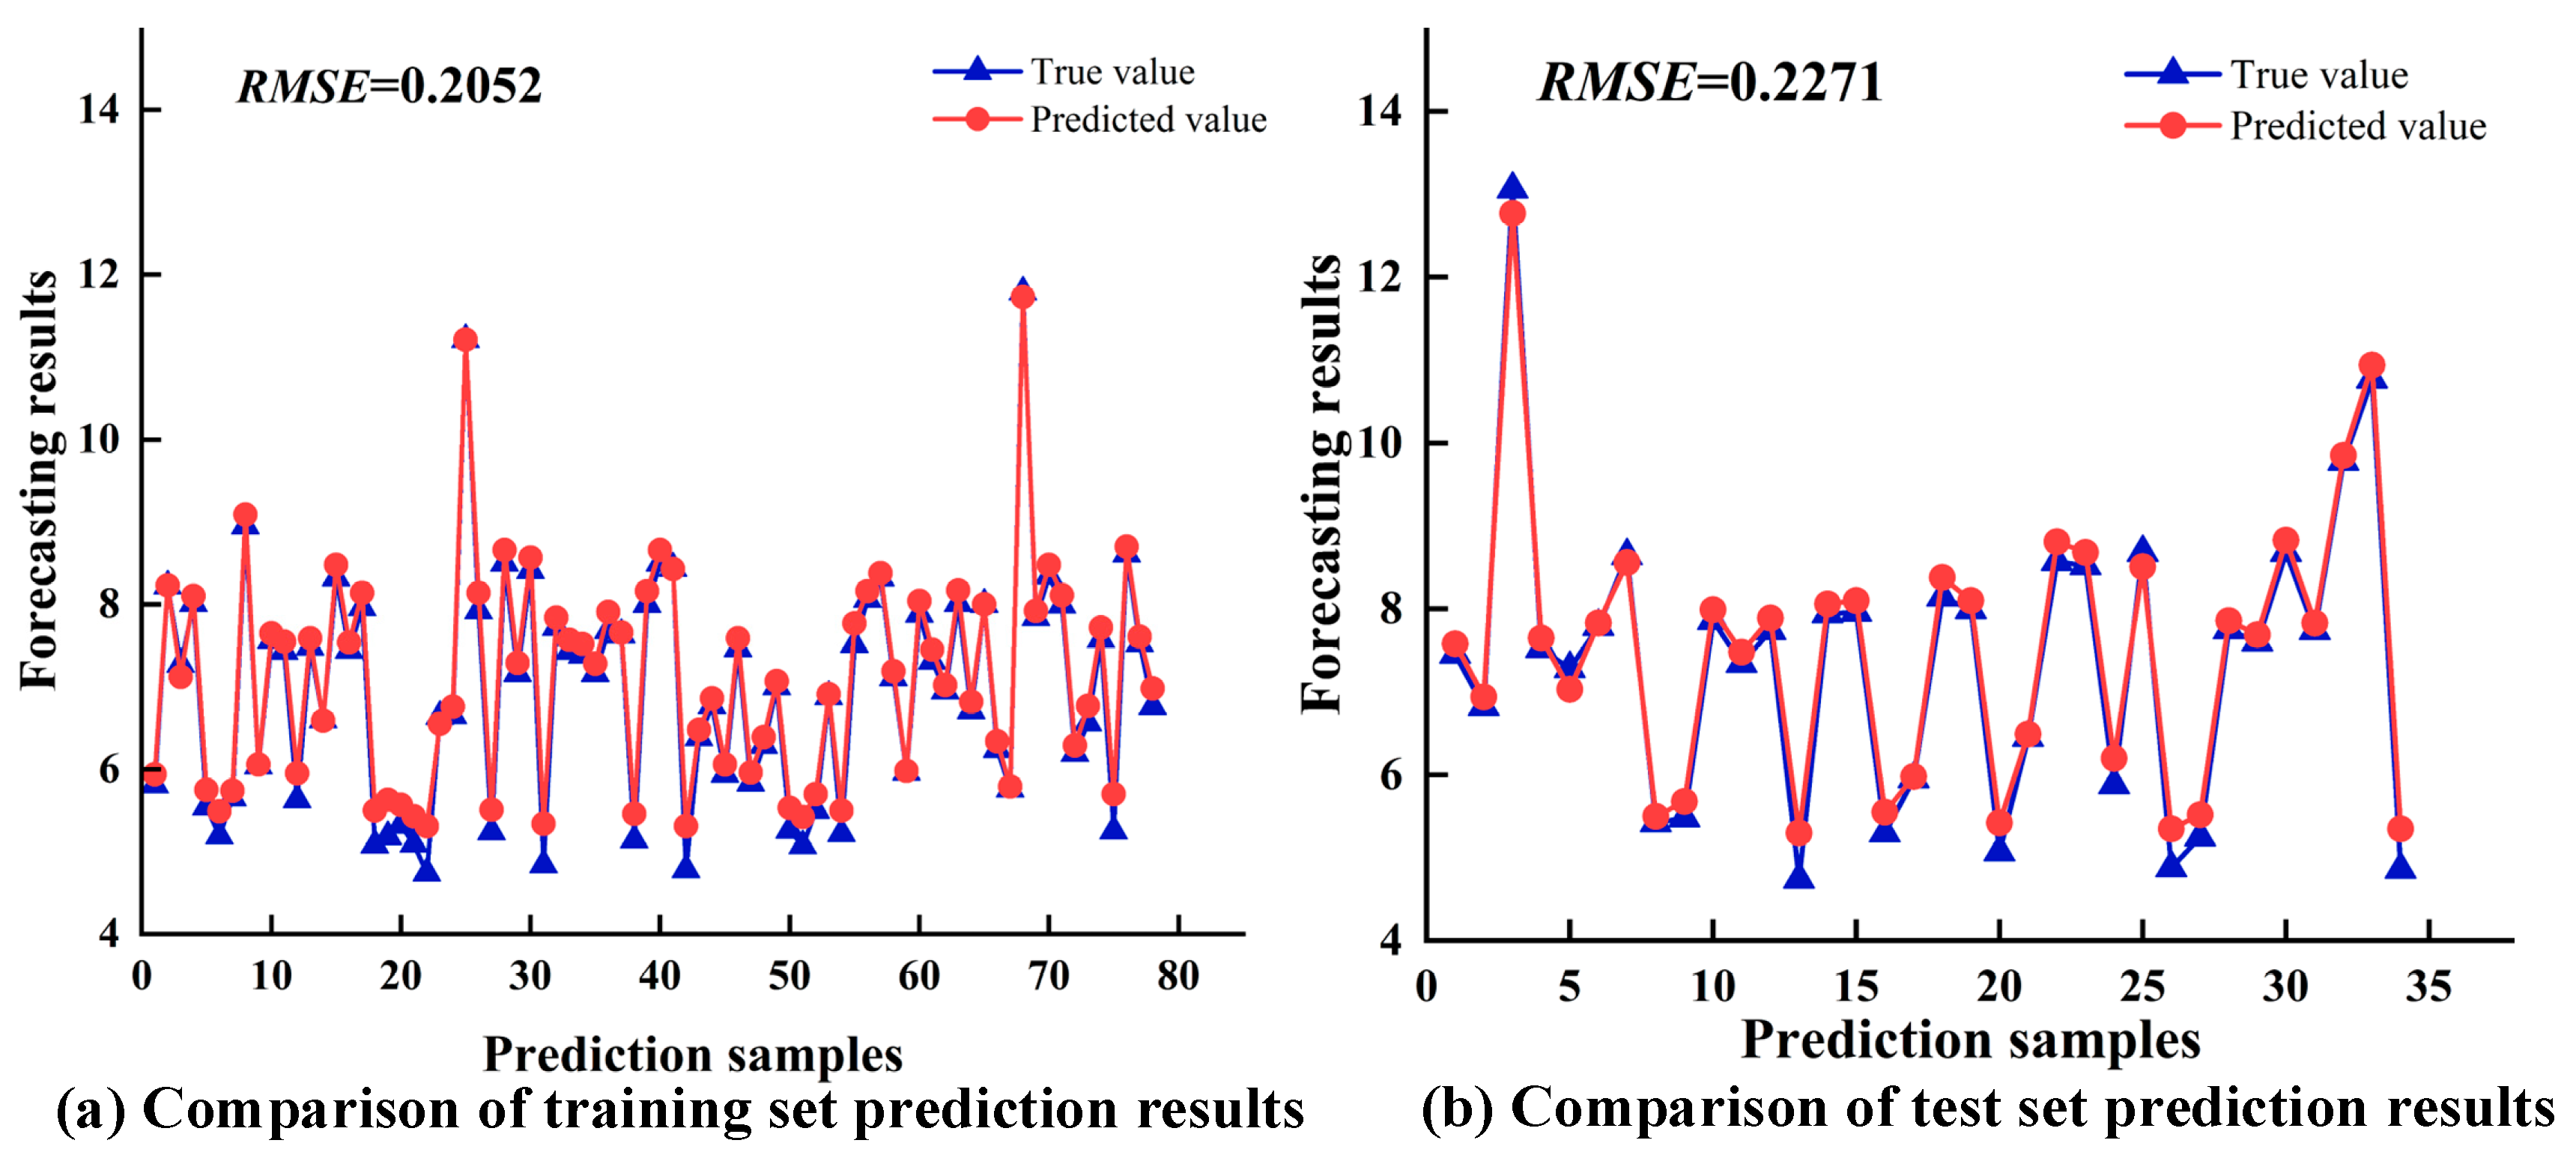
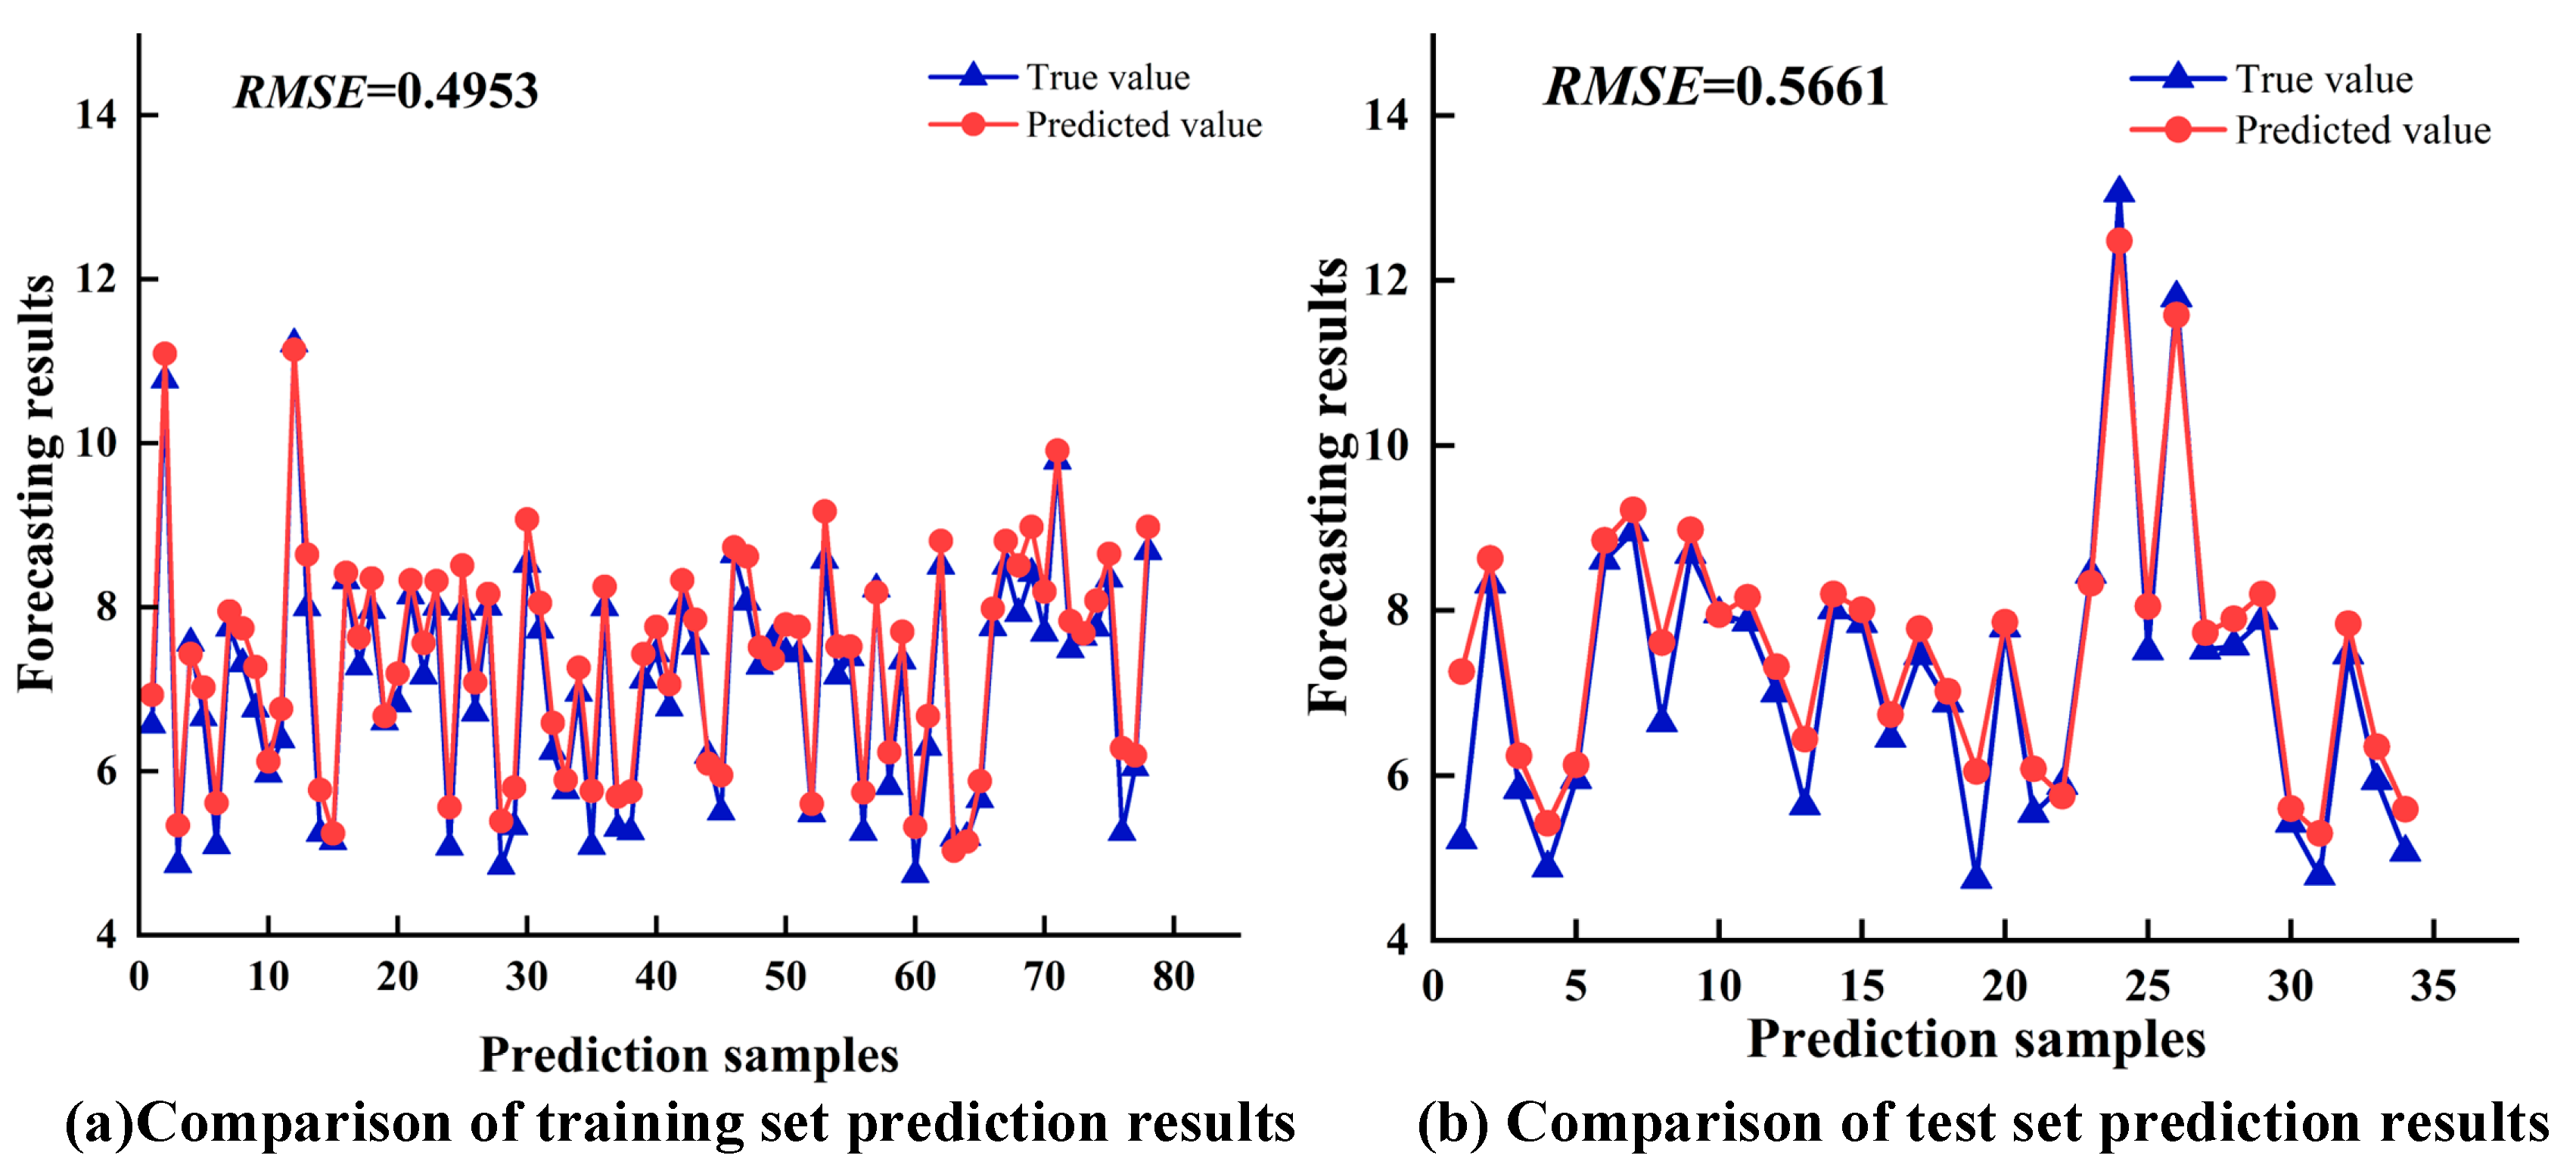
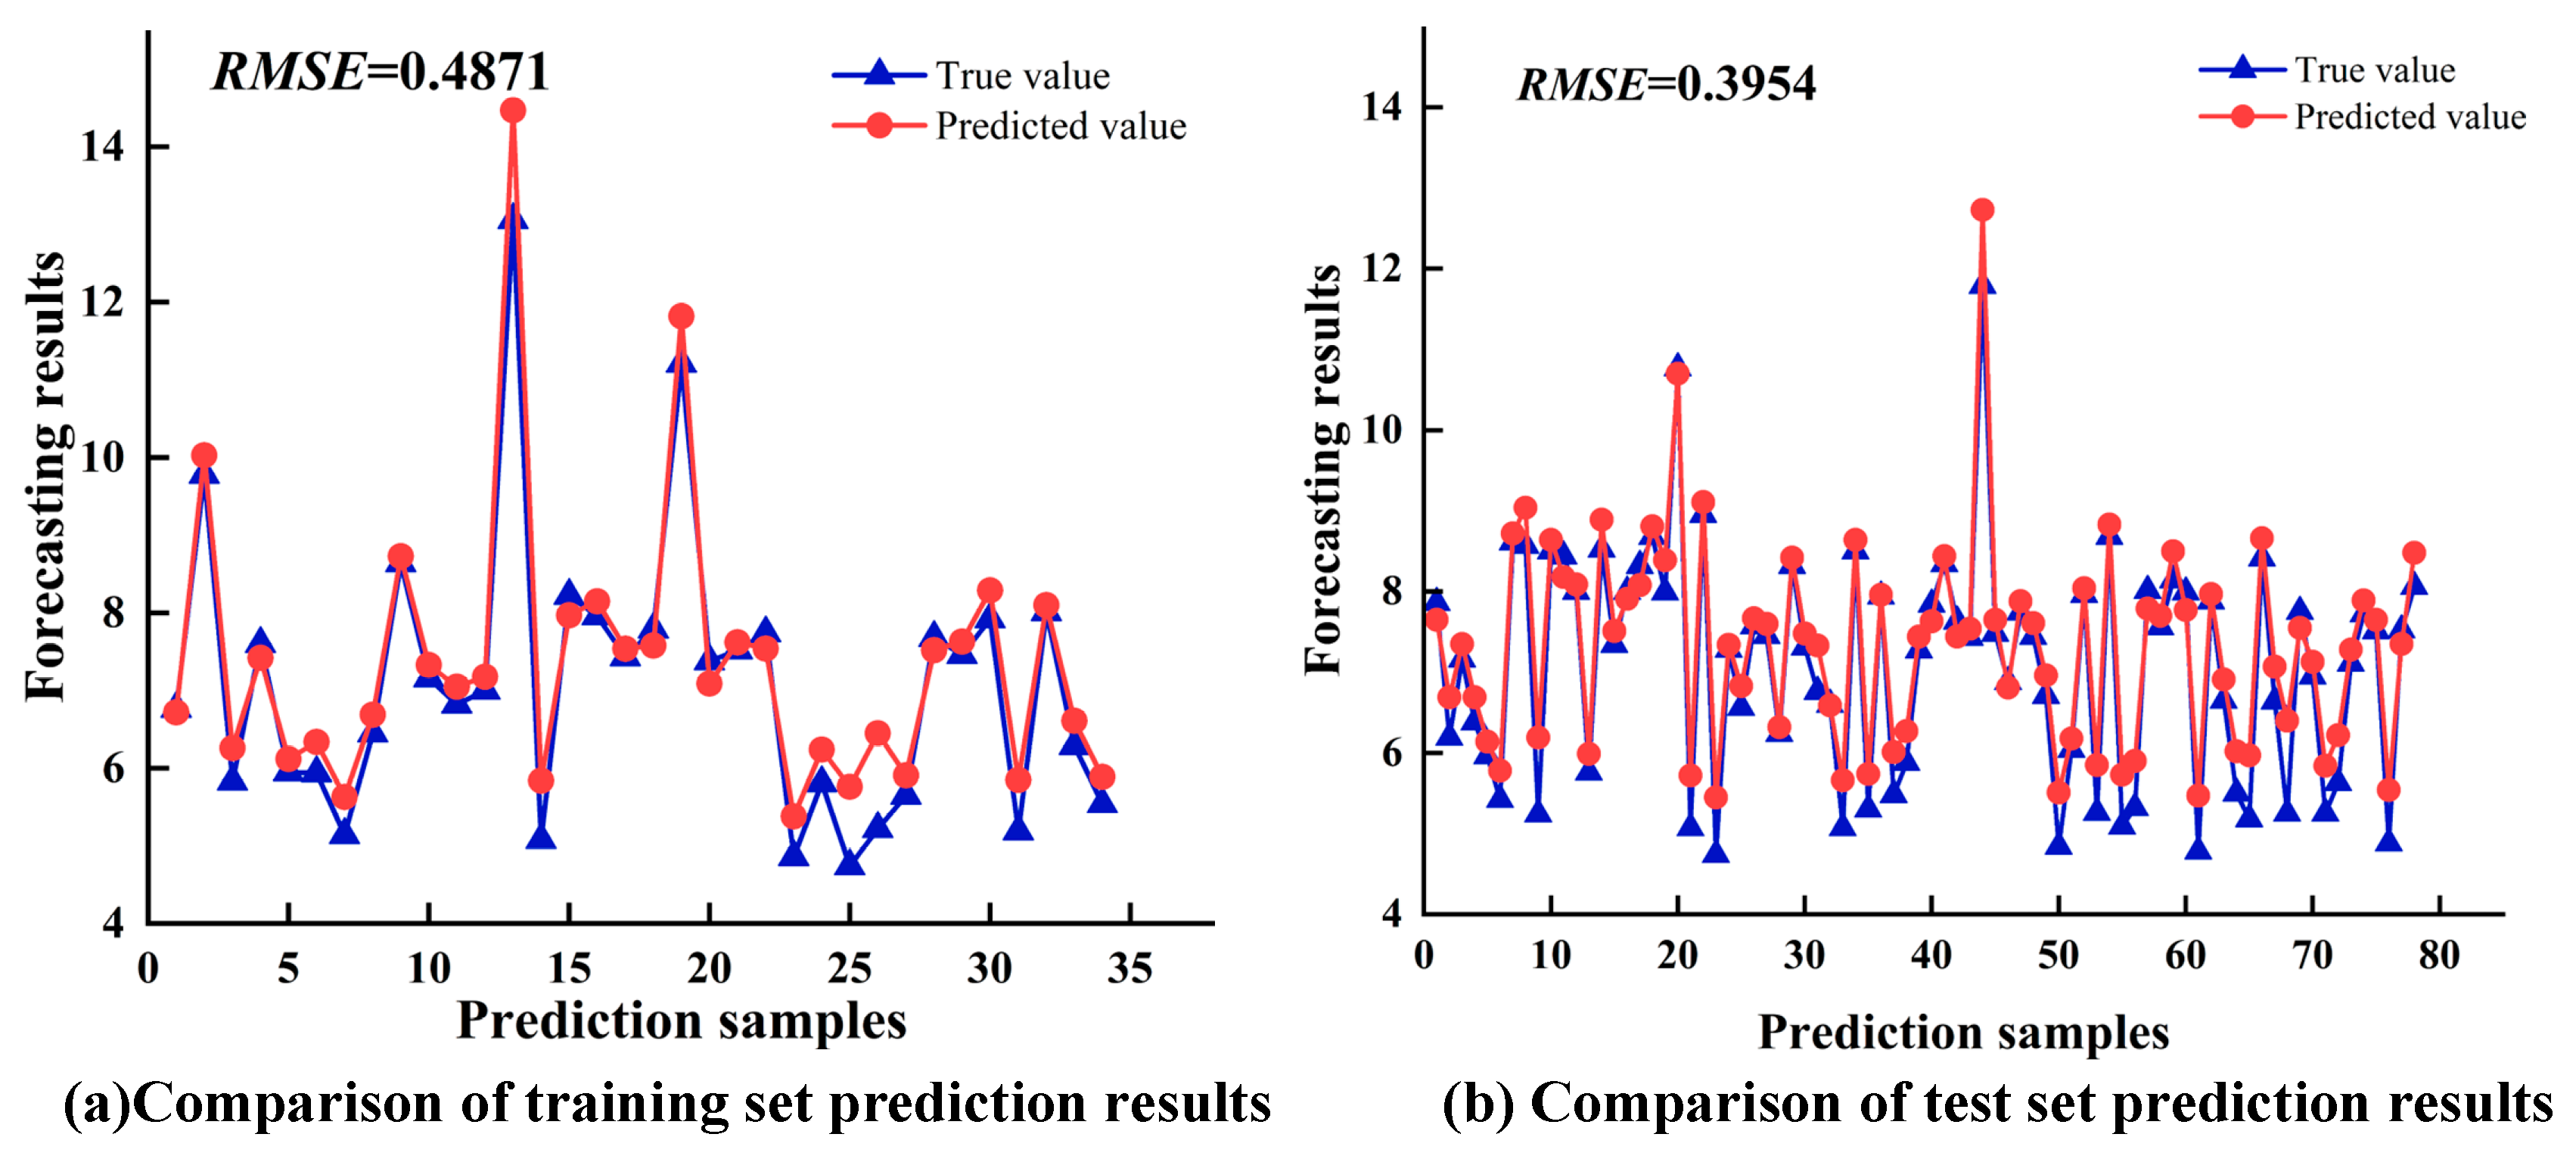
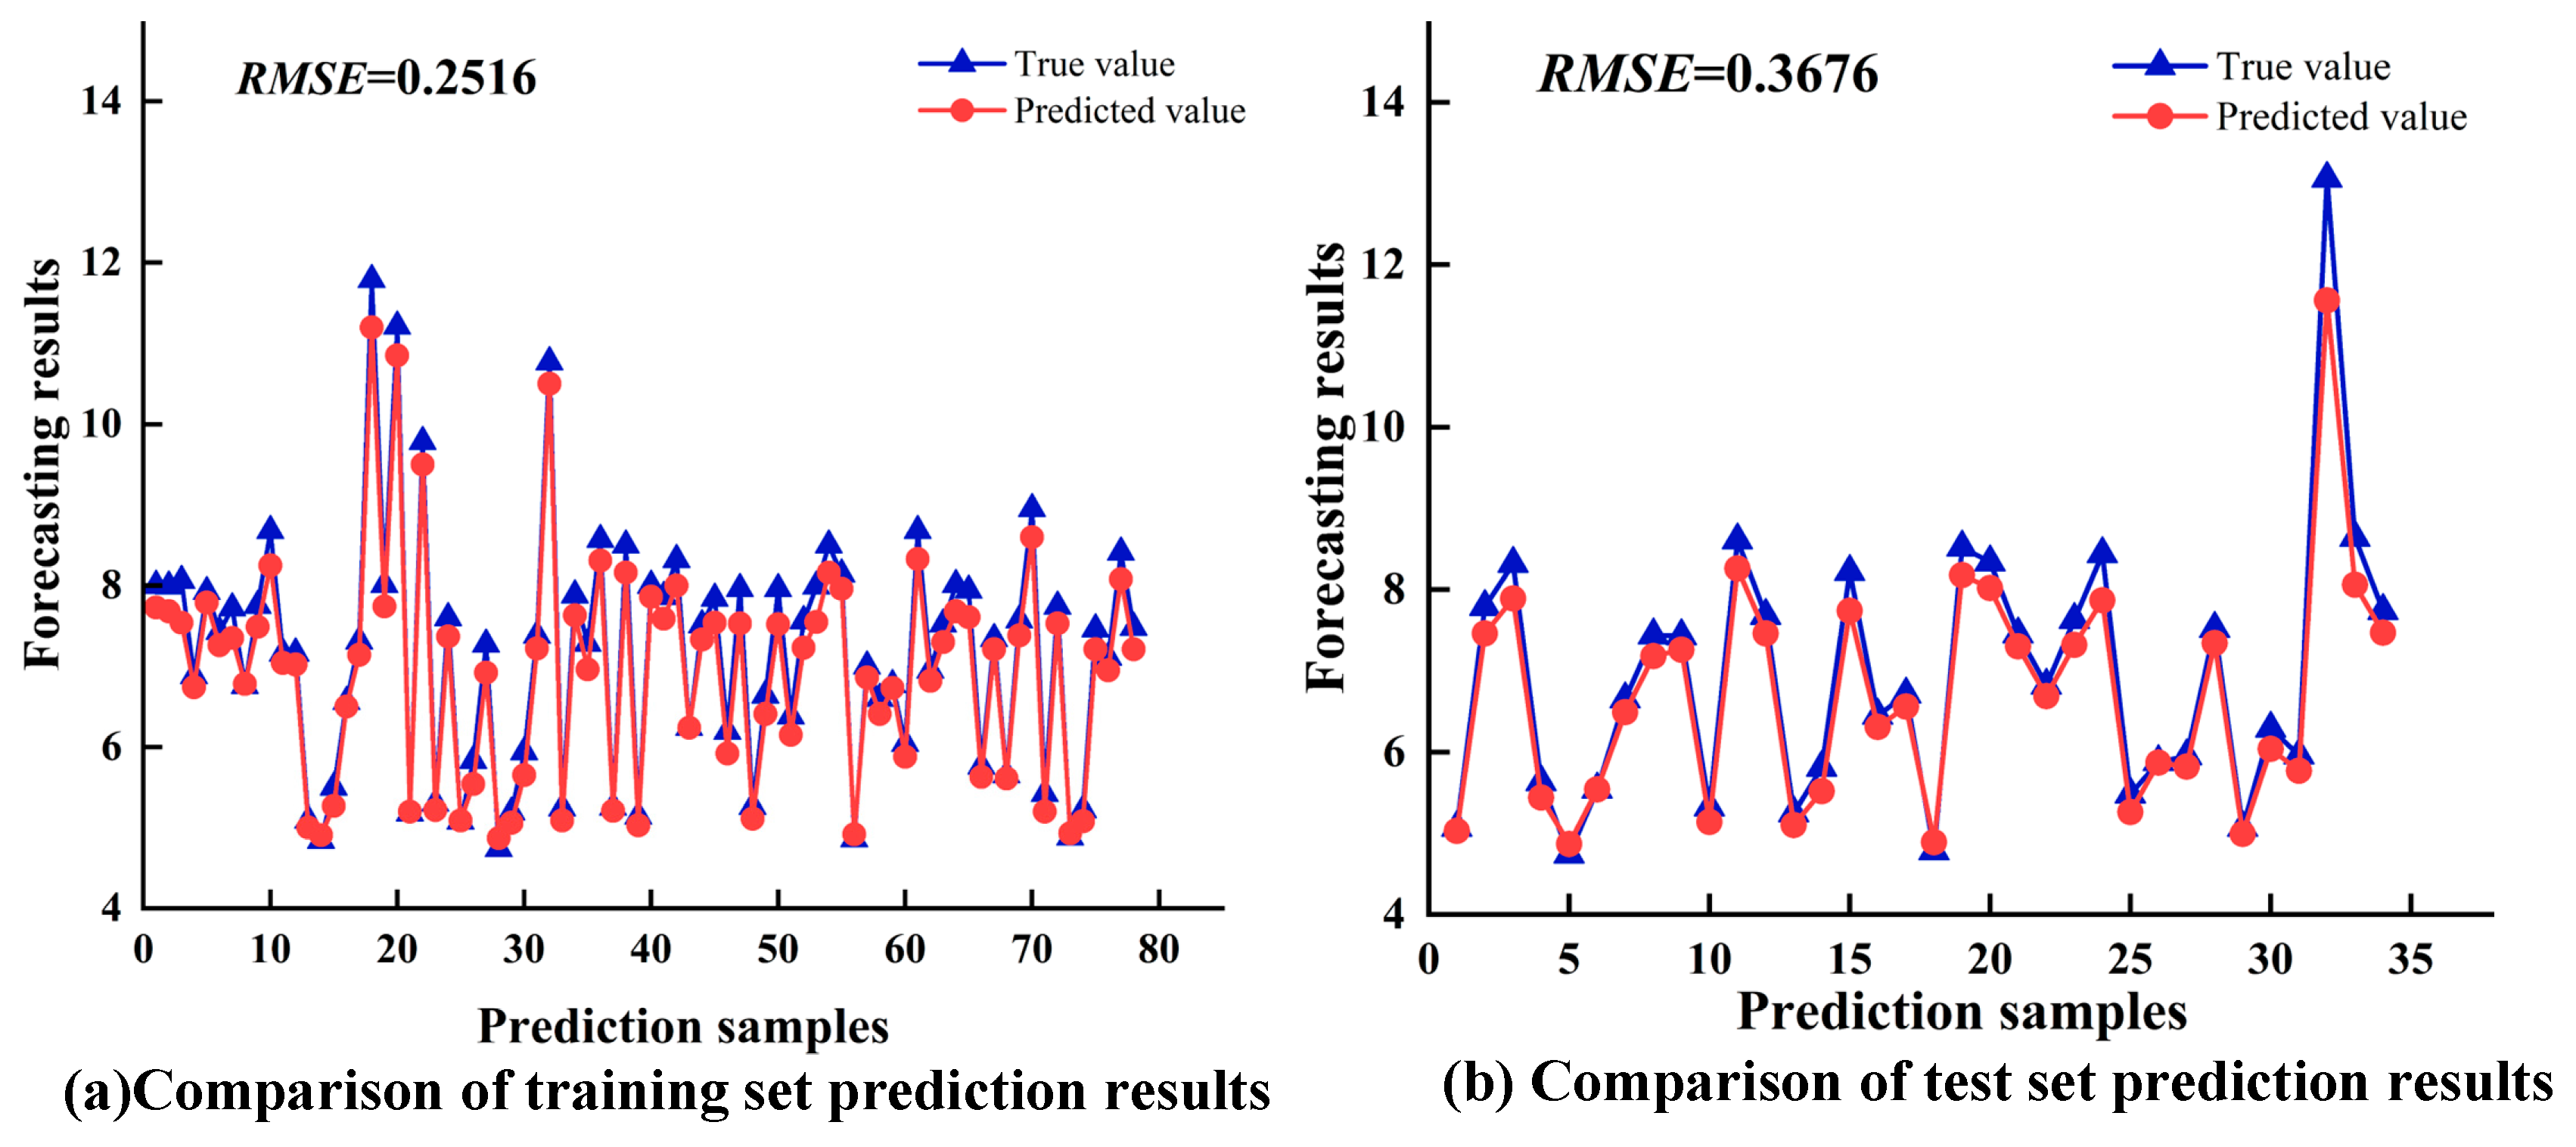
A friction prediction model based on the BO–Transformer–LSTM framework has been developed. This model incorporates three variations, namely BO-LSTM, LSTM–Attention, and CNN–LSTM–Attention. The model’s performance is evaluated using four metrics, namely mean absolute error (MAE), root mean square error (RMSE), R-squared (R2), and mean bias error (MBE). The findings indicate that the R2 value for the BO–Transformer–LSTM friction prediction model reaches an impressive 0.9835, while the RMSE remains within 0.2271, thereby demonstrating the model’s exceptional predictive capability and stability.
(4)
The purpose of this study is to provide a more efficient method for predicting and monitoring the friction force of micro-textured friction pairs. It can monitor the friction state in real time, help optimize the cutting parameters, significantly prolong the tool life, and reduce the frequency of tool change, thereby improving the processing efficiency and reducing the production cost. The current research is limited to the friction monitoring of titanium alloy-cemented carbide cutting types and does not cover other commonly used materials. In the future, more materials will be studied, and the research will be deepened through algorithm dynamic optimization, multi-condition verification, and cross-material migration, which will be applied to the field of intelligent monitoring of high-end manufacturing tools, such as those used for aviation and medical care.

Author Contributions

Conceptualization, H.Z. and X.T.; methodology, X.T.; validation, B.W. and H.Z.; formal analysis, H.Z.; investigation, X.T.; resources, B.W.; writing—original draft preparation, H.Z.; writing—review and editing, X.T.; funding acquisition, X.T. All authors have read and agreed to the published version of the manuscript.

Funding

This research was funded by the Natural Science Foundation of Heilongjiang, grant no. LH2024E083.

Institutional Review Board Statement

Not applicable.

Informed Consent Statement

Not applicable.

Data Availability Statement

Data are contained within the article.

Conflicts of Interest

The authors declare no conflicts of interest.

References

  1. Lontin, K.; Khan, M. Interdependence of friction, wear, and noise: A review. Friction 2021, 9, 1319–1345. [Google Scholar] [CrossRef]
  2. Liu, S.C.; Sai, Q.Y.; Wang, S.W.; Williams, J. Effects of laser surface texturing and lubrication on the vibrational and tribological performance of sliding contact. Lubricants 2022, 10, 10. [Google Scholar] [CrossRef]
  3. Xue, Y.; Shi, X.; Zhou, H.; Yang, Z.; Zhang, J.; Wu, C.; Xue, B. Effects of Textured Surface Combined with Sn-Ag-Cu Coating on Tribological Properties and Friction-Induced Noise of Ti-6Al-4V Alloy. Tribol. Trans. 2021, 64, 562–577. [Google Scholar] [CrossRef]
  4. Zhang, Y.M.; Guo, W.B.; Long, R.S.; Wang, Y.B. Study on Vibration and Noise of Textured Rolling Bearing Under Lean Oil Condition. Mech. Des. Manuf. 2024, 405, 138–142. [Google Scholar] [CrossRef]
  5. Chen, N.X. Chaotic Property and Correlation of Friction Force and Friction Vibrationin Wear Process. Master’s Thesis, China University of Mining and Technology, Xuzhou, China, 2015. [Google Scholar]
  6. Sadegh, H.; Mehdi, A.N.; Mehdi, A. Classification of acoustic emission signals generated from journal bearing at different lubrication conditions based on wavelet analysis in combination with artificial neural network and genetic algorithm. Tribol. Int. 2016, 95, 426–434. [Google Scholar] [CrossRef]
  7. Du, X.F. Research on Diesel Engine Noise and Vibration Signal Feature Extraction and Low Noise and Vibration Block Structure Improvement. Master’s Thesis, Tianjin University, Tianjin, China, 2012. [Google Scholar]
  8. Wang, Y.Y. Vibration-Acoustic Signal Analysis of Rolling Bearing. Master’s Thesis, Nanjing University of Aeronautics and Astronautics, Nanjing, China, 2014. [Google Scholar]
  9. Mo, H.F.; Gu, A.Y.; Rao, M.H.; Chen, R. Audio Fault Detection of Motor Based on Wavelet Packet Energy Relative Entropy. Coal Mine Mach. 2014, 35, 231–233. [Google Scholar] [CrossRef]
  10. Dong, H.L.; Bao, J.S.; Yin, Y.; Guo, C.; Huang, S.; Zhao, S. Experimental analysis of friction noise characteristics of disc brakes. J. Tribol. 2020, 40, 175–184. [Google Scholar] [CrossRef]
  11. Seong, Y.; Lee, D.; Yeom, J.; Park, J. The Feature Extraction through Wavelet Coefficients of Metal Friction Noise for Adhesive and Abrasive Wear Monitoring. Appl. Sci. 2021, 11, 3755. [Google Scholar] [CrossRef]
  12. Xing, S.; Tong, X.; Yang, S.; Li, X. Study on shallow configuration preparation and macroscopic and microscopic properties of cemented carbide surface. Int. J. Refract. Met. Hard Mater. 2024, 122, 106727. [Google Scholar] [CrossRef]
  13. Hu, Y.T.; Maimaitireyimu, A.; Zhang, C.; Shi, W.J. DBO-VMD-SVM Rolling Bearing Fault Diagnosis Based on Parameter Optimization. Comput. Simul. 2025, 42, 466–472. [Google Scholar]
  14. Shui, X.; Rong, Z.; Dan, B.; He, Q.; Yang, X. Tool Wear State Identification Based on the IWOA-VMD Feature Selection Method. Mach. 2024, 12, 184. [Google Scholar] [CrossRef]
  15. Zhao, Y.; Ma, Y.; Du, J.; Wang, C.; Xia, D.; Xin, W.; Zhan, Z.; Zhang, R.; Chen, J. Noise Reduction Based on a CEEMD-WPT Crack Acoustic Emission Dataset. Appl. Sci. 2023, 13, 10274. [Google Scholar] [CrossRef]
  16. Du, S.Y. On-line Condition Monitoring of Marine Gearbox Based on Cwt-Dcnn. Master’s Thesis, Harbin Institute of Technology, Harbin, China, 2022. [Google Scholar]
  17. Li, C.Y.; Hu, Y.H.; Shen, W.; Cui, X.D.; Zhang, C.; Rui, X.S. Fault diagnosis of marine machinery based on wavelet transform, C.N.N. China Meas. Test 2024, 50, 183–192. [Google Scholar] [CrossRef]
  18. Arif, A.; Rao, G.P.; Prasad, K. A novel hybrid Bayesian-optimized CNN–SVM deep learning model for real-time surface roughness classification and prediction based on in-process machined surface image analysis. Int. J. Interact. Des. Manuf. 2025, 1–18. [Google Scholar] [CrossRef]
  19. Li, Q.Y.; Lei, W.P.; Yan, H.; Lou, Y.W.; Cheng, Y. Rolling Bearing Life Prediction Based on Feature Selection and Transformer-LSTM. Modul. Mach. Tool Autom. Manuf. Tech. 2025, 200–206+211. [Google Scholar] [CrossRef]
  20. Zou, X.Y.; Hu, L.; Wang, F.L.; Pan, J.; Wang, Z.B. Bearing remaining useful life prediction based on signal decomposition embedding deep network. Chin. J. Sci. Instrum. 2024, 45, 45–57. [Google Scholar] [CrossRef]
  21. Jiang, X.; Wang, Q.; Long, Y.; Zhang, S.; Fang, Y.; Hu, D. Vibration Signal Features Prediction of GIS Equipment Based on Improved Slime Mold Optimization Algorithm Optimizing CNN-BiLSTM. Trait. Du Signal 2022, 39, 1109–1117. [Google Scholar] [CrossRef]
  22. Qu, N.; Wei, W.; Hu, C.; Shi, S.; Zhang, H. Series arc fault detection based on multi-domain depth feature association. J. Power Electron. 2024, 24, 1809–1819. [Google Scholar] [CrossRef]
  23. He, M.R.; Wu, S.F.; Li, M.; Zhang, W. Milling cutter wear recognition method based onmulti-sensor multi-eigenvalues fusion decision. J. Mech. Electr. Eng. 2024, 41, 2019–2028. [Google Scholar] [CrossRef]
  24. Chen, L.; Shen, Z.H.; Zhang, M. RUL Prediction of Rotating Machinery Under Variable Working Conditions Based on Deep MAML Method. Mach. Des. Manuf. 2025, 407, 188–192. [Google Scholar] [CrossRef]
  25. Wang, S.; Wang, Q.F.; Xiao, Y.; Liu, W.; Shang, M. Research on rotor system fault diagnosis method based on vibration signal feature vector transfer learning. Eng. Fail. Anal. 2022, 139, 106424. [Google Scholar] [CrossRef]
Figure 1. Workpiece preparation process and physical object.
Coatings 15 00843 g001
Figure 2. Friction and wear test platform construction.
Coatings 15 00843 g002
Figure 3. DBO-VMD-WPT algorithm workflow.
Coatings 15 00843 g003
Figure 4. Optimization curve.
Coatings 15 00843 g004
Figure 5. Pearson correlation coefficient between the IMF component and original signal.
Coatings 15 00843 g005
Figure 6. Signal denoising process flowchart.
Coatings 15 00843 g006
Figure 7. Signal comparison diagram.
Coatings 15 00843 g007
Figure 8. Two-dimensional time–frequency diagram of acoustic signal.
Coatings 15 00843 g008
Figure 9. BO–Transformer–LSTM flowchart.
Coatings 15 00843 g009
Figure 10. BO–Transformer–LSTM training network architecture.
Coatings 15 00843 g010
Figure 11. Friction data.
Coatings 15 00843 g011
Figure 12. Relief-F algorithm eigenvalue weight ratio.
Coatings 15 00843 g012aCoatings 15 00843 g012b
Figure 13. BO–Transformer–LSTM fitting effect diagram.
Coatings 15 00843 g013
Figure 14. BO-LSTM fitting effect diagram.
Coatings 15 00843 g014
Figure 15. LSTM–Attention fitting effect diagram.
Coatings 15 00843 g015
Figure 16. CNN–LSTM–Attention fitting effect diagram.
Coatings 15 00843 g016
Figure 17. Comparison of BO–LSTM–Attention results.
Coatings 15 00843 g017
Figure 18. Comparison of BO-LSTM results.
Coatings 15 00843 g018
Figure 19. Comparison of LSTM–Attention results.
Coatings 15 00843 g019
Figure 20. Comparison of CNN–LSTM–Attention results.
Coatings 15 00843 g020
Table 1. Orthogonal level table [12].
FactorPower
p (%)
Scanning Speed
v (mm/s)
Microtexture Diameter
d (μm)
Scan Times
n
Thickness of
Powder Layer
d (μm)
Level80110040640
85130050750
90150060860
95170070970
Table 2. Working parameters of the sound sensor.
ItemParameter
Open cardan shaft—circuit Sensitivity−26 ± 1.5 (50 mV/Pa)
Frequency response20 Hz~20 kHz + 2~−3 dB
Background noise (dBA)<17
Temperature range (°C)−40~+ 70
Table 3. Eigenvalue extraction.
Time Domain FeatureFrequency Domain FeatureWavelet Packet FeatureEntropy Feature
MaxMFP1Fuzzy entropy
MinFCP2Approximate entropy
PeakRMSFP3Energy entropy
P2PRVFP4Information entropy
Mean P5 
Average amplitude Energy E 
Root amplitude E1 
Var E2 
Std E3 
RMS E4 
Kurtosis E5 
Table 4. Eigenvalue filtering.
Time Domain FeatureFrequency Domain FeatureWavelet Packet FeatureEntropy Feature
PeakFCP1Fuzzy entropy
P2PRMSFP2Approximate entropy
Average amplitudeRVFP4 
Root amplitude P5 
Var Energy E 
Std E1 
RMS E4 
Table 5. Comparison of evaluation indexes of the model training sets.
Evaluating IndicatorPrediction Model
BO–Transformer–LSTMBO-LSTMLSTM–AttentionCNN–LSTM–Attention
MAE0.16340.34000.31240.2191
RMSE0.20520.49530.39540.2516
R20.97740.92030.91910.9701
MBE0.15500.32030.25690.2099
Table 6. Comparison of evaluation indexes of the test sets of the models.
Evaluating IndicatorPrediction Model
BO–Transformer–LSTMBO-LSTMLSTM–AttentionCNN–LSTM–Attention
MAE0.18800.41680.37000.2648
RMSE0.22710.56610.48710.3676
R20.98350.90160.92310.9488
MBE0.14100.35480.29230.2510
Disclaimer/Publisher’s Note: The statements, opinions and data contained in all publications are solely those of the individual author(s) and contributor(s) and not of MDPI and/or the editor(s). MDPI and/or the editor(s) disclaim responsibility for any injury to people or property resulting from any ideas, methods, instructions or products referred to in the content.

