Article

Simple Strain Gradient–Divergence Method for Analysis of the Nanoindentation Load–Displacement Curves Measured on Nanostructured Nitride/Carbonitride Coatings

1
Mechanical and Biomedical Engineering Institute, Faculty of Civil and Mechanical Engineering, Riga Technical University, Kipsala Street 6b, LV-1048 Riga, Latvia
2
Nesta, 58 Victoria Embankment, London EC4Y 0DS, UK
*
Author to whom correspondence should be addressed.
Coatings 2025, 15(7), 824; https://doi.org/10.3390/coatings15070824
Submission received: 14 May 2025 / Revised: 18 June 2025 / Accepted: 14 July 2025 / Published: 15 July 2025
(This article belongs to the Section Ceramic Coatings and Engineering Technology)

Abstract

This study investigates the fabrication, nanomechanical behavior, and tribological performance of nanostructured superlattice coatings (NSCs) composed of alternating TiAlSiNb-N/TiCr-CN bilayers. Deposited via High-Power Ion-Plasma Magnetron Sputtering (HiPIPMS) onto 100Cr6 steel substrates, the coatings achieved nanohardness values of ~25 GPa and elastic moduli up to ~415 GPa. A novel empirical method was applied to extract stress–strain field (SSF) gradient and divergence profiles from nanoindentation load–displacement data. These profiles revealed complex, depth-dependent oscillations attributed to alternating strain-hardening and strain-softening mechanisms. Fourier analysis identified dominant spatial wavelengths, DWL, ranging from 4.3 to 42.7 nm. Characteristic wavelengths WL1 and WL2, representing fine and coarse oscillatory modes, were 8.2–9.2 nm and 16.8–22.1 nm, respectively, aligning with the superlattice period and grain-scale features. The hyperfine structure exhibited non-stationary behavior, with dominant wavelengths decreasing from ~5 nm to ~1.5 nm as the indentation depth increased. We attribute the SSF gradient and divergence spatial oscillations to alternating strain-hardening and strain-softening deformation mechanisms within the near-surface layer during progressive loading. This cyclic hardening–softening behavior was consistently observed across all NSC samples, suggesting it represents a general phenomenon in thin film/substrate systems under incremental nanoindentation loading. The proposed SSF gradient–divergence framework enhances nanoindentation analytical capabilities, offering a tool for characterizing thin-film coatings and guiding advanced tribological material design.

Graphical Abstract

1. Introduction

Nitride/carbonitride superlattice coatings outperform both amorphous carbon films and conventional monolayers in tribological applications. Their alternating nanolayers enhance hardness by strengthening interfacial bonding and hindering dislocation movement, resulting in superior mechanical properties compared to amorphous carbon, which lacks long-range order [1,2]. While amorphous coatings can achieve high hardness, they are brittle. In contrast, superlattice architectures combine low friction with excellent wear resistance, as their layered structure distributes stress and enables controlled deformation under harsh conditions [3,4,5,6,7,8,9].
This study focuses on the nanomechanical behavior of a TiAlSiNb-N/TiCr-CN bilayer system developed via High-Power Ion-Plasma Magnetron Sputtering (HiPIPMS) [10]. The selected elements and multilayer design aim to enhance hardness, toughness, thermal stability, and wear resistance. A modified, non-stoichiometric multilayer structure, TiAlSiMe1-N/TiMe2-CN, has emerged as a promising candidate for next-generation self-healing nanostructured coatings, combining low friction with ultra-high wear resistance [4,11,12,13]. Here, Me1 and Me2 denote refractory metals. This strategy addresses the limitations of pure hard carbon coatings, such as high residual stress, poor adhesion to steel substrates, and low thermal stability [1,2].
Several nitride/carbonitride reference systems illustrate key superlattice effects. TiN/CrN superlattices exhibit hardness peaks and toughness maxima at specific bilayer periods (e.g., with wavelength Λ ≈ 6 nm) [14,15]. Their deformation involves grain boundary sliding in TiN and densification in CrN, with better corrosion resistance than TiN/VN [16]. CrN/NbN systems offer high hardness and thermal stability, leveraging Nb—also present in the current system—for improved cutting tool protection [17]. TiN/VN superlattices achieve extreme hardness (~55–56 GPa) but suffer from poor oxidation resistance [15,16]. TiAlN-based multilayers (e.g., TiAlN/VN, TiAlN/CrN) combine hardness and wear resistance with Al- or Si-enhanced oxidation stability. For instance, TiAlN/VN reaches ~38 GPa hardness and may form lubricious V2O5 at high temperatures, though oxidation resistance may decline if Al forms mixed oxides like AlVO4 [18,19]. High Entropy Nitride (HEN) coatings represent a newer class of multicomponent nitrides forming stable solid solutions despite compositional complexity. Examples include (AlCrTaTiZr)N and HEN-based multilayers such as TiNbZrTaN/CrFeCoNiNx [20].
The TiAlSiNb-N/TiCr-CN superlattice developed here is a complex, quinary/ ternary multilayer system that merges traditional superlattice engineering with high-entropy principles. Some key features and advantages of the proposed current system include: (i) Compositional synergy: Al and Si enhance hardness, thermal stability, and oxidation resistance in TiAlSiNb-N; Nb contributes via grain refinement and solid solution strengthening; Cr in TiCr-CN improves wear resistance, while the carbonitride layer modifies friction and wear particle behavior; (ii) Hybrid design: The system blends superlattice mechanics (e.g., interfacial strengthening) with multicomponent layer chemistry, echoing high-entropy alloy design to achieve a balanced performance; (iii) Performance: With a reported hardness of ~25 GPa (cf. Results and Discussion), the system may not match the hardest superlattices but offers a superior combination of durability, damage tolerance, and potential for tribo-film formation (e.g., SiOx), especially under high-temperature conditions. Thus, the TiAlSiNb-N/TiCr-CN system design integrates compositional and structural strategies to achieve a robust, synergistic balance of strength, toughness, and tribological performance.
Nanoindentation measurements at shallow depths (tens to hundreds of nanometers) often exhibit significant variability, requiring an average of at least ten indentation tests. Mechanical properties are typically evaluated at 200–300 nm depth or greater, where values stabilize and approximate bulk material properties conventionally assessed by micro- or macroindentation. However, steady-state responses may not be achieved even at depths of several hundred nanometers. This behavior stems from factors such as reverse indentation size effects (RISE) [1,2], structural defects, or substantial substrate influence on thin coatings [21,22]. Near-surface regions are often structurally heterogeneous, complicating steady-state value attainment [5]. Analyzing gradients and divergences of the local stress–strain field (SSF) induced by structural inhomogeneities can provide valuable insights into the nanomechanical behavior of a material investigation.
Therefore, to complement characterization of the TiAlSiNb-N/TiCr-CN bilayer system and overcome limitations of conventional analytical approaches, we present a novel, straightforward method for extracting local SSF gradient and divergence information from nanoindentation datasets. These strain-gradient-based representations are sufficiently sensitive to reveal even subtle structural heterogeneities, such as interfaces between mechanically distinct microzones (e.g., sublayer boundaries in superlattice architectures) or grain boundaries within sublayers in near-surface regions. Applying this SSF gradient-divergence analysis to nanostructured tribological coatings (NSCs) enabled us to identify both work-hardening and work-softening processes occurring beneath the indenter during nanoindentation.
Highly dynamic phenomena were observed as quasi-periodic spatial oscillations in the first derivatives P′(h) of the load–displacement curves, interpreted here as SSF gradient representations. These oscillations emerged at shallow depths and were most prominent in individual indentation test data collected at depths of a few hundred nanometers—precisely where data variability is highest and often disregarded. We attribute these oscillations to alternating cycles of strain-hardening and strain-softening events triggered during the nanoindentation process.

2. Materials and Methods

2.1. Preparation of the NSC Samples

Thin-film coatings were deposited on 100Cr6-bearing steel substrates using High-Power Impulse Plasma Magnetron Sputtering (HiPIPMS) (Riga Technical University, Riga, Latvia), an advanced physical vapor deposition (PVD) method, implemented within a thin-film modular deposition system [23]. The HiPIPMS-PVD process enables discharge power densities exceeding 60 W/cm2 in the magnetron sputtering target’s (MST) erosion zone, facilitating uniform sputtering rates for transition metals with inherently different sputtering yields. The PVD process was executed under precisely regulated deposition parameters (cf. Ref. [24]).

2.2. Developing the Stress–Strain Field Gradient–Divergence Method to Reveal Strain-Hardening and Strain-Softening Phenomena Caused by Nanoindentation

During nanoindentation, each indentation event generates elastic–plastic deformation waves that relax through the coating/substrate system, creating a time-evolving stress–strain field (SSF) that balances the applied load, P(h). While direct measurement of internal SSF components is not feasible, their influence can be inferred from the load–displacement (P/h) data. Building on strain gradient plasticity theory [21,25,26] and the expanding cavity model, we approximate the hydrostatic core beneath the indenter as a homogeneous, incompressible region that transduces the applied load into internal restoring forces [27,28,29], with displacement h used as the independent variable (instead of contact radius, ac). The SSF response is characterized through a scalar potential function U(h), representing the stored deformation energy, from which the gradient field ∇U(h) is derived. This gradient quantifies SSF heterogeneity at the indentation interface (R(z = h)), providing insights into local mechanical behavior via spatial variations in strain energy density [30]:
U h h U h U h
This gradient field z-component, U′(h), along the h-axis (i.e., z-axis), serves as a simplified representation of the complex stress–strain tensor field created beneath the incrementally loaded indenter. In turn, the SSF divergence is then defined as the divergence of the SSF gradient vector field U′(h) (1):
U h U h
Divergence is related to the SSF flux density, i.e., the amount of stress–strain flow entering or leaving the given point R(z = h), indicating where the interface between the hydrostatic core and the plastic deformation zone acts as a stress–strain flux source or sink. Positive divergence indicates the interface acting as a stress–strain flux source (strain-hardening effect), while negative divergence indicates the interface acting as a stress–strain flux sink (strain-softening).
By knowing the surface area of the interface between the hydrostatic core and the plastic deformation zone, the average total stress, σt(h), at the interface can be calculated as:
σ t h = F ( h ) 2 π h 2 = P ( h ) 2 π h 2 σ t h P ( h ) h 2
Following the definition of SSF gradient from Equation (1), we derived the normalized elastic–plastic strain gradient expression from Equation (3):
P h h P h d P h d h 2  
where P′(h) represents the total strain gradient. Analogously we also derive the normalized total, P″(h) divergence using the definition by Equation (2):
P h P h
In practice, we estimated the gradient and divergence representations by calculating the analytic derivative of a polynomial fit to the measurement data and gradient representation, respectively. The fit was applied to a sliding window of 2m + 1 points. Results with 1st (i.e., linear) and 2nd order (parabolic) fits were already found to be satisfactory, with m = 7, 8, or 9 providing the optimal window lengths indicated by robust accuracy of the fits (generally, R-squared value ≈ 0.999). The linear and 2nd-order fit differences were less than 2% of peak amplitude at shallow penetration depths (h < 32 nm). Here, we presented results obtained using a simple linear fit with m = 8. The exact length of the window did not strongly affect the calculation of results, i.e., relevant derivatives. However, we recommend finding the optimal moving window width for each specific dataset when treating numerical data. Because the larger the window width will be chosen, the greater the risk of losing important information captured by subtle small amplitude undulations of relevant variables.

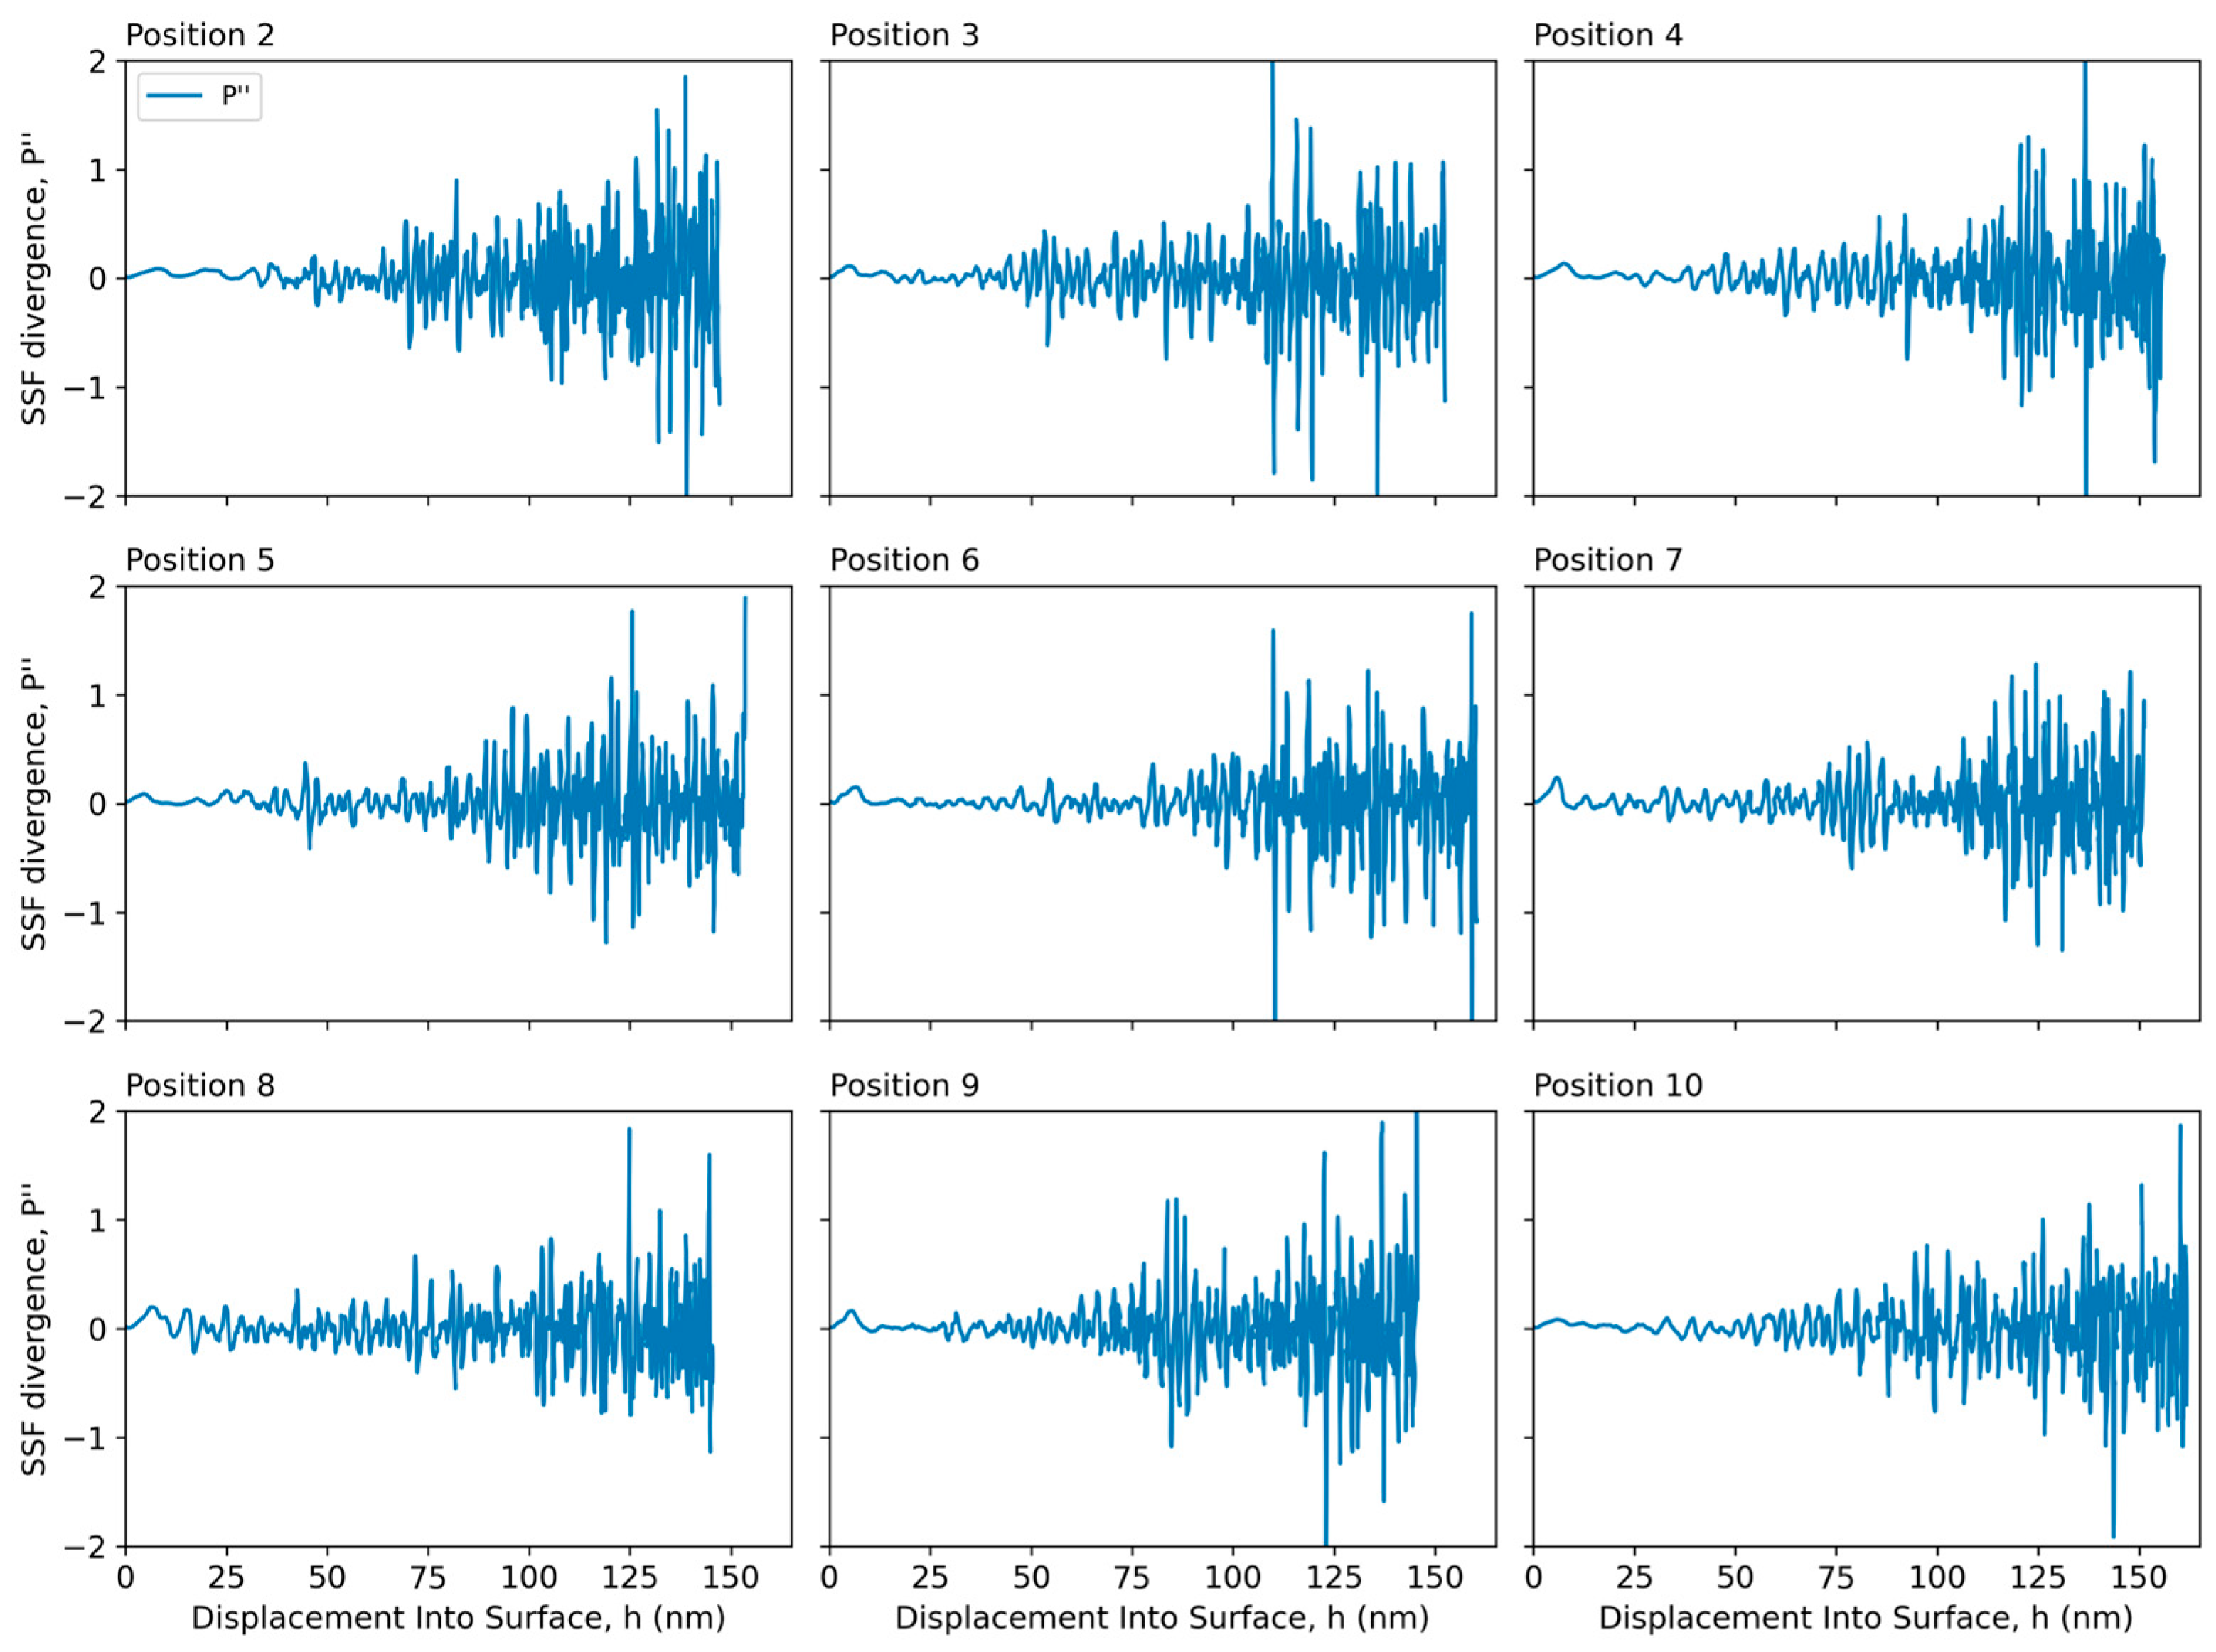
2.3. Strain Gradient and Divergence Oscillation Analysis of the Stress–Strain Field Caused by Incrementally Loaded Indenter

We investigated oscillations in nanoindentation-derived mechanical response signals, focusing on two quantities: the total strain gradient, P′(h), and the stress–strain field divergence, P″(h). Our approach draws on signal processing techniques typically used in time-series and surface roughness analysis, adapting them to spatially resolved indentation data. We employed frequency domain analysis via the Fast Fourier Transform (FFT), treating penetration depth h as the spatial domain.
We analyzed two distinct components of the primary strain gradient profile P′(h): a low-pass filtered, slowly undulating mean baseline component Pb(h) that we refer to as the total strain gradient profile’s fine structure and a superimposed, high-pass filtered component Pd(h) that we refer to as the hyperfine structure.
To perform the Fourier analysis on the baseline component Pb(h), we used a bin-averaging low-pass filtering approach using a 2 nm bin width, which yielded a smoothly varying Pb(h) component. This signal processing technique segments data into fixed-width intervals, calculates the arithmetic mean within each interval, and uses these averaged values to represent the corresponding data segments. The bin-averaging approach effectively reduces random fluctuations while preserving the underlying mechanical response characteristics, even at low amplitudes. We then applied the discrete one-sided FFT to the baseline component:
M f =   F F T P b h   =     n = 0   N 1 P b h n e 2 π i f h n
To analyze the hyperfine structure Pd(h), we used an alternative, moving average filtering approach with a relatively wide window width wMA = 10 nm:
P b h = M A P h = 1 N i k k P h i
where MA denotes the moving average filter function, and N = wMAh = 2k + 1 is the window width in terms of the number of interpolated measurement points P′(hi). The high-frequency component—representing the hyperfine structure—was computed as the detrended residual Pd(h):
P d h = P h     P b h
In this way, the Pb(h) baseline here was rendered rather flat, with the dynamic variation in P(h) primarily contained in the high-pass filtered component Pd(h). Note that to enable equidistant sampling required for FFT, the originally measured dataset was first interpolated into a uniform spatial grid with resolution Δh = 0.001 nm (the choice of the resolution does not affect the results, as long as it is sufficiently high). To characterize the oscillations, we applied the discrete one-sided FFT to the detrended residual:
M f =   F F T P d h   =     n = 0   N 1 P d h n e 2 π i f h n
where f is the spatial frequency in units of nm−1 and M(f) represents the oscillation magnitude spectrum. To identify characteristic length scales, frequencies were converted to wavelengths as λ = 1/f (excluding the DC component at f = 0). To reduce noise and improve spectral clarity, we applied a moving average filter in the frequency domain using a window of Δf = 0.1 nm−1. This operation preserved dominant spectral features while reducing the sensitivity to minor fluctuations. All spectra were normalized concerning the peak magnitude for comparability. Oscillatory patterns in Pd(h) varied with indentation depth. To capture this non-stationarity, we performed a local FFT analysis in sliding windows of width 30 nm, advancing by 15 nm per step. Within each window, we computed the FFT and identified the dominant spatial frequency fd as the frequency with the highest spectral magnitude. The corresponding dominant wavelength DWL was computed as:
D W L = 1 f d ,   w h e r e   f d = arg max f   M f
This produced an indentation depth-resolved profile of the dominant oscillatory modes in the total strain gradient P′/h-profile across the entire indentation depth. The stress–strain field divergence P″(h) was analyzed analogously. P″(h) did not show a discernible low-frequency baseline, so no detrending was applied. After interpolating a uniform spatial grid, we applied FFT directly to P″(h), followed by spectral smoothing and peak detection as above. The parameter with the greatest influence on the oscillation analysis is the moving average window width wMA, which determines the decomposition of mean baseline and detrended (hyperfine structure) components of the total strain gradient. We selected wMA = 10 nm empirically, ensuring that the baseline component excluded high-frequency hyperfine structure oscillations.

2.4. Nanoindentation Hardness Testing

The mechanical characterization of NSCs was carried out via nanoindentation using a TriboIndenter TI980 system (Bruker Nano Surfaces, Minneapolis, MN, USA) equipped with a sharp Berkovich diamond tip. To minimize environmental noise during testing, the experiments were conducted on a Herzan™ AVI-200 S/LP system (Irvine, CA, USA), where active vibration isolation is achieved by electrodynamic transducers actively suppressing low-frequency oscillations (0–200 Hz) and by a granite mass and rail-integrated spring system absorbing higher-frequency disturbances.
Nanoindentation was performed at a peak load of 8000 µN in a load-controlled mode. Ten distinct surface sites were selected within the test matrix, and ten load–displacement curves were recorded per site to characterize the mechanical response at peak load. The duration of each test was held constant across all measurements, irrespective of the applied load, ensuring consistent acquisition of P-h loops. Prior to data collection, the TI980 system was calibrated against a fused silica reference.
Mechanical properties such as hardness, elastic modulus, and associated standard deviations were extracted from the loading–unloading curves using the Oliver–Pharr method [31]. Data acquisition was carried out using Hysitron TriboScan TI 10.0.0.2 software, while post-processing and analysis were conducted via Tribo-IQ Indentation Explorer 1.0.0.2.

2.5. Tribological Tests of the NSC Samples

The tribological performance of the NSC samples was assessed using a ball-on-disk tribometer (TRB3 model, CSM Instruments SA, Peuseux, Switzerland), operating under dry friction conditions, following the ISO 18535:2016 standard. A 6 mm diameter 100Cr6 steel ball served as the static friction partner, to ensure experimental consistency and comparability with prior studies [32,33,34]. The tests were conducted using the following parameters: (i) a total sliding distance of 100 m; (ii) an applied load of 3 N; (iii) a wear track radius of 3 mm; (iv) a linear sliding speed of 0.05 m/s. All measurements were carried out in a temperature-controlled environment maintained at 22 ± 1 °C.
Steady-state coefficients of friction (CoF) were extracted from plateau regions of CoF vs. time curves, defined as segments displaying consistent frictional behavior over at least 20 m of sliding distance, with a coefficient of variation (relative standard deviation) below 10%. Average CoF values and corresponding standard deviations are reported.
Post-test analysis of wear tracks was performed at four evenly spaced positions on each sample using a profilometer (Surftest SJ-500, Mitutoyo, Kawasaki, Japan). Cross-sectional areas of the wear scars were quantified using MCube Map Ultimate 8.0 software (Mitutoyo, Kawasaki, Japan) [35,36], and specific wear rates were calculated by averaging the measured values. Wear on the static friction partner (100Cr6 steel ball) was examined using a digital microscope (KH-7700, Hirox, Tokyo, Japan).

2.6. Surface Roughness Evaluation Using Roughness Tester Mitutoyo AVANT

Surface roughness measurements were performed using a Mitutoyo AVANT roughness tester (model AVANT 3D, Mitutoyo, Japan), with details provided in Appendix A for all NSC samples investigated in this study (cf. Table A1). Measurement conditions were established according to ISO 21920-3:2021 (Geometrical product specifications (GPS) Surface texture: Profile—Part 2: Terms, definitions, and surface texture parameters). For each NSC sample, three symmetric roughness profiles were measured at 120-degree intervals from the sample center toward the outer perimeter. Average values were calculated for Ra (arithmetic mean deviation of the profile), Rq (root mean square deviation of the profile), and Rz (maximum height of the profile). The Mitutoyo AVANT is a high-precision contact profilometer that employs a stylus-based method to evaluate surface roughness parameters, including amplitude parameters Ra, Rq, and Rz. The instrument achieves a vertical resolution of 0.1 nm under optimal operating conditions. The measurement results were post-processed using MCube Map Ultimate 8.0 software.

2.7. Electron Microscopy Examinations of the NSC Samples

The morphology of the NSC sample structures was investigated with a scanning electron microscope (SEM) Lyra3 (Tescan, Brno, Czech Republic), equipped with an energy-dispersive X-ray spectrometer (EDS), AZtecCrystal (Oxford Instruments, Abingdon, UK). SEM and EDS measurements were performed using a beam-accelerating voltage of up to 30 kV and a beam current of 500 pA.

3. Results and Discussion

3.1. Characterization of the NSC Film Samples

We investigated the fabrication and characterization of the micromechanical properties and tribological performance of nanostructured tribological coatings (NSCs) with a multilayered alternating nitride/carbonitride bilayer substructure, TiAlSiNb-N/TiCr-CN. The chemical composition of the bilayered superlattice structure of the NSC samples was provisionally stated according to the MSD-MST configuration and using the PVD process technological parameters (Table 1). Custom mosaic-type magnetron sputtering targets (MSTs) incorporated Cr and Nb inserts, which were positioned strategically within the annular erosion zone of circular planar MSTs [37]. The arrangement of the MSTs and the rotating carousel mechanism of the substrate holder facilitated the deposition of superlattice-type nanostructured coatings with a period of around 17–19 nm. The configuration enabled the identification of the superlattice structure based on the PVD process technological parameters. Specifically, since the total coating thickness, t, is always measured after completion of the PVD process, an approximate superlattice structure can be calculated using process parameters such as deposition duration and the number of substrate holder carousel revolutions (Table 1). Additionally, by considering the sputtering yields of individual chemical elements (e.g., Ti ~0.5–0.8; C ~0.1–0.3; Cr ~0.6–1.0; Nb ~1.0–1.4), one can estimate the thickness of each sublayer, t1 and t2, from the total bilayer thickness, tb = t1 + t2, based on the average sputtering yields of the respective MSTs.
A total of 40 nanoindentation tests were performed on four NSC samples (Table 2) at a peak load of 8000 µN. For each NSC sample, an indentation matrix of 10 positions with adjustable coordinates (Xi, Yi) was established on the sample surface through microscopic investigation. Indentation sites were selected using optical microscopy to identify the smoothest possible surface areas and were spaced at least 4000 nm apart to avoid interference between nearby indentations. Each NSC sample underwent 10 indentation tests, yielding load–displacement data of 10 load–displacement loops (LDLs), with each dataset containing 2600 measurement points acquired during successive loading, drift, and unloading segments. All experiments were conducted in a single session to ensure identical measurement conditions and enable reliable comparison between NSC samples.
The primary focus of this study was to investigate the strain-hardening and strain-softening deformation processes that occur during nanoindentation testing experiments of the NSCs. The obtained nanoindentation datasets were used to calculate the total strain gradient P′/h-profiles regarding the stress–strain field (SSF) and corresponding divergence P″/h-profiles, for the four NSC samples.
Elevated substrate temperatures during the PVD process had a significant influence on the contact nanohardness. Maintaining substrate temperatures near 400 °C, particularly in the range of 380–390 °C, resulted in a substantial coating hardness due to improved microstructure, lowered residual stress–strain state, and superior interfacial quality between sublayers. Higher substrate temperatures promote increased adatom surface diffusion, enabling atoms to migrate more freely across the substrate surface and locate energetically favorable sites. This enhanced mobility leads to larger grain formation and denser film structures. In contrast, substrate temperatures below 300 °C (not reported here) are insufficient for significant surface diffusion, resulting in limited adatom mobility and consequently higher defect densities and more porous microstructures. The substrate temperature, thus, critically determines the balance between adatom mobility and shadowing effects during film growth.
The increased nanohardness of the NSC samples may stem from the interplay of several strengthening mechanisms, including grain refinement, solid solution strengthening, and precipitation hardening. Grain refinement enhances mechanical strength via the Hall–Petch relationship, where grain boundaries act as barriers that hinder dislocation motion. Solid solution strengthening likely results from the incorporation of refractory elements such as Cr and Nb into the lattice, generating local distortions that resist dislocation movement. In parallel, precipitation hardening may occur due to the formation of fine, dispersed precipitates that obstruct dislocation pathways. While a detailed examination of these individual mechanisms is beyond the scope of the present work, their combined influence is likely modulated by factors such as the superlattice structure, chemical composition, and processing conditions.

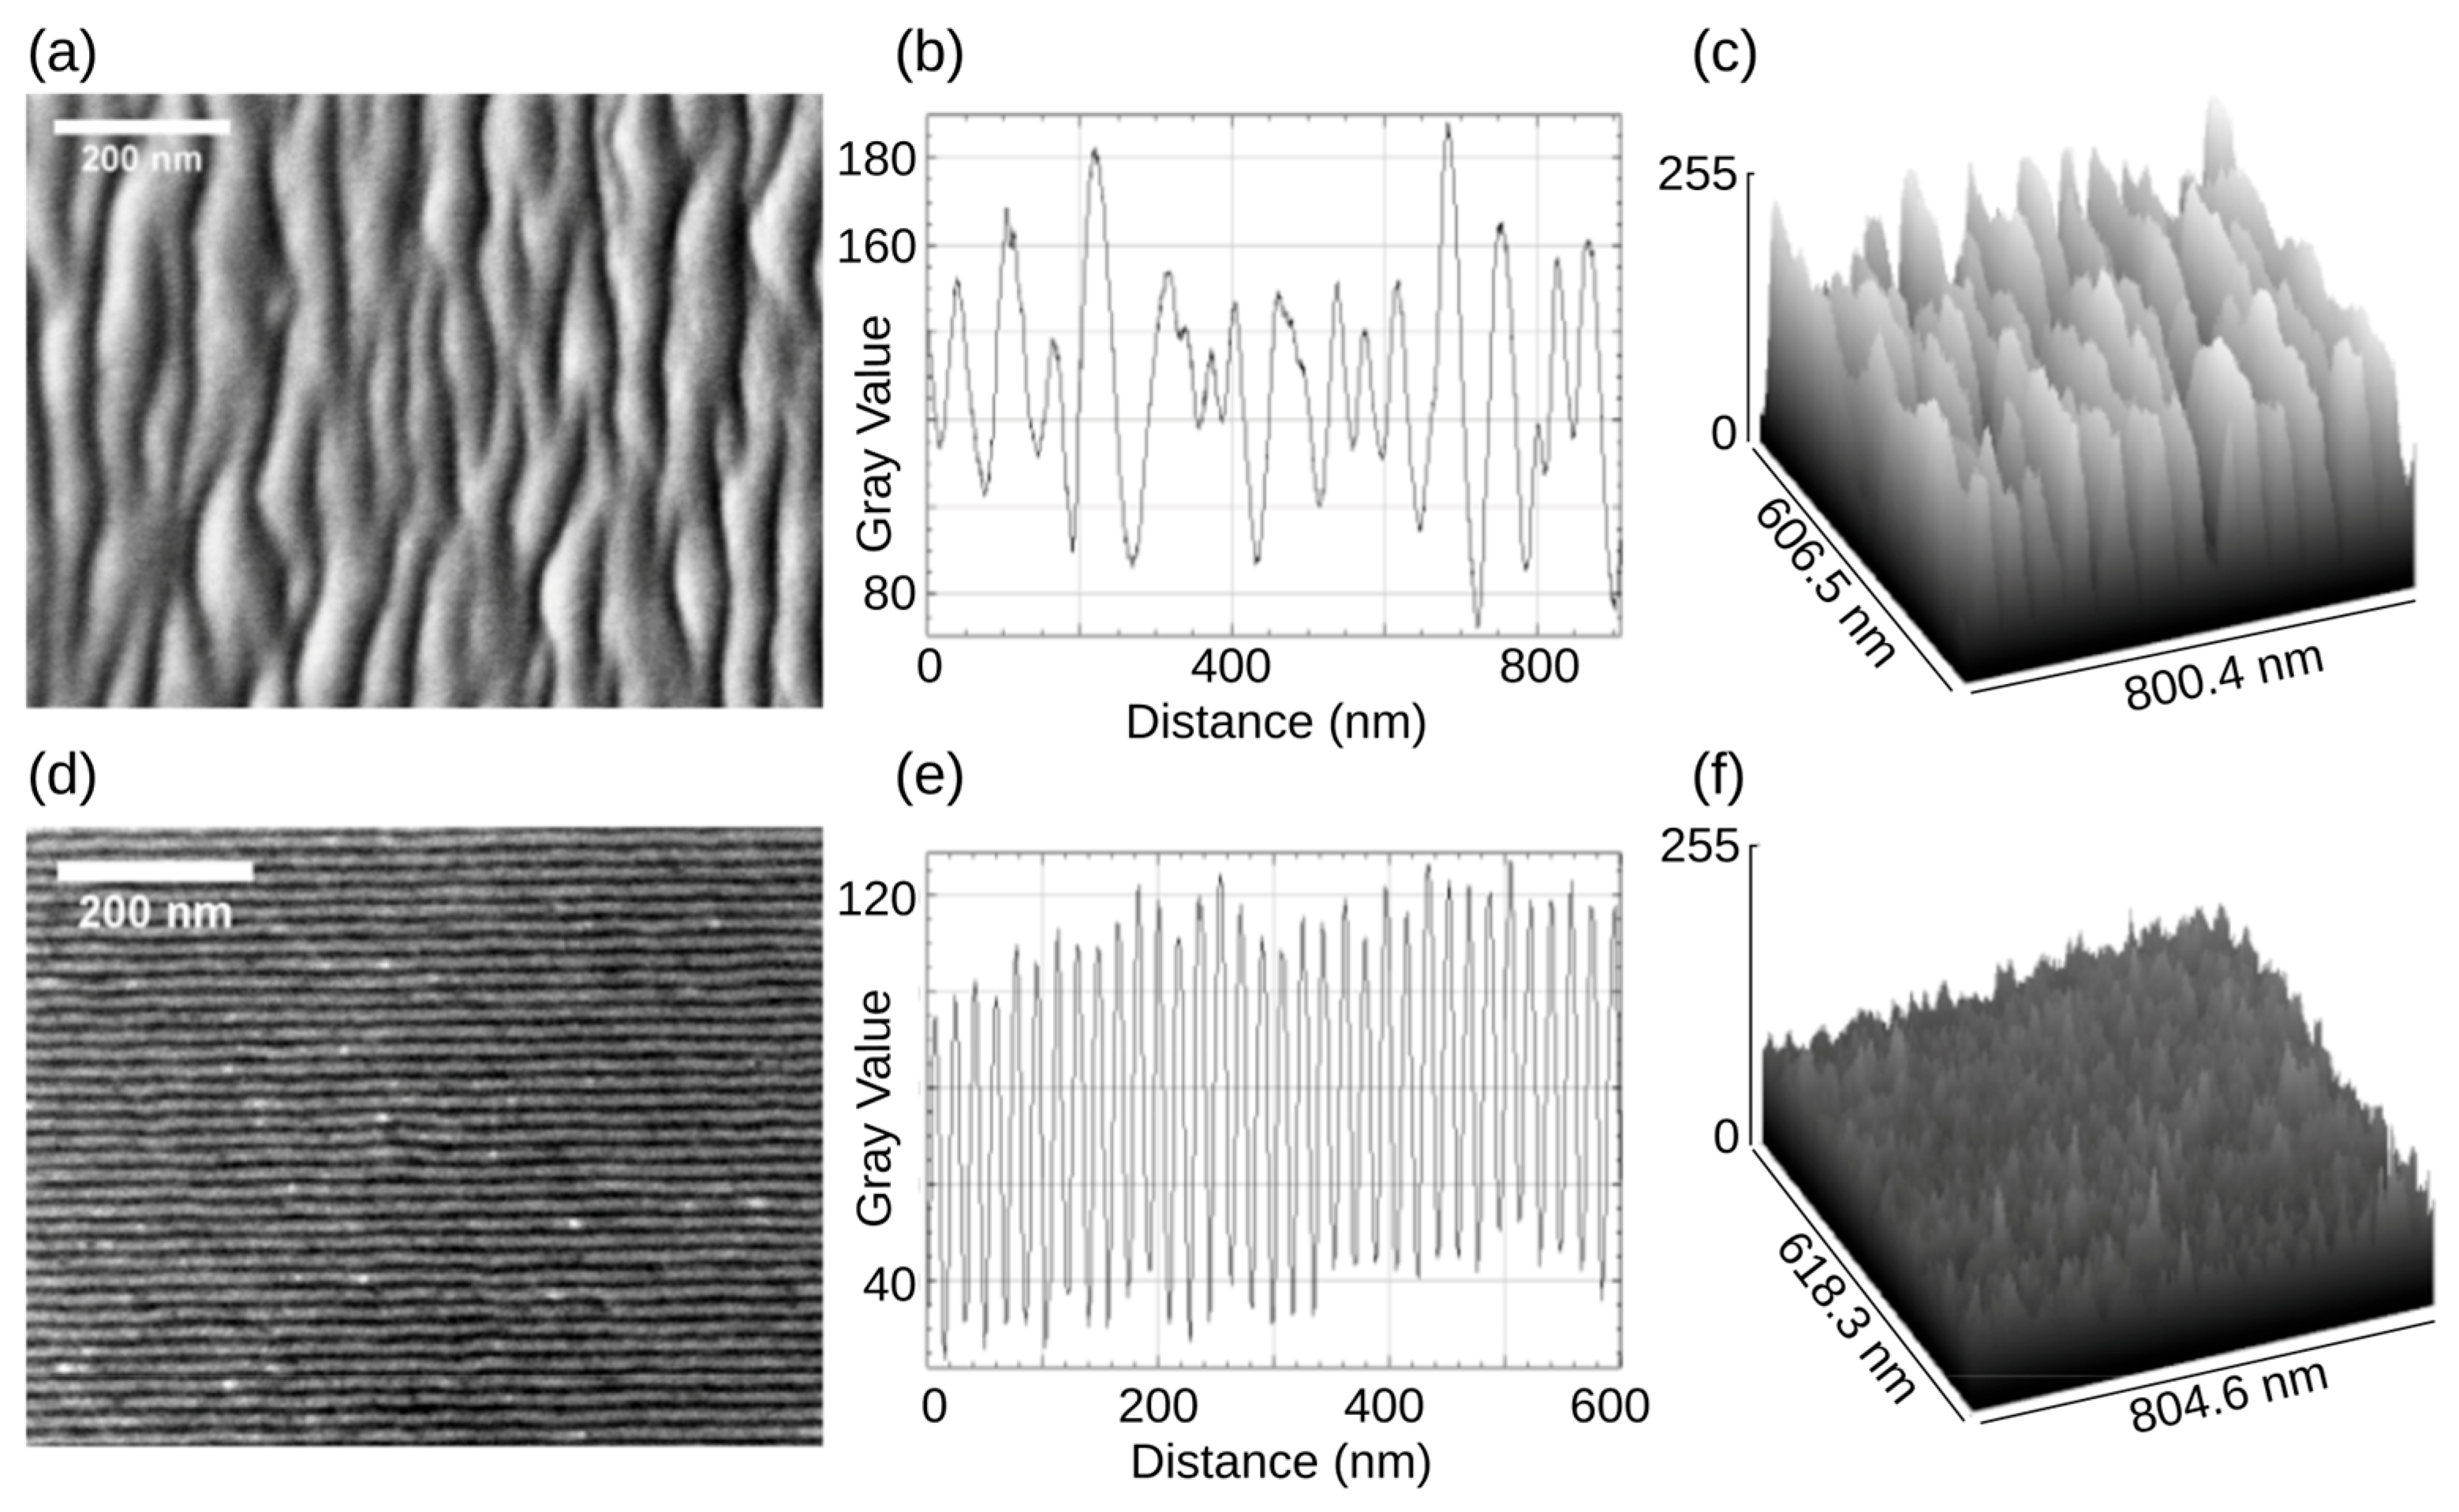
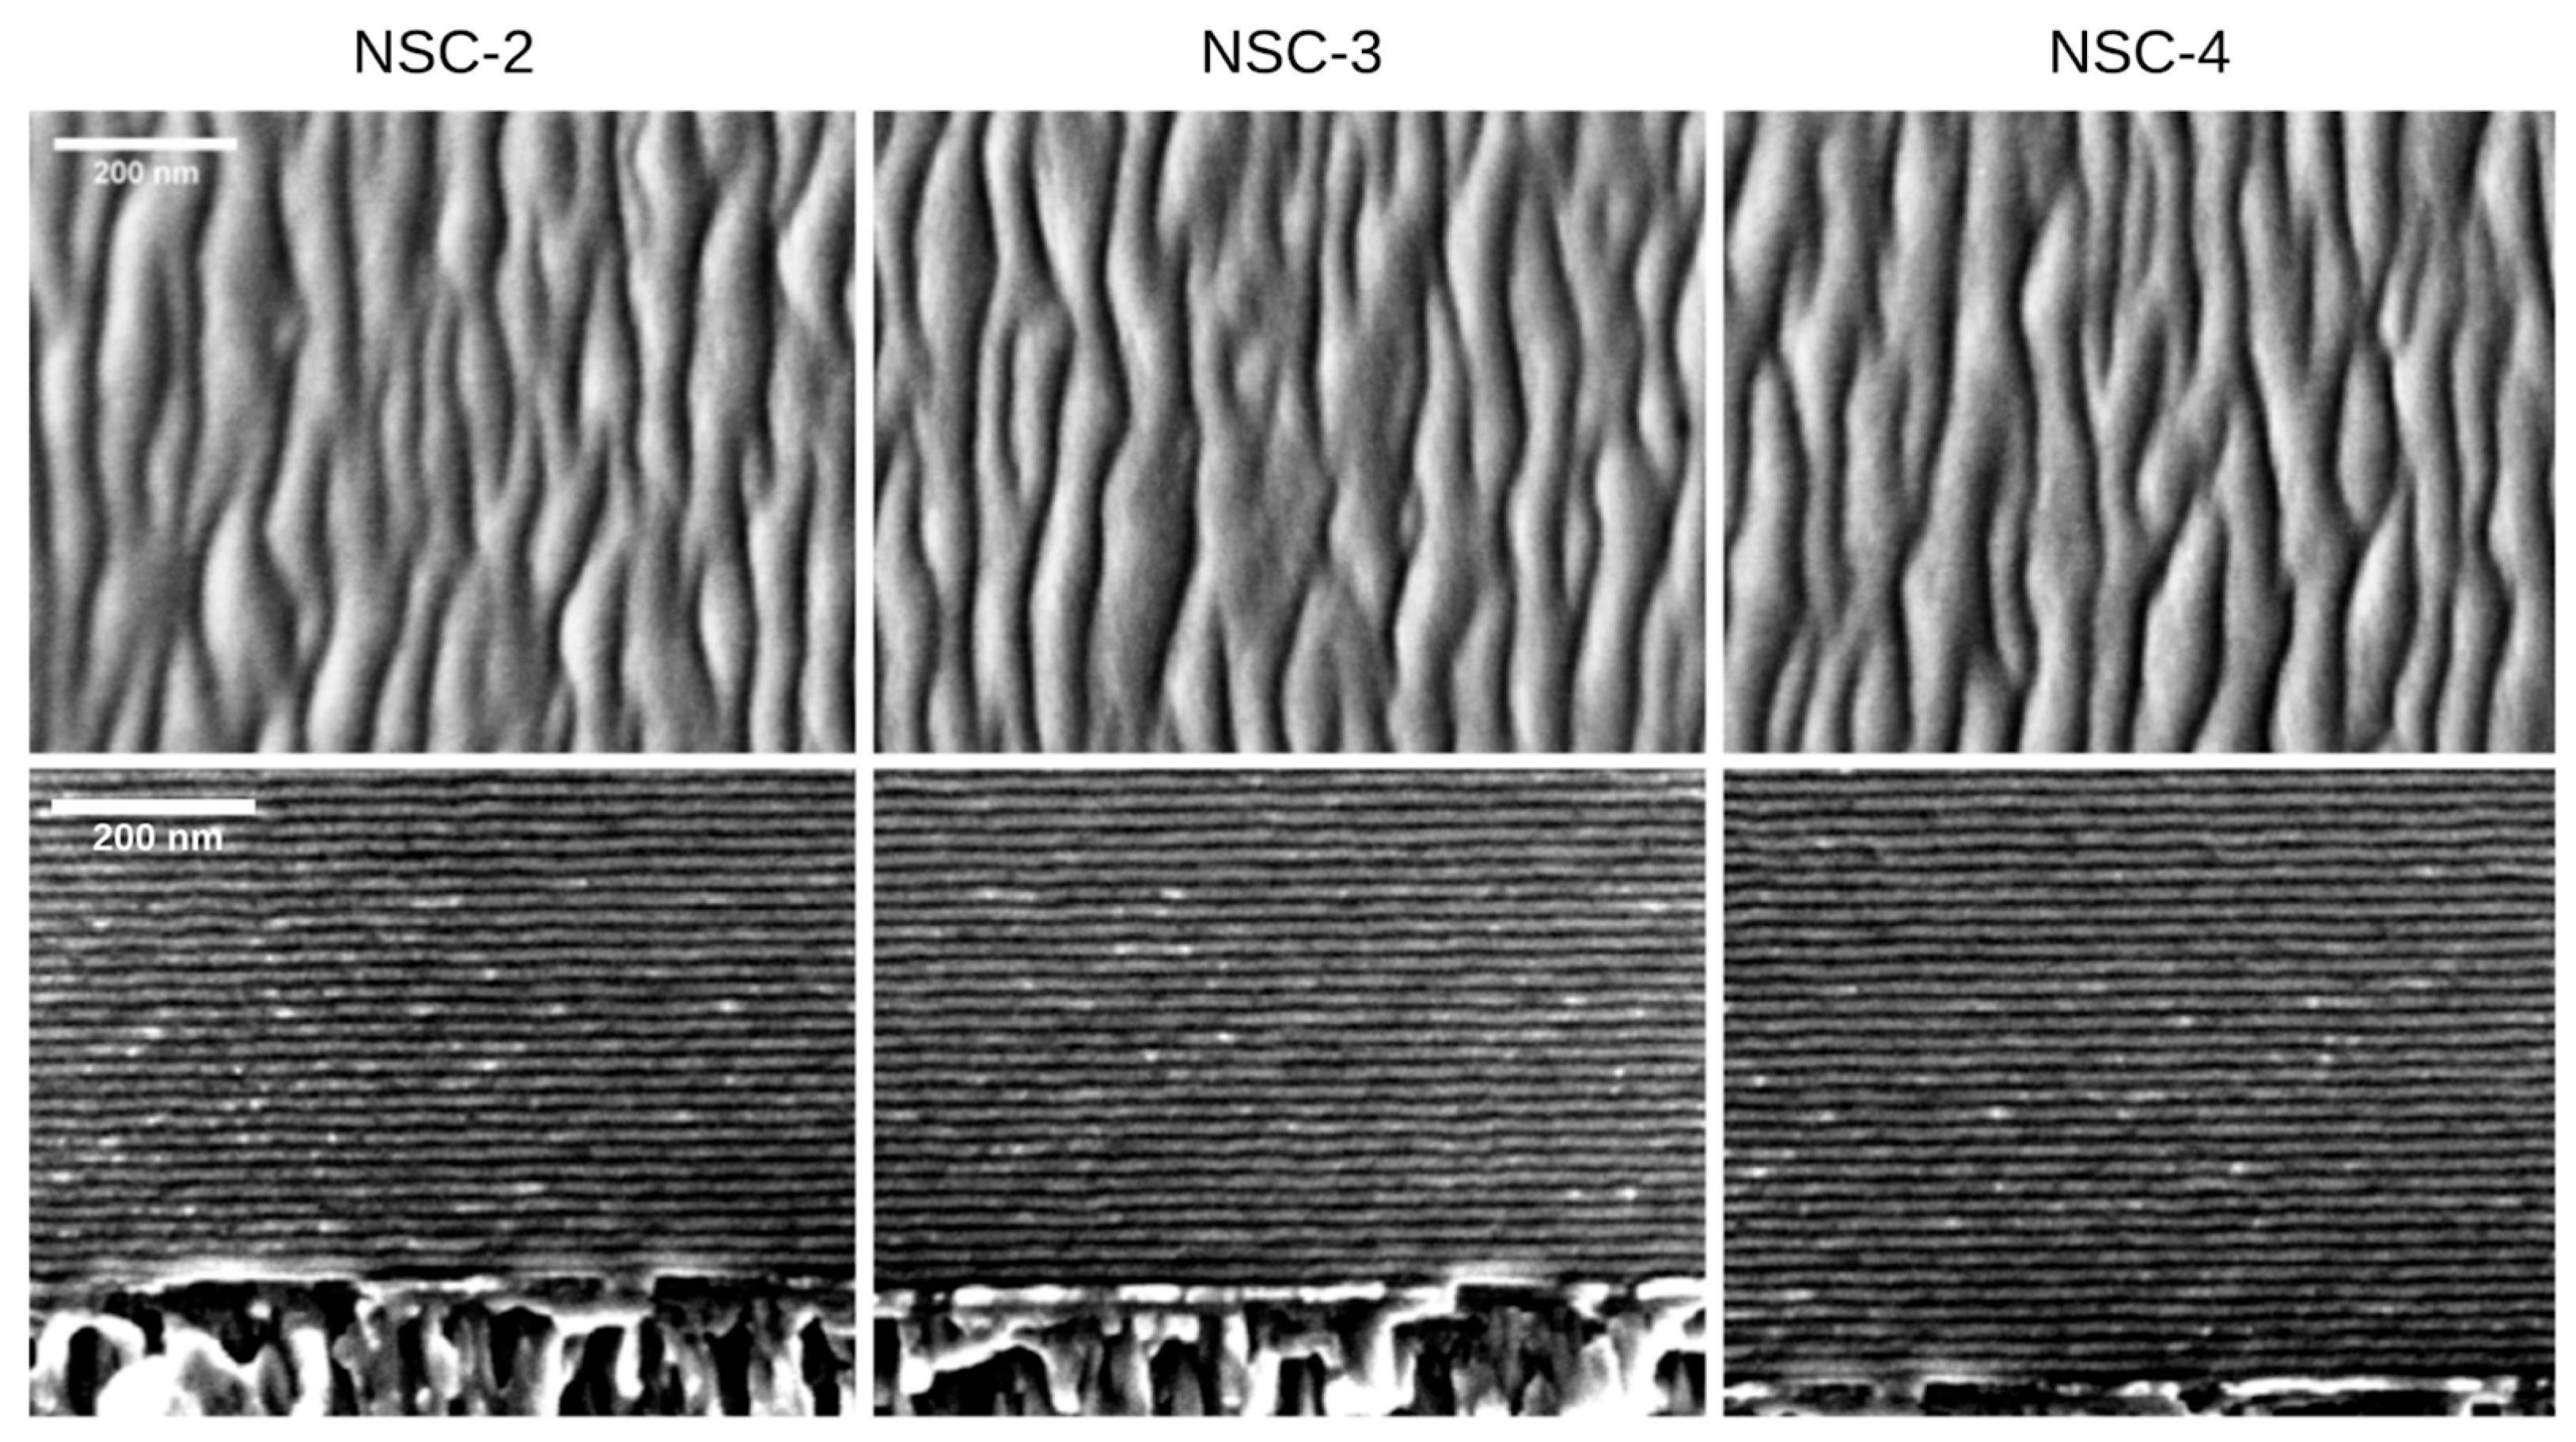
3.2. Scanning Electron Microscopy Study of the NSC Samples

SEM plan view micrograph study revealed a one-directional undulating anisotropic morphology pattern as surface roughness waves. The undulating bands cover the entire SEM image height of about 1360 nm (View Field Width parameter, ImageJ software 1.52v). The average wavelength was 49.85 nm with wavelengths ranging between 1.28 and 81.35 nm (NSC-1 sample). The narrow-band pattern had a high aspect ratio of approximately 27:1. The one-directional undulating surface pattern indicates that the coating morphology is governed by a combination of directional growth influences, strain effects, and atomic-scale self-organization mechanisms (Figure 1 and Figure 2). The pattern was not sensitive to substrate temperatures within the 350–400 °C range.
The undulating morphology might be the result of the combined effects of atomic shadowing, strain-driven instabilities, and limited surface diffusion during HiPIPMS-PVD growth of the bilayered {TiAlSiNb-N/TiCr-CN}n superlattice. Oblique flux incidence could give rise to self-shadowing and preferential columnar growth, while interfacial strain accumulation between alternating sublayers might drive periodic surface modulation through a mechanism resembling the Asaro–Tiller–Grinfeld instability [27,28,38]. Limited adatom mobility may further enhance surface roughness via kinetic roughening. Such anisotropic morphology could give rise to direction-dependent tribological behavior, potentially reducing friction along undulation ridges and increasing it in the perpendicular direction, with consequences for wear and energy dissipation [39,40,41]. Furthermore, the nanoscale periodicity (49–52 nm) might influence stick–slip dynamics and contribute to directional boundary lubrication by guiding lubricant flow along preferred paths.

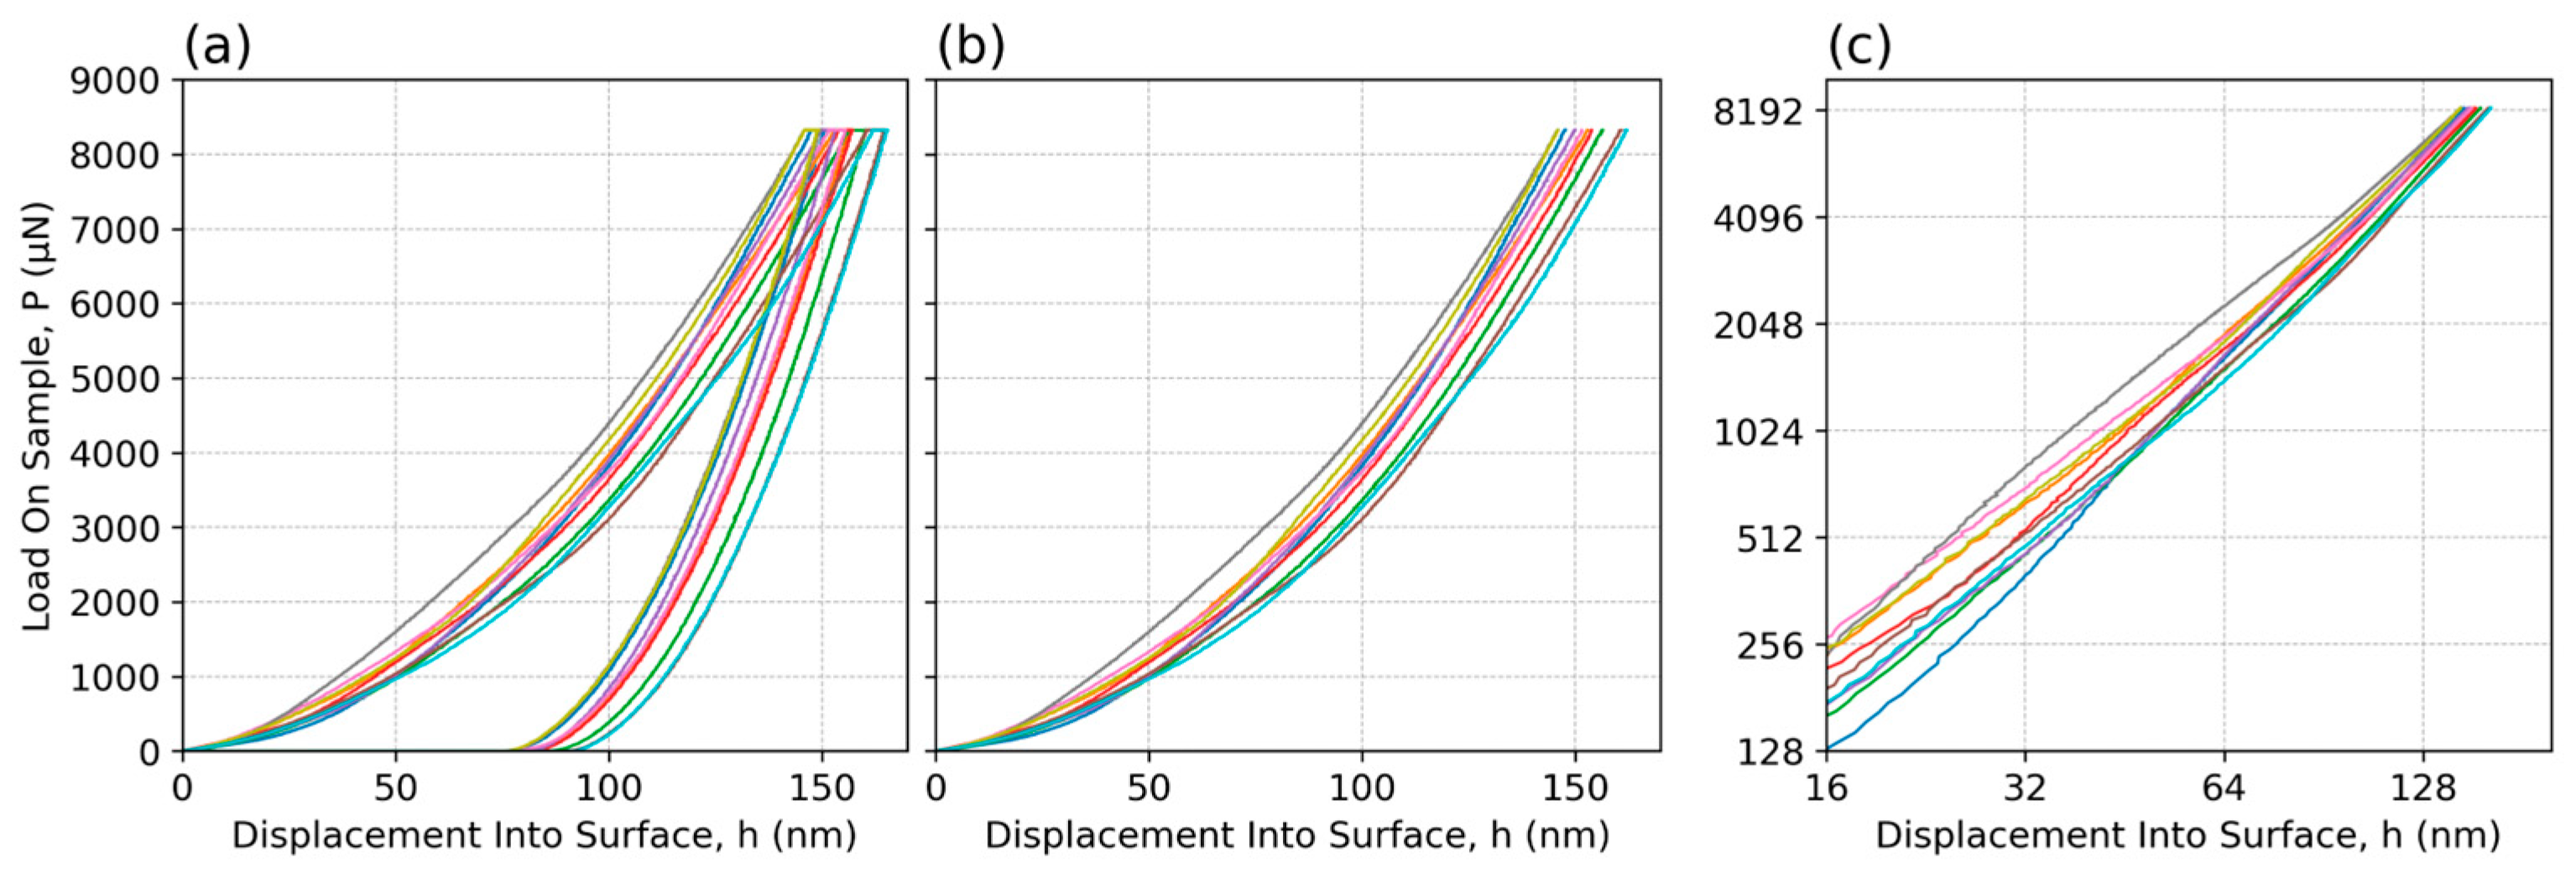
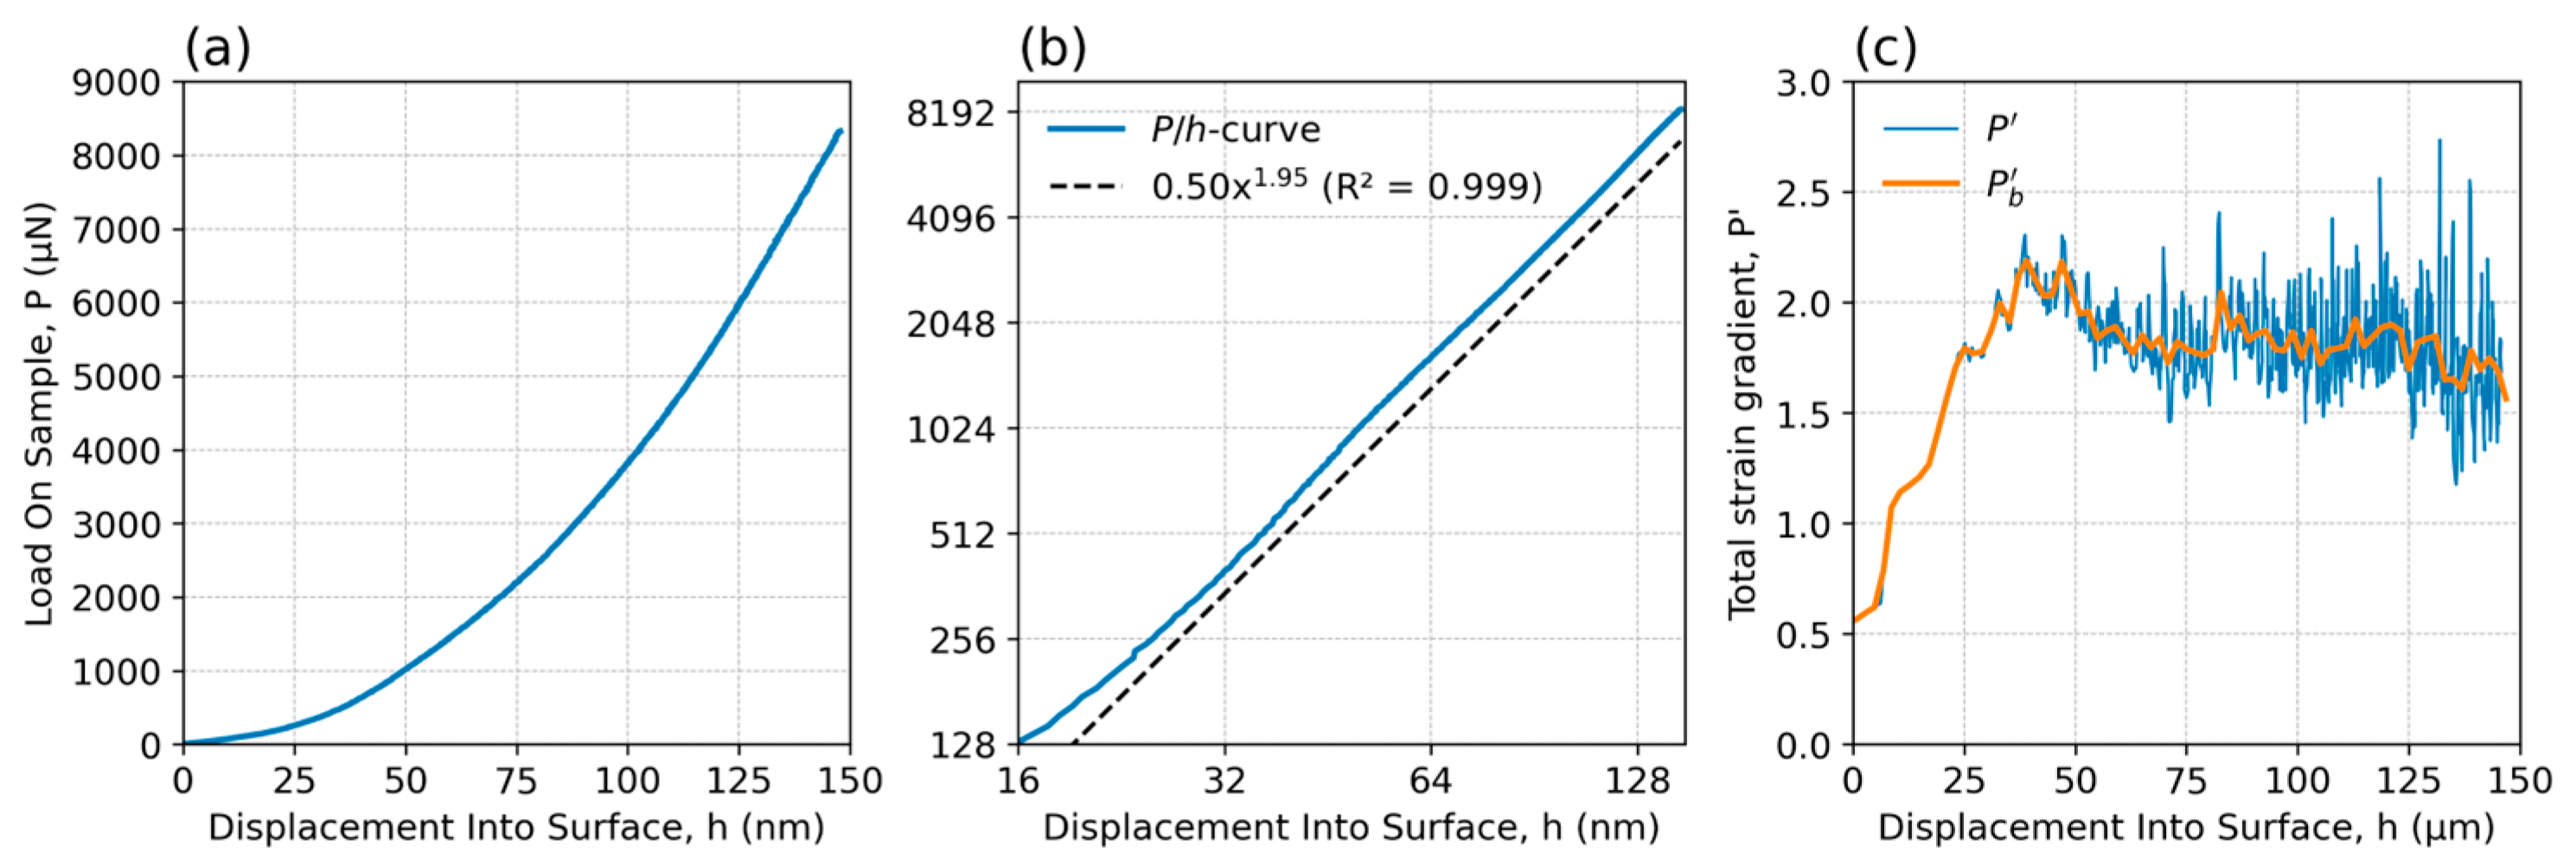
3.3. Nanoindentation Response Analysis Using the Loading Segment P/h-Curves Obtained at the Testing Peak Load of 8000 µN

A total of 40 nanoindentation experiments were performed on the four selected NSC samples within a single measurement session to ensure identical measurement conditions and comparability of results. Load–displacement data were obtained using a peak testing load of 8000 µN. For each NSC sample, an indentation matrix comprising ten precisely defined positions with coordinates (Xi, Yi) was carefully selected using optical microscopy, targeting the smoothest available surface areas. Each indentation position was spaced approximately 4000 nm apart to avoid potential interactions between adjacent indentations. In total, ten indentation experiments were conducted per NSC sample, resulting in load–displacement data comprising 2600 measurement readings.
The load–displacement P/h-curves obtained during the nanoindentation experiments can be described as load–displacement loops (LDLs), each consisting of four consecutive segments (Figure 3). The first segment corresponds to the loading phase, during which the applied load increases at a constant rate. This is followed by the drift segment, where the load is held constant at its peak value. Next, the unloading segment gradually reduces the load at the same rate as the loading phase, and finally, the indenter returns to its initial position. Note that while point markers and error bars have been omitted for clarity, the relative standard deviation for the P/h-curves at fixed peak load typically fell within the range of 3%–7%.
In the following, we present a detailed analysis of the loading segment of LDLs using Meyer’s power law model [40]. The P/h-curves were found to approximate Meyer’s power law, expressed by the relationship P = C × h^n (cf. Figure 3c). Meyer’s power law, first proposed by Meyer in 1908, represents the earliest attempt to relate applied load to indentation size [40]. Unlike Kick’s law, which assumes a parabolic load–displacement relationship with an exponent n = 2 [39], Meyer’s law provides more flexibility through its general power–law form, making it a more powerful tool for describing load–displacement behavior over a wider range of indentation depths. The constant C depends on the elastic–plastic properties of the coating and, to some extent, on the indenter geometry. It can be interpreted as a “hardness coefficient” reflecting the inherent hardness characteristics of the material under investigation. The exponent n, known as Meyer’s index, shapes the curvature of the load–displacement P/h-curve. The physical interpretation of n is closely tied to the indentation size effect (ISE) and the work-hardening characteristics of the material. If n < 2, this typically corresponds to the normal ISE observed in most nanoindentation experiments on hard materials due to factors like geometrically necessary dislocations (GNDs) accumulating under small volumes of deformation. At smaller indentation volumes, the density of GNDs needed to accommodate the strain gradients, which are inherently promoted by the indenter geometry and amplified by the interfaces, would be higher, leading to an effectively greater resistance to plastic deformation (i.e., higher hardness). The complex nanostructure of the superlattice, with its high density of interfaces and confined layers, naturally creates conditions for significant strain gradients to develop. If n = 2, the relationship is equivalent to Kick’s Law, where ISE is absent, and hardness is independent of the indentation load (P) or size (d, h). If n > 2, the material exhibits reverse ISE (RISE), often pertaining to bulk, ductile materials where significant plastic deformation and work hardening occur within the indented volume, causing the material to resist further deformation more strongly as the indent grows larger and deeper.
Analysis of our NSC samples revealed that n tended to increase with increasing indentation depth within the n-interval n ∈ (0.5, 2.0). The exponent n was estimated for individual P/h-curves obtained from the corresponding indentation matrix under the peak load of 8000 µN (Table 3, Figure 4). The calculations were performed for four consecutive depth intervals that together span nearly the entire maximum indentation depth, hmax. Since Meyer’s law is best examined using log–log coordinates, logarithmically equal-length h-intervals were selected. Within each h-interval, the power law holds almost exactly, as indicated by the R-squared value of the power trendline, which reaches up to 0.999. The average values of n calculated for these intervals gradually increase as h increases (Figure 3c), demonstrating that a non-truncated single power law does not hold consistently across the entire indentation depth—in fact, the exponent n is a function of h. This behavior is held for all investigated NSC samples.

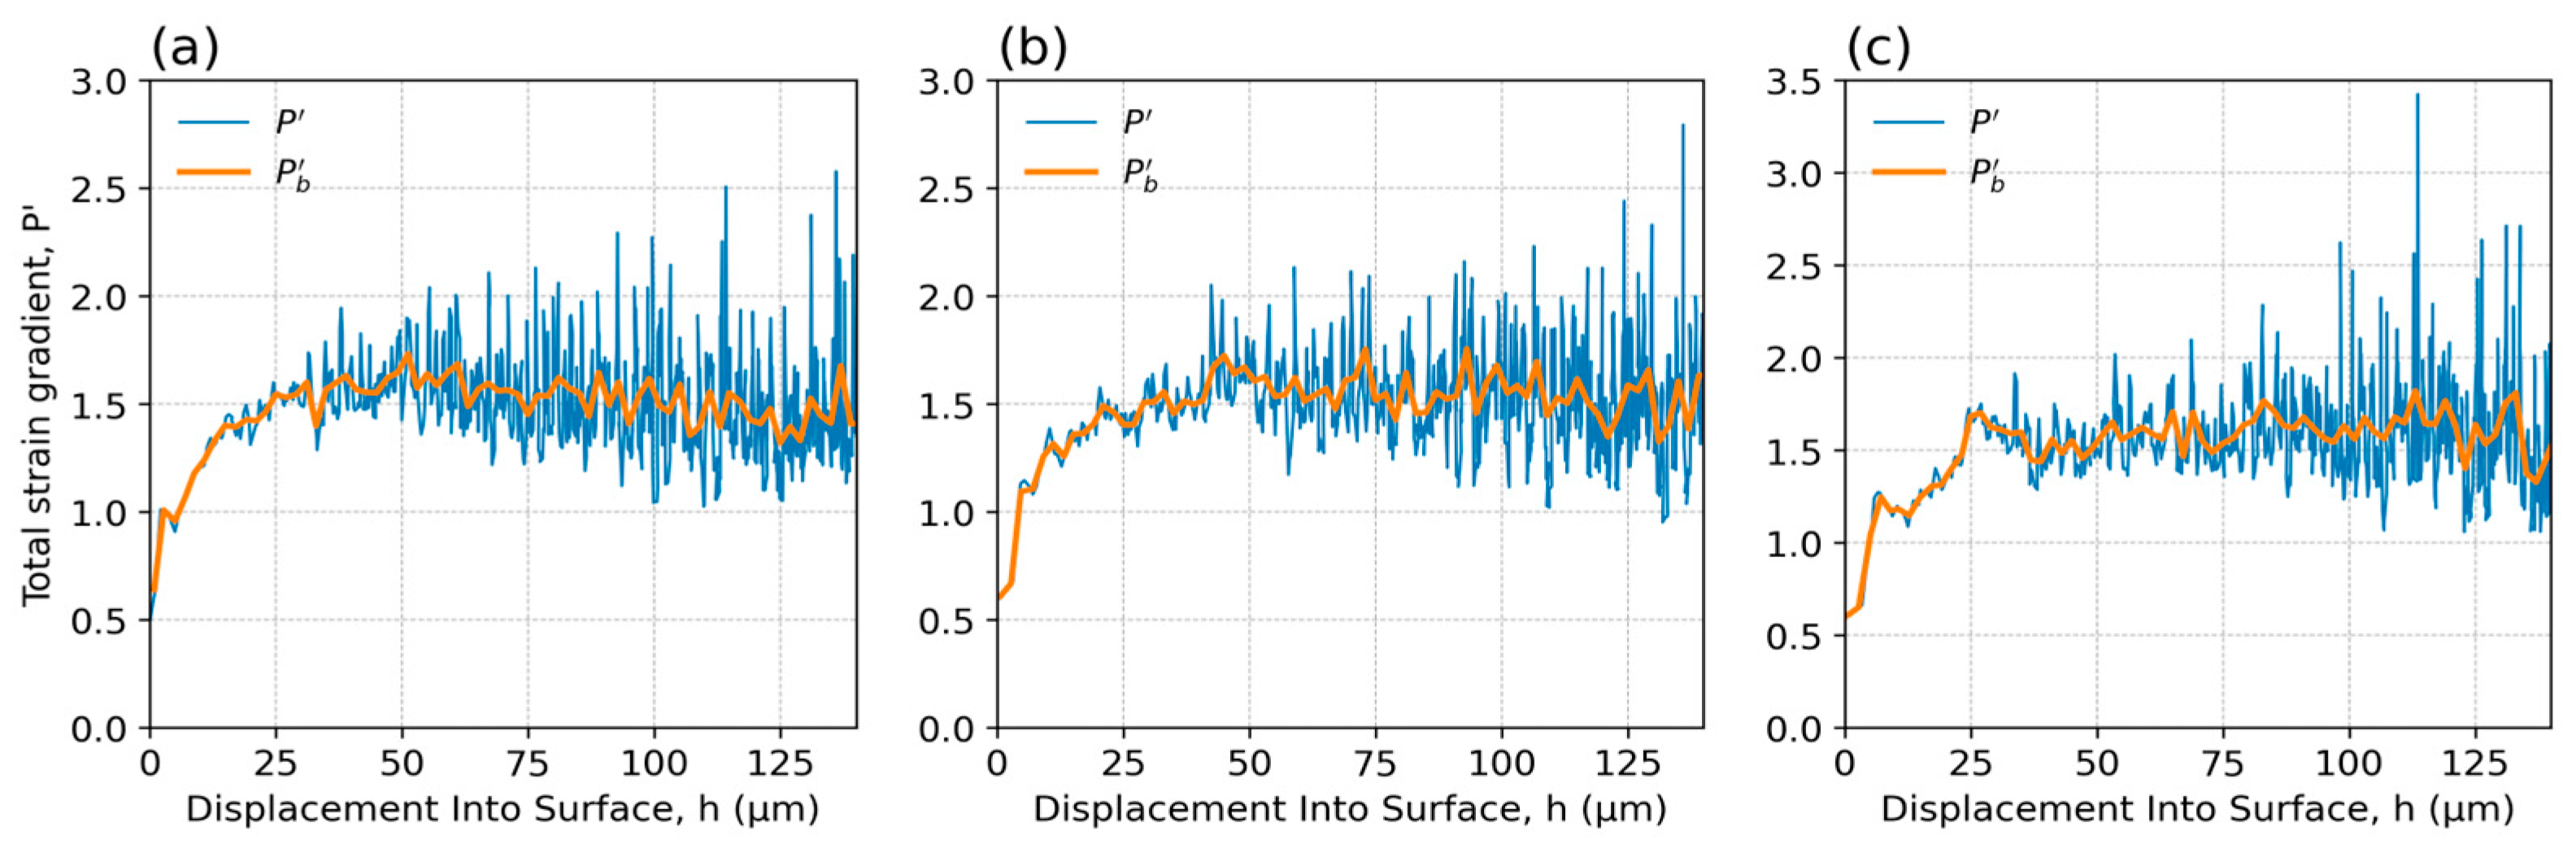
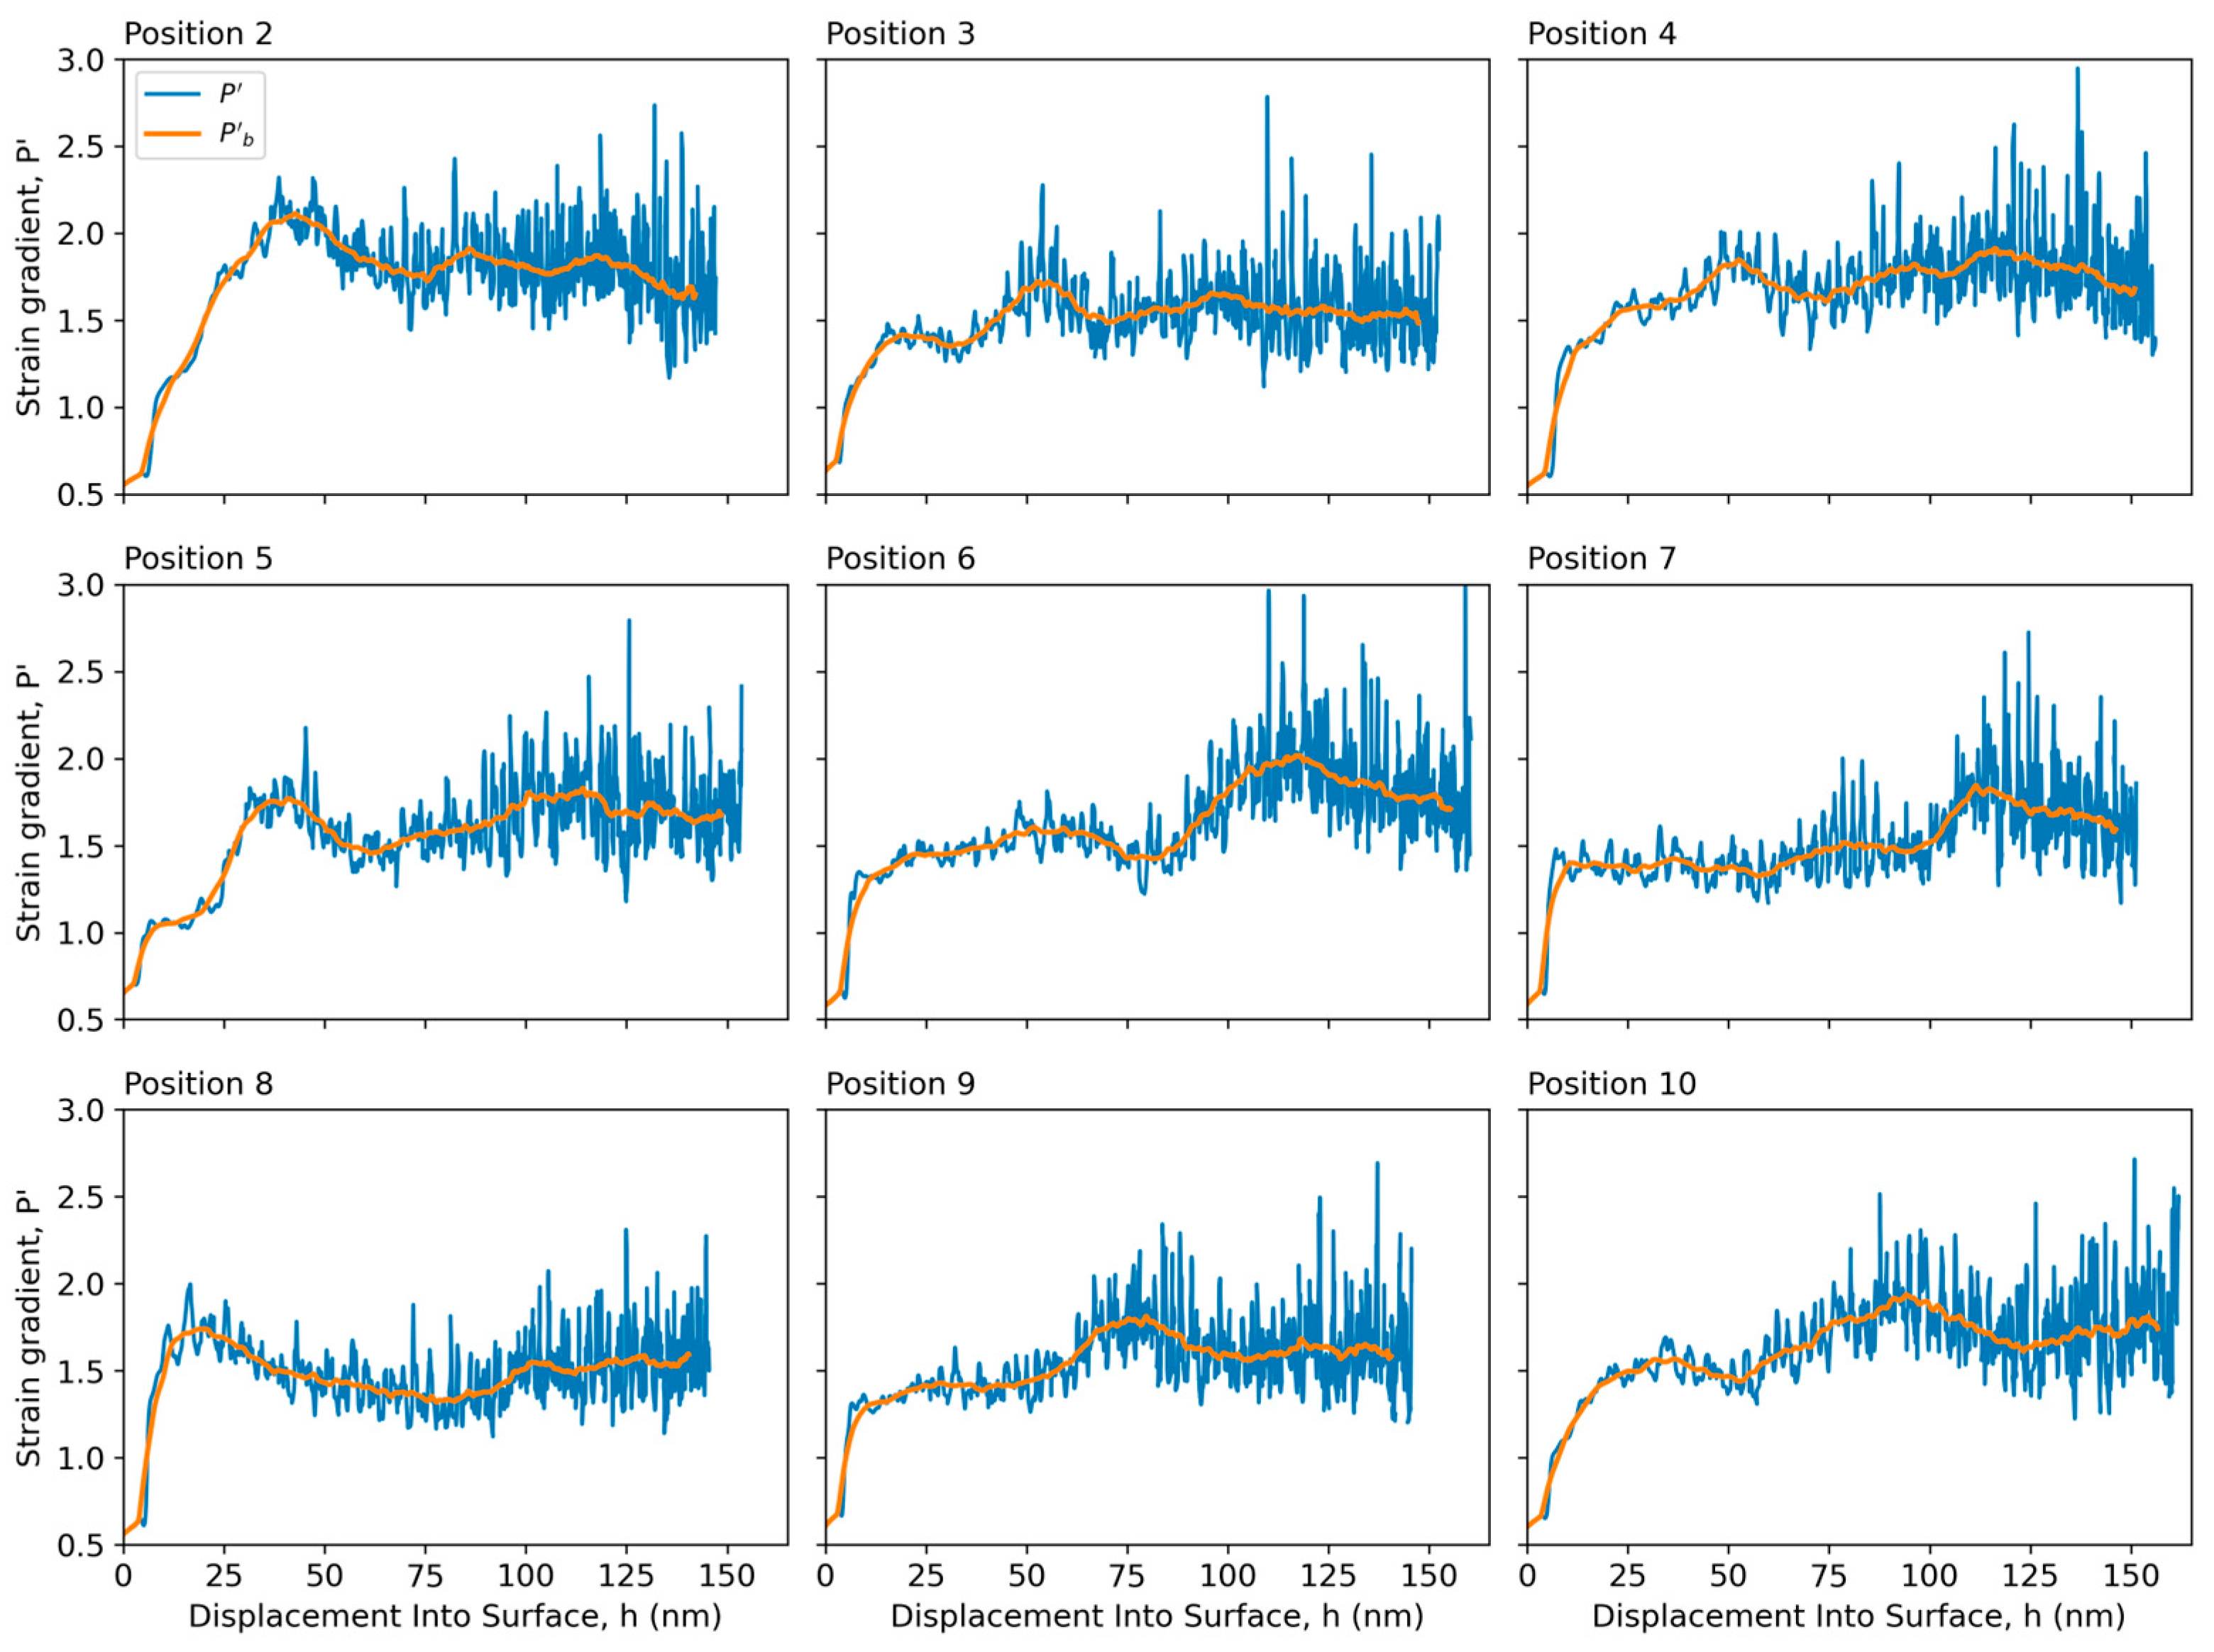
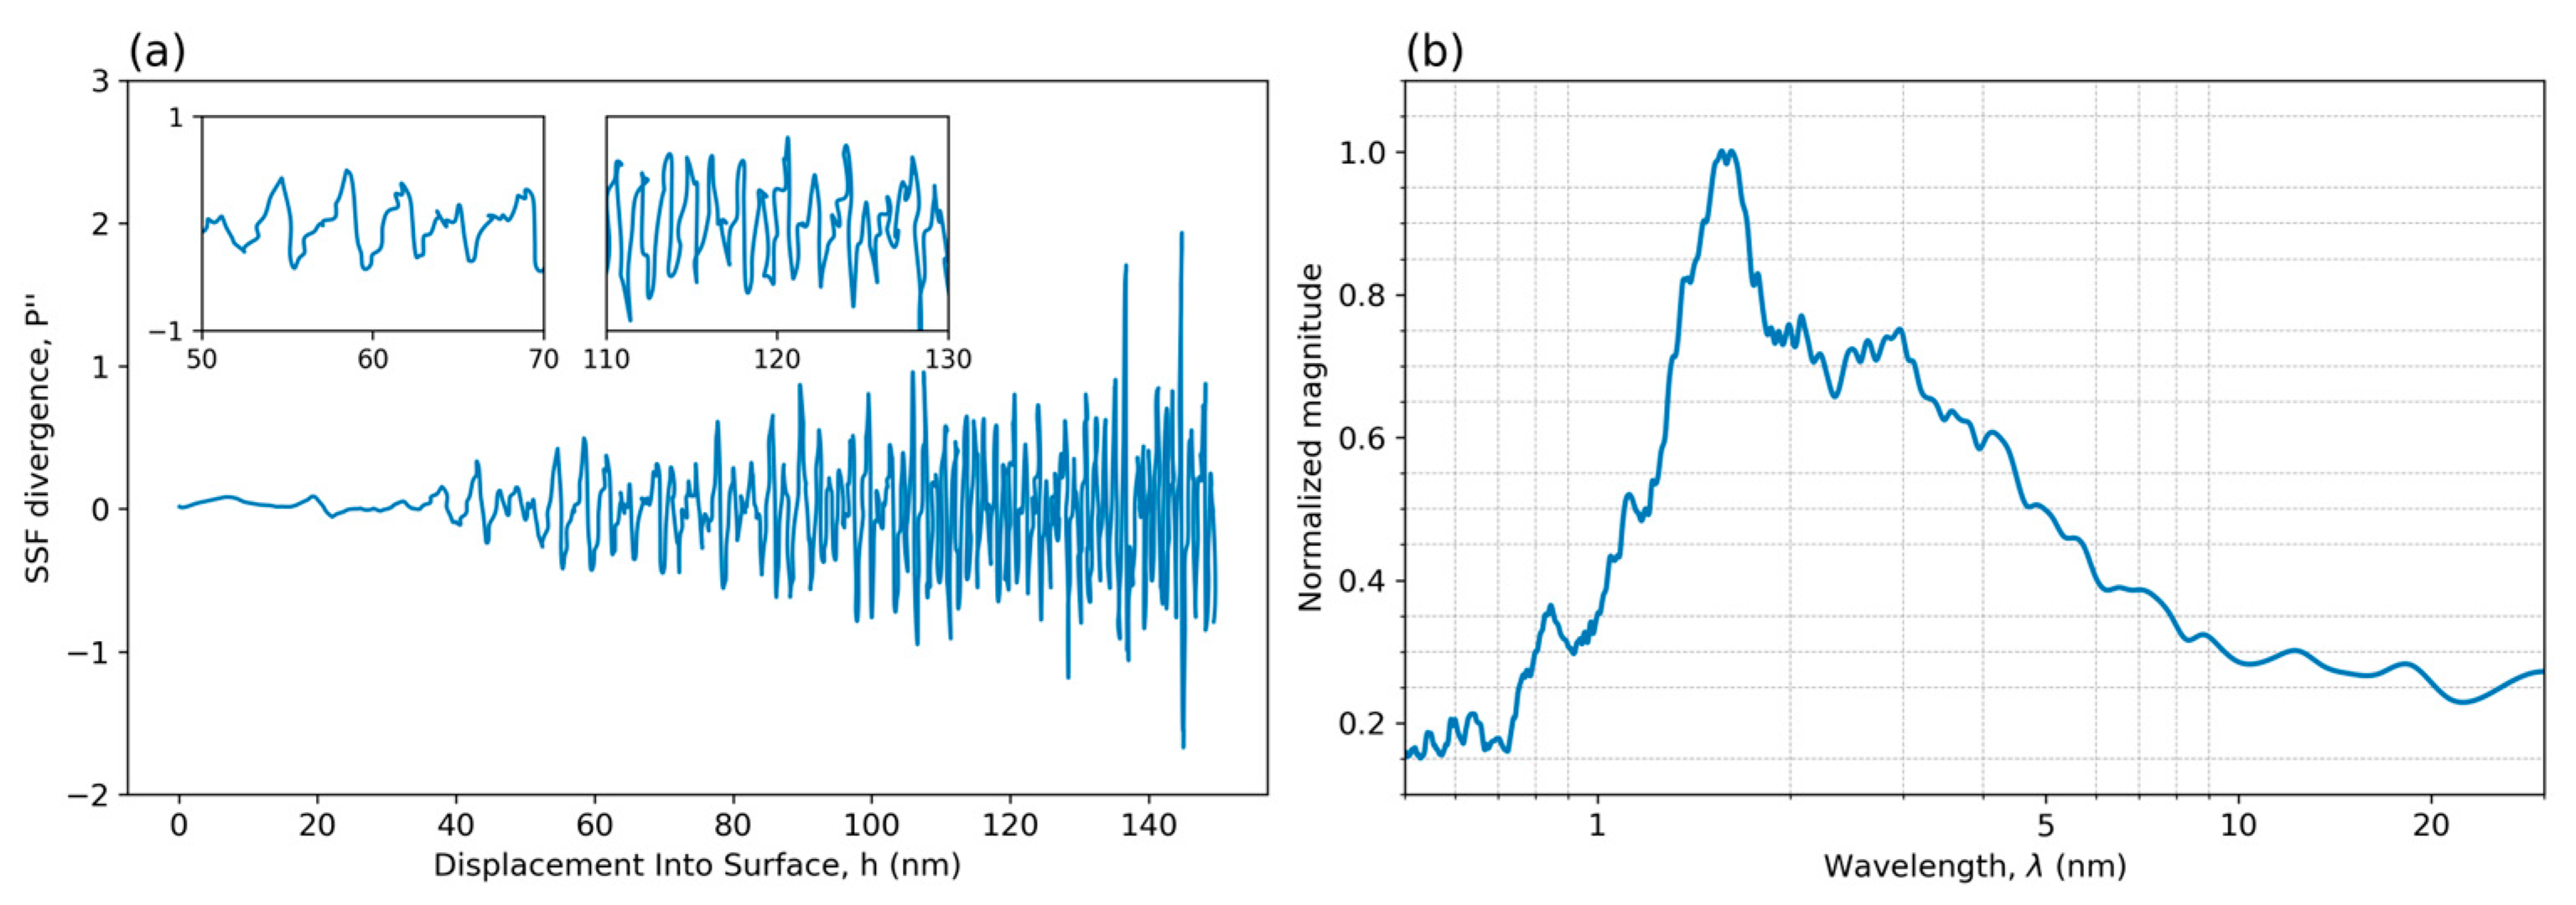
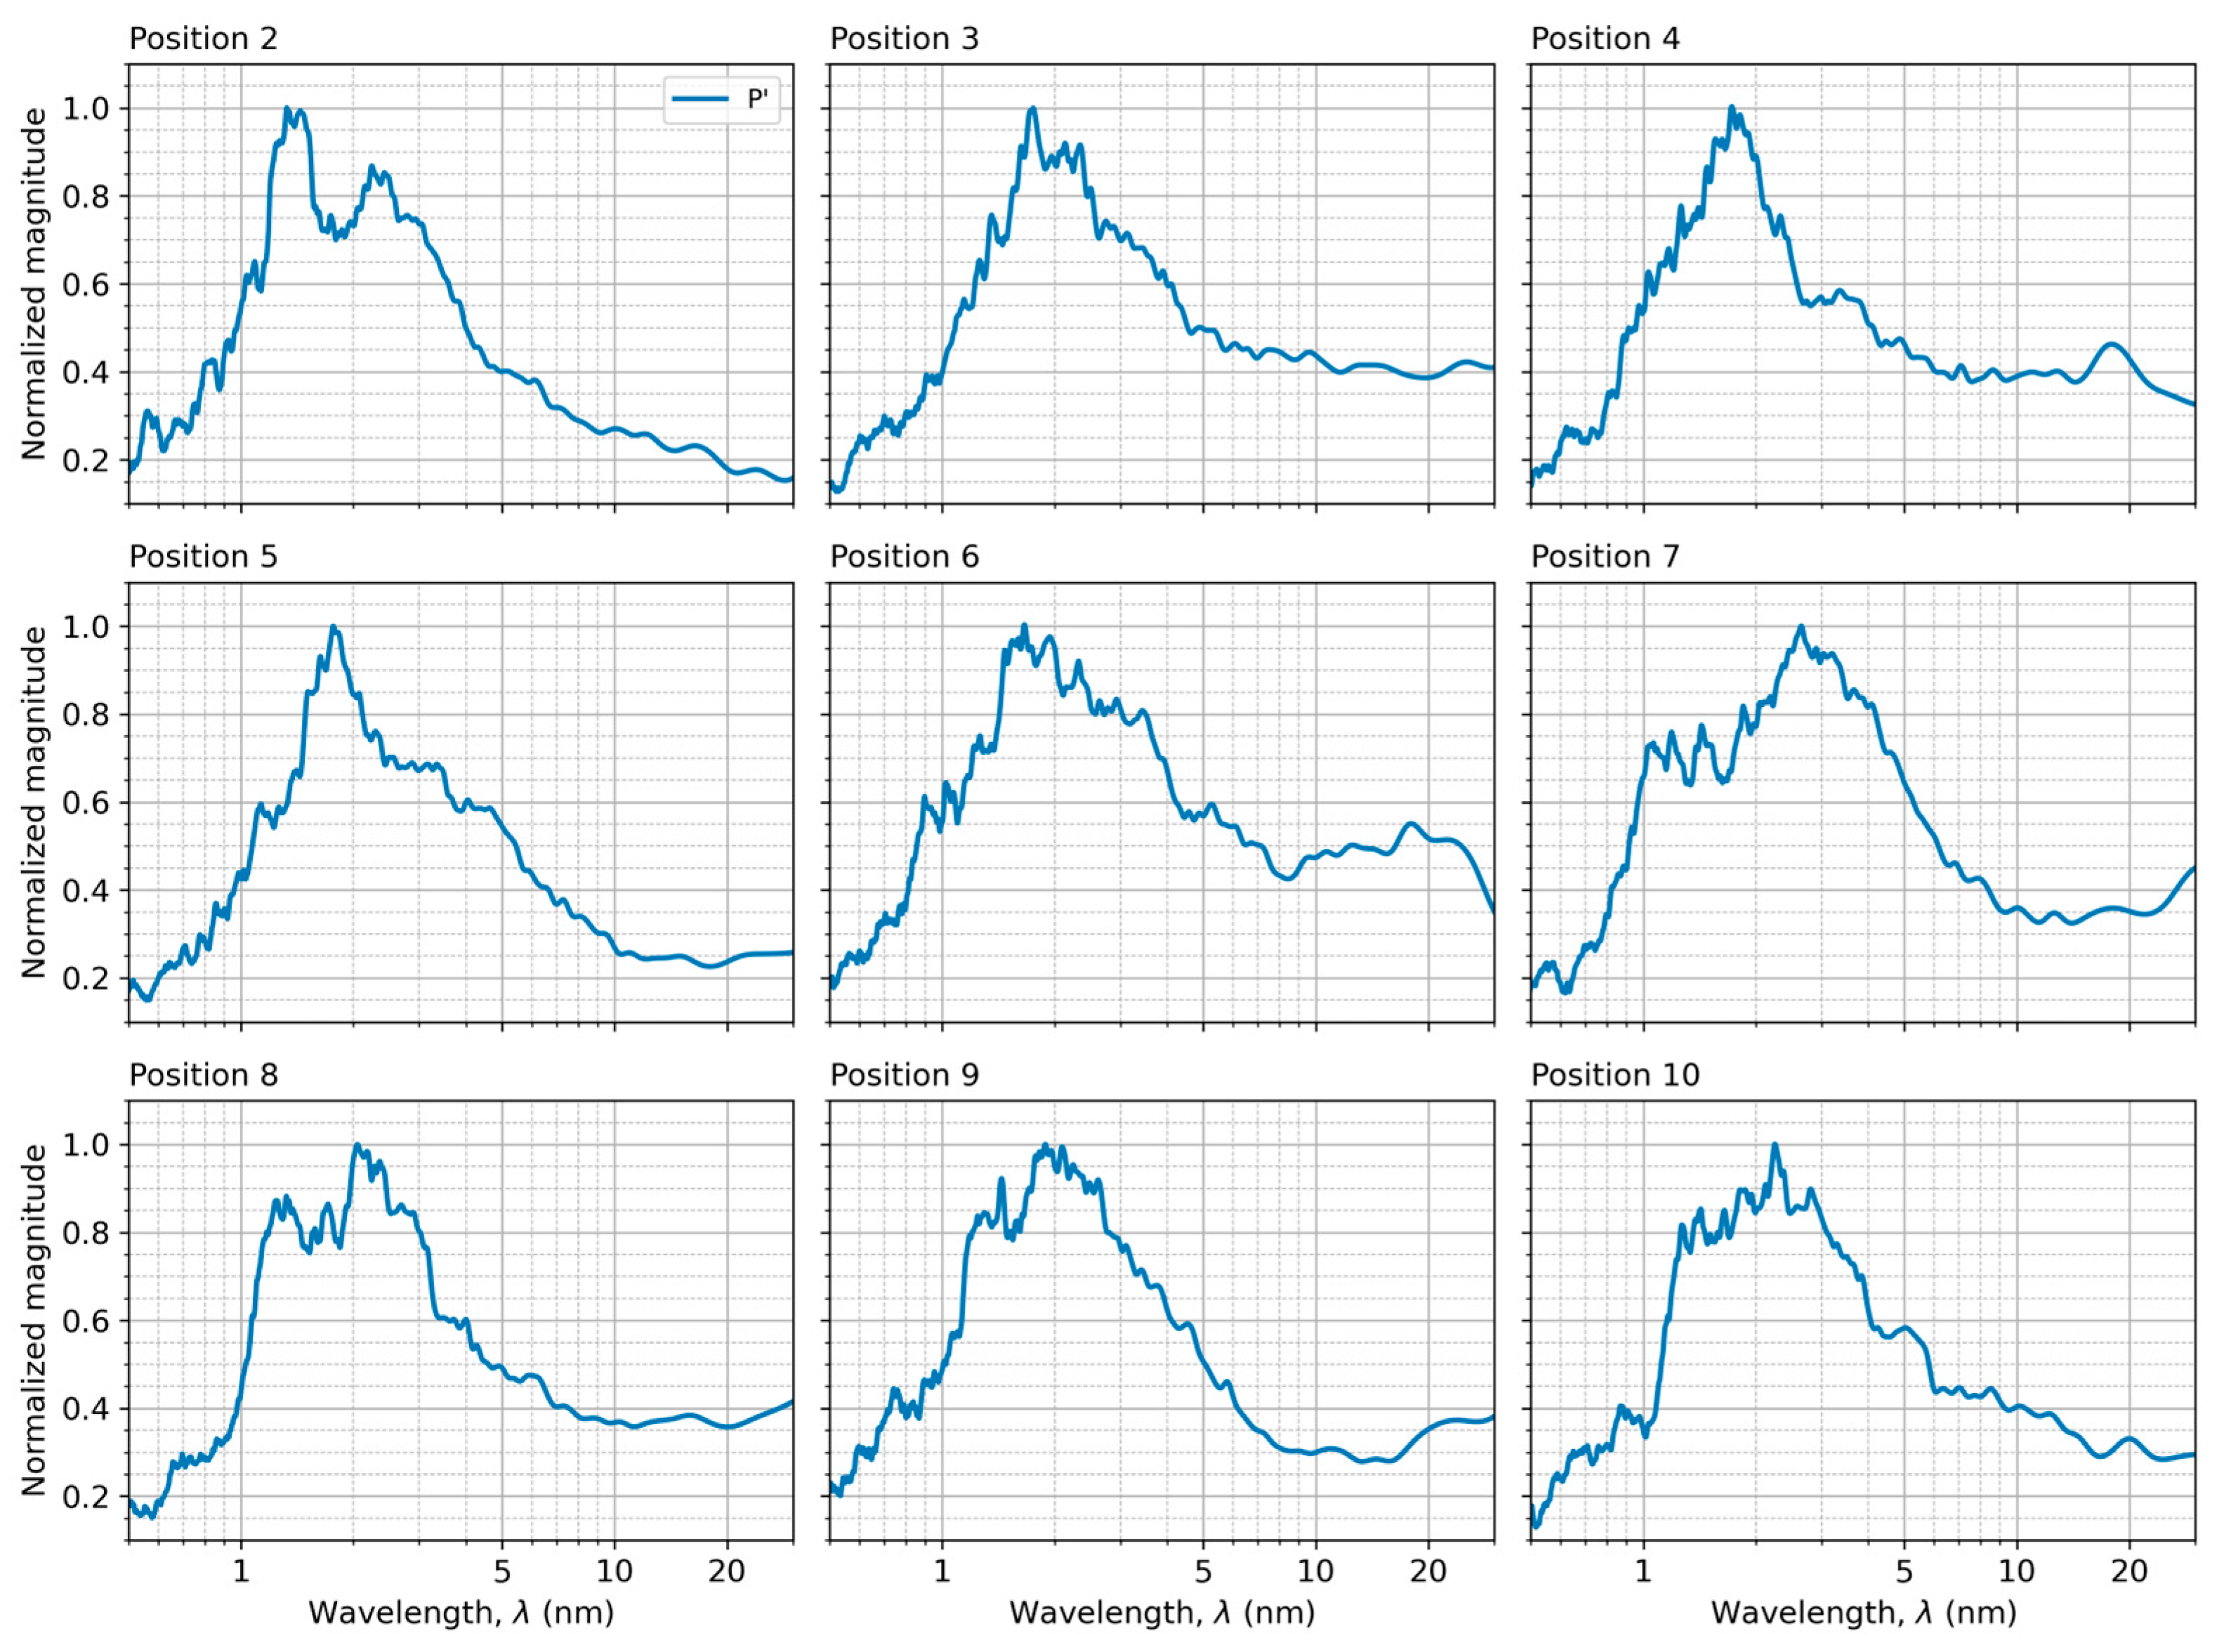
3.4. SSF Gradient P′/h-Profiles and Their Fine Structure

While Meyer’s law is commonly applied in the analysis of bulk material behavior, its usefulness in instrumented depth-sensing indentation experiments has been limited by the lack of a clear physical interpretation of the typically non-integer exponent n. As Froehlich et al. noted, this law is often used from a purely empirical standpoint [41]. In the following, we propose a new interpretation: the exponent n can be understood as representing the SSF total gradient, containing both elastic and plastic components of the gradient, which is strongly influenced by the microstructure of the coating. This physical interpretation also allows Meyer’s index n to serve as a meaningful parameter in studies of the mechanical properties of coatings, analyzing datasets measured by nanoindentation.
To this end, we relate the historical Meyer’s index, n, to the total strain gradient, P′/h-profile, which is calculated as the normalized derivative of the load–displacement P/h-curve using the expression (7) developed above but dropping the additive constant “−2”. Using this approach, we confirm that n (as represented by the P′/h-profile) is indeed not a constant throughout the indentation depth range but varies in a rather complex way with h (Figure 5). The P′/h-profiles revealed irregular oscillatory patterns resembling data structures typically observed in surface roughness measurements.
We considered two further aspects or components of the P′/h-profiles: The first one as a low-pass filtered, slowly undulating mean baseline component Pb(h) that we refer to as the total strain gradient profile’s fine structure (cf. Figure 5c). Secondly, we also considered the P′/h-profile’s high-pass filtered component Pd(h) that we refer to as the hyperfine structure; we analyzed the behavior of Pd(h) in greater detail in Section 3.5. This approach was intended to provide deeper insight into the strain-hardening and strain-softening behavior exhibited during nanoindentation, using a simplified mechanical framework for elastic–plastic deformation based on Hertzian contact theory [42].
Figure 6 shows irregular oscillatory patterns in P′/h-profiles, and their fine structure holds across the other three NSC samples. Figure 7 demonstrates similarly irregular oscillations in the corresponding P″/h-profiles representing stress–strain field (SSF) divergence.

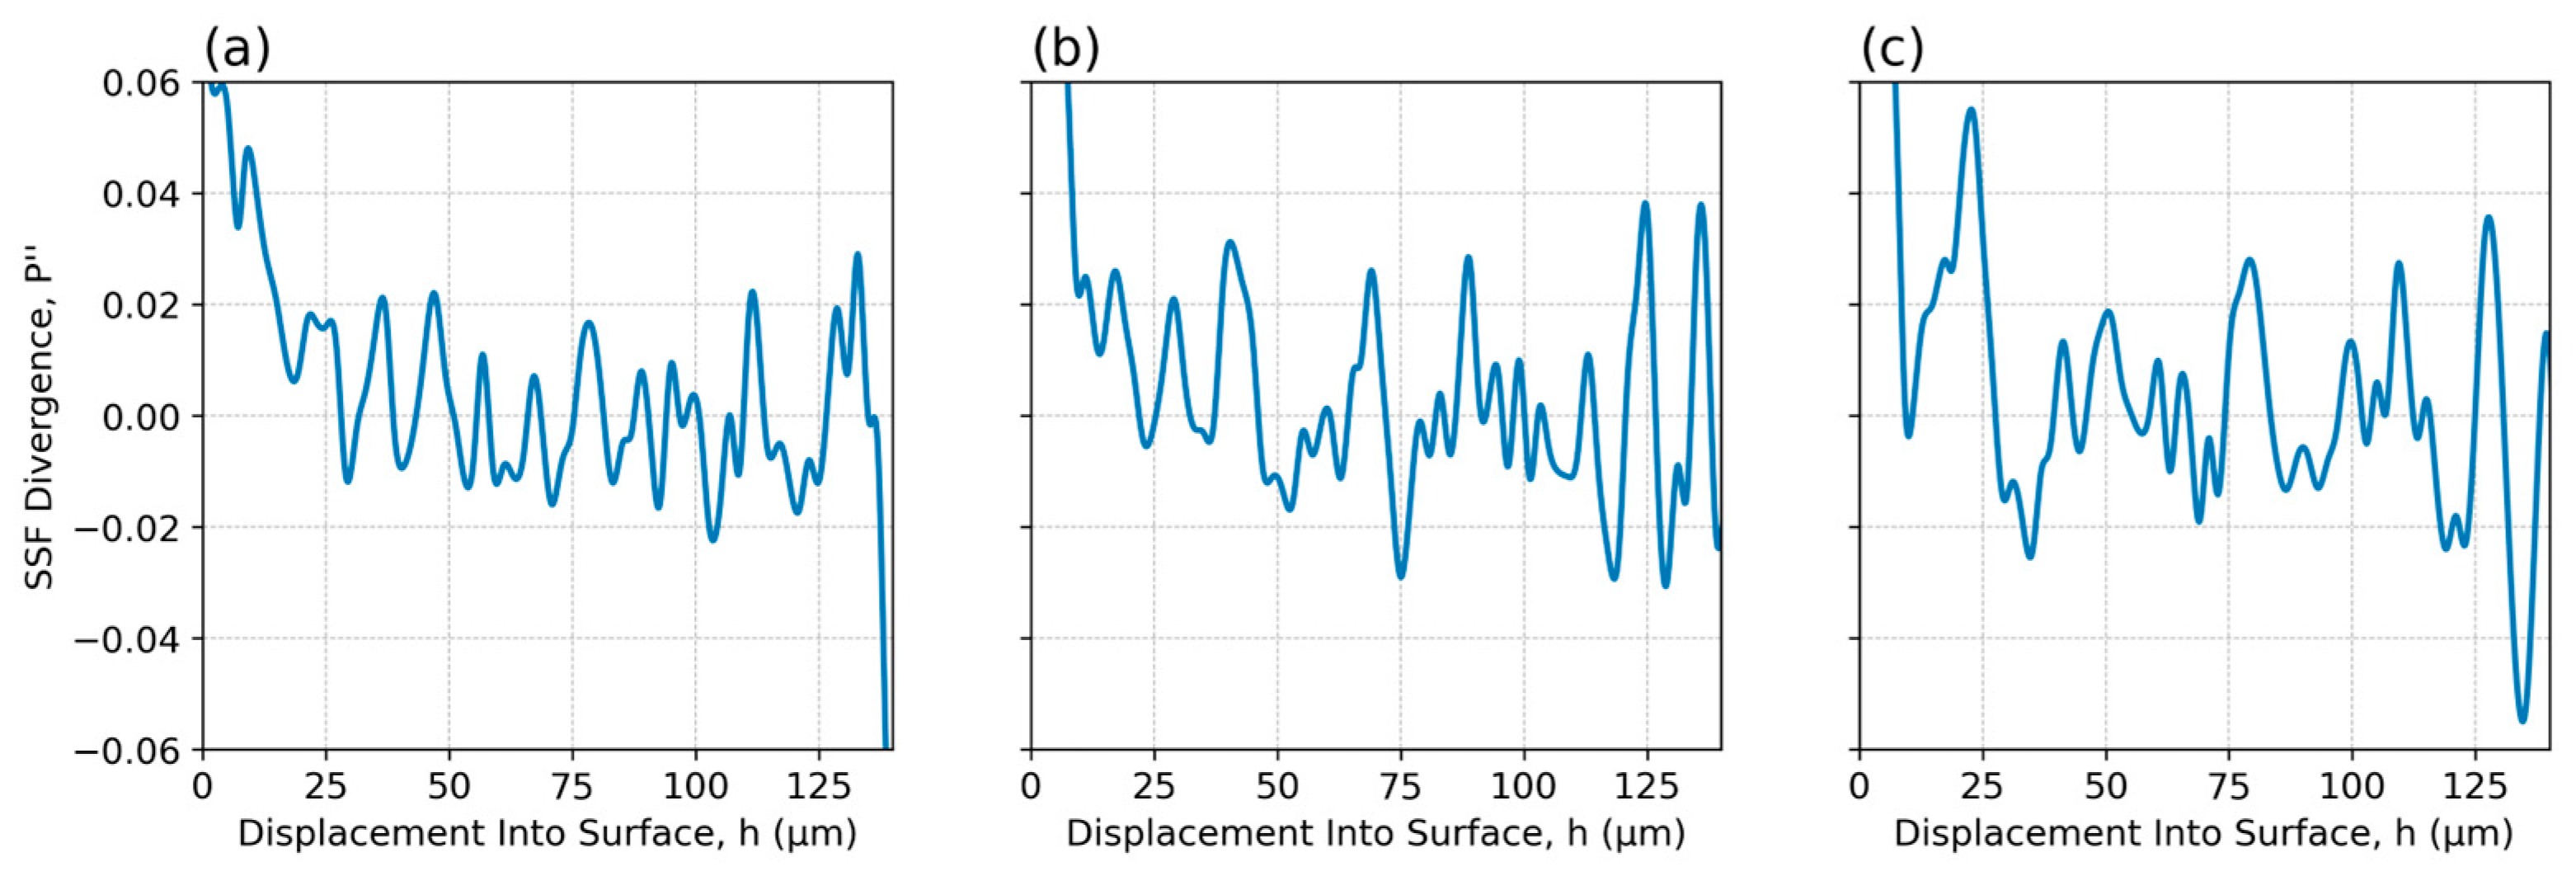
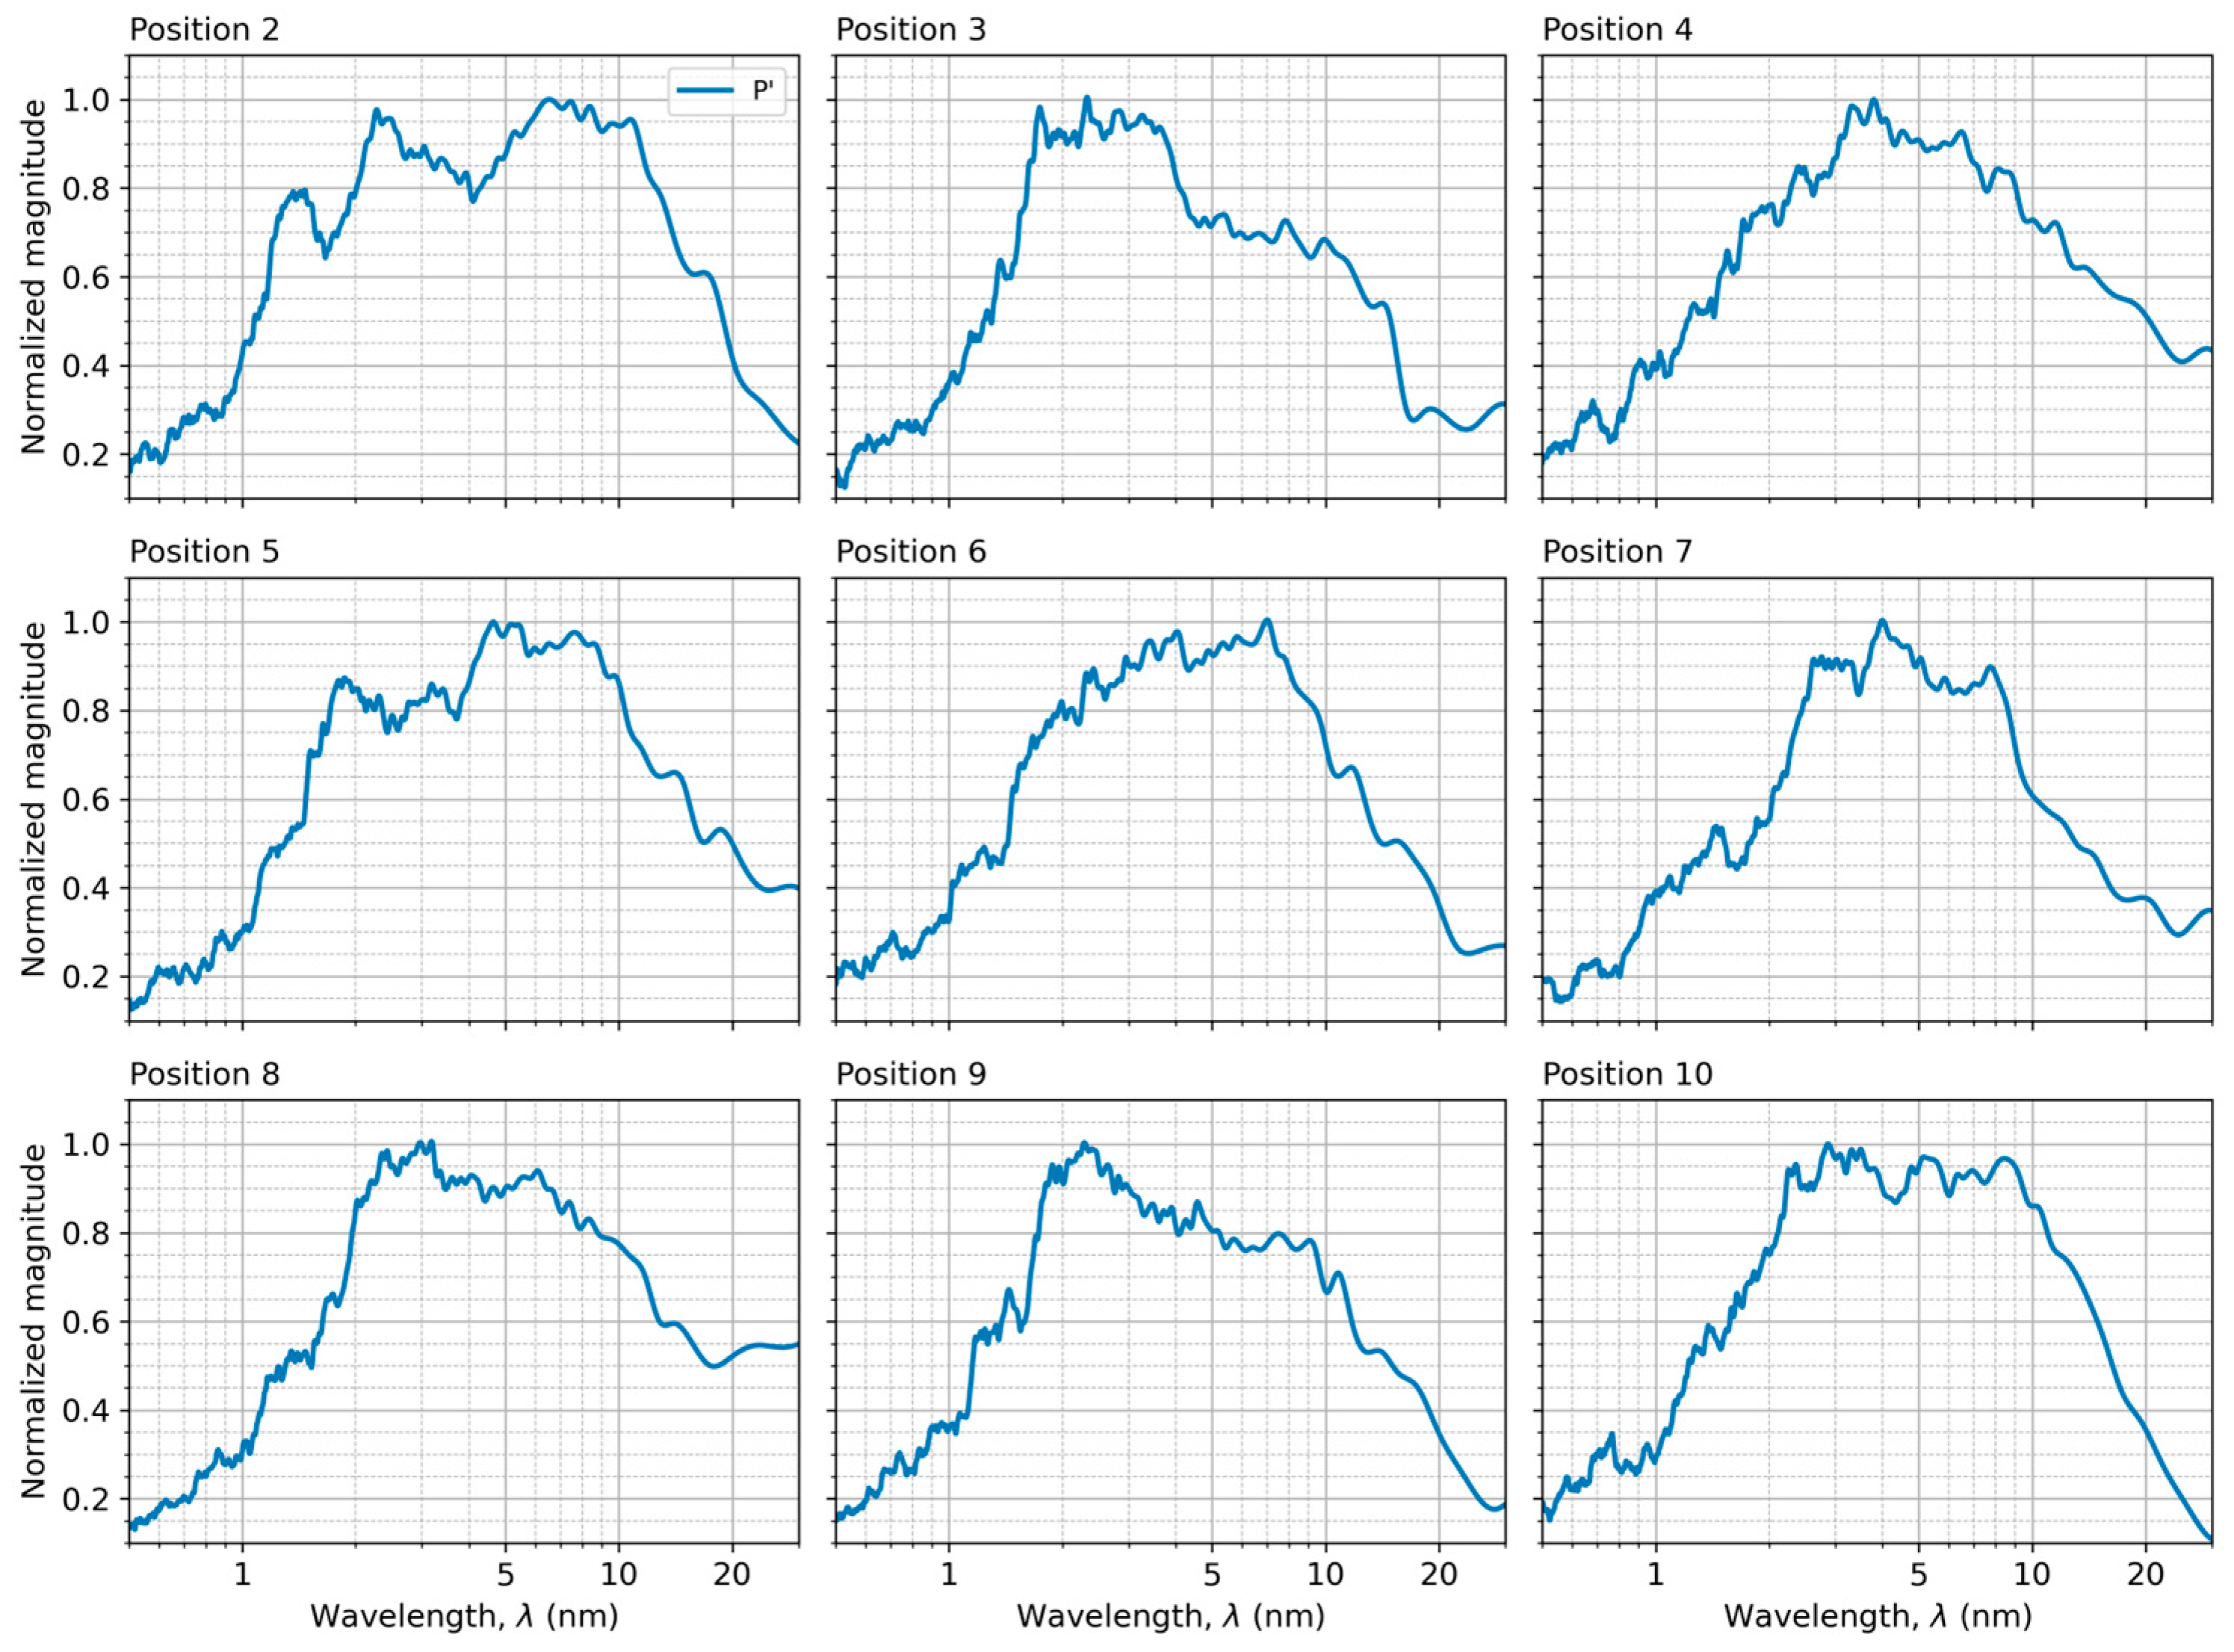
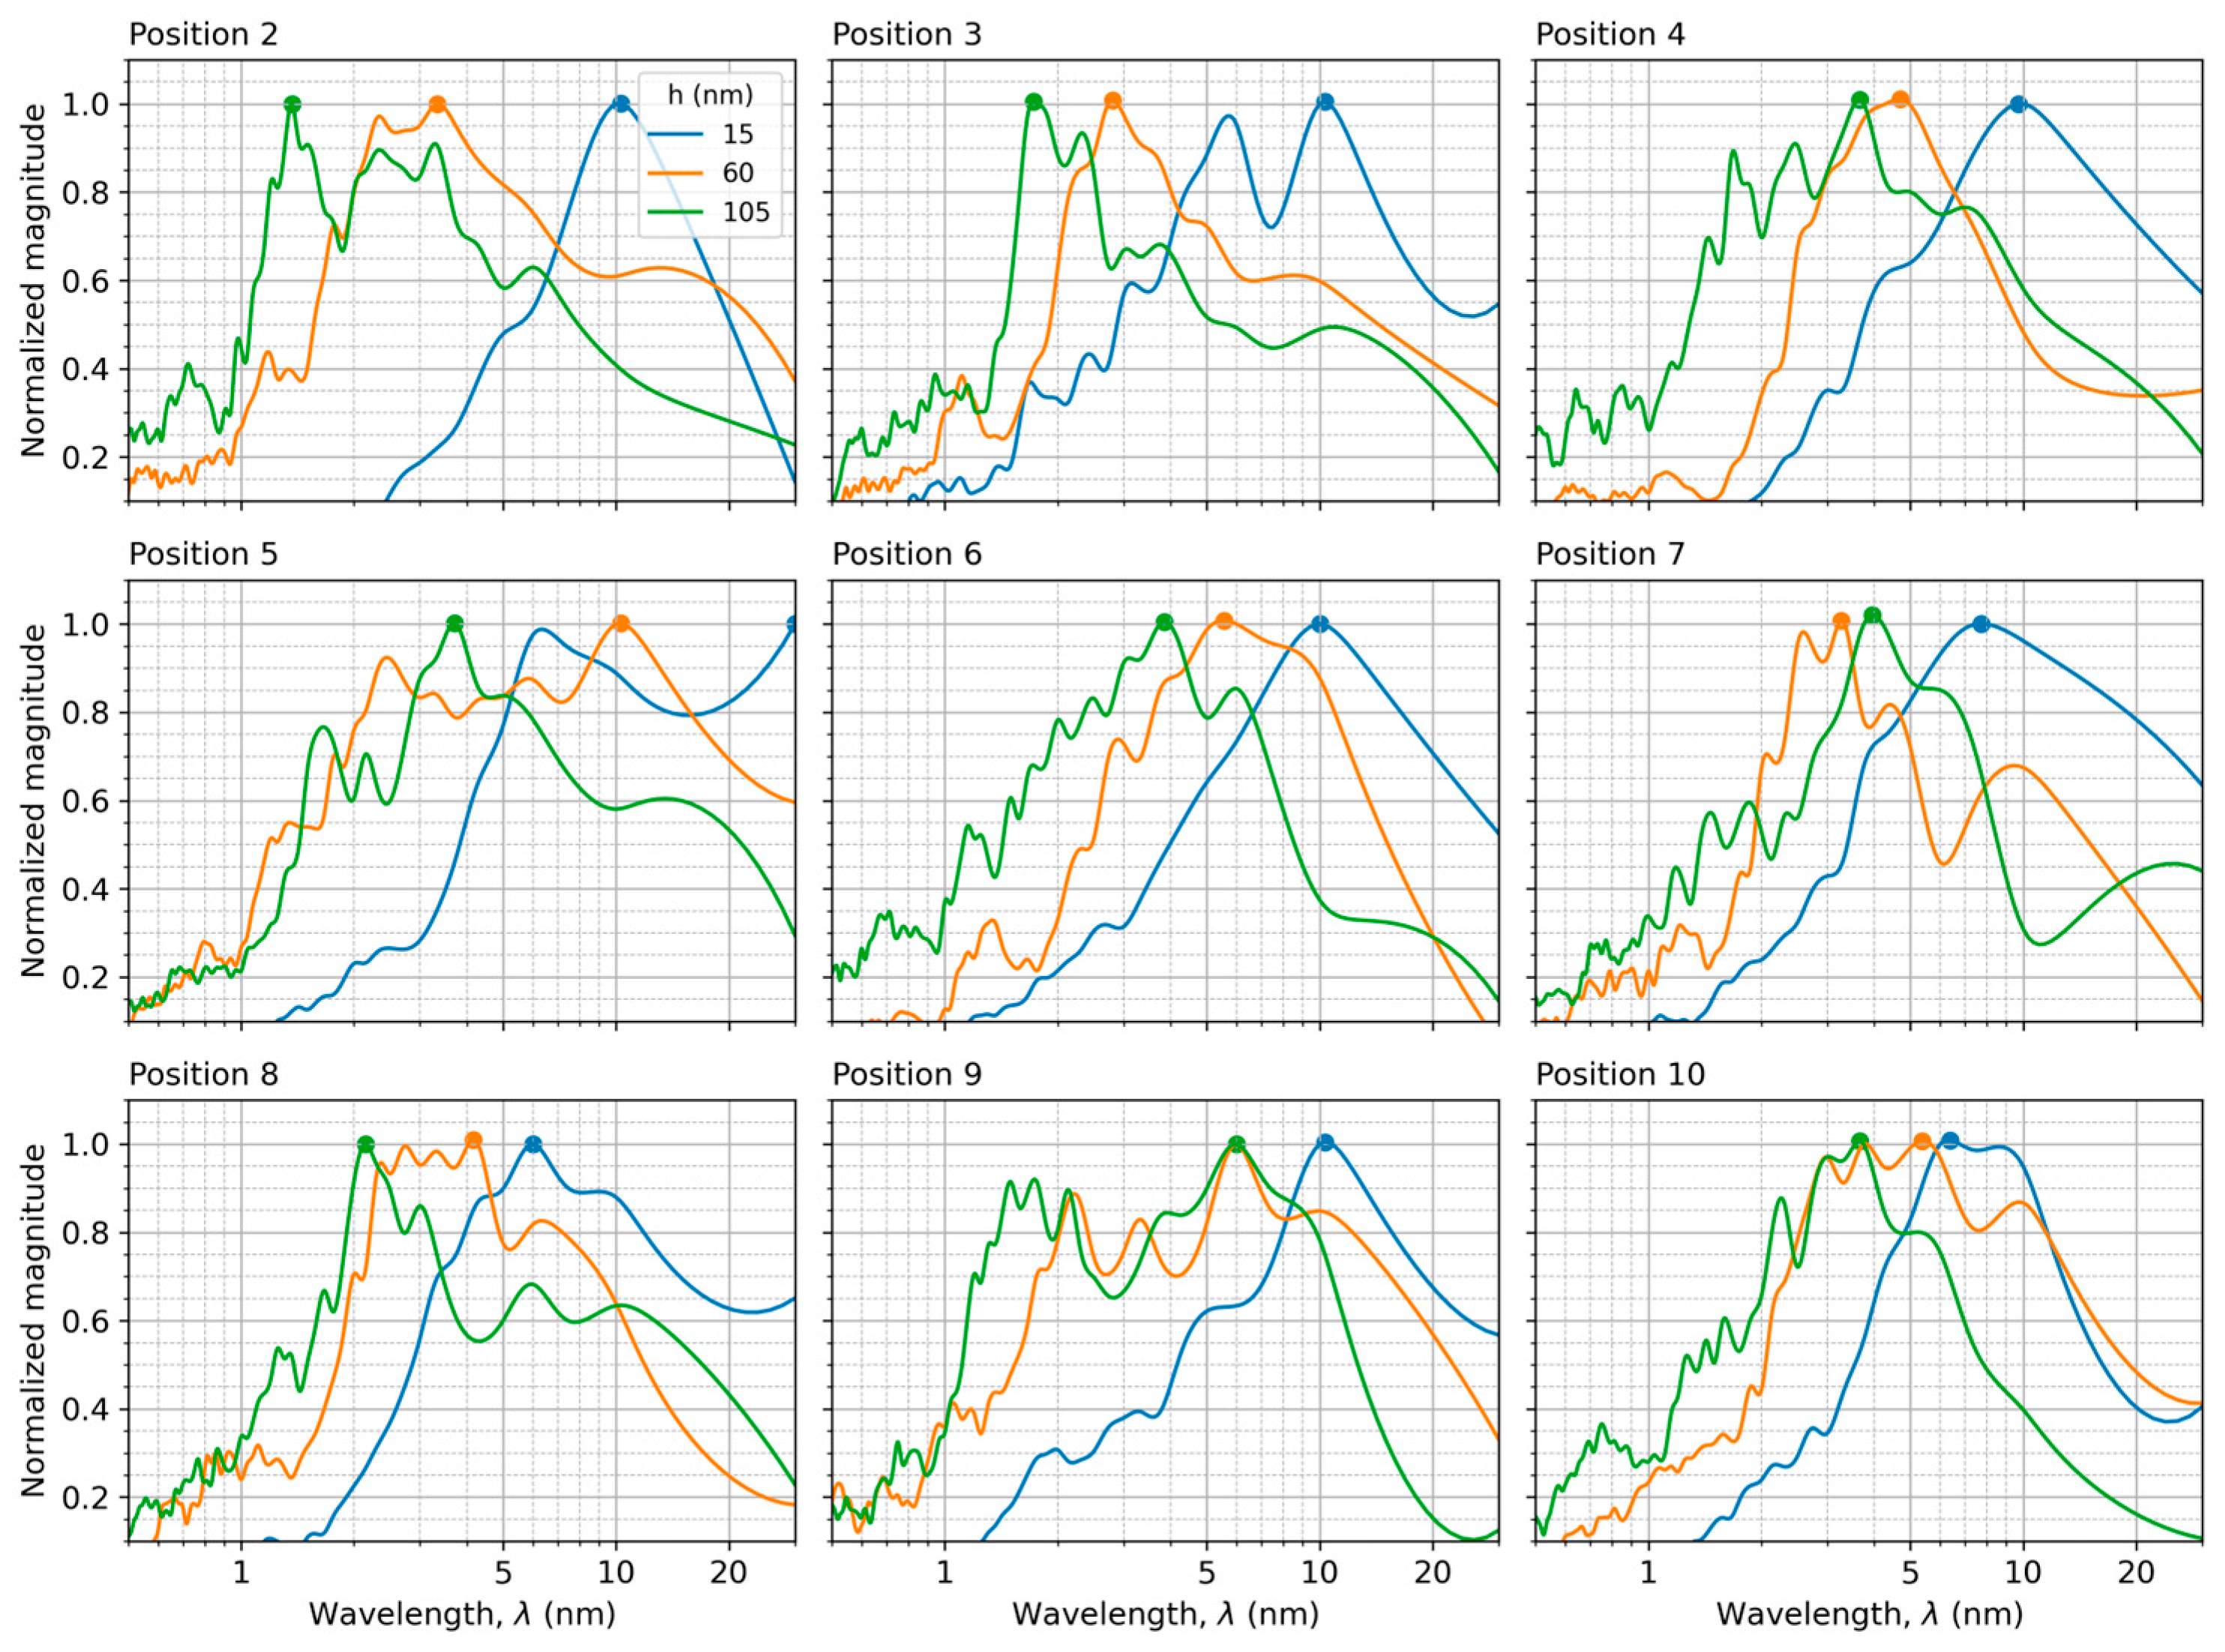
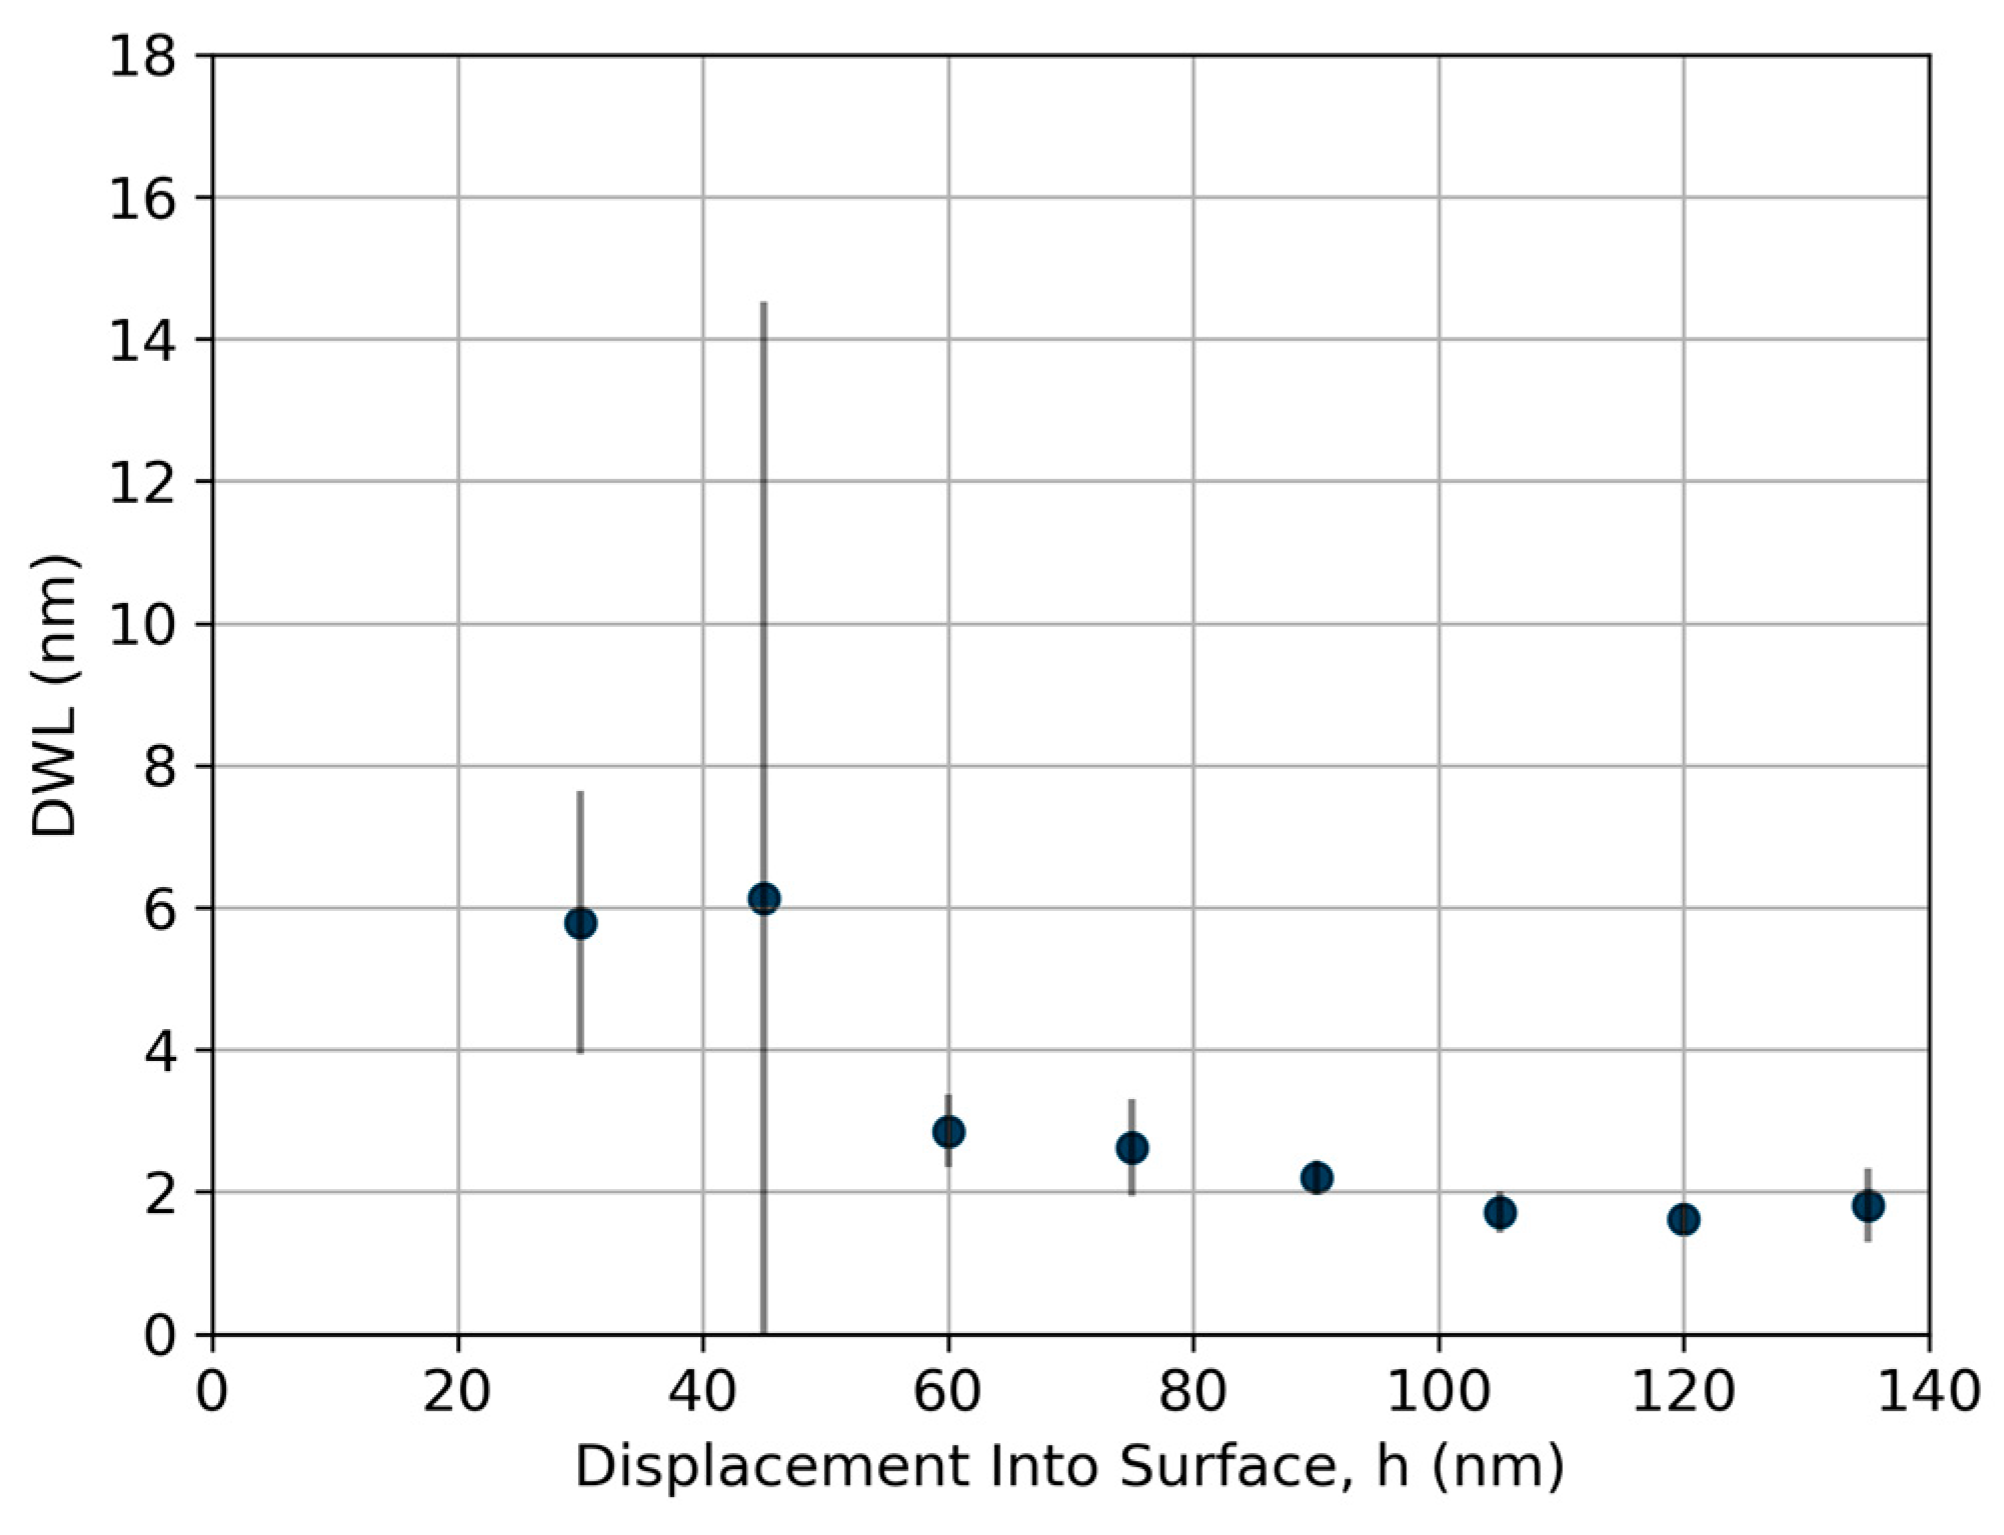
3.5. Fourier Frequency Analysis of the Total Strain Gradient’s Fine Structure

Fourier frequency analysis of the total strain gradient’s fine structure Pb’(h) was conducted to gain deeper insight into the deformation mechanisms induced by nanoindentation at the relatively low peak load as large as 8000 µN and the resulting shallow indentation depths. The spatial frequency spectrum of the Pb’(h) profiles enabled the identification of dominant wavelengths (DWLs) and two characteristic wavelengths, WL1 and WL2, as weighted averages of the entire Fourier frequency spectrum of the SSF gradient profiles. This approach parallels signal processing methods used in time-series and surface roughness analyses.
The DWL represents a characteristic length scale associated with the gradient variations in the SSF, as reflected in the P′/h-profiles in response to indentation. These dominant wavelengths are likely influenced by factors such as the microstructure of the NSC samples, surface or subsurface features, micromechanical behavior, or even experimental conditions, i.e., a loading rate. The following most prominent DWL1, DWL2, and DWL3 values were identified: 9.14, 25.60, and 42.67 nm for NSC-1; 4.27, 18.29, and 21.33 nm for NSC-2; 5.33, 11.64, and 32.00 nm for NSC-3; and 9.85, 25.60, and 32.00 nm for NSC-4. The largest DWL1 values are around 25% of the maximum indentation depths (hmax) of about 140–150 nm, while the intermediate DWL2 values likely correspond to the superlattice period of roughly 17–21 nm. In contrast, the smallest DWL3 values may be associated with the average coating grain size.
WL1 was estimated as the reciprocal of the magnitude-weighted average of all Fourier frequencies. The resulting WL1 values for NSC-1, NSC-2, NSC-3, and NSC-4 were 9.17, 8.23, 8.25, and 9.11 nm, respectively, which closely match the observed oscillating features in the strain gradient profiles throughout the indentation depth. The WL1 range of 8.23–9.17 nm suggests correspondence to half of the superlattice period as well as potentially intrinsic material responses such as alternating strain-hardening and strain-softening mechanisms under indentation.
WL2, derived from the Fourier wavelength spectrum as the magnitude-weighted average wavelength, yielded values of 21.40, 22.11, 16.77, and 17.37 nm for NSC-1, NSC-2, NSC-3, and NSC-4, respectively. These values are roughly double those of WL1, as expected from their method of computation based on the wavelength distribution.
The dominant wavelengths (approximately 4.7–42.7 nm) represent a characteristic length scale potentially associated with larger structural features within the material, such as stress–strain fields, subsurface phenomena, or periodic structures like the bilayered superlattice. In contrast, the WL1 wavelengths (approximately 8.2–9.2 nm) appear related to the finer oscillations in the strain gradient profile, indicating a multi-scale deformation response: dominant wavelengths capture broader structural influences, while WL1 represents localized deformation characteristics. Both DWL2 and WL2 are consistent with the superlattice period of around 17–21 nm, implying that nanoindentation captures not only microstructural attributes like grain size but also larger-scale features such as phase boundaries, residual stress distributions, or multilayer interfaces.

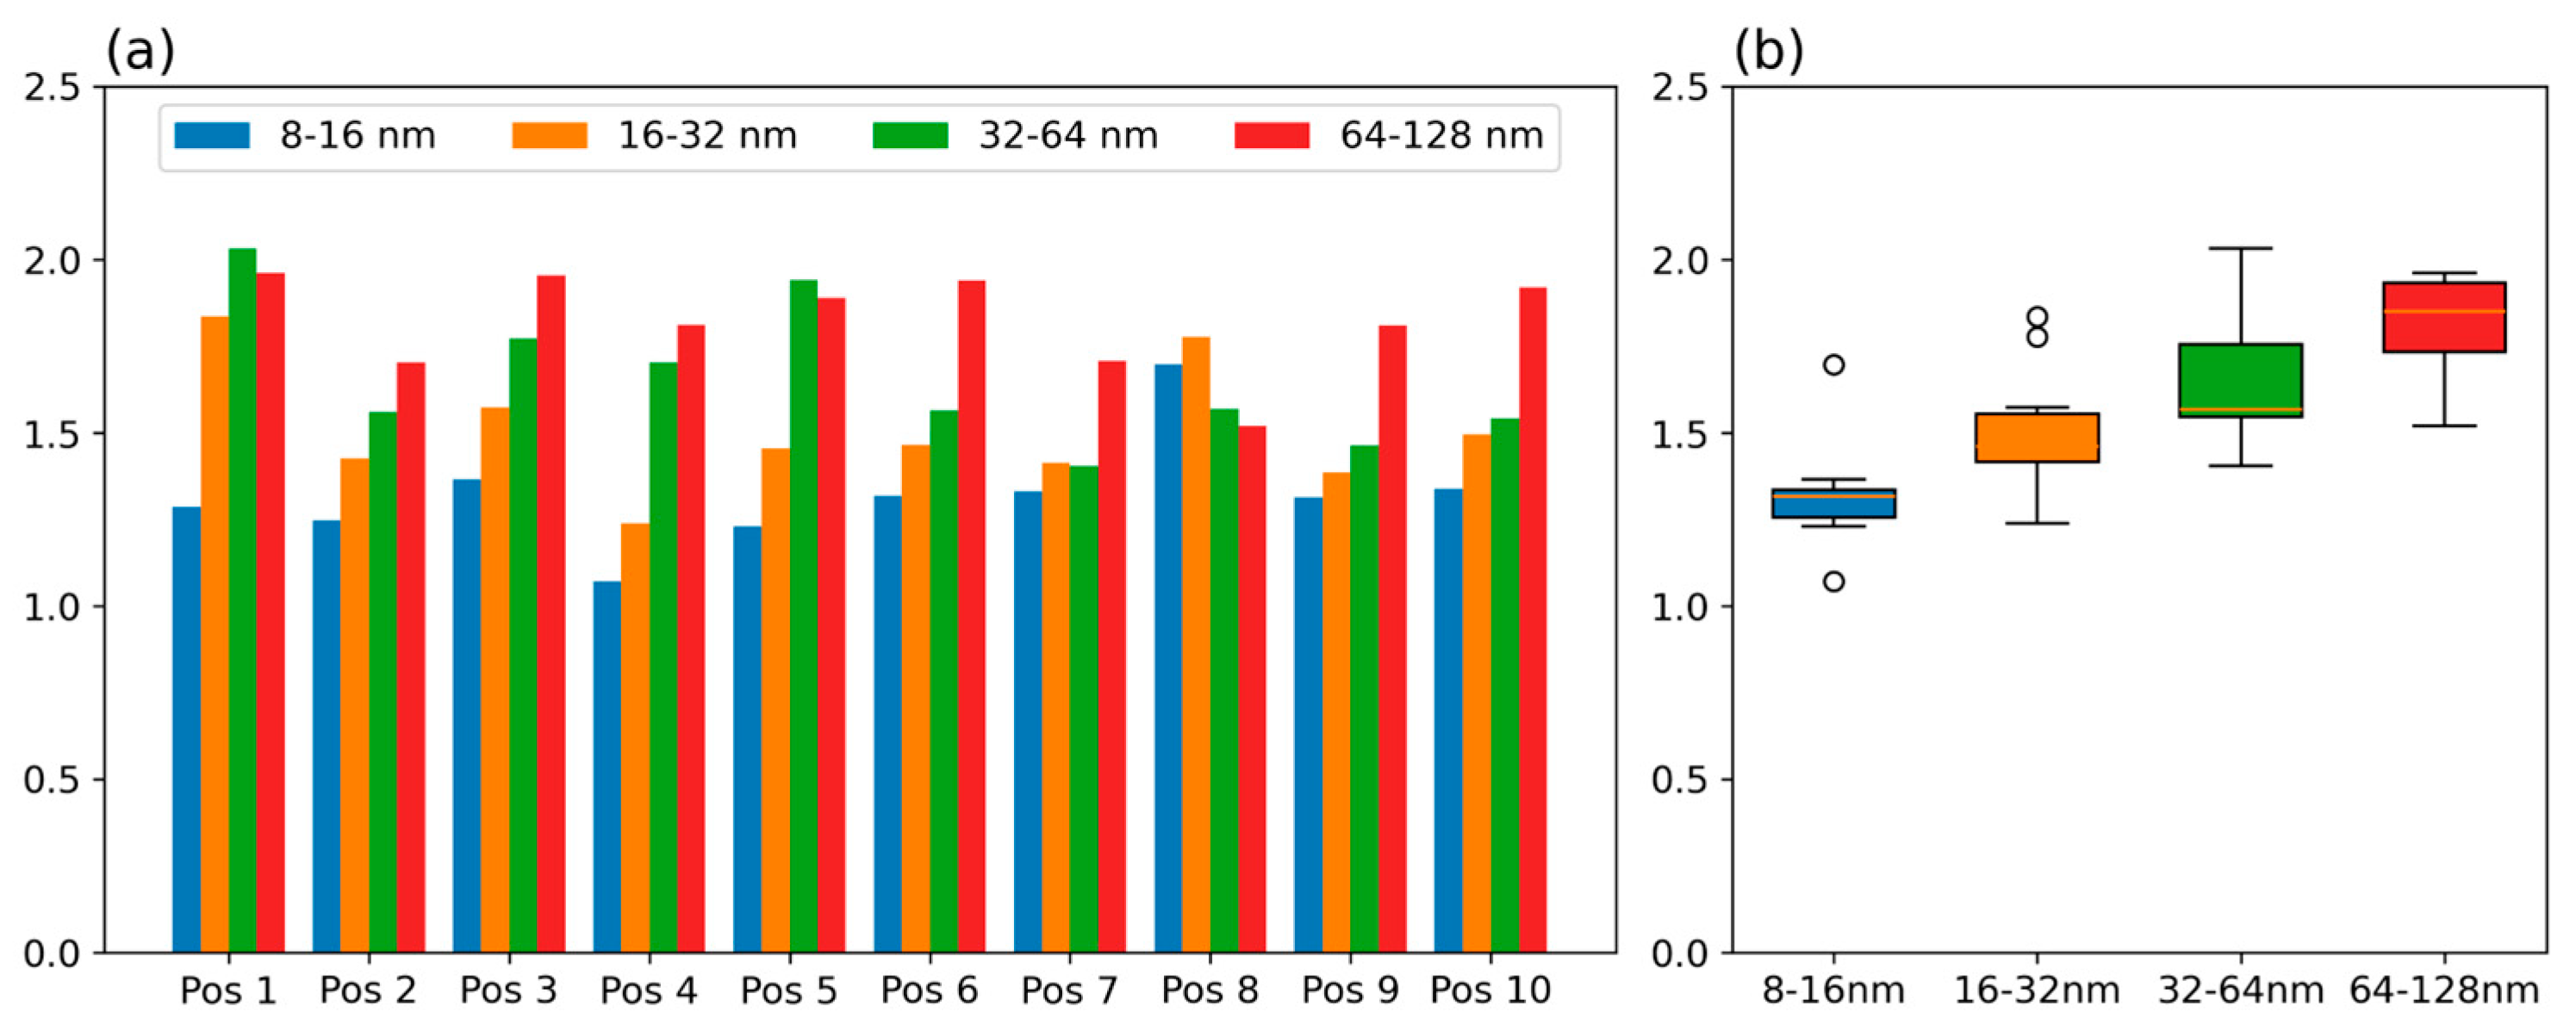
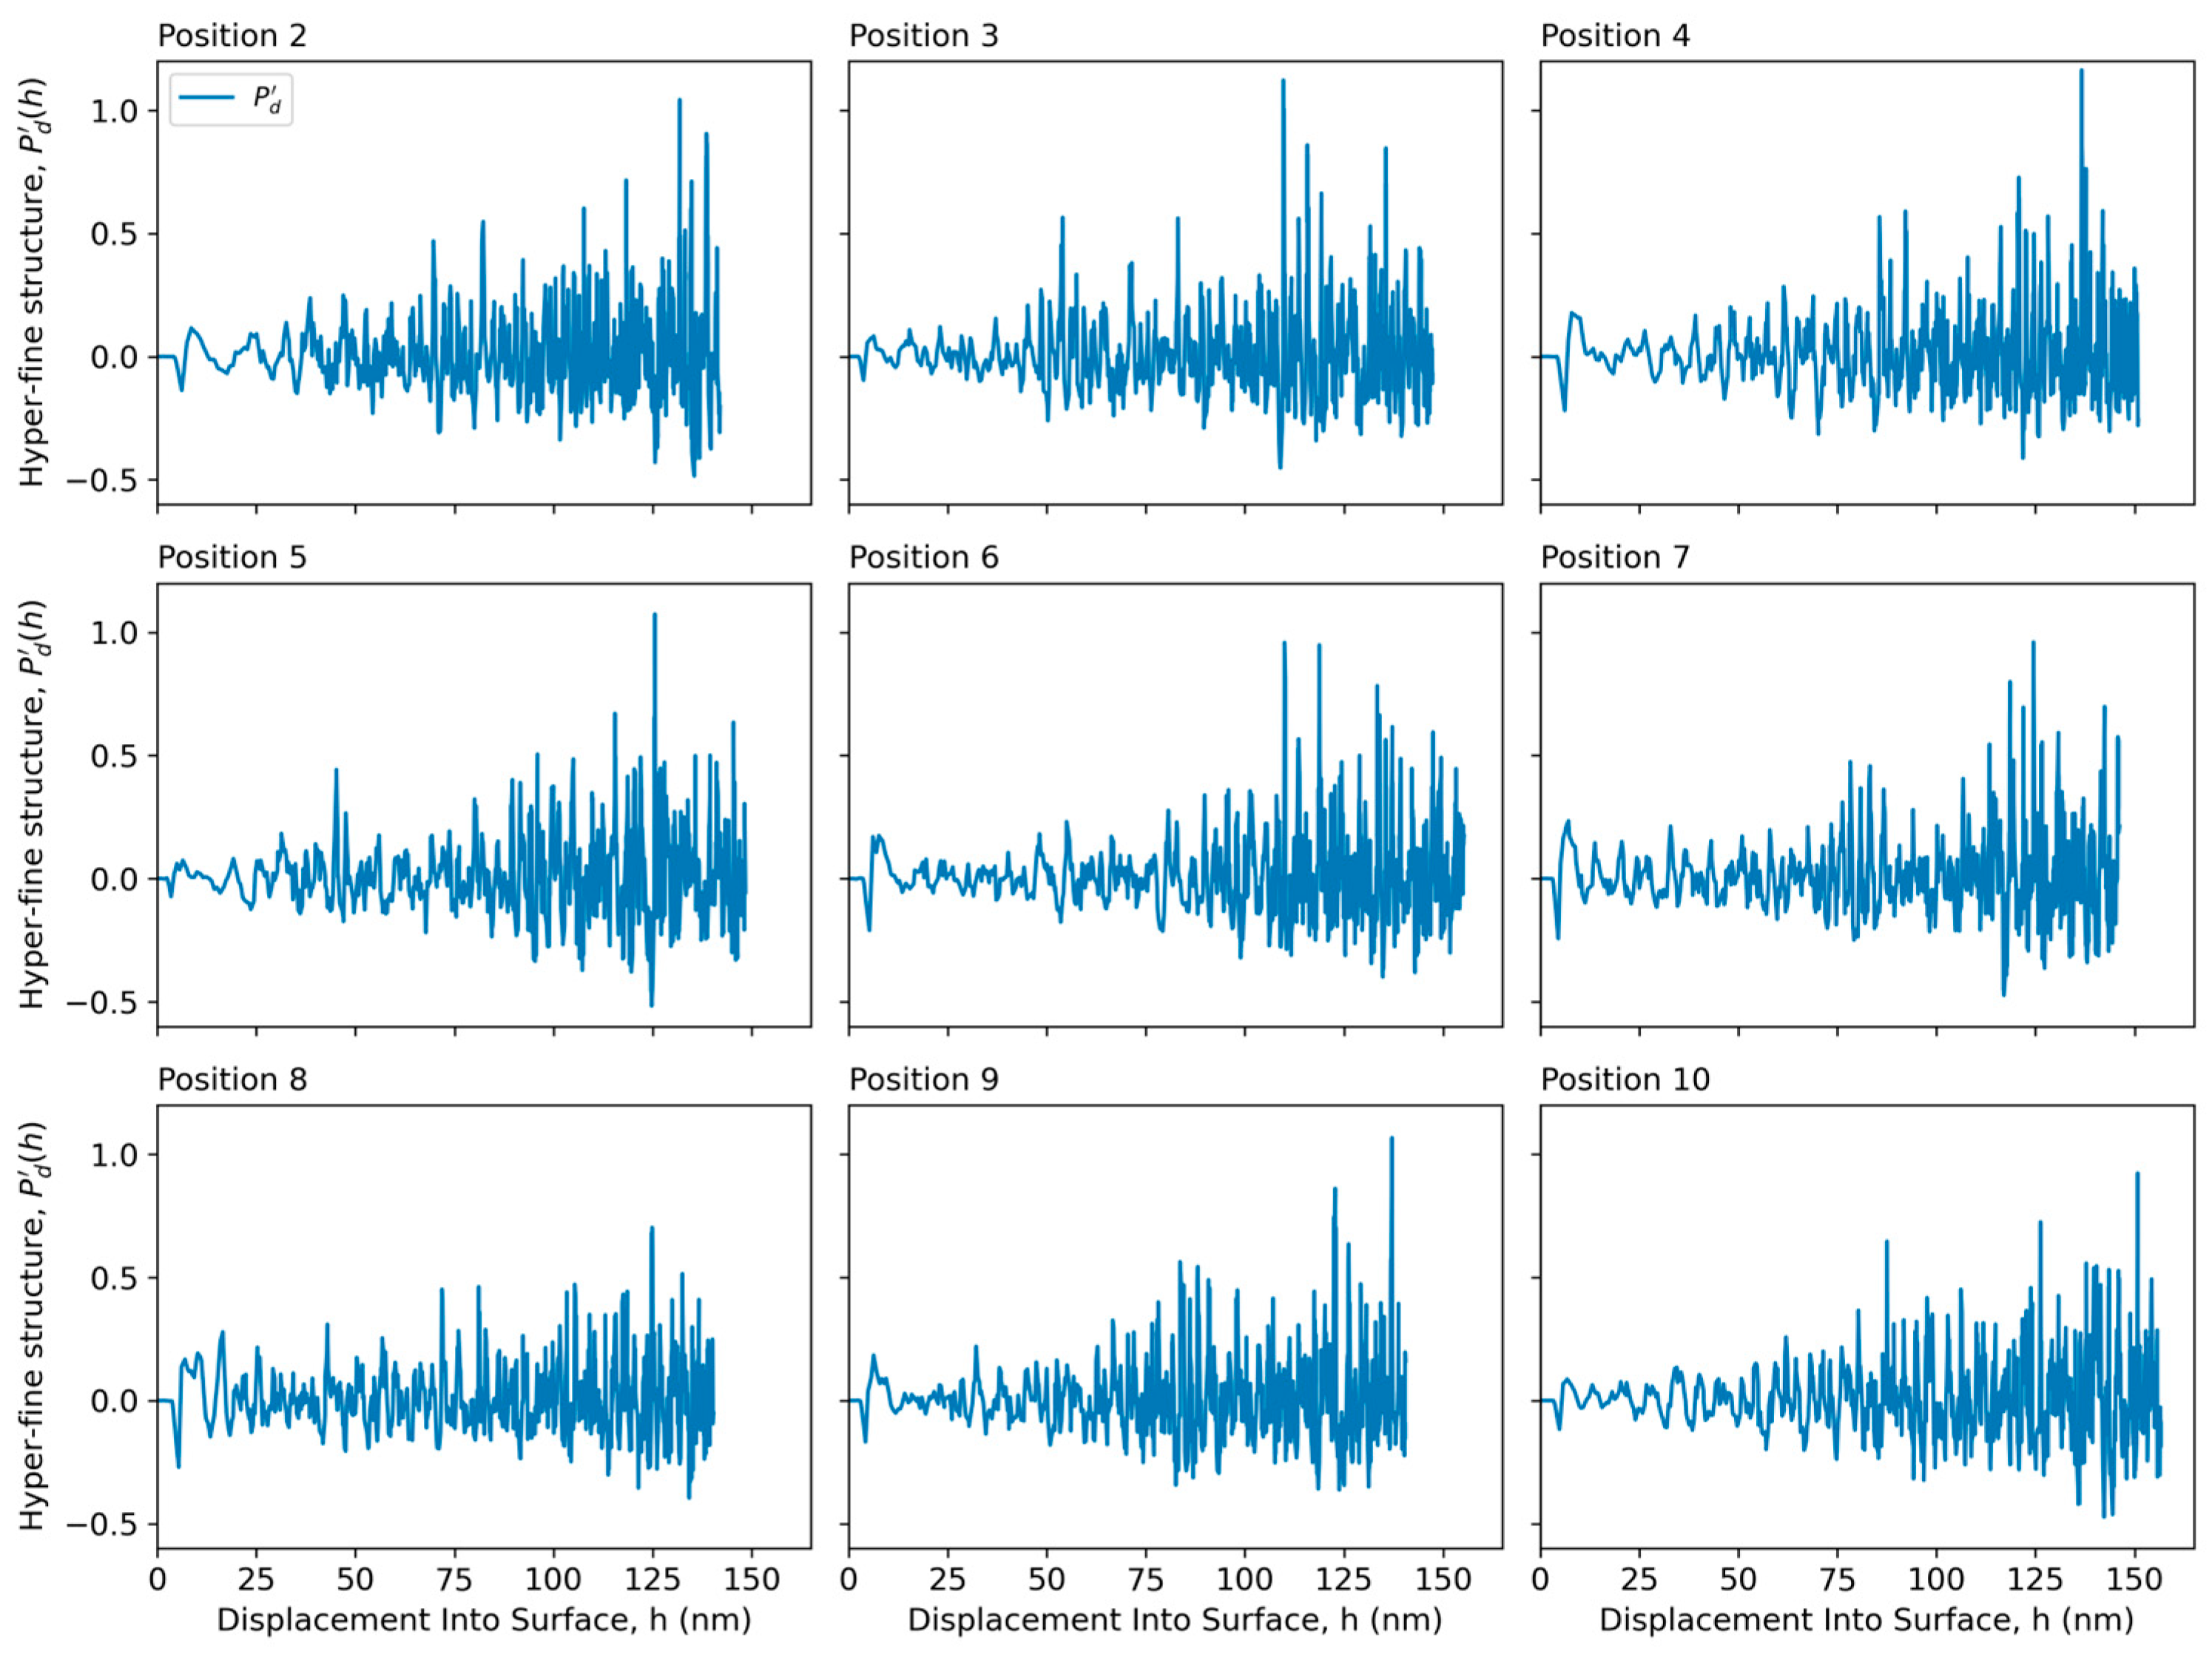
3.6. Fourier Frequency Analysis of the Total Strain Gradient’s Hyperfine Structure

In this section, we apply a more detailed Fourier frequency analysis on the high-pass filtered, hyperfine structure Pd(h) of the P′/h-profiles. This reveals a highly dynamic and coherent SSF structure at high spatial frequencies, caused by the incrementally loaded indenter during the nanoindentation experiment.
Figure 8 shows an example of the Fourier frequency analysis of the total strain gradient’s hyperfine structure. The total strain gradient P′(h) and its baseline fine structure Pb′(h) are shown in Figure 8a, revealing non-stationary spatial oscillatory dynamics around the baseline trend, with the frequency of the oscillations appearing to increase as the penetration depth h increases. The oscillatory hyperfine structure dynamics were extracted by detrending the total strain gradient (Figure 8b), and Fourier analysis of the detrended strain gradient Pd′(h) indicates oscillations across a range of wavelengths between 2 and 10 nm (Figure 8c). Note that for the analysis of the hyperfine structure, we have decomposed the P′/h-profile into the baseline Pb′(h) and the detrended Pd(h), such that the oscillatory dynamics are primarily contained in the Pd(h) component.
Careful analysis of the frequency spectrum reveals that the wavelength magnitude spectrum, in fact, gradually and coherently changes depending on the penetration depth h (Figure 8d): at shallower depths, the magnitude spectrum peaks at longer dominant wavelengths (e.g., DWL = 5 nm at h = 60 nm), whereas at deeper penetration depths, the oscillations have shorter wavelengths (e.g., DWL 1.5 nm at h = 105 nm). Thus, the Fourier analysis formalizes the observed dependency of the oscillations on penetration depth from Figure 8a.
Figure 9 confirms that total strain gradient oscillations are a consistent and reproducible feature across all (4 × 10) measurements. While the precise shape of the P′/h-profile and its associated mean baseline fine structure Pb’(h) varies—likely due to local heterogeneities in the sample nanostructure—the spatial oscillations superimposed on the baseline trend exhibit remarkably consistent characteristics. The isolated, detrended oscillations Pd’(h) extracted from each measurement are presented in Figure 10. Figure 11 displays the Fourier wavelength spectra of the detrended strain gradient measurements Pd’(h), indicating a range of dominant oscillatory modes. In certain measurement positions (e.g., position 2), multiple distinct peaks emerge, indicating the presence of several concurrent oscillation modes. Figure 12 presents a “decomposition” of these modes via Fourier analysis of windowed segments along the depth profile. This analysis confirms that for each measurement, we find distinct spectral components at different penetration depths. Although some variability is present, a consistent trend emerges, with the dominant wavelengths tending to shift toward shorter values with increasing depth.
Figure 13 summarizes the spatial evolution of dominant oscillatory modes in the strain gradient profiles across all measurements. A clear downward trend emerges, with the dominant wavelength, DWL, decreasing with increasing indentation depth, h. The variability of DWL at shallower depths is more significant, likely reflecting a more heterogeneous mechanical response near the sample surface. At larger displacement values of h, the peak wavelength appears to converge to around DWL = 3.02 ± 1.40 nm (mean ± standard deviation, for h ≥ 90 nm across all measurement positions)
Figure 14, Figure 15 and Figure 16 show that spatial oscillatory dynamics are also preserved in the SSF divergence P″/h-profiles, consistent with the expectations from the SSF gradient–divergence method. Similarly to the P′/h-profiles, the oscillations exhibit increasing frequency with increasing penetration depths (Figure 14a), and the wavelength spectrum of the full profile has a broad peak indicating multiple dominant oscillation modes (Figure 14b). This is reproduced across all the SSF P″/h-profiles in a total of 40 entities, i.e., measured and calculated from 10 P/h-curves of each NSC sample—NSC-1, NSC-2, NSC-3, and NSC-4. (Figure 15 and Figure 16).
Figure 17 summarizes the spatial evolution of dominant oscillatory modes in the stress–strain field divergence profiles across all measurements. Similarly to the strain gradient (Figure 13), we find a considerable variability of the dominant oscillation wavelength DWL at shallow penetration depths h, and a downward trend of DWL as penetration depth increases. In contrast to the strain gradient, the change in DWL for divergence appears somewhat sharper, with the dominant wavelength appearing to converge rather quickly to around DWL = 2.16 ± 0.64 (mean ± standard deviation, for h ≥ 60 nm across all measurement positions). This estimate is close to the dominant wavelength values found for strain gradient at large penetration depths, signaling an agreement between both oscillation analyses.
The hyperfine structure of the SSF represented by Pd(h) likely reflects the underlying dislocation activity during nanoindentation. When a sharp Berkovich indenter penetrates the coating, the material directly beneath the indenter initially responds elastically; the deformation is reversible. As the load increases, the stress underneath the indenter also increases, and once it exceeds the critical resolved shear stress threshold for the coating material, an irreversible plastic deformation process begins. With progressing indentation, dislocation loops nucleate beneath the loaded indenter, expanding their preferred slip planes, and prismatic loops or half-loops may be punched out of the high-stress zones, carrying plastic strain away from the indenter.
Because the indenter imposes a steep strain gradient—confined material under the tip versus laterally free material outside the contact—GNDs are generated first to maintain continuity of the lattice-like structure. Once the GNDs begin to form and the deformation spreads, continued plastic flow and dislocation interactions lead to the accumulation of statistically stored dislocations (SSDs). The growing SSD density shortens the dominant Fourier wavelength in P′/h-profiles’ hyperfine structures, Pd(h), corresponding to the observed increase in the spatial frequency of oscillations. It was expected that were the peak load continued increasing (beyond the limit of our measurements here), the SSF gradient would have decreased to a value of zero due to increases in the SSD density value. Most likely, when the SSD density level exceeds some critical threshold, then plastic strain is transformed into a self-similar deformation process, as it is often observed in cases of micro and macro indentation testing experiments.

4. Conclusions

This study investigated the nanomechanical behavior of TiAlSiNb-N/TiCr-CN superlattice coatings fabricated via HiPIPMS, combining empirical nanoindentation analysis with a novel gradient-divergence framework. These coatings exhibited distinctive multilayer architecture reflected in both mechanical performance and deformation response.
We demonstrated that Meyer’s power law, historically developed for bulk materials, can be extended for thin films, providing a semi-universal mathematical model across macro-, micro-, and nanoscale indentation tests. The evolution of the Meyer exponent n with indentation depth captures the transition from surface-dominated to bulk-like deformation and directly links to the SSF gradient beneath the indenter, offering a robust framework for comparing materials and capturing deformation behavior changes across scales.
We applied a simple empirical method to extract and analyze stress–strain field (SSF) gradient and divergence representations from nanoindentation load–displacement datasets measured regarding nanostructured tribological coatings (NSCs). The total strain gradient P′/h-profiles and divergence P″/h-profiles were calculated from load–displacement P/h-curves as normalized non-dimensional derivatives. By using this gradient–divergence approach, we revealed reproducible, depth-dependent oscillations across all samples, interpreted as alternating strain-hardening and strain-softening events related to local structural heterogeneities.
The oscillating fine structure of the P′/h-profile can be interpreted as a smoothed, low-frequency representation of the NSC film’s mechanical response during indentation. This quasi-equilibrium response is shaped by the intrinsic micromechanical characteristics of the nanostructured coatings, and likely reflects the combined effects of: (i) the transition from elastic to plastic deformation, where shifts in the gradient pattern may signal the onset of plastic flow; (ii) microstructural heterogeneity, with fluctuations in the response potentially associated with grain boundaries or sublayer transitions; and (iii) strain accumulation during progressing loading.
Superimposed on the fine structure are the high-frequency hyperfine structure oscillations captured by the detrended strain gradient Pd’(h), which carry information about deformation instabilities and sub-surface material behavior. They can be seen to correspond to localized events within the evolving stress–strain field, such as (i) strain-hardening cycles manifesting as periodic increases in resistance, likely from dislocation interactions or barrier effects at microstructural interfaces, and (ii) strain-softening cycles manifesting as drops in resistance, possibly due to local yielding, microvoid formation, microcracks or sublayer delamination. The spectral analyses of these oscillations revealed that their dominant wavelengths shift to shorter scales with increasing depth, which underscores the transition from coarse, surface-dominated deformation to finer-scale, bulk-driven mechanisms deeper in the film.
Our results demonstrate how gradient–divergence analysis adds substantial interpretive power to nanoindentation, offering insight into subsurface mechanical phenomena otherwise obscured by conventional metrics. The methodology is broadly applicable to architected coatings where microstructural complexity governs mechanical performance.
Future work should integrate advanced in situ characterization techniques—particularly coupling nanoindentation with in situ SEM or TEM—to directly visualize underlying deformation mechanisms corresponding to the observed SSF gradient oscillations, enabling real-time tracking of dislocation activity, interface yielding, and microcrack formation. Computational modeling, including FEM simulations with crystal plasticity and atomistic modeling, should simulate indentation responses in superlattice coatings, incorporating layer-specific properties to reproduce oscillatory behavior and link the SSF gradient–divergence features to specific micromechanical processes. These efforts will advance predictive design of next-generation tribological materials with architecture-dependent mechanical signatures.

Author Contributions

Conceptualization, U.K., K.K., A.K. and I.B.; investigation, U.K., K.K., E.J. and J.L.; writing—manuscript draft preparation, U.K. and K.K.; writing—review and editing, U.K., K.K., A.K. and I.B.; data visualization, K.K. and U.K.; supervision A.K.; project administration I.B.; funding acquisition I.B. All authors have read and agreed to the published version of the manuscript.

Funding

Latvian Council of Science, project “Carbon-rich self-healing multifunctional nanostructured smart coatings (NSC) for high-tech applications using high-power confined plasma technology for their deposition”, project No. 2019/1-0385.

Institutional Review Board Statement

Not applicable.

Informed Consent Statement

Not applicable.

Data Availability Statement

Measurement data available upon request to the corresponding author.

Acknowledgments

The authors thank V. Kovalenko for the preparation of the NSC samples and I. Jerane for conducting nanoindentation tests.

Conflicts of Interest

Author Karlis Kanders was employed by the company Nesta. The remaining authors declare that the research was conducted in the absence of any commercial or financial relationships that could be construed as a potential conflict of interest.

Appendix A. Surface Roughness Evaluation Using Roughness Tester Mitutoyo AVANT

The surface roughness tester Mitutoyo AVANT 3D was equipped with an S-3000 roughness detector module, a high-accuracy Y-axis table, and an auto-leveling table. The S-3000 roughness detector module featured a 0.75 mN detector and a standard stylus 12AAC731 with a cone angle of 60 degrees and a tip radius of 2 µm. Prior to the roughness measurements, the NCS samples were cleaned using compressed air flow and leveled using the auto-leveling function to ensure optimal alignment with the stylus. Three radial roughness profiles separated by an angle of 120 degrees were measured for each NSC sample. The average 3-profile Raqz values for each sample were calculated from 3 × 10,000 measurement points and presented in Table A1.
Table A1. Surface roughness parameters Raqz-values (nm) of the NSC film samples.
RaqzNSC-1NSC-2NSC-3NSC-4
Ra9.56 ± 0.8913.17 ± 1.3411.86 ± 1.1510.41 ± 1.43
Rq14.31 ± 1.1219.47 ± 2.5415.27 ± 1.1913.52 ± 1.56
Rz17.09 ± 1.9123.65 ± 2.3324.33 ± 2.5419.64 ± 2.03

References

  1. Wu, W.-Y.; Ting, J.-M. Growth and Characteristics of Metal-Containing Diamond-like Carbon Using a Self-Assembled Process. Carbon 2006, 44, 1210–1217. [Google Scholar] [CrossRef]
  2. Persson, K.; Gåhlin, R. Tribological Performance of a DLC Coating in Combination with Water-Based Lubricants. Tribol. Int. 2003, 36, 851–855. [Google Scholar] [CrossRef]
  3. Zhang, S.; Sun, D.; Fu, Y.; Du, H. Recent Advances of Superhard Nanocomposite Coatings: A Review. Surf. Coat. Technol. 2003, 167, 113–119. [Google Scholar] [CrossRef]
  4. Musil, J. Hard and Superhard Nanocomposite Coatings. Surf. Coat. Technol. 2000, 125, 322–330. [Google Scholar] [CrossRef]
  5. Musil, J.; Vlček, J. Magnetron Sputtering of Hard Nanocomposite Coatings and Their Properties. Surf. Coat. Technol. 2001, 142–144, 557–566. [Google Scholar] [CrossRef]
  6. Pogrebnjak, A.; Smyrnova, K.; Bondar, O. Nanocomposite Multilayer Binary Nitride Coatings Based on Transition and Refractory Metals: Structure and Properties. Coatings 2019, 9, 155. [Google Scholar] [CrossRef]
  7. Wang, Y.; Dong, Y.; Liu, J.; Tian, Y.; Chi, Y.; Yang, Y. Hardening Mechanism of Thick (Ti,Cr,V)N Composite Coatings with Multi-Layer Nano-Columnar Dendrites Microstructure. J. Eur. Ceram. Soc. 2024, 44, 2013–2025. [Google Scholar] [CrossRef]
  8. Gao, N.; Lu, D.; Zhao, Y.; Liu, X.; Liu, G.; Wu, Y.; Liu, G.; Fan, Z.; Lu, Z.; George, E.P. Strengthening of a CrMnFeCoNi High-Entropy Alloy by Carbide Precipitation. J. Alloys Compd. 2019, 792, 1028–1035. [Google Scholar] [CrossRef]
  9. Su, Y.L.; Kao, W.H.; Sung, K.H. Mechanical and Tribological Properties of NbAl, NbAlN, and NbAIN-CH Coatings Deposited Using Various Niobium Target Currents and Acetylene Flow Rates. J. Mater. Eng. Perform. 2022, 31, 3594–3610. [Google Scholar] [CrossRef]
  10. Leitans, A.; Jansons, E.; Lungevics, J.; Kundzins, K.; Boiko, I.; Kanders, U.; Kovalenko, V.; Linins, O. Tribological and Micromechanical Properties of the Nanostructured Carbonitride/Nitride Coatings of Transition Metals Alloyed by Hf and Nb. Coatings 2023, 13, 552. [Google Scholar] [CrossRef]
  11. Ul-Hamid, A. The Effect of Deposition Conditions on the Properties of Zr-Carbide, Zr-Nitride and Zr-Carbonitride Coatings—A Review. Mater. Adv. 2020, 1, 988–1011. [Google Scholar] [CrossRef]
  12. Musil, J.; Kunc, F.; Zeman, H.; Poláková, H. Relationships between Hardness, Young’s Modulus and Elastic Recovery in Hard Nanocomposite Coatings. Surf. Coatings Technol. 2002, 154, 304–313. [Google Scholar] [CrossRef]
  13. Donohue, L.A.; Smith, I.J.; Münz, W.D.; Petrov, I.; Greene, J.E. Microstructure and Oxidation-Resistance of Ti1 − x − y −zAlxCryYzN Layers Grown by Combined Steered-Arc/Unbalanced-Magnetron-Sputter Deposition. Surf. Coat. Technol. 1997, 94–95, 226–231. [Google Scholar] [CrossRef]
  14. Yang, Q.; Seo, D.Y.; Zhao, L.R. Multilayered Coatings with Alternate Pure Ti and TiN/CrN Superlattice. Surf. Coat. Technol. 2004, 177–178, 204–208. [Google Scholar] [CrossRef]
  15. Hahn, R.; Bartosik, M.; Soler, R.; Kirchlechner, C.; Dehm, G.; Mayrhofer, P.H. Superlattice Effect for Enhanced Fracture Toughness of Hard Coatings. Scr. Mater. 2016, 124, 67–70. [Google Scholar] [CrossRef]
  16. Yin, D.; Xu, Z.; Feng, J.; Qin, Y. Numerical Modelling of Multilayered Coatings—Latest Developments and Applications. Manuf. Rev. 2014, 1, 8. [Google Scholar] [CrossRef]
  17. Cabibbo, M.; Clemente, N.; El Mehtedi, M.; Hamouda, A.H.; Musharavati, F.; Santecchia, E.; Spigarelli, S. Constitutive Analysis for the Quantification of Hardness Decay in a Superlattice CrN/NbN Hard-Coating. Surf. Coat. Technol. 2015, 275, 155–166. [Google Scholar] [CrossRef]
  18. Vogli, E.; Tillmann, W.; Selvadurai-Lassl, U.; Fischer, G.; Herper, J. Influence of Ti/TiAlN-Multilayer Designs on Their Residual Stresses and Mechanical Properties. Appl. Surf. Sci. 2011, 257, 8550–8557. [Google Scholar] [CrossRef]
  19. Liew, W.Y.H.; Lim, H.P.; Melvin, G.J.H.; Dayou, J.; Jiang, Z.T. Thermal Stability, Mechanical Properties, and Tribological Performance of TiAlXN Coatings: Understanding the Effects of Alloying Additions. J. Mater. Res. Technol. 2022, 17, 961–1012. [Google Scholar] [CrossRef]
  20. Nie, X.-D.; Xu, J.-Y.; Zhang, Z.-C.; Wei, X.-L.; Xiao, J.-K.; Zhang, C. The Progress of Research on High-Entropy Ceramics in The Field of Tribology. Adv. Ceram. 2025, 46, 1–23. [Google Scholar] [CrossRef]
  21. Kanders, U.; Kanders, K.; Maniks, J.; Mitin, V.; Kovalenko, V.; Nazarovs, P.; Erts, D. Nanoindentation Response Analysis of Cu-Rich Carbon–Copper Composite Films Deposited by PVD Technique. Surf. Coat. Technol. 2015, 280, 308–316. [Google Scholar] [CrossRef]
  22. Das, J.; Linke, B. Evaluation and Systematic Selection of Significant Multi-Scale Surface Roughness Parameters (SRPs) as Process Monitoring Index. J. Mater. Process. Technol. 2017, 244, 157–165. [Google Scholar] [CrossRef]
  23. Liu, Y.; Yu, S.; Shi, Q.; Ge, X.; Wang, W. Multilayer Coatings for Tribology: A Mini Review. Nanomaterials 2022, 12, 1388. [Google Scholar] [CrossRef] [PubMed]
  24. Kanders, U.; Kanders, K.; Jansons, E.; Boiko, I.; Kromanis, A.; Lungevics, J.; Leitans, A. Strain-Hardening and Strain-Softening Phenomena Observed in Thin Nitride/Carbonitride Ceramic Coatings During the Nanoindentation Experiments. Coatings 2025, 15, 674. [Google Scholar] [CrossRef]
  25. Fleck, N.; Hutchinson, J. Strain Gradient Plasticity. Adv. Appl. Mech. 1997, 33, 295–362. [Google Scholar]
  26. Gao, H.; Huang, Y.; Nix, W.D. Modeling Plasticity at the Micrometer Scale. Naturwissenschaften 1999, 86, 507–515. [Google Scholar] [CrossRef] [PubMed]
  27. Fischer-Cripps, A.C. Nanoindentation; Springer Nature: Berlin, Germany, 2004. [Google Scholar] [CrossRef]
  28. Johnson, K.L. The Correlation of Indentation Experiments. J. Mech. Phys. Solids 1970, 18, 115–126. [Google Scholar] [CrossRef]
  29. Mokios, G.; Aifantis, E.C. Gradient Effects in Micro-/Nanoindentation. Mater. Sci. Technol. 2012, 28, 1072–1078. [Google Scholar] [CrossRef]
  30. Kanders, U.; Kanders, K. Nanoindentation Response Analysis of Thin Film Substrates-I: Strain Gradient-Divergence Approach. Latv. J. Phys. Tech. Sci. 2017, 54, 66–76. [Google Scholar] [CrossRef]
  31. Oliver, W.C.; Pharr, G.M. Measurement of Hardness and Elastic Modulus by Instrumented Indentation: Advances in Understanding and Refinements to Methodology. J. Mater. Res. 2004, 19, 3–20. [Google Scholar] [CrossRef]
  32. Sedlaček, M.; Podgornik, B.; Vižintin, J. Tribological Properties of DLC Coatings and Comparison with Test Results: Development of a Database. Mater. Charact. 2008, 59, 151–161. [Google Scholar] [CrossRef]
  33. Khun, N.W.; Lee, P.M.; Toh, W.Q.; Liu, E. Tribological Behavior of Nickel-Doped Diamond-Like Carbon Thin Films Prepared on Silicon Substrates via Magnetron Sputtering Deposition. Tribol. Trans. 2016, 59, 845–855. [Google Scholar] [CrossRef]
  34. Vicen, M.; Bronček, J.; Nový, F. Investigation of Tribological Properties of CarbonX Coating Deposited on 100Cr6 Steel. Prod. Eng. Arch. 2019, 25, 52–55. [Google Scholar] [CrossRef]
  35. Virtanen, P.; Gommers, R.; Oliphant, T.E.; Haberland, M.; Reddy, T.; Cournapeau, D.; Burovski, E.; Peterson, P.; Weckesser, W.; Bright, J.; et al. SciPy 1.0: Fundamental Algorithms for Scientific Computing in Python. Nat. Methods 2020, 17, 261–272. [Google Scholar] [CrossRef] [PubMed]
  36. Efron, B.; Tibshirani, R.J. An Introduction to the Bootstrap; Chapman and Hall: Boca Raton, FL, USA, 1994. [Google Scholar] [CrossRef]
  37. Boiko, I.; Kanders, U.; Kundzins, K.; Leitans, A.; Lungevičs, J.; Jansons, E.; Linins, O. Nanostructured Smart Coatings Obtained by the High Power Magnetically Compresed Plasma Method. In Proceedings of the RTU 63rd International Scientific Conference Section Mechanical Engineering Technology and Heat Engineering, Riga, Latvia, 13 October 2022; RTU Press: Riga, Latvia, 2023; pp. 19–21. [Google Scholar]
  38. Johnson, K.L. Contact Mechanics; Cambridge University Press: Cambridge, UK, 1985. [Google Scholar] [CrossRef]
  39. Attaf, M.T. Connection between the Loading Curve Models in Elastoplastic Indentation. Mater. Lett. 2004, 58, 3491–3498. [Google Scholar] [CrossRef]
  40. Meyer, E. Untersuchungen über Härteprüfung und Härte Brinell Methoden. Z. Ver. Deut. Ing. 1908, 52, 645–654. [Google Scholar]
  41. Fröhlich, F.; Grau, P.; Grellmann, W. Performance and Analysis of Recording Microhardness Tests. Phys. Status Solidi 1977, 42, 79–89. [Google Scholar] [CrossRef]
  42. Sneddon, I.N. The Relation between Load and Penetration in the Axisymmetric Boussinesq Problem for a Punch of Arbitrary Profile. Int. J. Eng. Sci. 1965, 3, 47–57. [Google Scholar] [CrossRef]
Figure 1. Surface texture analysis of the NSC-1 sample (top panel): (a) SEM micrograph plan view of the rectangle X*Y-selection; (b) Surface 3D roughness profile of the same selection in grayscale units averaged along the Y-axis; (c) Three-dimensional surface plot of the X*Y selection in arbitrary units produced in the ImageJ software 1.52v. Fracture analysis of the NSC-1 sample (bottom panel): (d) SEM micrograph cross-sectional view; (e) Coating’s bilayered superlattice structure with the period of about 17–18 nm; (f) Fracture 3D surface plot in arbitrary units, produced using the ImageJ software. Scale bars indicate 200 nm. SEM analysis revealed an anisotropic undulating surface roughness pattern with spatial wavelength distribution between 1.28 and 81.35 nm, and an average value of 49.85 nm.
Coatings 15 00824 g001
Figure 2. SEM micrographs of plan view (top panel) and cross-sectional view (bottom panel) of the NSC film samples NSC-2, NSC-3, and NSC-4. The scale bar indicates 200 nm for all images. All the NSC samples under investigation revealed anisotropic coating morphology that represents itself as a one-directional undulating surface roughness pattern. The coating’s bilayered superlattice period was estimated at around 17.9, 18.3, and 17.1 nm for the NSC-2, NSC-3, and NSC-4 samples, respectively. The fracture-view micrographs, in addition to the multilayered superlattice structure, contain remnants of the crystalline Ti-adhesion layer at the bottom of the images. All NSC film samples exhibited very similar undulating roughness and superlattice structure profiles.
Coatings 15 00824 g002
Figure 3. The collection of the individual LDLs and P/h-curves obtained at peak load of 8000 µN measured at ten different positions within the indentation matrix of the NSC-1 film sample: (a) LDLs; (b) P/h-curves of the loading segment presented in a conventional linear plot; (c) P/h-curves in a log–log plot. The Y-axis shows Load On Sample, P (µN) for all panels (ac).
Coatings 15 00824 g003
Figure 4. Meyer’s power law exponent n (y-axis) for individual P/h-curves obtained at the testing peak load of 8000 µN of the NSC-1 sample: (a) n-values for each P/h-curve within four consecutive h-intervals covering nearly the entire penetration depth; (b) boxplots of n-values grouped by the consecutive h-intervals, showing an overall increase along the indenter penetration depth.
Coatings 15 00824 g004
Figure 5. Individual P/h-curve and primary P′/h-profile obtained during the indentation experiment at the testing peak load of 8000 µN regarding the NSC-1 sample: (a) P/h-curve of the loading segment in a conventional linear plot; (b) the same P/h-curve in a log-log plot compared to a power law (dashed line); the y-axis shows Load On Sample, P (µN); (c) strikethrough P′/h-profile by its mean base line—low-pass filtered fine structure Pb’(h).
Coatings 15 00824 g005
Figure 6. Examples of P′/h-profile and its low-pass filtered fine structure Pb’(h) representing the undulations of the stress–strain field gradient across the indentation depth of individual NSC film sample measurements: (a) NSC-2; (b) NSC-3; (c) NSC-4. Y-axes show Total strain gradient, P′ for all panels (ac).
Coatings 15 00824 g006
Figure 7. P″/h-profiles derived from the corresponding low-pass filtered P′/h-profiles presenting prominent undulations in the stress–strain field divergence across the indentation depth of individual NSC film sample measurements: (a) NSC-2; (b) NSC-3; (c) NSC-4. Y-axes show SSF divergence, P″ for all panels (ac).
Coatings 15 00824 g007
Figure 8. Nanoindentation response obtained at measurement position 1 within the indentation matrix of the NSC-1 film sample: (a) The total strain gradient P′/h-profile calculated from the individual P/h-curve; and mean baseline Pb’(h) obtained with a moving average method; insets highlight the oscillating dynamics of the P′/h-profile at two distinct regions; (b) Detrended strain gradient Pd’(h) from P′/h-profile; (c) Fourier wavelength spectrum of the detrended strain gradient, Pd’(h); (d) Fourier wavelength spectra of windowed strain gradient profile (window width of 30 nm), centered around displacement values h = 15, 60 and 105 nm; dots indicate dominant wavelength DWL where spectrum magnitude is the highest; inset shows peak wavelength DWL as a function of h.
Coatings 15 00824 g008
Figure 9. P′/h-profiles calculated from individual P/h-curves, and their profile fine structures denoted as low-pass filtered baseline Pb’(h) for positions 2–10 within the indentation matrix of the NSC-1 film sample (position 1 is shown in Figure 8).
Coatings 15 00824 g009
Figure 10. Detrended strain gradient Pd’(h) for positions 2–10 within the indentation matrix of the NSC-1 film sample (position 1 is shown in Figure 8).
Coatings 15 00824 g010
Figure 11. Fourier wavelength spectra of the detrended strain gradient Pd’(h) for positions 2–10 within the indentation matrix of the NSC-1 film sample (position 1 is shown in Figure 8).
Coatings 15 00824 g011
Figure 12. Examples of Fourier wavelength spectra of Pd’(h) for windows centered around displacement values h = 15, 60, and 105 nm (window width of 30 nm), for positions 2–10 within the indentation matrix of the NSC-1 film sample (position 1 is shown in Figure 8). Dominant wavelengths DWL are indicated with dots.
Coatings 15 00824 g012
Figure 13. Evolution of dominant wavelength DWL of the detrended strain gradient P′/h-profile, Pd’(h), as a function of penetration depth h, obtained via Fourier frequency analysis using 30 nm-wide sliding windows.
Coatings 15 00824 g013
Figure 14. Stress–strain field (SSF) divergence measurement at peak load of 8000 µN at measurement position 1 within the indentation matrix of the NSC-1 film sample: (a) P″/h-profile; insets highlight the oscillating dynamics at two distinct regions; (b) wavelength spectrum of the full P″/h-profile.
Coatings 15 00824 g014
Figure 15. SSF divergence P″/h-profile for positions 2-10 within the indentation matrix of the NSC-1 film sample (position 1, which is shown in Figure 14).
Coatings 15 00824 g015
Figure 16. Wavelength spectra of the SSF divergence P″/h-profile for positions 2–10 within the indentation matrix of the NSC-1 film sample (position 1, which is shown in Figure 14).
Coatings 15 00824 g016
Figure 17. Evolution of peak wavelength DWL of the SSF gradient P″/h-profile as a function of penetration depth h, obtained via Fourier analysis using 30 nm-wide sliding windows.
Coatings 15 00824 g017
Table 1. Characterization of the superlattice periodic structure of the NSC samples.
Sample LabelCarbonitride/
Nitride
Bilayer
Coating Total
Thickness, t (nm)
PVD
Process Duration,
D (min)
Number
of
Periods,
N
Sublayer
(-N)
Thickness, t1 (nm)
Sublayer
(-CN)
Thickness, t2 (nm)
Bilayer
(-N/-CN)
Thickness, t1 + t2 (nm)
NSC-1{TiAlSiNb-N/TiCr-CN}547010431111.75.917.6
NSC-2{TiAlSiNb-N/TiCr-CN}52609829411.96.017.9
NSC-3{TiAlSiNb-N/TiCr-CN}568010331012.26.118.3
NSC-4{TiAlSiNb-N/TiCr-CN}583011434111.45.717.1
Table 2. Overview of the nanomechanical and tribological properties of the NSC samples.
Sample
Label
Coating
Thickness,
t (nm) 1
Substrate
Temperature
Ts, °C 2
Nano-
Hardness,
H (GPa) 3
Elastic-,
Modulus,
E (GPa) 3
Steady-State
Sliding Friction,
CoF 4
Wear Rate, Wr
at Test Load of 3N (mm3/Nm) 5
NSC-15470 ± 24038024.61378.600.23 ± 0.074.3 × 10−6
NSC-25260 ± 26039025.44339.500.21 ± 0.064.7 × 10−6
NSC-35680 ± 25039025.14414.800.19 ± 0.023.9 × 10−6
NSC-45830 ± 24038024.96371.800.22 ± 0.064.5 × 10−6
1 Deposited coating thickness was measured using Calo tester (CSM Instruments, Peseux, Switzerland) and digital microscope KH-7700 (Hirox, Tokyo, Japan). 2 Rotating substrate temperature, Ts, accuracy is estimated at around 4%–6% (reference sample with an embedded thermocouple and prior calibration curves were used). 3 H-values might be slightly overestimated due to indentation size effect (ISE) usually observed at low peak loads (here, 8000 µN). 4 Coefficient of friction (CoF) was estimated using the Pin-On-Disk dry sliding friction test with linear disk velocity of 0.15 m/s, 3 N test force, and 100 m distance. 5 Average across four cross-sectional tribotrack areas was used to estimate the wear rate.
Table 3. Meyer’s power law exponent n was calculated for the h-intervals of (8–16) nm, (16–32) nm, (32–64) nm, and (64–128) nm of the individual P/h-curves obtained at the peak load of 8000 µN (NSC-1 sample).
h-IntervalsPos 1Pos 2Pos 3Pos 4Pos 5Pos 6Pos 7Pos 8Pos 9Pos 10
h ∈ (8–16) nm1.28441.24581.36521.07211.22891.31691.33131.69741.31381.3369
h ∈ (16–32) nm1.83571.42501.57301.23881.45371.46551.41301.77651.38501.4953
h ∈ (32–64) nm2.03311.56021.77331.70331.94041.56561.40381.56871.46231.5402
h ∈ (64–128) nm1.96101.70291.95441.81051.88901.93821.70721.51981.80991.9186
Disclaimer/Publisher’s Note: The statements, opinions and data contained in all publications are solely those of the individual author(s) and contributor(s) and not of MDPI and/or the editor(s). MDPI and/or the editor(s) disclaim responsibility for any injury to people or property resulting from any ideas, methods, instructions or products referred to in the content.

