1. Introduction
Obesity is a significant global health concern, contributing to an increased prevalence of metabolic disorders such as type 2 diabetes, cardiovascular disease, and other obesity-associated complications. It is a multifactorial condition influenced by genetic, environmental, and behavioral factors, making it difficult to develop targeted therapeutic interventions [
1,
2,
3,
4]. Most FDA-approved drugs act as appetite reducers or satiety inducers, such as GLP-1 agonists, which have been effective for many, but side effects limit their use to a large portion of the population. Therefore, it is essential to develop a therapeutic agent that targets the obesity-induced pathophysiology, which includes impaired adipogenesis and adipocyte hypertrophy, extracellular matrix (ECM) remodeling, dysfunctional lipid handling, and chronic low-grade inflammation, in turn, leaving pharmacological strategies less efficient for long-term weight management [
5]. A significant challenge in anti-obesity drug discovery is the lack of an appropriate in vitro drug screening disease model that accurately replicates the complex in vivo adipose tissue microenvironment. Conventional two-dimensional (2D) cell culture systems fail to capture the intricate cell–cell and cell–matrix interactions required for adipocyte function and metabolism [
6,
7]. These limitations result in discrepancies between in vitro and in vivo responses, impeding the translation of potential therapeutics into clinically effective treatments. Therefore, developing physiologically relevant in vitro models is crucial for improving drug screening accuracy and advancing our understanding of adipose tissue biology.
Three-dimensional (3D) spheroid cultures have emerged as a beacon of hope in obesity research, offering a promising alternative to traditional 2D models. The 3D models better mimic the structural and functional properties of native adipose tissue, enhancing cell–cell communication and cell–extracellular matrix interactions, thus providing a more physiologically relevant microenvironment that supports adipogenic differentiation and lipid metabolism. Various scaffold-based and scaffold-free approaches have been employed to establish stable 3D adipocyte cultures. Our lab has developed an elastin-like polypeptide conjugated with polyethyleneimine (ELP-PEI) coated surface that has demonstrated considerable potential in promoting the formation of 3D adipocyte spheroids. ELP-PEI coatings provide a biomimetic substrate that facilitates cell aggregation and differentiation while maintaining structural integrity [
8,
9,
10]. However, a key limitation of this system is the gradual detachment of spheroids from the coated surface over time. Extended culture durations facilitate increased lipid accumulation in adipocyte spheroids, promoting adipocyte maturation and the development of an obesity-like phenotype. Therefore, improving spheroid retention on ELP-PEI surfaces is essential for long-term adipocyte maturation for metabolic function studies.
Recently, we investigated the potential of RGD functionalization to enhance spheroid attachment. The RGD peptide is a well-known integrin-binding motif that is pivotal in promoting cell adhesion by interacting with integrins, a family of receptors that mediate cell–matrix interactions. This interaction is crucial for various cellular processes, including cell attachment, migration, differentiation, and survival. By providing a physical and biochemical cue for integrin binding, we predicted that surfaces coated with RGD-modified ELP would enhance the mechanical retention of cell aggregates and foster better cellular organization within the 3D environment [
11,
12]. Our findings demonstrated that adding RGD did not alter the physicochemical properties of ELP or its conjugation efficiency with PEI. Notably, RGD functionalization at the C-terminus, ELP-(RGD)
3-PEI, resulted in superior spheroid retention. This modification presents a novel and intriguing strategy to address the detachment issue associated with ELP-PEI coatings to enable extended culture periods for studying adipocyte maturation, lipid metabolism, and obesity-related cellular mechanisms [
13].
In the current study, we evaluated the impact of RGD incorporation on key adipocyte functions, including adipogenic differentiation, triglyceride accumulation, and metabolic activity. By systematically comparing ELP-PEI and ELP-(RGD)3-PEI coatings, we aimed to determine whether RGD-mediated adhesion influences adipocyte maturation and lipid storage capacity within a 3D spheroid culture system. Our findings shed light on the significant potential of RGD to influence adipocyte function, thereby contributing to a deeper understanding of adipose tissue biology and drug screening in obesity research.
2. Materials and Methods
2.1. Expression and Purification of ELP and ELP-(RGD)3
The design, expression, and purification of the base elastin-like polypeptide (ELP) and its RGD-functionalized variant, ELP-(RGD)
3, were performed as described previously [
13]. Briefly, (VPGVG)
40 and (VPGVG)
40-(RGD)
3 constructs were cloned into the pET-25b(+) vector, expressed in E. coli BLR(DE3), and purified using inverse temperature cycling based on their lower critical solution temperature (LCST) behavior. The polypeptides were dialyzed using a 3.5 kDa MWCO membrane and lyophilized for storage.
2.2. Chemical Modification of ELP and ELP-(RGD)3 with Polyethyleneimine (PEI)
Chemical modification of ELP and ELP-(RGD)
3 with branched polyethyleneimine (PEI, MW ~800 Da) was performed using EDC/NHS coupling chemistry as previously established [
13]. In this study, a 10-fold molar excess of PEI, EDC, and NHS was used to activate carboxyl groups on the ELPs in MES buffer (pH 6.2), followed by overnight reaction at 4 °C and purification via inverse temperature cycling. The RGD sequence at the C-terminus served as a reactive site for conjugation in the ELP-(RGD)
3 variant.
2.3. Characterization of Chemically Conjugated ELP-PEI and ELP-(RGD)3-PEI
The concentration of ELP in the ELP-PEI and ELP-(RGD)3-PEI conjugates was determined using a Nanodrop UV-Vis spectrophotometer (ND-1000, Thermo Scientific, Waltham, MA, USA). To quantify the degree of PEI conjugation, an o-phthalaldehyde (OPA) assay was conducted following the EDC/NHS coupling reaction. Equivalent molar concentrations of unreacted ELP, PEI, and the conjugates (ELP-PEI and ELP-(RGD)3-PEI) were mixed with the OPA reagent, and fluorescence was measured using a microplate reader (Biotek FLx800, Winooski, VT, USA) at an excitation wavelength of 360 nm and an emission wavelength of 460 nm. The fluorescence intensity of the conjugates was compared to that of pure ELP (representing 0 mol% conjugation) and PEI (representing 100 mol% conjugation) to determine the extent of modification. The structural integrity and functional groups of ELP-PEI and ELP-(RGD)3-PEI were analyzed using attenuated total reflectance Fourier transform infrared spectroscopy (ATR-FTIR). Spectra were recorded using a Spectrum 100 FTIR spectrometer (Perkin-Elmer, Waltham, MA, USA) equipped with a diamond/ZnSe crystal. Each sample was scanned over the spectral range of 650 to 4000 cm−1 at a resolution of 4 cm−1 to detect characteristic amide and functional group peaks. The thermal responsiveness of ELP-PEI and ELP-(RGD)3-PEI was evaluated by monitoring their temperature-induced aggregation above the inverse phase transition temperature (Tt). Aqueous solutions of each polypeptide (5 mg/mL) were prepared in phosphate buffer (1 mmol/L Na2HPO4, 0.2 mmol/L KH2PO4, 0.27 mmol/L KCl, 13.7 mmol/L NaCl) and subjected to controlled heating from 20 °C to 60 °C at a rate of 1 °C/min in a Cary 100 UV-visible spectrophotometer (Varian Instruments, Palo Alto, CA, USA) with a temperature-controlled multicell holder. The absorbance at 350 nm (A350) was continuously recorded, and the Tt was determined as the temperature at which the derivative of A350 reached its maximum slope.
2.4. Preparation and Characterization of ELP-PEI and ELP-(RGD)3-PEI Coatings
For surface functionalization, ELP-PEI and ELP-(RGD)3-PEI were adsorbed onto 24-well tissue culture polystyrene (TCPS) plates. A total of 200 µL of a 5 mg/mL solution containing 5 mol% of each conjugate was added to each well. The plates were incubated at 37 °C for 48 h to allow solvent evaporation and stable adsorption of the conjugates onto the surface. The wettability of ELP-PEI and ELP-(RGD)3-PEI coatings was assessed through static water contact angle measurements. A Keyence microscope (Osaka, Japan, VHX-1000) was used to measure the contact angle using the sessile drop method, in which a 5 µL droplet of deionized water was placed onto the coated surface. Contact angles were recorded at room temperature after 30 s, with at least two independent measurements taken at different locations on each sample (n = 3 samples).
2.5. 3T3-L1 Cell Culture and Induction of Adiposity
3T3-L1 mouse fibroblasts (American Type Culture Collection, Manassas, VA, USA) were seeded at an approximate density of 26,000 cells/cm2 in each well coated with ELP-PEI and ELP-(RGD)3-PEI. The cells were maintained in Dulbecco’s Modified Eagle Medium (DMEM, Invitrogen, Carlsbad, CA, USA) supplemented with 10% calf serum and 100 U/mL penicillin–100 μg/mL streptomycin. Cultures were incubated at 37 °C with 5% CO2 for three days, during which cells formed 3D spheroids on ELP-PEI-coated and ELP-(RGD)3-PEI-coated TCPS. Following this period, adipogenesis was induced by culturing in DMEM containing 10% fetal bovine serum (FBS), 1 μM dexamethasone, 0.5 mM isobutylmethylxanthine (IBMX), and 0.1 U/mL insulin for three days. Following differentiation, cells were cultured in a maturation medium consisting of Dulbecco’s Modified Eagle Medium (DMEM), supplemented with 2% bovine serum albumin (BSA), 10% fetal bovine serum (FBS), 0.2 U/mL insulin, and 100 U/mL penicillin–100 µg/mL streptomycin. Cells were maintained in this maturation medium for up to 28 days.
2.6. Measurement of Spheroid Size
The spheroid sizes were evaluated using an Olympus IX81 optical microscope (Olympus, Center Valley, PA, USA) at a total magnification of 100×. ImageJ (Version 1.54h) software was used to assess spheroid dimensions for quantitative image analysis. A minimum of 50 spheroids (n > 50) were analyzed for each coating type. The average spheroid sizes were determined for each experimental condition.
2.7. Biochemical Characterization of Cell Lysate
At different time points during the culture period, 3T3-L1 cells were washed with phosphate-buffered saline (PBS) and detached from the culture surface via trypsinization. The collected cell suspensions were centrifuged at 2000 rpm for 2 min, followed by resuspension in PBS. The cells were then lysed, and the samples were subjected to sonication for 30 s at 10% amplitude using a Branson Digital Sonifier 450 (Danbury, CT, USA). All biochemical assays were conducted in triplicate following the manufacturer’s protocols. The CyQuant DNA assay (ThermoFisher Scientific, Waltham, MA, USA) was used to quantify DNA content, while total protein levels were determined using the bicinchoninic acid (BCA) protein assay (ThermoFisher Scientific). Intracellular triglyceride content was measured using an Invitrogen™ Triglyceride (TG) Colorimetric Assay Kit (ThermoFisher Scientific, Waltham, MA, USA).
2.8. Reverse Transcription Polymerase Chain Reaction (RT-PCR)
Spheroids were collected after 3 days of differentiation (M0) and at different time points during the maturation of the adipocytes, i.e., M7, M14, M28. Lysis was performed using 500 μL of TRI Reagent® (Zymo Research, Irvine, CA, USA), followed by total RNA isolation using the Direct-zol™ RNA MicroPrep kit (Zymo Research). RNA concentration was measured by spectrophotometry (NanoDrop, Thermo Fisher Scientific, Masdison, WI, USA), and 200 ng/20 μL was reverse transcribed into complementary DNA (cDNA) using the iScript Reverse Transcription kit (BioRad Laboratories, Hercules, CA, USA). For droplet digital PCR (ddPCR), reactions were prepared using 1 μL of cDNA Supermix (BioRad Laboratories; no dUTP), with 1 μL of TaqMan primer/probes (Applied Biosystems, Foster City, CA, USA) targeting HIF-1α, ADIPOQ, and PPARG. According to the manufacturer’s specifications, the final concentrations were 900 nM for each primer and 250 nM for the probe. Droplet generation was performed using an automated droplet generator (BioRad Laboratories), which partitioned the reaction mixture into nanodroplets. PCR amplification was conducted for 40 cycles following the manufacturer’s instructions. Droplets were subsequently analyzed using the QX200 Droplet Reader (BioRad Laboratories), and copy numbers were quantified using QuantaSoft software (BioRad Laboratories, version 1.7.4.0917).
2.9. Glucose Uptake Assay
The cells were maintained in FBS and insulin-free medium overnight and were washed twice with HBSS buffer, followed by incubation in HBSS buffer for 15 min at 37 °C with 0.2 U/mL of insulin. HBSS without insulin was used as a negative control. The cells were then incubated with 50 μM 2-deoxy-2-[(7-nitro-2,1,3-benzoxadiazol-4-yl) amino]-D-glucose (2-NBDG), a fluorescent glucose analog, in HBSS buffer at 37 °C for 30 min. The cells were then washed with HBSS and lysed with RIPA buffer supplemented with protease and phosphatase inhibitors. The fluorescence was then measured at an excitation wavelength of 465 nm and an emission wavelength of 540 nm.
2.10. Statistical Analysis
Data were first assessed for normality using the Shapiro–Wilk test. For comparisons between two groups on the same day, data that did not meet the assumptions of normality were analyzed using the non-parametric Mann–Whitney U test. For comparisons involving two or more groups with multiple factors, the Kruskal–Wallis test followed by Dunn’s multiple comparisons test was used when data were not normally distributed. When data met the assumptions of normality, a two-way analysis of variance (ANOVA) was performed, followed by a post hoc Tukey’s test for pairwise comparisons. All data are presented as mean ± 95% confidence interval. Statistical significance was defined as p ≤ 0.05. All statistical analyses were performed using GraphPad Prism software (version 10.4.2; GraphPad Software, San Diego, CA, USA).
3. Results
In our previous study, ELP-(RGD)
3-PEI enhanced spheroid retention by facilitating integrin-mediated adhesion, which improved cellular attachment and reduced spheroid displacement over time [
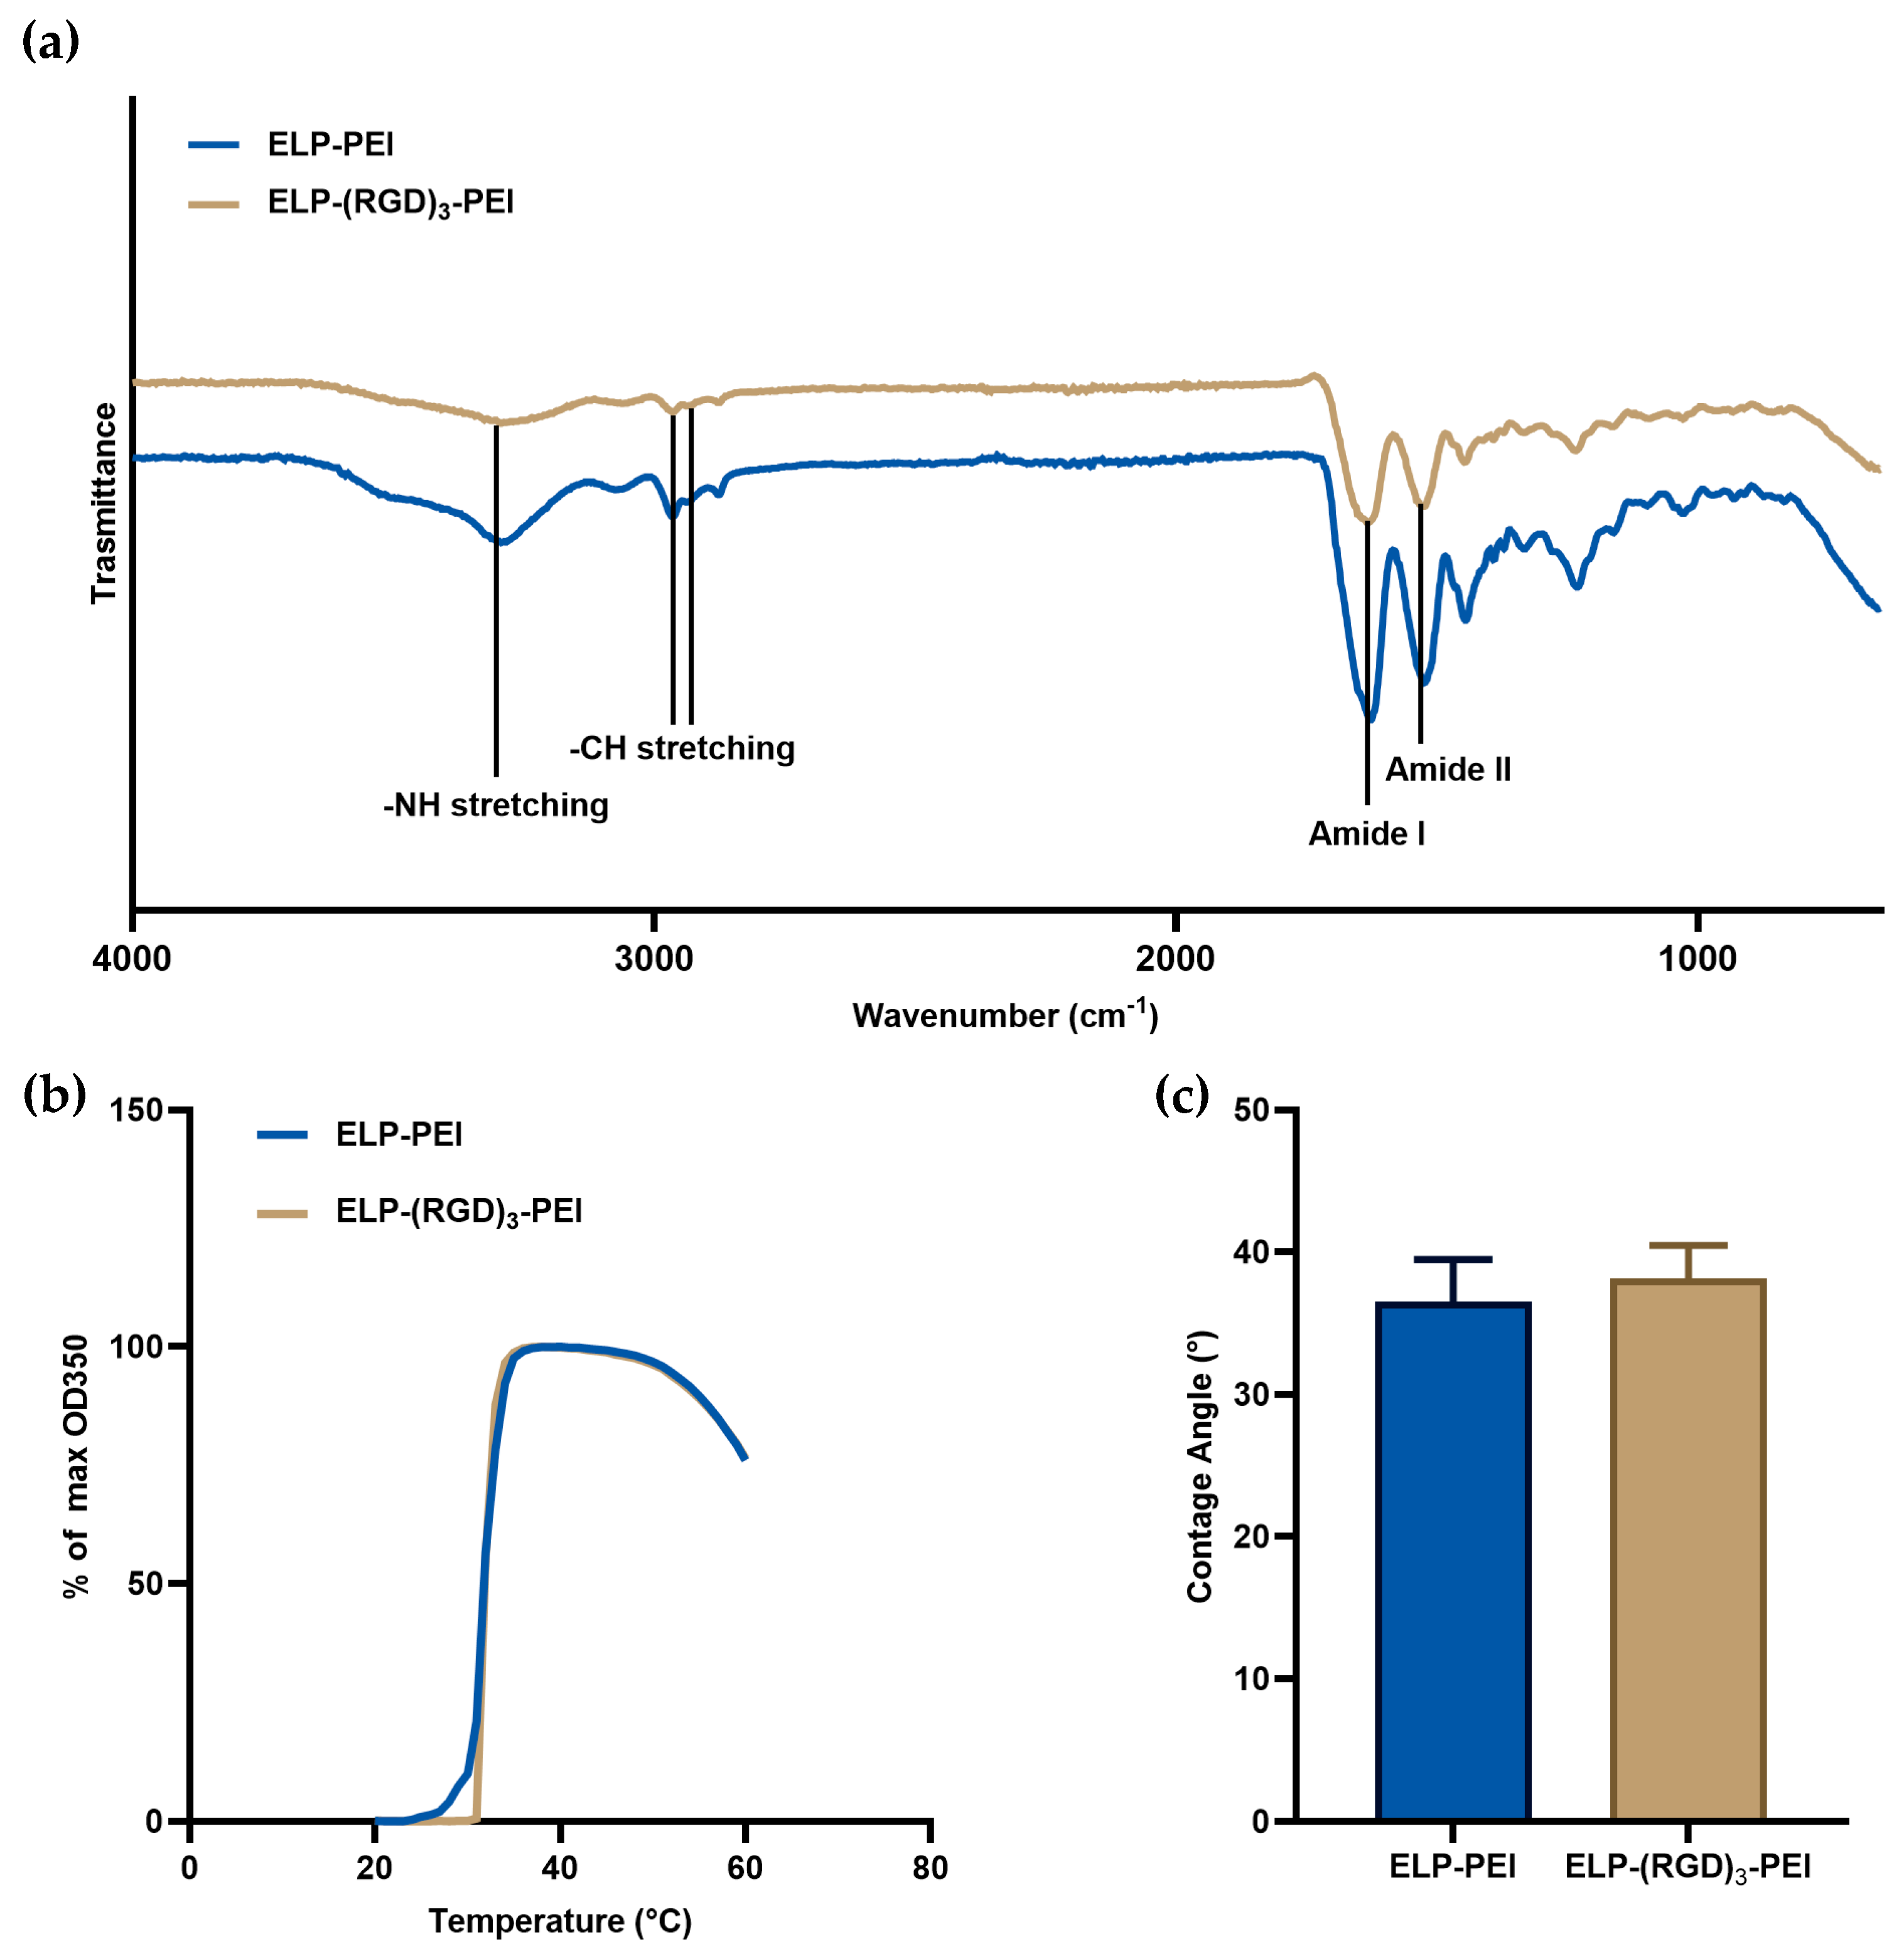
13]. To confirm that incorporating RGD into ELP-PEI does not alter its coating properties, turbidimetry and ATR-FTIR analyses were performed, shown in
Figure 1a. ATR-FTIR spectroscopy was performed to examine the chemical signatures of ELP-PEI and ELP-(RGD)
3-PEI. The spectra of both constructs displayed characteristic amide I and amide II bands, confirming the retention of ELP’s structural integrity. No significant shifts in peak positions or the emergence of new peaks were observed, indicating that the incorporation of (RGD)
3 did not introduce major alterations in the material’s chemical composition or secondary structure. Turbidimetry was used to assess the phase transition behavior of ELP-PEI and ELP-(RGD)
3-PEI to determine if RGD incorporation affected the thermal responsiveness of the material. Both constructs exhibited similar inverse phase transition temperatures (T
t) of 31.1 ± 0.1 and 31.0 ± 0.1 °C for ELP-PEI and ELP-(RGD)
3-PEI, respectively, indicating that the addition of the (RGD)
3 motif did not significantly alter the inverse phase transition behavior of ELP (
p > 0.05,
Figure 1b). The surface wettability of ELP-PEI and ELP-(RGD)
3-PEI coatings was assessed using water contact angle measurements. The water contact angles were 36.5 ± 3.0° and 38.2 ± 2.3° for the ELP-PEI and ELP-(RGD)
3-PEI coatings, respectively, with no statistically significant difference between the two groups (
p > 0.05,
Figure 1c). These results indicate that the incorporation of the (RGD)
3 motif does not substantially alter the hydrophilicity of the ELP-PEI coating.
3T3-L1 fibroblasts were seeded onto ELP-PEI and ELP-(RGD)
3-PEI substrates, where they aggregated over a 3-day culture period, forming spheroidal structures (
Figure 2a). Spheroid diameters were quantified three days post-seeding (D3), with mean diameters of 58.4 ± 2.6 µm and 57.8 ± 1.5 µm for cells cultured on ELP-PEI and ELP-(RGD)
3-PEI, respectively, as shown in
Figure 2b. Statistical analysis revealed no significant difference in spheroid diameters between the two substrate conditions (
p > 0.05), indicating that the initial cell aggregation and spheroid formation were comparable regardless of the presence of the RGD motif. On ELP-PEI coatings, spheroids exhibited progressive enlargement during adipogenic differentiation and maturation, maintaining their 3D structure throughout the culture period (
Figure 2c). The mean spheroid diameters increased to 75.3 ± 3.8 µm after three days of differentiation (M0), 88.5 ± 6.7 µm after seven days of maturation (M7), 104.2 ± 8.3 µm after fourteen days of maturation (M14), and 111.1 ± 11.7 µm after twenty-eight days of maturation (M28). This sustained increase in spheroid size suggests that ELP-PEI provides a supportive microenvironment for 3D adipogenic differentiation, likely facilitating ECM deposition and intracellular lipid accumulation characteristic of mature adipocytes. In contrast, spheroids formed on ELP-(RGD)
3-PEI surfaces exhibited time-dependent cell–substrate interactions. Despite initial spheroid formation on ELP-(RGD)
3-PEI surfaces, these structures gradually disassembled, leading to the formation of a 2D monolayer culture. The disassembly process suggests that the presence of the RGD motif may have enhanced cell–substrate adhesion while reducing cell–cell cohesion, thereby disrupting the maintenance of the spheroid architecture. However, by day 28 (M28), spheroids reformed on ELP-(RGD)
3-PEI coatings and exhibited a substantial increase in size, with an average diameter of 3941.2 ± 1642.6 μm (n = 5,
Figure 2d). This pronounced enlargement may be attributed to continued cell proliferation over the extended culture period.
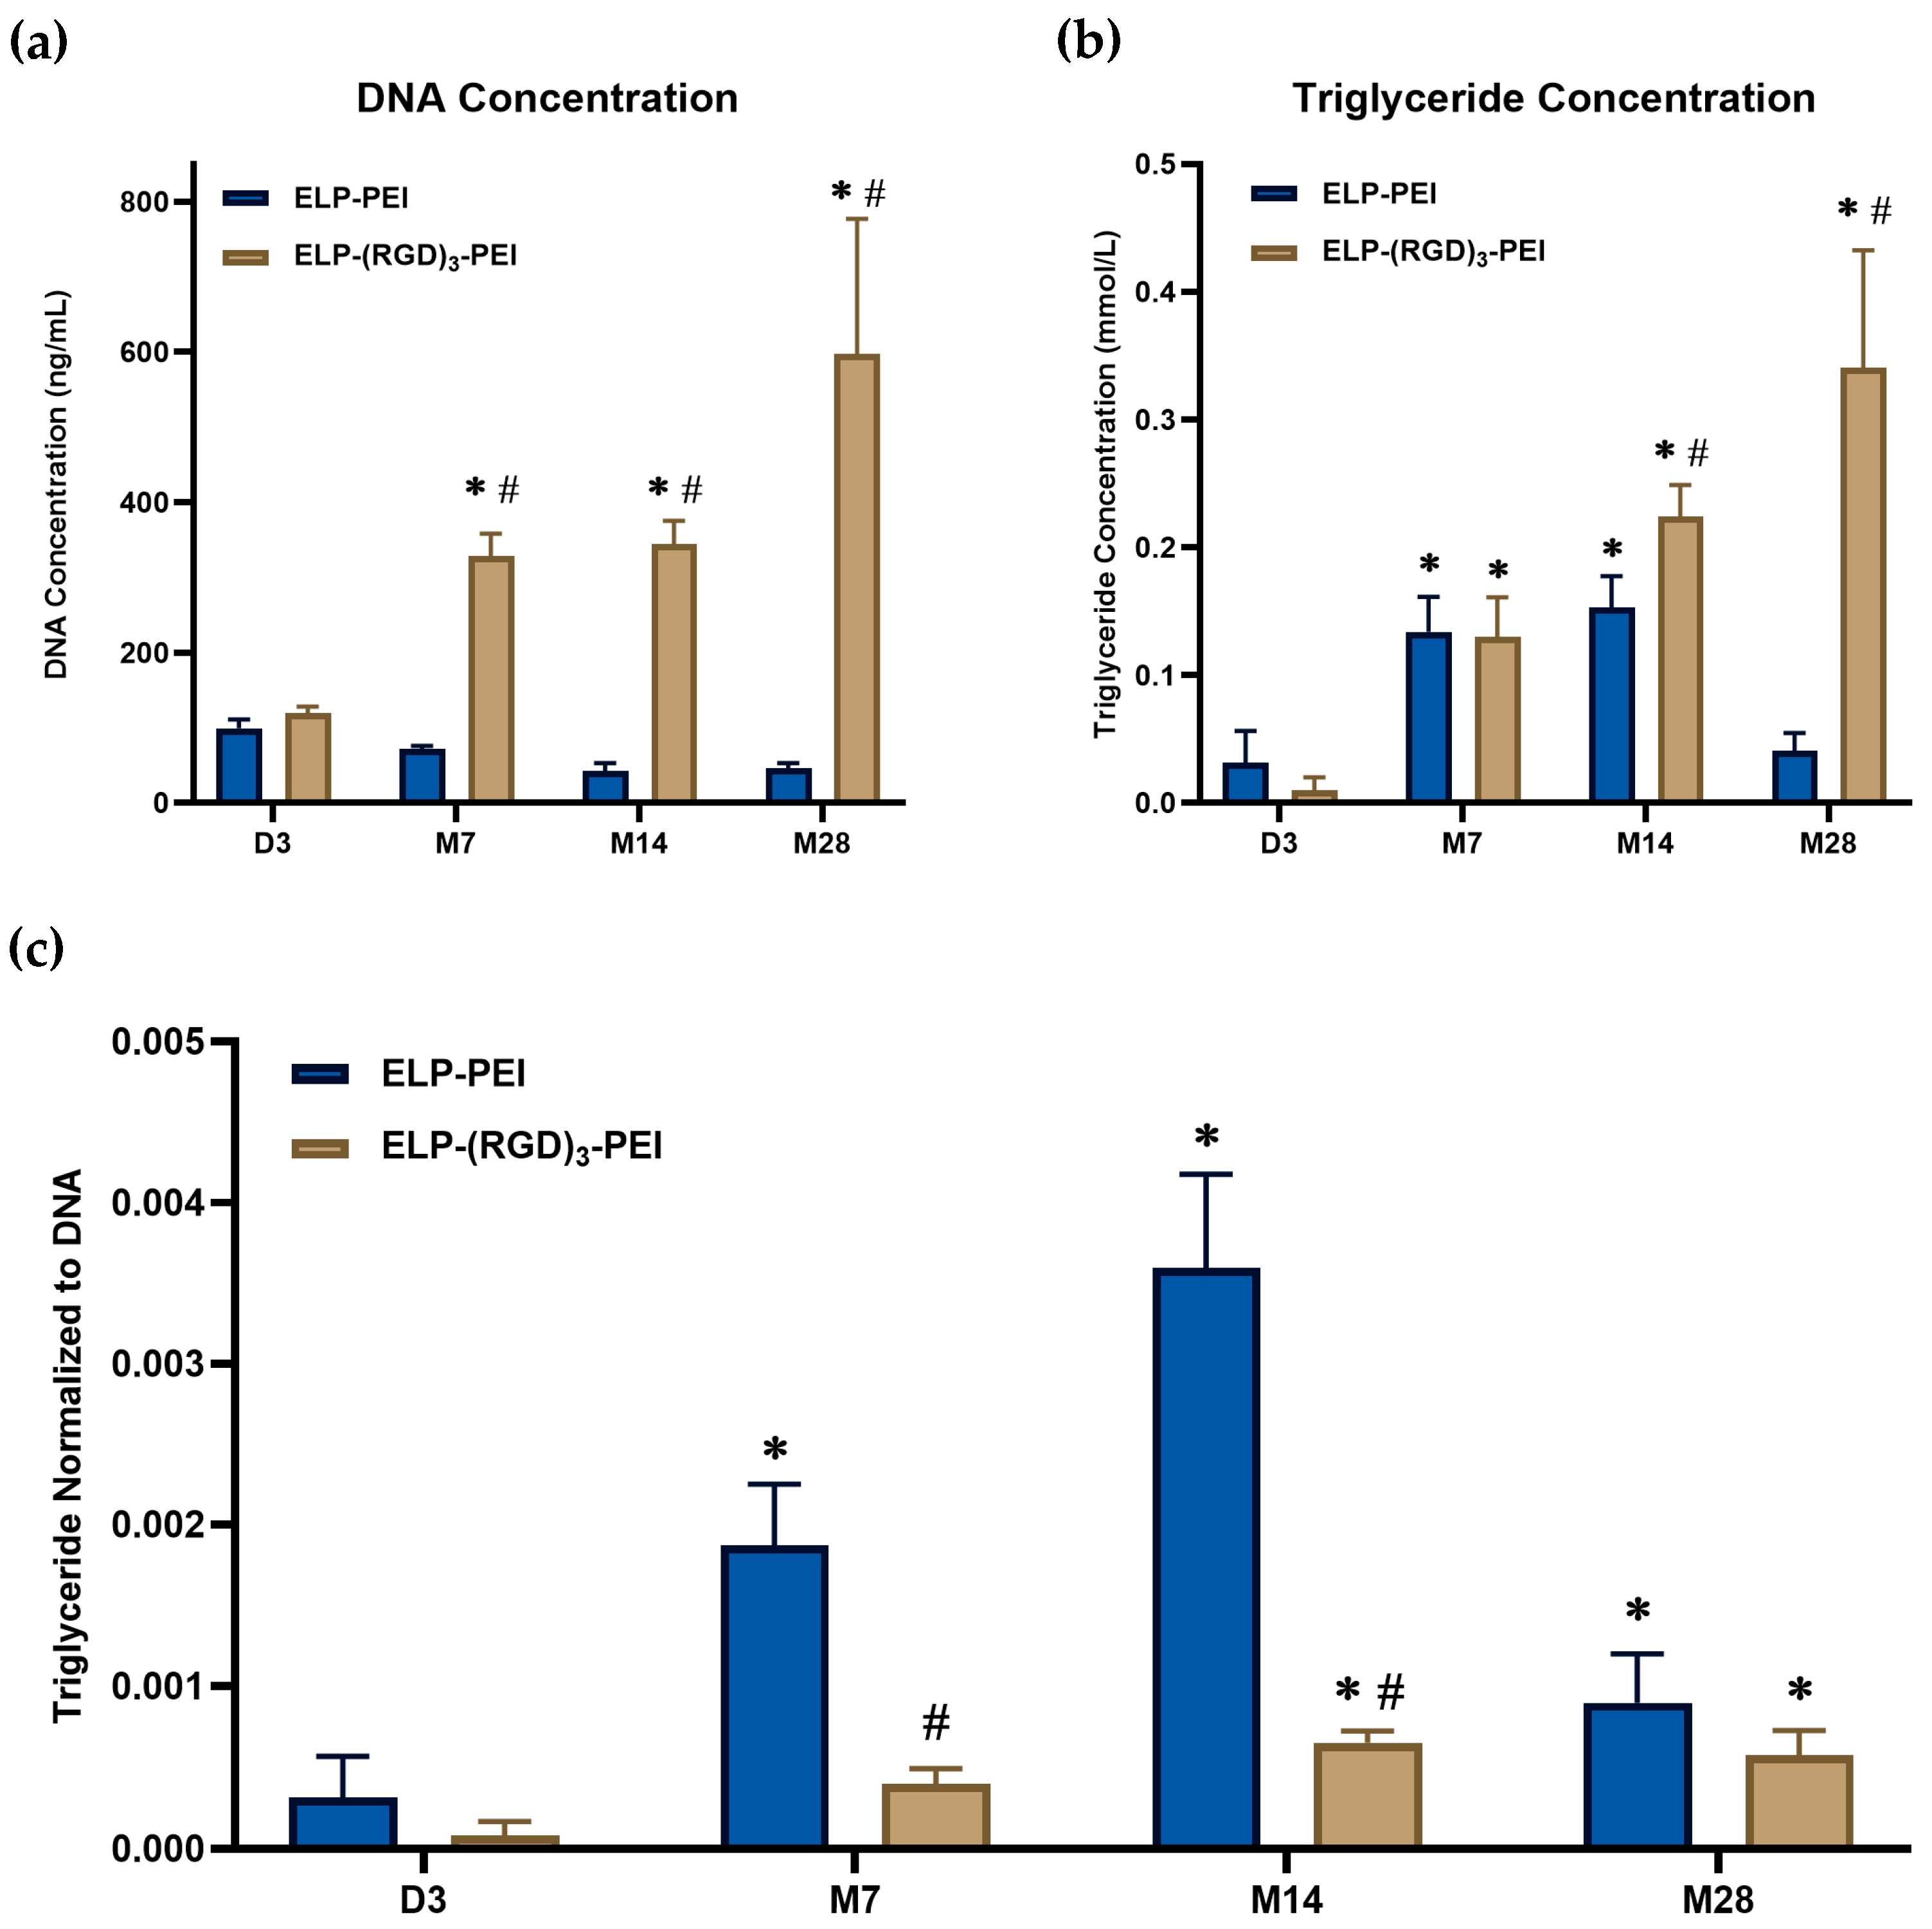
To assess cell proliferation and viability, DNA concentration was measured in cells cultured on ELP-PEI and ELP-(RGD)
3-PEI, shown in
Figure 3a. On D3, DNA concentrations were comparable between cells cultured on both coatings, indicating similar initial cell densities. However, in spheroids cultured on ELP-PEI, DNA concentration progressively declined after D3, continuing until M28. This decline suggests a cessation of proliferation and potential spheroid loss over time. In contrast, cells cultured on ELP-(RGD)
3-PEI exhibited a 2.75-fold increase in DNA concentration on M7, which continued to rise until M28, indicating sustained cell proliferation. The increase in DNA content suggests that the presence of RGD-functionalized ELP promoted cell adhesion and growth, supporting prolonged spheroid retention and cell proliferation.
Triglyceride quantification is a widely used biochemical assay to assess adipogenic differentiation, as triglycerides serve as the primary form of lipid storage in mature adipocytes. During adipogenesis, preadipocytes undergo a series of morphological and biochemical changes, including lipid droplet formation and triglyceride accumulation, which are indicative of cellular maturation along the adipogenic lineage. Measuring intracellular triglyceride levels provides a quantitative means to evaluate the extent of adipogenic differentiation and lipid metabolism within cultured cells. In this study, triglyceride content was measured to monitor the adipogenic progression of spheroids cultured on ELP-PEI and ELP-(RGD)
3-PEI coatings. By analyzing triglyceride levels over time, the maturation of adipocytes within spheroids can be assessed, providing insights into the influence of biomaterial coatings on adipogenic differentiation and lipid metabolism. Spheroids cultured on ELP-PEI exhibited a progressive increase in triglyceride levels over time till M14, indicating sustained differentiation along the adipogenic lineage, as shown in
Figure 3b. A 4-fold increase in triglyceride accumulation was observed from D3 to M7, indicating progressive differentiation and lipid accumulation. This elevated triglyceride content was maintained through M14. However, by M28, a decline in triglyceride levels was observed, potentially due to spheroid loss. This trend suggests that the ELP-PEI coating provides a favorable microenvironment for adipogenesis, supporting lipid accumulation within the spheroids. Interestingly, in cells cultured on ELP-RGD-PEI, a similar 4-fold increase in triglyceride content was observed at M7, but unlike ELP-PEI, the triglyceride levels continued to increase through M28.
Normalization of triglyceride with the DNA content ensures an accurate comparison of lipid accumulation in spheroids across different culture conditions. As shown in
Figure 3c, the normalized triglyceride levels increased progressively in spheroids maintained on ELP-PEI, indicating sustained adipogenic maturation up to M14, followed by a decline at M28, potentially due to spheroid loss. In contrast, cells cultured on ELP-(RGD)
3-PEI exhibited a less pronounced increase in the normalized triglyceride content, which could be due to dissociation of the spheroids to 2D culture, leading to less lipid accumulation. This suggests that RGD induced greater cell proliferation and inferior lipid accumulation per cell.
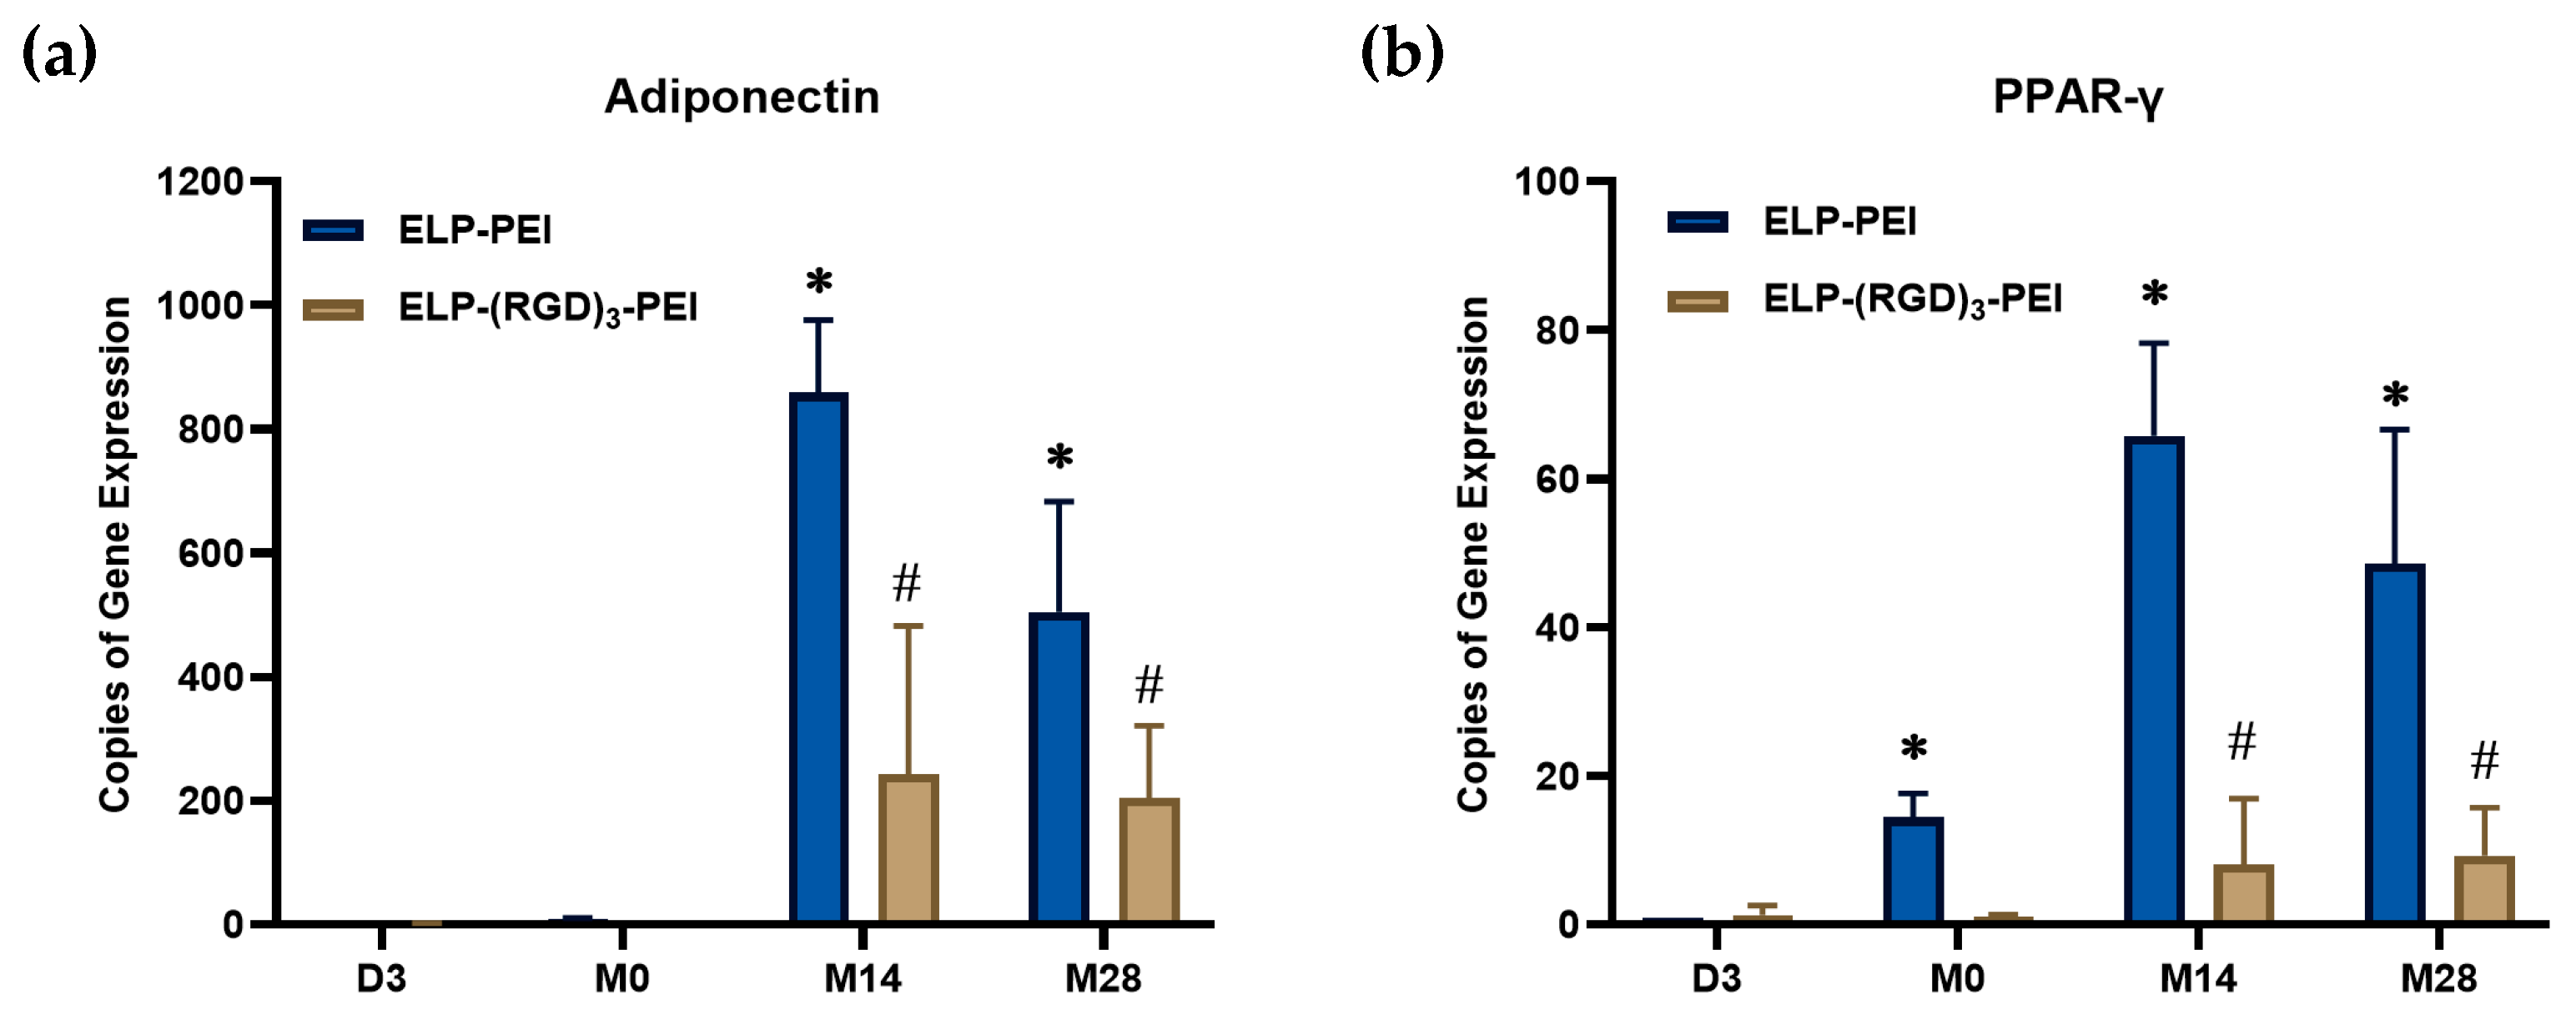
Adiponectin expression was measured over time to evaluate adipogenic maturation in spheroids cultured on ELP-PEI and ELP-(RGD)
3-PEI, as represented in
Figure 4a. No detectable expression was observed at D3 and M0 for either condition, which is expected, as at D3, the cells remained in their preadipocyte state, and at M0, they had only recently undergone differentiation into the adipogenic lineage. A significant increase in adiponectin expression was observed at M14 for spheroids cultured on ELP-PEI (
p ≤ 0.05 compared to M0), indicating robust adipogenic maturation, as adiponectin is a key adipokine secreted by mature adipocytes and plays a crucial role in metabolic regulation. However, its expression decreased at M28 (
p ≤ 0.05 compared to M14), which may be attributed to potential changes in spheroid retention, cellular senescence, or alterations in the microenvironment affecting adipocyte function at later stages of culture. Similarly, cells cultured on ELP-(RGD)
3-PEI exhibited no adiponectin expression at D3 and M0, followed by an increase at M14 and M28 (
p ≤ 0.05 compared to M0). However, the adiponectin levels in these spheroids were lower than those observed in spheroids cultured on ELP-PEI (
p ≤ 0.05), suggesting that the ELP-(RGD)
3-PEI coating may not support adipogenic maturation as effectively. This difference in adiponectin expression highlights the potential impact of biomaterial composition on adipocyte function and the extent of adipogenic differentiation.
Peroxisome proliferator-activated receptor gamma (PPAR-γ) expression was measured over time to assess the progression of adipogenic differentiation in cells cultured on ELP-PEI and ELP-(RGD)
3-PEI, represented in
Figure 4b. PPAR-γ is a key transcription factor that regulates adipogenesis by promoting lipid accumulation and adipocyte-specific gene expression. In spheroids cultured on ELP-PEI, PPAR-γ expression increased progressively over time, reaching its highest levels at M14 (
p ≤ 0.05 compared to M0) and maintaining a similar expression level at M28 (
p > 0.05 compared to M14). This sustained expression suggests a stable commitment of the cells to the adipogenic lineage. Interestingly, cells cultured on ELP-(RGD)
3-PEI also exhibited an increase in PPAR-γ expression over time, with the highest levels observed at M14 and M28 (
p ≤ 0.05 compared to M0). However, the overall rise in PPAR-γ expression in the cells cultured on ELP-(RGD)
3-PEI was less pronounced compared to spheroids on ELP-PEI (
p ≤ 0.05), again indicating a potentially lower efficiency of adipogenic differentiation. Interestingly, for both substrate conditions, PPAR-γ expression at M14 and M28 remained comparable (
p > 0.05), suggesting that the peak adipogenic differentiation was achieved by M14 and maintained through M28 without further upregulation at the later time point.
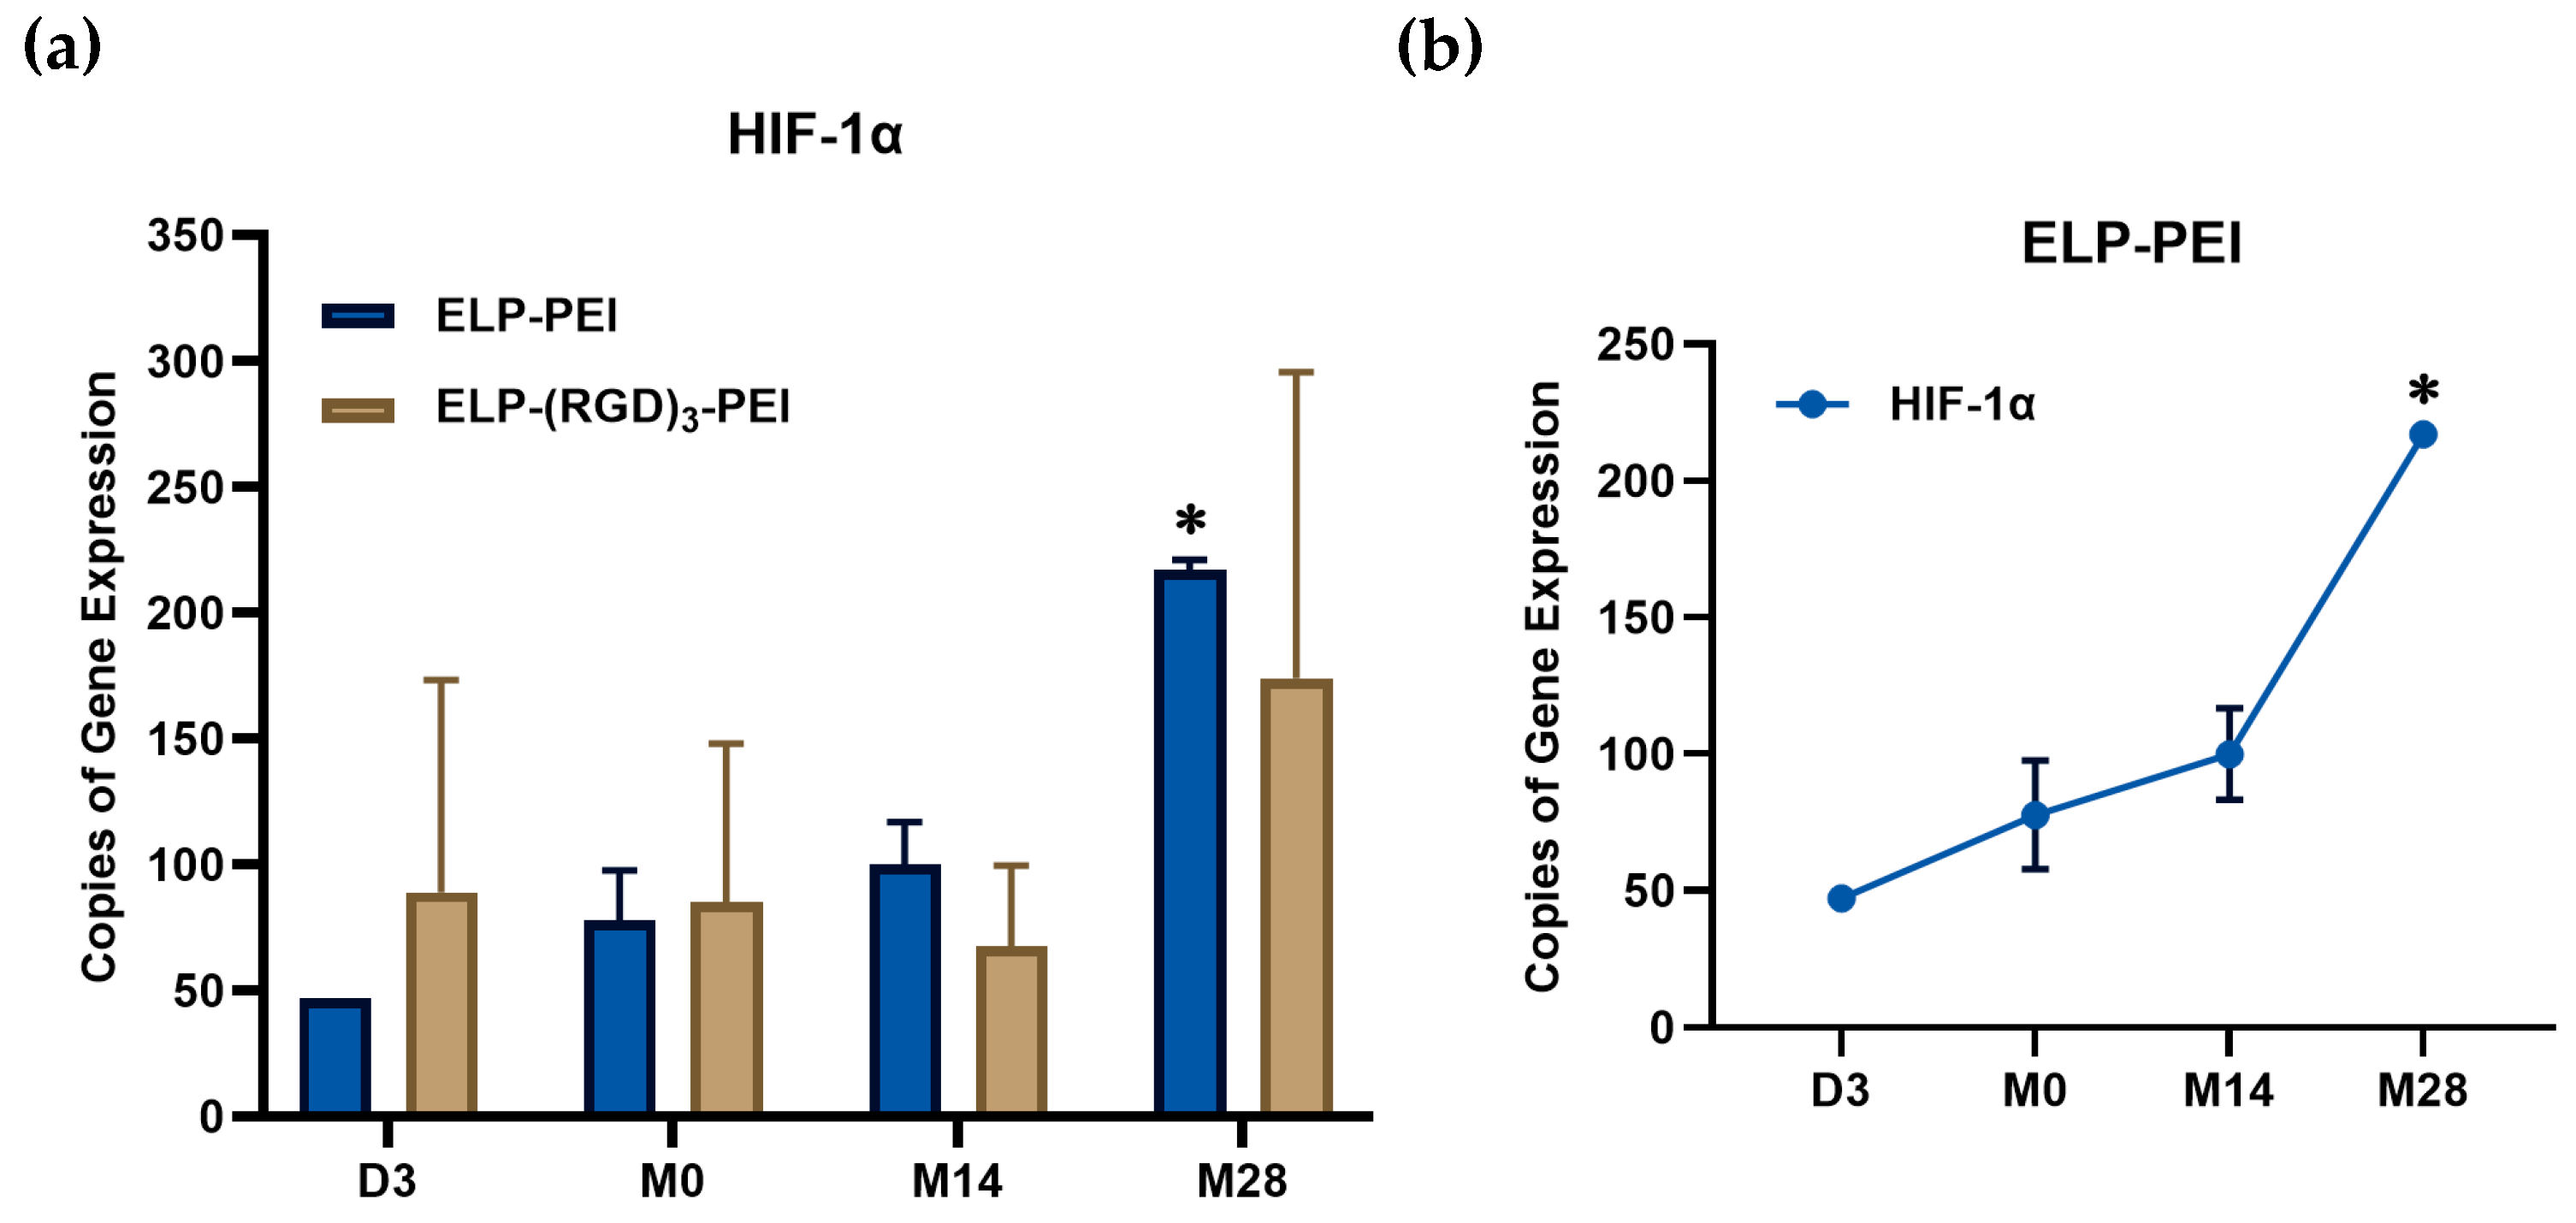
The expression of hypoxia-inducible factor-1 alpha (HIF-1α) mRNA was quantified over time in spheroids cultured on ELP-PEI and ELP-(RGD)
3-PEI using droplet digital PCR (ddPCR), as shown in
Figure 5a. HIF-1α is a key transcription factor that regulates cellular adaptation to hypoxia and is often upregulated in 3D cultures due to oxygen diffusion limitations. In spheroids cultured on ELP-PEI, HIF-1α expression progressively increased with spheroid growth, reaching its highest levels at M28 (
p ≤ 0.05 compared to M0). In contrast, despite the increase in mean value, cells cultured on ELP-(RGD)
3-PEI did not exhibit a statistically significant increase in HIF-1α expression over time between M14 and M28. Given that these spheroids progressively disassembled into a 2D monolayer culture, the lack of HIF-1α upregulation further supports the notion that a stable 3D microenvironment is necessary to induce hypoxic responses. These findings highlight the role of biomaterial composition in influencing spheroid retention and cellular adaptation to microenvironmental cues.
Figure 5b summarizes the mRNA expression levels of hypoxia-related gene expression in spheroids cultured on ELP-PEI over time and compares them with spheroid diameter. It is observed that as spheroids increased in size, there was a corresponding increase in HIF-1α expression, with the highest levels observed at M28 when spheroids reached an average diameter of 111.1 ± 11.7 µm. This trend suggests that as spheroids mature and expand, hypoxic conditions may intensify, leading to increased HIF-1α transcriptional activation [
14]. Similarly, PPAR-γ expression progressively increased with time, reaching peak levels at M14 and remaining stable at M28, indicating sustained adipogenic differentiation. Adiponectin expression was absent at D3 and M0, as expected since the cells were still in their preadipocyte or early differentiation stage. However, its expression peaked at M14, signifying adipocyte maturation, before declining at M28, potentially due to spheroid instability or changes in adipocyte function at later time points. These findings demonstrate a correlation between spheroid growth and gene expression changes associated with hypoxia adaptation and adipogenic progression. The increase in HIF-1α with spheroid size suggests the development of a hypoxic core, while the trends in PPAR-γ and adiponectin confirm the timeline of adipogenic maturation, with M14 marking a critical stage of differentiation.
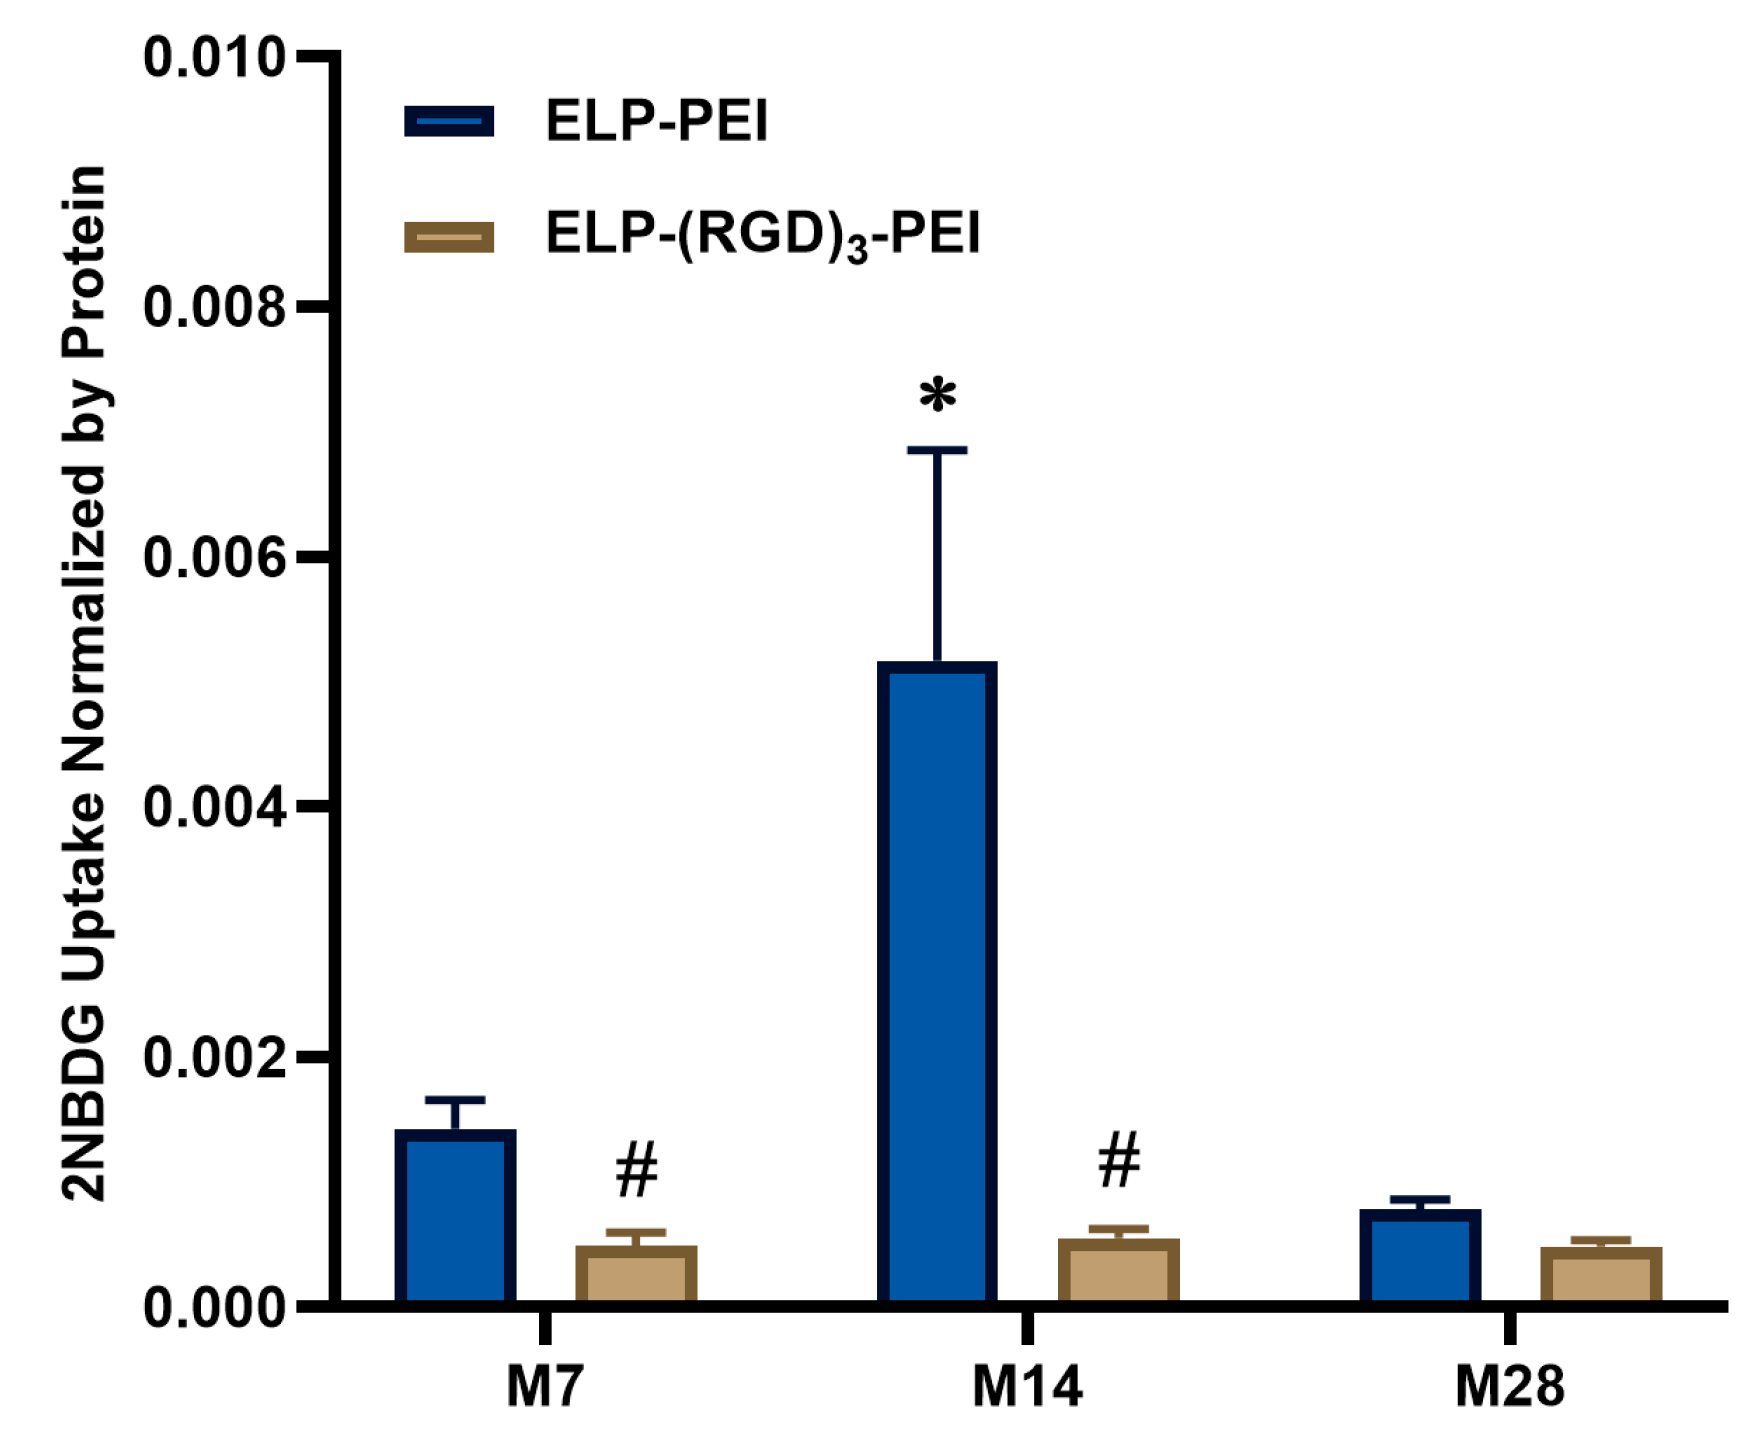
Figure 6 shows the results obtained from the 2-NBDG glucose uptake assay, normalized by protein content, which demonstrate differences in glucose metabolism between cells cultured on ELP-PEI and ELP-(RGD)
3-PEI surfaces over time and in response to insulin stimulation. At M7, 2-NBDG uptake remained low across all conditions, with no substantial differences between cells cultured on ELP-PEI and ELP-(RGD)
3-PEI, irrespective of insulin treatment. At M14, a significant increase in glucose uptake was observed for spheroids cultured on ELP-PEI, particularly in the presence of insulin, indicating enhanced insulin responsiveness and metabolic activity at this stage of adipogenic maturation. The ELP-PEI (+insulin) condition exhibited the highest glucose uptake. In contrast, cells cultured on ELP-(RGD)
3-PEI displayed markedly lower glucose uptake, suggesting impaired metabolic function or reduced insulin sensitivity. By M28, 2-NBDG uptake decreased for spheroids cultured on ELP-PEI coating. This decline may be attributed to adipocytes becoming insulin resistant during hypoxic conditions. Overall, these results suggest that ELP-PEI coatings support adipogenic maturation and insulin-responsive glucose uptake. In contrast, ELP-(RGD)
3-PEI coatings result in reduced metabolic activity and diminished insulin sensitivity in spheroid cultures.
4. Discussion
Previous studies have underscored the critical role of ECM interactions in regulating the differentiation of mesenchymal cells and the necessity of selecting an appropriate environment for lineage-specific differentiation [
15,
16,
17,
18,
19,
20]. In the context of adipogenesis, these interactions become particularly significant as adipogenic cells remodel their surrounding matrix, creating conditions that allow for the accumulation of lipids and the expansion of cell volume into a hypertrophic morphology [
21,
22]. This process is often facilitated by the secretion of matrix metalloproteinases (MMPs), which soften the matrix and allow for cellular expansion and differentiation. Consistent with these findings, our study highlights how the material composition of the substrate, specifically the presence of the RGD peptide, influences the behavior of 3T3-L1 preadipocytes, modulating their ability to undergo adipogenic differentiation.
Our results showed that the ELP-PEI substrate provides a microenvironment conducive to maintaining spheroid integrity and promoting adipogenesis, as evidenced by the sustained increase in spheroid size and triglyceride accumulation over time. This observation aligns with previous studies demonstrating the importance of maintaining 3D cellular architectures to support adipogenic progression [
8]. In contrast, the inclusion of the RGD sequence in the ELP-(RGD)
3-PEI substrate led to a disruption of spheroid retention, with cells transitioning to a 2D monolayer over time. The dynamic remodeling of cell organization on ELP-(RGD)
3-PEI coatings reflects a complex interplay between cell–substrate and cell–cell interactions modulated by the surface-bound RGD motif. Between M7 and M14, spheroids progressively disassemble and transition into a 2D monolayer morphology, driven by enhanced integrin engagement (e.g., α5β1 and αvβ3) with the RGD-functionalized surface [
11]. This strong cell–substrate adhesion likely disrupts cadherin-mediated intercellular junctions critical for maintaining spheroid integrity. Concurrently, integrin clustering activates the Rho/ROCK signaling pathway, promoting actomyosin contractility and cytoskeletal tension that further destabilize cell–cell cohesion and promote cell spreading. As cytoskeletal tension rises, cell–cell adhesion becomes destabilized, leading to the breakdown of the 3D structure. This mechanically induced transition is further amplified by the loss of 3D confinement and the associated spatial cues that typically support spheroidal morphology. Collectively, these processes drive the transition to a 2D architecture during the early stages of adipogenic maturation, ultimately altering the microenvironment and impeding adipogenic progression.
The re-assembly and pronounced enlargement of spheroids at M28 on ELP-(RGD)
3-PEI coatings, following an initial period of disassembly and monolayer formation, suggest a dynamic interplay between cell–substrate and cell–cell interactions modulated by the surface-bound RGD sequence. As the RGD motif initially promotes strong integrin-mediated adhesion, this enhanced substrate attachment may disturb early spheroid cohesion and encourage increased cell–ECM interaction, leading to 2D spreading. Over a prolonged culture period, integrin recycling and redistribution can occur [
23]. Such integrin redistribution, as well as increasing cell density, may facilitate reaggregation into 3D structures [
24]. Additionally, cells actively secrete ECM proteins over the prolonged culture period, which can modify the biochemical and mechanical cues to the cells [
25]. This newly deposited ECM may gradually diminish the dominance of the RGD sequences and favor cell–cell cohesion and compaction. Moreover, cytoskeletal tension and cellular contractility, which increase with cell confluency and differentiation, could contribute to tension-driven aggregation and multicellular reorganization. Taken together, these factors likely contribute to the formation of large spheroid-like structures observed at M28.
Transcriptome analysis conducted by Turner et al. has shown significant gene expression changes in cells cultured in 3D spheroids compared to 2D monolayers [
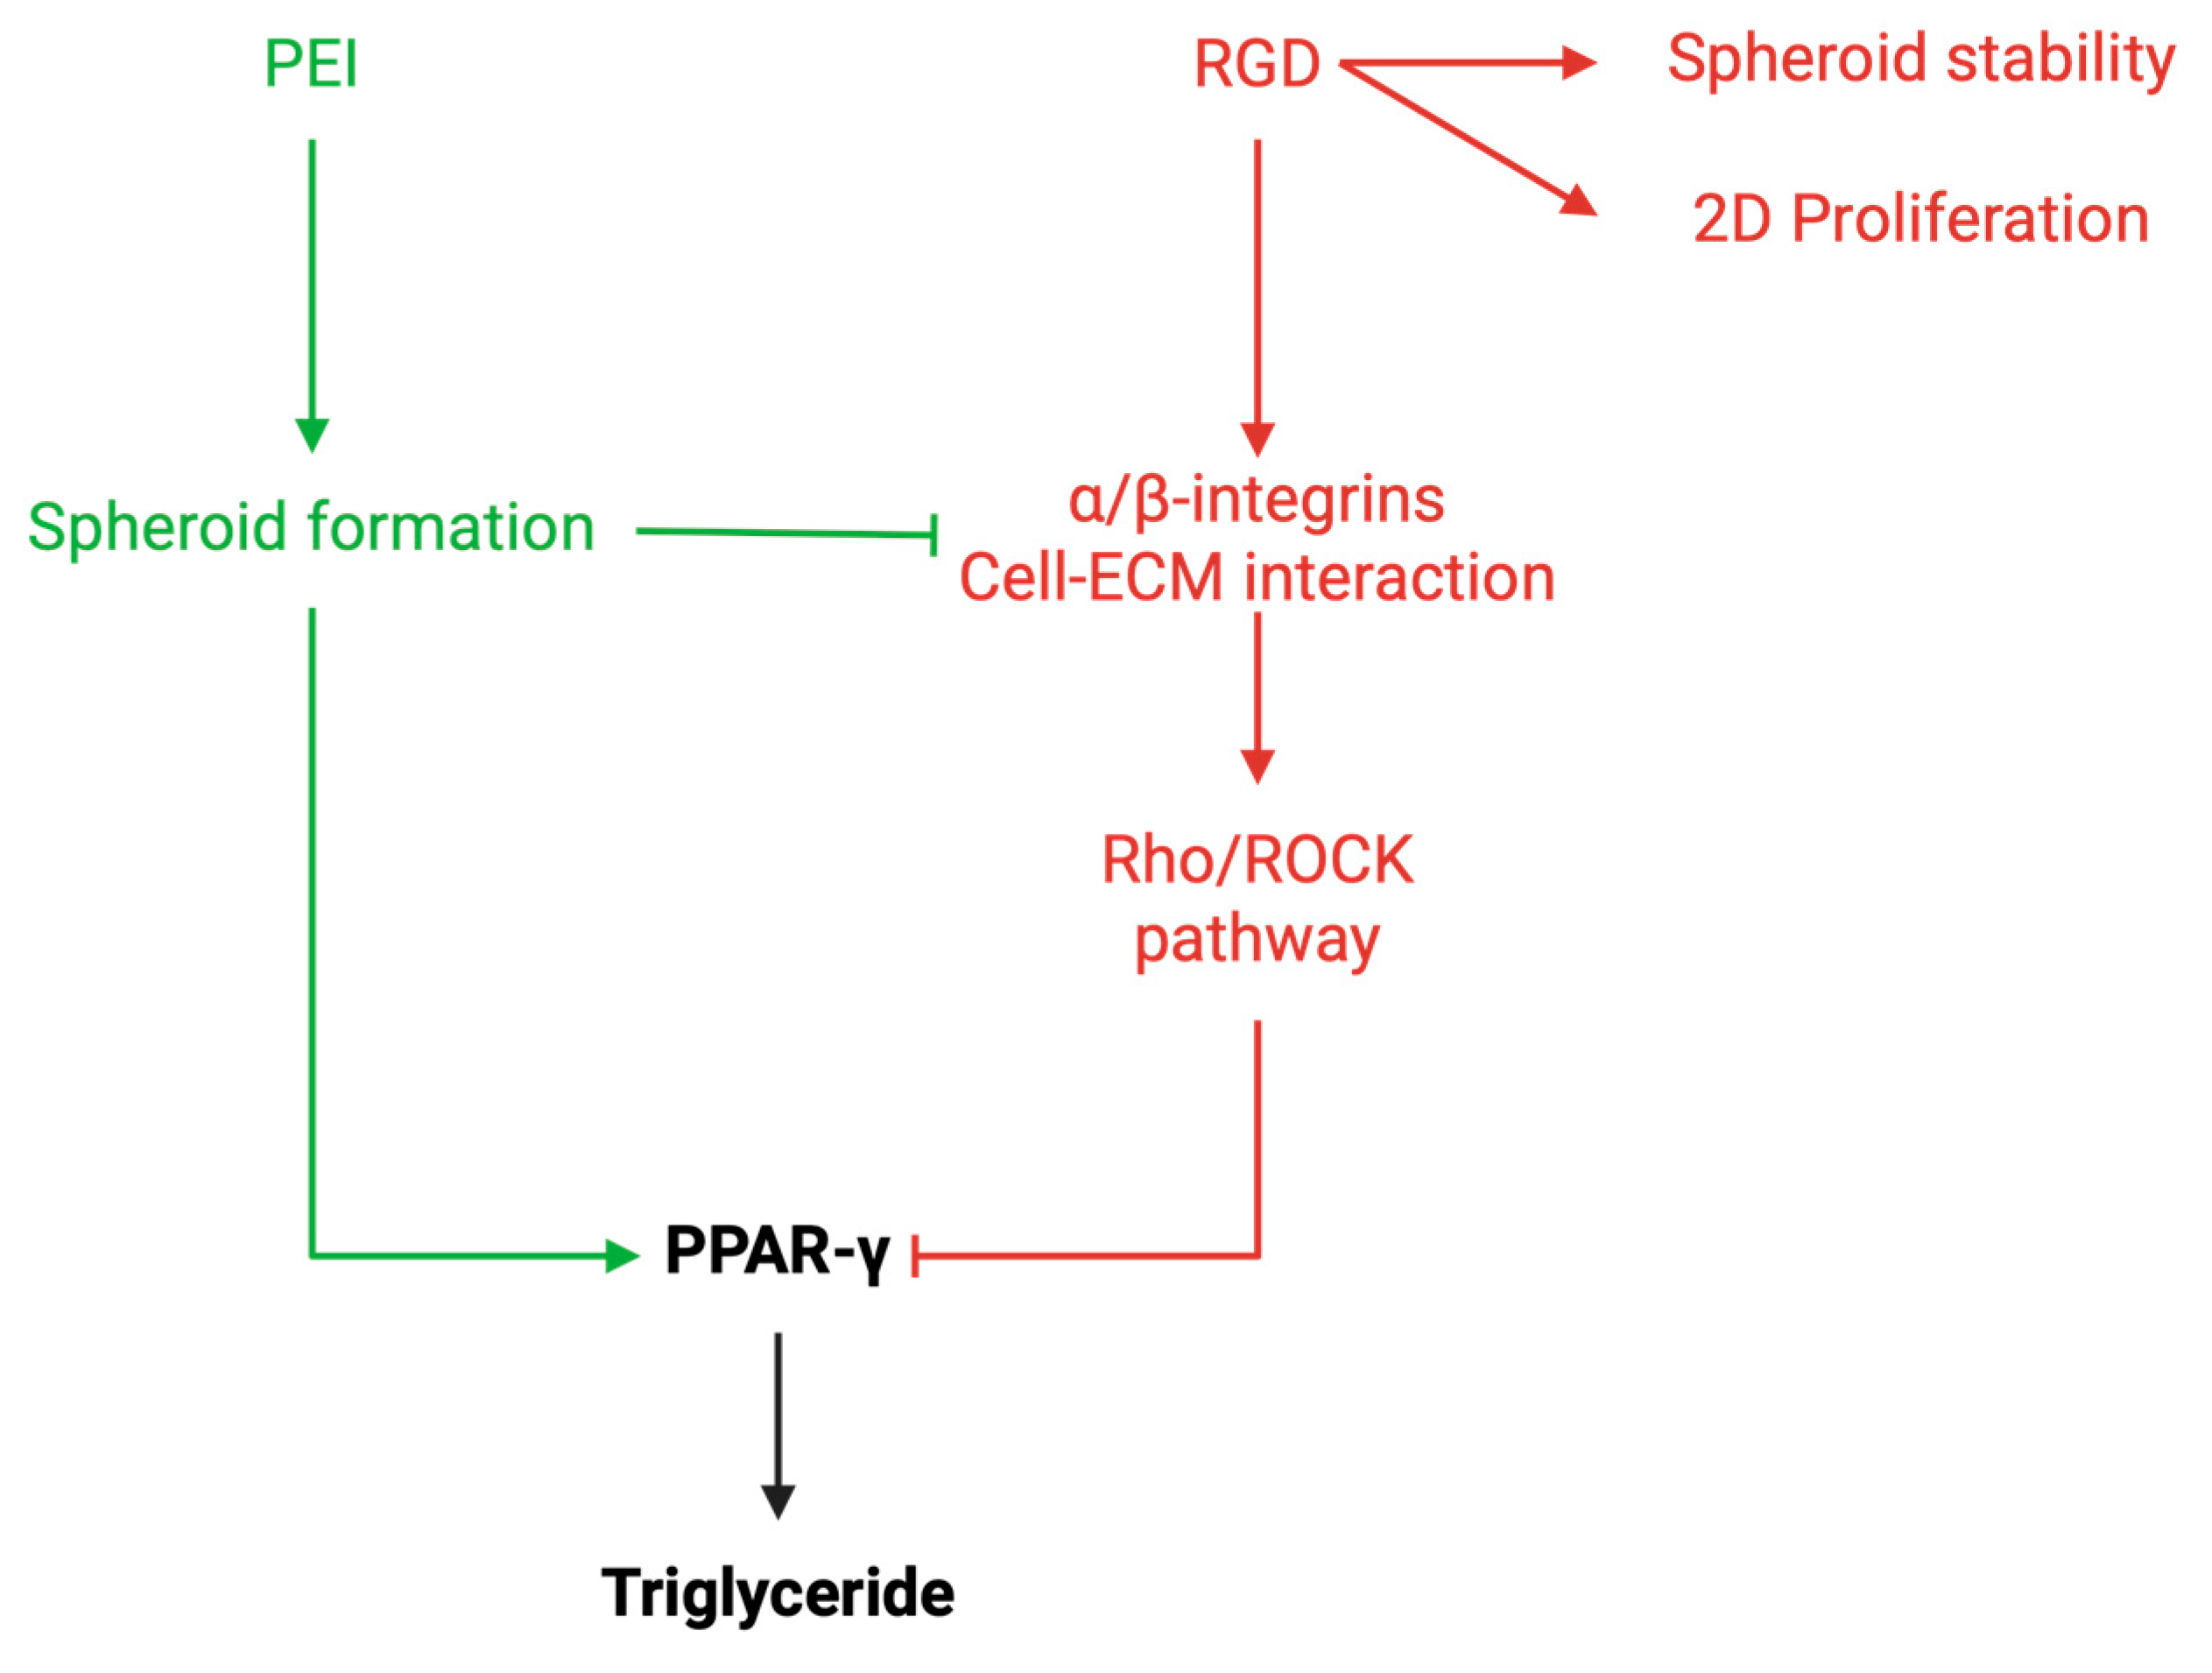
8]. Specifically, there was a 1.2-fold downregulation of integrin subunits (α and β), actin isoforms (α and γ), and Rho/GTPase3, alongside a 1.2-fold upregulation of PPAR-γ, a crucial transcription factor for adipogenesis. The downregulation of integrins and Rho/GTPase3 suggests that the reduced integrin–ECM interactions in the 3D spheroid model contribute to the suppression of the Rho-ROCK pathway, which is known to inhibit PPAR-γ expression and adipogenesis. This reduction in Rho signaling may promote adipogenic differentiation by allowing PPAR-γ expression to proceed unimpeded. As Rho signaling has been shown to act as an inhibitor of adipogenesis, its reduced expression in the 3D spheroid cultures likely contributes to the promotion of adipogenic differentiation. The upregulation of PPAR-γ, along with other adipogenic markers, indicates that the 3D spheroid environment, by limiting stable integrin binding and subsequent activation of the Rho/ROCK pathway, favors adipogenesis (Green arrows in
Figure 7).
In this study, the ELP-(RGD)
3-PEI substrate, which contains the RGD motif, offered insights into how integrin interactions influence adipocyte differentiation. The RGD peptide promotes cell adhesion by binding to integrins, such as α
5β
1, that anchor cells to the ECM. However, our results indicate that while RGD facilitated cell–substrate adhesion, it also disrupted the cell–cell cohesion, leading to the disassembly of spheroids into a more 2D-like monolayer culture. This alteration in the 3D structure likely affected the differentiation process, as the lack of a stable 3D spheroid environment may have prevented the cells from receiving the proper mechanical and biochemical cues necessary for adipogenesis. Additionally, the ELP-(RGD)
3-PEI substrate may have led to enhanced integrin binding to the surface, triggering the activation of the Rho/ROCK pathway and potentially suppressing the adipogenic differentiation process (red arrows in
Figure 7). This effect was reflected in the reduced expression of key adipogenic markers, such as adiponectin and PPAR-γ, in spheroids cultured on ELP-(RGD)
3-PEI compared to those on ELP-PEI.
Spheroid size is a critical determinant of adipocyte function in 3D culture, primarily due to limitations in oxygen and nutrient diffusion. The oxygen diffusion distance in biological tissues is generally estimated to be ~100–200 µm; beyond this range, cells experience reduced oxygen availability, often leading to hypoxia or necrotic core formation. Several studies have shown that larger spheroids (>500 μm in diameter) often experience nutrient and oxygen diffusion limitations, leading to the development of hypoxic cores, necrotic zones, or altered signaling cascades that mimic features of hypertrophic adipose tissue. In our study, spheroids on ELP-PEI coatings remained below this threshold (≤111 µm), supporting stable 3D architecture and sustained adipogenic differentiation. Another key observation in our study is that the spheroids on M28 were hypoxic, characterized by the highest expression of HIF-1α, which might have resulted in a decrease in adiponectin levels and a reduction in insulin-mediated glucose uptake. These findings suggest that hypoxia in the spheroids might be contributing to insulin resistance. Hypoxia is known to alter the metabolic state of cells and can lead to insulin resistance in adipocytes [
26]. The elevated HIF-1α expression in our spheroids likely contributes to this phenomenon, as hypoxic conditions disrupt normal glucose metabolism and impair insulin signaling. The decrease in adiponectin levels further supports this, as adiponectin plays a key role in enhancing insulin sensitivity. However, in the hypoxic environment, the reduction in adiponectin and glucose uptake indicates that the cells are becoming insulin resistant rather than sensitized to insulin. This shift toward insulin resistance under hypoxic conditions mirrors what is observed in vivo, where hypoxia can impair metabolic functions and glucose uptake. The inability of the spheroids to effectively take up glucose despite insulin signaling suggests that the hypoxic microenvironment is contributing to the development of insulin resistance, potentially affecting adipogenic processes and overall metabolic health.
The differential behavior observed between ELP-PEI and ELP-(RGD)
3-PEI coatings offers valuable insights into how cell–matrix interactions regulate adipogenic differentiation and metabolic function. While the ELP-(RGD)
3-PEI coating supported initial spheroid formation, the enhanced integrin-mediated cell–substrate adhesion eventually led to spheroid disassembly and 2D monolayer formation. This disruption of 3D architecture likely impaired the signaling of mechanical and spatial cues necessary for adipogenic maturation, as evidenced by the reduced expression of adipogenic markers such as PPAR-γ and adiponectin. The sustained integrin engagement may have activated the Rho/ROCK pathway, which is known to inhibit adipogenesis, thereby offering a mechanistic explanation for the observed suppression. Despite this limitation, the RGD-containing system presents a tunable platform to study how specific integrin–ECM interactions regulate adipose tissue remodeling, particularly under conditions that mimic mechanical or spatial deregulation of the niche [
27]. In contrast, the ELP-PEI coating maintained long-term spheroid integrity and supported 3D differentiation. At the end time point (M28), spheroids cultured on ELP-PEI showed signs of hypoxia and insulin resistance, including elevated HIF-1α expression and reduced adiponectin levels. These findings closely parallel features of hypertrophic adipose tissue in vivo, making the ELP-PEI system particularly suited for modeling metabolic dysfunction.
