3.1. Structural Design and Preparation of Electrodes
The laser-machined groove structure significantly enhanced the overall electrochemical performance of thick electrodes. However, the laser-machined structure also affected the mechanical stability of the electrodes. In order to examine the effects of varying structural depths on both the mechanical and electrochemical properties to achieve a balanced performance, we simulated and analyzed the mechanical and electrochemical properties of the electrode structures with varying processing depths.
As shown in
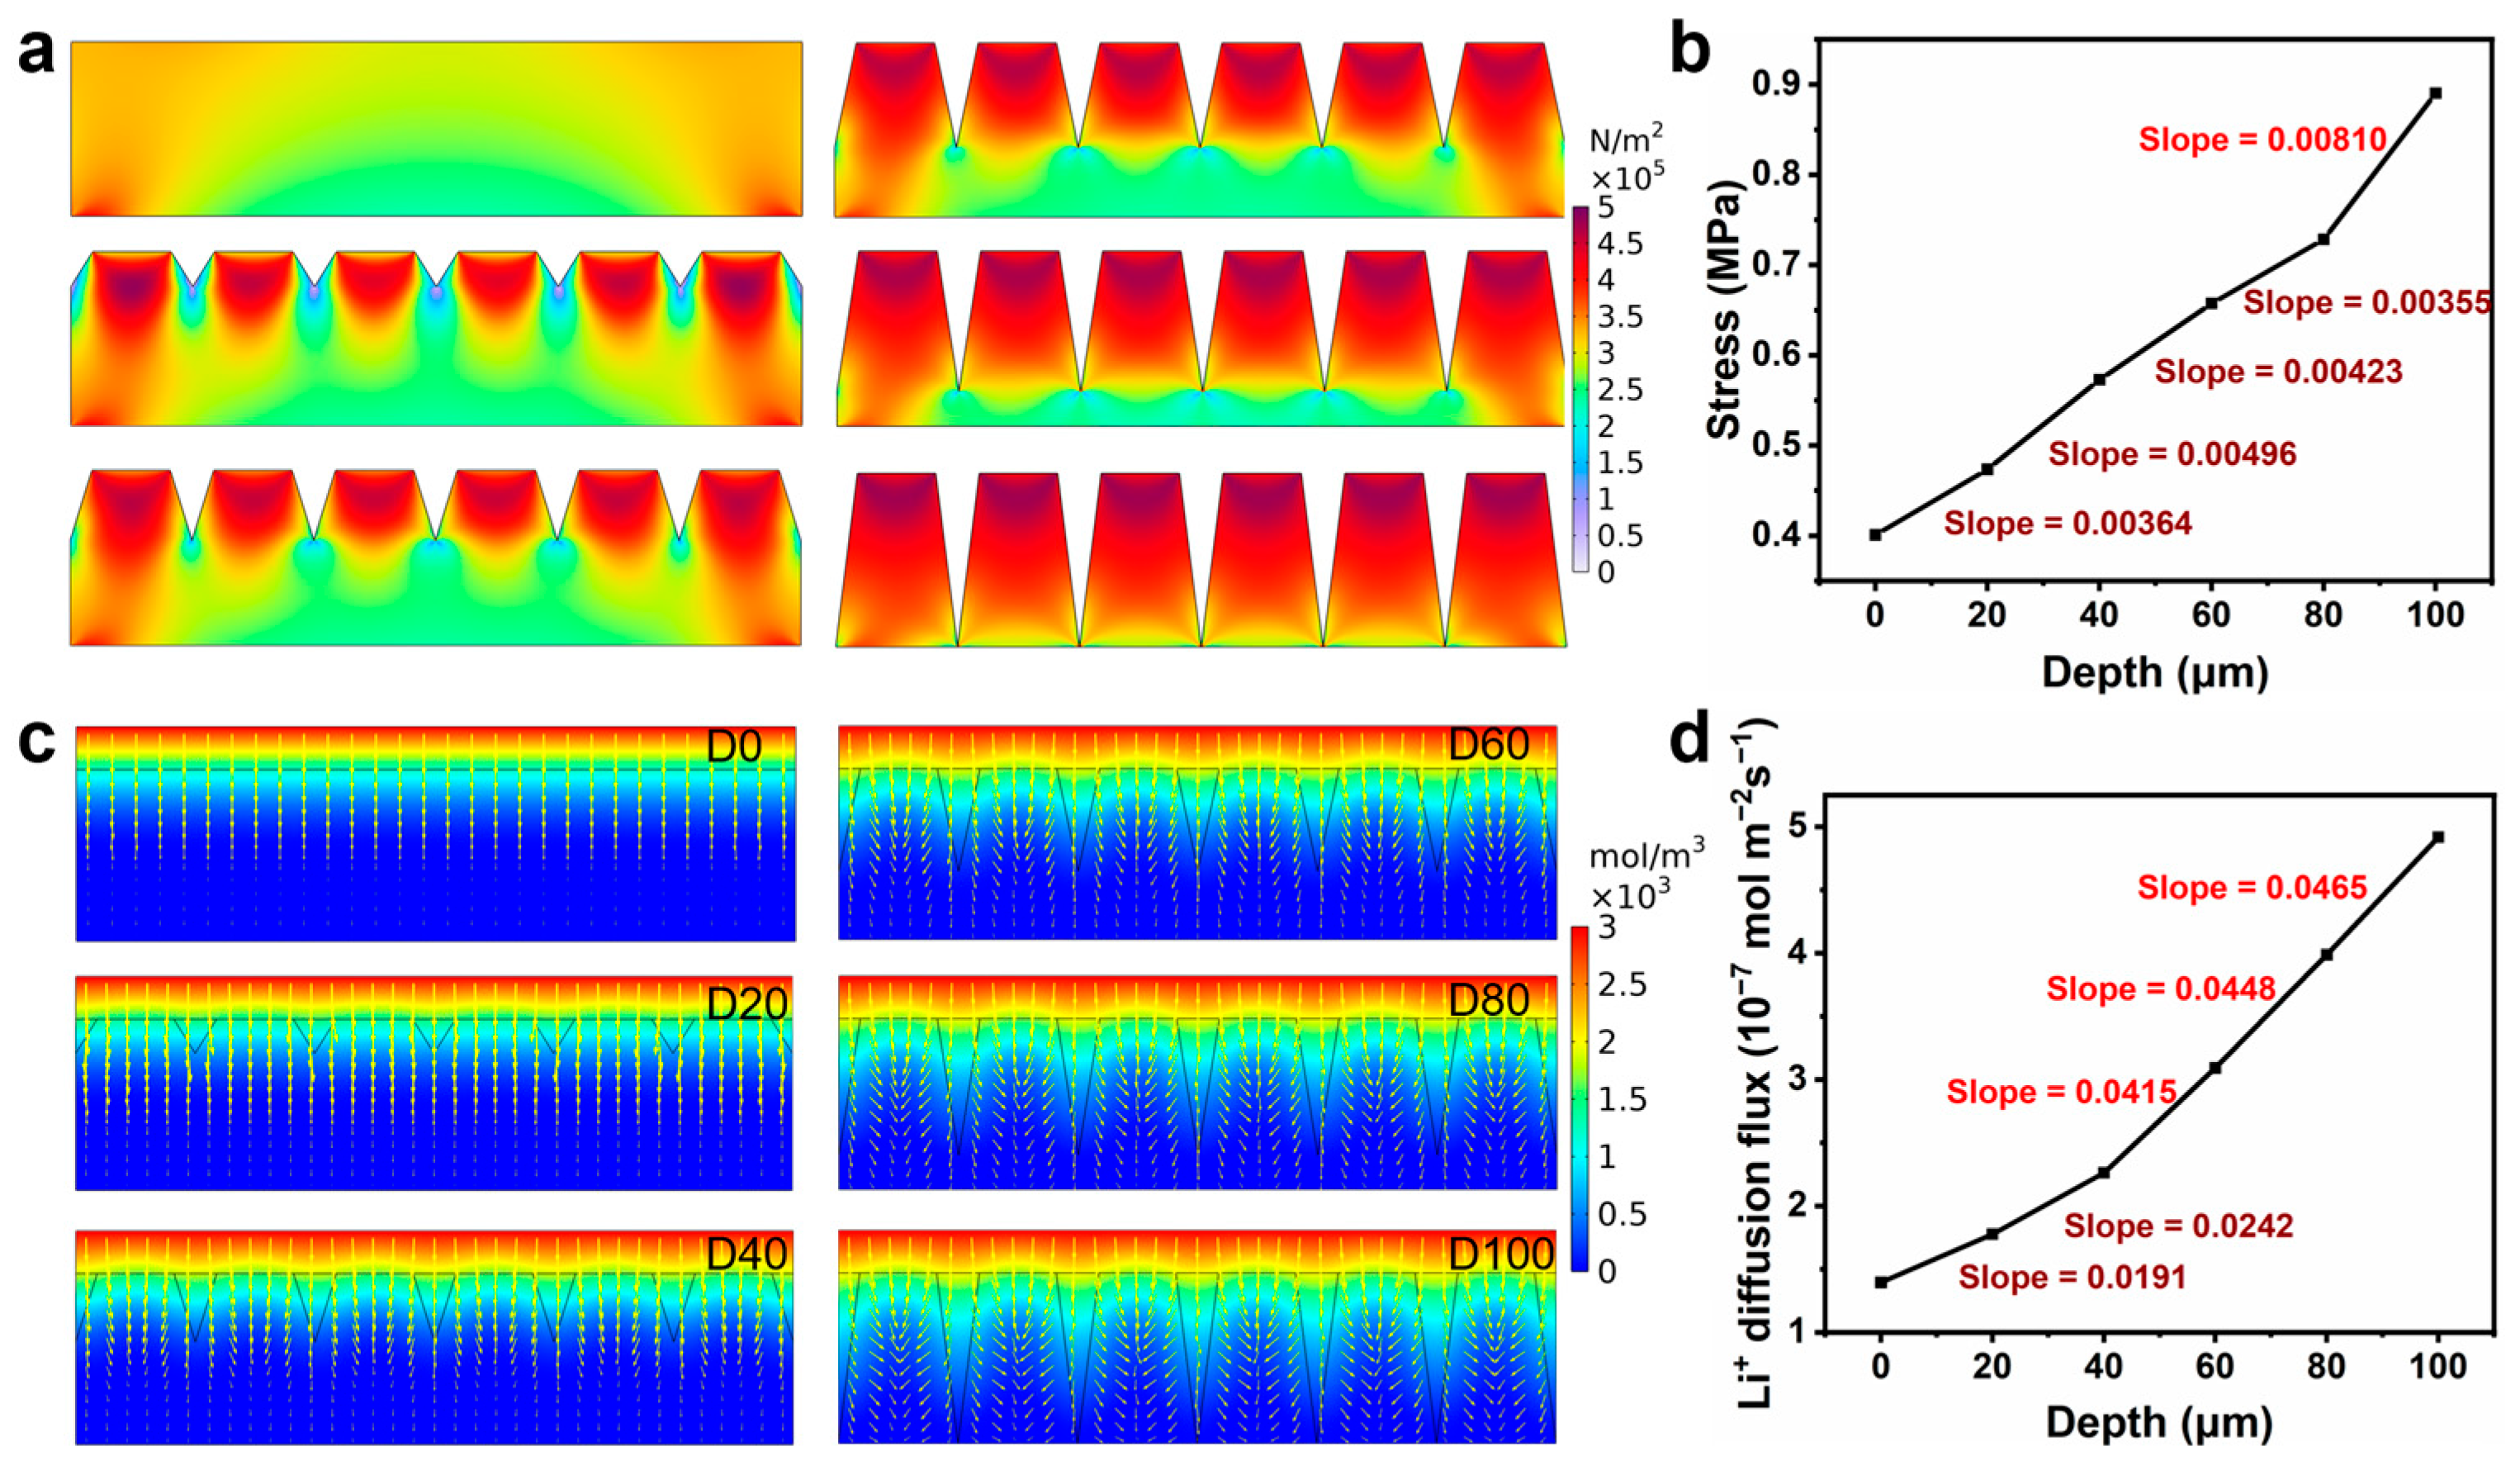
Figure 1a, the stress distribution in the structured electrode gradually concentrates at the top of the structure as the depth of laser processing increases, and the stress value increases significantly. This suggests that electrodes with deeper laser processing depths are more prone to damage at the top when subjected to internal stresses. By quantitatively analyzing the stresses on electrodes with different processing depths (
Figure 1b), it can be observed that the peak stress increases slowly between 0–80 μm, while in the 80–100 μm depth interval, the stress increases significantly, indicating that deeper laser processing may affect the structural integrity of the electrodes.
Figure 1c shows the effect of laser processing depth on the Li-ion diffusion process, and the results indicate that the laser-processed structure significantly promotes Li-ion diffusion. Further calculations of Li-ion flux (
Figure 1d) revealed that the Li-ion flux increases slowly in the 0–40 μm depth range and rapidly in the 40–100 μm interval, suggesting that the deeper processed structure facilitates the rapid transport of Li-ions.
The design of the electrode structure should follow the principle of maximizing Li-ion flux while minimizing stress. Therefore, we compared the ratio of Li-ion flux to stress at different trench depths, as shown in
Figure S1. The findings show that the ratio of Li-ion flux to stress increases rapidly with the deepening of the groove but then levels off when the depth of the groove reaches 80 μm, indicating that construction of groove structures with a depth of 80 μm may be the optimal choice to balance mechanical stability and electrochemical performance.
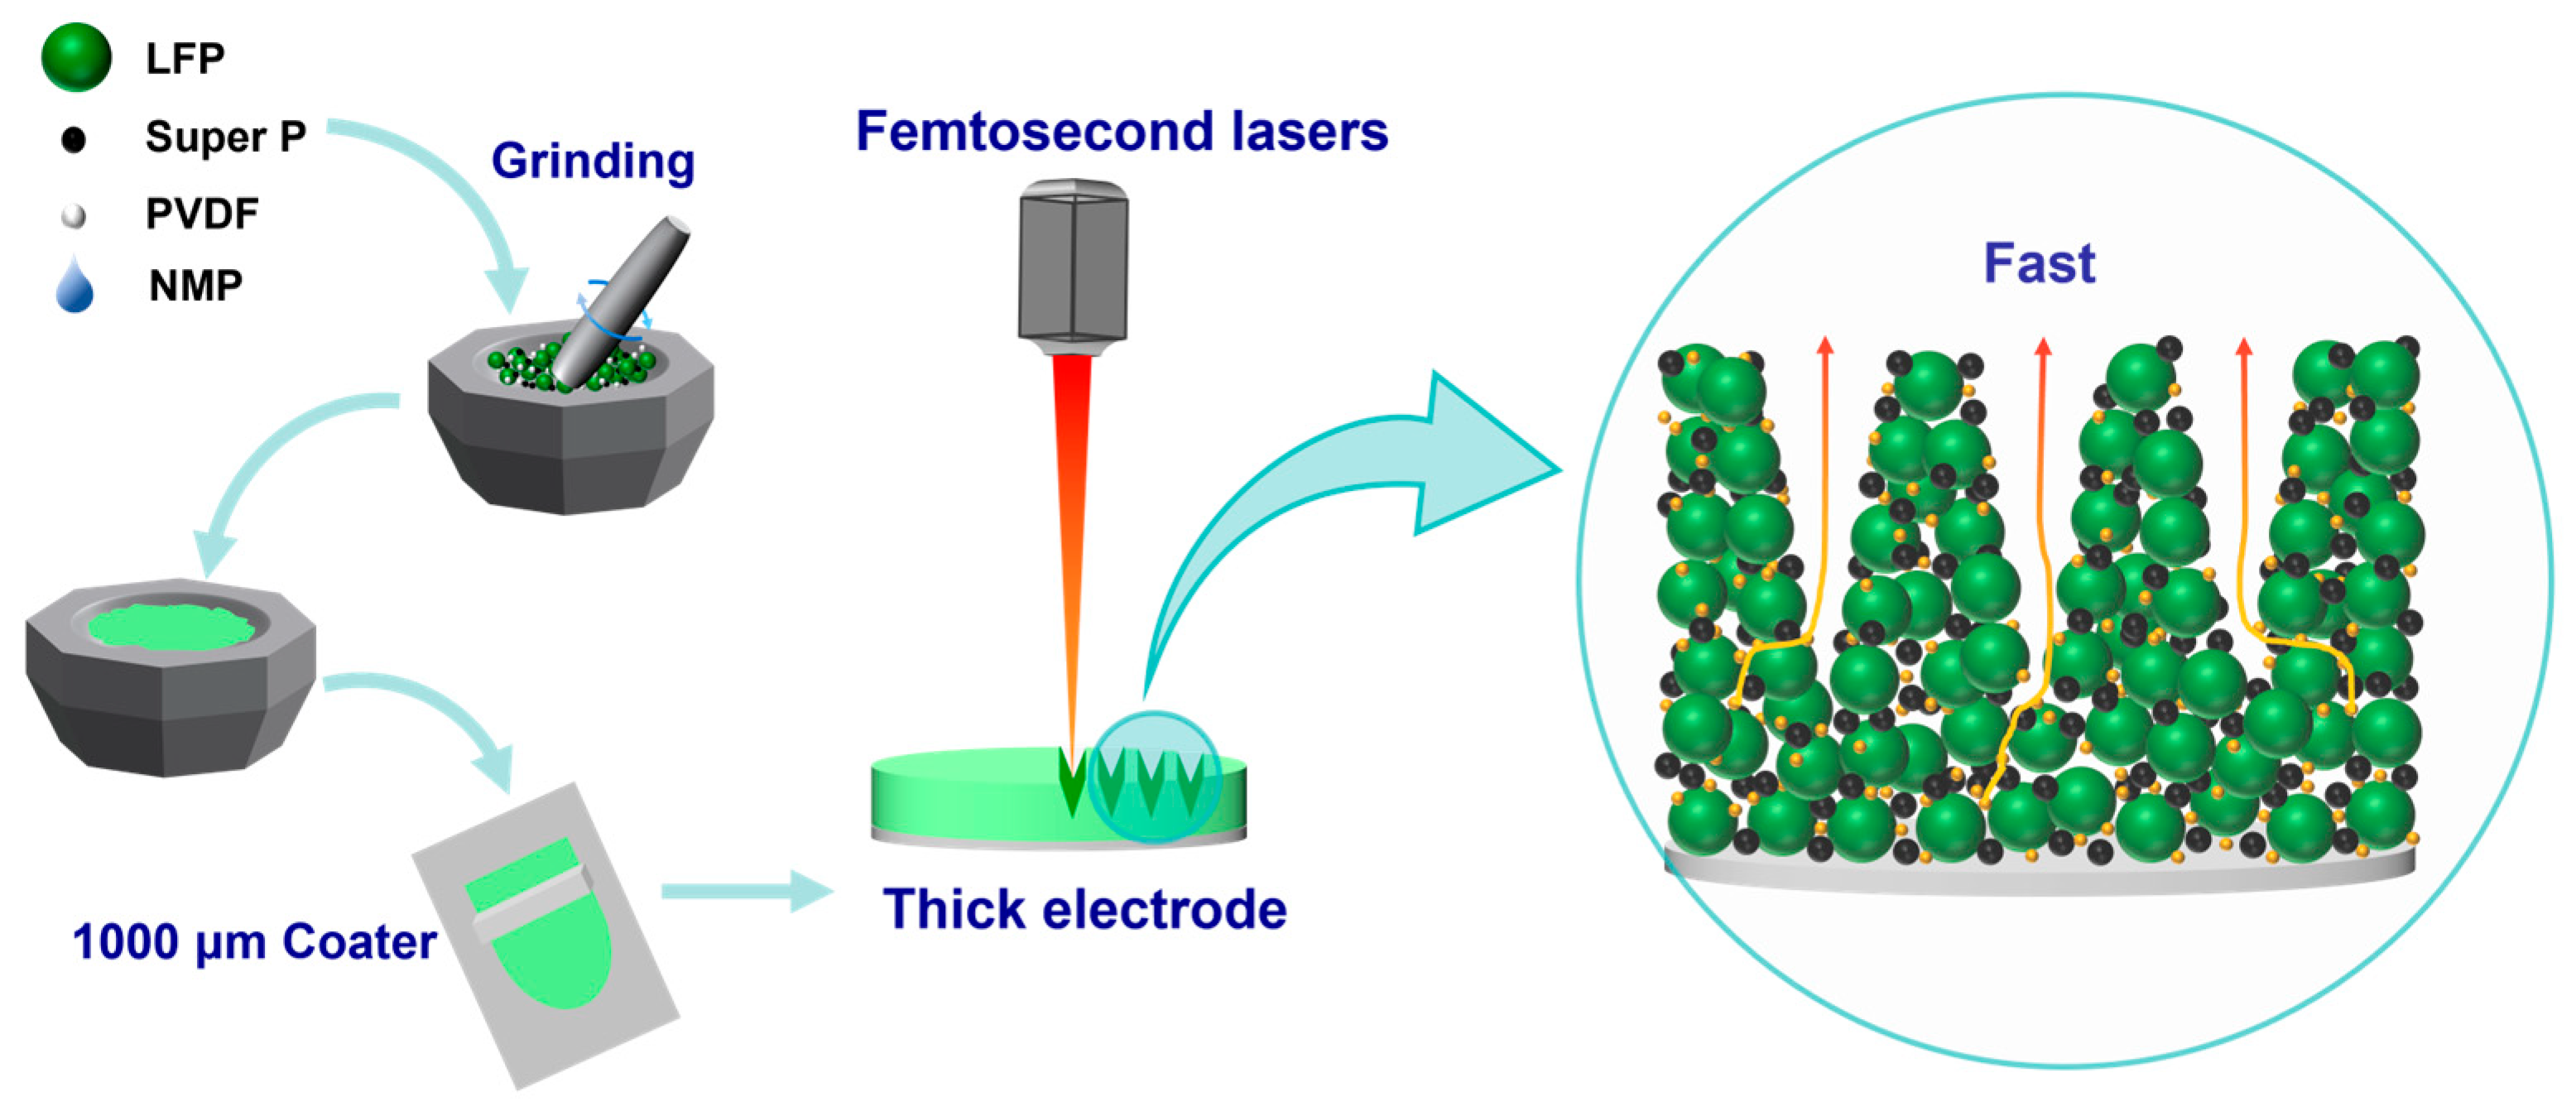
To verify the simulation results and optimize the thick electrode structure, we obtained thick electrodes by controlling the amount of NMP dripped and using a 1000 μm thick four-sided applicator for coating. Then, groove structures of varying depths were created on the D0 electrode using a femtosecond laser, with adjustments made to the laser power and processing speed. The preparation process is shown in
Figure 2.
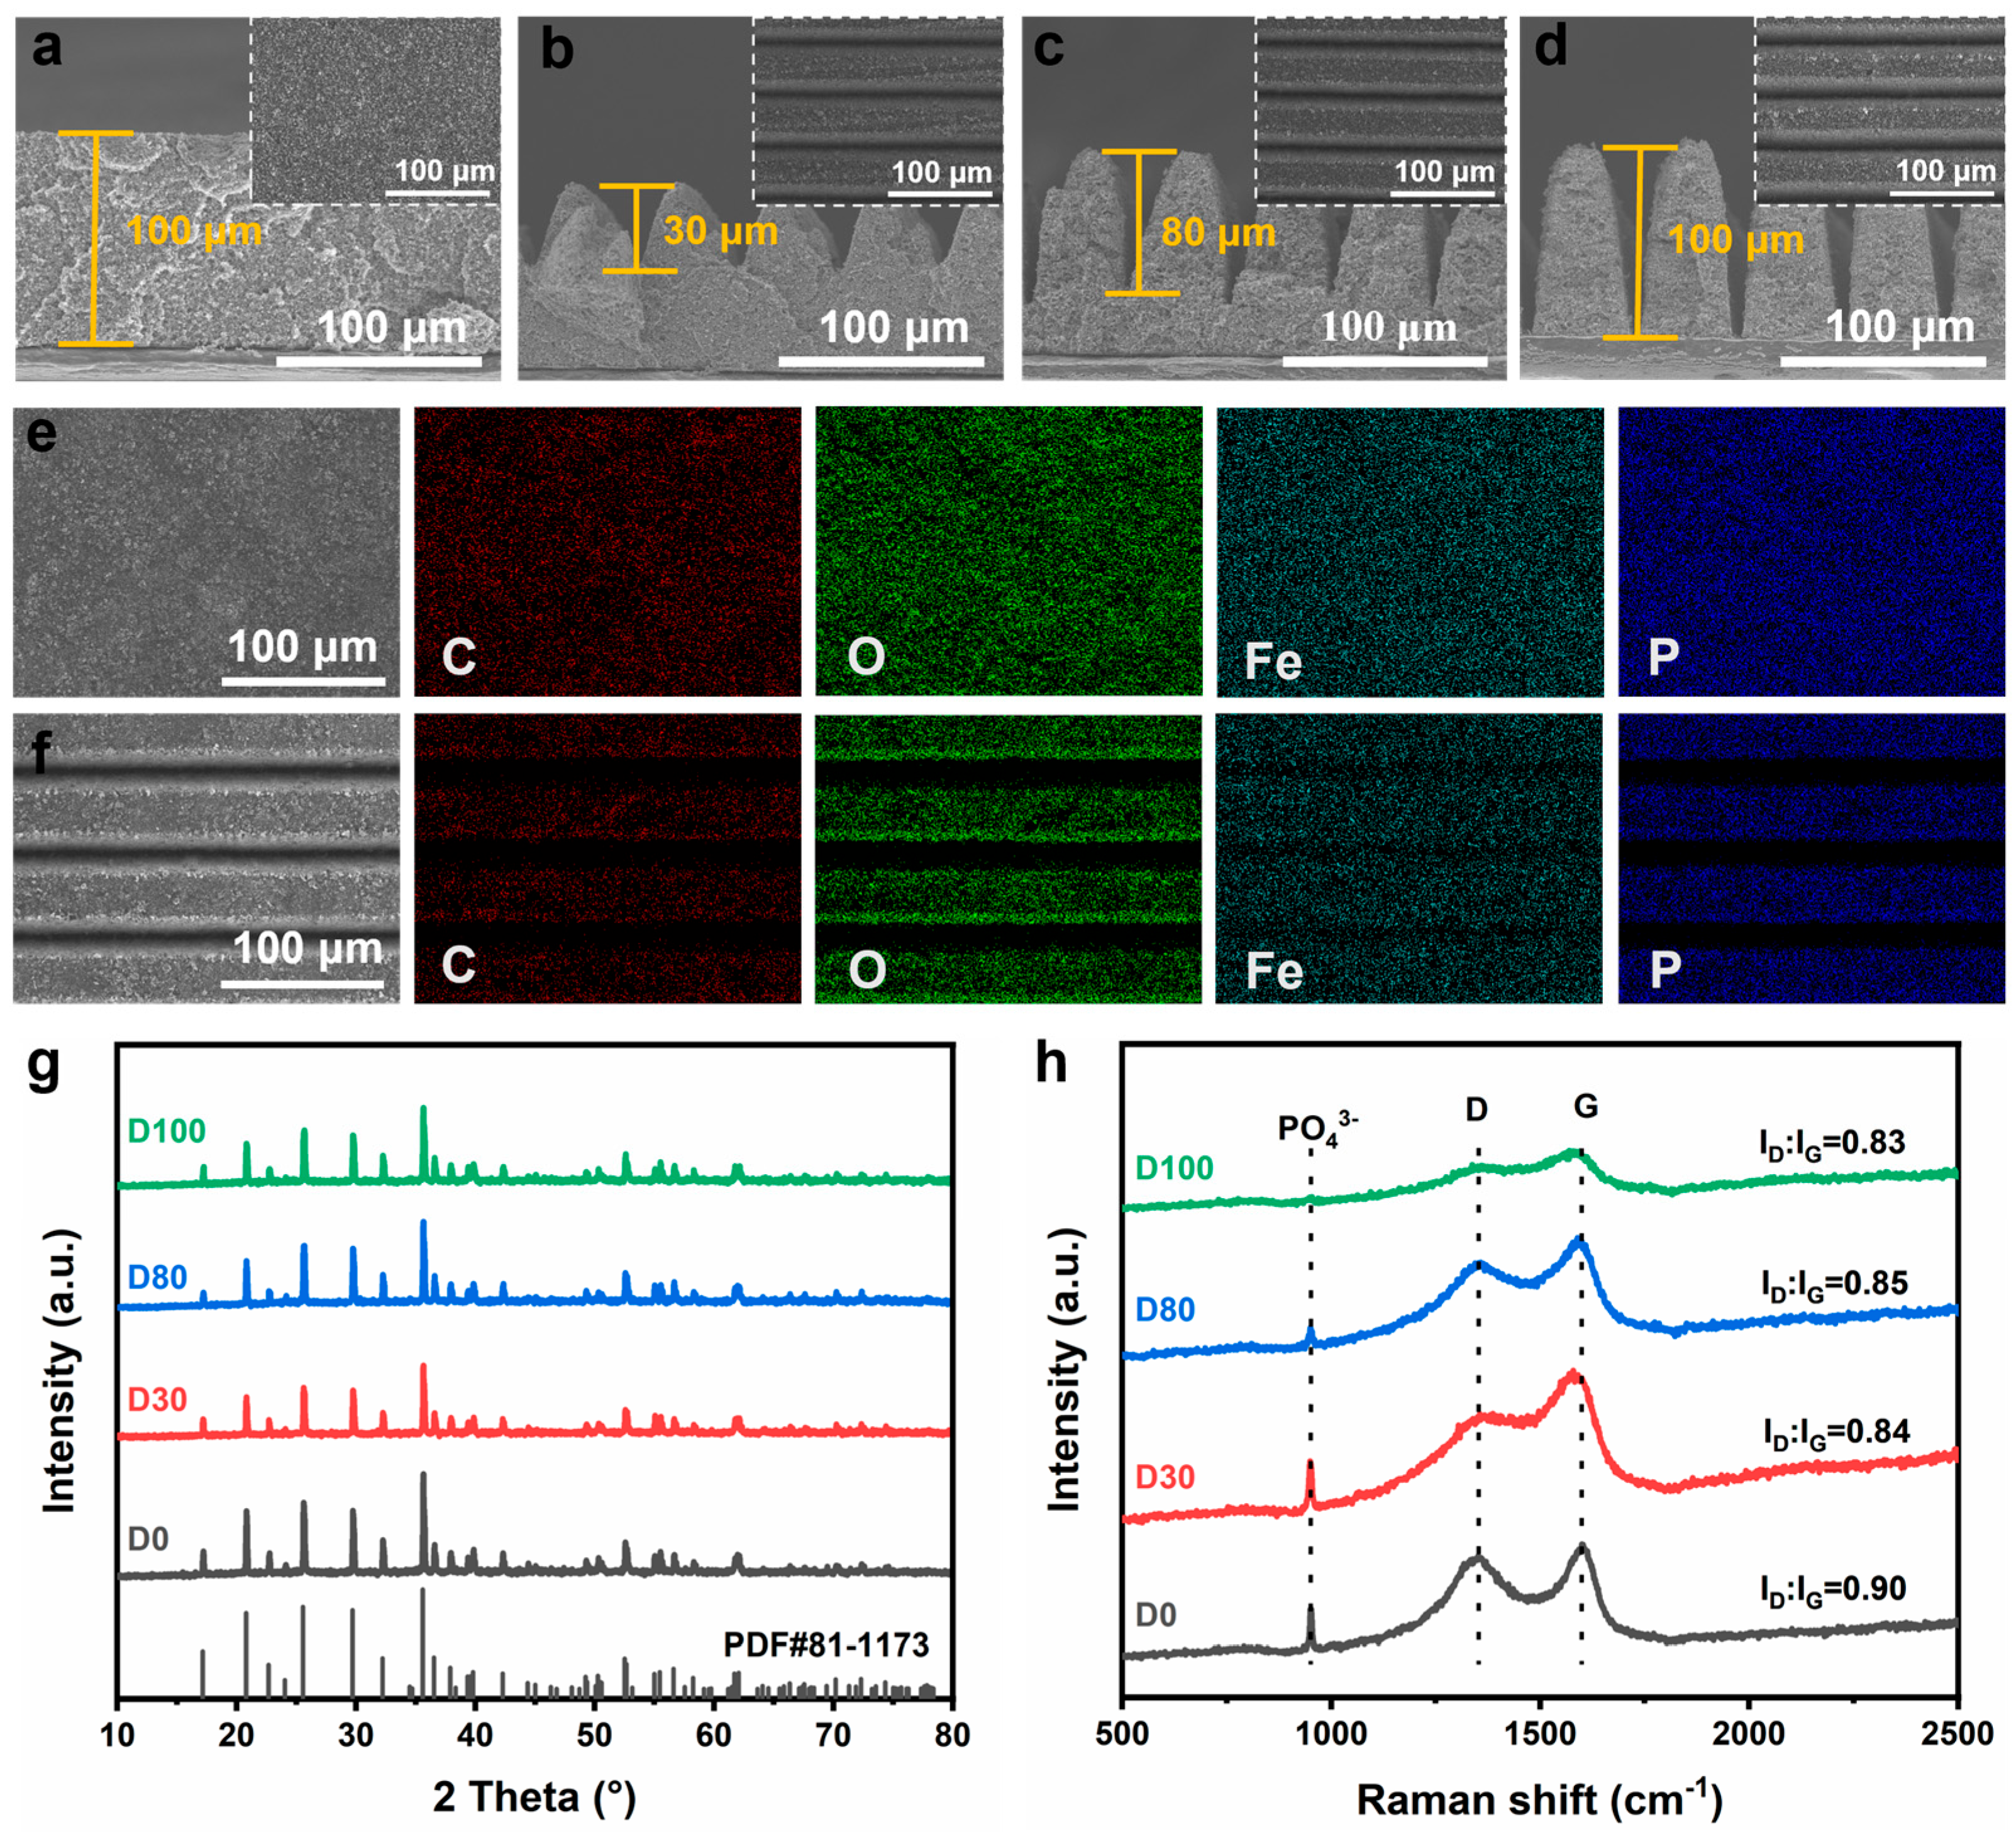
Figure 3a–d shows the surface and cross-sectional views of the electrode before and after laser processing. As shown in
Figure 3a, the surface of the D0 sample is smooth and flat, and the electrode paste is uniformly distributed without cracks and voids in the D0 group. This may be attributed to thorough grinding and homogeneous mixing of the paste. The cross-sectional view shows that the D0 sample is about 100 μm in thickness.
Figure 3b–d presents the surface morphologies of the D30, D80, and D100 samples. Laser processing did not cause significant cracking or delamination between the processed and unprocessed areas. The cross-sectional images indicate that the groove depth varies from shallow to deep and is uniformly distributed across the structure. Notably, the edges of the laser-processed grooves showed no signs of melting or resolidification, suggesting that the ultrashort pulses of the femtosecond laser have a negligible thermal effect. Additionally, the EDS elemental mapping images (
Figure 3e,f) of the laser-processed and D0 electrodes indicate that the laser processing did not affect the elemental distribution of the material.
The crystal structures of the D0, D30, D80, and D100 electrodes were characterized using XRD, with the results presented in
Figure 3g. Before and after laser processing, the crystal structure of the electrode active material remained unchanged, with all the diffraction peaks matching the standard XRD patterns of LFP (JCPDS card No. 81-1173), without any noticeable peak shifts. This is attributed to the high speed and small heat-affected zone of femtosecond laser processing [
16].
To further investigate the material changes during laser processing of the electrode structure, Raman tests were performed (
Figure 3h), and vibrational peaks appeared near 950 cm
−1, 1350 cm
−1, and 1580 cm
−1. The faint peak at 950 cm
−1 corresponds to the stretching vibration of PO
43− in LFP [
17]. The vibrational peaks near 1350 cm
−1 and 1580 cm
−1 correspond to the D and G peaks of the characteristic vibrational peaks of amorphous carbon. The D peak corresponds to the disordered structure of the defects or boundary regions in the carbon material. The G peak corresponds to the planar vibration of the carbon–carbon bond in sp
2 hybridized carbon, which is typically found in hexagonal carbon structures, such as those in graphite [
18,
19]. With the increase in the depth of the laser processing, the stretching vibration peaks of PO
43⁻ gradually weakened and eventually disappeared. Degradation caused by the heating of the cathode active layer in certain areas of the heat-affected zone resulted in the masking of the olivine peak at 951 cm
−1 [
20]. Relative to the untreated electrode samples, the laser-treated electrodes demonstrate a lower intensity ratio of the D and G bands (ID/IG). This indicates that the laser processing facilitates a transition from disordered to ordered carbon structures, leading to a relative increase in sp
2-hybridized carbon content and a reduction in the proportion of sp
3-hybridized disordered structures [
21]. This results in an enhancement of the electrodes’ conductivity, which is crucial for electron transport in thick electrodes. In addition, the D and G peaks in the Raman spectra show significant shifts, which are attributed to the stress or strain changes induced by laser processing, and the generation of a large number of defects during laser processing [
22].
3.2. Physical Properties of Electrodes
Efficient electron transport is essential for the electrochemical performance of thick electrodes. The conductivity of the D0, D30, D80, and D100 electrodes was measured using the four-probe method. As shown in
Figure 4a, the average conductivity values of the D0, D30, D80, and D100 electrodes were 0.11, 0.15, 0.39, and 0.49 S cm
−1, respectively. Laser processing enhances the electronic conductivity of the electrodes. This increase is attributed to the laser-induced rise in sp
2 carbon content, which enhances the material’s electrical conductivity [
23,
24]. Additionally, as the laser processing depth increases, the specific surface area and porosity of the electrode surface also increase, optimizing the electron conduction pathway and reducing resistance in the electron transport process. Consequently, the overall electronic conductivity of the electrode is greatly enhanced. Enhanced electronic conductivity facilitates electron movement within the electrodes, thereby maintaining superior electrochemical performance under high-current charging and discharging conditions. This ultimately may improve the rate capability of the battery [
25].
Porosity is an important parameter for evaluating electrode performance. We calculated the porosity of the electrodes with different structural depths based on the porosity calculation formula [
26]. As shown in
Figure S2, the porosities of the four electrodes are 27.3%, 30.7%, 34.6%, and 39.2%, respectively. The results indicate that the porosity increases with the laser processing depth. The increased porosity can enhance electrolyte wettability and shorten ion diffusion paths, thereby improving the electrochemical performance of the electrodes [
27]. For thick electrodes, the wettability of the electrolyte is also a crucial factor in battery performance [
9]. As shown in
Figure 4b, the contact angles of the D0 and D30 electrodes were 13.36° and 4.68°, respectively, while the D80 and D100 electrodes showed super wettability with a contact angle of 0°. The laser-processed groove structure notably enhances the roughness of the electrode surface, expands the interaction area with the electrolyte, and simultaneously enhances the capillary effect within the groove, causing the electrolyte to spread rapidly along the groove structure upon contact [
28]. This groove structure significantly improves the wettability of thick electrodes, effectively reduces the contact angle and internal resistance of the battery, and thus alleviates the inherent response inhomogeneity of thick electrodes [
29]. In summary, the conductivity of the electrodes and the homogeneity of the electrochemical reaction are improved after constructing grooves on the thick electrodes, which may contribute to improving the electrochemical performance of the battery.
However, laser processing of the electrode may also lead to specific issues.
Figure 4c presents the average mass losses of the D0, D30, D80, and D100 electrodes, which were 0%, 3.99%, 8.34%, and 12.77%, respectively, showing an increasing trend with the increase in depth. This mass loss is primarily ascribed to the evaporation or ablation of the material during laser processing. The reduction in active material may lead to a decrease in the battery’s energy density, which negatively impacts the cost. Therefore, the depth of laser processing should be carefully controlled in electrode design to strike a balance between performance optimization and material loss.
The mechanical properties of the electrode are another potential risk. As shown in
Figure 4d, the peel strength of the electrodes decreases with increasing trench depth, which is consistent with the simulation result. When the trench depth increases from 0 μm to 30 μm and 80 μm, the peel strength shows minimal variation, with the D80 electrode exhibiting only a 2.75% reduction compared to the D0 electrode. However, as the trench depth increases from 80 μm to 100 μm, the peel strength of the D100 electrode decreases significantly, showing a reduction of 13.45% relative to the D0 electrode. The laser-processed structure destroys the structural integrity of the electrode, and this damage to the structural integrity increases the brittleness of the pole piece, thereby reducing the peel strength.
In summary, the grooves introduced to the surface of thick electrodes by laser processing weaken the structural integrity of the electrodes to some extent and reduce the amount of active material, which may affect the cycling stability and long cycle life of the battery. However, these processed structures provide shorter and more direct paths for electrolyte penetration and lithium-ion transport within thick (highly active material-loaded) electrodes, facilitating rapid ion transport within the thick electrode layer. In addition, the laser-processed electrodes show significant improvements in conductivity and wettability with the electrolyte. This improvement enhances the kinetics of electron and ion migration. It reduces the resistance to charge transfer and concentration polarization effects within the electrode, potentially leading to improved electrochemical performance under high-current conditions.
3.3. Electrochemical Properties of Electrodes
The obtained electrodes (with an active material loading of 20 mg cm
−2) were assembled into half-cells, and their electrochemical performance was compared.
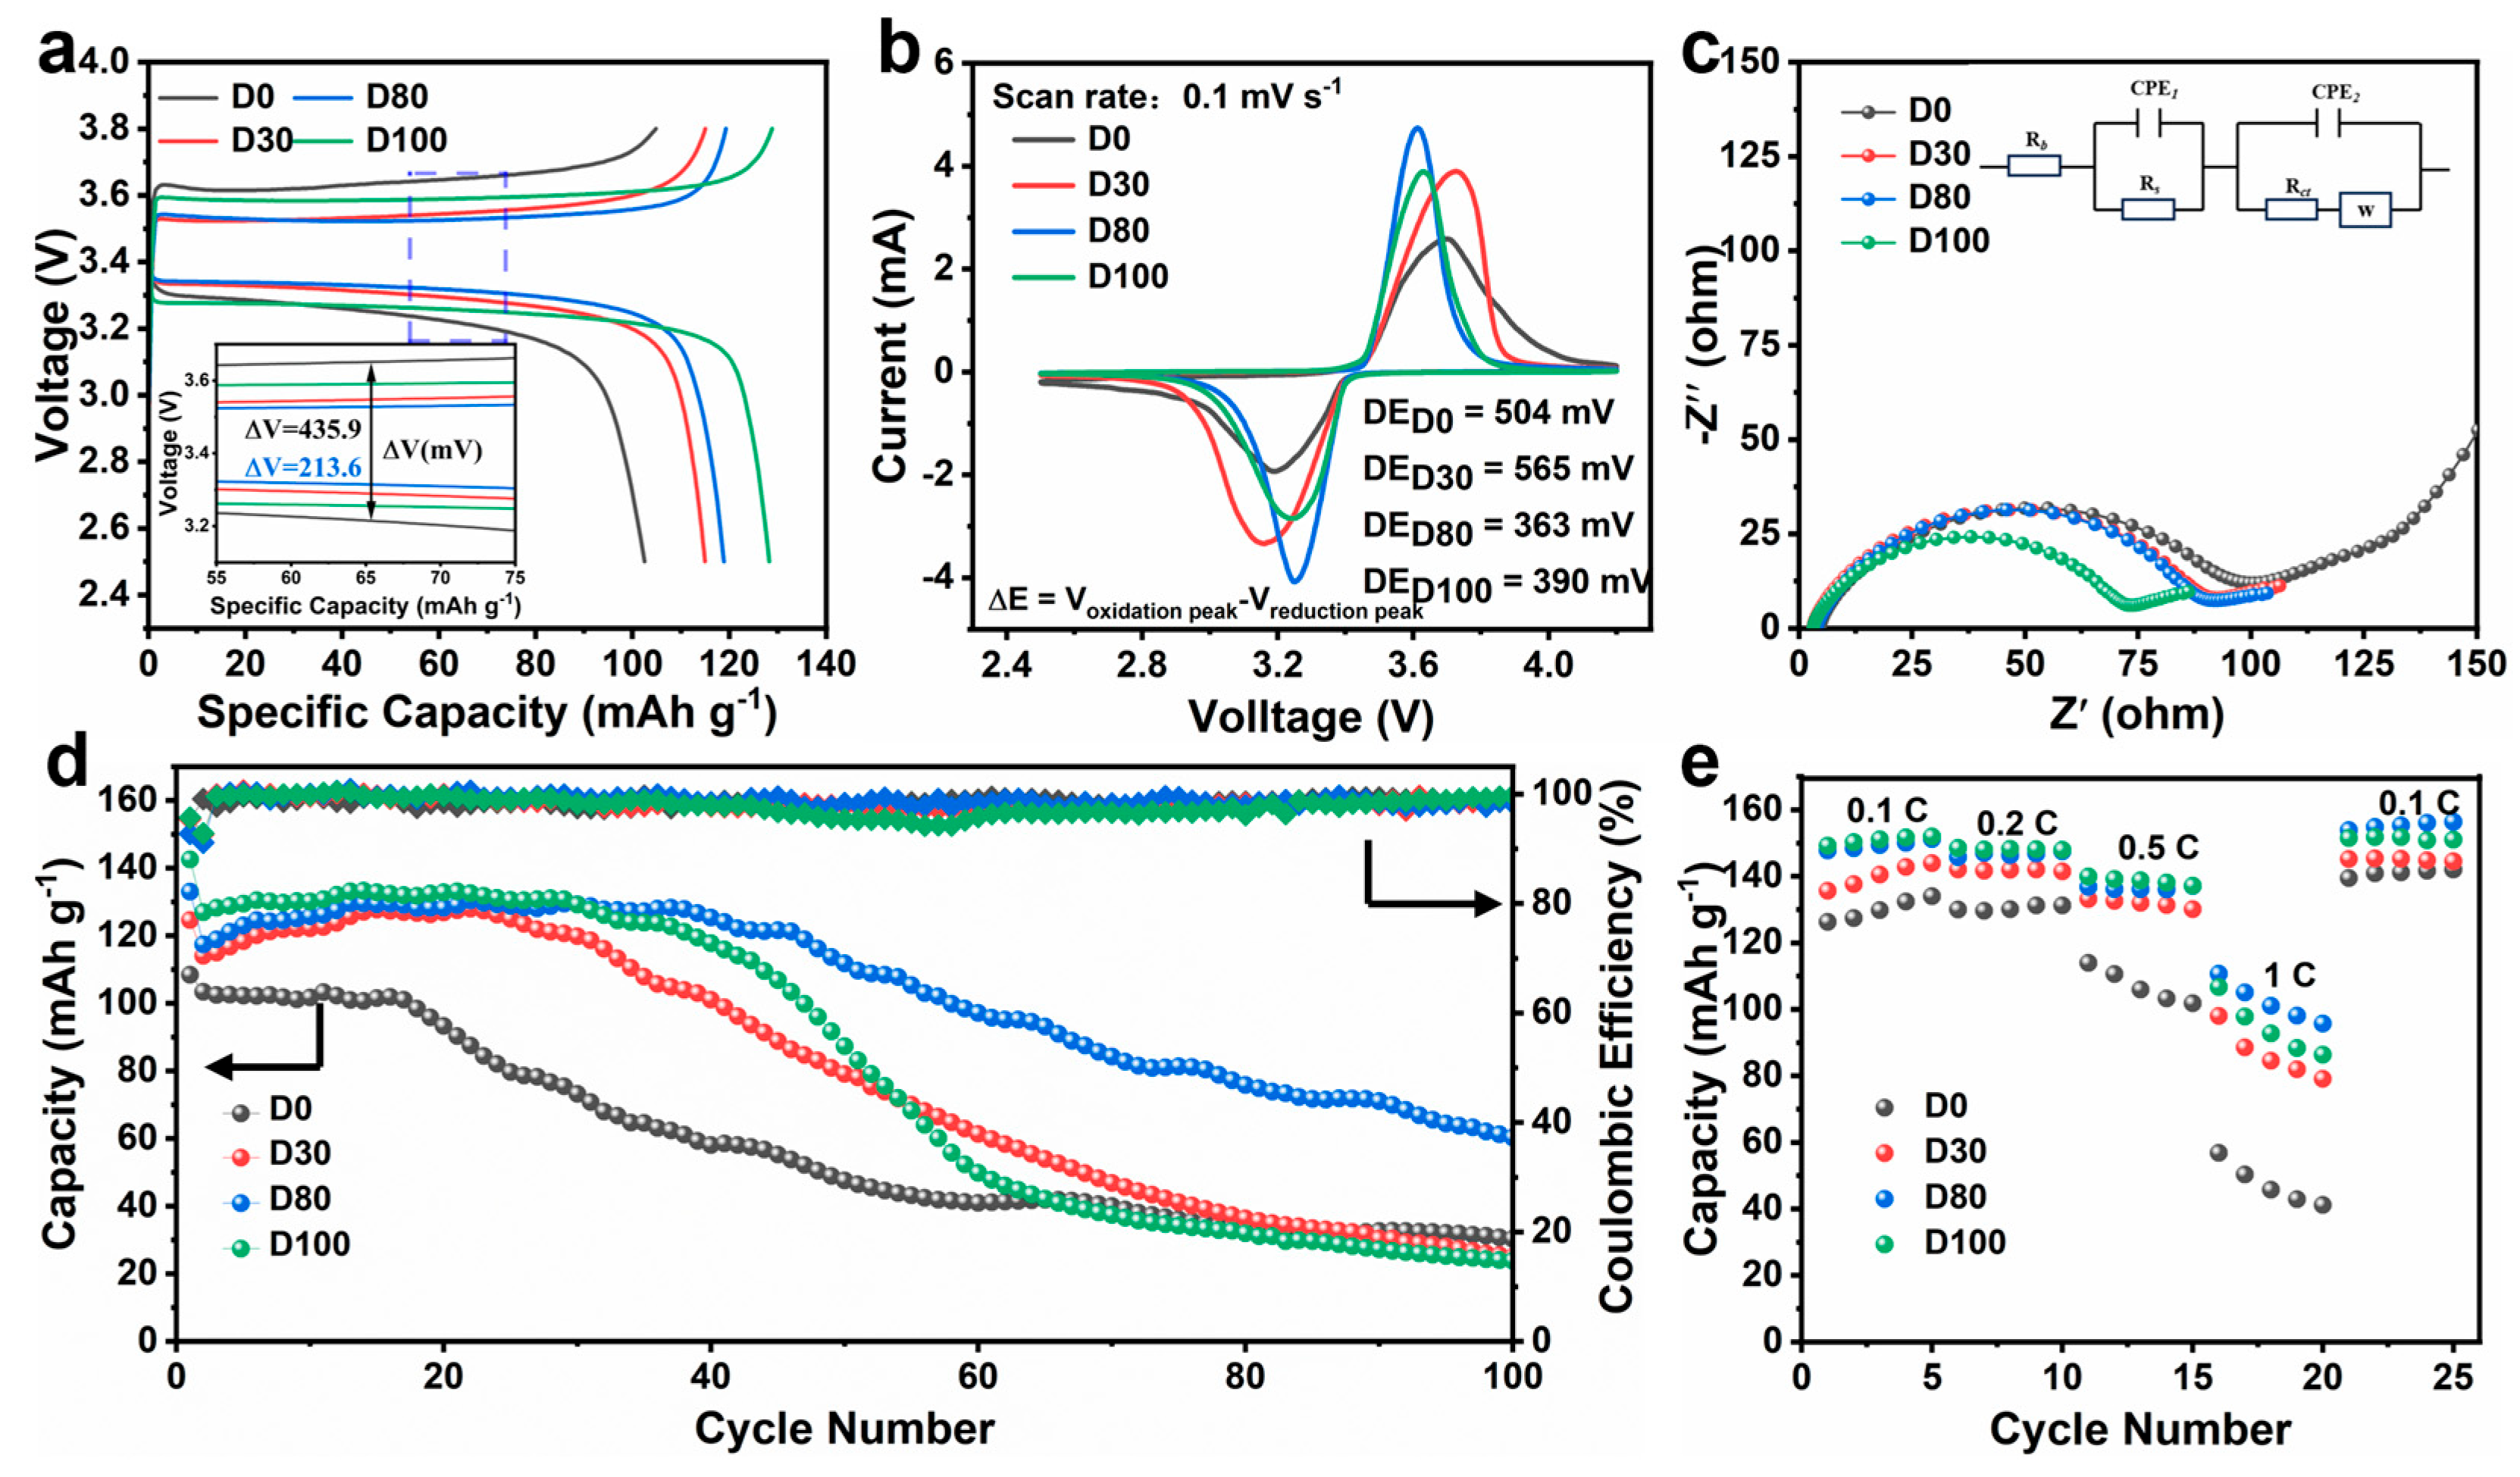
Figure 5a displays the charge and discharge curves of the four electrodes during the third cycle. The discharge capacities of the D0, D30, D80, and D100 electrodes are 102.47 mAh g
−1, 114.25 mAh g
−1, 118.86 mAh g
−1, and 128.25 mAh g
−1, respectively. The discharge capacity increases with the trench depth, with the D80 and D100 electrodes demonstrating exceptional lithium storage capacity. The charge–discharge curves of the two electrodes exhibit a prolonged response plateau and outstanding stability, which are crucial for maintaining high capacity. Furthermore, the potential differences for the four electrodes are 435.9 mV(D0), 258.2 mV(D30), 213.6 mV(D80), and 335.1 mV(D100), respectively, with the D80 electrode showing the least polarization. This confirms that the D80 structure shortens the ion transport path, enhances electrolyte wettability, and facilitates ion diffusion dynamics, thereby mitigating concentration polarization.
Figure 5b presents the cyclic voltammetry (CV) curves of the four electrodes within the voltage range of 2.5–4.2 V. The CV curves of the four electrodes exhibit a similar pair of distinct cathodic and anodic peaks, corresponding to the phase transition of LFP during the lithiation and delithiation processes [
30]. The potential differences of the D0, D30, D80, and D100 electrodes are 504 mV, 565 mV, 363 mV, and 390 mV, respectively, at a scan rate of 0.1 mV s
−1. The D80 electrode exhibits a higher, more pronounced, narrower, and more symmetrical redox peak profile. This result indicates that the D80 electrode exhibits enhanced electrochemical kinetics, faster charge diffusion, and reduced polarization [
31,
32]. This result is consistent with the results of the galvanostatic charge–discharge curves of the electrodes.
The EIS of the four electrodes is shown in
Figure 5c. All the samples show a semicircular shape in the high-frequency region, with the diameter value of the semicircle corresponding to the sum of the SEI membrane resistance (R
SEI) and the charge-transfer resistance (R
ct). The total resistances of the D0, D30, D80, and D100 electrodes are 101 Ω, 84 Ω, 80 Ω, and 66 Ω, respectively. For the D0 electrodes, as the thickness of the active material stack increases, the ion transport path lengthens, and the poorer wettability hinders ion and electron conduction. The reduction in impedance of laser-processed electrodes can be attributed to three main factors: the large specific surface area and shortened transport paths created by the surface structure, and the increased electronic conductivity and improved wettability to the electrolyte. These factors enhance the effective transport of the electrolyte, thereby enabling the rapid movement of ions and electrons.
The laser-processed electrodes exhibited excellent cycling stability and lithium storage kinetics, showing significant rate capability at high magnification.
Figure 5d presents the cycling performance of the electrodes with different groove depths at 0.5 C. The initial specific capacities of the D0, D30, D80, and D100 electrodes were 108.43 mAh g
−1, 124.57 mAh g
−1, 132.98 mAh g
−1, and 142.56 mAh g
−1, respectively. The results demonstrate that the initial specific capacity of the electrode increases with the depth of the grooves. Among them, the D0 electrode exhibited an average capacity decay rate of 0.721% after 100 cycles, with a final specific capacity of 30.26 mAh g
−1. The D80 electrode exhibited the best long-cycle performance, maintaining a capacity of 60 mAh g
−1 after 100 cycles with minimal capacity decay. Compared to the D0 electrode, the D80 electrode showed improvements of 1.99 times in specific capacity and 1.82 times in capacity retention after 100 cycles at 0.5 C. In contrast, although the D100 electrode had a higher specific capacity in the first cycle, it showed poorer long-cycle performance, likely due to its mechanical properties being more adversely affected by the deep laser processing. The laser-processed structures significantly enhanced the cycling performance.
Figure 5e shows the rate capability test results of the electrodes under different rate conditions. The laser-processed electrodes demonstrated superior performance compared to untreated electrodes at high rates. At 1 C, the D80 electrode exhibits a specific capacity of 110.65 mAh g
−1, while the D0 electrode exhibits a particular capacity of only 56.77 mAh g
−1, representing a 1.95-fold improvement in capacity. This performance improvement is mainly due to the structural design, which increases the interfacial area and shortens the transport path, thereby significantly improving the ion dynamics. The D80 electrode demonstrates excellent cycle stability and rate performance.
To further optimize the electrode structure, we designed s with spacings of 30, 90, and 180 μm. The labels are L30, L90, and L180, where ‘L’ stands for the spacing (70 μm was used for the spacing when probing the electrodes at different depths, so D80 = L70).
Figure S3a,b illustrates the cycling and rate performance of the electrodes. The results demonstrate that the D80 (L70) electrode performs optimally among the structures investigated. This phenomenon may be attributed to structural differences that directly impact the ion and electron transport pathways. Shorter transport and diffusion paths, along with optimal structural spacing, enhance ion transport properties. Furthermore, smaller pitch structures (such as L30) exhibit the same superior long-cycle performance as D80 (L70) electrodes due to their enhanced interfacial area and shortened ionic transport paths. However, L30 also displays the highest mass loss from a cost perspective. Consequently, D80 (L70) is the optimal structure.
3.4. Kinetic Properties of Electrodes
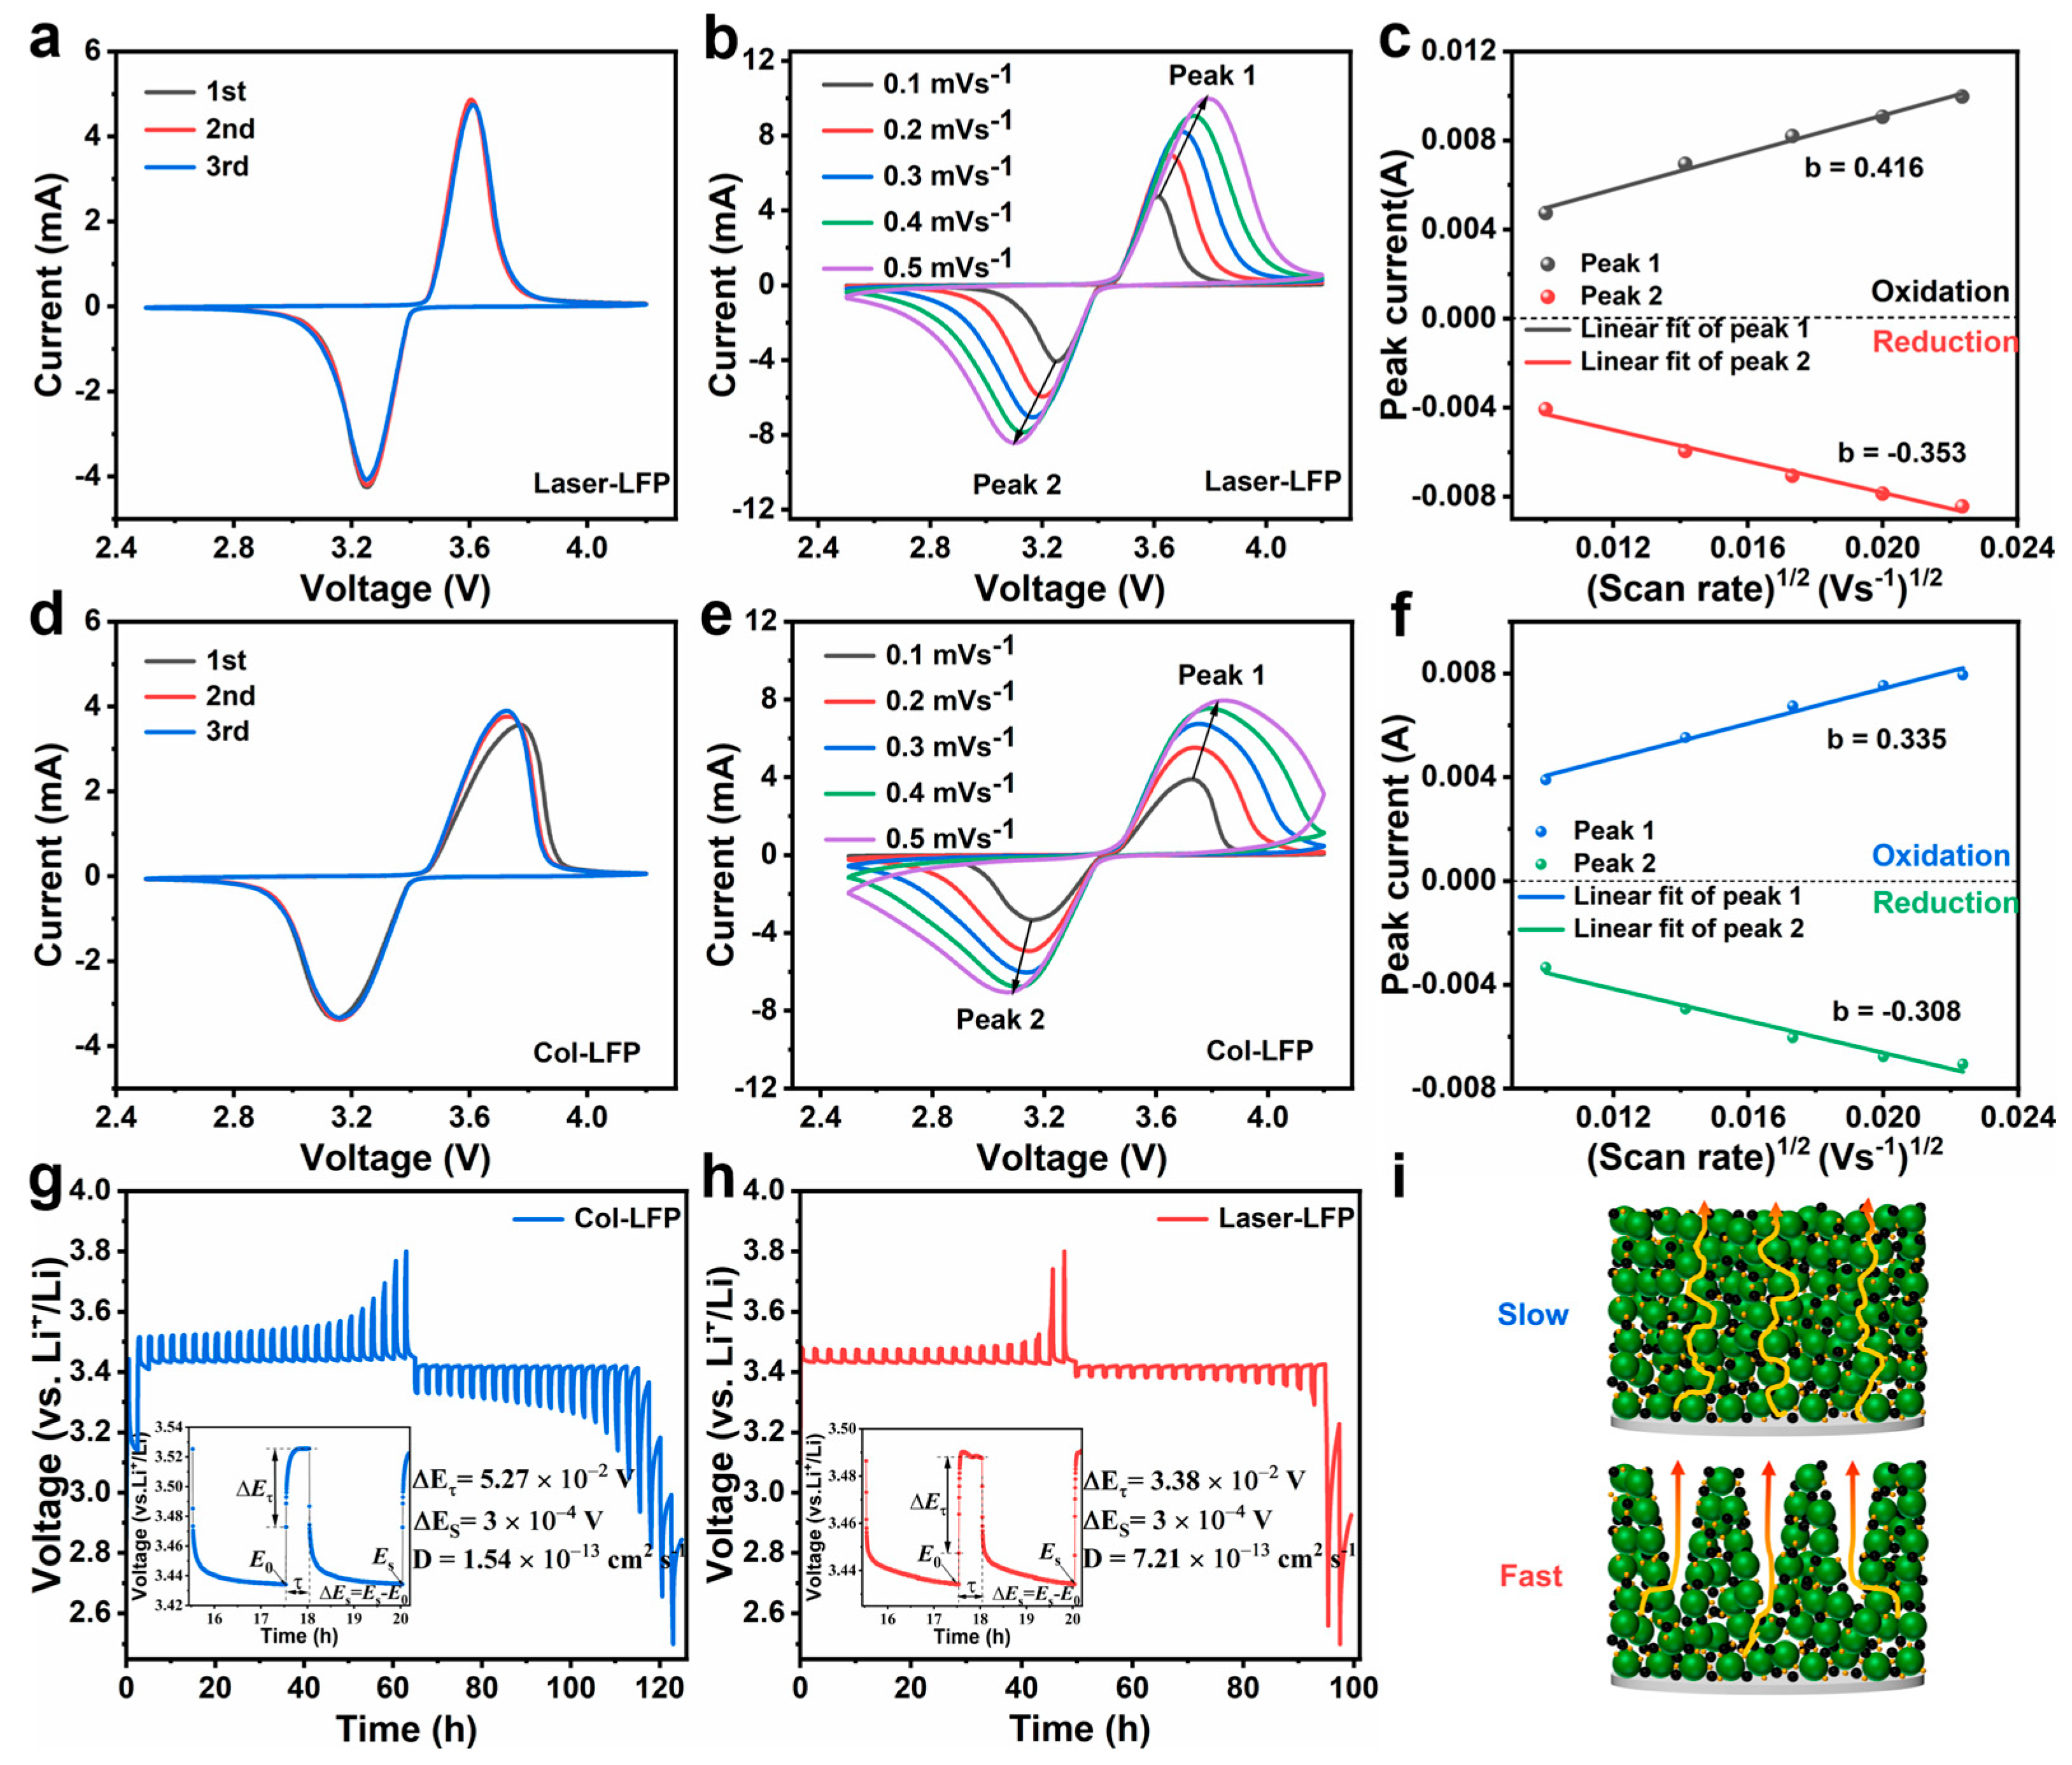
The kinetic properties are crucial to the cycling stability and rate performance of the electrodes. The CV curves for the first three cycles of the D80 electrode (
Figure 4a) and the D0 electrode (
Figure 4d) were analyzed within a voltage range of 2.5–4.2 V at a sweep rate of 0.1 mV s
−1. The CV curves exhibit an oxidation peak at 3.62 V and a reduction peak at 3.252 V, respectively [
30]. The first three cycles of the D80 electrodes exhibit a greater degree of overlap compared to the D0 electrodes. Moreover, the extent of the overlap in the first three cycles indicates the reversibility of the electrode’s redox reaction, suggesting that the D80 electrodes exhibit enhanced cyclic stability. The CV curves of the D80 electrodes (
Figure 6b) and the D0 electrodes (
Figure 6e) were tested at scan rates of 0.1, 0.2, 0.3, 0.4, and 0.5 mV s
−1. At varying scan rates, the CV curves of the D80 electrodes exhibited superior regularity in shape compared to those of the D0 electrodes, indicating that the D80 electrodes are less polarized, with enhanced stability and reversible performance [
33]. Moreover, according to the Randles–Sevcik Equation (1),
In Equation (
Ip), the variables
n,
a,
DLi+,
CLi, and
v represent the peak current, the number of charge transfers, the geometric electrode area, the concentration of lithium ions in the electrolyte, and the scan rate, respectively. The linear relationship between
v0.5 and Ip was obtained through both experimental and computational means for the D80 electrode (
Figure 6c) and the D0 electrode (
Figure 6f). The slope of the fitted line derived from Equation (1) is proportional to the lithium-ion diffusion rate [
32]. Therefore, the D80 electrode exhibits a higher
DLi+ than the D0 electrode.
To gain a more comprehensive understanding of the electrochemical kinetics, we utilized the GITT technique to further investigate the lithium storage dynamics of the D80 electrode. A pulse current of 0.01 A g
−1 was applied, with the current flow and relaxation times set to 0.5 h and 2 h, respectively. The GITT profiles for the D80 and D0 electrodes are shown in
Figure 6g and
Figure 6h, respectively. The open-circuit potential after the relaxation period is deemed to be the lithium insertion–extraction equilibrium potential, which for these electrodes is approximately 3.41 V. Notably, the voltage plateau of the D80 electrode is lower compared to the D0 electrode, reflecting a reduction in electrochemical polarization in the former, which is consistent with the observations in
Figure 3e. Subsequently, the ion diffusion coefficients of these electrodes were calculated from the GITT curves using Equation (2).
where τ represents the relaxation time of the current pulse, ΔE
s denotes the change in steady-state potential during relaxation, ΔE
t is the potential difference during the current pulse, and L is the thickness of the electrode. The lithium-ion diffusion rate was determined to increase by 4.68 times. The laser-machined structures on the electrode surface facilitate Li
+ diffusion into the active material and decrease the resistance to charge transfer at the microchannel boundary.
3.5. Mechanisms of Oxygen Vacancy Variation in Electrodes During Laser Processing
It was found that the electrochemical performance generally aligns with the simulation results, with the only exception being that the D80 but not the D100 electrode exhibits the best long-cycle performance and electrochemical kinetics. The discrepancy may stem from the simulation accounting only for the physical structure while overlooking material variations. Based on the material characterization results, the materials exhibit identical chemical compositions in the crystalline phase, suggesting that the observed differences may arise from laser-induced defects in the electrodes. Consequently, further defect characterization was conducted for the laser-processed electrodes.
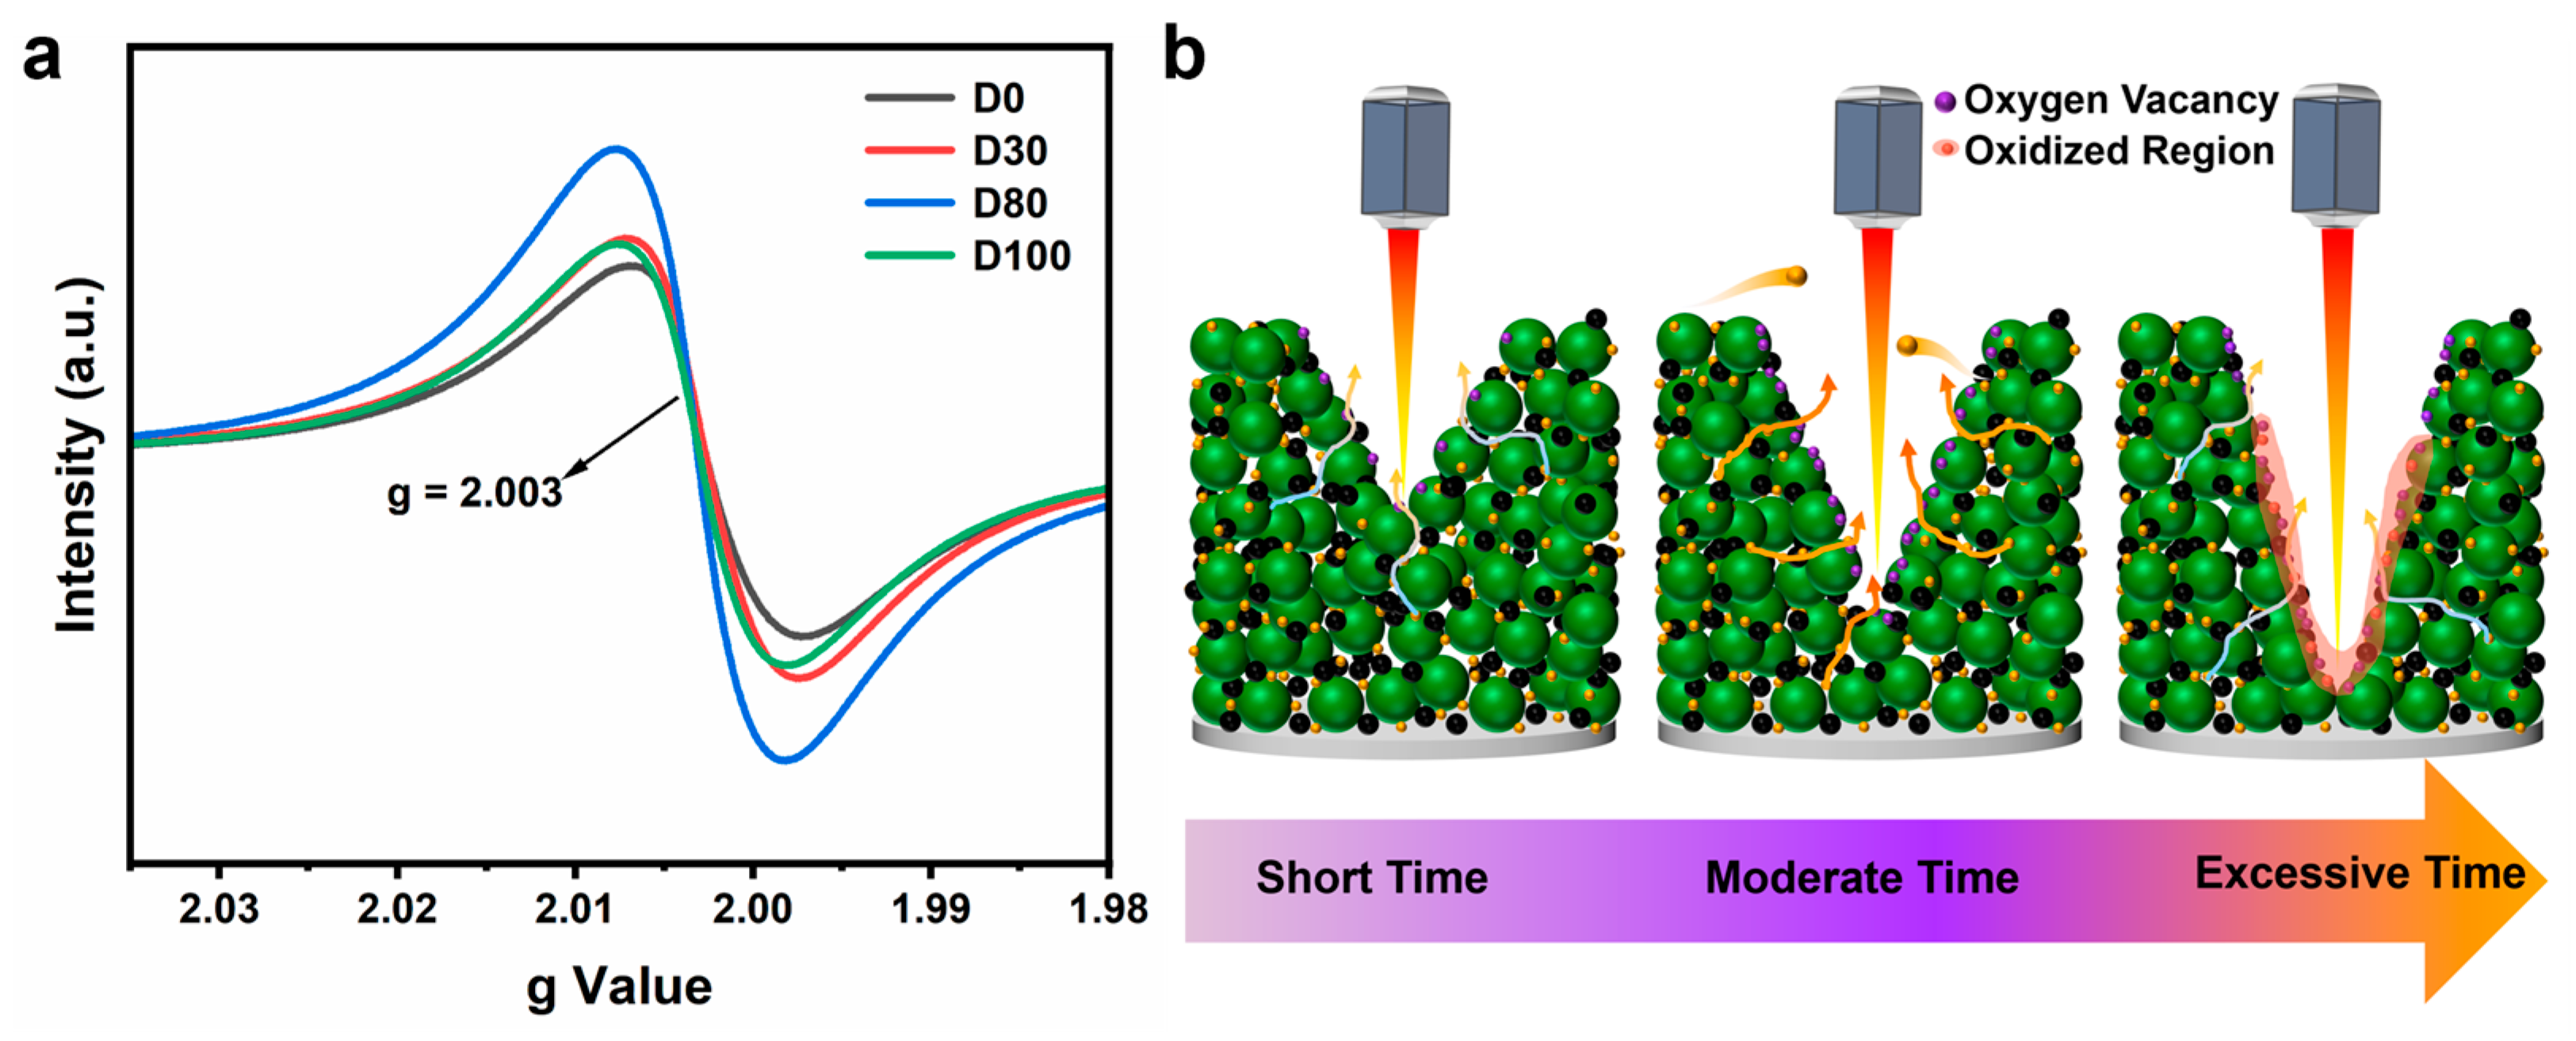
An electron paramagnetic resonance (EPR) analysis of oxygen vacancies was performed to explore the differences in electrochemical behavior and simulation outcomes. In
Figure 7a, it was observed that the oxygen vacancies in the electrode increased after laser processing. The oxygen vacancy content increased and then decreased, with the D80 electrode having the highest oxygen vacancy content among the four electrodes.
Table S2 presents the spins per milligram (spins/mg) values of the four electrodes to quantitatively compare the variation in oxygen vacancy concentration in microstructured electrodes with different laser processing depths. The trend of the spins/mg values is consistent with the EPR signal intensity shown in
Figure 7a, exhibiting an initial increase followed by a decrease. Specifically, the D0, D30, D80, and D100 electrodes show spins/mg values of 2.62 × 10
15, 2.77 × 10
15, 3.12 × 10
15, and 2.67 × 10
15, respectively, with the D80 electrode showing the highest spin count. The oxygen vacancy content increases and then decreases, and the mechanism can be analyzed for the following reasons, as shown in
Figure 7b:
Different depth structures are processed by varying the linear velocity at a fixed power. Initially, as the linear velocity decreases, the laser dwell time in the same area increases. The femtosecond laser, with its high pulse energy, rapidly raises the surface temperature of the material in a short time, causing the breakage of metal–oxygen bonds and the creation of oxygen vacancies within the material [
34].
Femtosecond lasers have very short pulse durations, in the order of 10
−15 s, and this rapid heating and cooling process causes the material surface to enter a non-stationary state. Under non-steady state conditions, oxygen atoms are more likely to escape from the material surface or be removed by the laser, resulting in the formation of oxygen vacancies in the lattice. At this point, the amount of oxygen vacancies increases with increasing laser energy input [
35].
If the laser line speed is further reduced, the laser will remain on the material’s surface for too long, resulting in an excessively high surface temperature. This condition causes the material surface to oxidize and the oxygen vacancies to be filled, resulting in a reduction in oxygen vacancies.
The presence of oxygen vacancies can [
36,
37,
38] a. influence the energy band structure of the material, consequently lowering the energy barrier during lithium-ion insertion and extraction; b. provide additional lithium-ion migration channels, which is why the D80 electrode demonstrates excellent electrochemical kinetic performance; c. help alleviate stress during lithium-ion migration, maintaining the stability of the crystal structure. This stability is also a reason the D80 electrode demonstrates excellent long-cycle performance.
