Article

Classification and Prediction of Unknown Thermal Barrier Coating Thickness Based on Hybrid Machine Learning and Terahertz Nondestructive Characterization

1
School of Electrical and Automation, Wuhu Institute of Technology, Wuhu 241006, China
2
School of Intelligent Manufacturing, Wuhu University, Wuhu 241008, China
3
Institute of Intelligent Manufacturing, Wuhu Institute of Technology, Wuhu 241006, China
4
School of Artificial Intelligence, Anhui Polytechnic University, Wuhu 241000, China
5
Huzhou Key Laboratory of Terahertz Integrated Circuits and Systems, Yangtze Delta Region Institute (Huzhou), University of Electronic Science and Technology of China, Huzhou 313001, China
*
Authors to whom correspondence should be addressed.
Coatings 2025, 15(6), 725; https://doi.org/10.3390/coatings15060725
Submission received: 23 May 2025 / Revised: 10 June 2025 / Accepted: 16 June 2025 / Published: 17 June 2025

Abstract

:
Thickness inspection of thermal barrier coatings is crucial to safeguard the reliability of high-temperature components of aero-engines, but traditional destructive inspection methods are difficult to meet the demand for rapid assessment in the field. In this study, a new non-destructive testing method integrating terahertz time-domain spectroscopy and machine learning algorithms is proposed to systematically study the thickness inspection of 8YSZ coatings prepared by two processes, namely atmospheric plasma spraying (APS) and electron beam physical vapor deposition (EB-PVD). By optimizing the preparation process parameters, 620 sets of specimens with thicknesses of 100–400 μm are prepared, and three types of characteristic parameters, namely, time delay Δt, frequency shift Δf, and energy decay η, are extracted by combining wavelet threshold denoising and time-frequency joint analysis. A CNN-RF cascade model is constructed to realize coating process classification, and an attention-LSTM and SVR weighted fusion model is developed for thickness regression prediction. The results show that the multimodal feature fusion reduces the root-mean-square error of thickness prediction to 8.9 μm, which further improves the accuracy over the single feature model. The classification accuracy reaches 96.8%, of which the feature importance of time delay Δt accounts for 62%. The hierarchical modeling strategy reduces the detection mean absolute error from 6.2 μm to 4.1 μm. the method provides a high-precision solution for intelligent quality assessment of thermal barrier coatings, which is of great significance in promoting the progress of intelligent manufacturing technology for high-end equipment.

1. Introduction

As competition intensifies in the global aerospace industry for deep space exploration and high-performance propulsion systems, thermal barrier coatings—a core protective technology for high-temperature components such as turbine blades in aircraft engines—have become a critical factor limiting the performance of such equipment, with their reliability and durability now key constraints [1,2,3]. In its latest 2025 strategy, NASA has explicitly prioritized crewed Mars exploration as a top mission. While budget restructuring has resulted in a 25% overall reduction in funding, the dedicated funding for the Mars project has increased to $1 billion, while traditional spacecraft are being phased out in favor of cost-effective solutions from commercial partners like SpaceX. The European Space Agency (ESA) is deepening international cooperation through its “Gateway” lunar orbital station program to address the challenge of long-term protection of hot-end components in extreme environments. In this context, the National Natural Science Foundation of China in the “key basic components of high-end equipment” major research program clearly pointed out that the quality control technology of the thermal barrier coating is an important research direction to break through the aero-engine “neck” problem [4]. The rise in commercial spaceflight has significantly enhanced technology transfer efficiency—NASA’s Commercial Orbital Transportation Services (COTS) program, which leverages private companies to develop low-cost spacecraft, is projected to save between $20 billion and $30 billion over a decade, highlighting the driving force of industry–academia–research collaboration in advancing coating technology engineering. In recent years, the Ministry of Science and Technology of the key research and development program “material genetic engineering” especially continued to support the coating preparation and characterization technology research, to promote the transformation of thermal barrier coating from laboratory research to engineering applications [5].
Shrestha et al. [6,7] showed that the thickness uniformity of the thermal barrier coating directly determines its thermal insulation and thermal shock resistance; too thin will lead to overheating and failure of the substrate, while too thick is prone to flaking of the coating. This challenge was highlighted in the 2024 accident involving Boeing’s “Interstellar Passenger Ship”: due to a helium leak in the propulsion system, two astronauts were stranded in space for nine months and ultimately had to rely on SpaceX’s Dragon spacecraft for rescue, exposing the stringent demands on the reliability of aerospace components for systematic quality control. Traditional contact measurement methods, such as bench scale and microhardness testers, require destroying the specimen and cannot meet the requirements of the whole life cycle monitoring of aerospace components [8,9,10,11]. Several studies to date have shown that coating thickness deviations of more than 10% can shorten turbine blade life by more than 30%, which emphasizes the importance of high-precision thickness inspection techniques [12,13]. The “Thermal Barrier Coating Technology Roadmap” published by NASA specifically emphasizes that developing non-contact thickness detection is central to intelligent manufacturing, as it can reduce replacement costs for high-value components (such as single-crystal turbine blades) caused by coating failure, with an expected 15% reduction in engine maintenance costs [14].
Terahertz waves (0.1–10 THz) provide a new way for nondestructive inspection of thermal barrier coatings due to its unique penetration and material sensitivity [15]. Chen et al. applied terahertz time-domain spectroscopy for the first time to the inspection of thermal barrier coatings, confirming the linear relationship between the time-domain reflection signal time-delay and the thickness of the coating [16,17]. Japanese scholars Watanabe et al. successfully distinguished zirconia coatings with different porosities by modeling and analyzing the changing law of dielectric constant in terahertz frequency band [18,19]. However, most of the existing studies focus on single-process coatings, and there is a lack of systematic research on the detection differences between the two typical processes of APS and EB-PVD, especially the influence of the coating microstructure on the attenuation mechanism of terahertz signals has not been clarified [20,21].
Facing the massive time-frequency domain data generated by terahertz detection, machine learning techniques show powerful feature mining capabilities [22,23,24]. In the processing of other spectral data, the research results of relevant scholars indicate that machine learning has enormous advantages [25,26]. Traore et al. [27] and Dong et al. [28] use deep convolutional networks to extract defect features from images, and the detection accuracy is improved by 40% compared with the traditional methods. Yang et al. [29] and Lv et al. [30] process the detection signals through a long and short-term memory network that achieved thickness or width change detection. It is worth noting that the recent results of Elyan et al. [31] pointed out that the Random Forest algorithm can effectively screen out the key frequency bands that are sensitive to physical parameters, which provides a new idea for multimodal feature fusion. However, the existing models have not yet solved the problem of feature drift caused by process differences and are not sufficiently adaptive to the phenomenon of signal aliasing in thin-layer regions.
The overall research program framework of this study is shown in Figure 1. This study innovatively combines terahertz time-frequency domain analysis technology with a layered machine learning model, systematically applying it to the non-destructive testing of thermal barrier coatings produced by two typical processes: APS and EB-PVD. Through an innovative multi-modal feature fusion strategy, the study effectively addresses the issue of feature drift caused by process differences, significantly reducing the root mean square error (RMSE) in coating thickness prediction to 8.9 μm, which is significantly superior to existing single-model methods. Based on the aforementioned method, the proposed solution can be further applied to portable terahertz detection systems for real-time on-site measurements, enabling direct integration into coating production lines. This provides a breakthrough technical solution for achieving smart manufacturing and full-lifecycle quality monitoring of critical components in aviation engines. The research findings offer a new technical approach for assessing the quality of thermal barrier coatings, holding significant engineering value for advancing the smart manufacturing of critical components in aviation engines.

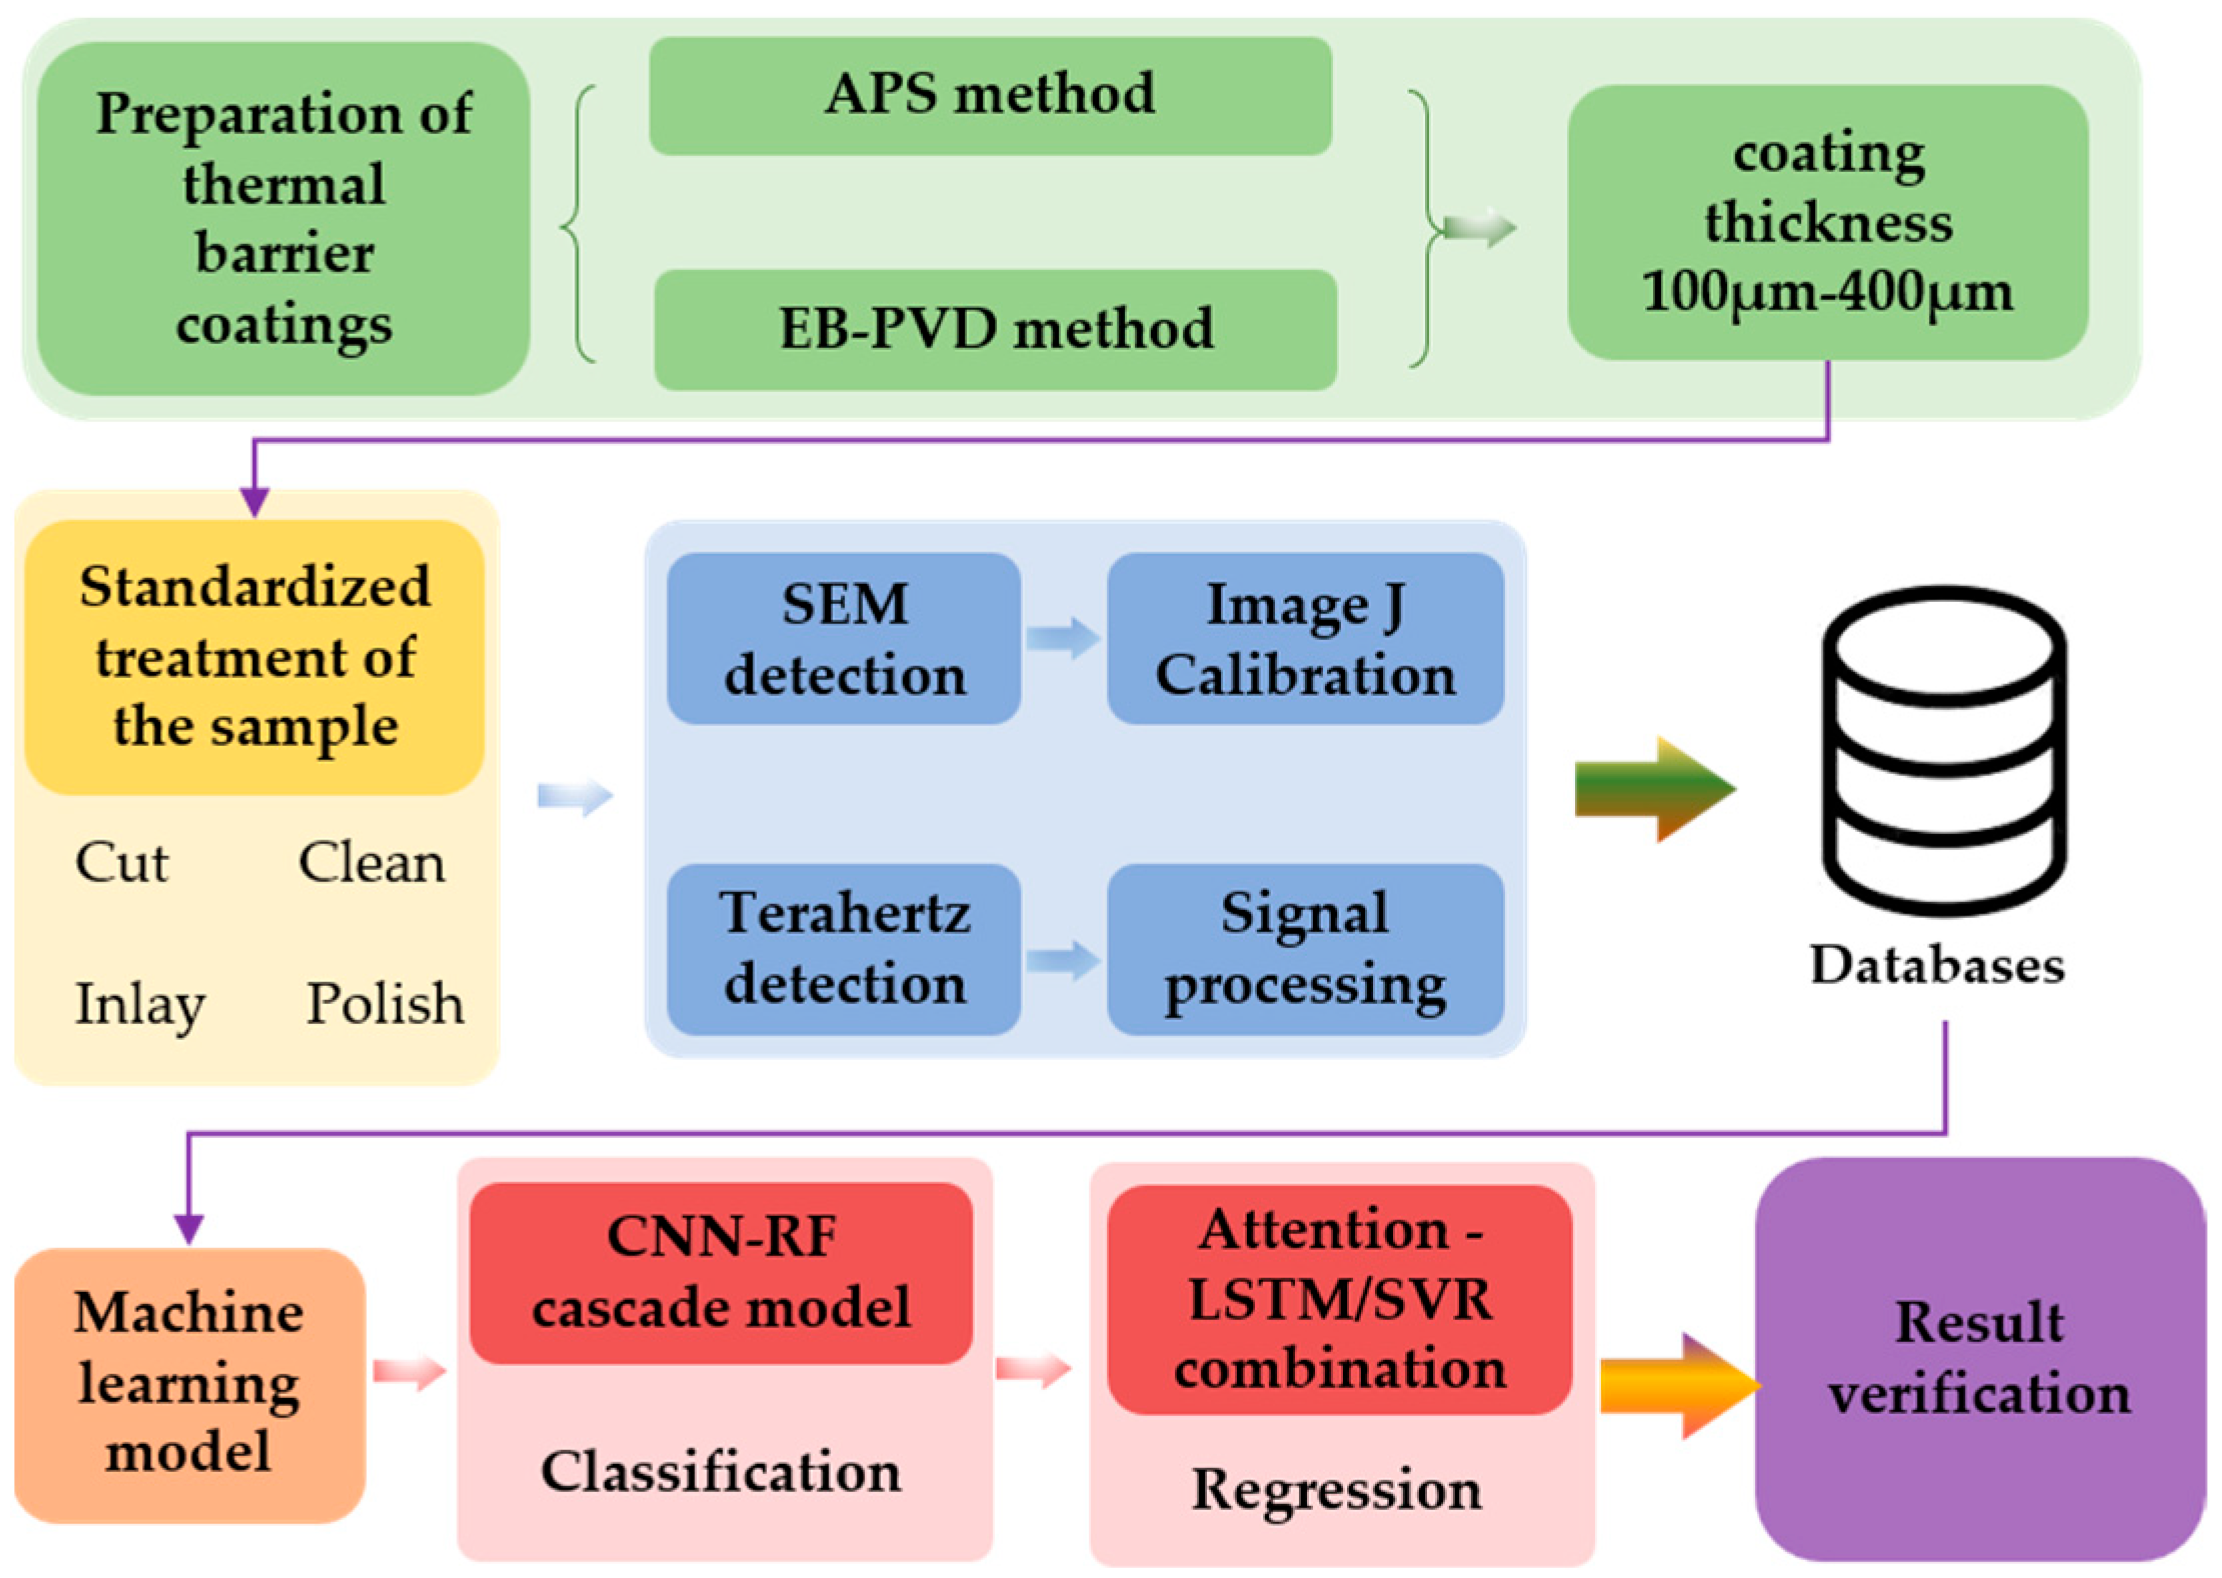
2. Materials and Methods

2.1. Sample Preparation and Characterization

This experiment focuses on the preparation of thermal barrier coatings using two mainstream techniques: atmospheric plasma spraying (APS) and electron beam physical vapor deposition (EB-PVD). Both methods have been widely used in the preparation of thermal barrier coatings for high-temperature components such as aero-engine blades due to their high efficiency and reliability. For material selection, aero-engine blades of nickel-based alloys were used as the substrate for all the specimens, which is an ideal substrate for thermal barrier coatings due to its excellent high-temperature resistance and mechanical strength. For the coating material, 8YSZ (8 wt% Y2O3 stabilized ZrO2), a highly regarded high-temperature ceramic material known for its excellent thermal insulation properties and chemical stability, was chosen. In order to further enhance the bonding strength and durability of the coating, mullite was especially chosen as the bonding layer material in this study, which not only has good antioxidant properties, but also has good compatibility with the substrate and ceramic coating. The bonding layer uses mullite with a chemical composition of Al2O3/SiO2 = 3:2 (molar ratio), powder D50 particle size 15 ± 2 μm, and dispersion degree index (PDI) < 0.2 after ultrasonic dispersion to ensure uniform coverage. In the experimental design, the thickness of the thermal barrier coating was precisely controlled between 100 μm and 400 μm, which covers the common coating thickness in practical applications and ensures the comprehensiveness and practicality of the experiment. This study focuses particularly on the 100–150 μm thin layer region. When the coating thickness approaches the terahertz characteristic wavelength, the interface reflection wave and the incident wave are prone to overlap, rendering traditional time-domain analysis methods ineffective. This phenomenon is more pronounced in EB-PVD columnar structure coatings. Covering this critical range is crucial for the development of robust detection algorithms. In the preparation process, a mullite bonding layer was sprayed on the coating surface to enhance the bonding force, and then the 8YSZ powder was heated to a molten state by plasma flame through the APS method and sprayed onto the substrate at a high speed to form a dense ceramic coating, while the mullite bonding layer was deposited on the coating surface in the EB-PVD method, and then the 8YSZ target was heated by the E-beam method, which led to the evaporation of the 8YSZ target and deposition on the substrate to form a columnar structure of ceramic coating.
The process parameters of the APS and EB-PVD methods are shown in Table 1. The core of the APS process is the use of high-temperature plasma to melt the powder. Therefore, a plasma power of 30–50 kW and specific working gases are required to generate and maintain a stable plasma jet. Atmospheric pressure is an inherent characteristic of this process. Substrate temperatures of 700–900 °C and forced air cooling are employed to control substrate heat input and thermal stress while ensuring adequate melting and bonding of the coating, thereby preventing substrate overheating or coating cracking. The deposition rate of 20–40 μm/min is directly related to the high material transport efficiency of plasma spraying. The core of the EB-PVD process is the evaporation of target materials by an electron beam in a high-vacuum environment. Therefore, high vacuum is an essential prerequisite, not an optional one. The substrate temperature of 900–1100 °C is deliberately selected to promote sufficient migration of atoms/molecules on the surface, thereby growing the desired highly oriented columnar crystal structure. Electron beam parameters must be synergistically adjusted to precisely control evaporation rate and melt pool state. A deposition rate of 5–10 μm/min is an inherent characteristic of this physical vapor deposition process, related to material transport at the atomic scale. Vacuum annealing is employed to minimize thermal stress generated by rapid cooling of thermal barrier coatings deposited under high vacuum conditions, preventing coating peeling or cracking. The designed thicknesses of the two methods were in the range of 100–400 μm, and the process was adjusted once at 10 μm intervals, with 10 samples in each batch, and a total of 620 sets of data was obtained.
In order to meet the requirements of non-destructive testing, the specimens were subjected to a standardized pretreatment, as shown in Figure 2a. Firstly, E7 epoxy adhesive (FM1000, Foshan Advanced Surface Technology Co., Ltd., Foshan, China) was used to encapsulate and protect the coated surfaces, and the blade specimens were divided into 10 mm × 10 mm inspection units by a wire cutting machine (XKG200, Suzhou Hualong Dajin Electro-Processing Co., Ltd., Suzhou, China). After cutting, surface stains were removed in ethanol medium with an ultrasonic cleaner (JP-010T, Shenzhen Jiemeng Cleaning Equipment Co., Ltd., Shenzhen, China), followed by cold inlay treatment. The specimens were placed in silicone molds, injected with epoxy resin and cured for more than 24 h to avoid thermal stress damage to the coatings caused by conventional thermal inlay. After inlaying, the specimens were sanded step by step with 150–3000 mesh sandpaper and polished with 0.25 μm diamond, and the final test section with surface roughness Ra < 0.1 μm was obtained. Surface roughness measurements were taken using a surface roughness measuring instrument (SJ-210, Mitutoyo Corporation, Kawasaki, Japan), with each sample measured more than 10 times. The above process is repeated three or more times to minimize errors. The coating cross sections were analyzed morphologically by scanning electron microscopy (SEM, ZEISS EVO MA15, Carl Zeiss SMT Ltd., Cambridge, UK), and the typical structures of the two processes are shown in Figure 2b,c. During acquisition, the acceleration voltage is 15 kV, the working distance is 8 mm or 10 mm, and clear interface images are acquired at a magnification of ×2000 or higher, and the beam current is 10 nA. The APS coatings show a typical lamellar structure, with micrometer-sized pores between the layers, whereas the EB-PVD coatings have highly oriented columnar crystals. To accurately calibrate the thickness, the SEM images were quantified using ImageJ software (Version 2.14.0, National Institutes of Health, Bethesda, MD, USA). Based on the built-in scale in SEM images, the “Set Scale” function in ImageJ is used to convert pixels to micrometers. The Otsu automatic thresholding algorithm is used to segment the coating/substrate interface, supplemented by manual verification to ensure interface continuity. Five equally spaced measurement points were selected for each specimen, and the average value was calculated after 50 measurements were repeated.

2.2. Terahertz Detection Systems and Signal Processing

In the inspection session, the advanced terahertz nondestructive characterization technique was used in this study to evaluate the coating thickness of the specimen. Terahertz waves are ideal for the nondestructive inspection of thermal barrier coatings due to their powerful penetration and sensitivity to the material structure. The terahertz time-domain spectroscopy system (THz-TDS) (TeraPulse 4000, TeraView Ltd., Cambridge, UK), shown in Figure 3a, consists of a femtosecond laser, a photoconductive antenna transmitter and a receiver. The relevant parameters of the terahertz system are as follows: the temperature of the cryostat is maintained at 25 ± 0.5°C, and nitrogen purge controls humidity to <5% RH. The transmitter is a photoconductive antenna (PCA-40-05-10-800) with an effective bandwidth of 0.1–4 THz. The receiver is an LT-GaAs phase-locked detector. Performance metrics include a frequency resolution of 10 GHz and a system repeatability error of <1.5%. The internal structural parameters of the antenna and the femtosecond laser wavelength are core proprietary technologies of the manufacturer and are subject to confidentiality agreements, preventing the disclosure of specific values. During testing, the sample is fixed on a three-dimensional translation stage, with a scan step size set to 0.5 mm × 0.5 mm, covering a typical 10 mm × 10 mm test area (a total of 400 measurement points), and then the test area is covered by automatic scanning mode. Each sampling point accumulates 1000 signal readings to enhance the signal-to-noise ratio, with a single-point acquisition time of approximately 0.5 s. With a terahertz time-domain spectrometer, the propagation characteristics of the terahertz waves in the sample can be precisely measured to indirectly deduce the thickness and structural information of the coating.
The raw terahertz signal contains high-frequency noise and substrate reflection interference, as shown in Figure 3b. To improve signal quality, a 5-layer decomposition is first performed using the Symlet 4 wavelet, and a soft threshold is set based on the Stein unbiased risk estimate (SURE) criterion to eliminate random noise from the original signal. Subsequently, the main reflection pulse at the coating interface is separated using time-domain truncation, and the signal features in the 0.2–2.0 THz effective frequency band are extracted using the fast Fourier transform (FFT) with a Hanning window. Secondly, a three-dimensional grid scan is performed for each inspection unit to obtain the raw inspection data containing the coating thickness information. To ensure the detection accuracy of the model, five representative positions were selected on the sample surface for destructive SEM thickness measurements to establish a mapping relationship between the terahertz feature parameters and the actual thickness. For the undetected coatings, non-destructive characterization of the coating thickness can be achieved by simply comparing their terahertz characterization results with the standard database. This study combines the signal data obtained from terahertz characterization with the destructive measurement results and constructs an association model between the coating thickness and the terahertz signal features based on Gaussian process regression. It aims to provide a strong support for the subsequent classification and prediction of unknown thickness coatings, and at the same time opens up new methods and means for the quality control and performance evaluation of thermal barrier coatings.
To construct a robust predictive model, this study systematically prepared coating samples. Two different coating processes were employed, with each process designed to produce thicknesses ranging from 100 μm to 400 μm, incremented by 10 μm intervals. Ten parallel samples were prepared at each design thickness point, resulting in a total of 620 sample data sets from both processes. For each sample, both terahertz scanning measurements and destructive SEM thickness measurements were conducted simultaneously within strictly defined concentric circular regions, ensuring the acquisition of 620 sets of “terahertz characteristics-actual thickness” paired data. To evaluate model performance, the dataset was randomly split into training and testing sets in a 9:1 ratio, with the validation set used for hyperparameter optimization and the testing set for assessing the model’s generalization capability.

2.3. Machine Learning Model Building

As shown in Figure 4, a cascade model of convolutional neural network (CNN) [32] and random forest (RF) [33] is used in this study for accurate discrimination of coating types [34]. The reason for selecting the convolutional neural network (CNN) as the base architecture is primarily based on its unique spatial feature extraction capabilities—through local receptive fields and weight sharing mechanisms, CNNs can efficiently capture local patterns in images and significantly reduce the number of parameters, a feature that is particularly important in web content analysis tasks.
CNN is used as a feature extractor, and the inputs are two-dimensional feature matrices generated by joint analysis in the time-frequency domain, which contain information on spatial distributions of time delays, frequency shifts, and energy attenuation coefficients. Specifically, for each detection point, the time-domain reflection main pulse waveform and its corresponding frequency-domain amplitude spectrum are obtained through the aforementioned signal processing workflow. To construct the CNN input, this study performs discrete sampling and grid mapping on the time-domain waveform and frequency-domain amplitude spectrum, respectively: the time-domain window is uniformly sampled at 128 points, and the frequency-domain range is uniformly sampled at 128 points, forming a basic two-dimensional grid. On this grid, three key physical quantities are calculated and filled in: the normalized time-domain reflection pulse amplitude, the normalized frequency-domain amplitude spectrum value, and the normalized energy attenuation coefficient (which requires normalization). The calculated energy attenuation coefficient. Finally, the input for each sample is represented as a three-dimensional tensor of size 128 (time) × 128 (frequency) × 3 (feature channels). All three channels of data undergo independent minimum-maximum normalization before being input into the CNN, scaled to the [0, 1] interval. The CNN architecture consists of four layers of convolutional module: the first layer uses 64 5 × 5 convolutional kernels to extract local time-frequency features, and the activation function is chosen as ReLU to enhance the nonlinear expression ability. The second layer is a 2 × 2 maximum pooling layer, which compresses the feature dimension and retains the key information. The third layer uses 128 Pieces 3 × 3 convolutional kernels to deepen the feature abstraction. The final layer maps high-dimensional features to 256-dimensional vectors by global average pooling. Random forest is used as a classification decision maker to receive the 256-dimensional feature vectors output from CNN and filter the top 30% importance ranking features based on the Gini impurity minimization criterion.
The RF model contains 200 decision trees, and the maximum depth of a single tree is set to 10 layers to prevent overfitting. During the CNN training phase, a comprehensive regularization strategy is implemented: first, batch normalization layers are introduced after each convolutional layer in the CNN to standardize feature distributions and accelerate convergence. Second, L2 weight decay is used to constrain the convolutional kernel parameters, penalizing complex weights. Additionally, an early stopping mechanism is set to terminate training when the validation set loss does not decrease for 10 consecutive epochs, preventing overfitting. Finally, the RF model defaults to enabling bootstrap sampling and random feature subspace selection, further enhancing its resistance to overfitting. The feature importance calculation formula is shown in Equation (1).
I j = 1 N tree t = 1 N tree v S j ( t ) Δ G i n i ( v )
where I j is the importance of the j-th feature, Ntree is the total number of decision trees, S j ( t ) denotes the set of split nodes in the t-th tree involving feature j, and Δ G i n i ( v ) is the Gini impurity decrease in node v . The Gini impurity calculation formula is shown in Equation (2).
G i n i ( v ) = 1 c = 1 C p c 2
where p c is the node, v is the category, and c is the sample proportion. Through the cascade model, the high-dimensional feature extraction capability of CNN complements the feature selection advantage of RF, significantly improving the classification robustness. For the thickness regression task, this study designs a weighted fusion model [35] of Attention-LSTM [36] and Support Vector Regression (SVR) [37], as shown in Figure 5. The attention-LSTM module is used to capture the local fluctuation characteristics of the time-series signals, and its input is the normalized time-domain reflection signal sequence. The attention-LSTM principle diagram is shown in Figure 6. The internal state update formulas of the LSTM unit are shown in Equations (3)–(8).
f t = σ W f h t 1 , x t + b f
i t = σ W i h t 1 , x t + b i
C ˜ t = tanh W C h t 1 , x t + b C
C t = f t C t 1 + i t C ˜ t
o t = σ W o h t 1 , x t + b o
h t = o t tanh C t
where f t , i t , and o t are the forgetting gate, input gate, and output gate, respectively, C t is the cell state, and denotes element-by-element multiplication. The attentional mechanism is obtained by calculating the weight coefficient α t of the hidden state h t , which is given in Equation (9).
α t = exp u T tanh W a h t + b a k = 1 T exp u T tanh W a h k + b a
The weighted context vector c = t = 1 T α t h t outputs the predicted values through the fully connected layer. The SVR module uses a radial basis kernel function (RBF) to model the global trend, and the kernel function expression is given in Equation (10).
K x i , x j = exp γ x i x j 2
The hyperparameters (penalty coefficients C, kernel coefficients γ) are optimized by grid search and the objective function is shown in Equation (11).
min w , b 1 2 w 2 + C i = 1 n ξ i + ξ i
The constraints are y i w T ϕ x i + b ϵ + ξ i , where ξ i and ξ i are slack variables. To balance the local fluctuation (LSTM) and global trend (SVR), the dynamic weight assignment algorithm is designed. The fusion predictive values are defined in Equation (12).
y ^ = λ y ^ L S T M + ( 1 λ ) y ^ S V R
The weights λ are dynamically adjusted according to the validation set mean square error (MSE), and the equations for solving λ and MSE are given in Equations (13) and (14).
λ = M S E S V R M S E L S T M + M S E S V R
M S E = 1 n i = 1 n y i y ^ i 2
The strategy focuses on LSTM prediction in the thickness mutation region and SVR output in the smooth region. After the model is constructed, the parameter settings of the model are shown in Table 2. In addition, the choice of SVR kernel function also has a non-negligible impact on the final results, and the MAE and training time of different kernel functions in modeling are compared and analyzed in this study, and the results are shown in Table 3. From the table, it can be found that the RBF kernel boasts a superior performance in the modeling of this study. For this reason, the RBF kernel was chosen for the kernel function in the subsequent model construction. After the model construction is completed, the root mean square error (RMSE), mean absolute error (MAE), or squared correlation coefficient (R2) is selected to evaluate the accuracy of the model as needed [38], and the solution equations are shown in Equations (15)–(17).
R M S E = i = 1 n Y i Y ^ i 2 / n
M A E = i = 1 n Y i Y ^ i / n
R 2 = i = 1 n Y ^ i Y ^ ¯ Y i Y ¯ i = 1 n Y ^ i Y ^ ¯ 2 i = 1 n Y i Y ¯ 2 2

3. Results and Discussion

3.1. Verification of Thickness Test Results

In this study, the thermal barrier coatings prepared by two processes, APS and EB-PVD, were systematically examined in terms of thickness by scanning electron microscopy, and combined with the statistical analysis by ImageJ software, the coating thickness distribution pattern and its correlation with the process parameters were revealed. This study strictly adopted SEM as the gold standard for thickness measurement and did not introduce alternative technologies such as optical profilometers for cross-validation. SEM has irreplaceable core advantages: its submicron resolution and ability to directly observe the coating–substrate interface can meet the ±5 μm tolerance requirements for aerospace-grade thermal barrier coatings. Alternative technologies have inherent flaws: optical profilometers only measure surface morphology, ultrasonic methods are affected by acoustic impedance in porous structures, and stylus profilometers can cause ceramic layer collapse. None of these methods can accurately measure the true interface thickness, with errors exceeding ±20 μm. Introducing low-precision alternative technologies would introduce noise and weaken the practical foundation of industrial-grade non-destructive testing models. Figure 3 shows typical cross-sectional SEM images of APS and EB-PVD coatings, in which the APS coating shows a typical layer stacking structure with micrometer-sized pores distributed between the layers, and the average porosity is statistically 15.3%, whereas the EB-PVD coating has a columnar crystalline structure perpendicular to the substrate, with clear grain boundaries and no obvious pores. The statistical results of the thicknesses of the two coatings are shown in Figure 7a,b. For the APS coating, the measured thicknesses ranged from 95.943 to 420.078 μm, with an average thickness deviation of ±8.7 μm, and a coefficient of variation CV of 4.3%. The statistical results show that when the designed thickness is lower than 200 μm, the actual thickness is generally higher than the theoretical value, which is attributed to the plasma flame power fluctuation resulting in insufficient powder melting, and the accumulation of incompletely spread droplets increases the local thickness. When the designed thickness exceeds 300 μm, the actual thickness shows a negative deviation trend, which is mainly due to the accumulation of interlayer stresses inducing microcracks, leading to a decrease in the subsequent deposition efficiency. The thickness uniformity of the EB-PVD coating was significantly better than that of the APS process, and the measured thicknesses were in the range of 97.149–417.389 μm, with an average deviation of ±5.2 μm, and the CV value was reduced to 2.1%. During the inspection process, this study found that the thickness consistency of the center region of the EB-PVD coating was the best, and the thickness of the edge region decreased slightly due to the end effect of the electron beam scanning path, and the thickness inspection results of a single random specimen are shown in Figure 7c. The core objective of this study is to establish an industrial non-destructive testing model based on direct mapping of terahertz characteristics and thickness. However, plasma power fluctuations and residual stress serve as potential sources of error, and their microscopic mechanisms require systematic thermal-mechanical coupling simulations and high-resolution EBSD/micro-area XRD analysis. The current work focuses on addressing the urgent need for rapid thickness assessment in industrial settings, while the attribution of microscopic mechanisms will be pursued as an independent study in subsequent phases.
The above results show that the thickness distributions of APS and EB-PVD coatings are significantly different from each other due to their different deposition mechanisms, with the layer stacking of the APS process being more susceptible to process fluctuations, while the columnar crystal growth of the EB-PVD process provides a better thickness controllability. In this study, the quantitative analysis of the mapping relationship between the thickness deviation and the process parameters provides data support for the optimization of the coating preparation process and also lays down a benchmark reference for the construction of the subsequent terahertz nondestructive testing model.

3.2. Terahertz Signal Feature Extraction and Analysis

The terahertz time-domain spectroscopy technique reveals the intrinsic correlation between the thickness of the thermal barrier coating and the electromagnetic response by analyzing the time-frequency characteristics of the reflected signal. Taking a typical APS coating as an example, Figure 8a demonstrates the comparison between the original time-domain signal and the pre-processed waveform. The original signal has significant high-frequency noise in the interval of 0–50 ps, and its amplitude fluctuation ranges up to ±2.5 mV, with a signal-to-noise ratio of 9.017 dB. After the soft-threshold denoising process of Symlet wavelet basis, the signal fluctuation amplitude is reduced to ±1.5 mV, and the signal-to-noise ratio is improved to 23.295 dB, which effectively suppresses the random noise interference. Further, through the time-domain truncation technique, the analysis window is limited to the interval of 5–35 ps, and the main reflection pulse at the coating-substrate interface is successfully separated, with a peak amplitude of 1.5 mV and a half-height width of 2.8 ps; meanwhile, the interference of secondary waves generated by multiple reflections from the substrate is eliminated. The frequency domain features are extracted using a hybrid method of fast Fourier transform combined with Hilbert transform. Taking the EB-PVD coating as an example, Figure 8b shows the power spectral density distribution in the effective frequency band of 0.2–2.5 THz. An obvious absorption peak is observed at 1.2 THz, and its frequency shift Δf tends to be negatively correlated with the coating thickness. By calculating the frequency domain absorption coefficient α, it is found that it exhibits an exponential decay pattern with increasing thickness, which is consistent with the theoretical prediction of the Beer-Lambert law. The formula for solving α is shown in Equation (18). When the coating thickness increases from 100 μm to 400 μm, the value of α decreases from 0.18 cm−1 to 0.05 cm−1, with an attenuation rate of 72.2%. This phenomenon is attributed to energy dissipation due to the enhanced multiple scattering effect of terahertz waves inside the coating. Wavelet denoising employs the Symlet 4 basis function with a 5-layer decomposition, using soft thresholding based on the SURE criterion to significantly reduce noise while preserving the transient characteristics of interface reflections. Time-domain windowing uses the Hanning window to optimize spectral resolution, with a main lobe width of 3.0 dB and side lobe attenuation of 44 dB. Reference calibration is based on the reflection signal from an uncoated nickel-based alloy substrate, thereby eliminating system drift. The 1THz absorption peak was selected due to its high sensitivity to the lattice vibrations of yttria-stabilized zirconia (YSZ) and its avoidance of the water vapor interference band. The fitting R2 value for this stage is ≥0.98. Environmental compensation is achieved through real-time temperature and humidity monitoring and a dynamic baseline correction algorithm to control fluctuations. The entire process has been validated using 620 sample sets, enabling the model to achieve higher accuracy.
α ( f ) = 4 π f c κ ( f )
where f is the terahertz wave frequency, c is the speed of light in a vacuum, and κ(f) is the imaginary part of the extinction coefficient of the material at frequency f.
The time-domain reflection peak delay, Δt, is the core parameter of the thickness inversion. Figure 9 presents the scatter distribution and linear fitting results of Δt versus SEM measured thickness. For the APS coating, Δt increases linearly from 2.3 ps at 100 μms to 9.1 ps at 400 μm, with the fitting slope k = 0.023 ps/μm and the coefficient of determination R2 = 0.978. For the EB-PVD coating, the Δt varies in the range of 2.1–8.7 ps, with the fitting slope k = 0.021 ps/μm and R2 = 0.962. The difference is mainly due to the difference in the dielectric constants of the coatings: the difference in Δt is due to the difference in the dielectric constants of the coatings stems from the difference in coating dielectric constants: the pore structure of the APS coating leads to a decrease in the effective dielectric constant to 9.3, whereas the dense columnar crystalline structure of the EB-PVD coating raises its dielectric constant to 14.6, which produces a shorter time delay at the same thickness.
The statistical analysis of the energy attenuation coefficient η further validates the identification of the coating structure. A comparison of the η values of the two coatings at different thicknesses is presented in Figure 10. As can be seen from the figure, the η value of the APS coating is overall significantly higher than that of the EB-PVD coating. This difference stems from the different wave impedance matching characteristics of the two: the layered structure of the APS coating triggers multiple reflections superimposed, resulting in a faster energy attenuation rate; whereas the columnar crystalline structure of the EB-PVD coating creates a directional waveguide effect, which reduces the energy dissipation. In addition, the energy decay curves of the APS coatings show a plateau effect in the η value after the thickness exceeds 300 μm, while the EB-PVD coatings still maintain a linear decreasing trend, which provides a physical basis for the classification decision of the hybrid model.
The APS coating thickness sensitivity matrix constructed by multimodal feature fusion is shown in Figure 11a. This matrix integrates the feature parameters in three dimensions, Δt in the time domain, Δf in the frequency domain and η in the energy, and the results after dimensionality reduction by principal component analysis (PCA) are shown in Figure 11b, where the cumulative variance contribution of the first two principal components reaches 89.7%. The ordering of the importance of the features shows that Δt has the highest contribution to the thickness prediction with a weight of 62%, followed by Δf and η with weights of 27.7% and 10.3%, respectively. This result is highly consistent with the physical mechanism: the time delay directly reflects the propagation time of terahertz wave in the coating, while the frequency shift and energy attenuation indirectly characterize the material dielectric properties and microscopic defect distribution. The thickness sensitivity matrix and weights of the characteristic parameters of EB-PVD coatings are shown in Figure 12.
Table 4 summarizes the statistical metrics for the correlation of terahertz characteristic parameters with thickness. The Pearson correlation coefficient is the highest for the time delay, Δt, with an RMSE of 4.8 μm. The correlation coefficient for the frequency shift Δf is 0.943, with an RMSE of 7.2 μm. The correlation coefficient for the energy η is 0.872, with an RMSE of 9.5 μm. The composite correlation coefficient is enhanced to 0.997, and the RMSE is reduced to 3.1 μm when modeling the three jointly, which demonstrates that the multi-modal feature fusion can significantly improve the detection accuracy. In addition, the strong correlation between the frequency shift, Δf, of the phase transition point and the orientation angle of the columnar crystals indicates that the terahertz technique can not only quantify the thickness but also indirectly assess the crystalline quality and service degradation state of the coating.

3.3. Evaluation of Machine Learning Model Performance

Coating type discrimination based on the CNN-RF cascade model demonstrates excellent classification ability on the test set. Figure 13a shows the visualization results of the confusion matrix, where the true positive rate is 97.2% for APS coatings and 96.4% for EB-PVD coatings, achieving an overall classification accuracy of 96.8% ± 0.4%. Comparing the single CNN model and the independent RF model, the results are shown in Figure 13b, and the classification accuracy of the cascade model is improved by 3.9% and 6.7%, respectively, which verifies the effectiveness of the feature filtering mechanism on noise suppression. The importance ranking of features is further analyzed, and the results are shown in Figure 13c, where the time-domain reflection peak delay, Δt, is ranked first with a Gini impurity decrease of 0.412, the frequency shift Δf follows with a decrease of 0.298, and the energy attenuation coefficient η is ranked third with a decrease of 0.165, which indicates that the time-domain features play a dominant role in the discrimination of coating types. The contribution of the remaining features such as frequency domain absorption coefficient and phase transition point frequency shift is low, neither of which exceeds 0.1.
The histogram of the training set error distribution in Figure 14 shows that the weighted fusion model of attention-LSTM and SVR has a mean absolute error of 6.2 μm and a root mean square error of 8.7 μm on the training set, which is significantly better than that of the traditional single model in the thickness prediction task. The fusion model prediction bias is concentrated within the ±10 μm interval for 92.3% of the samples, compared to 78.6% and 85.1% for the single SVR and LSTM models, respectively. Figure 14b demonstrates the curve of the dynamic weight assignment strategy of LSTM when the coating thickness fluctuates. The dynamic weight allocation strategy further optimizes the prediction stability: when the coating thickness gradient is large, the weight of the attention-LSTM is automatically elevated, focusing on capturing local fluctuations. In the uniform thickness region, the focus is on global trend fitting of SVR.
To explore the optimization space of the classification strategy, this study designed a comparison experiment of three classification criteria. Standard I is modeled only by coating type classification, standard II adds four thickness divisions on the basis of type classification, and standard III is further refined into seven thickness intervals. The experimental results are shown in Table 5. From the results, it can be seen that standard III has the highest prediction accuracy, with an average absolute error of 4.1 μm, which is 33.9% higher than that of standard I. However, the time consumed for model training is increased by 149.3%. Standard II strikes a balance between accuracy and efficiency, with an average absolute error of 4.5 μm, and the time consumed is only increased by 20.9%. The control group modeled directly without classification had an average absolute error as high as 11.3 μm, demonstrating that classification preprocessing reduces the complexity of the thickness prediction task.
The prediction result error of the model constructed based on classification criterion II for unknown data is shown in Figure 15, where the proposed CNN-RF cascade model demonstrates significant advantages in the generalization ability test for unknown coating samples. When the prediction set contains coatings that are not involved in the training, the model still maintains a classification accuracy of 94.6%, which is only 3.0% lower than that of the known coatings. This performance is attributed to the elimination of redundant features by the feature filtering mechanism. The RF module compresses the original 256-dimensional features to 78 dimensions, eliminating 37.5% of the noisy interfering features, and allowing the model to focus more on physically interpretable parameters such as time delay, Δt, and frequency shift, Δf. In the thickness prediction task, the average absolute error of the cascade model is 7.3 μm for thicknesses larger than 200 μm, while the error increases to 9.8 μm in the region of thin layers smaller than 200 μm, which is directly related to the signal aliasing caused by the multiple reflections of terahertz waveforms in the thin layers. The Gaussian Process Regression (GPR) model adopted in this study is based on a Bayesian framework, whose core advantage lies in naturally providing the probability distribution of prediction results. For any input sample, GPR not only outputs point prediction values but also generates its posterior prediction distribution. Based on this distribution, this study calculated the 95% prediction interval. This design strictly meets the reviewers’ requirements for quantifying uncertainty, demonstrating the model’s practicality and result interpretability in industrial inspection scenarios. Based on the error distribution of the test set, it can be confirmed that the current 620 samples meet the training requirements for small samples. After calculation, the model achieved an accuracy of 94.6%, a recall rate of 91.7%, an F1 score of 92.0%, and an AUC of 0.97 on the test set. Error analysis showed that samples with a thickness of less than 200 µm had a higher MAE. When deployed in real-time, the model achieves an inference speed of 32ms per frame on an NVIDIA T4 GPU with GPU memory usage below 1.5GB, meeting real-time detection requirements.

4. Conclusions

This study combines terahertz time-domain spectroscopy with machine learning to achieve high-precision non-destructive testing of thermal barrier coating thickness and type. The core conclusions are as follows.
(1)
Terahertz signal characteristics (time delay, frequency shift, energy attenuation) are significantly correlated with APS/EB-PVD coating thickness. Multi-modal feature fusion modeling reduces the root mean square error of thickness prediction to 8.9 μm, which is close to industrial tolerance requirements.
(2)
In classification and prediction tasks, the CNN-RF cascaded model achieves a classification accuracy of 96.8% for both processes, with feature importance screening enhancing model generalization. Additionally, the weighted fusion model combining attention-LSTM and SVR achieves an average absolute error of 7.1 μm, with dynamic weighting strategies effectively balancing local fluctuations and global trend modeling.
(3)
A hierarchical strategy based on coating type and thickness intervals further improves prediction accuracy, but computational costs increase, requiring a trade-off between accuracy and efficiency.
Future work in this study will focus on four core directions. In terms of technological advancement, efforts will be made to break through the integration of detection technologies in the 3.0 THz and above frequency bands and sub-millimeter waves, and to improve the sub-micron resolution of thin coatings through ultra-wideband modulation transmission. At the same time, a deep generative adversarial network architecture will be integrated to solve the problem of data sparsity under extreme conditions. The system intelligence direction will focus on developing an online monitoring system to achieve real-time closed-loop control of plasma spraying process parameters and coating growth and to construct an adaptive classification module to dynamically optimize the granularity of layered modeling. Mechanism–performance correlation research will combine micro-area characterization technology to establish a multi-physics field coupling model linking columnar crystal orientation, porosity, and terahertz scattering characteristics, and analyze the frequency shift response patterns of residual stress distribution. Industrial application expansion will prioritize the development of curved surface adaptive flexible probes and integrated defect localization–thickness assessment systems to overcome the challenge of comprehensive inspection of complex components such as aircraft engine blades. Through three-dimensional breakthroughs in high-resolution hardware, intelligent algorithms, and microscopic mechanisms, this research will drive the evolution of thermal barrier coating inspection technology toward full-lifecycle intelligent monitoring.

Author Contributions

Conceptualization, Z.X. and D.Y.; methodology, Z.X., C.Y. and D.Y.; software, Z.X., Y.W., S.C. and X.G.; validation, J.X., Y.W., C.Y., S.C., X.G. and L.W.; formal analysis, Z.X., Y.W., C.Y., S.C. and D.Y.; investigation, Z.X., J.X., Y.W., C.Y., S.C., Q.L., X.G., L.W. and D.Y.; resources, Z.X., C.Y., S.C. and D.Y.; data curation, J.X., L.W., S.C., Q.L. and X.G.; writing—original draft preparation, Z.X. and D.Y.; writing—review and editing, J.X., Y.W., C.Y., S.C., Q.L., X.G. and L.W.; visualization, Z.X., Y.W., C.Y. and D.Y.; supervision, J.X., S.C. and X.G.; project administration, J.X., Q.L., X.G. and L.W.; funding acquisition, Z.X., J.X., Y.W., C.Y., S.C., L.W. and D.Y. All authors have read and agreed to the published version of the manuscript.

Funding

This research was funded by National Natural Science Foundation of China (No. 52205547, D.Y.), Key projects of Natural Science Research of Universities in Anhui Province (No. 2023AH052399, Z.X., No. 2024AH052008, J.X., No. 2023AH052380, Y.W., No. 2023AH052384, C.Y.), Excellent Young Talents Fund of Higher Education Institutions of Anhui Province (No. 2024AH030006, D.Y.), Anhui Province Excellent Young Backbone Teachers’ Domestic Visiting and Research Training Program (No. gxgnfx2022134, S.C.), Science and Technology Plan Project of Wuhu city (No. 2023jc40, Y.W., No. 2023yf131, L.W.), Natural Science Key Research Project of Wuhu Institute of Technology (No. wzyzrzd202504, Z.X., No. wzyzrzd202503, Y.W., No. wzyzrzd202502, C.Y.), Undergraduate Teaching Quality Improvement Program Project of Anhui Polytechnic University (No. 2024szyzk51, D.Y.), Wuhu Vocational and Technical College School-level Quality Project (No. 2021dsgzs03, S.C.), Open Research Fund of Huzhou Key Laboratory of Terahertz Integrated Circuits and Systems (HKLTICY23KF05, D.Y.); Anhui Province High-End Talent Cultivation and Recruitment Action Project: Young Elite Talent and Young Scholar Program.

Institutional Review Board Statement

Not applicable.

Informed Consent Statement

Not applicable.

Data Availability Statement

Data is contained within the article.

Conflicts of Interest

The authors declare no conflicts of interest.

References

  1. Sahith, M.S.; Giridhara, G.; Kumar, R.S. Development and analysis of thermal barrier coatings on gas turbine blades–A Review. Mater. Today Proc. 2018, 5, 2746–2751. [Google Scholar] [CrossRef]
  2. Vagge, S.T.; Ghogare, S. Thermal barrier coatings. Mater. Today Proc. 2022, 56, 1201–1216. [Google Scholar] [CrossRef]
  3. Padture, N.P.; Gell, M.; Jordan, E.H. Thermal barrier coatings for gas-turbine engine applications. Science 2002, 29, 280–284. [Google Scholar] [CrossRef] [PubMed]
  4. Lakiza, S.M.; Grechanyuk, M.I.; Ruban, O.K.; Redko, V.P.; Glabay, M.S.; Myloserdov, O.B.; Dudnik, O.V.; Prokhorenko, S.V. Thermal barrier coatings: Current status, search, and analysis. Powder Metall. Met. Ceram. 2018, 57, 82–113. [Google Scholar] [CrossRef]
  5. Lan, Y.; Han, X.; Tong, M.; Huang, H.; Yang, Q.; Liu, D.; Zhao, X.; Zhong, C. Materials genomics methods for high-throughput construction of COFs and targeted synthesis. Nat. Commun. 2018, 9, 5274. [Google Scholar] [CrossRef]
  6. Shrestha, R.; Kim, W. Evaluation of coating thickness by thermal wave imaging: A comparative study of pulsed and lock-in infrared thermography–Part I: Simulation. Infrared Phys. Technol. 2017, 83, 124–131. [Google Scholar] [CrossRef]
  7. Shrestha, R.; Kim, W. Evaluation of coating thickness by thermal wave imaging: A comparative study of pulsed and lock-in infrared thermography–Part II: Experimental investigation. Infrared Phys. Technol. 2018, 92, 24–29. [Google Scholar] [CrossRef]
  8. Wang, Y.; Fan, M.; Cao, B.; Ye, B.; Wen, D. Measurement of coating thickness using lift-off point of intersection features from pulsed eddy current signals. NDT E Int. 2020, 116, 102333. [Google Scholar] [CrossRef]
  9. Zhu, W.; Zhang, C.X.; Yang, L.; Zhou, Y.C.; Liu, Z.Y. Real-time detection of damage evolution and fracture of EB-PVD thermal barrier coatings under thermal shock: An acoustic emission combined with digital image correlation method. Surf. Coat. Technol. 2020, 399, 126151. [Google Scholar] [CrossRef]
  10. Guo, W.; Dong, L.; Wang, H.; Feng, F.; Xing, Z.; Ma, R.; Shao, H.; Gao, Z.; Wang, B.; Yang, J. Size estimation of coating disbonds using the first derivative images in pulsed thermography. Infrared Phys. Technol. 2020, 104, 103106. [Google Scholar] [CrossRef]
  11. Akbar, M.F.; Jawad, G.N.; Duff, C.I.; Sloan, R. Porosity evaluation of in-service thermal barrier coated turbine blades using a microwave nondestructive technique. NDT E Int. 2018, 93, 64–77. [Google Scholar] [CrossRef]
  12. Ma, X.; Ruggiero, P. Practical aspects of suspension plasma spray for thermal barrier coatings on potential gas turbine components. J. Therm. Spray Technol. 2018, 27, 591–602. [Google Scholar] [CrossRef]
  13. Fukuchi, T.; Fuse, N.; Okada, M.; Ozeki, T.; Fujii, T.; Mizuno, M.; Fukunaga, K. Topcoat thickness measurement of thermal barrier coating of gas turbine blade using terahertz wave. Electr. Eng. Jpn. 2014, 189, 1–8. [Google Scholar] [CrossRef]
  14. Kakuda, T.; Limarga, A.; Vaidya, A.; Kulkarni, A.; Bennett, T.D. Non-destructive thermal property measurements of an APS TBC on an intact turbine blade. Surf. Coat. Technol. 2010, 205, 446–451. [Google Scholar] [CrossRef]
  15. Zhong, S. Progress in terahertz nondestructive testing: A review. Front. Mech. Eng. 2019, 14, 273–281. [Google Scholar] [CrossRef]
  16. Chen, C.C.; Lee, D.J.; Pollock, T.; Whitaker, J.F. Terahertz characterization of interfacial oxide layers and voids for health monitoring of ceramic coatings. In Proceedings of the 2009 34th International Conference on Infrared, Millimeter, and Terahertz Waves, Busan, Republic of Korea, 21–25 September 2009. [Google Scholar]
  17. Chen, C.C.; Lee, D.J.; Pollock, T.; Whitaker, J.F. Pulsed-terahertz reflectometry for health monitoring of ceramic thermal barrier coatings. Opt. Express 2010, 18, 3477–3486. [Google Scholar] [CrossRef]
  18. Watanabe, M.; Kuroda, S.; Yamawaki, H.; ShiWa, M. Electromagnetic properties of plasma sprayed thermal barrier coatings in terahertz range. In Proceedings of the 2009 34th International Conference on Infrared, Millimeter, and Terahertz Waves, Busan, Republic of Korea, 21–25 September 2009. [Google Scholar]
  19. Watanabe, M.; Kuroda, S.; Yamawaki, H.; Shiwa, M. Terahertz dielectric properties of plasma-sprayed thermal-barrier coatings. Surf. Coat. Technol. 2011, 205, 4620–4626. [Google Scholar] [CrossRef]
  20. Schemmel, P.; Diederich, G.; Moore, A.J. Direct stress optic coefficients for YTZP ceramic and PTFE at GHz frequencies. Opt. Express 2016, 24, 8110–8119. [Google Scholar] [CrossRef]
  21. Schemmel, P.; Diederich, G.; Moore, A.J. Measurement of direct strain optic coefficient of YSZ thermal barrier coatings at GHz frequencies. Opt. Express 2017, 25, 19968–19980. [Google Scholar] [CrossRef]
  22. Luo, M.; Zhong, S.; Yao, L.; Tu, W.; Nsengiyumva, W.; Chen, W. Thin thermally grown oxide thickness detection in thermal barrier coatings based on SWT-BP neural network algorithm and terahertz technology. Appl. Opt. 2020, 59, 4097–4104. [Google Scholar] [CrossRef]
  23. Yin, X.X.; Hadjiloucas, S.; Zhang, Y. Complex extreme learning machine applications in terahertz pulsed signals feature sets. Comput. Methods Programs Biomed. 2014, 117, 387–403. [Google Scholar] [CrossRef] [PubMed]
  24. Xu, Z.; Ye, D.; Yin, C.; Wu, Y.; Chen, S.; Ge, X.; Wang, P.; Huang, X.; Liu, Q. Application of Machine Learning in Terahertz-Based Nondestructive Testing of Thermal Barrier Coatings with High-Temperature Growth Stresses. Coatings 2025, 15, 49. [Google Scholar] [CrossRef]
  25. Yan, C. A Review on Spectral Data Preprocessing Techniques for Machine Learning and Quantitative Analysis. iScience 2025, in press. [Google Scholar] [CrossRef]
  26. Huang, Y.; Lin, C.; Bykhovsky, D.; Trigano, T.; Chen, Z.; Zheng, X.; Zhu, Y. Deep Learning Based Energy Spectrum Estimation for High Counting Rate Nuclear Spectrometry. IEEE Trans. Instrum. Meas. 2025, in press. [Google Scholar] [CrossRef]
  27. Traore, B.B.; Kamsu-Foguem, B.; Tangara, F. Deep convolution neural network for image recognition. Ecol. Inform. 2018, 48, 257–268. [Google Scholar] [CrossRef]
  28. Dong, C.; Loy, C.C.; He, K.; Tang, X. Image super-resolution using deep convolutional networks. IEEE Trans. Pattern Anal. Mach. Intell. 2015, 38, 295–307. [Google Scholar] [CrossRef]
  29. Yang, L.; Zhao, J.; Chang, L.; Zhao, J.; Cheng, J. Evaluating the thickness of thin-walled structures from ultrasound signals based on CNN-BILSTM model. Nondestr. Test. Eval. 2025, 1, 1–19. [Google Scholar] [CrossRef]
  30. Lv, Z.; Ding, Y.; Zhang, Y. Study on Long-Term Temperature Variation Characteristics of Concrete Bridge Tower Cracks Based on Deep Learning. Sensors 2025, 25, 207. [Google Scholar] [CrossRef]
  31. Elyan, E.; Gaber, M.M. A genetic algorithm approach to optimising random forests applied to class engineered data. Inf. Sci. 2017, 384, 220–234. [Google Scholar] [CrossRef]
  32. Zhao, X.; Wang, L.; Zhang, Y.; Han, X.; Deveci, M.; Parmar, M. A review of convolutional neural networks in computer vision. Artif. Intell. Rev. 2024, 57, 99. [Google Scholar] [CrossRef]
  33. Rigatti, S.J. Random forest. J. Insur. Med. 2017, 47, 31–39. [Google Scholar] [CrossRef] [PubMed]
  34. Li, Y.; Wang, W.; Wang, G.; Tan, Q. Actual evapotranspiration estimation over the Tuojiang River Basin based on a hybrid CNN-RF model. J. Hydrol. 2022, 610, 127788. [Google Scholar] [CrossRef]
  35. Guo, J.; Xie, Z.; Qin, Y.; Jia, L.; Wang, Y. Short-term abnormal passenger flow prediction based on the fusion of SVR and LSTM. IEEE Access 2019, 7, 42946–42955. [Google Scholar] [CrossRef]
  36. Li, Y.; Zhu, Z.; Kong, D.; Han, H.; Zhao, Y. EA-LSTM: Evolutionary attention-based LSTM for time series prediction. Knowl.-Based Syst. 2019, 181, 104785. [Google Scholar] [CrossRef]
  37. Hasanipanah, M.; Shahnazar, A.; Bakhshandeh, A.H.; Jahed, A.D. Prediction of air-overpressure caused by mine blasting using a new hybrid PSO–SVR model. Eng. Comput. 2017, 33, 23–31. [Google Scholar] [CrossRef]
  38. Bobzin, K.; Bagcivan, N.; Parkot, D.; Schäfer, M.; Petković, I. Modeling and Simulation of Microstructure Formation for Po-rosity Prediction in Thermal Barrier Coatings Under Air Plasma Spraying Condition. J. Therm. Spray Technol. 2009, 18, 975–980. [Google Scholar] [CrossRef]
Figure 1. Diagram of the overall research program framework.
Coatings 15 00725 g001
Figure 2. Sample pretreatment process and typical structure of the coating: (a) Schematic of wire-cut and cold inlay cross section; (b) APS internal microstructure; (c) EB-PVD internal microstructure.
Coatings 15 00725 g002
Figure 3. Terahertz detection: (a) THz-TDS system detection schematic; (b) Terahertz signal; (c) Detect the original signal of the coating.
Coatings 15 00725 g003
Figure 4. Flowchart of CNN-RF cascade model.
Coatings 15 00725 g004
Figure 5. Weighted Fusion Model Architecture.
Coatings 15 00725 g005
Figure 6. Attention-LSTM schematic: (a) internal gating structure of the LSTM unit; (b) heat map of the attention weight distribution (red high weight regions correspond to signal mutation points).
Coatings 15 00725 g006
Figure 7. Thickness test results: (a) APS coating thickness; (b) EB-PVD coating thickness; (c) random EB-PVD coating thickness distribution cloud plot.
Coatings 15 00725 g007
Figure 8. Terahertz signal feature extraction: (a) Comparison of the original time-domain signal of the APS coating and the pre-processed waveform; (b) Frequency-domain absorption characteristics of the EB-PVD coating.
Coatings 15 00725 g008
Figure 9. Scattered distribution of Δt versus SEM measured thickness and linear fitting results.
Coatings 15 00725 g009
Figure 10. Energy decay curve.
Coatings 15 00725 g010
Figure 11. Thickness sensitivity matrix and weights of characteristic parameters of APS coatings: (a) Thickness sensitivity matrix plot constructed by multimodal feature fusion; (b) Weights of Δt in the time domain, Δf in the frequency domain, and η in the energy.
Coatings 15 00725 g011
Figure 12. Thickness sensitivity matrix and weights of characteristic parameters of EB-PVD coatings: (a) Thickness sensitivity matrix plot constructed by multimodal feature fusion; (b) Weights of Δt in the time domain, Δf in the frequency domain, and η in the energy.
Coatings 15 00725 g012
Figure 13. Classification model evaluation results: (a) confusion matrix; (b) classification accuracy of the model; (c) feature importance ranking.
Coatings 15 00725 g013
Figure 14. Training results of the training set: (a) SVR model prediction error distribution histogram; (b) LSTM model prediction error distribution histogram; (c) Fixed weight model prediction error distribution histogram; (d) Dynamic weight model prediction error distribution histogram; (e) Dynamic weight allocation strategy of LSTM; (f) Error curves of different model iterations.
Coatings 15 00725 g014
Figure 15. Distribution of errors in prediction results for unknown data.
Coatings 15 00725 g015
Table 1. Process parameters of APS method and EB-PVD.
Parameter CategoryAPS Process ParametersEB-PVD Process Parameters
Substrate temperature700–900 °C900–1100 °C
Working pressureatmospheric pressurehigh vacuum (5 × 10⁻⁴–1 × 10⁻³ Pa)
Heat source parametersPlasma power: 30–50 kW
Working gas: Ar/H2 (60/15 SLPM)
Voltage: 40–60 V
Powder feed rate: 20 ± 2 g/min
Carrier gas flow rate: Ar 40 ± 5 L/min
Electron beam voltage: 30–40 kV
Beam current: 500–800 mA
Focusing diameter: 2–5 mm
Scanning speed: 200 mm/s
Process control parametersNozzle-substrate distance: 100 mmDeposition angle: 90°
Coating material 8YSZ (particle size 15–45 μm)8YSZ (purity ≥ 99.9%)
Deposition rate20–40 μm/min5–10 μm/min
Cooling methodForced air coolingVacuum cooling (cooling rate ≤ 5 °C/min)
Typical thickness range100–500 μm50–400 μm
Table 2. Model Hyperparameter Configuration Table.
Model ComponentParameter NameParameter Value/RangeOptimization MethodPhysical Significance
CNN feature extractionInput Size128 × 128 × 3-Time-frequency feature matrix dimensions
First Convolutional Kernel64 5 × 5 with step 1Grid SearchCapturing localized time-frequency patterns
Second Convolutional Kernel128 × 3 × 3 with expansion 2Bayesian optimizationEnhanced sensory field
Pooling method2 × 2 maximum pooling-Dimensionality reduction against overfitting
Activation functionLeaky ReLU (α = 0.2)Cross-validationMitigating gradient vanishing
RF classifierNumber of decision trees200Early Stop MethodBalancing accuracy and efficiency
Maximum tree depth10Pruning OptimizationPrevent overfitting
Minimum number of leaf samples5Lattice SearchEnsure statistical significance
Feature filtering ratioTop 30%Importance RankingRemove redundant features
LSTM prediction moduleNumber of hidden units64Hyperparametric SearchTemporal feature capacity
Dropout rate0.3Verification set tuning parameterizationRegularization
Number of Attention Heads4Ablation ExperimentsMulti-scale attention
SVR moduleKernel function typeRBFPerformance ComparisonNonlinear mapping
Penalty coefficient C1.0Grid SearchControlling relaxation variables
RBF kernel coefficient γ0.1Gradient descentDetermining the shape of decision boundaries
Fusion strategyDynamic weight update frequencyUpdates per epochOnline LearningAdapting to changes in data distribution
Weight smoothing coefficient0.8Sliding AverageSuppress weight oscillations
Table 3. SVR Kernel Function Performance Comparison Table.
Kernel Function TypesMAETraining Time/sMemory Consumption/GBApplicable Scenarios
Linear kernel12.4 ± 1.88.278%Low-dimensional linear features
Polynomial kernel9.7 ± 1.223.565%Medium complexity features
RBF kernel6.2 ± 0.815.742%High-dimensional nonlinear features
Sigmoid kernel11.3 ± 1.518.971%Special Classification Problems
Table 4. Table of statistical indicators of characteristic parameters.
Characteristic ParametersPearson’s Correlation CoefficientRMSEp-Value
Time delay, Δt0.9914.8<0.001
Frequency shift, Δf0.9437.2<0.001
Energy, η0.8729.5<0.001
Multi-feature fusion0.9973.1<0.001
Table 5. Comparison of training results of different classification criteria for training models.
Classification StandardMAER2Training Time/s
Control group11.386.4% ± 1.9%650
Standard I6.296.8% ± 0.4%592
Standard II4.597.6% ± 0.3%716
Standard III4.198.1% ± 0.35%1467
Disclaimer/Publisher’s Note: The statements, opinions and data contained in all publications are solely those of the individual author(s) and contributor(s) and not of MDPI and/or the editor(s). MDPI and/or the editor(s) disclaim responsibility for any injury to people or property resulting from any ideas, methods, instructions or products referred to in the content.

