Abstract
This work presents an exhaustive parametric study of the multi-scale residual stress analysis on arbitrary substrate geometry based on a one-way-coupled thermo-mechanical model in an Atmospheric Plasma Spray process. It was carried out by modifying key process parameters, such as substrate surface geometry, substrate pre-heating temperature, and coating thickness, in an Al2O3 coating process on an aluminium substrate. The relationship of these parameters to the generation of quenching stress, thermal stress and residual stress was analysed at three different sub-modelling scales, from the macroscopic dimension of the substrate to the microscopic dimension of the splats. The thermo-mechanical phenomena occurring during the deposition process at the microscopic level were discussed in the proposed cases. Understanding these phenomena helps to optimise the parameters of the coating process by identifying the underlying mechanisms responsible for the generation of residual stresses. The simulated residual stresses of the 200 μm Al2O3 outer coated aluminium cylinder were experimental validated using the incremental high-speed micro-hole drilling and milling method.
1. Introduction
Thermal spray coating processes are widely used to extend the lifetime and reduce the manufacturing costs of industrial components by providing corrosion-resistant, wear-resistant or thermal barrier coatings. Atmospheric Plasma Spray (APS) is a well-established process for producing ceramic coatings within the thermal spray process. The high temperature achieved in the plasma jet (10,000 K to 20,000 K) melts the particles of the feedstock material and then propels them at high speed towards the substrate. When the molten (or semi-molten) particles hit the surface of the substrate, they flatten, cool and solidify to form the coating layer. The resulting coating has specific features such as porosity, oxide inclusions, hardness and residual stress [1,2,3].
High residual stresses induce cracks in the coating, which affect the mechanical properties, adhesion and lifetime of the coating [1,2,4]. It is, therefore, necessary to understand the mechanisms that generate the residual stresses and their evolution to optimise the manufacturing process parameters.
Residual stresses are due to the difference in the thermal and mechanical properties of the substrate and coating materials, such as the coefficient of thermal expansion (CTE) and the modulus of elasticity [5,6,7]. The high-temperature gradients cause residual stresses during the deposition phase and the subsequent cooling phase at room temperature of the substrate-coating assembly [7,8,9]. When the molten particles are deposited on the substrate surface, they solidify rapidly, but their adhesion with the substrate limits their contraction. This limitation in the contraction of the splats creates a tensile stress in the coating, called quenching stress, σq [10,11]. The subsequent cooling of the coating-substrate assembly to room temperature creates a differential contraction between the two layers due to a mismatch in the thermal expansion coefficients of the two materials, so-called thermal stress, σth [12,13]. For ceramic coatings, this is usually a compressive stress. This is because the CTE of the coating material is lower than the CTE of the substrate material. The superposition of the quenching and thermal stress results in the final residual stress.
Numerical modelling is a widely used technique for determining residual stresses generated in thermal spray coating processes [14]. The numerical models have been instrumental in minimising expenditure and accelerating the time-to-market for new products. The classification of numerical simulation models is dependent upon the scale of the coating process on which they focus. Coating process simulation models at the macroscopic scale level consider the coating layer deposited at each torch pass. These models assume uniform thickness and homogeneous properties of the coating layer [15,16,17,18,19], and the effect of splat layer deposition within the coating layer is not considered. In contrast, simulation models at the splat size scale, i.e., the microscopic level, study the interactions between splats [20,21,22,23]. The simulation is usually limited to a small region of the coating layer and a small number of splats. The issue they raise is the difficulty of defining the boundary conditions of the model. The results obtained at each level of simulation are dependent on the process parameters considered and the boundary conditions defined in each case. This makes it difficult to correlate them.
A novel multi-scale coupled thermo-mechanical approach was proposed in previous works [24,25]. The proposed model uses the advanced submodel technique to define three scale levels, from the macroscopic level of the overall component to the microscopic level in the splat dimension. The simulation results obtained facilitate an understanding of the thermo-mechanical phenomena occurring during the coating process from the component scale to the splat level and allow correlation of their effects on the temperature and stress distributions within the coating and on the substrate surface. An experimental method of non-contact temperature measurement using an infrared pyrometer was used to validate the inside substrate temperature evolution during the process of Al2O3 APS coating on an aluminium substrate plate [24]. The quenching stress of an Al2O3 APS coating process on a flat aluminium plate was validated by the in situ curvature method [25].
Industrial applications of APS thermal coating processes involve components with a variety of geometries, such as flat plates, cylinders, cylinder liners, turbine blades, transmission shafts, camshafts, etc. It is fundamental to study the evolution of residual stress as a function of the geometry of the surface. The aim of this work is to carry out an exhaustive analysis of the significant parameters of the APS process, such as substrate surface geometry, substrate pre-heating temperature and coating thickness, using the proposed model [25].
The multi-scale thermo-mechanical model for different geometries is presented in Section 2. In Section 3, the temperature and residual stress evolution at the three submodelling levels during the APS coating process is studied in detail for common substrate surface geometries such as flat plates and cylinders. In addition, a parametric study of the residual stress is carried out by modifying key process parameters, such as substrate pre-heating temperature and coating thickness. In Section 4, the simulated residual stress validation for the outer coated cylinder geometry is carried out by the incremental hole-drilling method [26,27,28,29,30].
2. Numerical Model
This section describes the finite element model (FEM) used to study the APS coating process. The one-way coupled thermo-mechanical model is described in Section 2.1. The operational parameters that define the APS process are outlined in Section 2.2, including torch path parameters, plasma plume profile and heat transfer processes. The thermal and mechanical material properties are summarised in Section 2.3. The experimental measurement method of the residual stress is described in Section 2.4.
2.1. Multi-Scale One-Way Coupled Thermo-Mechanical Model Description
A multi-scale, one-way coupled thermo-mechanical model has been used to study the residual stresses generated in an atmospheric plasma spray coating process [25]. The multi-scale model is based on the submodeling technique [31,32,33]. The modelling is divided into three scale levels due to the difference in dimensions between the overall substrate and the coating layer. This technique facilitates the correlation of the coating process from the macroscopic dimension of the overall component to the microscopic splat level in comparison to other global modelling techniques [16,17,18]. The ANSYS Mechanical APDL 2024 R1 software was used to perform the simulations (ANSYS Inc., Canonsburg, PA, USA) [34].
Additionally, the proposed model [25] allows the study of several types of geometries (flat plate, cylinder, cylinder liners, turbine blades, transmission shafts, camshafts, etc.). The adaptive meshing defined in the macroscopic model can be easily adapted to the shape of the substrate. Two basic geometries characteristic of APS coating processes have been studied, such as flat plate and cylinder. The flat plate case was studied in [25]. The inner and outer coated cylinder cases are studied for typical cylinder applications (cylinders, tubes, liners, etc.). To compare the temperature and stress evolution between the different cases, the same substrate surface dimensions of 101.6 × 25.4 mm2 with a thickness of 4 mm were defined. In the case of the cylinder, the substrate surface area defines the inner or outer diameter of the cylinder. Table 1 summarises the dimensions of each case studied.

Table 1.
Definition of the submodeling simulation parameters.
At each submodeling level, the ratio between the thickness of the coating layer and the substrate layer gradually increases until the coating layer has the same dimensional ratio as the substrate layer in the last submodel level [25]. In the macroscopic model, the meshing of the overall substrate is studied, and the coating layer is defined as surface elements (by the scale difference of the coating thickness to the substrate thickness), as shown in Figure 1. From the macroscopic model, an element of the substrate surface layer is selected, and the so-called mesoscopic submodel is generated. In this case, the coating layer is defined as an additional layer of elements with the defined properties of the coating. The thickness of the coating layer in the mesoscopic submodel is 1/10 of the thickness of the substrate layer. The last submodel level, called microscopic, is created from four elements of the substrate surface layer and four elements of the coating layer. In this sub-model level, the coating layer has the same thickness as the substrate layer. To study the interaction at the splat layer level, the coating layer is divided into 10 layers, which are activated sequentially as the flame profile evolves. Each layer represents the deposition of a splat layer on the substrate surface, providing a detailed evolution of temperature and stresses in the coating thickness. The size of each element in the microscopic model is 4.41 × 4.41 × 3.65 µm3 [35]. During the APS coating process, new layers of coating material are created in the mesoscopic and microscopic model. The simulation was performed using the well-known birth and death element techniques to create the coating layers [7,15,36].
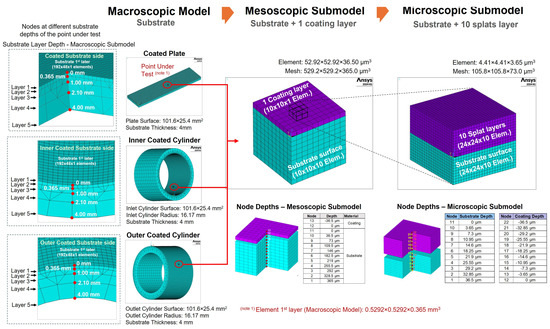
Figure 1.
Diagram of the multi-scale model, which shows the sequence of the macroscopic, mesoscopic and microscopic submodel meshing. Details of layers and nodes at different depths of the point under test for the macroscopic model for the three geometries. Detail of the layer and node distributions for the mesoscopic and microscopic submodels [25].
2.2. Thermal Model
An APS process was simulated on an Al2O3 coating on an aluminium substrate with dimensions summarized in Table 1. The torch path on the substrate depends on the geometry considered. The typical torch path for a flat surface is displayed in Figure 2a [25]. The process was characterised by a succession of linear trajectories of length Lx, with a vertical distance between successive trajectories, DLy. Figure 2b shows the typical torch path for the outer coating of a cylinder. The cylinder rotates with a constant angular velocity, ω, and the torch moves vertically with a constant velocity, vL. The operating parameters were defined as shown in Table 2.
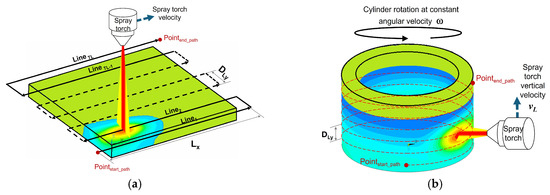
Figure 2.
(a) Schematic diagram of plasma plume trajectory motion for a flat plate with a number of lines or trajectories TL and a line offset DLy (DLy = ΔLZ × dy) [25]. (b) Schematic diagram of plasma plume trajectory motion for an externally coated cylinder with a number of circular paths TL and a line offset DLy (DLy = ΔLZ × dy).
Table 2.
Plasma torch parameters.
The thermal model proposed was explained in [25]. It is subdivided into three principal phases. In the initial phase, before the torch reaches the Kth point under test, the heat transfer between the substrate and the environment by convection and radiation is modelled. The plasma plume reaches the Kth element in the second phase at step K + 1. The torch heat flow over the substrate is modelled as a forced convection heat flow, and the plasma plume profile is defined based on a Gaussian heat flux distribution [24]. The coating layers are activated in this phase of the thermal model. One coating layer is activated in the mesoscopic submodel. Ten splat layers are activated successively in the microscopic submodel. The activation sequence of each layer is shown in Figure 3. Finally, the plasma plume leaves the point under test at step K + FLx + 1. The radiative and convective heat transfer between the coating layer and the environment is modelled. The heat transfer equations were defined in [25].
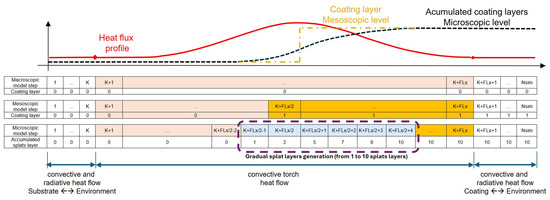
Figure 3.
Sequence diagram of the torch trajectory over the Kth element and the coating layers activation. The plasma plume passes over the element Kth from step K + 1 to K + FLx. Nsim is the total number of simulation steps. In the mesoscopic model, the single coating layer is activated at time K + FLx/2. In the microscopic model, ten splat layers are activated sequentially from time step K + FLx/2 − 1 to time step K + FLx/2 + 4 [25].
2.3. Material Properties
The material of the substrate was aluminium AL99 AW 1050A H14, and the material of the coating was Al2O3 99.7%. The ANSYS material model called Multilinear Isotropic Hardening Plasticity (MISO) was used for the ceramic coating [34]. The Multilinear Isotropic Hardening Plasticity material model describes the multilinear isotropic hardening process of the material during the application of a force. The thermal and mechanical properties of the implemented materials are defined in [25].
2.4. Experimental Measurement of Residual Stress in Thermal Spray Coating Process
Different experimental methods have been extensively employed for the measurement of residual stresses in thermal spray coatings. These experimental methods can be classified according to the following criteria: measurement technique, sample destruction and penetration depth [12,37,38]. In-situ curvature and incremental hole-drilling methods are frequently used. However, each of these is characterised by its own limitations [7]. The in-situ curvature method was proposed in a previous study [25] for experimental measurement of the quenching stress. This was performed to validate the results obtained from the mesoscopic model for the APS coating process of Al2O3 coating on an aluminium substrate flat plate pre-heated to 300 K. However; the in-situ curvature technique can only be applied to flat surfaces. The incremental hole-drilling method (IHD) [26,30] was proposed in this study for experimental measurement of the residual stress in the APS coating process for an Al2O3 outer coating on an aluminium cylinder substrate.
The technique employed was the incremental high-speed micro-hole drilling and milling method (IHMDMM) [27,28,29]. The combination of high-speed drilling up to 300,000 rpm and low penetration rate (~60 μm/min), in addition to a small drilling depth per drilling step (~5–20 μm), guarantees a drilling process without additional stresses and negligible heat development, even in extremely hard materials. This method is an established technique for measuring residual stress distribution across the thickness in terms of magnitude, direction and sense by means of a strain gauge rosette.
The Institute for Ceramic Materials and Technologies (IKMT) of the University of Stuttgart (Germany) has developed a measurement setup based on the incremental high-speed micro-hole drilling and milling method, as shown in Figure 4a. A universal position control unit OWIS PS90 (OWIS GmbH, Staufen, Germany) was used to control the three-axis OWIS LIMES 60 motion system. A high-speed pneumatic turbine at the end of the motion system is used to drill the sample, which is operated by compressed air and reaches a speed of 300,000 rpm. The superficial strains are measured by a strain gauge rosette type EA-06-062RE-120 connected to strain indicator and recorder Vishay P3 (Vishay Precision Group, Inc., Raleigh, NC, USA). A camera with optical zoom is used to monitor and control the drilling and milling process.
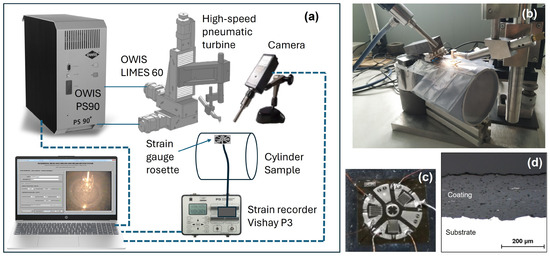
Figure 4.
(a) Diagram of the IHMDMM measurement setup from IKMT. (b) Picture of the IHMDMM measurement setup with the cylinder sample. (c) Picture of the strain gauge rosette type EA-06-062RE-120 used for this experiment. (d) Cross section of the APS-sprayed Al2O3 coating on the aluminium substrate of the sample under test.
An APS coating process was carried out on the outside of an aluminium cylinder (AL99 AW 1050A H14) with an outer diameter of 100 mm and a thickness of 10 mm, with an Al2O3 coating thickness of 200 µm (Al2O3 99.7%, provided by Ceram GmbH Ingenieurkeramik, Albbruck, Germany), as shown in Figure 4d. The F6 APS torch (GTV, Germany) was used, and a six-axis robot (Type RX 130 B, Stäubli Tec-Systems GmbH, Germany) was used to describe the movement of the torch. A coating path was applied with the parameters summarised in Table 2 for an outer coated cylinder. The substrate was pre-heated to 500 K.
3. Simulation Results
The following Section presents the temperature and residual stress evolution simulation at the multi-scale model proposed during the Al2O3 APS coating process on an aluminium substrate. In Section 3.1, the evolution of temperature and residual stress for the cases of flat plate and cylinder coatings in the three proposed submodels is analysed and compared for a substrate pre-heating temperature of 300 K and a coating layer thickness of 36.5 µm. The residual stresses evolution during the deposition process for different coating thicknesses for the two proposed geometries is discussed in Section 3.2. Section 3.3 analyses the effect of substrate pre-heating temperature on the quenching stress and final residual stress in the three proposed cases.
3.1. Substrate Geometry
This Section compares the numerical model results for three typical APS coating geometries: a flat plate, an inner-coated cylinder and an outer-coated cylinder. The simulation results for a flat plate were analysed in [25]. A torch path of 15 trajectories was simulated in the macroscopic model. The point under test was selected at the centre of the top-coated layer, and the five vertical nodes through the thickness of the substrate were selected, as shown in Figure 1. Figure 5 shows the macroscopic model temperature evolution at different substrate depths at the point under test during the coating process for the three geometry cases studied.
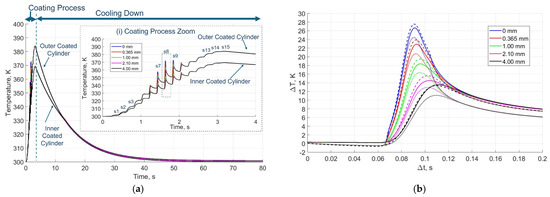
Figure 5.
(a) Macroscopic model temperature evolution at different substrate depths (0, 0.365, 1.0, 2.1, and 4.0 mm) of the point under test (Figure 1) during the APS coating process on inner and outer coated cylinders. Inset (i) shows the simulated temperature evolution details of the 15 trajectories of the coating path for external or internal cylinder sides, sx, x = 1, …, 15. (b) Normalized simulated temperature evolution during the 8th trajectory at different substrate depths of the point under the test of the flat plate (continuous), inner coated cylinder (dotted, …), and outer coated cylinder (dashed,--).
Figure 5a shows the temperature evolution in the inner and outer coated cylinder cases. As in the case of the flat plate [25], two phases were observed, corresponding to the coating phase and the cooling phase at ambient temperature. The homogeneous substrate temperature increase was due to the build-up of heat during the coating phase. The maximum temperature of the cylinder path was observed to be 370 K and 385 K for the inner and outer coated cylinders at the end of the coating phase, respectively.
A maximum temperature peak sequence was observed in the central trajectories (sixth to tenth). This pattern was due to the plasma plume passing close to the point under test. The maximum temperature peak was obtained when the plasma plume passed over the point under test in the 8th trajectory, as shown in the inset of Figure 5a. It can be observed that there was a difference in the overall substrate temperature increases between the two cylinder cases. This was because the outer coated cylinder had a lower cooling rate through the inner surface of the cylinder, in comparison to the inner coated cylinder, which had a larger cooling surface area with the environment through its outer face.
Figure 5b presents a comparative analysis of the time interval for the 8th trajectory in the three study cases. The three plots were normalised by the differences in temperatures and times observed in each case to facilitate comparison. The three cases studied exhibit a similar trend. The largest temperature increase at the substrate surface (0 μm depth) was 27 K and 28 K for the flat plate and outer coated cylinder cases, respectively. The overall substrate temperature increased by 8 K at the end of the 8th trajectory in both cases. In the inner coated cylinder, the maximum increase in the substrate surface temperature was 23 K, and the overall temperature increased by less than 6 K at the end of the 8th trajectory. This is because the inner coated cylinder had a larger surface area exposed to the external environment on its outer face.
Figure 6 shows the stress evolution in the three case studies in the macroscopic model. Two phases are identified in the three cases, corresponding to the coating phase and the cooling phase to ambient temperature, as justified in the thermal analysis. Figure 6a presents the stress evolution in the flat plate. A correlation is observed between the peak compressive stress of −43 MPa and the peak temperature of 361 K at the point under test due to the passage of the plasma plume, as it was discussed in [25]. When the plasma plume left the point under test, it cooled down, and the compressive stress disappeared.
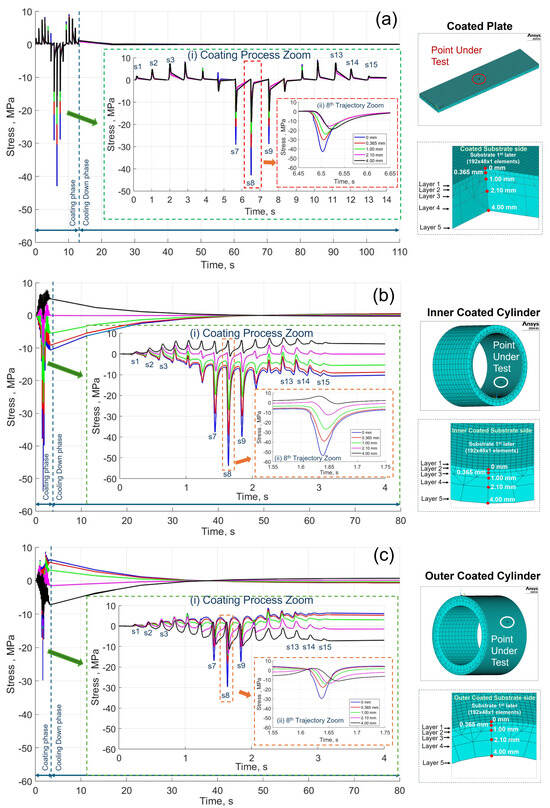
Figure 6.
Macroscopic model stress evolution at different substrate depths (0, 0.365, 1.0, 2.1, and 4.0 mm) of the point under test (Figure 1) during the APS coating process on a flat plate (a), inner coated cylinder (b), and outer coated cylinder (c). Inset (i) shows simulated stress evolution details of the 15 trajectories of the coating path, sx, x = 1,…,15.
Two additional effects were observed in the cylinder geometry cases. The first one was the increment of the accumulated substrate temperature. The result of this was a compressive stress accumulation on the inner face and an accumulation of tensile stress on the outer face. This was due to the material undergoing expansion. The second one was the compressive stress peaks in the vertical section of the point under test due to the passage of the plasma plume over the test point. This pattern of compressive stress peaks is related to the pattern of temperature peaks observed in Figure 5. In the case of the inner coated cylinder, the coating layer was created on the inner face of the cylinder. The maximum compressive stress peak was observed on the internal surface because of the direct effect of the heat flow from the plasma plume. In contrast, the maximum compressive stress peak was obtained on the external surface of the outer coated cylinder case. The maximum compressive stresses for the inner and outer coated cylinders were −55 MPa and −30 MPa, respectively. In the flat plate case, it was −43 MPa [25].
The macroscopic, mesoscopic and microscopic simulated temperature evolutions in the 8th trajectory are shown for the inner and outer coated cylinder cases in Figure 7.
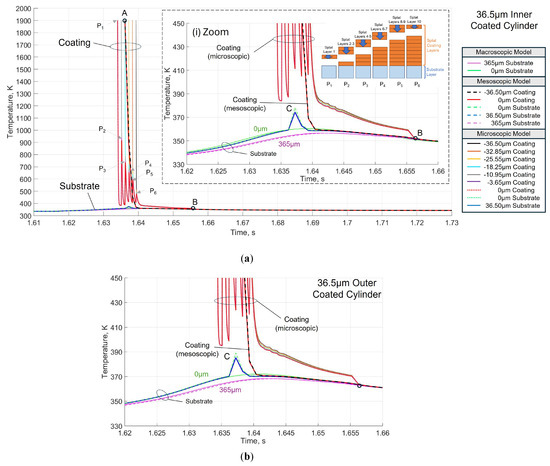
Figure 7.
(a) Macroscopic, mesoscopic and microscopic numerical simulation temperature evolutions at different coating and substrate depths of the point under test (Figure 1) for a 36.5 µm coating thickness of inner coated cylinder case with a pre-heating substrate temperature of 300 K. Inset (i) shows the temperature evolution details of the splat layers in the microscopic submodel and the effect on the temperature evolution of the substrate surface. (b) Details of the temperature evolution of the splat layers in the microscopic submodel and the effect on the substrate temperature evolution in the outer coated cylinder case for a 36.5 µm coating thickness and a pre-heating substrate temperature of 300 K.
Figure 7a shows the temperature evolution in the central period of the 8th trajectory for the inner coated cylinder case at the three submodels. The surface substrate temperature (0 μm substrate) increased progressively in the macroscopic level because of the plasma plume up to 361 K. When the centre of the plasma plume arrives over the point under test, the coating layers (0 µm coating-mesoscopic and −35.6 µm coating-mesoscopic) were activated in the mesoscopic model at 1900 K, point A, and it cooled rapidly in contact with the substrate surface (0 µm substrate-mesoscopic). At this time, the substrate temperature rose to 378 K, point C. This effect was not observed in the macroscopic model because this model only considers the heat of the plasma plume. A temperature gradient between the coating layers and the substrate layer was observed. This effect was due to the imperfect contact between the two surfaces. It was modelled by the thermal contact conductivity [39]. Finally, the temperature of the coating and the substrate layers equalised when the plasma plume left the point under test, point B. The inset in Figure 7a shows the temperature evolution in the different coating layers of the microscopic submodel in the inner coated cylinder. This showed a similar pattern to that of the flat plate case, as previously discussed in [25]. A gradient of temperature between the coating and substrate layers was observed, like the mesoscopic submodel. The thermal effect of the activation of each splat layer during the deposition process produced fluctuations in the coating temperature, as shown by the 0 μm coating-microscopic temperature evolution.
The initial temperature of the first splat layer was 1900 K at the instant of deposition, point P1. The splat layer cooled rapidly in contact with the substrate until time instant P2. At this instance, the following two splat layers were initiated at a temperature of 1900 K. A sudden temperature increase of the initial splat layer to the temperature of point P2, after which the layers cooled down together until the time instant P3. At this time, two new layers of splats were deposited at 1900 K, which caused a sudden heating of the previous coating layers up to the temperature of point P3, after which they cooled down together until time instant P4. Then, two additional splat layers were deposited at time instant P4, with a temperature of 1900 K, and the preceding coating layers rapidly reached the P4 temperature and subsequently underwent a cooling process to reach time instant P5. This phenomenon was repeated in the remaining deposition phases of the splat layers. The temperature peaks in the 0 μm coating layer decreased because the heat from the cooling of the successive splat layers was distributed over a larger volume of material. At the final splat layer deposition, time instant P6, the final peak temperature was reached, and the ten splat layers cooled together to match the substrate temperature at point B.
It is important to note that these temperature fluctuations had a fundamental role in the generation of stresses in the splat layers of the microscopic model, as discussed in further detail below. A comparable effect was observed for the outer coated cylinder, with an increase in substrate temperature to 389 K, as shown in Figure 7b. The microscopic model also showed the same pattern of temperature peaks in the splat layers.
Figure 8a presents a comparative analysis of the stress evolution in the deposition phase of the coating across the three submodels in the inner coated cylinder case. The compressive stress in 0 μm substrate layer increased progressively up to −52 MPa in the macroscopic level due to the only heating effect of the plasma plume. In the case of the mesoscopic and microscopic submodels, the effect of the solidification of the coating layer was taken into account, resulting in a compression stress peak of −91 MPa in the surface layer of the substrate, point A. This compression peak was due to the rapid heating of the substrate point under test by the solidification of the coating layer, which was constrained by the adjacent substrate. The compressive stress in the 0 μm substrate layer reached −45 MPa at the end of the solidification phase of the coating layer, designated as point B, with a quenching stress of 17 MPa in the coating layer, point C. The quenching stress of the flat plate model was validated using the in-situ curvature method [25].
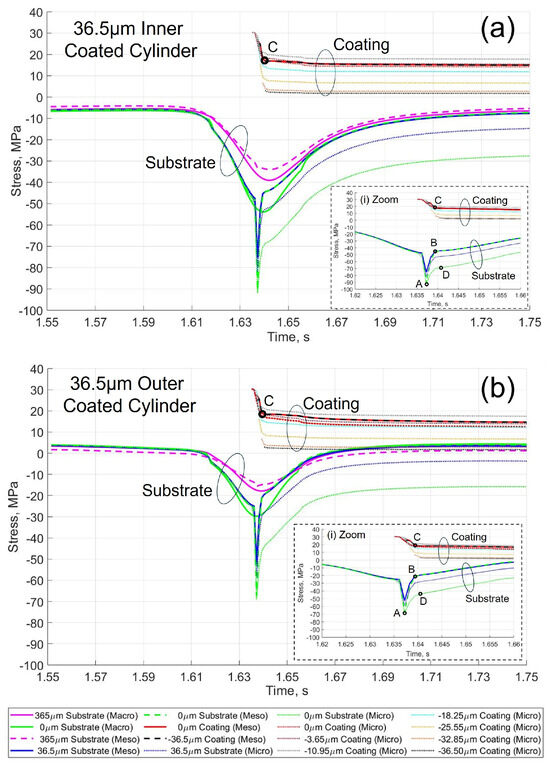
Figure 8.
(a) Stress evolution of the macroscopic, mesoscopic and microscopic numerical simulations at different depths of coating and substrate of the point under test (Figure 1) for a case of the inner coated cylinder. (b) Stress evolution of the macroscopic, mesoscopic and microscopic numerical simulations at different depths of coating and substrate of the point under test (Figure 1) for a case of the outer coated cylinder.
In the case of the microscopic level, tensile stresses in the coating layers decreased as a function of coating thickness as successive layers of splats were deposited. The highest tensile stress of 30 MPa was observed in the initial layer of the coating when the coating layer was activated. The splat contracted during cooling down in contact with the substrate, but this contraction was limited by the splat adhesion with the substrate surface. This resulted in the generation of tensile stress within the coating layer. Subsequent layers of splats were deposited on top of previous splat layers, as illustrated in Figure 7a. The activation of each splat layer resulted in an increase in the temperature of the previous coating layers. This resulted in a reduction in tensile stresses within successive splat layers due to a reduced temperature gradient during the deposition phase. This phenomenon was repeated in each splat layer. This increased the compressive stress in the 0 μm microscopic substrate layer to −70 MPa, point D. The compressive stress difference of −25 MPa between the mesoscopic and microscopic 0 µm substrate layer remained constant until the end of the coating phase. Figure 8b shows a similar pattern for the outer coated cylinder case. In the mesoscopic submodel, the substrate compression peak at the coating layer deposition time was increased to −68 MPa at point A. The compressive stress in the 0 μm substrate layer reached −21 MPa, point B, and −43 MPa, point D, at the end of the deposition phase in the mesoscopic and microscopic submodel, respectively, with a quenching stress of 17 MPa in the coating layer, point C.
3.2. Effect of the Coating Thickness
In this subsection, the coating thickness effect on the residual stresses of the deposition process was studied for the three geometries analysed for a substrate pre-heating temperature of 300 K. The coating thickness was correlated with the thickness of the first layer element of the macroscopic mesh, dz, as shown in Table 1. Three values of dz were analysed, 365 µm, 730 µm and 1095 µm, that corresponded with 36.5 µm, 73 µm and 109.5 µm coating thickness in the microscopic model, respectively.
Figure 9 presents a comparative analysis of the stress evolution during the deposition phase of the coating layer for the three coating thicknesses on the flat plate case. An increase in compressive stress in the 0 µm substrate layer resulted in an increase in coating thickness. The maximum compressive stress increased from −77 MPa for a coating thickness of 36.5 µm to −99 MPa and −110 MPa for coating thicknesses of 73 µm and 109.5 µm, respectively. Thicker coatings increased the heating of the substrate at the test point, which increased the compressive stress peak. The compressive stress peak of the substrate increased by 5 ms from a coating thickness of 36.5 µm to 109.5 µm, point D.
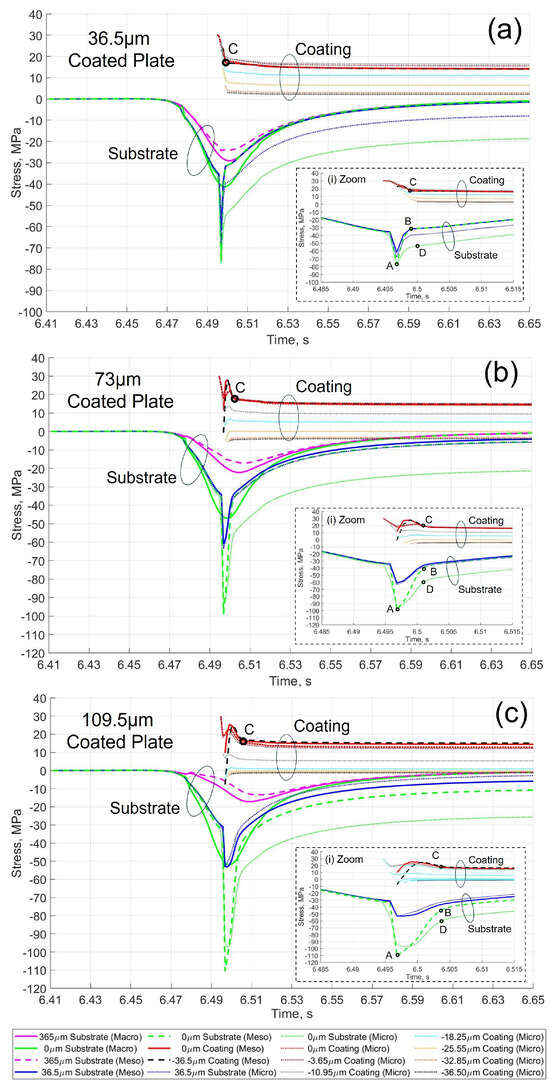
Figure 9.
Stress evolution of the macroscopic, mesoscopic and microscopic numerical simulations at different depths of coating and substrate of the point under test (Figure 1) of an aluminium plate with (a) 36.5 µm Al2O3 coating thickness; (b) 73 µm Al2O3 coating thickness; (c) 109.5 µm Al2O3 coating thickness.
The microscopic submodel shows the stress distribution in the coating thickness in more detail for successive splat layers. It observed that the tensile stresses in the successive splat layers decreased as the splat layers moved away from the substrate surface, as discussed in Figure 8. It was due to a decreasing effect of substrate stiffness as the splat layers were deposited on top of previous splat layers.
Figure 10a shows the quenching stress, thermal stress and final residual stress obtained for the three cases studied (flat plate, inner coated cylinder and outer coated cylinder) as a function of the coating thickness ratio dz/dx. Similar behaviour was observed for the three coating geometries studied. The quenching stress was found to be practically constant, with an average value of 18 MPa. It can, therefore, be concluded that the quenching stress is not dependent on the coating thickness. The thermal stress decreased proportionally with increasing coating thickness because the substrate temperature increased due to a larger volume of coating material. The lowest thermal stress was observed in the inner coated cylinder, as its maximum temperature at the end of the deposition process was 20 K lower than the other geometries for the same coating thickness. Finally, the residual stress decreased progressively with the thickness of the coating due to the predominant effect of the thermal stress on the quenching stress. The highest residual stress was achieved with the inner coated cylinder, regardless of coating thickness, due to the lower thermal stress.
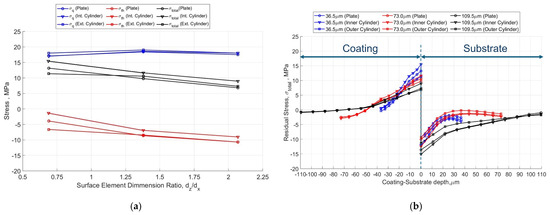
Figure 10.
(a) Simulated quenching stress, σq, thermal stress, σth, and residual stress, σtotal, versus surface element dimension substrate ratio dz/dx, at the coating interface (0 µm coating) for flat plate, inner coated cylinder and outer coated cylinder cases at different coating thicknesses, for a 300 K pre-heated substrate temperature (dx = 0.5292 mm, three values of dz were analysed, 365 µm, 730 µm and 1095 µm). (b) Simulated microscopic-scale residual stress, σtotal, at different depths of the coating and substrate interface for flat plate, inner coated cylinder and outer coated cylinder cases at different coating thicknesses for a 300 K pre-heated temperature of the substrate.
The residual stress at different depths of the coating-substrate interface for different coating thicknesses is shown in Figure 10b for a substrate pre-heating temperature of 300 K. The interface between the coating, and the substrate was at a depth of 0 µm. It can be observed that the coating was subjected to predominantly tensile stress, while the substrate was subjected to predominantly compressive stress. This was attributed to the thermal stress being relatively low compared to the quenching stress for a substrate pre-heating temperature of 300 K. The maximum tensile stress at the coating layer interface was obtained for the inner coated cylinder for a coating thickness of 36.5 µm, with a maximum value of 15.5 MPa. However, the maximum compression stress at the interface of the substrate layer was obtained for the inner coated cylinder for a thickness of 36.5 µm coating, with a maximum value of −15 MPa. Furthermore, it was revealed that an increase in coating thickness results in a reduction in tensile stress at the coating interface, while compressive stress at the substrate interface was increased. This is due to the larger volume of material in the coating layer.
3.3. Effect of Substrate Pre-Heating Temperature
In the following subsection, the effect of substrate pre-heating temperature is studied for the flat plate, inner-coated cylinder and outer-coated cylinder cases. The cases of substrate pre-heating temperature at 300 K, 400 K, 500 K and 600 K are analysed. Figure 11a compares the quenching stress, thermal stress, and final residual stress obtained for the three cases studied (flat plate, inner coated cylinder, and outer coated cylinder) as a function of substrate pre-heating temperature. The simulated quenching stress increased slightly from 17 MPa to 28 MPa with increasing substrate temperature, which was in line with the trend of the literature results for Al2O3 coating [11]. It was also observed that dependence was smaller at higher substrate pre-heating temperatures [11,17]. On the other hand, the thermal stress decreased with increasing substrate pre-heating temperature, which was in line with the trend of the literature results when the CTE of the substrate was bigger than the CTE of the coating [11]. Finally, the residual stress showed a decreasing trend with increasing substrate pre-heating temperature. Null residual stress corresponded to a substrate pre-heating temperature of 350 K, at which the quenching stress and thermal stress cancel each other out.
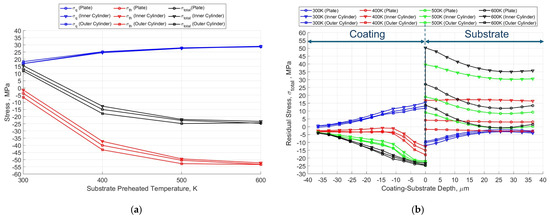
Figure 11.
(a) Simulated quenching stress, σq, thermal stress, σth, and residual stress, σtotal, versus substrate pre-heated temperature for flat plate, inner coated cylinder and outer coated cylinder cases at the coating interface (0 µm coating) for a 36.5 µm coating thickness layer. (b) Simulated microscopic-scale residual stress, σtotal, at different depths of the coating and substrate interface for flat plate, inner coated cylinder and outer coated cylinder cases at the coating interface (0 µm coating) for a 36.5 µm coating thickness, and different pre-heating temperature of the substrate in the APS process.
Figure 11b shows the final residual stress as a function of coating-substrate depth. The interface between the coating and the substrate was at a depth of 0 µm. A change in the trend of the residual stress was observed between 300 K and 400 K. The thermal stress had a smaller effect than the quench stress on the residual stress for the pre-heating temperature of 300 K. The residual stress trend change was observed for the pre-heating temperature of 350 K. As the pre-heating temperature of the substrate increased from 400 K to 600 K, the temperature gradient produced higher thermal stress during the cooling down phase. This resulted in higher compressive stresses in the coating and higher tensile stresses in the substrate [11]. The residual stress in coating depth had the same trend for the three geometries analysed and the same substrate pre-heating temperature, with a maximum value at the interface layer. However, the residual stress in the substrate layer changed significantly depending on the case analysed. The lowest substrate residual stress was observed in the outer coated cylinder from the 400 K pre-heating temperature in the three geometries. On the other hand, the residual stress was approximately twice and four times higher for the flat plate and the inner coated cylinder, respectively, for the same substrate pre-heating temperature. The residual stress on the coated substrate surface was lower in the outer coated cylinder due to the outward radial expansion of the substrate during the coating process. In the case of the inner coated cylinder, the coated substrate surface was unable to expand due to the cylinder geometry, which caused a residual stress increase on the coated surface during the cooling phase.
4. Experimental Measurement of Residual Stresses by Incremental High-Speed Hole-Drilling Method
This section describes the experimental measurement of the residual stress used to validate the simulated results obtained from the microscopic model for the APS coating process of Al2O3 outer coating on an aluminium cylinder substrate pre-heated to 500 K. The technique employed was the incremental high-speed micro-hole drilling and milling method (IHMDMM), which is based on the well-known incremental hole-drilling method (IHD). The process parameters are summarised in Table 2.
Figure 12 shows the residual stress profile of the outer coated cylinder sample obtained using the IHMDMM measurement setup, as shown in Figure 4b. The experimental residual stress exhibited a compressive stress pattern that increased in depth within the coating layer, reaching a maximum value of −217 MPa at the coating-substrate interface at 0 µm. The compressive stress increased in the substrate until a maximum value of −231 MPa at 10 µm substrate depth. After that, the residual stress decreased with the substrate depth until it was zero value at 200 µm depth. This compressive residual stress on the substrate surface was attributed to the grit-blasting of the sample surface performed prior to the coating process [40,41].
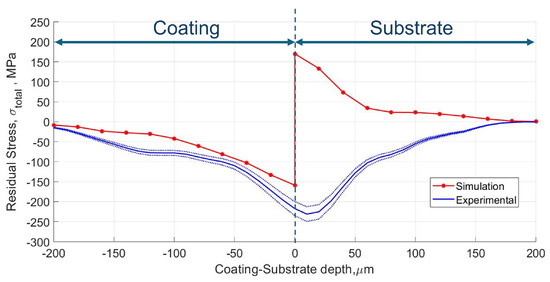
Figure 12.
Comparison of the residual stresses measured (blue line) and residual stress simulated (red line) with the microscopic model for the outer coated cylinder sample.
The simulated residual stress was obtained with the microscopic model for the outer cylinder sample, as shown in the red line in Figure 12. The simulated residual stress showed two different trends: compressive stress in the coating layer and tensile stress in the substrate layer. The compressive residual stress increased with the depth of the coating layer, reaching a maximum value of −159 MPa, which was similar evolution to the experimental results. A tensile stress peak of 170 MPa was observed at a substrate layer depth of 0 µm. The tensile stress exhibited a relaxation trend along the depth of the substrate, reaching a state of zero stress at 200 µm substrate depth. This effect was due to the CTE difference between the coating and the substrate materials. At the end of the cooling phase, a mismatch in the shrinkage of both materials appeared at the interface, which induced a compressive stress peak in the coating and a tensile stress peak in the substrate. This was due to the simplifications of the surface contact model used in the simulation model, which was not observed in the experimental measurements. The experimental results prove the interpretation of the numerical results regarding the formation of high compressive stresses in the coating layer. In contrast, the microscopic model exhibited a lack of correlation with the experimentally measured compressive stress on the substrate surface, which was attributed to the prior grit blasting of the sample. This was because the numerical model did not consider the initial stress state of the substrate surface due to grit blasting. Surface grit-blasting is a complex process with several parameters (particle size, blasting distance, pressure, etc.) that must be taken into consideration [42]. Furthermore, its effects are only observable at the microscopic level for the first few hundred microns of substrate depth [40]. In order to characterise the grit-blasting process correctly, it would be necessary to carry out a complex and specific study. This would make the proposed multi-scale simulation model more complex and exceed the scope of the present work.
5. Conclusions
This work carried out an exhaustive parametric study to analyse the robustness and flexibility of the multi-scale thermo-mechanical model proposed in [25] for the APS process. The influence of several key parameters of an APS Al2O3 coating process on an aluminium substrate has been studied, such as substrate geometry, substrate pre-heating temperature, and coating thickness. Three typical cases were studied, such as flat plate, inner coated cylinder and outer coated cylinder. The temperature and residual stress evolutions during the coating process showed the same trend in the three cases analysed. An overall substrate temperature difference of 24 K was observed at the end of the coating phase for a 300 K pre-heating substrate temperature between the flat plate and the outer coated cylinder. This was mainly due to the differing rates of heat transfer between the substrate and the environment in each case. The influence of the coating thickness layer had similar behaviour in all geometries. The quenching stress was quasi-independent with the coating thickness, with an average value of 18 MPa. On the other hand, the thermal stress evolution was correlated with the coating thickness increment due to the substrate temperature increment for a higher heat flow from the coating layer. Finally, the residual stress showed a slight decrease of 7.5 MPa due to the thermal stress effect. The pre-heating temperature increase had a minimum effect on quenching stress, with a slight increase of 11 MPa. However, it had a significant effect on thermal stress, with a decrease of −50 MPa due to the higher temperature gradient during the cool-down phase. The final residual stress decreased due to the predominant effect of the thermal stress. One important conclusion was that the proposed model could predict the optimal pre-heating temperature for a specific APS coating process to achieve a null residual stress.
Experimental measurement of residual stress has been carried out using the incremental high-speed micro-hole drilling and milling method to validate the residual stress simulation model of an aluminium outer coated cylinder. The simulated microscopic residual stresses depth profile followed the trend of the experimental data in the depth of the coating layer. However, the measured compressive stress in the first 200 µm substrate depth could not be obtained through the microscopic model. This was due to the numerical model not taking account of the grit-blasting of the substrate surface sample before the APS process.
Author Contributions
Conceptualisation, J.M.-G.; software development, J.M.-G. and V.M.-G.; writing—original draft preparation, J.M.-G.; writing—review and editing, J.M.-G., V.M.-G. and A.K. All authors have read and agreed to the published version of the manuscript.
Funding
This research received no external funding.
Institutional Review Board Statement
Not applicable.
Informed Consent Statement
Not applicable.
Data Availability Statement
Data is contained within the article.
Acknowledgments
The authors thank the Institute for Ceramic Materials and Technologies (IKMT) of the University of Stuttgart (Germany) for their support in the experimental tests.
Conflicts of Interest
The authors declare that they have no known competing financial interests or personal relationships that could have appeared to influence the work reported in this paper.
References
- Pawlowski, L. The Science and Engineering of Thermal Spray Coatings, 2nd ed.; John Wiley & Sons, Ltd.: Oxford, UK, 2008; ISBN 978-0-471-49049-4. [Google Scholar]
- Espallargas, N. Future Development of Thermal Spray Coatings, 1st ed.; Woodhead Publishing: Cambridge, UK, 2015; ISBN 978-0-85709-769-9. [Google Scholar]
- Li, C.J.; Ohmori, A. Relationships between the microstructure and properties of thermally sprayed deposits. J. Therm. Spray Technol. 2002, 11, 365–374. [Google Scholar] [CrossRef]
- Ferguen, N.; Leclerc, W.; Lamini, E.-S. Numerical investigation of thermal stresses induced interface delamination in plasma-sprayed thermal barrier coatings. Surf. Coat. Technol. 2023, 461, 129449. [Google Scholar] [CrossRef]
- Davis, J.R. Handbook of Thermal Spray Technology, 1st ed.; ASM International: Novelty, OH, USA, 2004; ISBN 0-87170-795-0. [Google Scholar]
- Bach, F.; Laarmann, A.; Wenz, T. Modern Surface Technology, 1st ed.; Wiley-VCH Verlag GmbH & Co., KgaA: Weinheim, Germany, 2006; ISBN 978-3-52731-532-1. [Google Scholar]
- Abubakar, A.A.; Arif, A.F.M.; Al-Athel, K.S.; Akhtar, S.S.; Mostaghimi, J. Modeling Residual Stress Development in Thermal Spray Coatings: Current Status and Way Forward. J. Therm. Spray. Tech. 2017, 26, 1115–1145. [Google Scholar] [CrossRef]
- Gan, Z.; Ng, H.W.; Devasenapathi, A. Deposition-Induced Residual Stresses In Plasma-Sprayed Coatings. Surf. Coat. Technol. 2004, 187, 307–319. [Google Scholar] [CrossRef]
- Matejicek, J.; Sampath, S. Intrinsic residual stresses in single splats produced by thermal spray processes. Acta Mater. 2001, 49, 1993–1999. [Google Scholar] [CrossRef]
- Fauchais, P.; Vardelle, A.; Vardelle, M.; Fukumoto, M. Knowledge concerning splat formation: An invited review. J. Therm. Spray Technol. 2004, 13, 337–360. [Google Scholar] [CrossRef]
- Kuroda, S.; Clyne, T.W. The Quenching Stress In Thermally Sprayed Coatings. Thin Solid Film. 1991, 200, 49–66. [Google Scholar] [CrossRef]
- Clyne, T.W.; Gill, S.C. Residual Stresses in Thermal Spray Coatings and Their Effect on Interfacial Adhesion: A Review of Recent Work. JTST 1996, 5, 401–418. [Google Scholar] [CrossRef]
- Wenzelburger, M.; Riegert-Escribano, M.J.; Gadow, R. Methods of Residual Stress Analysis in Layer Composites and Their Application. Mech. Prop. Perform. Eng. Ceram. Compos. VI Ceram. Eng. Sci. Proc. 2009, 26, 371–379. [Google Scholar]
- Mehta, A.; Vasudev, H.; Thakur, L. Applications of numerical modelling techniques in thermal spray coatings: A comprehensive review. Int. J. Interact. Des. Manuf. 2024, 18, 3525–3545. [Google Scholar] [CrossRef]
- Elhoriny, M.; Wenzelburger, M.; Killinger, A.; Gadow, R. Finite Element Simulation of Residual Stress Development in Thermally Sprayed Coatings. J. Therm. Spray Technol. 2017, 26, 735–744. [Google Scholar] [CrossRef]
- Floristán, M.; Montesinos, J.A.; García-Marín, J.A.; Killinger, A.; Gadow, R. Robot Trajectory Planning For High Quality Thermal Spray Coating Processes On Complex Shaped Components. In Proceedings of the ITSC 2012, Houston, TX, USA, 21–24 May 2012; ASM International: Almere, The Netherlands, 2012; pp. 448–453. [Google Scholar] [CrossRef]
- Liu, J.; Bolot, R.; Costil, S. Residual Stresses and Final Deformation of an Alumina Coating: Modeling and Measurement. Surf. Coat. Technol. 2015, 268, 241–246. [Google Scholar] [CrossRef]
- Ng, H.W.; Gan, Z. A Finite Element Analysis Technique For Predicting as-Sprayed Residual Stresses Generated by the Plasma Spray Coating Process. Finite Elem. Anal. Des. 2005, 41, 1235–1254. [Google Scholar] [CrossRef]
- Wu, L.; Zhu, J.; Xie, H. Numerical and Experimental Investigation of Residual Stress in Thermal Barrier Coatings During APS Process. J. Therm. Spray Technol. 2014, 23, 653–665. [Google Scholar] [CrossRef]
- Cai, Z.; Jiang, J.; Wang, W.; Liu, Y.; Cao, Z. CMAS penetration-induced cracking behavior in the ceramic top coat of APS TBCs. Ceram. Int. 2019, 45, 14366–14375. [Google Scholar] [CrossRef]
- Abubakar, A.A.; Arif, A.F.M.; Akhtar, S.S.; Arif, A.F.M.; Mostaghimi, J. Splats Formation, Interaction and Residual Stress Evolution in Thermal Spray Coating Using a Hybrid Computational Model. J. Therm. Spray Technol. 2019, 28, 359–377. [Google Scholar] [CrossRef]
- Gadelmoula, A.; Al-Athel, K.S.; Akhtar, S.S.; Arif, A.F.M. A Stochastically Generated Geometrical Finite Element Model for Predicting the Residual Stresses of Thermally Sprayed Coatings Under Different Process Parameters. J. Therm. Spray Technol. 2020, 29, 1256–1267. [Google Scholar] [CrossRef]
- Gao, X.; Li, C.; Han, X.; Chen, X.; Zhao, X. Numerical simulation and parameter sensitivity analysis of multi-particle deposition behavior in HVAF spraying. Surf. Coat. Technol. 2022, 441, 128569. [Google Scholar] [CrossRef]
- Martínez-García, J.; Martínez-García, V.; Killinger, A. Modelling and Experimental Validation of the Flame Temperature Profile in Atmospheric Plasma Coating Processes on the Substrate. Coatings 2024, 14, 1248. [Google Scholar] [CrossRef]
- Martínez-García, J.; Martínez-García, V.; Killinger, A. Multi-Scale Thermo-Mechanical Model Simulation of Residual Stress in Atmospheric Plasma Spray Process. Coatings 2024, 14, 1547. [Google Scholar] [CrossRef]
- Rossini, N.S.; Dassisti, M.; Benyounis, K.Y.; Olabi, A.G. Methods of measuring residual stresses in components. Mater. Des. 2012, 35, 572–588. [Google Scholar] [CrossRef]
- Berreth, K.; Buchmann, M.; Gadow, R.; Tabellion, J. Evaluation of Residual Stresses in Thermal Sprayed Coatings. In Proceedings of the International Thermal Spray Conference, Düsseldorf, Germany, 17–19 March 1999. [Google Scholar] [CrossRef]
- Buchmann, M.; Gadow, R.; Tabellion, J. Experimental and Numerical Residual Stress Analysis of Layer Coated Composites. Mater. Sci. Eng. A 2000, 288, 154–159. [Google Scholar] [CrossRef]
- Gadow, R.; Riegert-Escribano, M.J.; Buchmann, M. Residual stress analysis in thermally sprayed layer composites, using the hole milling and drilling method. J. Therm. Spray Technol. 2005, 14, 100–108. [Google Scholar] [CrossRef]
- Grant, P.; Lord, J.; Whitehead, P.; Fry, A.T. The Application of Fine Increment Hole Drilling for Measuring Machining-Induced Residual Stresses. Appl. Mech. Mater. 2005, 3, 105–110. [Google Scholar] [CrossRef]
- Cormier, N.G.; Smallwood, B.S.; Sinclair, G.B.; Meda, G. Aggressive Submodelling of Stress Concentrations. Int. J. Numer. Methods Eng. 1999, 46, 889–909. [Google Scholar] [CrossRef]
- ASNYS. Advanced Analysis Guide—Chapter 9: Submodeling, Release 12.1; ASNYS Inc.: Canonsburg, PA, USA, 2009. [Google Scholar]
- Soundararajan, B.; Sofia, D.; Barletta, D.; Poletto, M. Review On Modeling Techniques For Powder Bed Fusion Processes Based On Physical Principles. Addit. Manuf. 2021, 47, 102336. [Google Scholar] [CrossRef]
- ANSYS. Advanced Analysis Technique Guide; ANSYS Inc.: Canonsburg, PA, USA, 2009. [Google Scholar]
- Mulero, M.A.; Zapata, J.; Vilar, R.; Martínez, V.; Gadow, R. Automated Image Inspection System To Quantify Thermal Spray Splat Morphology. Surf. Coat. Technol. 2015, 278, 1–11. [Google Scholar] [CrossRef]
- Wang, L.; Wang, Y.; Sun, X.G.; He, J.Q.; Pan, Z.Y.; Wang, C.H. Finite element simulation of residual stress of double-ceramic-layer La2Zr2O7/8YSZ thermal barrier coatings using birth and death element technique. Comput. Mater. Sci. 2012, 53, 117–127. [Google Scholar] [CrossRef]
- Kandil, F.A.; Lord, J.D.; Fry, A.T.; Grant, P.V. NPL Report MATC(A)O4: A Review of Residual Stress Measurement Methods-A Guide to Technique Selection; National Physical Laboratory: Teddington, UK, 2001. [Google Scholar]
- Guo, J.; Fu, H.; Pan, B.; Kang, R. Recent progress of residual stress measurement methods: A review. Chin. J. Aeronaut. 2021, 34, 54–78. [Google Scholar] [CrossRef]
- Sun, D.; You, E.; Zhang, T.; Xu, J.; Wang, X.; Ren, X.; Tao, W. A review of thermal contact conductance research of conforming contact surfaces. Part B Int. Commun. Heat Mass Transf. 2024, 159, 108065. [Google Scholar] [CrossRef]
- Ghara, T.; Paul, S.; Bandyopadhyay, P.P. Influence of Grit Blasting on Residual Stress Depth Profile and Dislocation Density in Different Metallic Substrates. Met. Mater. Trans. A 2021, 52, 65–81. [Google Scholar] [CrossRef]
- Ghelichi, R.; Bagherifard, S.; MacDonald, D.; Fernandez-Pariente, I.; Jodoin, B.; Guagliano, M. Experimental and numerical study of residual stress evolution in cold spray coating. Appl. Surf. Sci. 2014, 288, 26–33. [Google Scholar] [CrossRef]
- Mellali, M.; Grimaud, A.; Leger, A.C. Alumina grit blasting parameters for surface preparation in the plasma spraying operation. J. Therm. Spray Technol. 1997, 6, 217–227. [Google Scholar] [CrossRef]
Disclaimer/Publisher’s Note: The statements, opinions and data contained in all publications are solely those of the individual author(s) and contributor(s) and not of MDPI and/or the editor(s). MDPI and/or the editor(s) disclaim responsibility for any injury to people or property resulting from any ideas, methods, instructions or products referred to in the content. |
© 2025 by the authors. Licensee MDPI, Basel, Switzerland. This article is an open access article distributed under the terms and conditions of the Creative Commons Attribution (CC BY) license (https://creativecommons.org/licenses/by/4.0/).