Article

Comparing Operational Approaches (Spectrophotometric, Electroanalytic and Chromatographic) to Quantify the Concentration of Emerging Contaminants: The Limit of Detection, the Uncertainty of Measurement, Applicability and Open Problems

by
Marconi Sandro Franco de Oliveira
1,
Jorge Leandro Aquino de Queiroz
1,
Danyelle Medeiros de Araújo
1,
Mayra Kerolly Sales Monteiro
1,2,
Karen Giovanna Duarte Magalhaes
1,
Carlos Alberto Martínez-Huitle
1,* and
Elisama Vieira dos Santos
1,*
1
Renewable Energies and Environmental Sustainability Research Group, Institute of Chemistry, Federal University of Rio Grande do Norte, Campus Universitário, Av. Salgado Filho 3000, Lagoa Nova, Natal CEP 59078-970, RN, Brazil
2
Human Resources Program of the National Agency for Petroleum, Natural Gas and Biofuels—PRH-37-ANP Lagoa Nova, Natal CEP 59078-970, RN, Brazil
*
Authors to whom correspondence should be addressed.
Coatings 2025, 15(6), 719; https://doi.org/10.3390/coatings15060719 (registering DOI)
Submission received: 10 April 2025 / Revised: 30 May 2025 / Accepted: 6 June 2025 / Published: 14 June 2025
(This article belongs to the Special Issue Functional Coatings in Electrochemistry and Electrocatalysis)

Abstract

:
In this study, a boron-doped diamond (BDD) sensor was used to study the electroanalytical behavior of emerging contaminants (ECs), such as caffeine, paracetamol and methyl orange. BDD shows strong resolving power for the superimposed voltammetric response of ECs in well-resolved peaks with increased peak current. Differential pulse voltammetry, which is an electroanalytical technique, was compared with two reference techniques including absorption spectrophotometry in the UV-vis region and high-performance liquid chromatography (HPLC) in the detection and quantification of ECs. The results obtained were satisfactory, as the complete removal of ECs was achieved in all applied processes. The detection limits were 0.69 mg L−1, 0.84 mg L−1 and 0.46 mg L−1 for CAF, PAR and MO, respectively. The comparison of electroanalysis results with those obtained by UV-vis and HPLC established and confirmed the potential applicability of the technique for determining CAF, PAR and MO analytes in synthetic effluents and environmental water samples (tap water, groundwater and lagoon water). The electrochemical approach can therefore be highlighted for its low consumption of reagents, ease of operation, time of analysis and excellent precision and accuracy, because these are characteristics that enable the use of this technique as another means of determining analytes in effluents.

Graphical Abstract

1. Introduction

Industrial and anthropic practices have caused the dissemination of emerging contaminants (ECs) in the environmental matrix, even in trace amounts, which constitute a serious threat to human health and environmental ecology and, therefore, have attracted the attention of different scientific communities [1]. A wide range of substances are considered ECs, for example, drugs, hormones, alkylphenols and their derivatives, illicit drugs, sucralose, pesticides, azo-dyes, microplastics and so on [2,3,4].
Over thousands of years, new pollutants and difficulties with soil, air and water pollution have existed without our understanding. As environmental chemistry and engineering, health and toxicology advance, it might be anticipated that we will be able to avoid harmful impacts on our environment and health more effectively and that fewer instances will arise where we wait until the harm is severe before enforcing regulations, attempting to prevent environmental problems or applying treatment technologies.
Concerning the detection and quantification of ECs, several analytical methods have been used for assessing their environmental impact, environmental management, environmental issues and monitoring as well as to establish environmental limit legislations for these compounds. Gas chromatography, spectrophotometry, high-performance liquid chromatography (HPLC), chemiluminescence, polarography and capillary zone electrophoresis as well as potentiometric and electrochemical methods [5,6,7,8,9,10] have been widely employed for detecting and quantifying ECs, thanks to their reliability and confidence.
In the case of pollution, preservation and recovery of water systems, a chemical substance, chemical element, or mixture can have its physical or chemical properties determined using a specific analytical approach, utilizing a highly specialized apparatus. However, the matrix and interferences can significantly impact both the quality of the results and how the analysis is carried out.
Water and sanitation for all people need to be made available and managed sustainably, according to Sustainable Development Goal 6 (SDG 6). For the sake of both human and environmental health, water and sanitation are essential. SDG 6 covers both the quality and sustainability of water resources globally as well as concerns related to drinking water, sanitation and hygiene. For development in other areas like nutrition, education, health and gender equality to advance, improvements in drinking water, sanitation and hygiene are needed. Therefore, it will be challenging in the coming years to better understand pollutants of rising concern to effectively manage risks to human health and the environment, their concentrations in the environment and their harmful effects on species as well as their treatment strategies. In fact, these contaminants are not susceptible to conventional water and effluent treatment processes [11], making their existence in water a subject of special concern.
Wastewater treatments are used to remove contaminants from effluents and water, which are converted into a water matrix that can be returned to the water cycle. However, when the goal is to assess the treatment efficiency of a given technology, research using ultrapure/demineralized water with a single target pollutant and/or a concentration several orders of magnitude higher than in the real environment masks the applicability of the experimental data to real applications. Therefore, it is recommended to complement the work with experimental data using real matrices and environmentally relevant contaminant concentrations.
1,3,7-trimethylxanthine, or CAF, is one of the many ECs belonging to the pharmaceutical class and is a very common food compound that is partially biodegradable, and due to our poor sewage infrastructure and low treatment capacity, it has been detected in underground and surface water bodies [2,12,13]. Due to the widespread consumption of caffeinated beverages like coffee, tea, soft drinks and energy drinks, caffeine is the most widely used psychoactive substance in the world, and its quantification is primarily of pharmaceutical and dietary concern [14,15]. Another emerging pharmaceutical contaminant is PAR (N-acetyl-p-aminophenol), one of the most abundant drugs found in effluent treatment plants (ETEs) [16] because 1 kg of the drug discarded via sewage can contaminate up to 450 thousand liters of water. Furthermore, industrial effluents containing considerable amounts of synthetic organic dyes, such as MO [17], cause pollution and are associated with serious health risk factors, which is why the identification and decontamination of effluents with dyes have received increasing attention in recent times [18].
In addition, traditional effluent treatment processes are ineffective in the degradation of micropollutants [19,20]. Therefore, there is a need to develop new methods and technologies that can both effectively remove micropollutants and meet conventional treatment metrics with minimal capital and operating costs [21,22,23,24]. Electrochemically advanced oxidation technologies have come to the fore in recent years due to their potential to mitigate or eliminate numerous forms of water pollution. Furthermore, the shift toward renewable technologies as the primary electrical energy source in place of the traditional electrical supply has increased the versatility of these methods across a variety of water-security domains.
The use of UV-vis spectrophotometric methods to quantify a target organic molecule and obtain its kinetic profile should be analyzed carefully, especially when dealing with real matrices and/or advanced oxidation/reduction technologies. It is possible to have spectral interferences by transformation intermediates and matrix components, which may absorb radiation at the wavelength of the target organic pollutant’s absorption maximum. Thus, it is recommended to use chromatographic methods for the quantification of target organic molecules. However, the instruments involved are often expensive to run and maintain, and the pretreatment process for samples is often time-consuming and complicated [25,26].
In recent years, a demand has grown for analytical strategies capable of not only providing accurate quantification but also the real-time monitoring of EC concentrations during treatment processes. Traditional water systems, although providing satisfactory treatment performance in certain instances, may employ potentially harmful chemicals, sustain substantial energy expenses, or need significant operating efforts. Recent advancements in water and wastewater treatment technology have demonstrated significant progress in environmental cleanup, monitoring and a reduction in ECs, with cost-effectiveness relative to previous methods. Electrochemical oxidation (EO) emerges as an electrocatalytic approach for efficient water treatment due to its technological simplicity [27], sustainability and control conditions [28], particularly when boron-doped diamond (BDD) anodes are used [29,30,31]. Despite this, monitoring the progression of contaminant degradation remains challenging when using conventional methods like UV-vis or HPLC, which can be affected by matrix interferences or require time-consuming sample preparation.
Therefore, in the present work, attention has been focused on (i) verifying the applicability of an electroanalytical technique (differential pulse voltammetry), carried out using a BDD electrode for monitoring CAF, PAR and MO concentrations, (ii) applying these techniques to quantify CAF, PAR and MO in complex matrices, such as water samples from an electrochemical wastewater treatment reactor, a local water supply system (tap water), a well and a lagoon, (iii) identifying the influence of the applied method on the electrochemical elimination of CAF, PAR and MO, and (iv) comparing all instrumental methods according to their limit of detection, uncertainty of measurement and difficulties to compare their confidence, accuracy and practical applicability.

2. Materials and Methods

The chemicals were of the highest quality commercially available and were used without further modifications. Caffeine—C8H10N4O2 (CAS: [58-08-2] Synth, São Paulo, Brazil); paracetamol—C8H9NO2 (CAS: [103-90-2] Synth, São Paulo, Brazil); methyl orange (MO)—C14H15N3O3S.NA (CAS: [547-58-0] Synth, São Paulo, Brazil); Sulfuric Acid—H2SO4 (CAS: [7664-93-9] Synth, São Paulo, Brazil); Sodium Sulfate—Na2SO4 (CAS: [7757-82-6]). All solutions were prepared using ultrapure water (resistivity 18.2 MΩ cm, 25 °C) from a Millipore Milli-Q direct-0.3 purification system (Berlin, Germany). Three stock solutions of CAF (100 mg L−1), PAR (100 mg L−1) and MO (50 mg L−1) were prepared in an acidic and neutral medium of about 0.5 mol L−1 H2SO4 and 0.5 Na2SO4 mol L−1, and these were used as the standard solutions for all determinations. In the EO experiments were also used, as model EC waste, CAF (20 mg L−1), PAR (20 mg L−1) and MO (10 mg L−1).

2.1. Analytical Methods

During the EO tests, the EC concentration was determined through measurements with UV–visible spectroscopy (UV-Vis), HPLC and Differential pulse voltammetry (DPV). The electrochemical analyses were carried out using an Autolab model PGSTAT302N Metrohm with Nova 1.8 and GPES 4.0 software, and data were treated by Graph prism 7. Experiments were carried out in a conventional three-electrode system, and measurements were performed between 0 V and +2.0 V, in 0.5 mol L−1 H2SO4 at 25 °C. A BDD sensor, with a geometric area of 1.00 cm2, was used as the working electrode, while a Ag/AgCl (KCl 3 mol L−1) wire and platinum wire were employed as the reference and auxiliary electrodes, respectively. The other details of the procedure were as follows: potential scan rate of 50 mV s−1; equilibration time: 10 s; modulation time: 0.04 s; step potential: 0.005 V; modulation amplitude: 0.05 V; and standby potential: 0.05 V. All electrochemical studies were conducted at 25 ± 2 °C and without deaeration. The EC (CAF, PAR and MO) concentration was also determined by UV–visible spectroscopy (UV-Vis), using a UV-1800 Shimadzu model, Germany; for these measurements, a calibration method was employed. The characteristic wavelengths at which CAF, PAR and MO absorb were 268, 244 and 464 nm, respectively. HPLC was also investigated, using a model Ultimate 3000, DIONEX, Thermo Fisher Scientific, Inc., São Paulo, Brazil operating with Chomeleon software, version 6.8, equipped with an Acclaim PolarAdvantage II column C18 (3 μm, 120 Å, 2 × 100 mm), Thermo Scientific, Inc., São Paulo, Brazil. The mobile phase consisted of phase A (water) and phase B (acetonitrile) with the following elution mode conditions—gradient: 10% phase B for 0 min and 50% phase B for 8 min, followed by 10% phase B for 8.5 min. The flow rate was set at 350 μL min−1 and wavelength detection at 273 and 244 nm, respectively. For methyl orange, the Ultimate 3000 model, DIONEX, was prepared with an Acclaim Mixed-mod WCX-1 column (5 um, 120 Å, 4.6 × 250 mm). The mobile phase consisted of a phosphate buffer (25 mM KH2PO4, pH 2.5 adjusted with H3PO4) in phase A and acetonitrile for B—50% of each—with isocratic elution mode. The flow rate was 1 mL min−1, and wavelength detection was at 265 and 471 nm. Each measurement was performed in triplicate, and the data obtained were subjected to statistical analysis and are reported as the mean ± standard deviation (SD). For the determination of ECs (CAF, PAC and MO), a well-known quantity/volume of standard solution of ECs was subsequently added (standard addition method) three times to the real sample. All the results of the experiments were processed with GraphPad Prism v.7, and the calibrations were analyzed by ordinary linear least-square regression; the relevant results (slopes and intercept) are reported with their confidence intervals (P = 95%), as recommended by experts in the field.

2.2. Electro-Oxidation of ECs

All electrolysis experiments were conducted in an undivided reactor of 500 mL capacity equipped with magnetic stirring to ensure homogenization and mass transport toward electrodes. The two electrodes were placed at the center of the reactor parallel to each other at an electrode distance of 1 cm. Experiments were conducted under galvanostatic conditions with the current supply by using a power supply (Minipa, model MLP-3305, Minipa do Brasil Ltd.a, São Paulo, Brazil). The geometrical area of the anode material was about 18.06 cm2 for the BDD, while the Ti cathode had a similar area. All electrolysis procedures were conducted in triplicate. The efficiency of EO for the degradation of ECs (CAF (20 mg L−1), PAR (20 mg L−1) and MO (10 mg L−1)) in 0.05 mol L−1 Na2SO4 was tested under galvanostatic conditions by applying different values of current density (j = 15, 30 and 45 mA cm−2). Similar experiments were conducted by using a real water matrix to understand the effect of the matrix and to determine the confidence and accuracy of each one of the instrumental strategies used.

2.3. Environmental Water Samples

Tap water was collected at the Federal University of Rio Grande do Norte (Natal, Brazil); groundwater was collected from a 48 m deep well (Natal, Brazil); and lagoon water was obtained from Extremoz Lagoon (Natal, Brazil). All samples were filtered through a qualitative filter paper (11 μm pore size, Whatman®) and stored in a refrigerator until analysis. Proper amounts of H2SO4 and Na2SO4, resulting in a concentration of 0.5 mol L−1 each, were added to the water samples before analysis.

3. Results

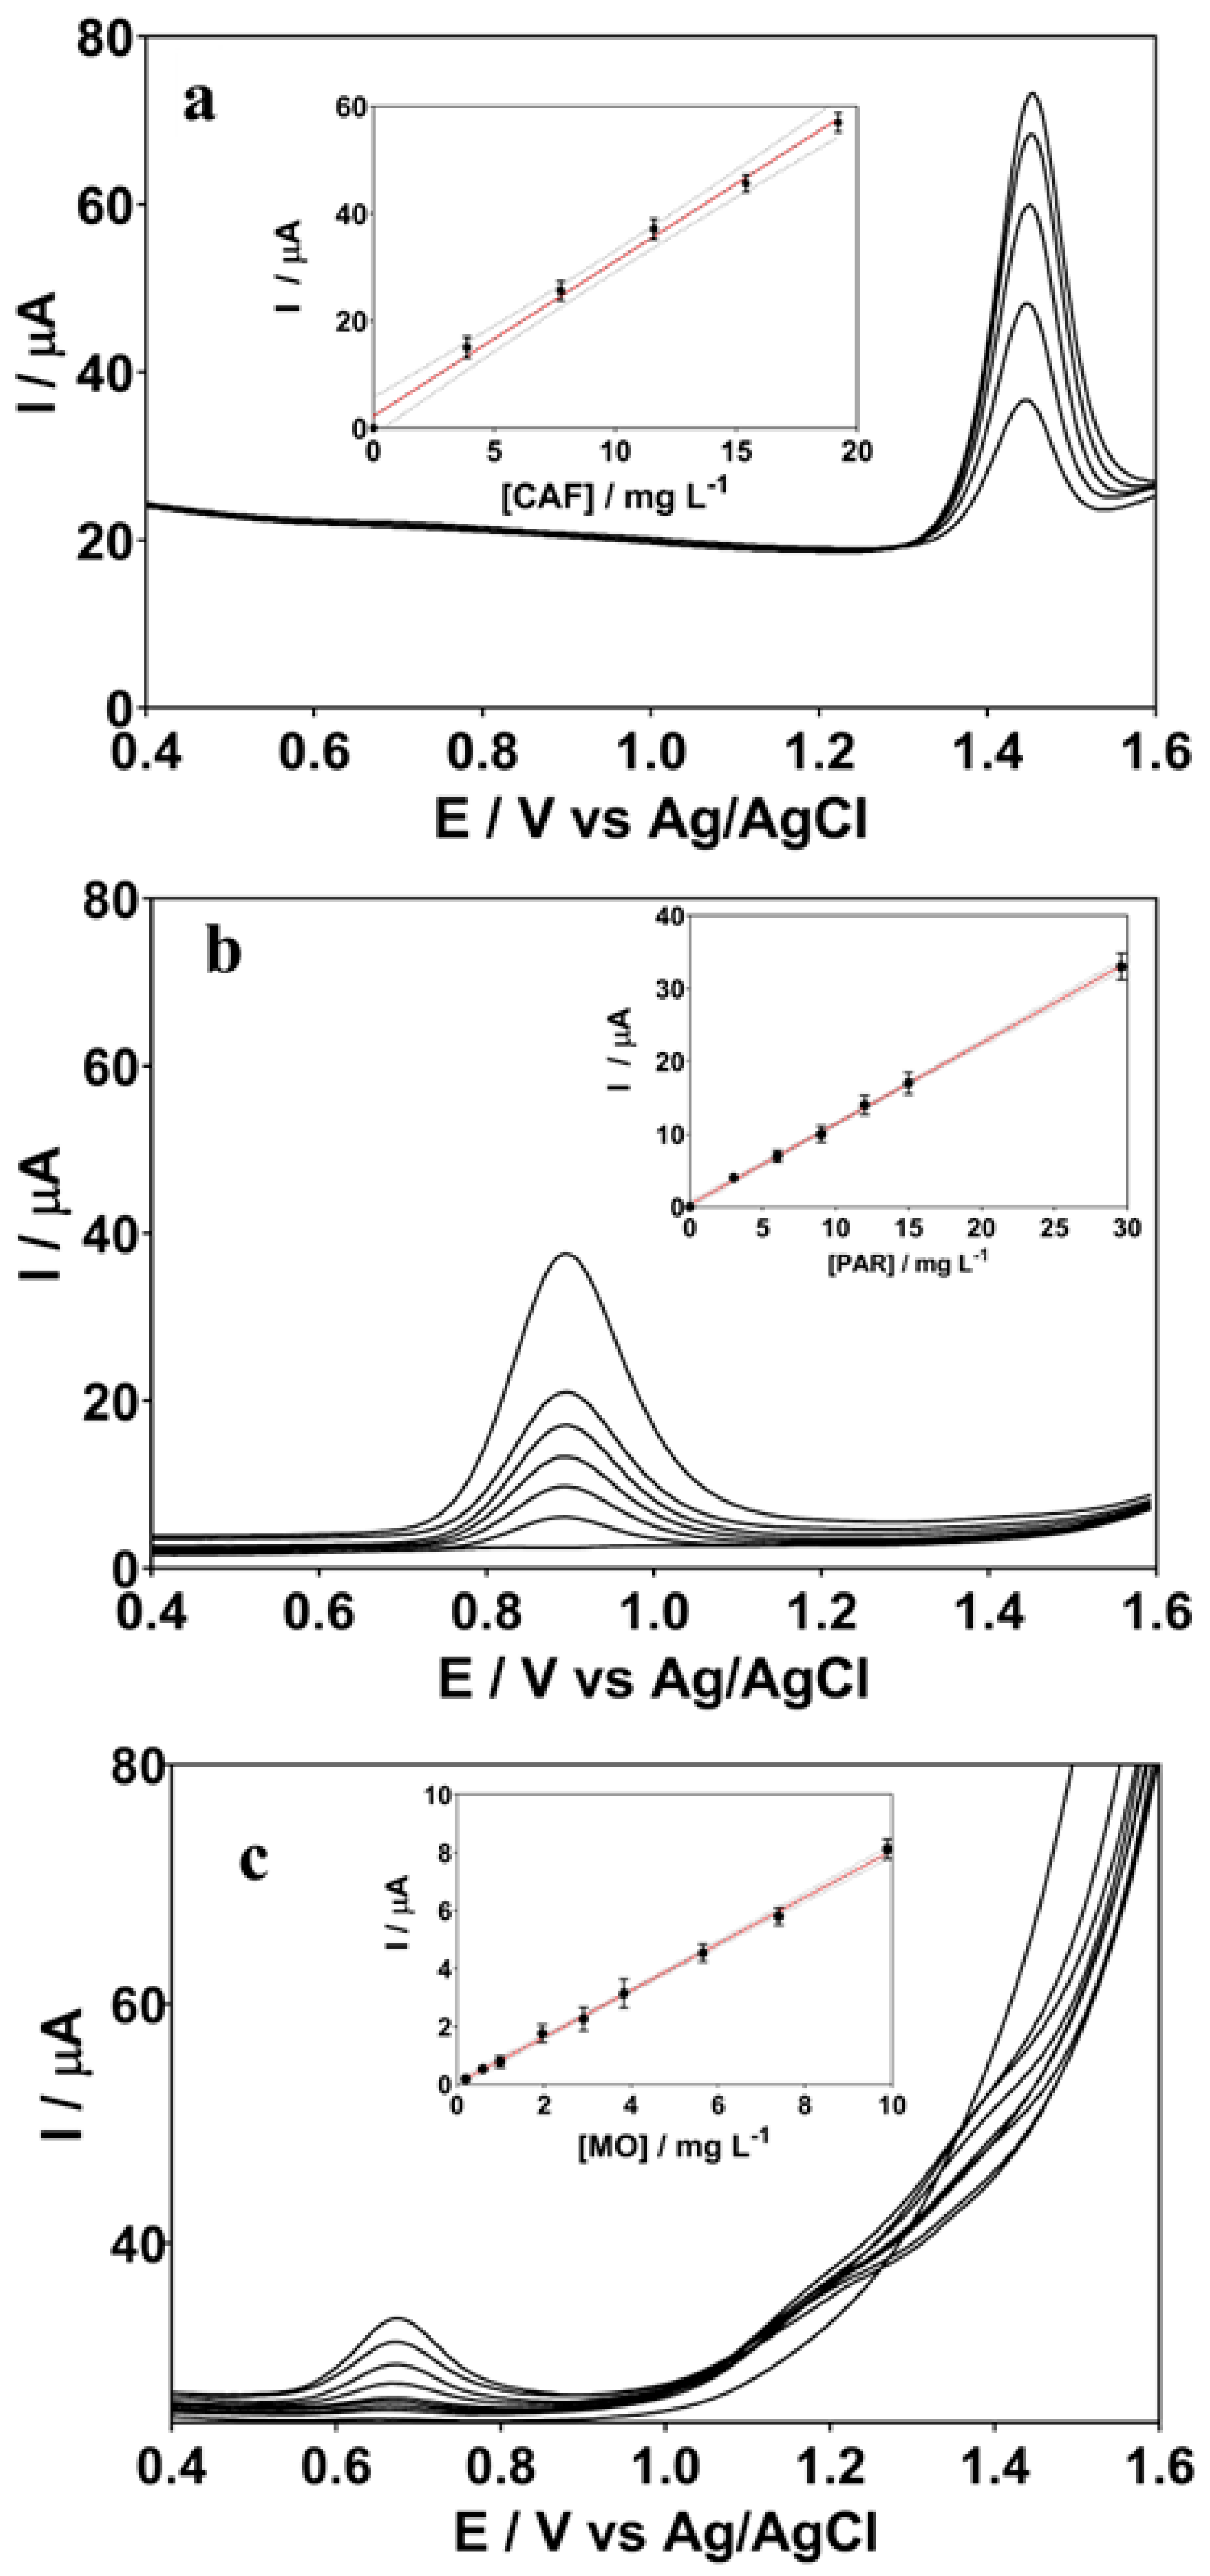
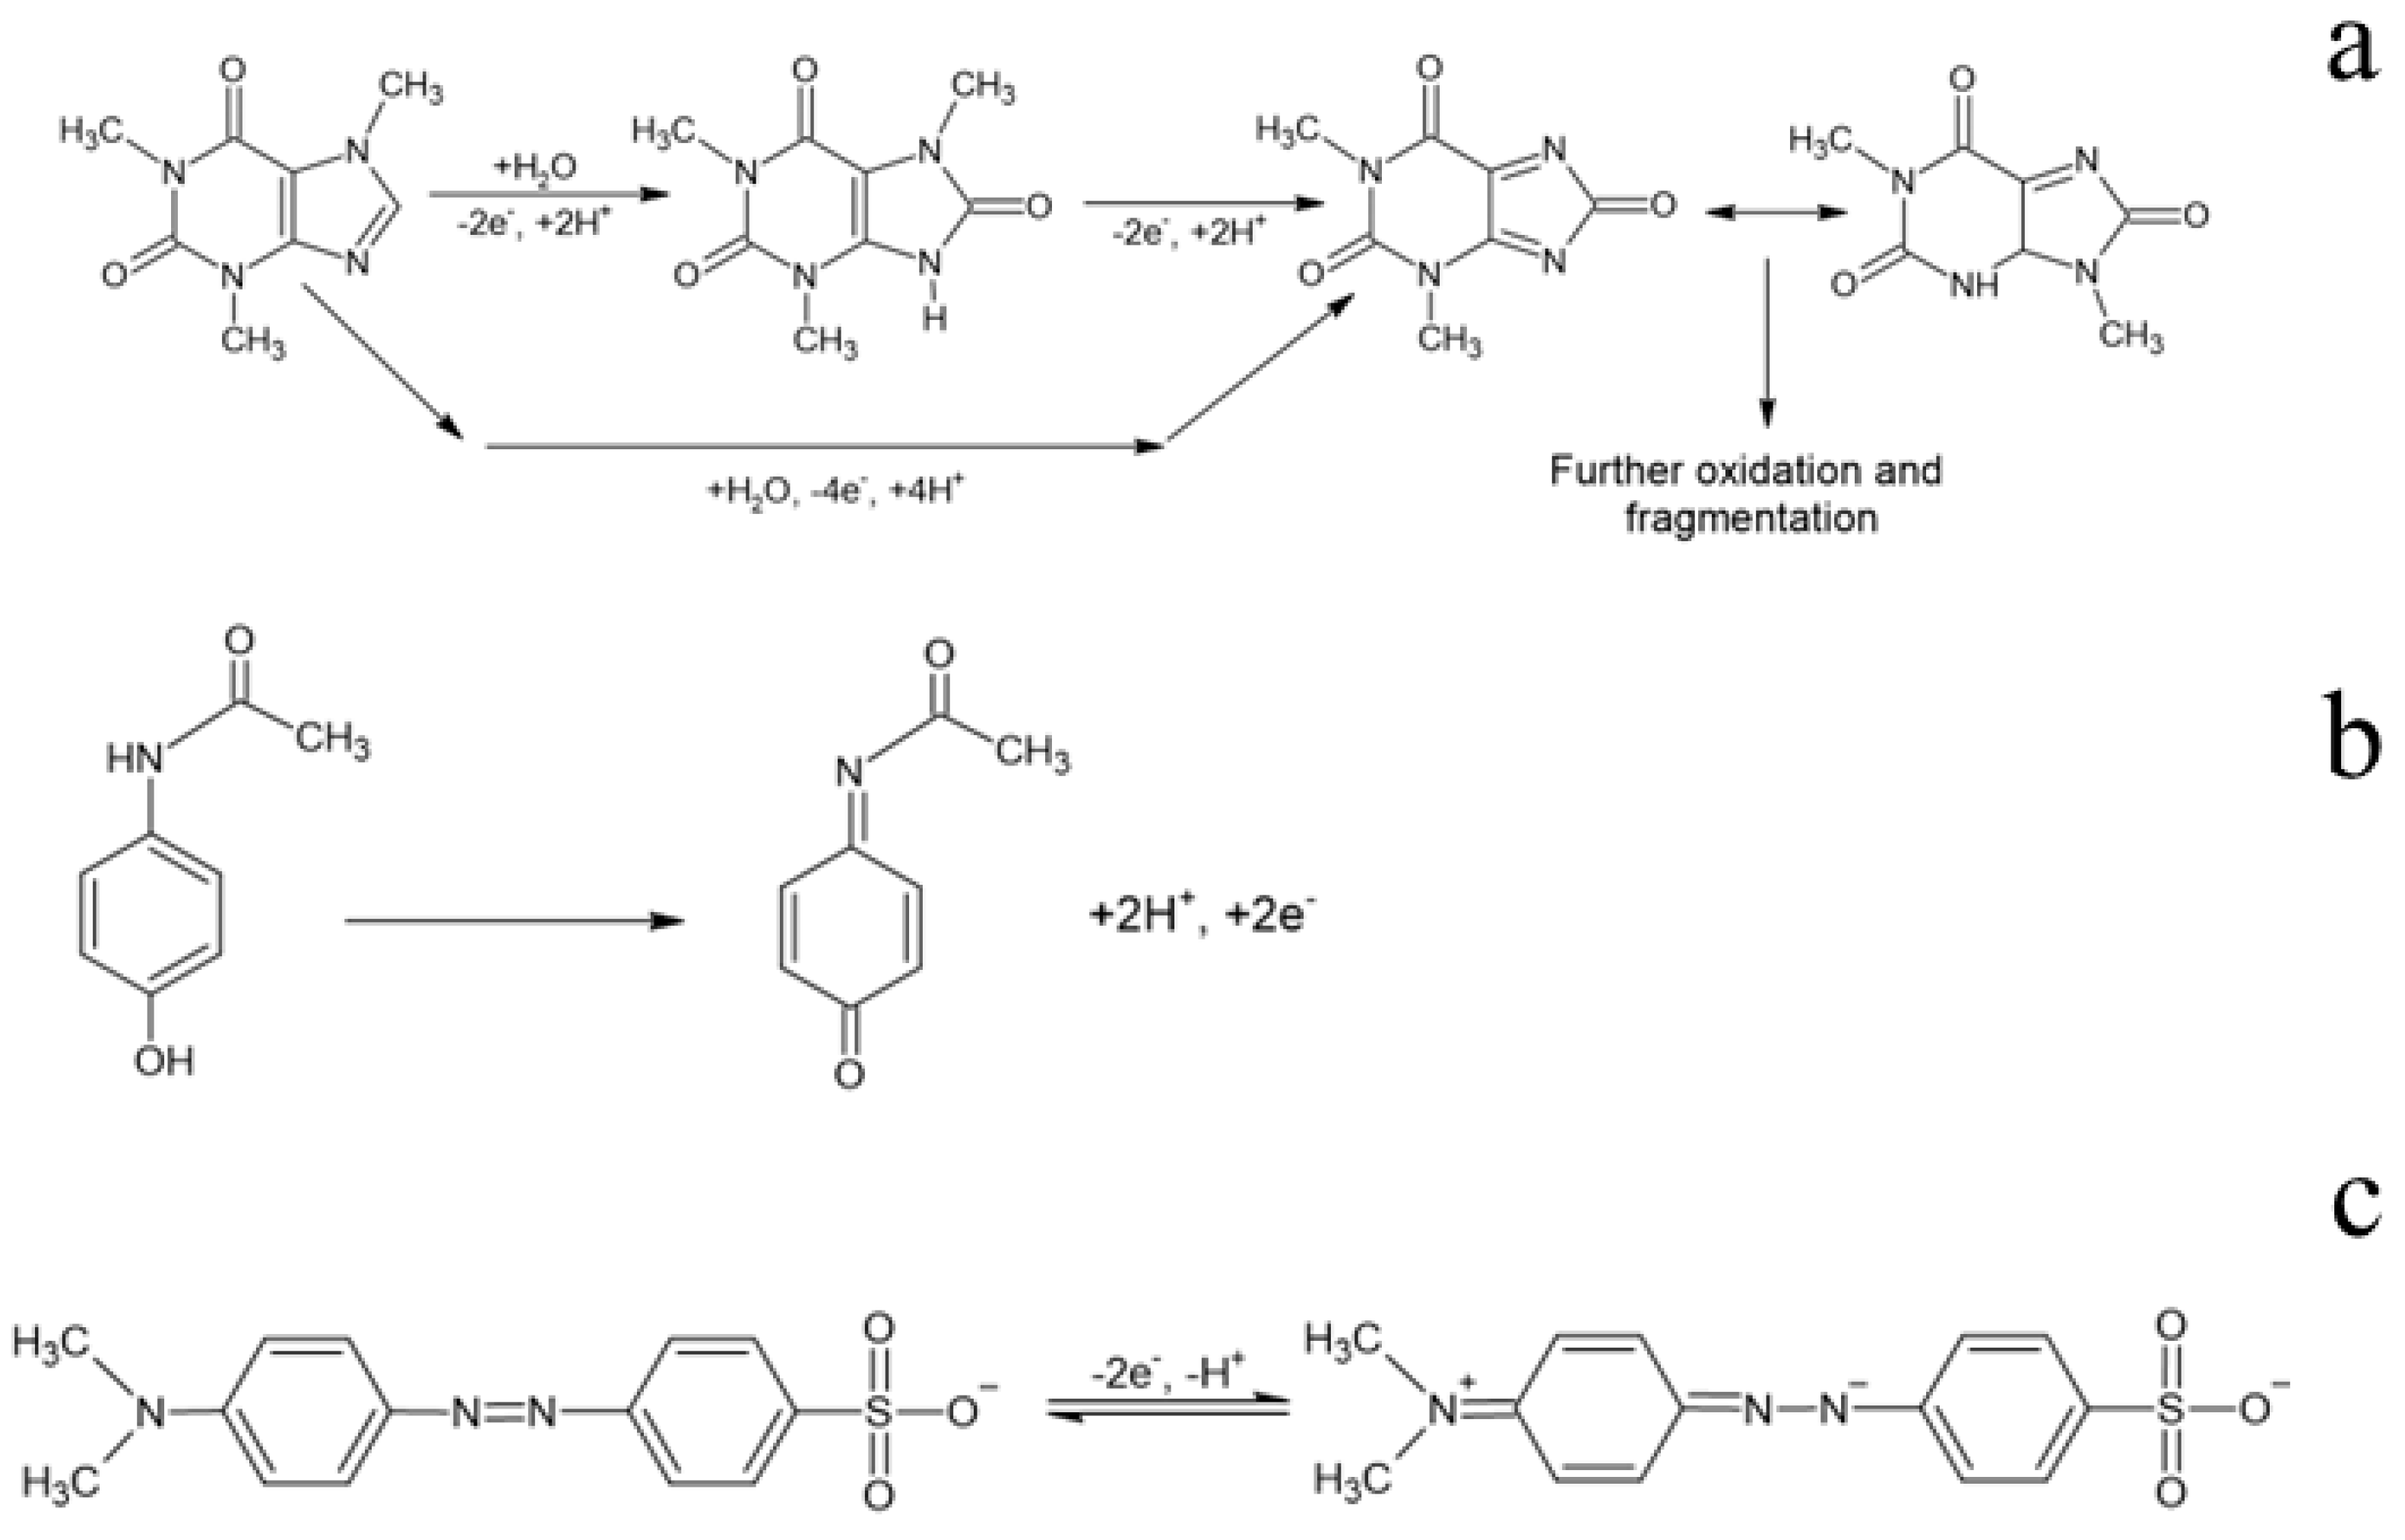
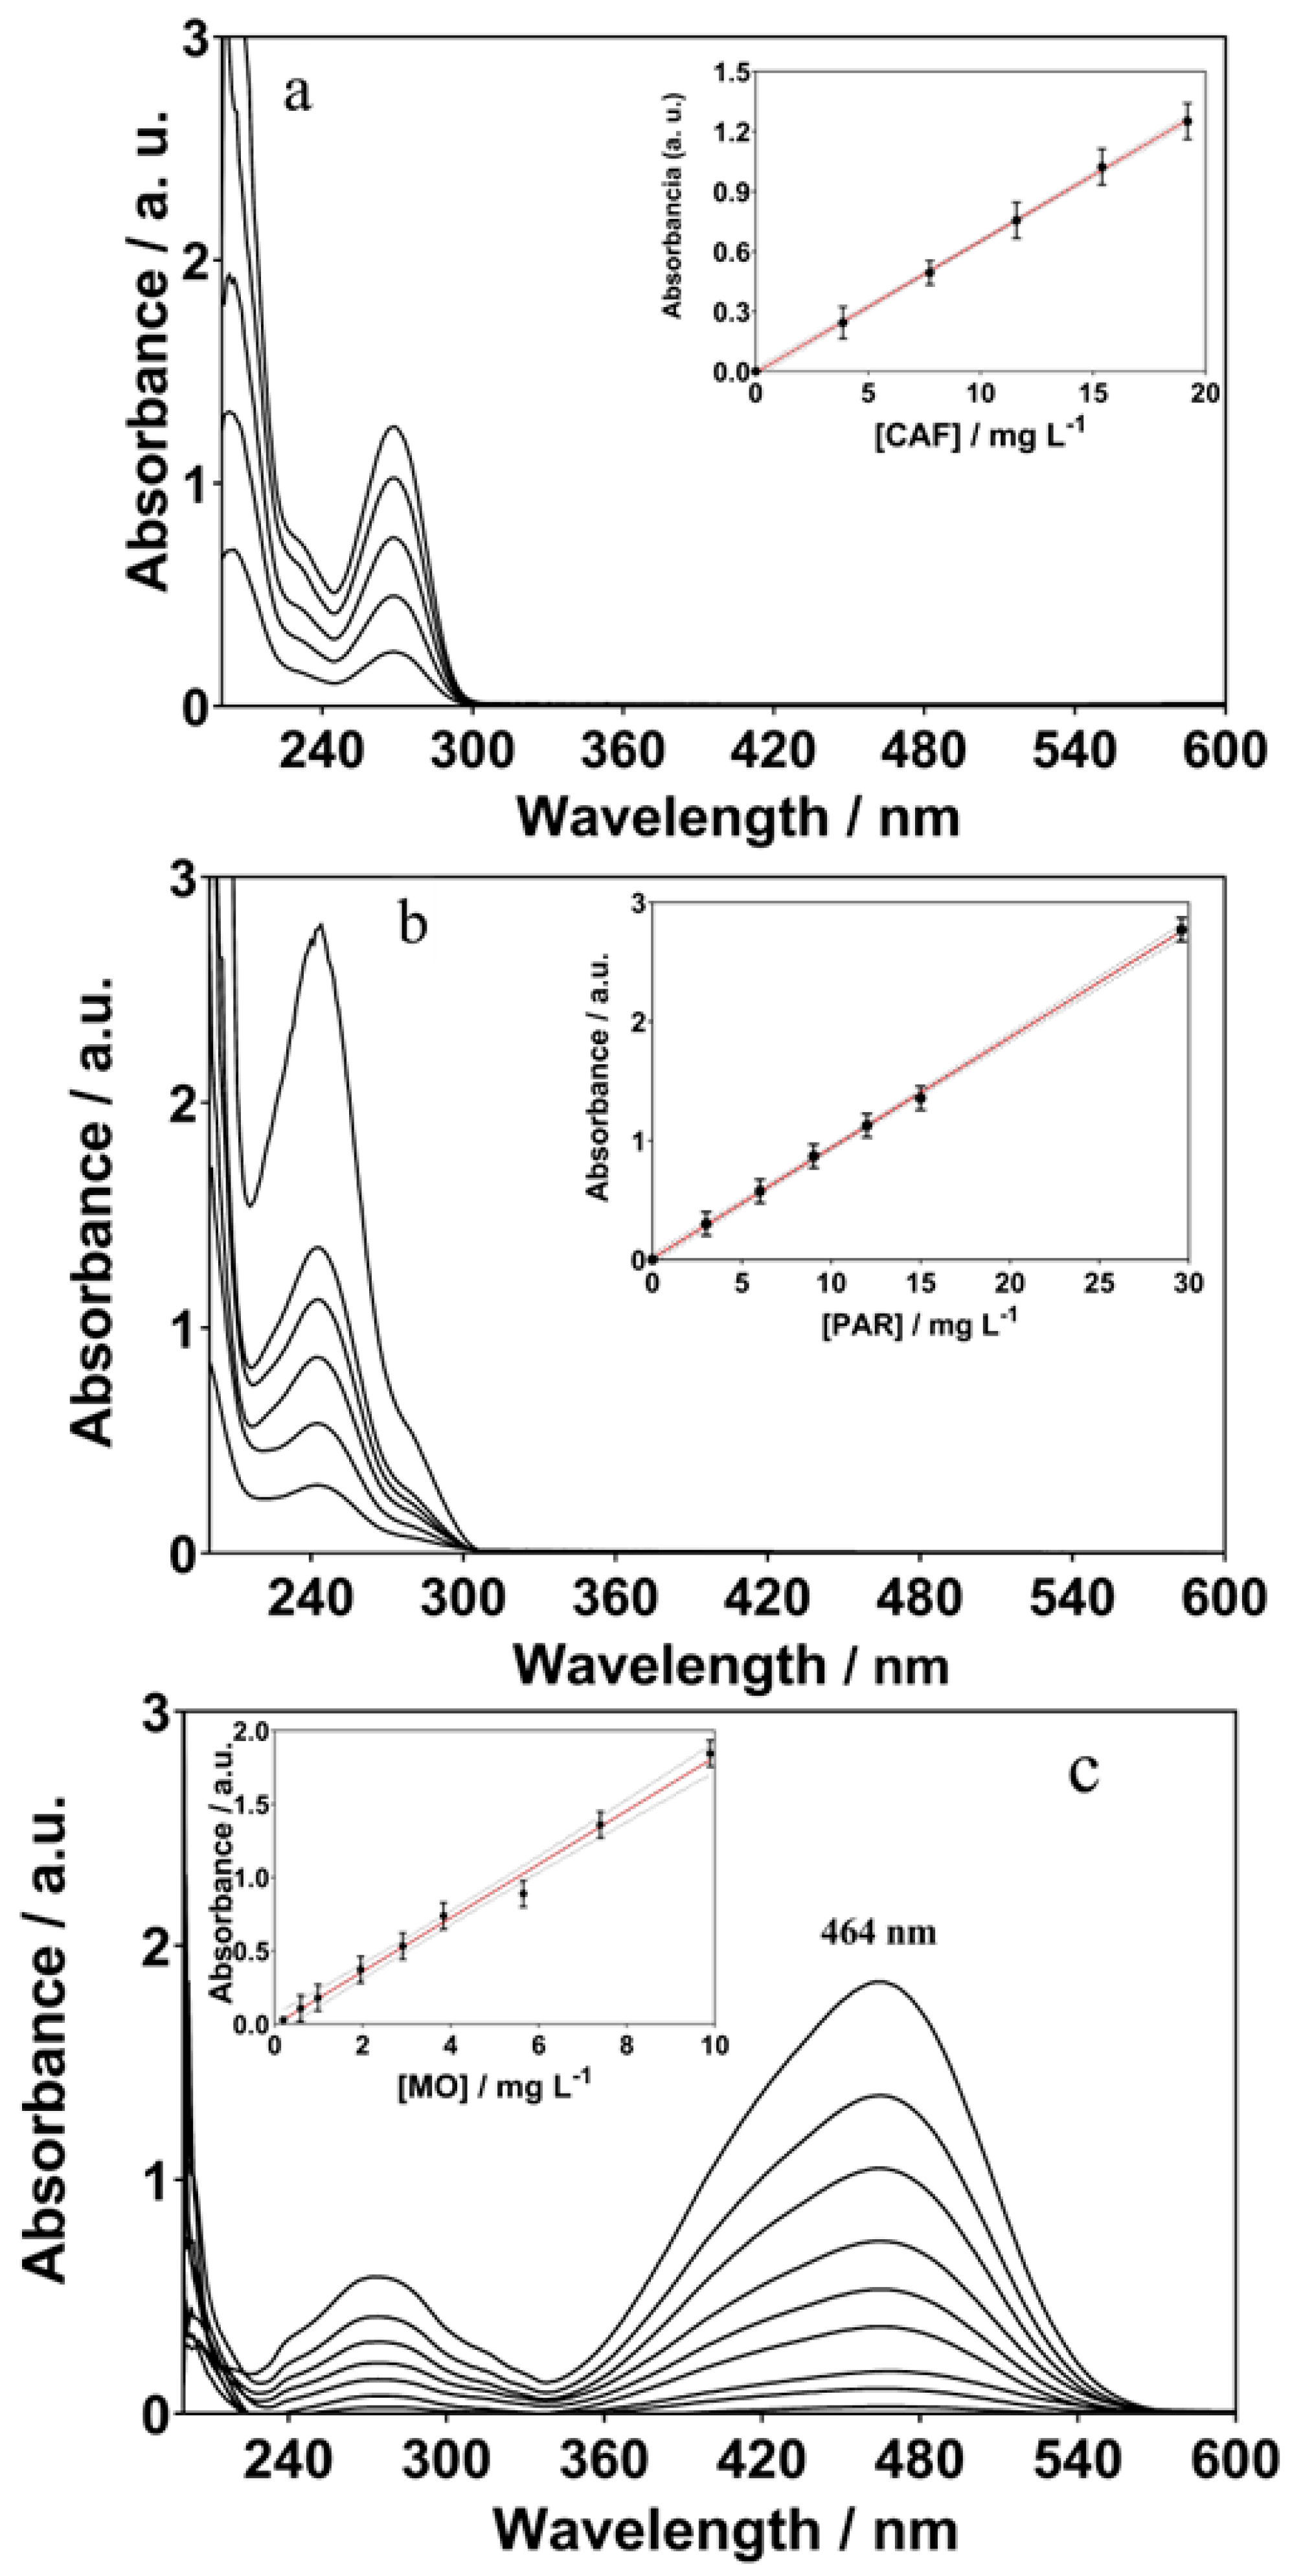
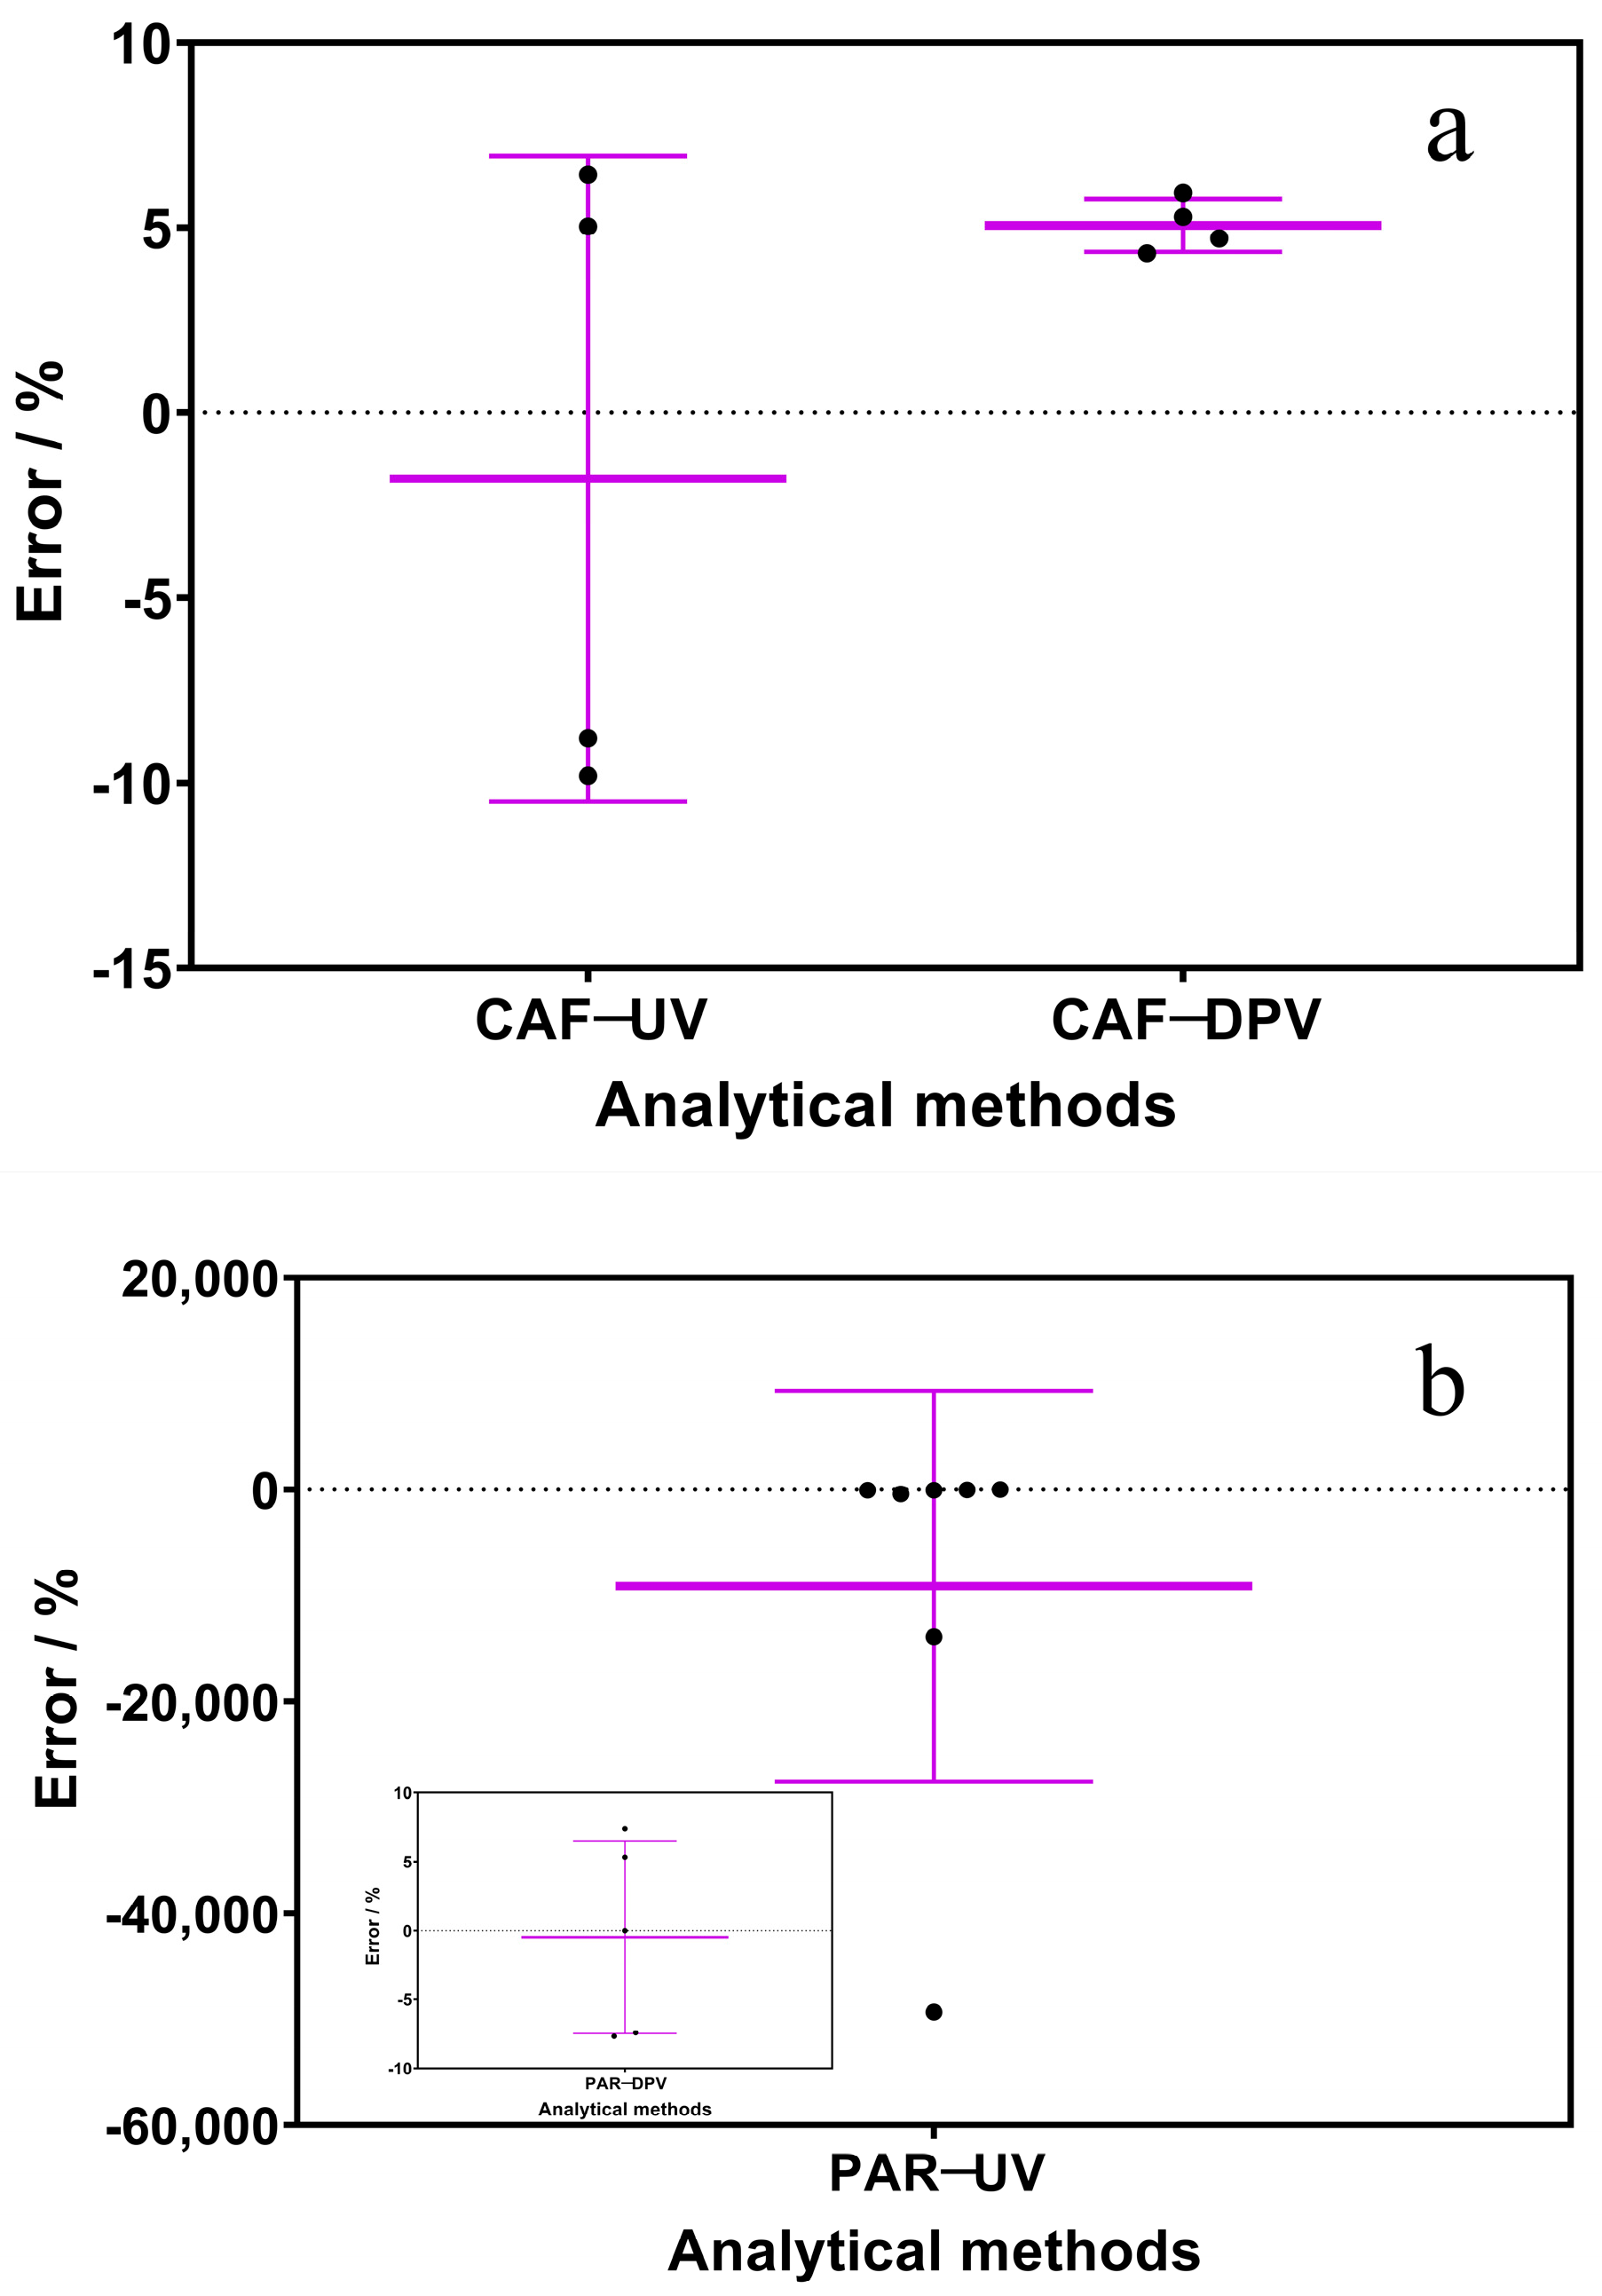
3.1. Electroanalysis of ECs by BDD Sensor and Comparison with Conventional Methods

DPV responses were analyzed for the determination of ECs (CAF, PAR and MO) using the BDD sensor in a 0.5 mol L−1 H2SO4 solution, in the absence and presence of the EC. Figure 1a–c show the DPV measurements of CAF, PAR and MO in 0.5 mol L−1 H2SO4 with high analytical signal intensity and adequate peak definition. Different CAF (0.25–20 mg L−1) concentrations were used to obtain the analytical curve, as shown in Figure 1a. Through DPV, anodic peaks of around +1.45 V, +0.9 V and +0.7 V were observed for CAR, PAR and MO, respectively, as shown in Figure 1a–c. The DPV signals obtained with the corresponding concentrations present profiles similar to those reported in the existing literature [32].
For CAF, an overall 4e, 4H+ oxidation mechanism is observed. First, the C-8 to N-9 bonds undergo a 2e, 2H+ oxidation to produce the substituted uric acid. This is followed immediately by a 2e, 2H+ oxidation to produce the 4,5-diol analog of uric acid that quickly fragments (Figure 2a) [33]. PAR oxidation is an overall 2e, 2H+ process, resulting in N-acetyl-p-quinone imine (Figure 2b) [34]. Finally, MO oxidation seems to proceed through a 2e, one- H+ process, involving the breaking of a N=N azo bond (Figure 2c) [35].
As can be observed, the current peak had a good linear relationship with the CAF (3.88–19.20 mg L−1), PAR (3.02–29.6 mg L−1) and MO (0.199–9.89 mg L−1) concentration by using the BDD sensor. Several analytical curves were achieved using the BDD sensor, evaluating the peak intensity as a function of the CAF, PAR and MO concentration and considering at least nine analyte concentrations. To obtain a liner relationship between the peak current and the analyte concentration for each EC compound (CAF, PAR and MO), different analyte concentrations of CAF (3.88–19.20 mg L−1) in H2SO4 mol L−1, PAR (3.02–29.6 mg L−1) in H2SO4 mol L−1 and MO (0.199–9.89 mg L−1) in Na2SO4 mol L−1 were evaluated (Figure 1a–c). The analytical curves for CAF, PAR and MO obtained for the BDD electrochemical sensor are represented by the following equations and concentration ranges:
CAF: I/µA = (2.88 ± 0.05) [CAF mg L−1] + (2.20 ± 0.09), α = 0.05, n = 6, R2 = 0.995
PAR: I/µA = (1.09 ± 0.10) [PAR mg L−1] + (4.96 ± 0.12), α = 0.05, n = 5, r2 = 0.992
MO: I/µA = (8.04 ± 0.13) [MO mg L−1] + (2.65 ± 0.20), α = 0.05, n = 5, r2 = 0.994
The residuals of the regression curve are also included in the insets of Figure 1a–c, in order to verify visually the absence of significant non-linearity, as recommended by IUPAC [36,37]. The LOD and LQ were estimated using the standard deviation in the regression method: LOD = 3 × S y / x / b and LQ = 10 × S y / x / b , where S y / x is the residual standard deviation and b is the slope of the calibration plot. Based on the standard deviation of the regression, LODs of approximately 0.69 mg L−1, 0.84 mg L−1 and 0.46 mg L−1 were estimated for CAF, PAR and MO, respectively. At the same time, limits of quantification of approximately 1.69, 1.31 mg L−1 and 1.26 mg L−1 were estimated for CAF, PAR and MO, respectively.
The spectrophotometric responses of absorption in the UV-vis region were acquired in the support electrolyte at 0.5 mol L−1 H2SO4 for both CAF and PAR, while for the determination of MO, the support electrolyte was at 0.5 mol L−1 Na2SO4. The spectrophotometric responses for the determination of ECs (CAF, PAR and MO) in the absence and presence of the ECs are shown in Figure 3a–c. Spectra with high analytical signal intensity and adequate peak definition were obtained (Figure 3), which showed an increase in intensity as a function of the EC (CAF, PAR and MO) content in solution. Figure 2 shows that CAF, PAR and MO were identified at the maximum wavelengths (λ) of 268 nm, 244 nm and 464 nm, respectively. The calibration curves for CAF, PAR and MO are shown in Figure 3a–c, yielding the following equations:
CAF: Abs268nm= (0.066 ± 0.010) [CAF mg L−1] − (0.0067 ± 0.002), α = 0.05, n = 5, R2 = 0.994
PAR: Abs244nm = (0.092 ± 0.012) [PAR mg L−1] − (0.015 ± 0.002), α = 0.05, n = 6, r2 = 0.992
MO: Abs464nm = (0.182 ± 0.09) [MO mg L−1] − (0.0063 ± 0.0012), α = 0.05, n = 9, r2 = 0.991
The UV-Vis absorption spectrum shows a profile for each one of the ECs that is the same as that reported in the literature [38,39,40]. LODs of approximately 3.68 mg L−1, 9.82 mg L−1 and 1.39 mg L−1 were estimated for CAF, PAR and MO, respectively. LQs of approximately 4.39 mg L−1, 11.38 mg L−1 and 4.02 mg L−1 were estimated, respectively, for CAF, PAR and MO.
The key aim of the present work was to develop an electrochemical method to detect model ECs (CAF, PAR and MO) and compare it to the classical techniques of spectrophotometry and HPLC. To validate the obtained figures, HPLC determinations were performed in a standard EC solution, using the standardized method for determining CAF, PAR and MO, as reported in Table 1. First, analytical curves were obtained under conditions similar to those used for DPV techniques and absorption spectrophotometry in the UV-vis region, in terms of standard concentrations. The curve for each one of the ECs (CAF, PAR and MO) in HPLC was obtained and evaluating the peak area as a function of the analyte concentration (a similar concentration range to that used in the electrochemical and spectroscopic approaches was proposed to compare the three methods). The calibration curves for CAF, PAR and MO are described in Table 1.
CAFArea = (1.331 ± 0.20) × [CAF mg L−1] − (1.020 ± 0.30) α = 0.05, n = 6, r2 = 0.981
PARArea = (2.156 ± 0.31) × [PAR mg L−1] − (1.359 ± 0.19) α = 0.05, n = 6, r2 = 0.998
MOArea = (1.593 ± 0.31) × [MO mg L−1] − (0.00143 ± 0.0009) α = 0.05, n = 9, r2 = 0.995
The limits of detection and quantification were calculated for this method, which are as follows: 0.52 mg L−1, 0.95 mg L−1 and 0.68 mg L−1 and 1.58 mg L−1, 2.01 mg L−1 and 2.38 mg L−1 for CAF, PAR and MO, respectively. Likewise, the method showed excellent sensitivity, as the angular coefficients of the lines showed median values. This means that with small variations in concentration, large variations in the measured signals are obtained, ensuring the differentiation between two closer concentrations. LOD and LOQ values were considered satisfactory (sufficiently lower), mainly for the purpose of the method (the analysis of CAF, PAR and MO).

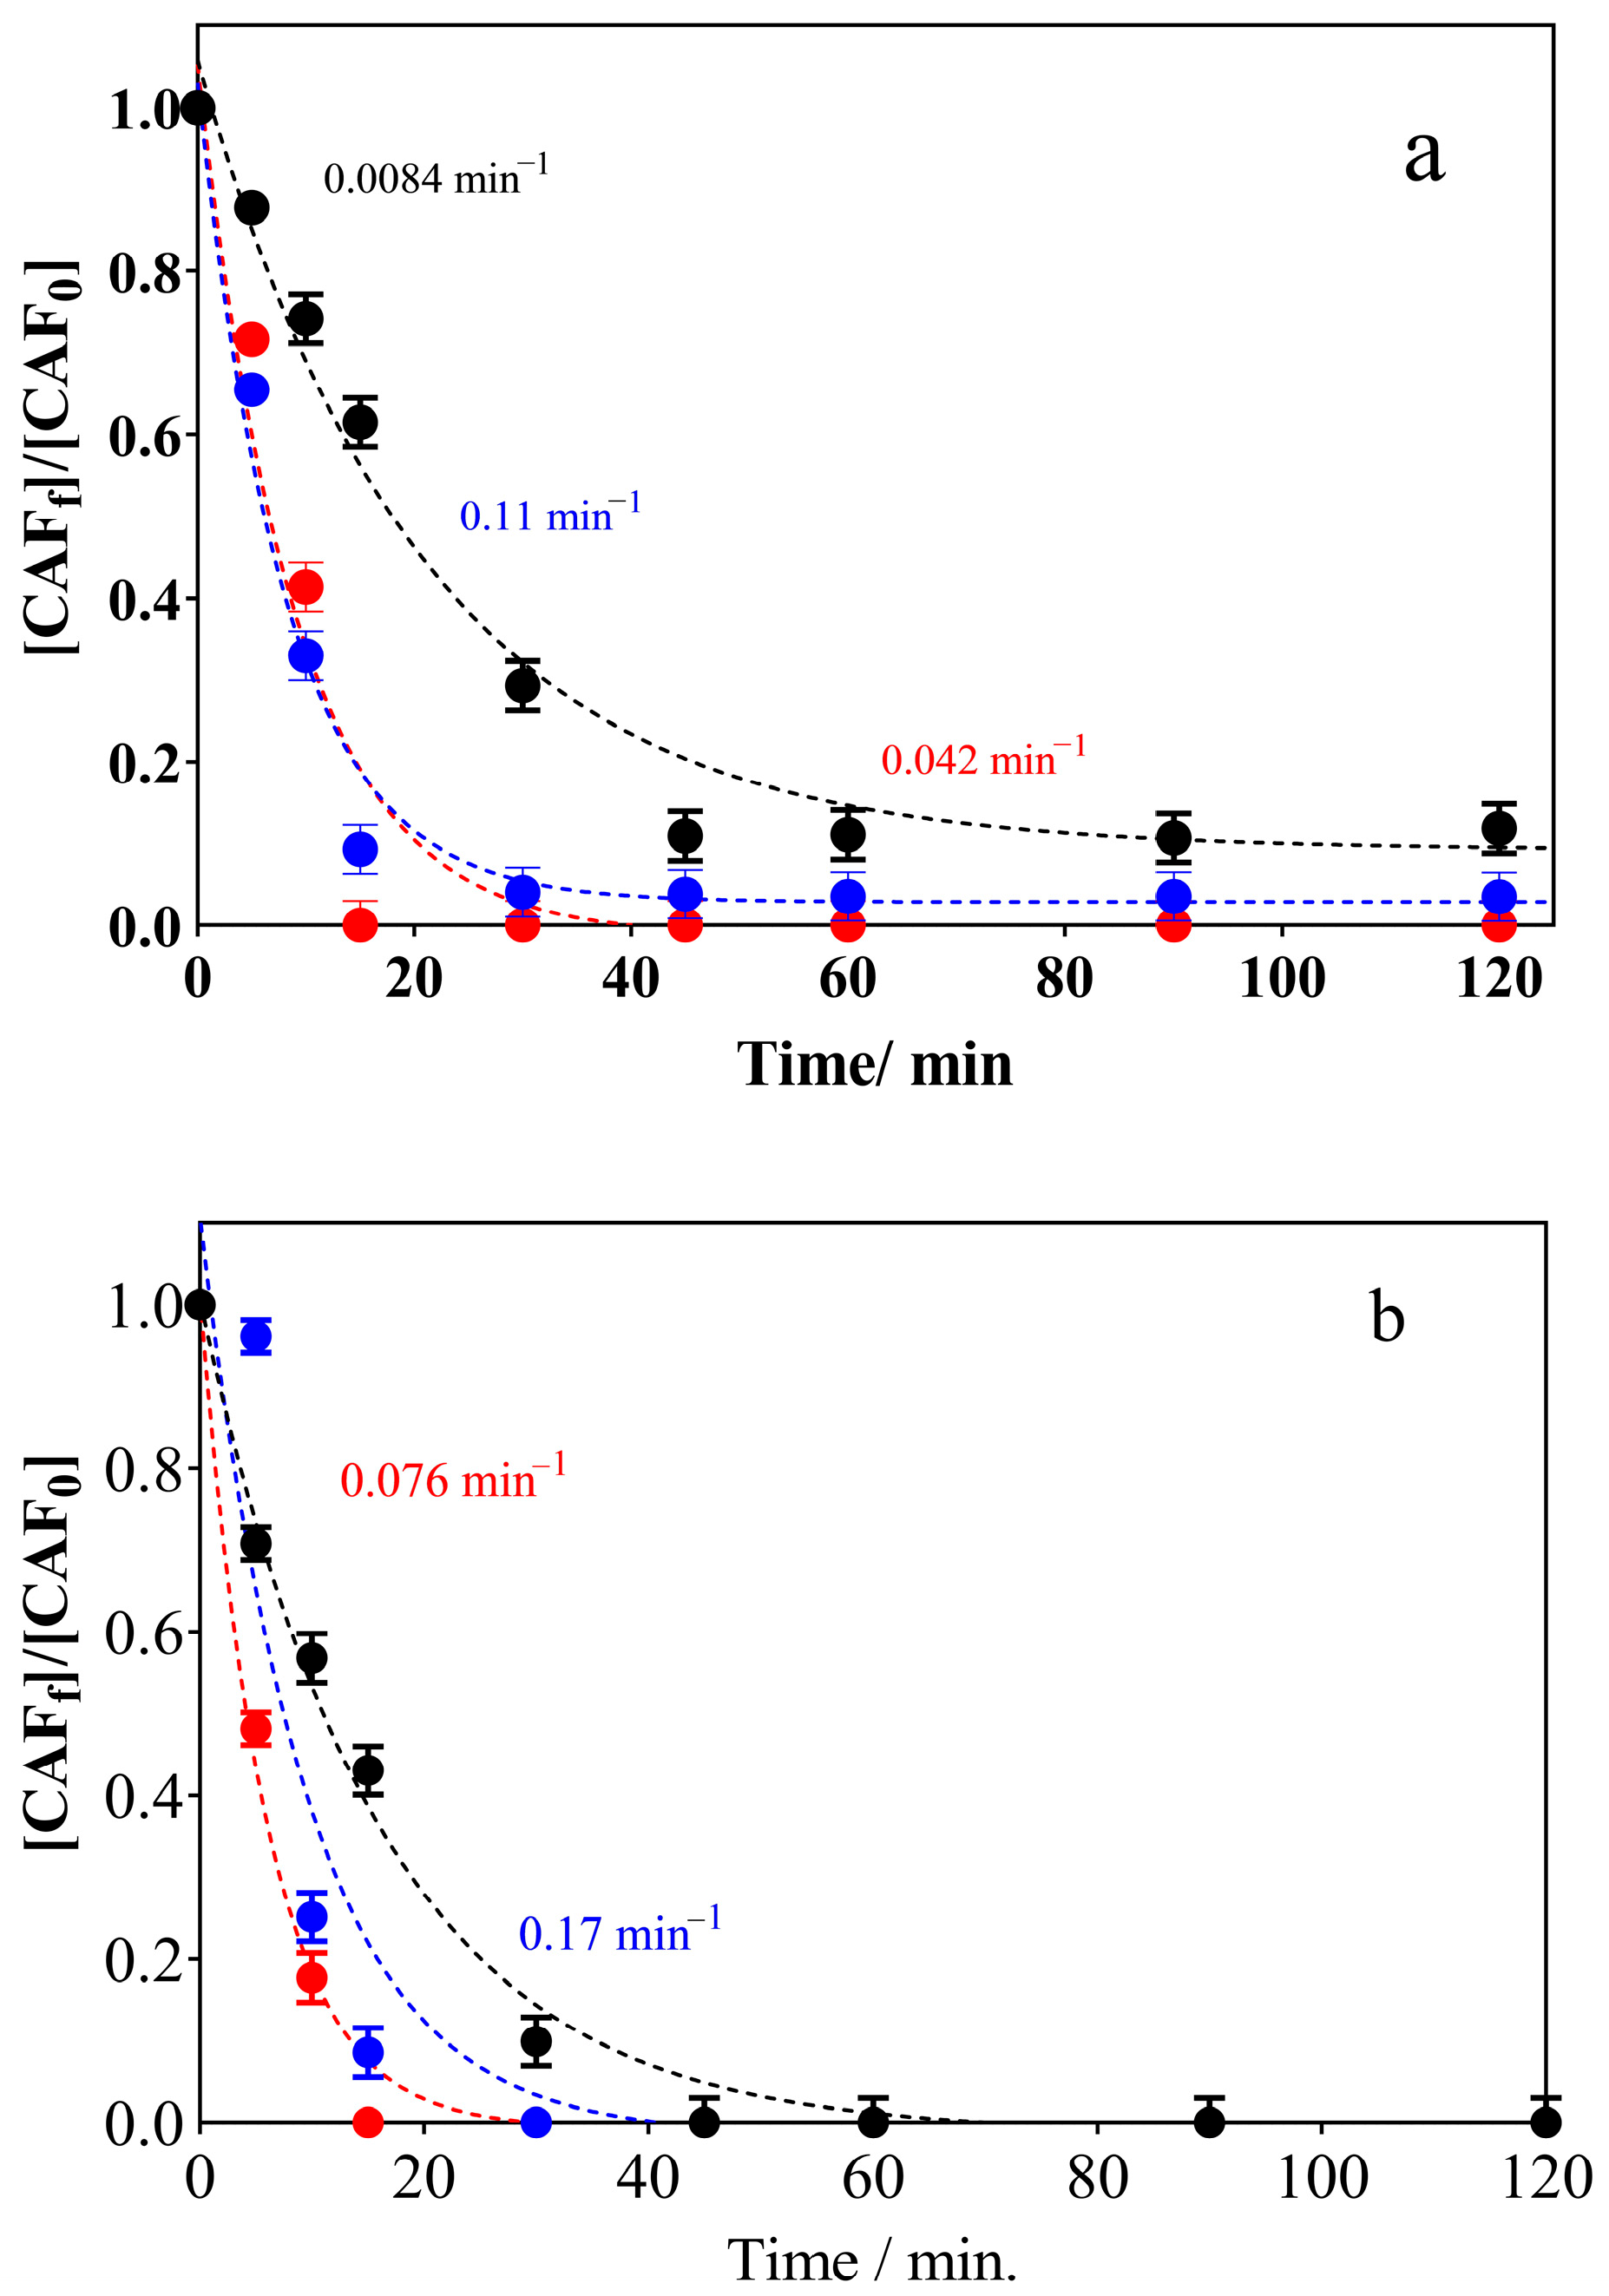
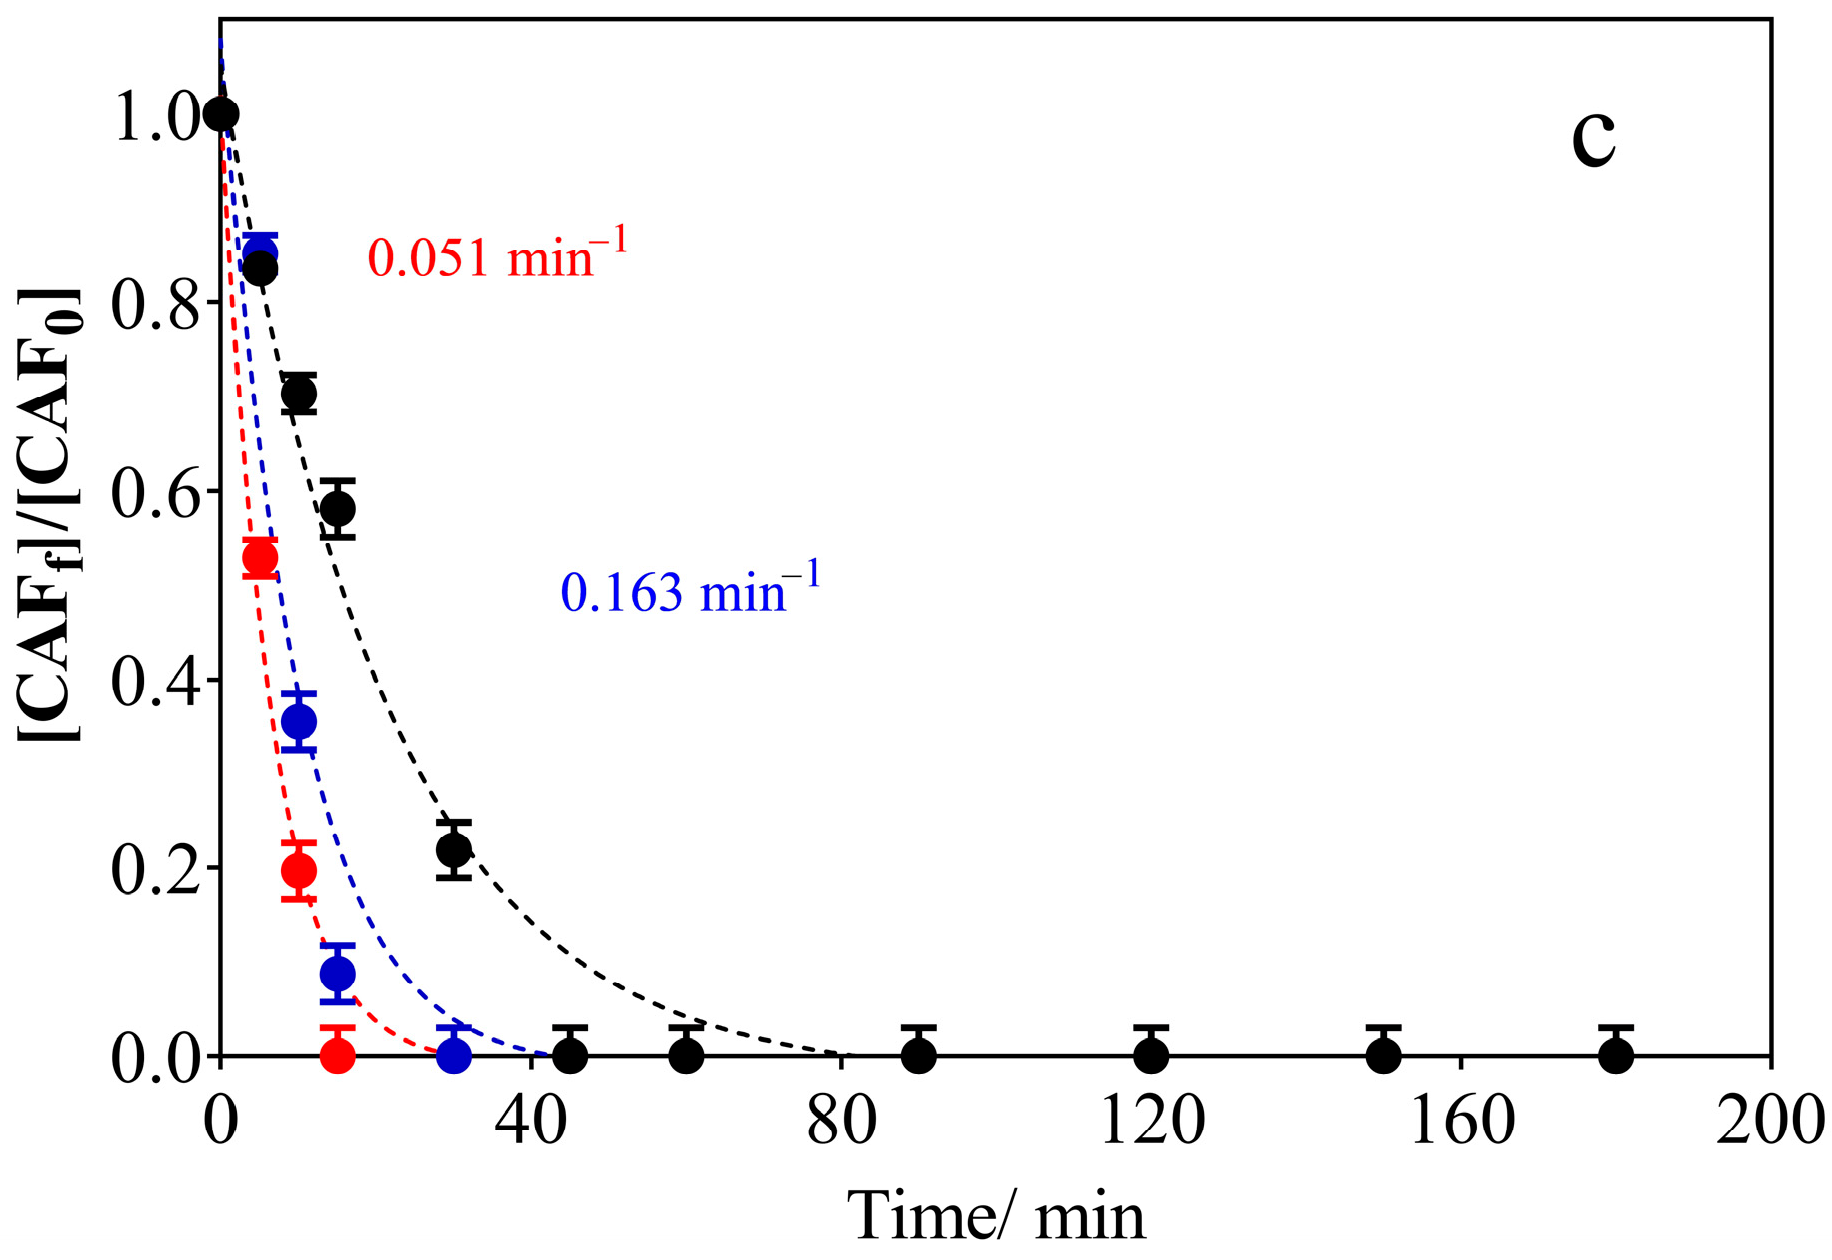
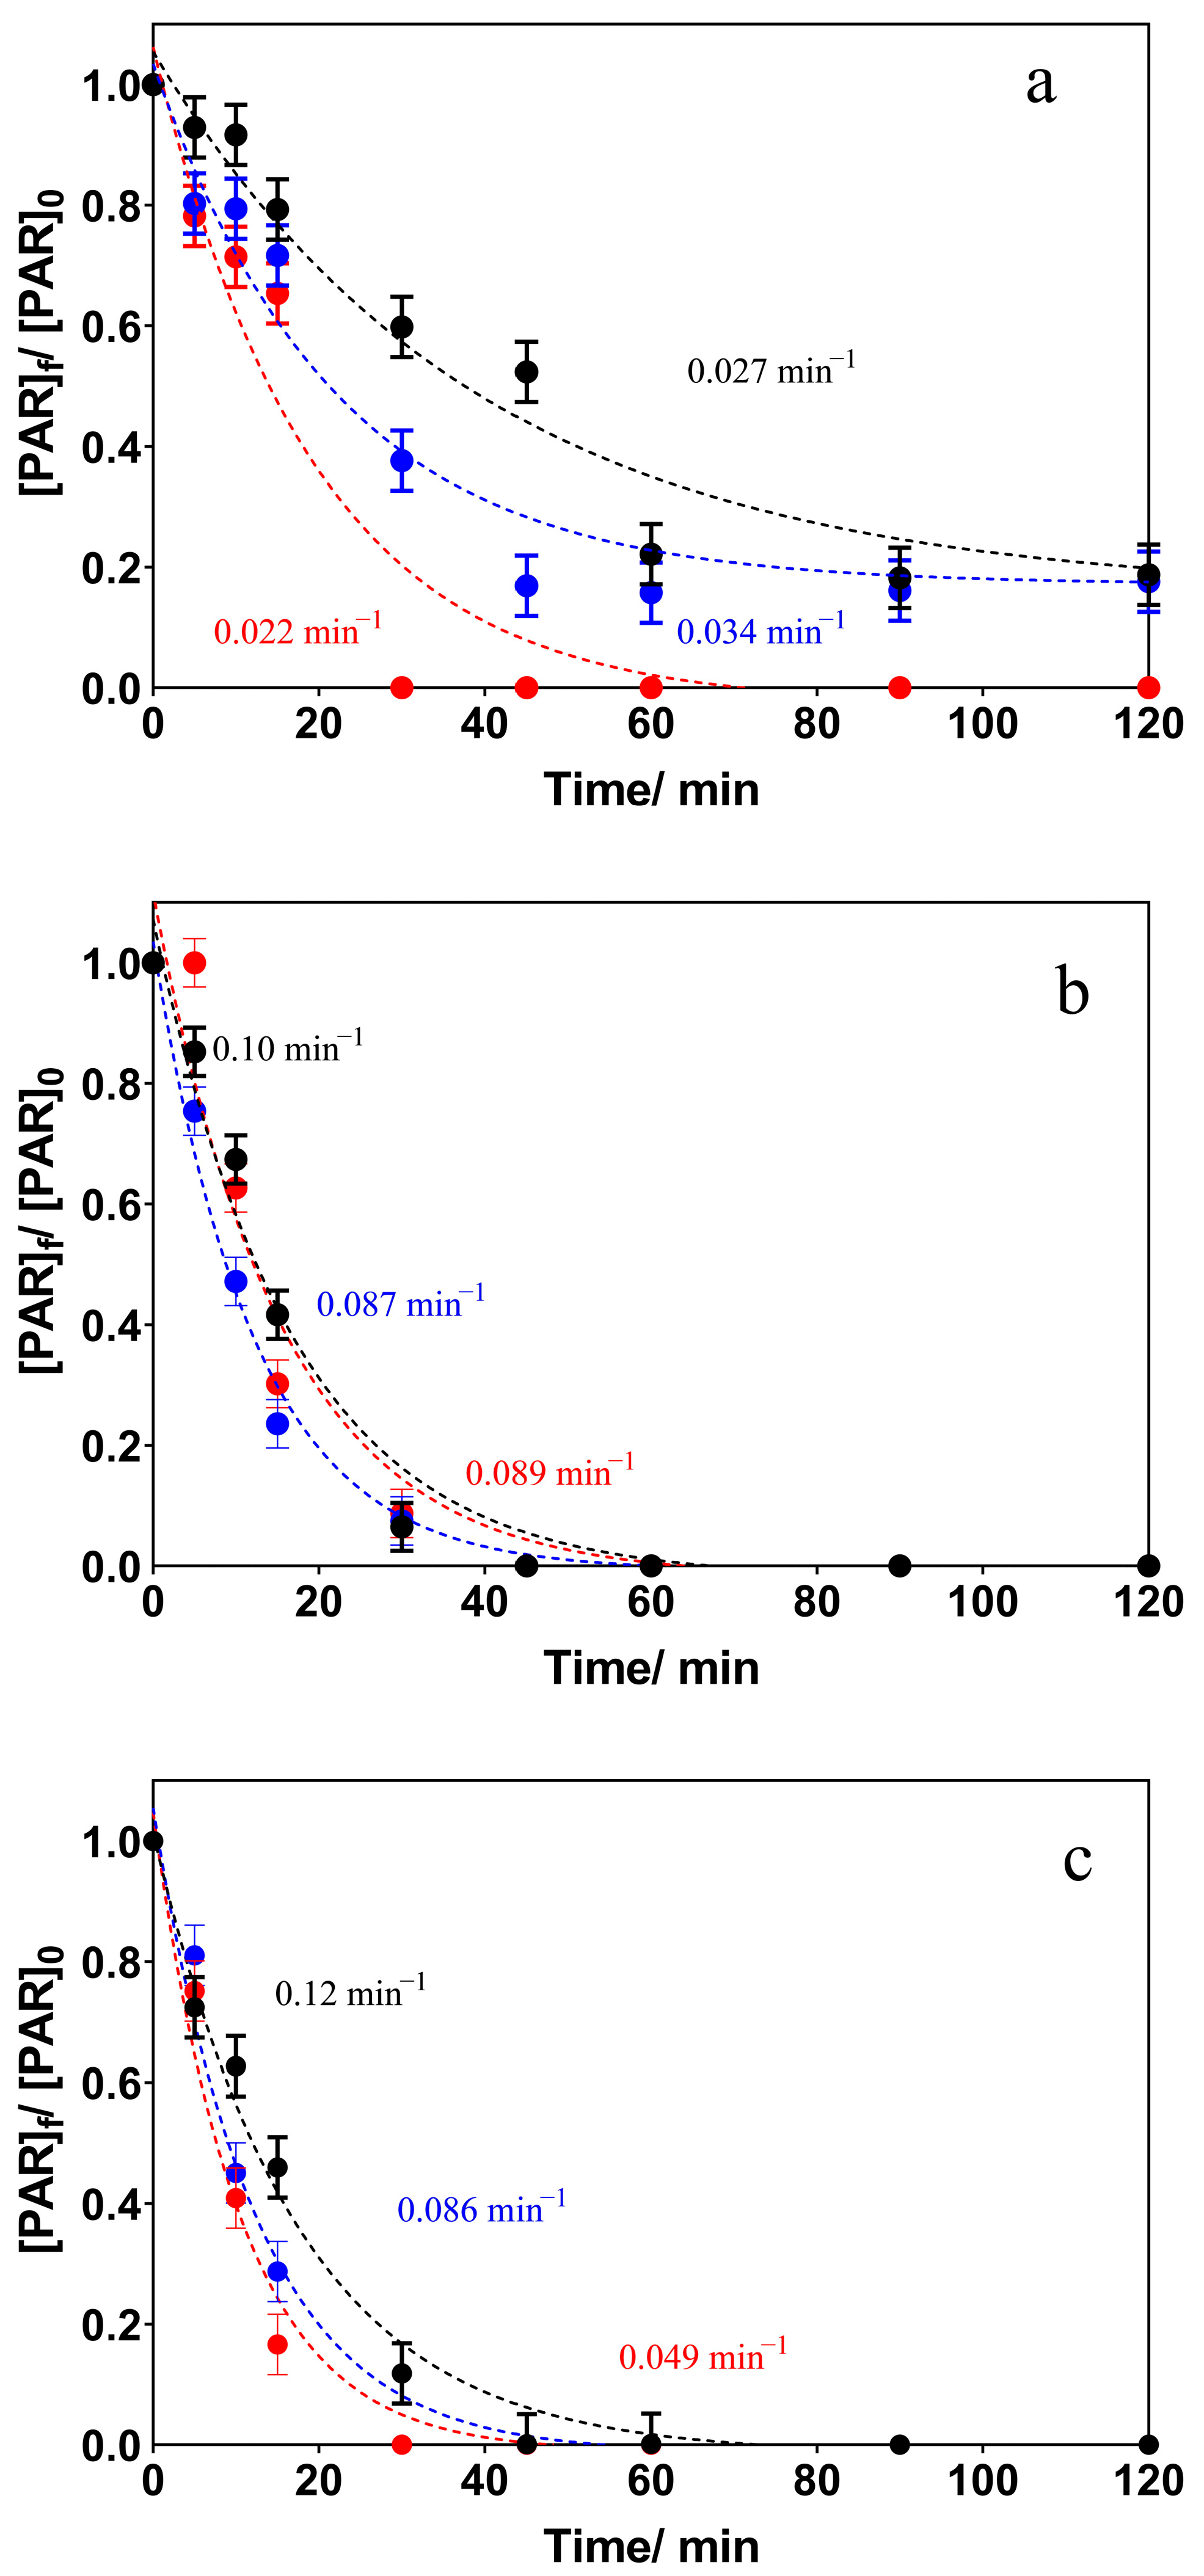
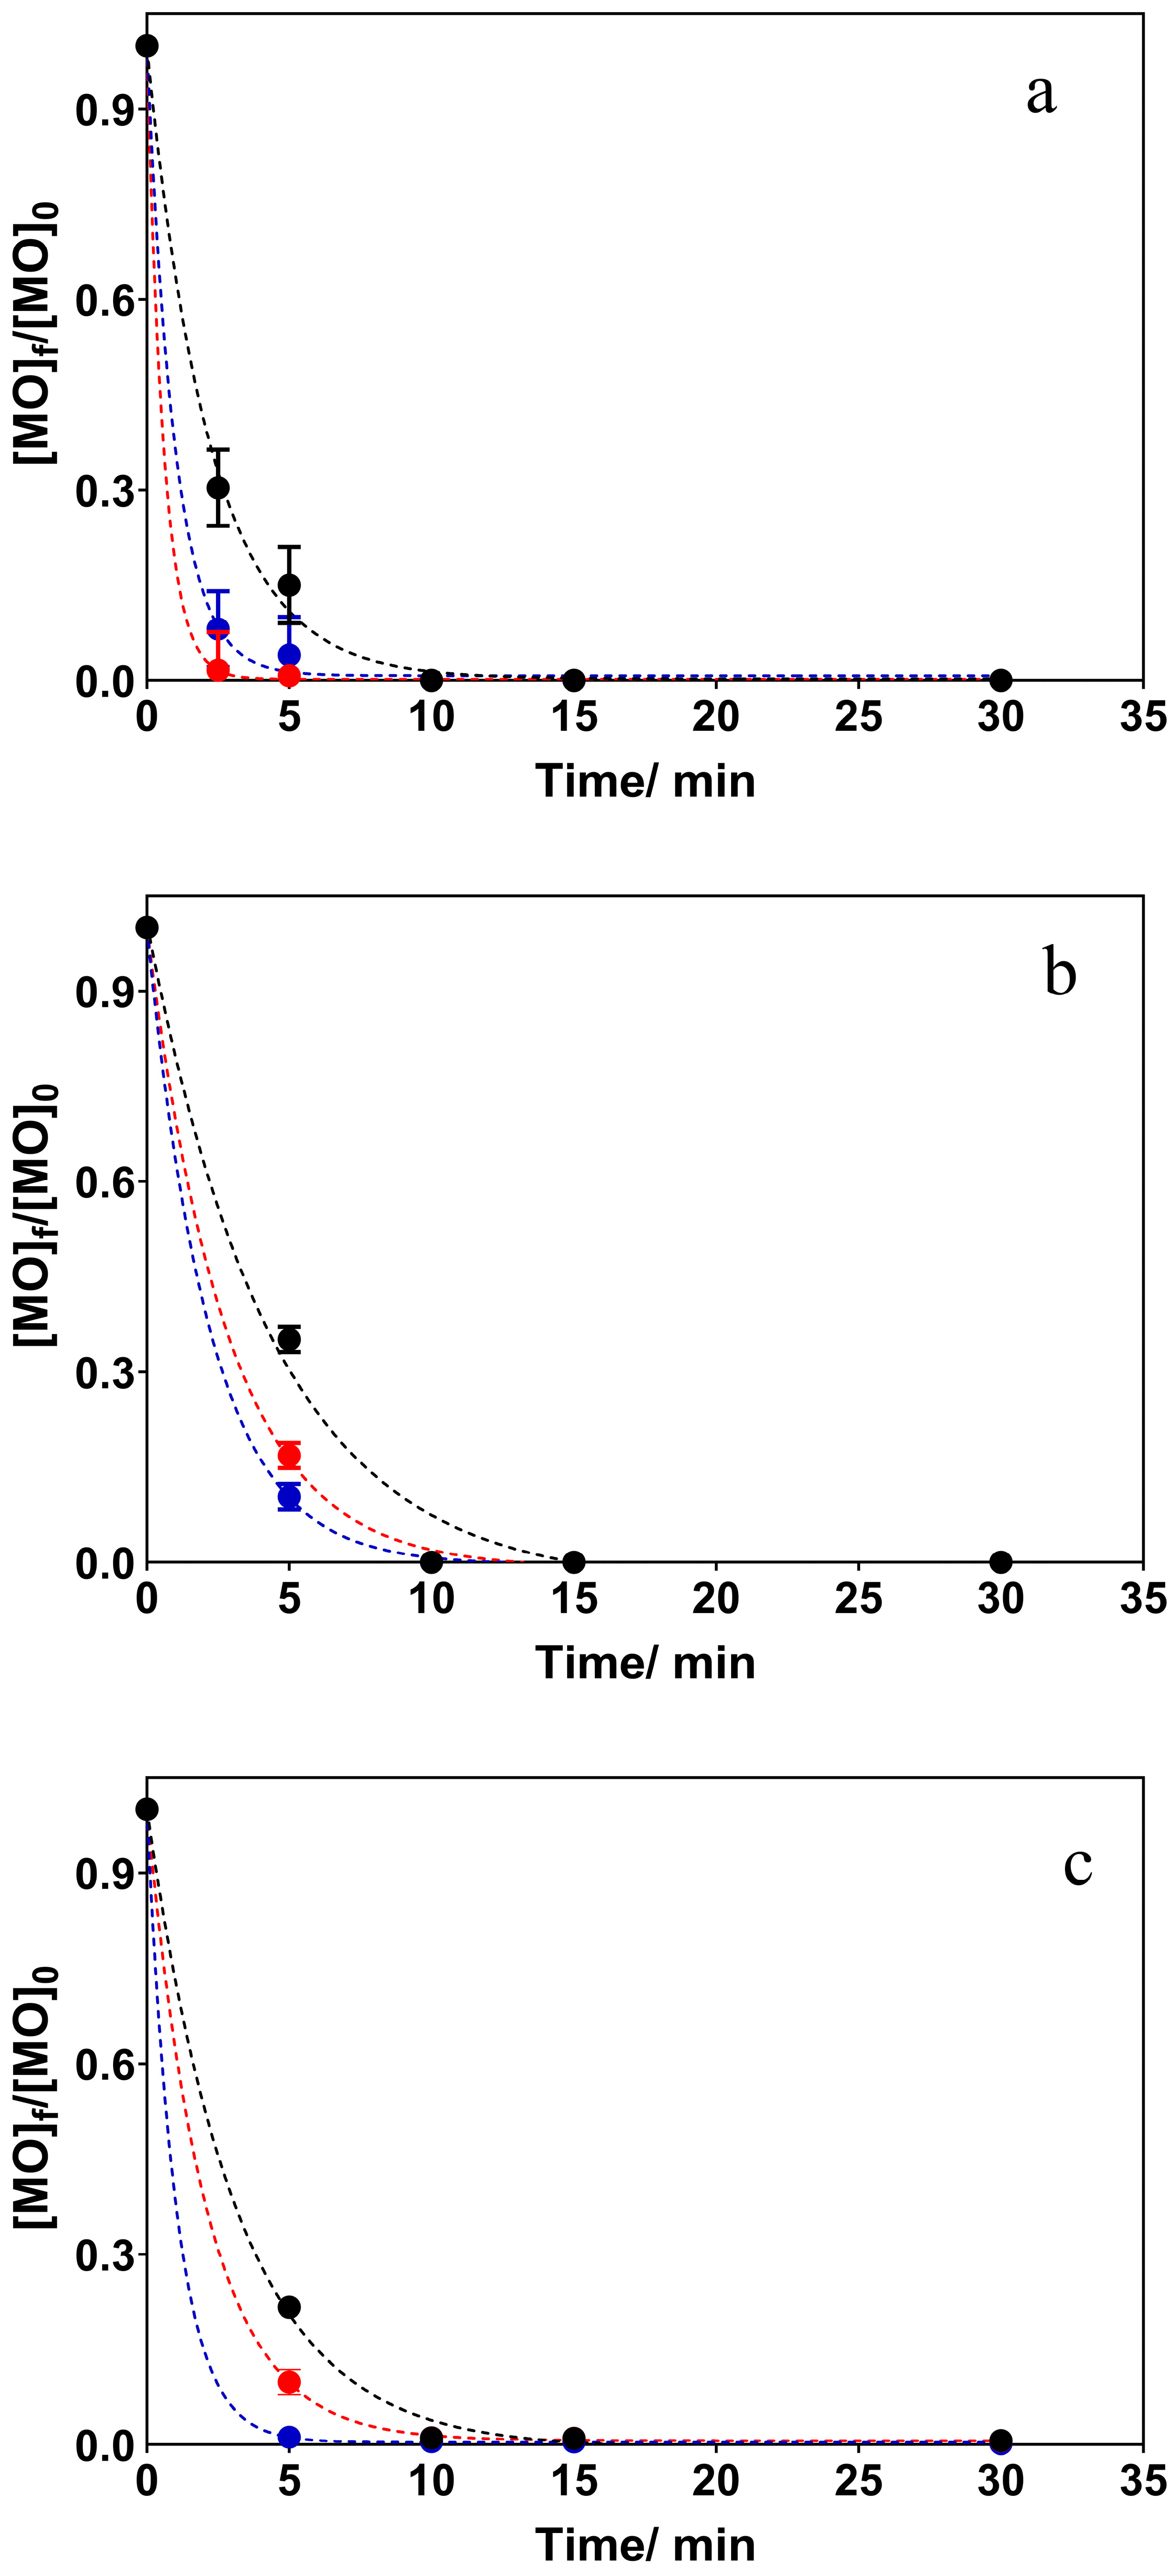
3.2. Electrochemical Oxidation Experiments

The applicability of DPV for the monitoring of CAF, PAR and MO concentrations during the EO process has been verified in previous works, but there are no studies comparing the efficiencies of UV-vis spectrophotometry, DPV and HPLC [33,41,42]. As can be observed from Figure 4, the degradation of CAF was monitored by UV-vis spectrophotometry (Figure 4a), DPV (Figure 4b) and HPLC (Figure 4c), and in all three techniques, a complete elimination of CAF in solution was achieved, by applying 15, 30 and 45 mA cm−2. Figure 4a shows the CAF degradation, as a function of time, during galvanostatic electrolysis at the BDD anode by applying 15, 30 and 45 mA cm−2 in the presence of 50 mM of Na2SO4 in solution. The results clearly show that UV spectrophotometry does not present a similar response to DPV and HPLC for monitoring CAF (20 mg L−1 in 50 mM of Na2SO4). Therefore, the electrochemical method has been shown to be a fast and reliable option for detection compared to conventional spectroscopy methods. As its sensitivity can be similar to that of HPLC, the quantification of species is based on their electrochemical potential, and there are no additional compounds that can absorb light at the same wavelength and cause false positives or values higher than expected [43]. At 15 mA cm−2, the removal efficiency was 92.95% when monitored by UV-vis spectrophotometry, while DPV and HPLC showed similar results, corresponding to a total degradation of 20 mg L−1 of CAF in the presence of 50 mM of Na2SO4 before 60 min. This difference can be attributed to the interferents electrogenerated during the oxidation of CAF, which are associated with the presence of carboxylic acids, which are generated at lower current densities. Taking into account the first minute, the exponential behavior of degradation curves, as a function of time, indicated that the process was controlled by mass transport. According to the available literature, the indirect mechanism for producing persulfate is favored under conditions that promote oxygen evolution overpotential at the electrodes, such as non-active anodes (e.g., diamond films) [21,44,45]. As can be seen, poor performance of UV-vis spectrophotometry was observed at 15 mA cm−2 in terms of k1 values, and this behavior can be explained by the formation of intermediates in lower j. On the other hand, pseudo-first-order kinetic analysis produced good results, similar to DPV and HPLC analysis, for monitoring CAF during the EO process. As shown in Figure 4b,c, it was found that the k value increased from 0.076 to 0.17 min−1 (DPV analysis) and 0.051 to 0.16 min−1 (HPLV analysis) at different j values of 15–45 mA cm−2.
As can be observed, different results were obtained using UV-vis spectrophotometry when compared to those determined by DPV and HPLC for CAF quantification. During the electrochemical process for removing 20 mg L−1 of PAR, according to UV-vis spectrophotometry only 45 mA cm−2 was applied, resulting in total removal in 30 min. At 15 and 30 mA cm−2, the efficiency of removal was 75 and 80% after 120 min of electrochemical oxidation. On the other hand, the decay of PAR by the BDD anode at different j values (15, 30 and 45 mA cm−2) was monitored by DPV and HPLC, and the results are shown in Figure 5a–c. As can be observed, the effect of j on PAR oxidation was investigated and its concentration monitored by DPV and HPLC. According to Figure 5b, the PAR samples in 50 mM Na2SO4 using DPV and HPLC showed similar responses with regard to the decay of PAR concentration. By both analytical methods, DPV and HPLC, the degradation of PAR is quick and significant as j increases. An exponential decrease in PAR was observed, regardless of j. This behavior is in accordance with that described in the literature, in which current densities are higher than the initial limiting current density. Higher j values led to quick PAR degradation. The degradation kinetics data of the target PAR at different j values were associated with a pseudo-first-order reaction with a constant (k1) accomplishing good linear correlations. k1 values of about 0.049 min−1 (R2 = 0.95), 0.089 min−1 (R2 = 0.97) and 0.109 min−1 (R2 = 0.97) were obtained for 15, 30 and 45 mA cm−2, respectively, and the data were acquired by monitoring the oxidation process by DPV, demonstrating that similar accuracy was obtained by HPLC analysis (see Figure 5c). This result clearly confirms that UV-vis spectrophotometry is not a good strategy for monitoring organic compounds during electrochemical oxidation, while DPV and HPLC present similar results. Within this framework, these figures clearly demonstrate that j is a key parameter for paracetamol degradation, which contributes to the efficient production of oxidizing species. This study reinforces the value of electroanalytical approaches, particularly DPV, not only as a complementary technique but as a primary tool for sustainable water treatment monitoring. DPV’s operational simplicity, cost-effectiveness and capacity for real-time analysis position it as a highly practical solution for advancing wastewater remediation technologies and supporting the goals of environmental sustainability.
The initial MO concentration was 10 mg L−1 in 50 mM Na2SO4, present as a synthetic effluent which was electrochemically treated by applying 15, 30 and 45 mA cm−2. Figure 6a–c show that the oxidation rate increases, increasing j. As can be observed from Figure 6a, the results related to the quantification of MO during EO by UV-vis spectrophotometry were similar to those obtained by DPV and HPLC at all j values. The good performance of UV-vis spectrophotometry for monitoring MO during EO can be explained by MO’s structure, which has N=N groups that promote absorption in the visible region (400–600 nm). On the other hand, when organic compounds have characteristic absorption in the ultraviolet region, they may have suffered the influence of other interferents present in the sample.
In order to conduct a statistical treatment of the set of data acquired in the experiments, the error related to the determination of ECs (CAF, PAR and MO) using the two procedures was estimated as described in Equations (1) and (2), for all analytical curves obtained.
E r r o r   % = [ E C ] H P L C [ E C ] U V E C H P L C   ×   100
E r r o r   % = [ E C ] H P L C [ E C ] D P V E C H P L C   ×   100
During EO, ECs (CAF, PAR and MO) were withdrawn and analyzed with UV-vis spectrophotometry, DPV and HPLC to quantify the remaining concentration of CAF, PAR and MO in solution. UV-vis spectrophotometry presented moderate responses for the detection of these organic compounds, while DPV and HPLC provided similar outcomes with modest discrepancies. Figure 6a shows that DPV gave reliable results, with the statistical error being below 10% in the majority, i.e., 90%, of the responses; additionally, it is important to highlight the average values of CAF, PAR and MO concentrations estimated by DPV at all j values. The resulting values are presented in Figure 7, and these confirm the linear relationship between analytical signals and EC (CAF, PAR and MO) concentrations.

3.3. Interferences and Environmental Water Sample Analysis

The applicability of DPV for the monitoring of CAF, PAR and MO in real environmental water samples was also evaluated. Initially, the possible interference of ions commonly found in environmental aqueous systems was assessed by recording the DPV of each analyte in the absence and presence of 10-fold concentrations of different interfering species (Na+, K+, Ca2+, Cl and HCO3). As can be observed in Figure 8, the presence of these ions did not significantly affect the analyte response, indicating that the BDD electrode is selective and can be applied to the quantification of CAF, PAR and MO in environmental water samples.
The sensor was then applied for the determination of each EC in spiked tap water, groundwater and lagoon water samples. Each sample was spiked with 5 mg L−1 CAF, PAR and MO, respectively, and the results are shown in Table 2. DPV achieved good performance in all cases, as evidenced by good recovery values and low relative error, due to the great analytical performance of BDD and low interference of ions. The quantification of the selected ECs was also possible by HPLC. However, higher recovery percentages are observed due to matrix influences. On the other hand, the quantification of CAF and PAR was not possible by UV-vis, since ions that also absorb in the UV region significantly affected the analyte response.

4. Conclusions

In view of all the results obtained for the synthetic effluents under study, it was possible to detect and quantify CAF, PAR and MO in solution (synthetic effluent) by the DPV technique using a BDD electrochemical device. Advantages, such as satisfactory response, greater sensitivity and ease of applicability, were presented by the voltammetric/sensor technique when compared to the chromatographic technique, which is time-consuming and requires pretreatment of the sample and the use of toxic solvents. Considering a real-world scenario, voltametric determination of ECs with BDD presented a series of advantages, providing reliable results in a faster, less costly and more environmentally friendly way. For the DPV data in relation to the absorption spectrophotometry method in the UV-vis region, it presented excellent results in regard to linearity with the analytical signal, given the excellent value of the correlation coefficient, which was greater and close to 1. The degradation of ECs by electrochemical oxidation was studied under different j values (15, 30 and 45 mA cm−2), demonstrating that higher current densities accelerated the elimination of organic matter from the solution due to the efficient electrogeneration of oxidants with the BDD anode [46].

Author Contributions

Conceptualization, M.S.F.d.O., J.L.A.d.Q., D.M.d.A., M.K.S.M., K.G.D.M., C.A.M.-H., E.V.d.S.; methodology, M.K.S.M., J.L.A.d.Q., K.G.D.M., C.A.M.-H., E.V.d.S.; formal analysis, M.S.F.d.O., D.M.d.A., M.K.S.M., K.G.D.M., C.A.M.-H., E.V.d.S.; investigation, J.L.A.d.Q., M.S.F.d.O., D.M.d.A., M.K.S.M., K.G.D.M., C.A.M.-H., E.V.d.S.; data curation, M.K.S.M., K.G.D.M., C.A.M.-H., E.V.d.S.; writing—original draft preparation, M.K.S.M., K.G.D.M., C.A.M.-H., E.V.d.S.; writing—review and editing, M.K.S.M., K.G.D.M., C.A.M.-H., E.V.d.S.; and funding acquisition, E.V.d.S., C.A.M.-H. All authors have read and agreed to the published version of the manuscript.

Funding

Financial support was received from Conselho Nacional de Desevolvimento Científico e Tecnológico (CNPq, Brazil) (408110/2022-8, 315879/2021-1, 402736/2022-2, 421313/2023-4, 403008/2022-0) and from Fundação de Amparo à Pesquisa do Estado de São Paulo (Brazil), FAPESP, under 2014/50945-4 and 2019/13113-4.

Institutional Review Board Statement

Not applicable.

Informed Consent Statement

Not applicable.

Data Availability Statement

The data that support the findings of this study are available from the corresponding author upon reasonable request.

Conflicts of Interest

The authors declare no conflicts of interest.

References

  1. Sundararaman, S.; Aravind Kumar, J.; Deivasigamani, P.; Devarajan, Y. Emerging Pharma Residue Contaminants: Occurrence, Monitoring, Risk and Fate Assessment—A Challenge to Water Resource Management. Sci. Total Environ. 2022, 825, 153897. [Google Scholar] [CrossRef] [PubMed]
  2. Li, Y.; Ma, L.; Li, Y.; Abuduwaili, J. Exploration of the Driving Factors and Distribution of Fecal Coliform in Rivers under a Traditional Agro-Pastoral Economy in Kyrgyzstan, Central Asia. Chemosphere 2022, 286, 131700. [Google Scholar] [CrossRef] [PubMed]
  3. Richardson, S.D.; Kimura, S.Y. Water Analysis: Emerging Contaminants and Current Issues. Anal. Chem. 2016, 88, 546–582. [Google Scholar] [CrossRef]
  4. Zhong, M.; Wang, T.; Zhao, W.; Huang, J.; Wang, B.; Blaney, L.; Bu, Q.; Yu, G. Corrigendum to “Emerging Organic Contaminants in Chinese Surface Water: Identification of Priority Pollutants” [Engineering 11 (2022) 111–125]. Engineering 2022, 31, 139–140. [Google Scholar] [CrossRef]
  5. Fan, Y.; Liu, J.H.; Lu, H.T.; Zhang, Q. Electrochemical Behavior and Voltammetric Determination of Paracetamol on Nafion/TiO2-Graphene Modified Glassy Carbon Electrode. Colloids Surf. B Biointerfaces 2011, 85, 289–292. [Google Scholar] [CrossRef]
  6. El Bouabi, Y.; Farahi, A.; Labjar, N.; El Hajjaji, S.; Bakasse, M.; El Mhammedi, M.A. Square Wave Voltammetric Determination of Paracetamol at Chitosan Modified Carbon Paste Electrode: Application in Natural Water Samples, Commercial Tablets and Human Urines. Mater. Sci. Eng. C 2016, 58, 70–77. [Google Scholar] [CrossRef]
  7. Tyszczuk-Rotko, K.; Bȩczkowska, I.; Wójciak-Kosior, M.; Sowa, I. Simultaneous Voltammetric Determination of Paracetamol and Ascorbic Acid Using a Boron-Doped Diamond Electrode Modified with Nafion and Lead Films. Talanta 2014, 129, 384–391. [Google Scholar] [CrossRef]
  8. Mallah, M.A.; Sherazi, S.T.H.; Bhanger, M.I.; Mahesar, S.A.; Bajeer, M.A. A Rapid Fourier-Transform Infrared (FTIR) Spectroscopic Method for Direct Quantification of Paracetamol Content in Solid Pharmaceutical Formulations. Spectrochim. Acta A Mol. Biomol. Spectrosc. 2015, 141, 64–70. [Google Scholar] [CrossRef] [PubMed]
  9. Tefera, M.; Geto, A.; Tessema, M.; Admassie, S. Simultaneous Determination of Caffeine and Paracetamol by Square Wave Voltammetry at Poly(4-Amino-3-Hydroxynaphthalene Sulfonic Acid)-Modified Glassy Carbon Electrode. Food Chem. 2016, 210, 156–162. [Google Scholar] [CrossRef]
  10. Khaskheli, A.R.; Fischer, J.; Barek, J.; Vyskočil, V.; Sirajuddin; Bhanger, M.I. Differential Pulse Voltammetric Determination of Paracetamol in Tablet and Urine Samples at a Micro-Crystalline Natural Graphite-Polystyrene Composite Film Modified Electrode. Electrochim. Acta 2013, 101, 238–242. [Google Scholar] [CrossRef]
  11. Li, L.; Zou, D.; Xiao, Z.; Zeng, X.; Zhang, L.; Jiang, L.; Wang, A.; Ge, D.; Zhang, G.; Liu, F. Biochar as a Sorbent for Emerging Contaminants Enables Improvements in Waste Management and Sustainable Resource Use. J. Clean. Prod. 2019, 210, 1324–1342. [Google Scholar] [CrossRef]
  12. Vieira, L.R.; Soares, A.M.V.M.; Freitas, R. Caffeine as a Contaminant of Concern: A Review on Concentrations and Impacts in Marine Coastal Systems. Chemosphere 2022, 286, 131675. [Google Scholar] [CrossRef] [PubMed]
  13. Rodriguez del Rey, Z.; Granek, E.F.; Sylvester, S. Occurrence and Concentration of Caffeine in Oregon Coastal Waters. Mar. Pollut. Bull. 2012, 64, 1417–1424. [Google Scholar] [CrossRef] [PubMed]
  14. Svorc, L. Determination of Caffeine: A Comprehensive Review on Electrochemical Methods. Int. J. Electrochem. Sci. 2013, 8, 5755–5773. [Google Scholar] [CrossRef]
  15. Indermuhle, C.; Martín de Vidales, M.J.; Sáez, C.; Robles, J.; Cañizares, P.; García-Reyes, J.F.; Molina-Díaz, A.; Comninellis, C.; Rodrigo, M.A. Degradation of Caffeine by Conductive Diamond Electrochemical Oxidation. Chemosphere 2013, 93, 1720–1725. [Google Scholar] [CrossRef]
  16. Pham, V.L.; Kim, D.G.; Ko, S.O. Advanced Oxidative Degradation of Acetaminophen by Carbon Catalysts: Radical vs Non-Radical Pathways. Environ. Res. 2020, 188, 109767. [Google Scholar] [CrossRef]
  17. Allaire, M.; Mackay, T.; Zheng, S.; Lall, U. Detecting Community Response to Water Quality Violations Using Bottled Water Sales. Proc. Natl. Acad. Sci. USA 2019, 116, 20917–20922. [Google Scholar] [CrossRef]
  18. da Costa Soares, I.C.; da Silva, Á.R.L.; de Moura Santos, E.C.M.; dos Santos, E.V.; da Silva, D.R.; Martínez-Huitle, C.A. Understanding the Electrochemical Oxidation of Dyes on Platinum and Boron–Doped Diamond Electrode Surfaces: Experimental and Computational Study. J. Solid State Electrochem. 2020, 24, 3245–3256. [Google Scholar] [CrossRef]
  19. Luo, Y.; Guo, W.; Ngo, H.H.; Nghiem, L.D.; Hai, F.I.; Zhang, J.; Liang, S.; Wang, X.C. A Review on the Occurrence of Micropollutants in the Aquatic Environment and Their Fate and Removal during Wastewater Treatment. Sci. Total Environ. 2014, 473–474, 619–641. [Google Scholar] [CrossRef]
  20. Bradley, I.; Straub, A.; Maraccini, P.; Markazi, S.; Nguyen, T.H. Iron Oxide Amended Biosand Filters for Virus Removal. Water Res. 2011, 45, 4501–4510. [Google Scholar] [CrossRef]
  21. Martínez-Huitle, C.A.; Panizza, M. Electrochemical Oxidation of Organic Pollutants for Wastewater Treatment. Curr. Opin. Electrochem. 2018, 11, 62–71. [Google Scholar] [CrossRef]
  22. Bolong, N.; Ismail, A.F.; Salim, M.R.; Matsuura, T. A Review of the Effects of Emerging Contaminants in Wastewater and Options for Their Removal. Desalination 2009, 239, 229–246. [Google Scholar] [CrossRef]
  23. Rizzo, L.; Malato, S.; Antakyali, D.; Beretsou, V.G.; Đolić, M.B.; Gernjak, W.; Heath, E.; Ivancev-Tumbas, I.; Karaolia, P.; Lado Ribeiro, A.R.; et al. Consolidated vs New Advanced Treatment Methods for the Removal of Contaminants of Emerging Concern from Urban Wastewater. Sci. Total Environ. 2019, 655, 986–1008. [Google Scholar] [CrossRef] [PubMed]
  24. Krzeminski, P.; Tomei, M.C.; Karaolia, P.; Langenhoff, A.; Almeida, C.M.R.; Felis, E.; Gritten, F.; Andersen, H.R.; Fernandes, T.; Manaia, C.M.; et al. Performance of Secondary Wastewater Treatment Methods for the Removal of Contaminants of Emerging Concern Implicated in Crop Uptake and Antibiotic Resistance Spread: A Review. Sci. Total Environ. 2019, 648, 1052–1081. [Google Scholar] [CrossRef]
  25. Silva, T.A.; Zanin, H.; Corat, E.J.; Fatibello-Filho, O. Simultaneous Voltammetric Determination of Paracetamol, Codeine and Caffeine on Diamond-like Carbon Porous Electrodes. Electroanalysis 2017, 29, 907–916. [Google Scholar] [CrossRef]
  26. de Araújo, D.M.; Paiva, S.D.S.S.M.; Henrique, J.M.M.; Martínez-Huitle, C.A.; Dos Santos, E.V. Green Composite Sensor for Monitoring Hydroxychloroquine in Different Water Matrix. Materials 2021, 14, 4990. [Google Scholar] [CrossRef] [PubMed]
  27. Jlassi, K.; Oturan, M.A.; Fauzi Ismail, A.; Chehimi, M.M. Clean Water: Next Generation Technologies; Springer: Cham, Switzerland, 2024. [Google Scholar] [CrossRef]
  28. dos Santos, E.V.; Martínez-Huitle, C.A.; Rodrigo, M.A. The Electro-Refinery in Organics: A New Arising Concept for Valorization of Wastes. Curr. Opin. Electrochem. 2023, 39, 101267. [Google Scholar] [CrossRef]
  29. de Oliveira Silva, K.N.; Rodrigo, M.A.; dos Santos, E.V. Electrochemical Treatment of Soil-Washing Effluent with Boron-Doped Diamond Electrodes: A Review. Curr. Opin. Solid State Mater. Sci. 2021, 25, 100962. [Google Scholar] [CrossRef]
  30. Zazou, H.; Oturan, N.; Sönmez Çelebi, M.; Hamdani, M.; Oturan, M.A. Cold Incineration of 1,2-Dichlorobenzene in Aqueous Solution by Electrochemical Advanced Oxidation Using DSA/Carbon Felt, Pt/Carbon Felt and BDD/Carbon Felt Cells. Sep. Purif. Technol. 2019, 208, 184–193. [Google Scholar] [CrossRef]
  31. Clematis, D.; Panizza, M. Application of Boron-Doped Diamond Electrodes for Electrochemical Oxidation of Real Wastewaters. Curr. Opin. Electrochem. 2021, 30, 100844. [Google Scholar] [CrossRef]
  32. Lotfi, S.; Veisi, H.; Karmakar, B. A Convenient Strategy for the Electrochemical Evaluation of Acetaminophen and Caffeine in Combined Drugs and Biological Samples over TiO2@polymethyldopa/Pd Nanocomposite Functionalized Glassy Carbon Electrodes. Measurement 2021, 186, 110156. [Google Scholar] [CrossRef]
  33. Monteiro, M.K.S.; Santos, E.C.M.M.; Silva, D.R.; Martínez-Huitle, C.A.; dos Santos, E.V. Simultaneous Determination of Paracetamol and Caffeine in Pharmaceutical Formulations and Synthetic Urine Using Cork-Modified Graphite Electrodes. J. Solid State Electrochem. 2020, 24, 1789–1800. [Google Scholar] [CrossRef]
  34. Martin, K.K.; Ouattara, L. Electroanalytical Investigation on Paracetamol on Boron-Doped Diamond Electrode by Voltammetry. Am. J. Anal. Chem. 2019, 10, 562–578. [Google Scholar] [CrossRef]
  35. Kang, N.; Ji, L.; Zhao, J.; Zhou, X.; Weng, X.; Li, H.; Zhang, X.; Yang, F. Uniform Growth of Fe3O4 Nanocubes on the Single-Walled Carbon Nanotubes as an Electrosensor of Organic Dyes and the Study on Its Catalytic Mechanism. J. Electroanal. Chem. 2019, 833, 70–78. [Google Scholar] [CrossRef]
  36. Miller, J.N. Basic Statistical Methods for Analytical Chemistry. Part 2. Calibration and Regression Methods. A Review. Analyst 1991, 116, 3–14. [Google Scholar] [CrossRef]
  37. Desimoni, E.; Brunetti, B. About Estimating the Limit of Detection of Heteroscedastic Analytical Systems. Anal. Chim. Acta 2009, 655, 30–37. [Google Scholar] [CrossRef] [PubMed]
  38. Whitaker Sena, J.D.; Lowe, P.A.; Lee, S.W. Significant Predictors of Test Anxiety among Students with and without Learning Disabilities. J. Learn. Disabil. 2007, 40, 360–376. [Google Scholar] [CrossRef]
  39. Wang, C.; Zhao, H. The Impact of COVID-19 on Anxiety in Chinese University Students. Front. Psychol. 2020, 11, 1168. [Google Scholar] [CrossRef]
  40. Belay, A.; Ture, K.; Redi, M.; Asfaw, A. Measurement of Caffeine in Coffee Beans with UV/Vis Spectrometer. Food Chem. 2008, 108, 310–315. [Google Scholar] [CrossRef]
  41. Monteiro, M.K.S.; Paiva, S.S.M.; da Silva, D.R.; Vilar, V.J.P.; Martínez-Huitle, C.A.; dos Santos, E.V. Novel Cork-Graphite Electrochemical Sensor for Voltammetric Determination of Caffeine. J. Electroanal. Chem. 2019, 839, 283–289. [Google Scholar] [CrossRef]
  42. Freitas de Araújo, K.C.; de Oliveira Silva, K.N.; Monteiro, M.K.; Ribeiro Da Silva, D.; Santos, E.V.d.; Quiroz, M.A.; Martínez-Huitle, C.A. Using Persulfate Electrogenerated at Boron-Doped Diamond Electrodes as an Ex -Situ Oxidation Approach: Storage and Service-Life Solution Parameters. J. Electrochem. Soc. 2022, 169, 033506. [Google Scholar] [CrossRef]
  43. Molina, J.; Cases, F.; Moretto, L.M. Graphene-Based Materials for the Electrochemical Determination of Hazardous Ions. Anal. Chim. Acta 2016, 946, 9–39. [Google Scholar] [CrossRef] [PubMed]
  44. Panizza, M.; Cerisola, G. Application of Diamond Electrodes to Electrochemical Processes. Electrochim. Acta 2005, 51, 191–199. [Google Scholar] [CrossRef]
  45. Panizza, M.; Cerisola, G. Direct and Mediated Anodic Oxidation of Organic Pollutants. Chem. Rev. 2009, 109, 6541–6569. [Google Scholar] [CrossRef]
  46. Oliveira, K.S.G.C.; dos Santos, E.V.; Loor-Urgilés, L.D.; Shabanloo, A.; Martínez-Huitle, C.A. The World Impact of Boron Doped Diamond Electrodes and Low-Cost Strategies for Novel Production Systems for Sustainable Wastewater Treatment. Curr. Opin. Electrochem. 2025, 50, 101648. [Google Scholar] [CrossRef]
Figure 1. Differential pulse voltammograms on the BDD sensor for different concentrations of different ECs. (a) CAF: linear range—3.88–19.20 mg L−1 in H2SO4 mol L−1. (b) PAR: 3.02—29.6 mg L−1 in H2SO4 mol L−1. (c) MO: 0.199—9.89 mg L−1 in Na2SO4 mol L−1. Insert: linear calibration graph of concentration of EC in solution versus current peak. Insert: graph of DPV response, in terms of current, as a function of EC concentration.
Coatings 15 00719 g001
Figure 2. Schematic representation of (a) CAF, (b) PAR and (c) MO oxidation.
Coatings 15 00719 g002
Figure 3. (a) UV-vis curves recorded for different concentrations of CAF in 0.5 mol L−1 H2SO4: 3.88 mg −19.20 mg L−1; (b) PAR in 0.5 mol L−1 H2SO4: 3.02−29.6 mg L−1; and (c) MO in 0.5 mol L−1 Na2SO4: 0.199−9.89 mg L−1. Insert: graph of UV-vis response, in terms of absorbance, as a function of EC concentration.
Coatings 15 00719 g003
Figure 4. Comparison of CAF removal, as a function of time, between (a) UV spectrophotometry, (b) DPV and (c) HPLC analysis for quantifying CAF concentration during its elimination by EO process using BDD and Ti as anode and cathode electrodes, respectively. Experimental condition: 500 mL of 20 mg L−1 CAF in the presence of Na2SO4; applied current densities: (●) 10, () 30 and () 45 mA cm−2. Experiments have been carried out at 25 °C.
Coatings 15 00719 g004aCoatings 15 00719 g004b
Figure 5. Comparison of PAR removal, as a function of time, between (a) UV spectrophotometry, (b) DPV and (c) HPLC analysis for quantifying PAR concentration during its elimination by EO process using BDD and Ti as anode and cathode electrodes, respectively. Experimental condition: 500 mL of 20 mg L−1 PAR in 50 mM Na2SO4; applied current densities: (●) 10, () 30 and () 45 mA cm−2. Experiments have been carried out at 25 °C.
Coatings 15 00719 g005
Figure 6. Comparison of MO removal, as a function of time, between (a) UV spectrophotometry, (b) DPV and (c) HPLC analysis for quantifying MO concentration during its elimination by EO process using BDD and Ti as anode and cathode electrodes, respectively. Experimental condition: 500 mL of 10 mg L−1 MO in 50 mM Na2SO4; applied current densities: (●) 10, () 30 and () 45 mA cm−2. Experiments have been carried out at 25 °C.
Coatings 15 00719 g006
Figure 7. Statistical error (dashed lines), mean (pink full lines marked in bold) and standard deviation (pink full lines, indicating ± standard deviation) for measurements performed using DPV (black points), with respect to results provided by HPLC. Graphic displays weighted residuals (a) CAF (b) PAR and (c) MO.
Coatings 15 00719 g007aCoatings 15 00719 g007b
Figure 8. Normalized response for 5 mg L−1 (a) CAF, (b) PAR and (c) MO isolated and combined with 10-fold concentrations of common interfering ions.
Coatings 15 00719 g008
Table 1. Calibration lines for quantitative determination of EC model (CAF, PAR and MO) by DPV, spectrophotometry and HPLC.
AnalyteParametersDPVUV-VisHPLC
CAFLimit range (mg L−1)3.88–19.203.88–19.203.88–19.20
Correlation coefficient (r2)0.9950.9940.981
Slope (b)2.880.0661.33
Intercept (a)2.200.00671.02
LOD (mg L−1)0.693.680.52
LQ (mg L−1)1.694.391.40
PARLimit range (mg L−1)3.02–29.63.02–29.63.02–29.6
Correlation coefficient (r2)0.9990.9920.998
Slope (b) 1.090.0922.156
Intercept (a)4.960.0151.359
LOD (mg L−1)0.849.820.95
LQ (mg L−1)1.3111.382.01
MOLimit range (mg L−1)0.19–9.890.19–9.890.19–9.89
Correlation coefficient (r2)0.9980.9920.995
Slope (b)8.040.1821.593
Intercept (a)2.650.00630.0014
LOD (mg L−1)0.461.390.68
LQ (mg L−1)1.264.022.38
Table 2. Recovery values for CAF, PAR and MO determination in environmental water samples.
AnalyteDPVUV-visHPLC
Added/mg L−1Found/mg L−1Recovery/%Added/mg L−1Found/mg L−1Recovery/%Added/mg L−1Found/mg L−1Recovery/%
Tap waterCAF5.04.66 ± 0.0593.1 ± 1.15.01.44 ± 0.3028.8 ± 21.05.05.96 ± 0.01119.2 ± 0.1
PAR5.04.64 ± 0.1392.8 ± 2.85.07.88 ± 0.21157.5 ± 2.75.05.47 ± 0.01109.4 ± 0.1
MO5.04.36 ± 0.0887.3 ± 1.95.04.26 ± 0.0285.2 ± 0.55.05.57 ± 0.28111.4 ± 4.9
Well waterCAF5.04.85 ± 0.1897.0 ± 3.85.06.51 ± 0.04130.3 ± 0.65.05.81 ± 0.01116.2 ± 0.11
PAR5.04.34 ± 0.1386.8 ± 2.95.02.90 ± 0.0158.0 ± 0.15.05.90 ± 0.01118.1 ± 0.1
MO5.05.41 ± 0.35108.2 ± 6.55.04.95 ± 0.0199.0 ± 0.15.05.35 ± 0.13107.0 ± 2.5
Lagoon waterCAF5.05.83 ± 0.27116.5 ± 4.65.03.16 ± 0.0663.2 ± 1.95.05.66 ± 0.01113.3 ± 0.04
PAR5.04.43 ± 0.1588.6 ± 3.55.03.94 ± 0.1478.8 ± 3.65.04.82 ± 0.0196.3 ± 0.2
MO5.05.21 ± 0.10104.3 ± 2.05.04.87 ± 0.0197.4 ± 0.075.05.46 ± 0.15109.1 ± 2.8
Disclaimer/Publisher’s Note: The statements, opinions and data contained in all publications are solely those of the individual author(s) and contributor(s) and not of MDPI and/or the editor(s). MDPI and/or the editor(s) disclaim responsibility for any injury to people or property resulting from any ideas, methods, instructions or products referred to in the content.

