
Effect of Normal Load on the Current-Carrying Friction Performance of Copper–10% Graphite Composites

Abstract
1. Introduction
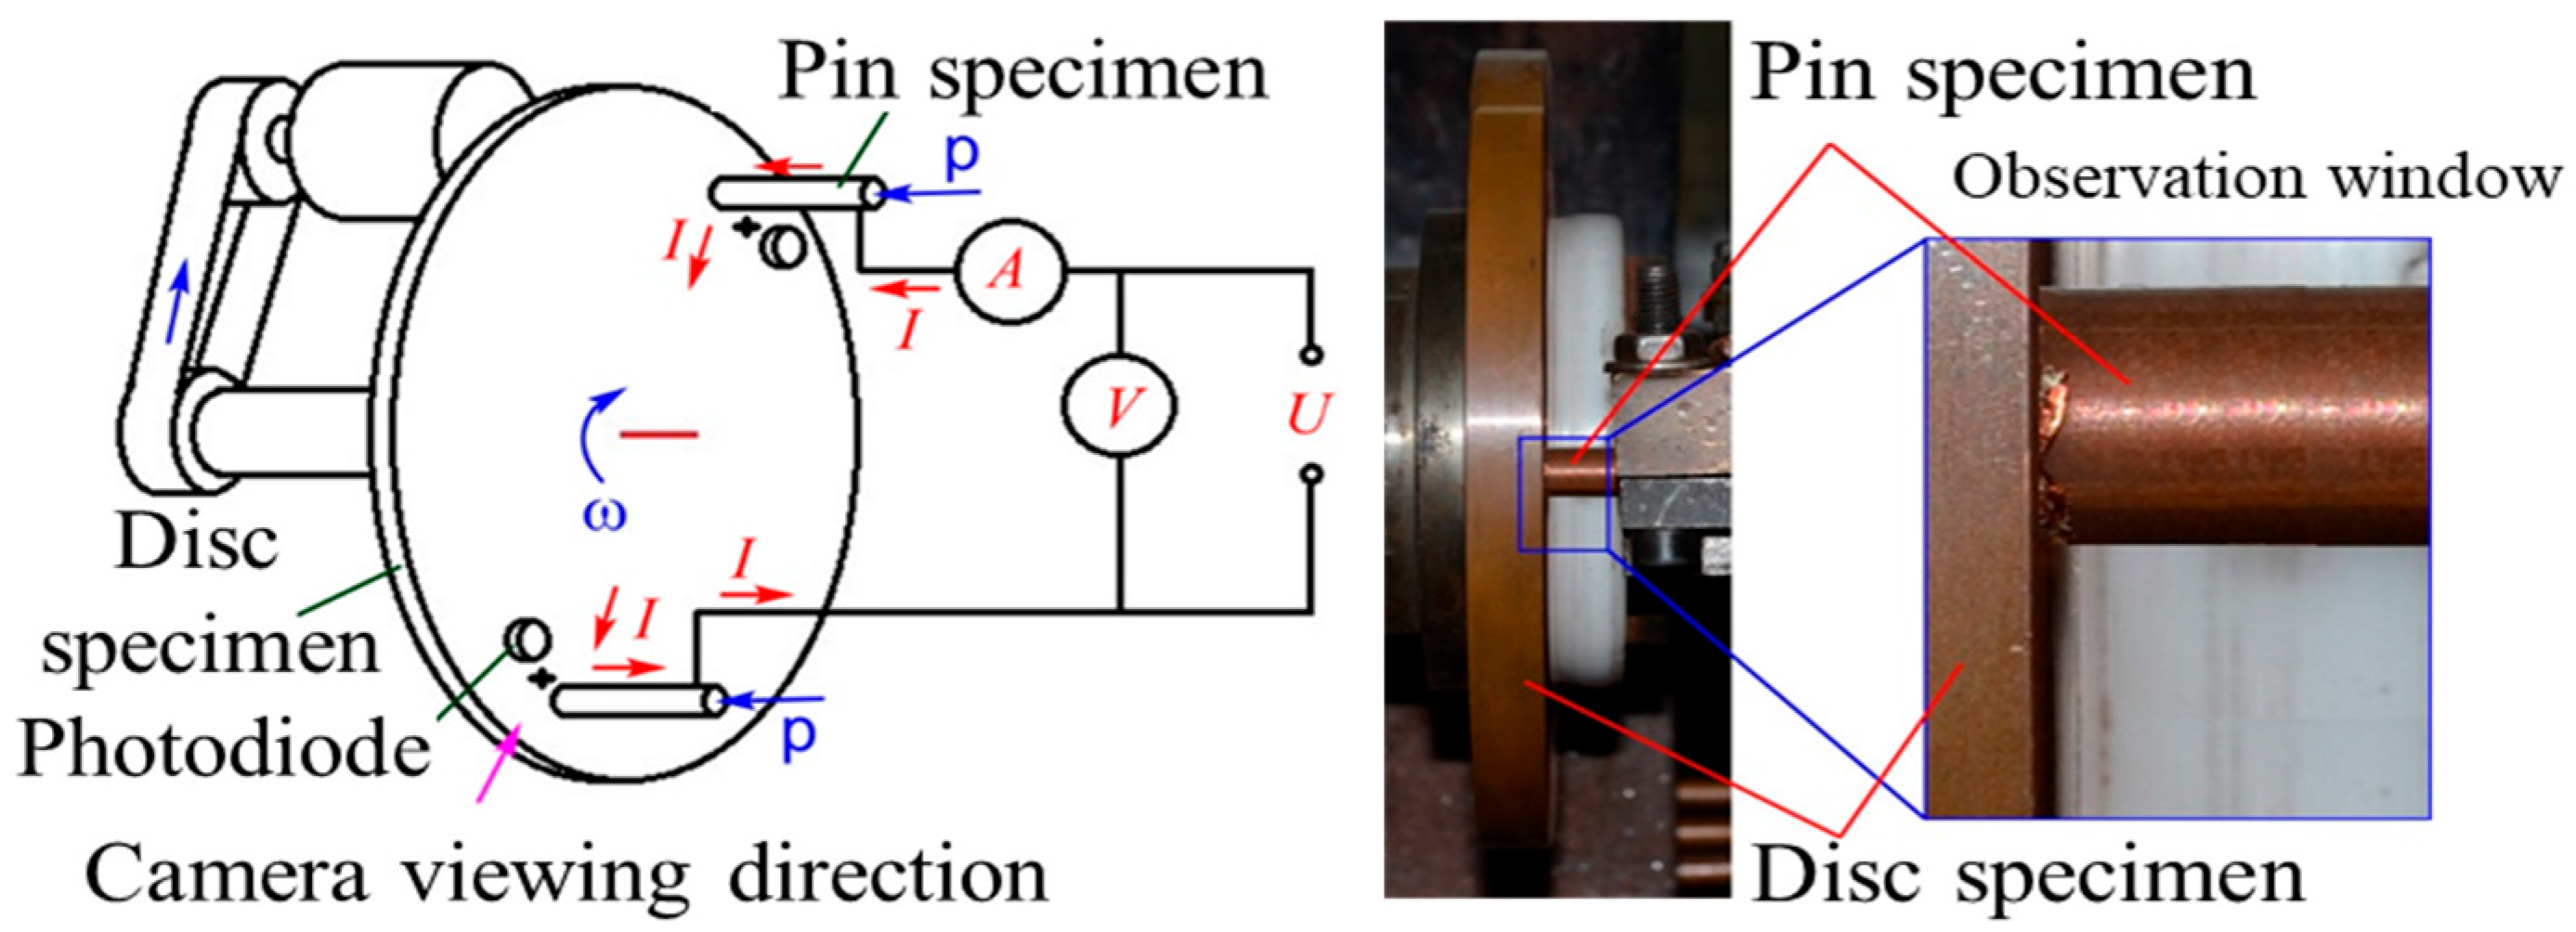
2. Experiment
3. Result
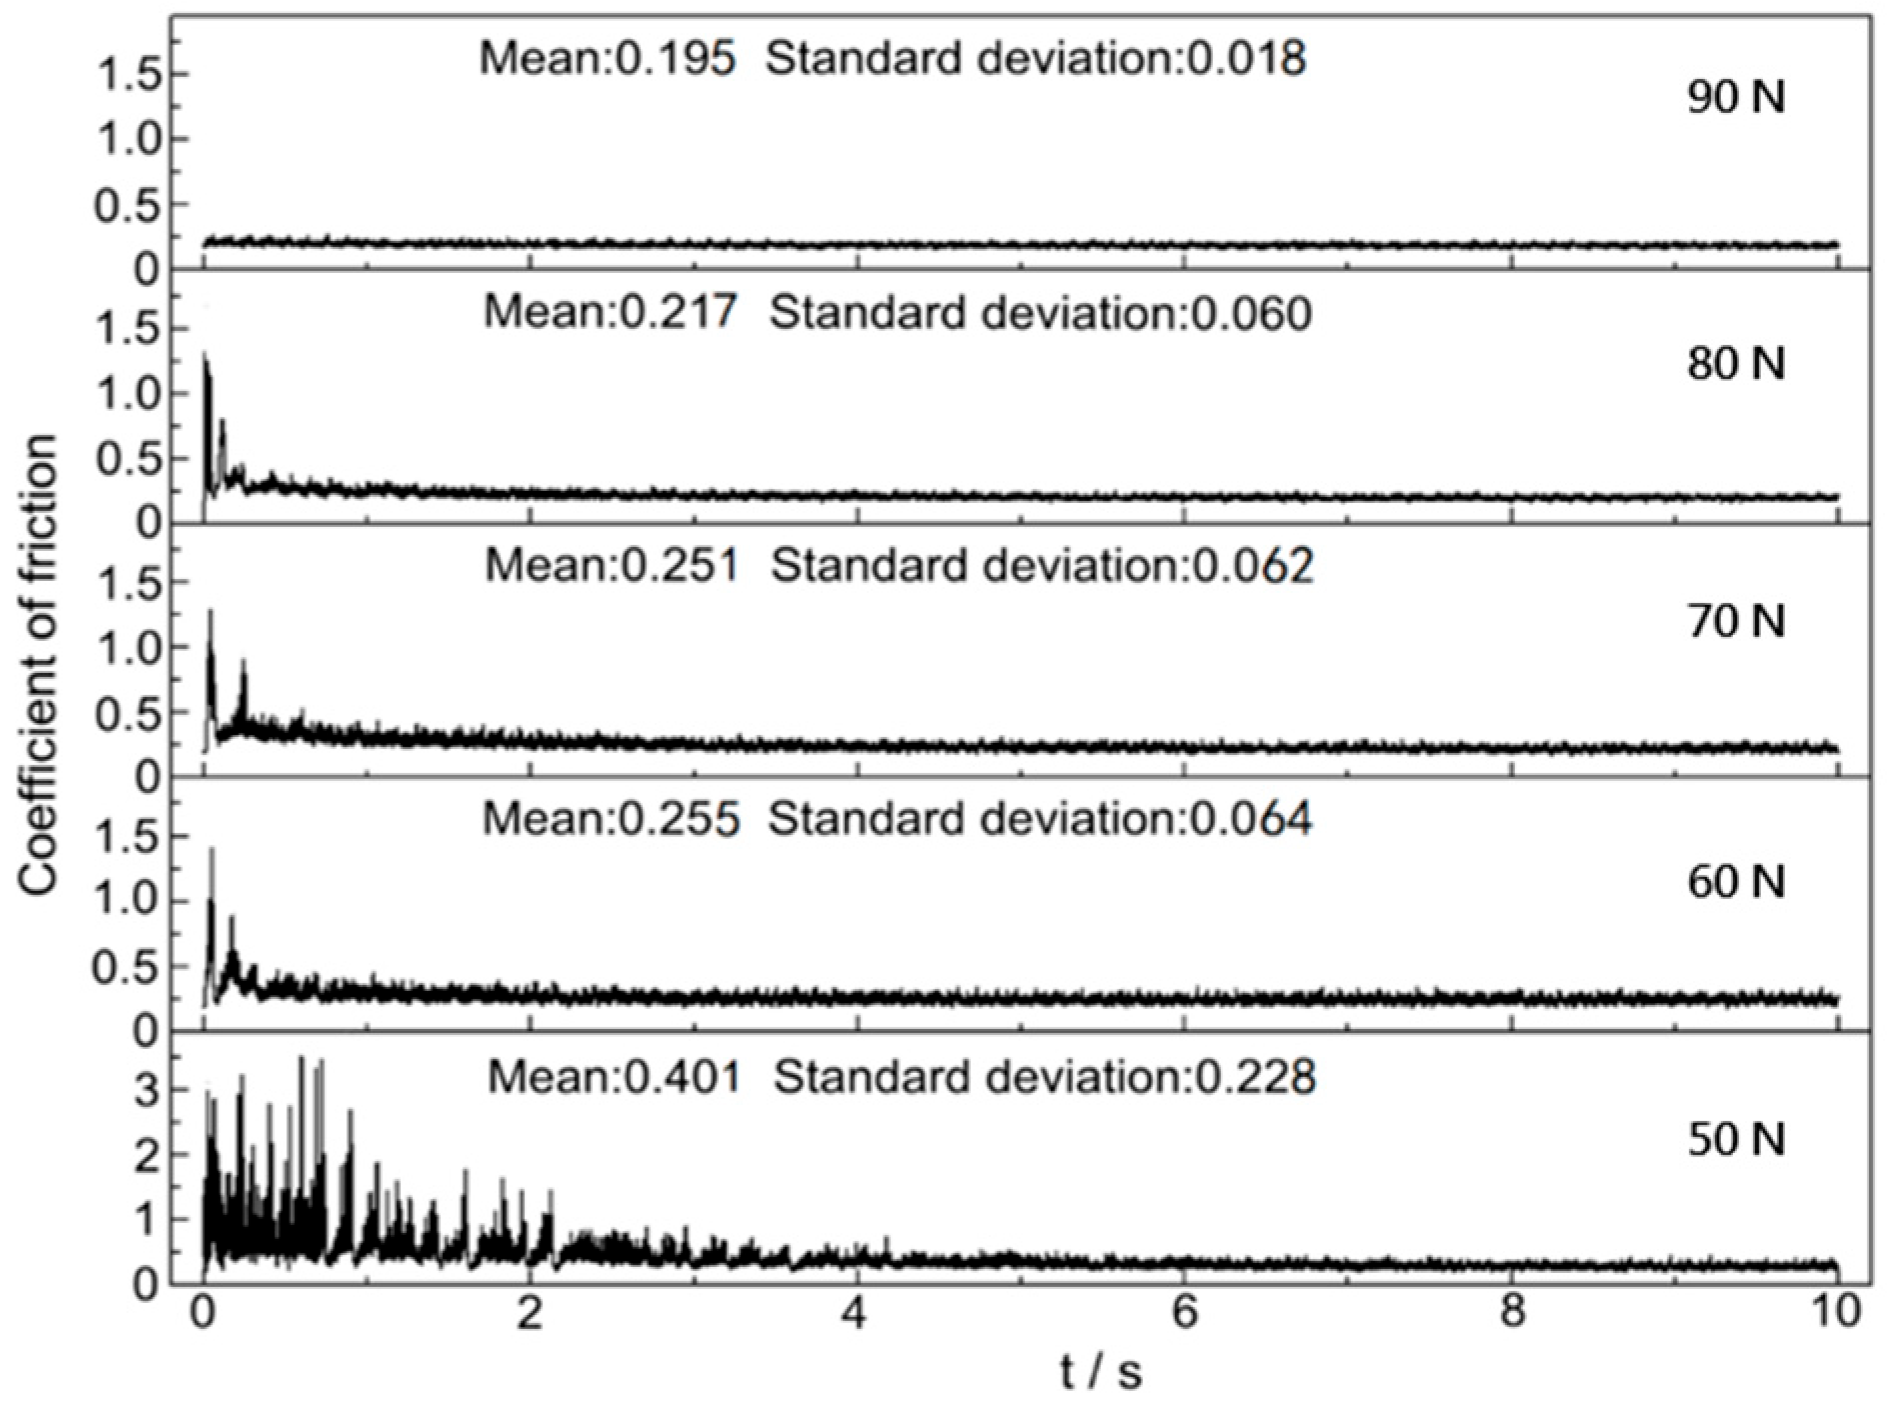
3.1. Frictional Performance Under Different Normal Load Conditions with Current Flow
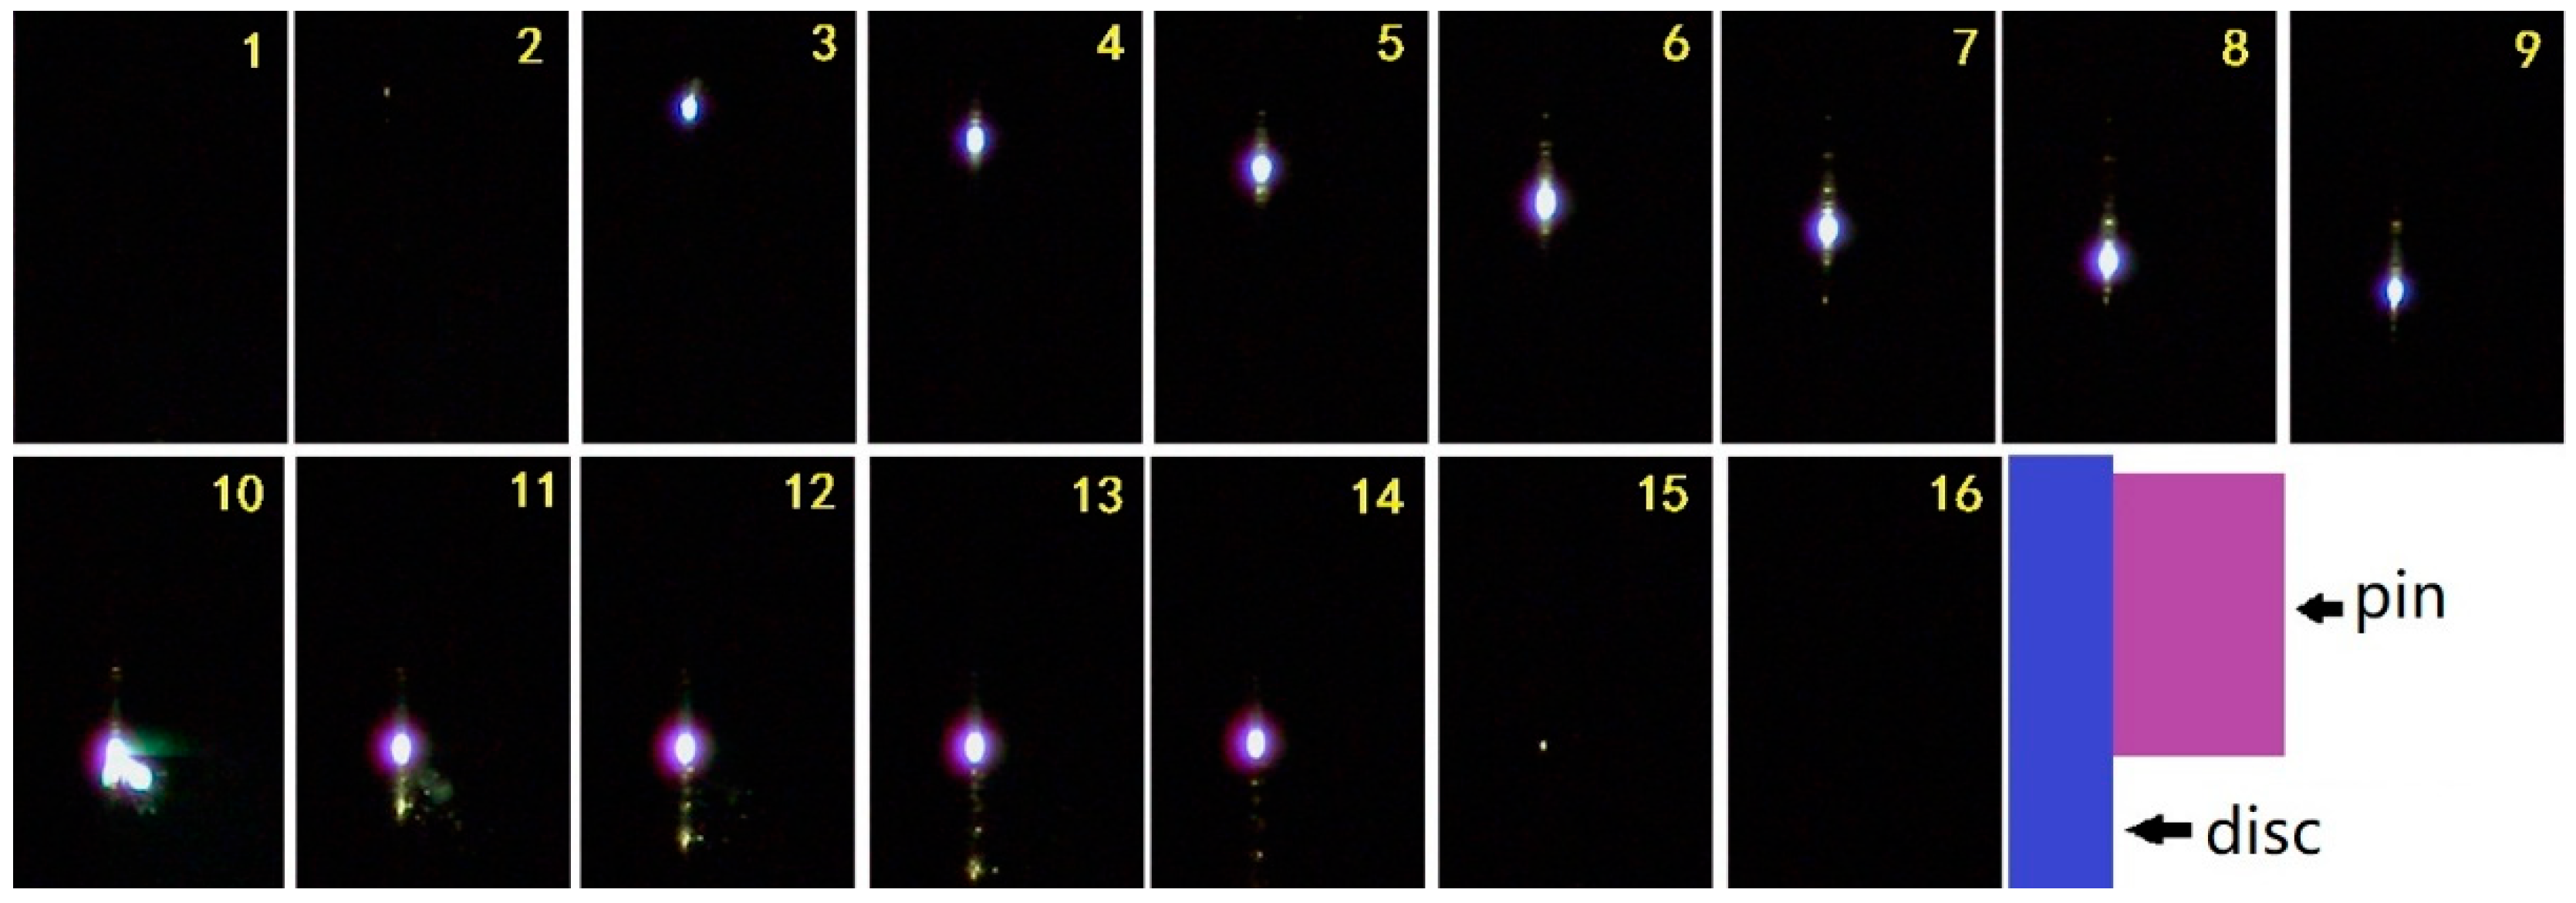
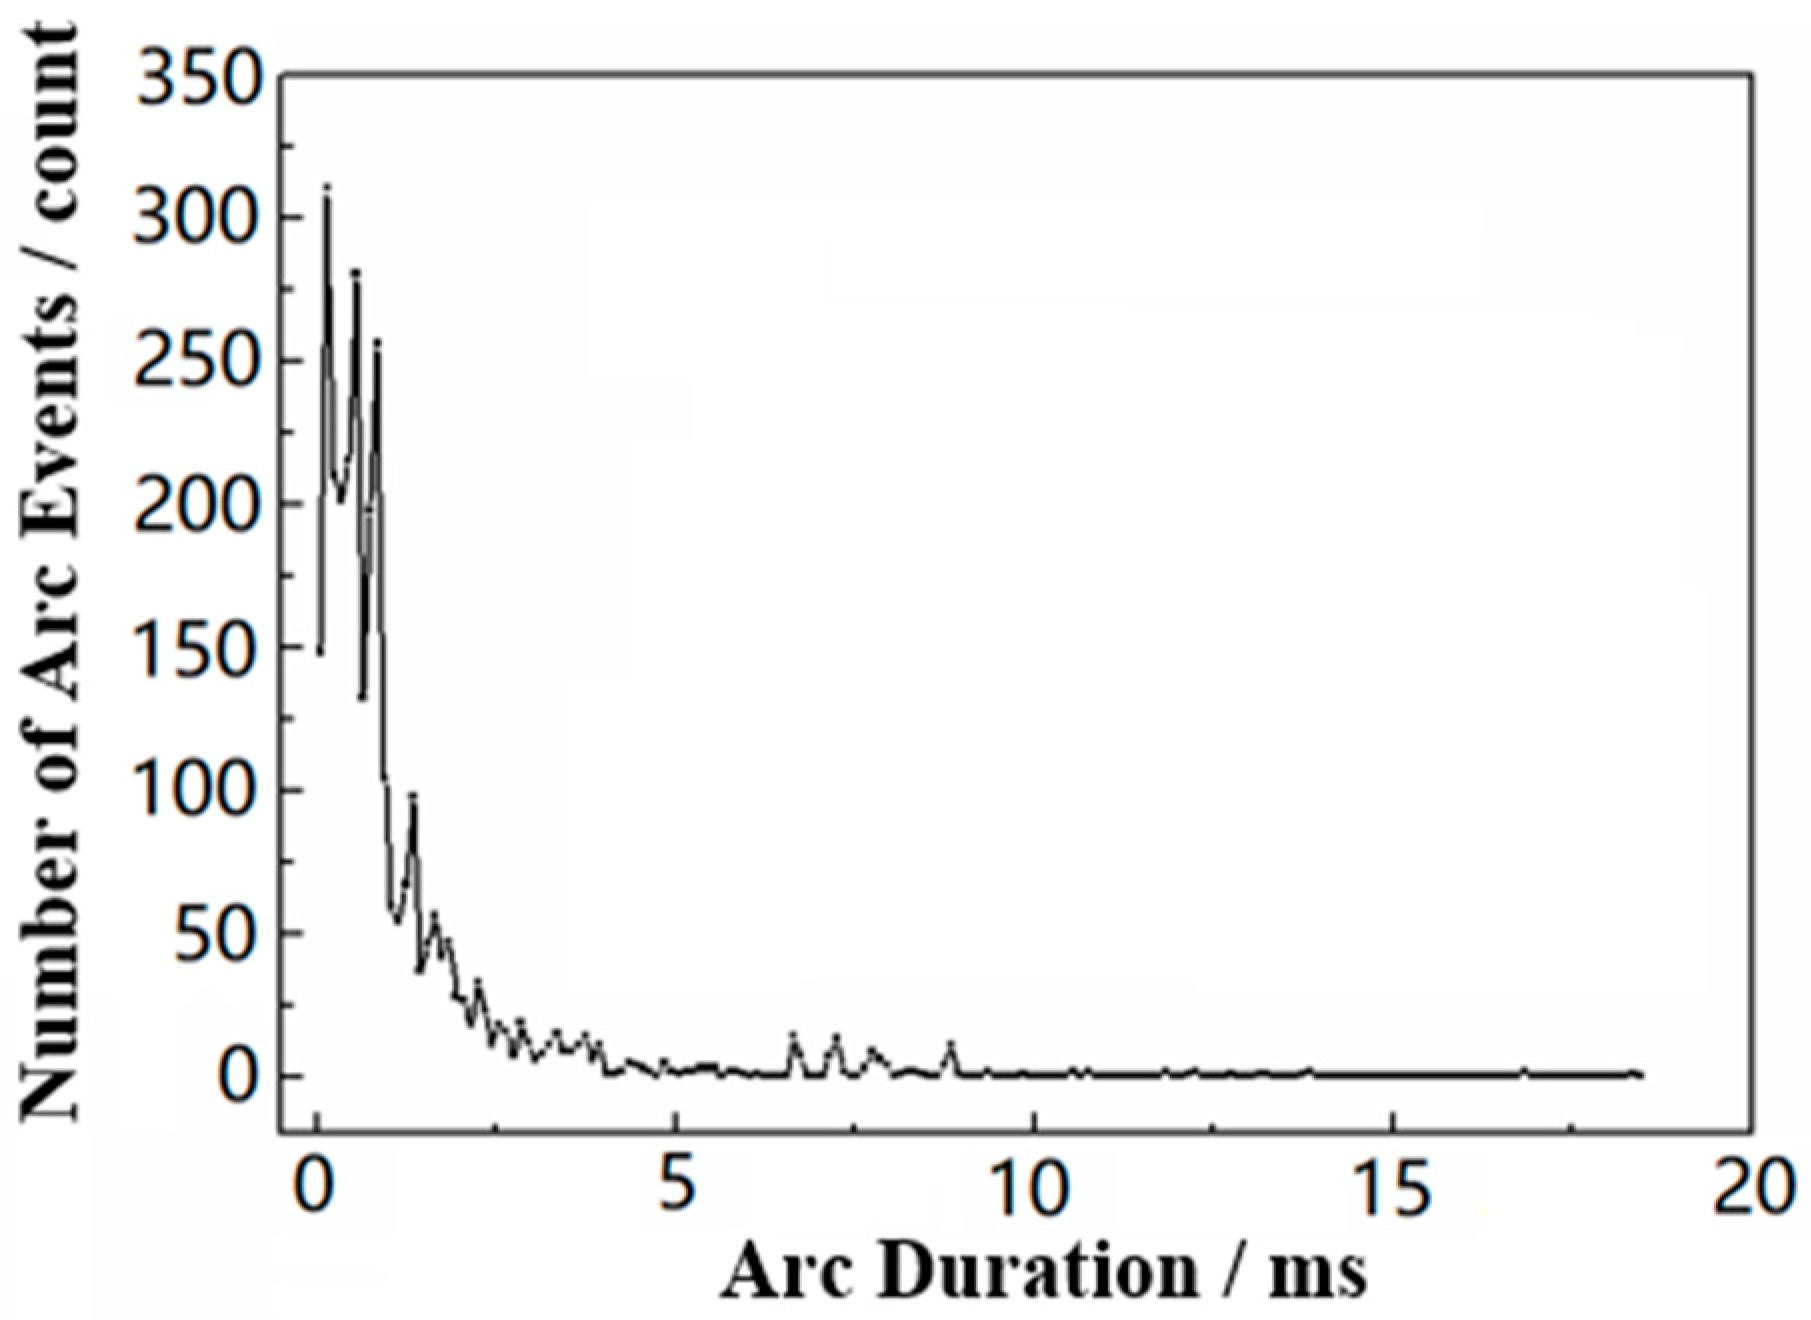
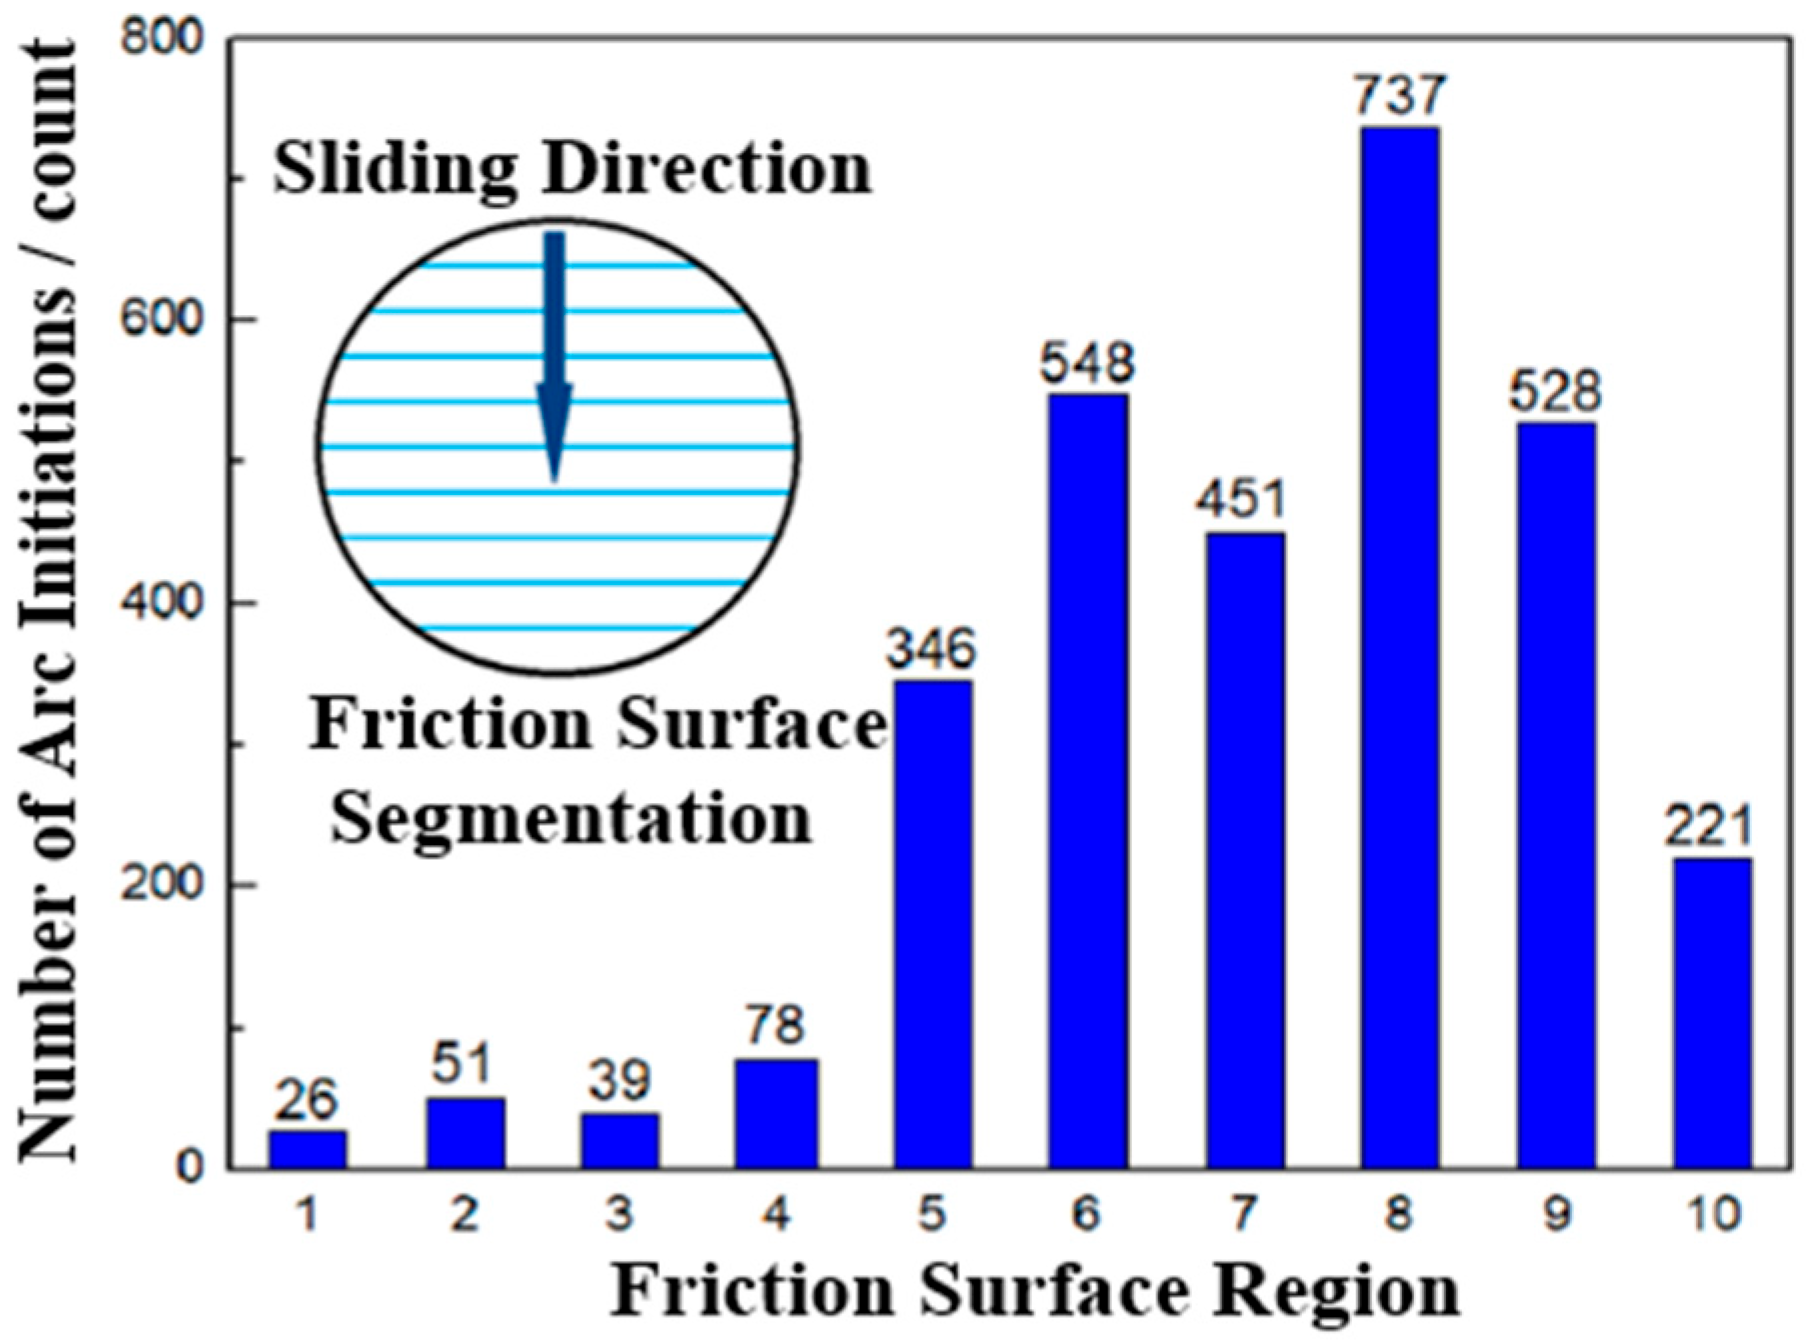
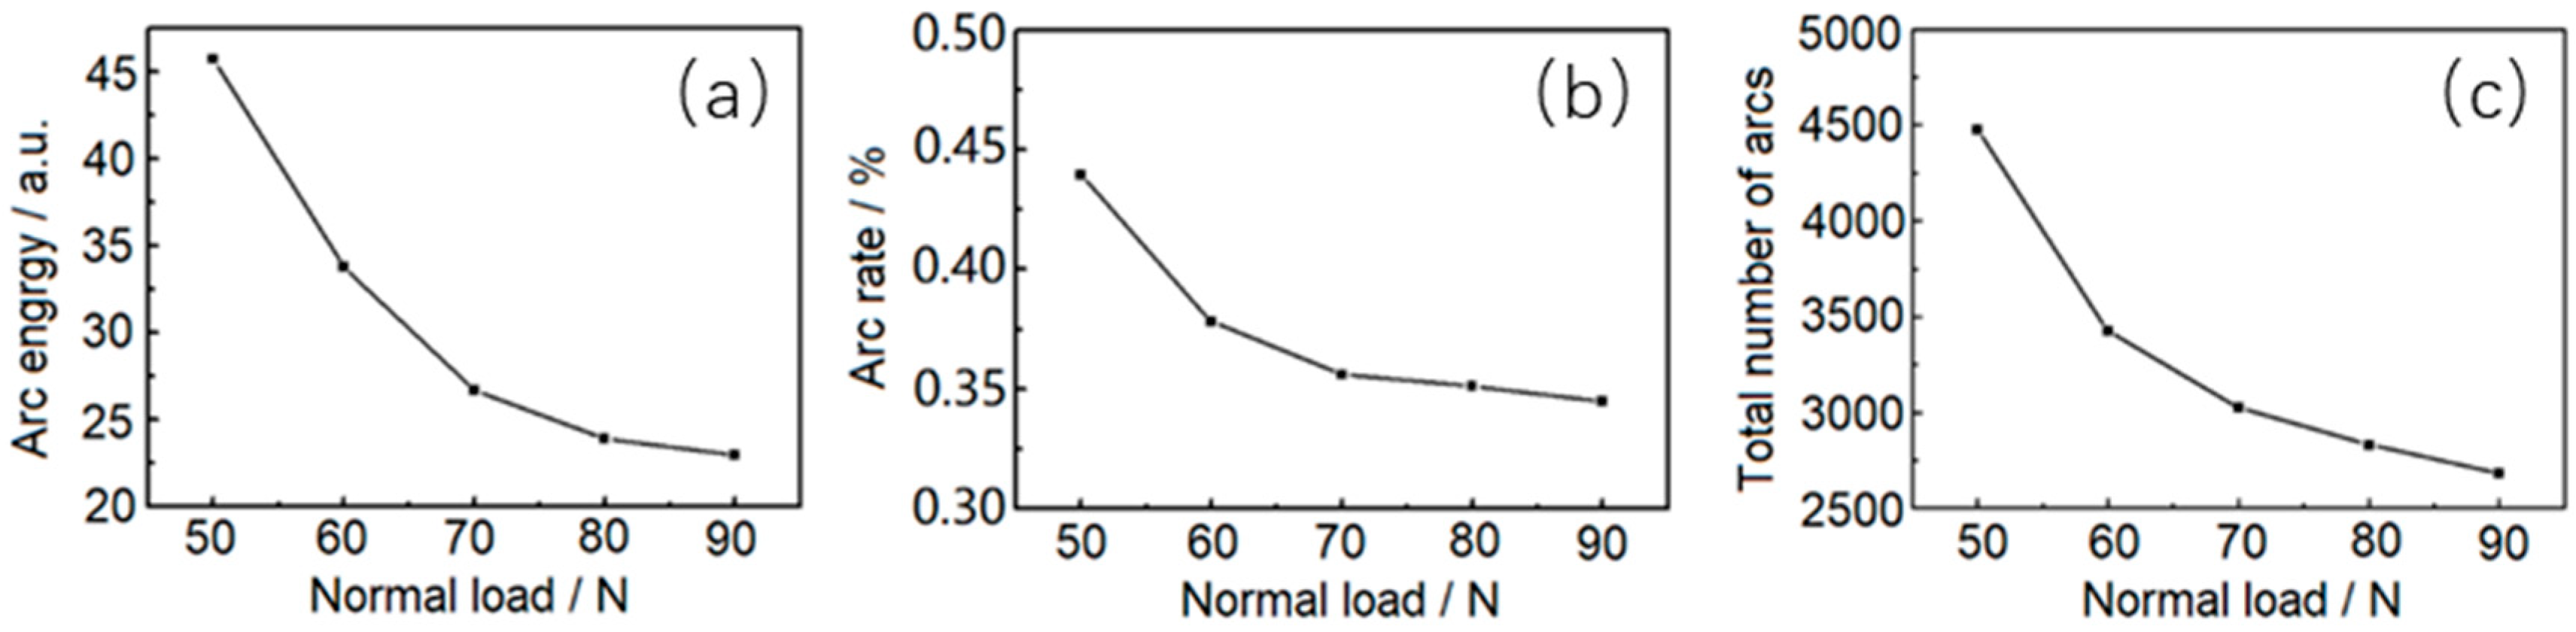
3.2. Arc Under Different Normal Load Conditions
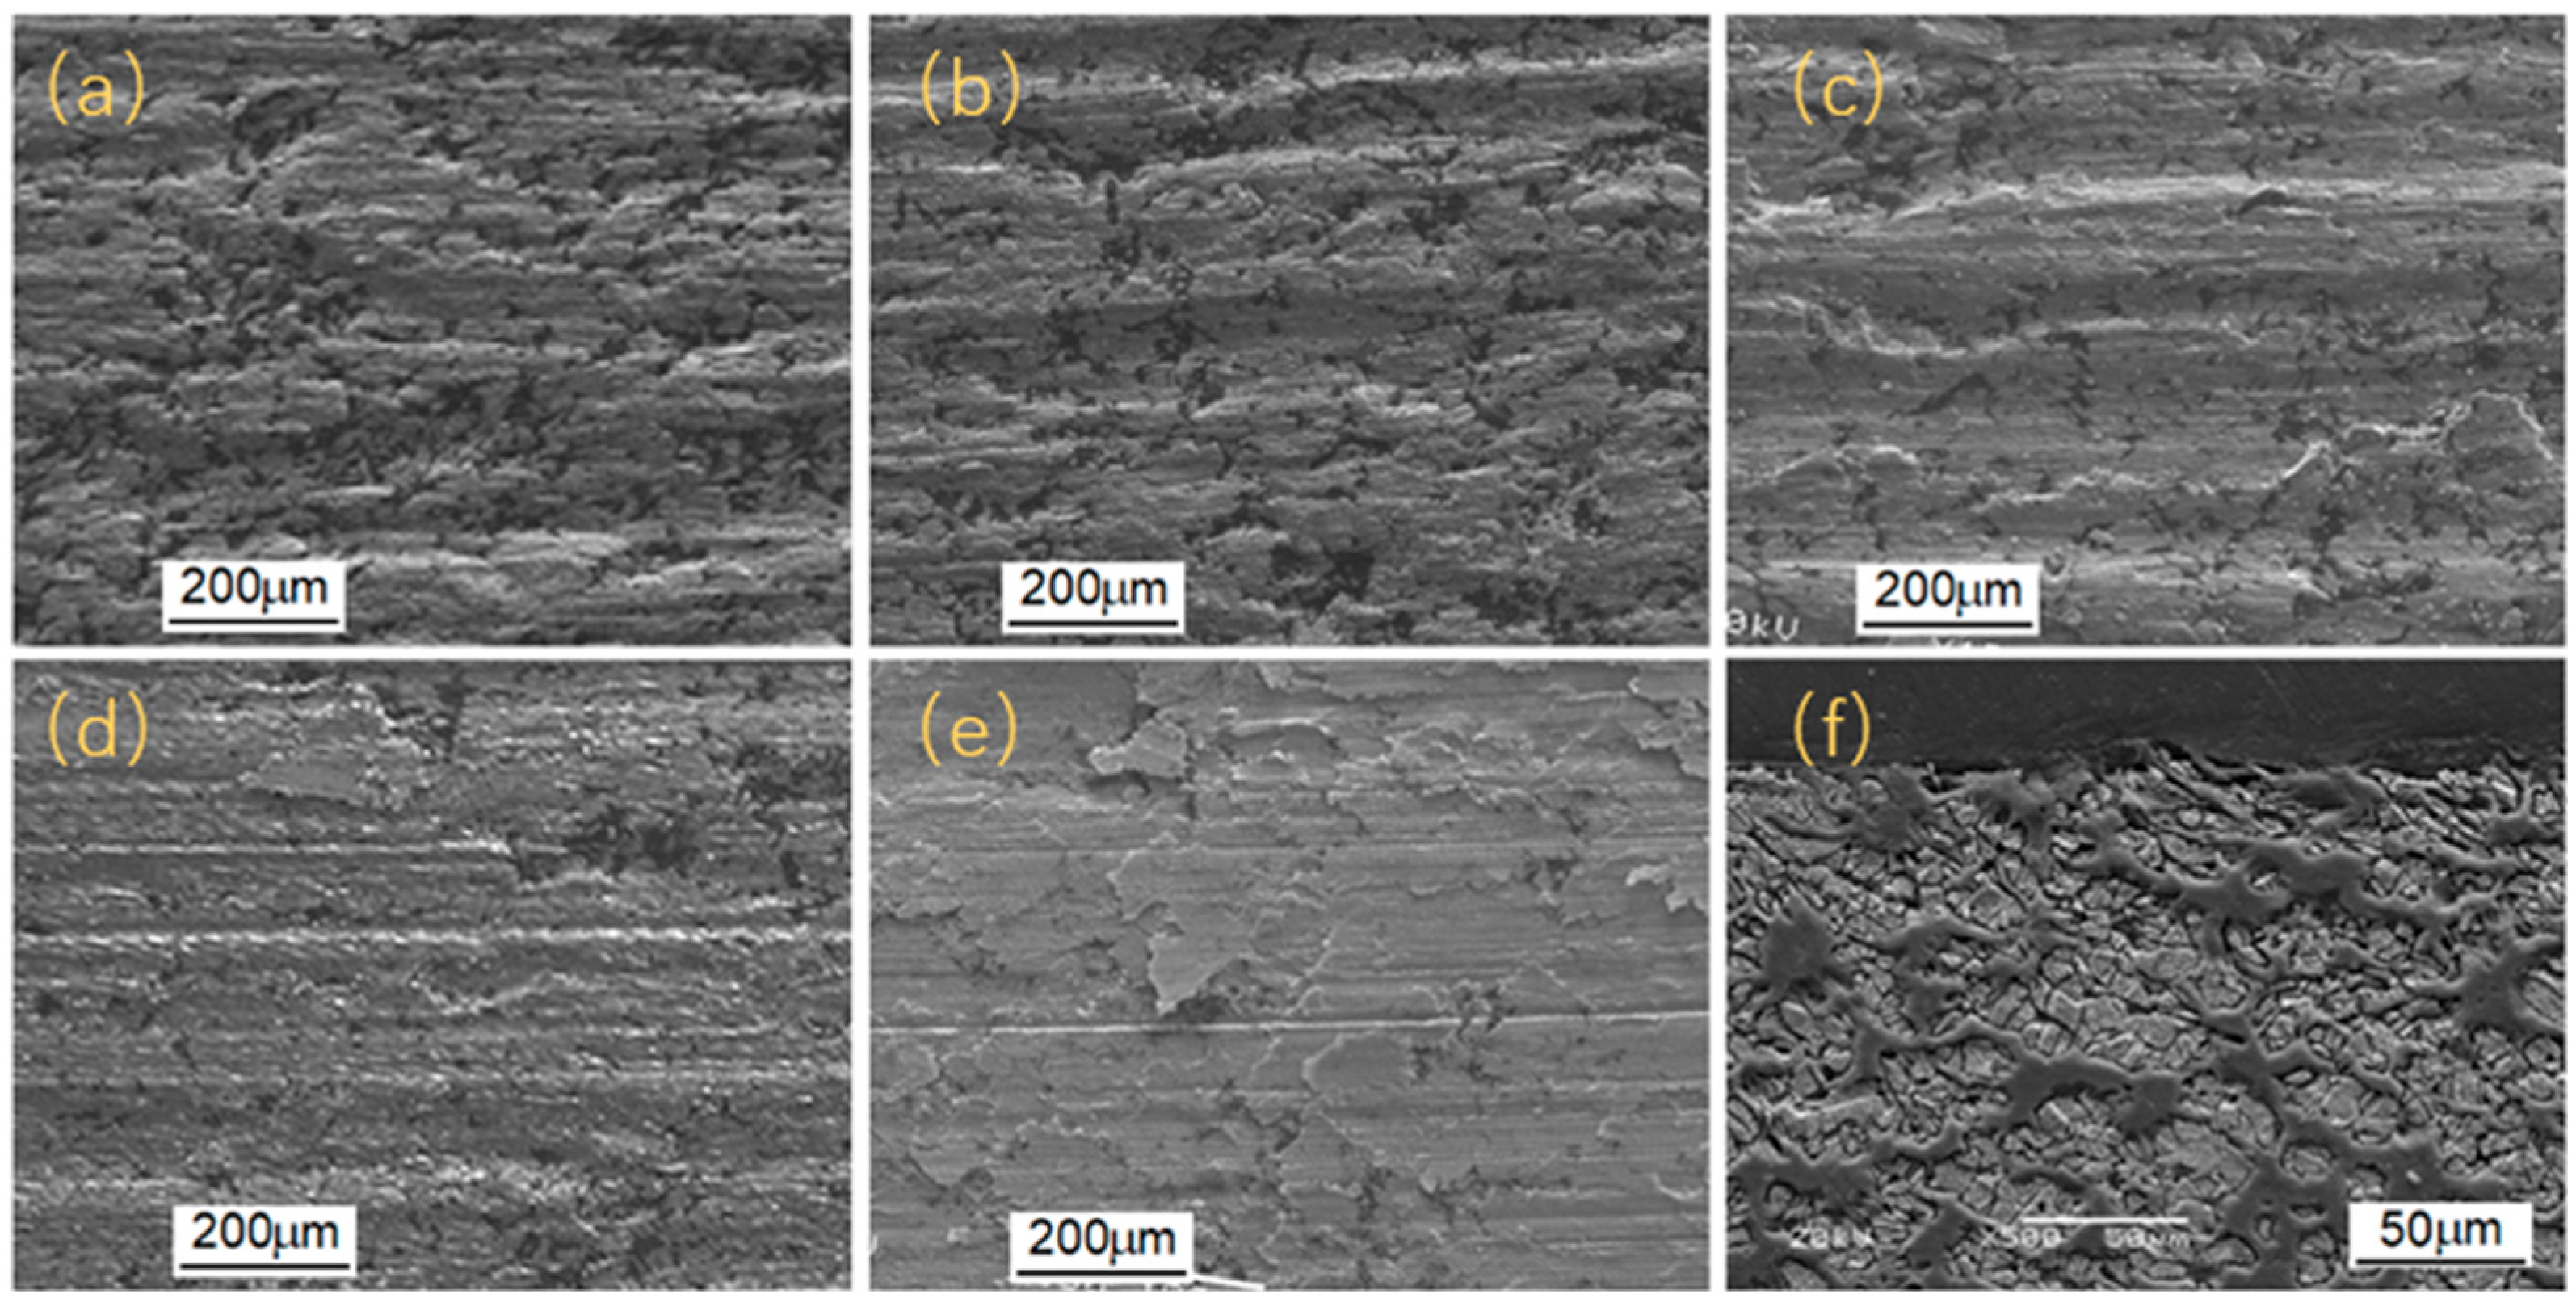
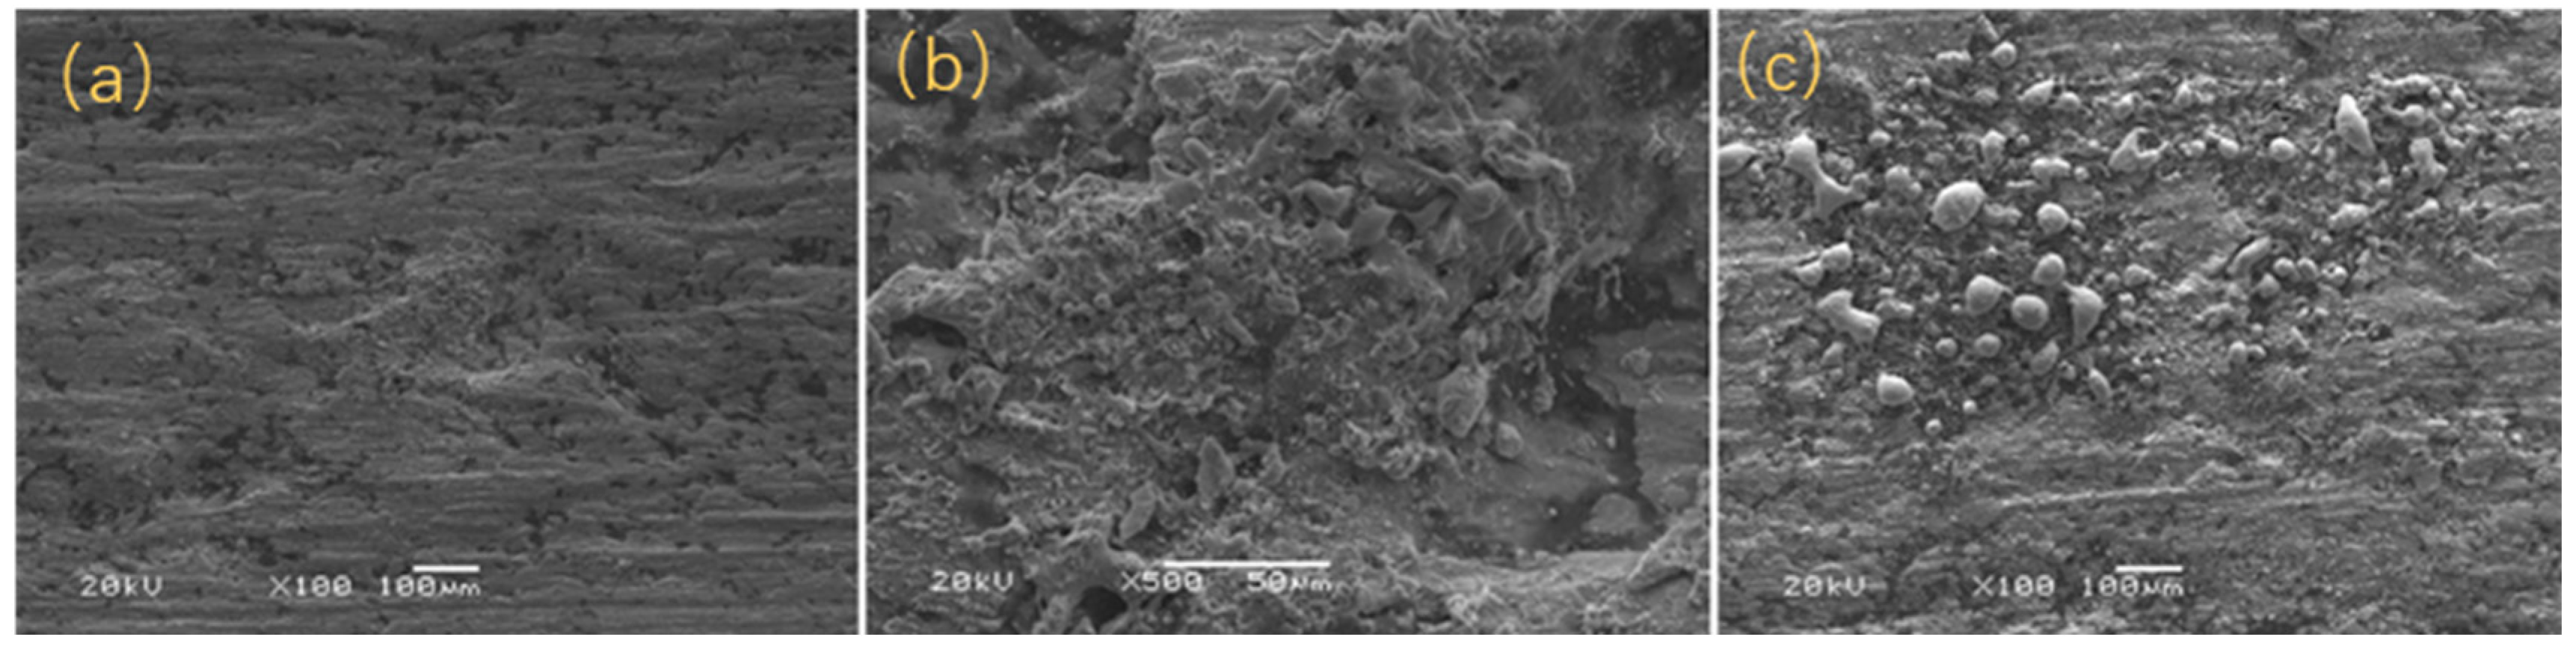
3.3. Material Damage During the Current-Carrying Friction Process
4. Discussions
5. Conclusions
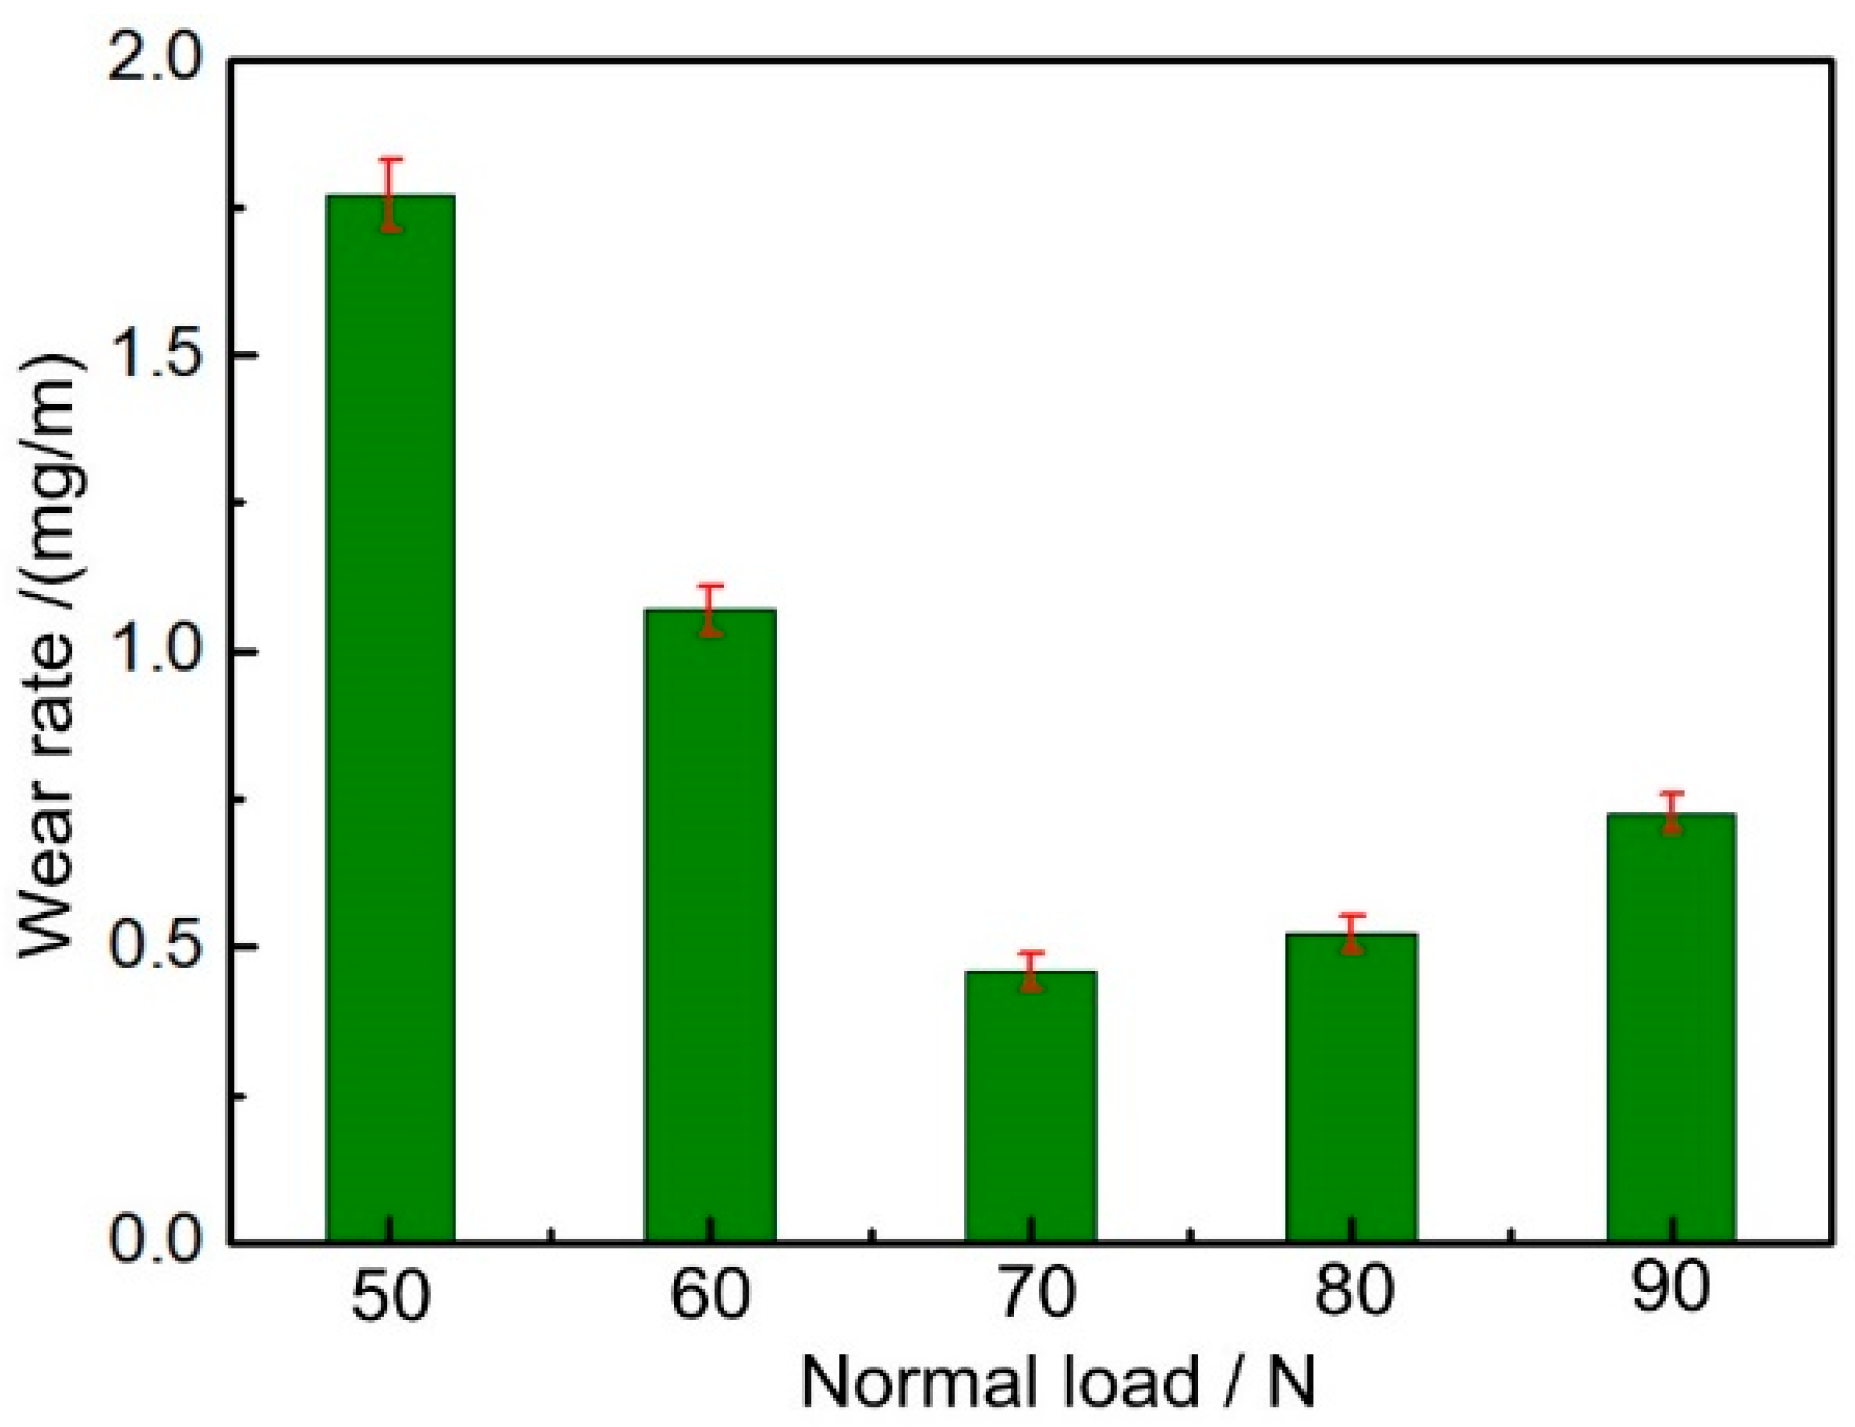
- Under the test conditions, the wear rate initially decreased rapidly and then increased gradually with increasing normal load. The current-carrying efficiency and stability of the friction pair remained high, fluctuating slightly within a narrow range. A normal load of 70 N was identified as optimal, primarily based on the minimum wear rate observed (approximately 0.46 mg/m).
- Material damage consisted of mechanical wear, characterized by plowing and plastic deformation, and arc erosion, marked by localized melting and splattering. With increasing normal load, arc erosion gradually decreased while mechanical damage intensified. The overall damage was minimized at 70 N.
- Arc erosion led to pronounced spatial non-uniformity on the worn surface. Particular attention should be paid to high-energy arcs—those with high current and long burning duration—due to their potential to cause severe localized damage.
Author Contributions
Funding
Data Availability Statement
Conflicts of Interest
References
- Ma, X.; He, G.; He, D.; Chen, C.; Hu, Z. Sliding wear behavior of copper–graphite composite material for use in maglev transportation system. Wear 2008, 265, 1087–1092. [Google Scholar] [CrossRef]
- Zhou, T.; Dai, J.; Xiao, Z.; Qiu, W.-T.; Lei, Q.; Liu, X.; Qin, L.; Ma, M. Interface Microstructure and Tribological Behaviors of Copper Matrix Composites with High Graphite Content Prepared by Short-Process Reduction and Vacuum Hot Pressing. JOM 2022, 74, 2094–2105. [Google Scholar] [CrossRef]
- Yang, Z.; Song, Y.; Jiao, J.; Li, W.; Shangguan, B.; Zhang, Y. Optimization of current-carrying friction and wear properties of copper-carbon composite materials based on damage. Tribol. Int. 2023, 191, 109074. [Google Scholar] [CrossRef]
- Wang, N.; Wang, C.; Xu, W.; Cheng, W.; Wu, H.; Li, H. Friction and Wear Performances and Mechanisms of Graphite/Copper Composites Under Electrical Contact in Marine Environments. Materials 2025, 18, 1516. [Google Scholar] [CrossRef]
- Yasar, I.; Canakci, A.; Arslan, F. The effect of brush spring pressure on the wear behaviour of copper–graphite brushes with electrical current. Tribol. Int. 2007, 40, 1381–1386. [Google Scholar] [CrossRef]
- Xie, X.-L.; Zhang, L.; Xiao, J.-K.; Qian, Z.-Y.; Zhang, T.; Zhou, K.-C. Sliding electrical contact behavior of AuAgCu brush on Au plating. Trans. Nonferrous Met. Soc. China 2015, 25, 3029–3036. [Google Scholar] [CrossRef]
- Huang, Z.; Zhai, H.; Li, M.; Liu, X.; Zhou, Y. Friction behaviors and effects on current-carrying wear characteristics of bulk Ti3AlC2. Tribol. Trans. 2014, 57, 300–307. [Google Scholar] [CrossRef]
- Liu, S.; Feng, Y.; Xu, X. Research on Current-carrying Wear Characteristics of Pantograph Friction Pair. Control Eng. China 2023, 30, 148–153. [Google Scholar]
- Hui, Y.; Liu, G.; Yan, T.; Liu, M. Effect of Loads on the Current-Carrying Tribological Property of Mo Coating Deposited by Supersonic Plasma Spraying Technique. Mater. Prot. 2019, 52, 1–8. [Google Scholar] [CrossRef]
- Song, Y.; Yang, Z.; Jiao, J.; Li, W.; Zhao, M.; Shangguan, B.; Zhang, Y. Research on damage optimization of copper-carbon gradient composite materials for current-carrying friction. Tribol. Int. 2024, 195, 109635. [Google Scholar] [CrossRef]
- Grandin, M.; Wiklund, U. Wear phenomena and tribofilm formation of copper/copper-graphite sliding electrical contact ma-terials. Wear 2018, 398–399, 227–235. [Google Scholar] [CrossRef]
- Lu, J.; Ma, C.; Zhang, L.; He, Z.; Guo, B.; Wei, J.; Zeng, D.; Li, W.; Liu, Y. Effect of normal load on damage mechanism of gradient copper-graphite composites under electric current. Wear 2024, 562–563, 205653. [Google Scholar] [CrossRef]
- Simonelli, M.; Tuck, C.; Aboulkhair, N.T.; Maskery, I.; Ashcroft, I.; Wildman, R.D.; Hague, R. A Study on the Laser Spatter and the Oxidation Reactions During Selective Laser Melting of 316L Stainless Steel, Al-Si10-Mg, and Ti-6Al-4V. Met. Mater. Trans. A 2015, 46, 3842–3851. [Google Scholar] [CrossRef]
- Lu, J.; Zheng, B.; Guo, B.; Wang, Y.; Li, W.; Liu, Y. The current-carrying damage mechanism of gradient copper-based composite ceramics with different sliding speeds. Ceram. Int. 2024, 51, 3837–3845. [Google Scholar] [CrossRef]
- Liu, J.; Sun, K.; Zeng, L.; Wang, J.; Xiao, X.; Liu, J.; Guo, C.; Ding, Y. Microstructure and Properties of Copper–Graphite Composites Fabricated by Spark Plasma Sintering Based on Two-Step Mixing. Metals 2020, 10, 1506. [Google Scholar] [CrossRef]
- Zhong, B.; Wang, Y.; Yu, Z.; Li, F.; Ding, C. Effect of TiB2Content on Microstructure and Friction Properties of TiB2/Graphite-copper. J. Netshape Form. Eng. 2025, 17, 183–191. [Google Scholar] [CrossRef]
- Zhu, L.; Yi, M.; Wang, L.; Chen, S. Effects of foam copper on the mechanical properties and tribological properties of graph-ite/copper composites. Tribol. Int. 2020, 148, 106164. [Google Scholar] [CrossRef]
- Liu, Y.; Li, H.; Zheng, B.; Zhang, Y.; Li, W. Current-Carrying Tribological Properties of Cu-Coated Graphite-Copper Composites with Different Current Densities. Copp. Eng. 2023, 1, 75–81. [Google Scholar] [CrossRef]
- Hu, M.-J.; Liu, X.-L.; Zhou, C.-W.; Wang, D.-Y.; Xiao, Q.; Guan, X.; Zhang, S.; Xu, Z.-B. Comparative study of the current-carrying tribological properties of carbon graphite composites with different hardnesses. Int. J. Mech. Sci. 2023, 245, 108133. [Google Scholar] [CrossRef]
- Simarro, M.; Postigo, S.; Casanueva, C.; Rodríguez-Tembleque, L.; Castillo, J.J. of main operating conditions on contact wire wear of rigid catenary lines. Tribol. Int. 2024, 196, 109708. [Google Scholar] [CrossRef]
- Mei, G.; Fu, W.; Chen, G.; Zhang, W. Effect of high-density current on the wear of carbon sliders against Cu–Ag wires. Wear 2020, 452–453, 203275. [Google Scholar] [CrossRef]
- Mahdavinejad, R.A.; Khajeafzali, M. Fabrication and experimental investigation of arc erosion behavior in W/Cu functionally graded composites. Proc. Inst. Mech. Eng. Part B J. Eng. Manuf. 2020, 235, 394–405. [Google Scholar] [CrossRef]
- Kou, G.; Guo, L.-J.; Li, H.-J. Effect of copper on the heat erosion mechanism of carbon/carbon composites. J. Alloys Compd. 2017, 723, 1132–1141. [Google Scholar] [CrossRef]
- Huang, L.; Yang, H.; Yuan, F. Fundamentals of Analog Electronic Technology; China Machine Press: Beijing, China, 2023. [Google Scholar]


| Regions | 50 N | 60 N | 70 N | 80 N | 90 N |
|---|---|---|---|---|---|
| Front region | 5.88 | 4.63 | 5.93 | 7.06 | 5.44 |
| Rear region | 40.18 | 26.10 | 35.34 | 29.78 | 15.05 |
Disclaimer/Publisher’s Note: The statements, opinions and data contained in all publications are solely those of the individual author(s) and contributor(s) and not of MDPI and/or the editor(s). MDPI and/or the editor(s) disclaim responsibility for any injury to people or property resulting from any ideas, methods, instructions or products referred to in the content. |
© 2025 by the authors. Licensee MDPI, Basel, Switzerland. This article is an open access article distributed under the terms and conditions of the Creative Commons Attribution (CC BY) license (https://creativecommons.org/licenses/by/4.0/).
Share and Cite
Yang, Z.; Zhao, M.; Wang, X.; Hu, K.; Tian, X.; Zhang, Y. Effect of Normal Load on the Current-Carrying Friction Performance of Copper–10% Graphite Composites. Coatings 2025, 15, 714. https://doi.org/10.3390/coatings15060714
Yang Z, Zhao M, Wang X, Hu K, Tian X, Zhang Y. Effect of Normal Load on the Current-Carrying Friction Performance of Copper–10% Graphite Composites. Coatings. 2025; 15(6):714. https://doi.org/10.3390/coatings15060714
Chicago/Turabian StyleYang, Zhenghai, Mengfeng Zhao, Xiaowei Wang, Kaifeng Hu, Xiaojun Tian, and Yongzhen Zhang. 2025. "Effect of Normal Load on the Current-Carrying Friction Performance of Copper–10% Graphite Composites" Coatings 15, no. 6: 714. https://doi.org/10.3390/coatings15060714
APA StyleYang, Z., Zhao, M., Wang, X., Hu, K., Tian, X., & Zhang, Y. (2025). Effect of Normal Load on the Current-Carrying Friction Performance of Copper–10% Graphite Composites. Coatings, 15(6), 714. https://doi.org/10.3390/coatings15060714