
Investigation of Tensile Properties at Room and Elevated Temperatures of S1100QL Steel and Its Welded Joints


 ,
,
Abstract
1. Introduction
2. Materials and Methods
2.1. Base Material
2.2. Introduction to Welding S1100QLl
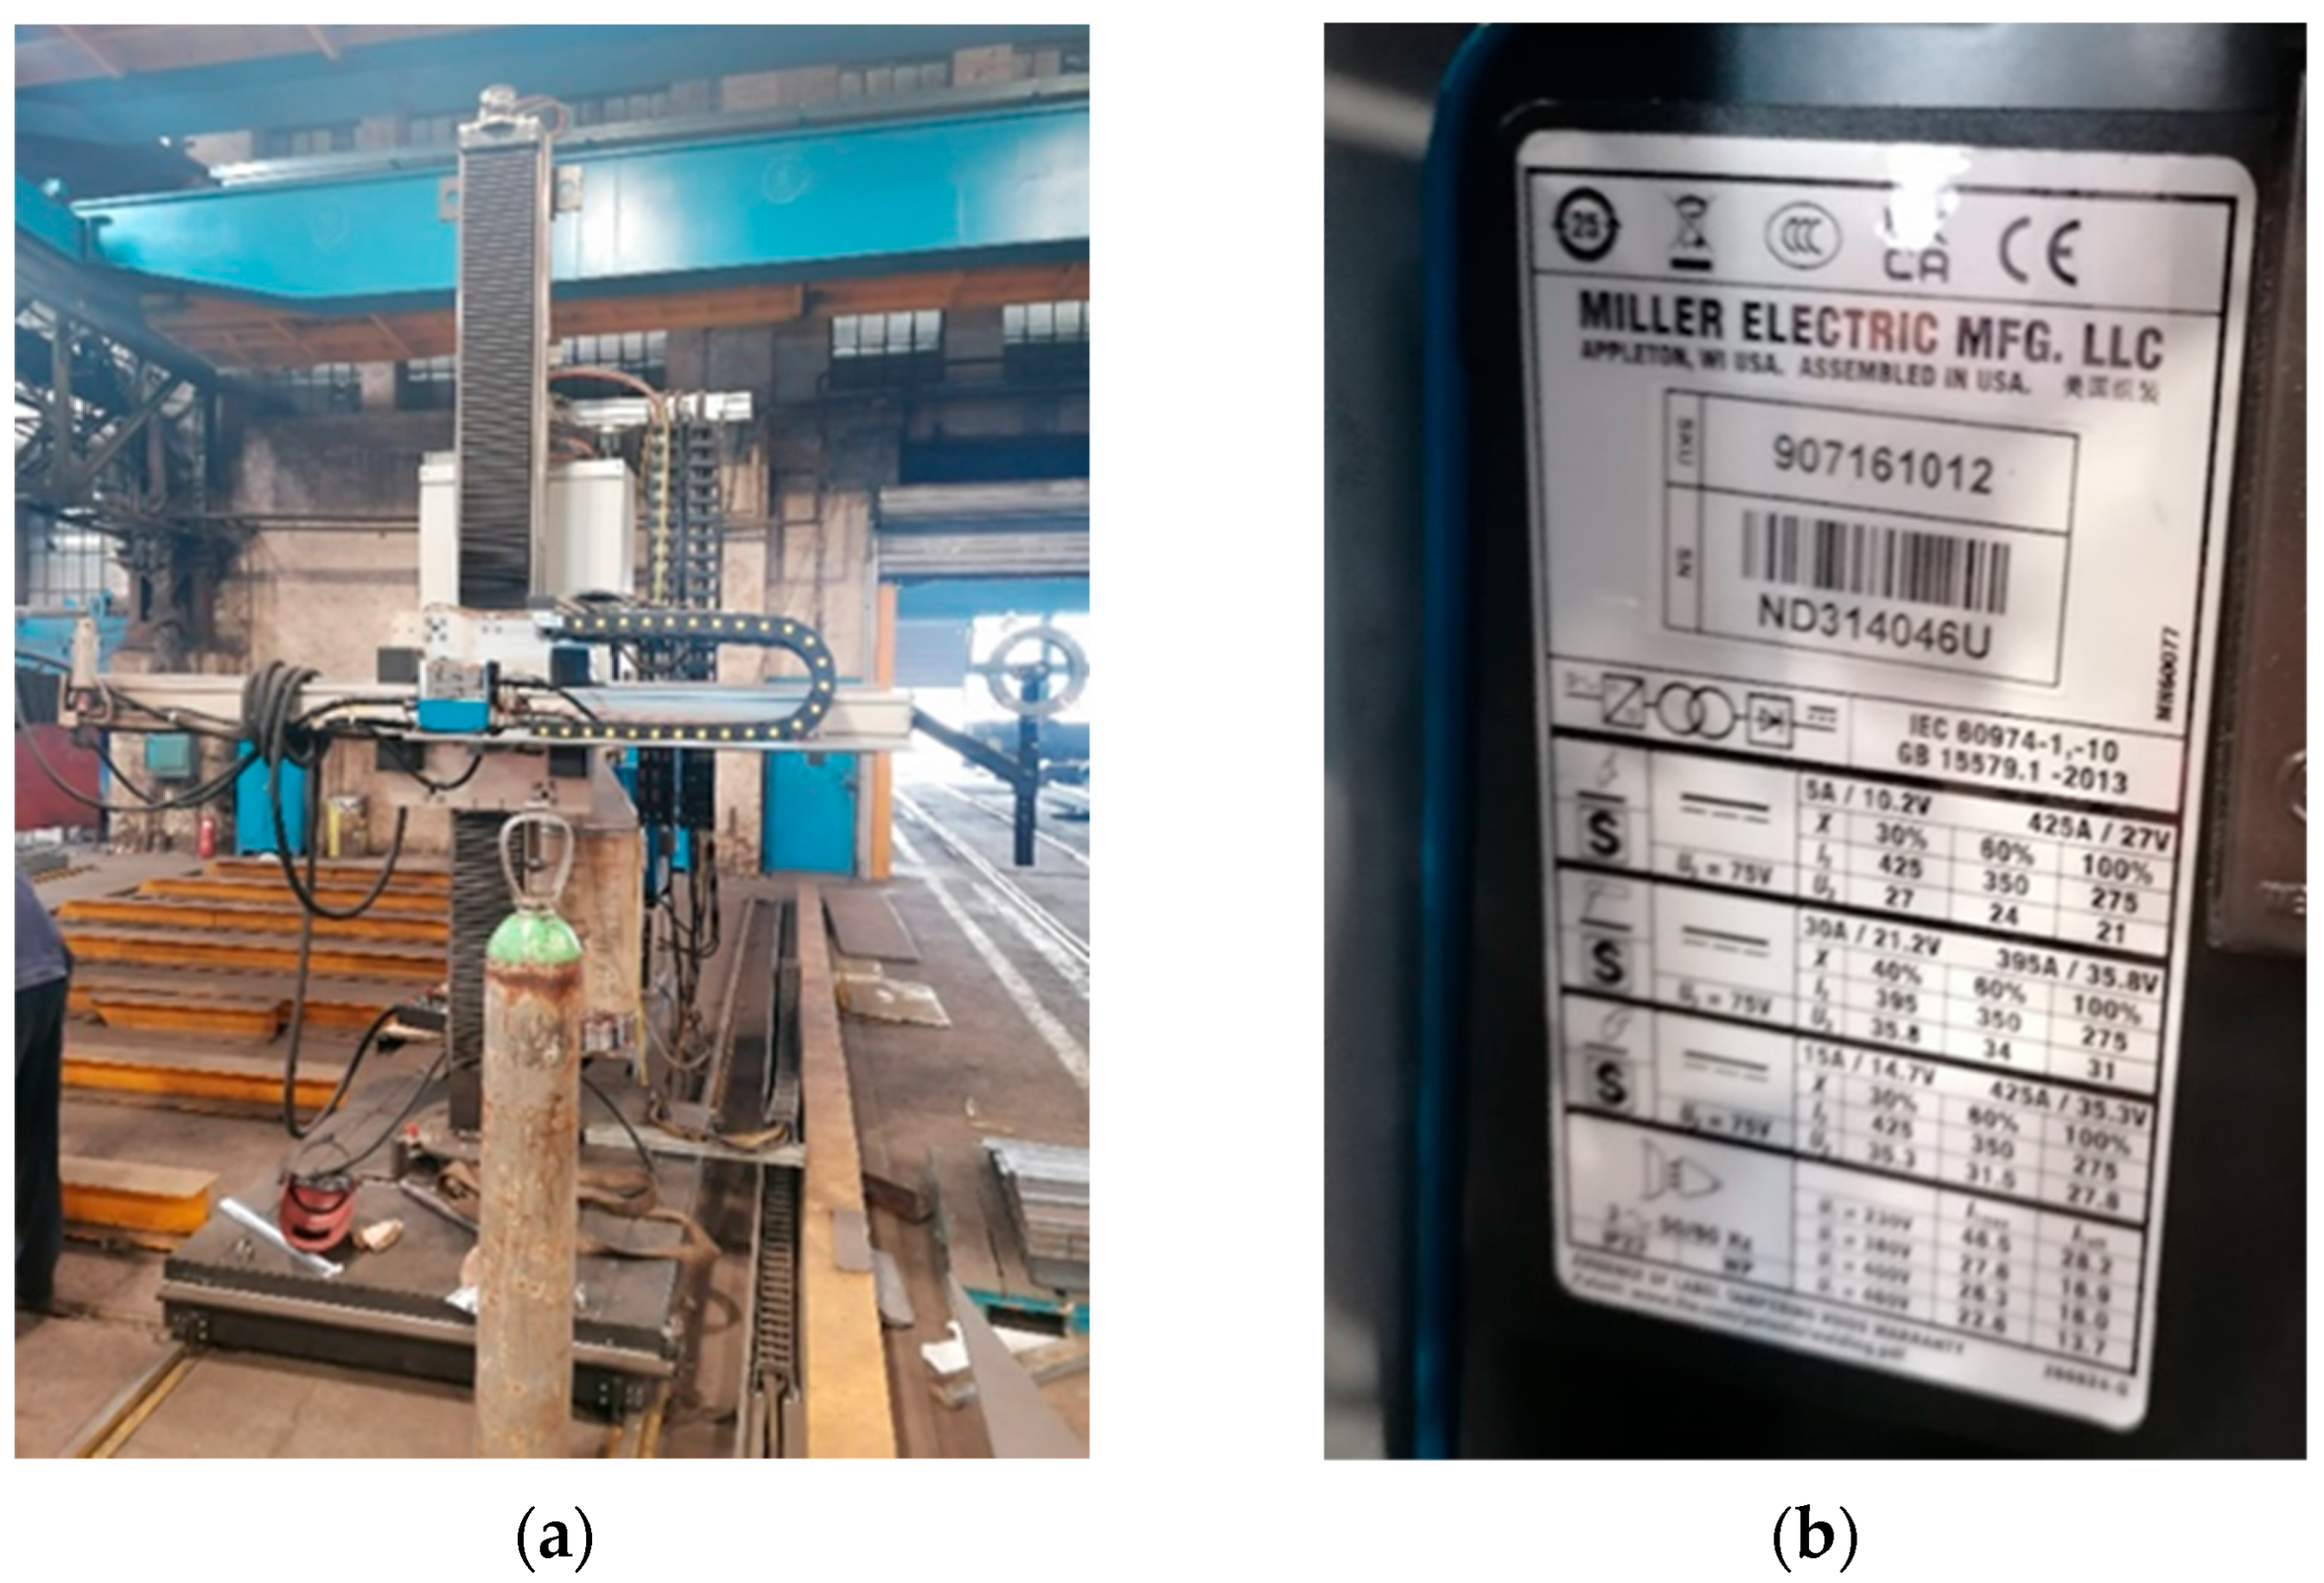
2.3. Welding Equipment
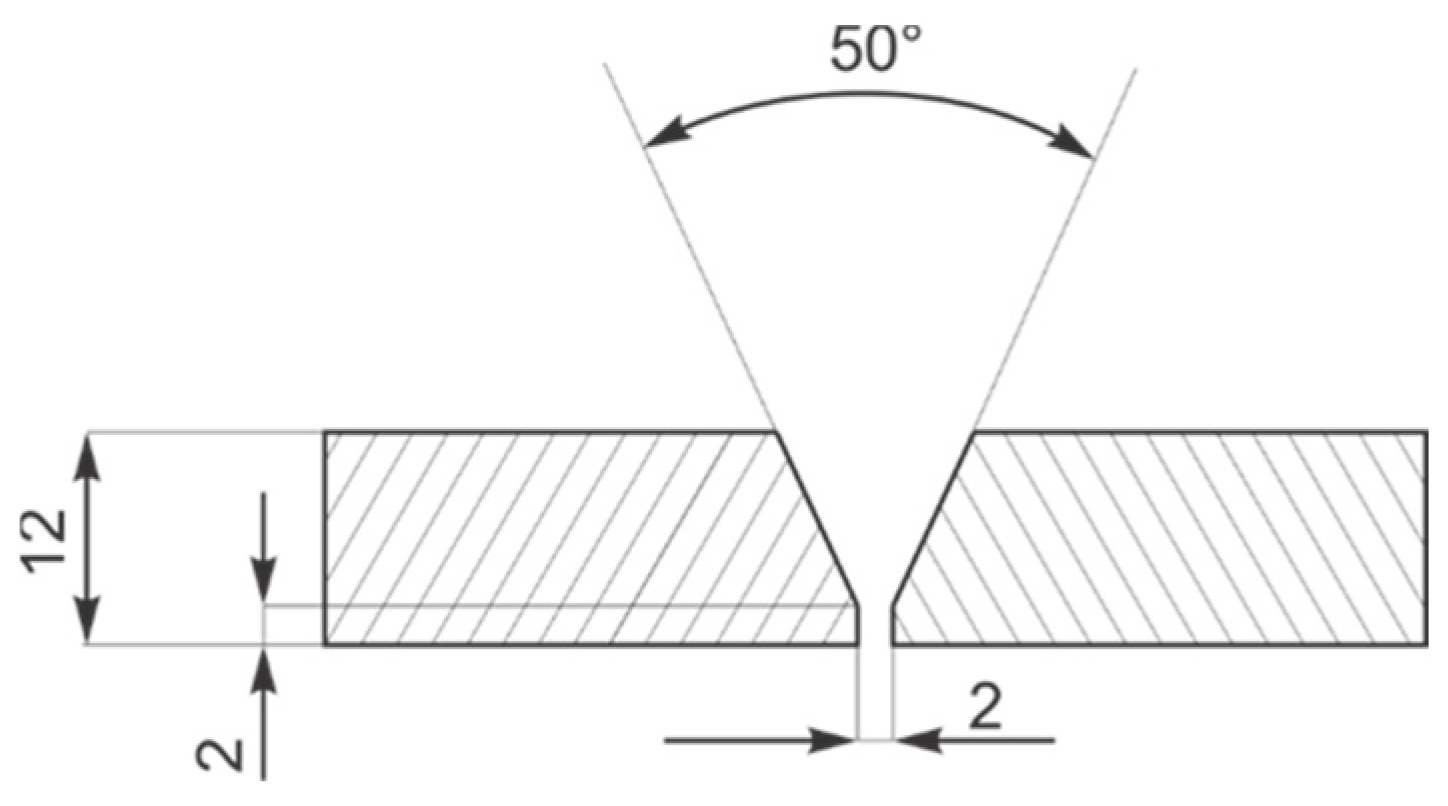
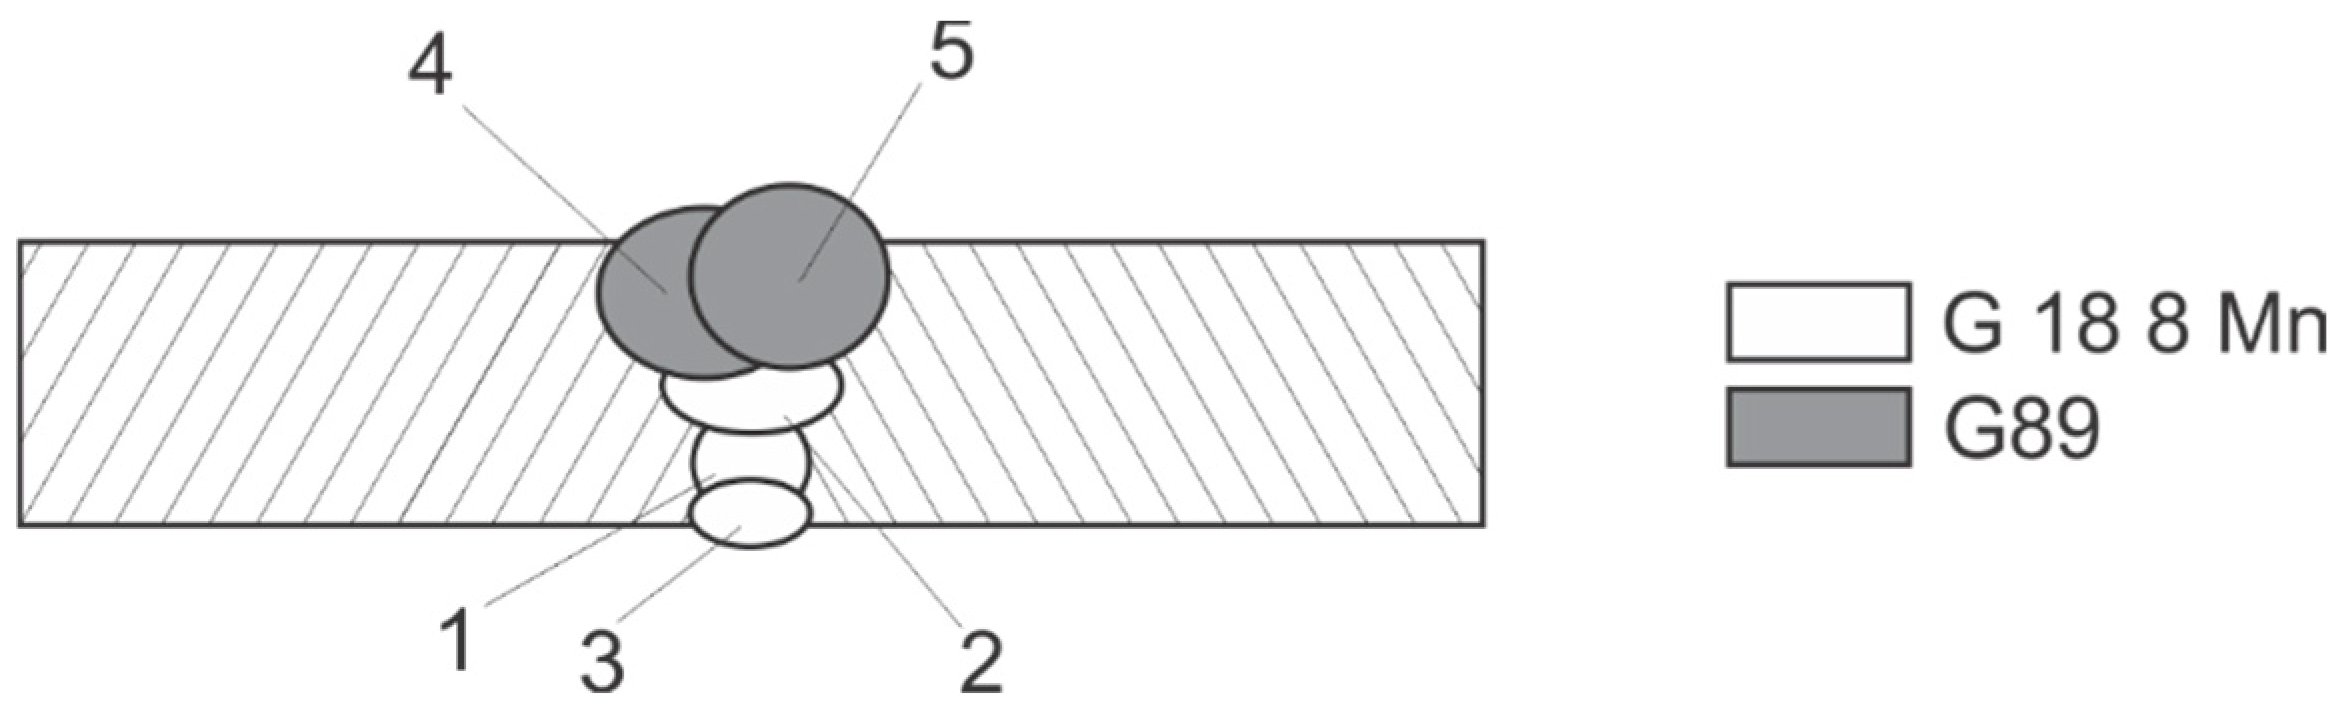
2.4. Welding Technology A
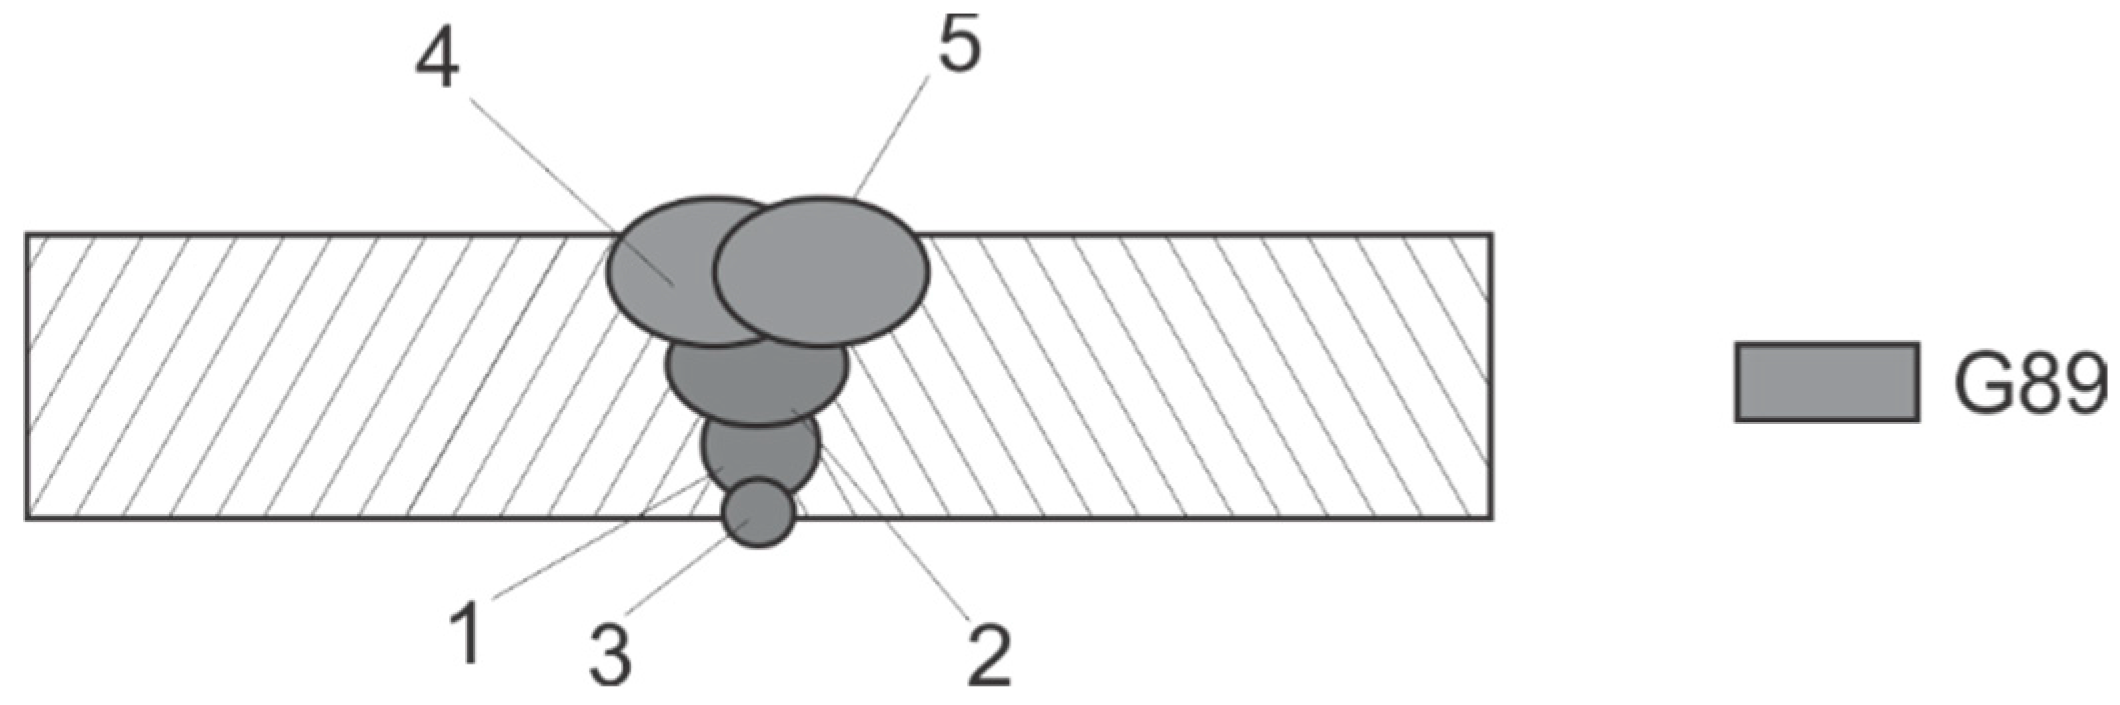
2.5. Welding Technology B
2.6. Testing
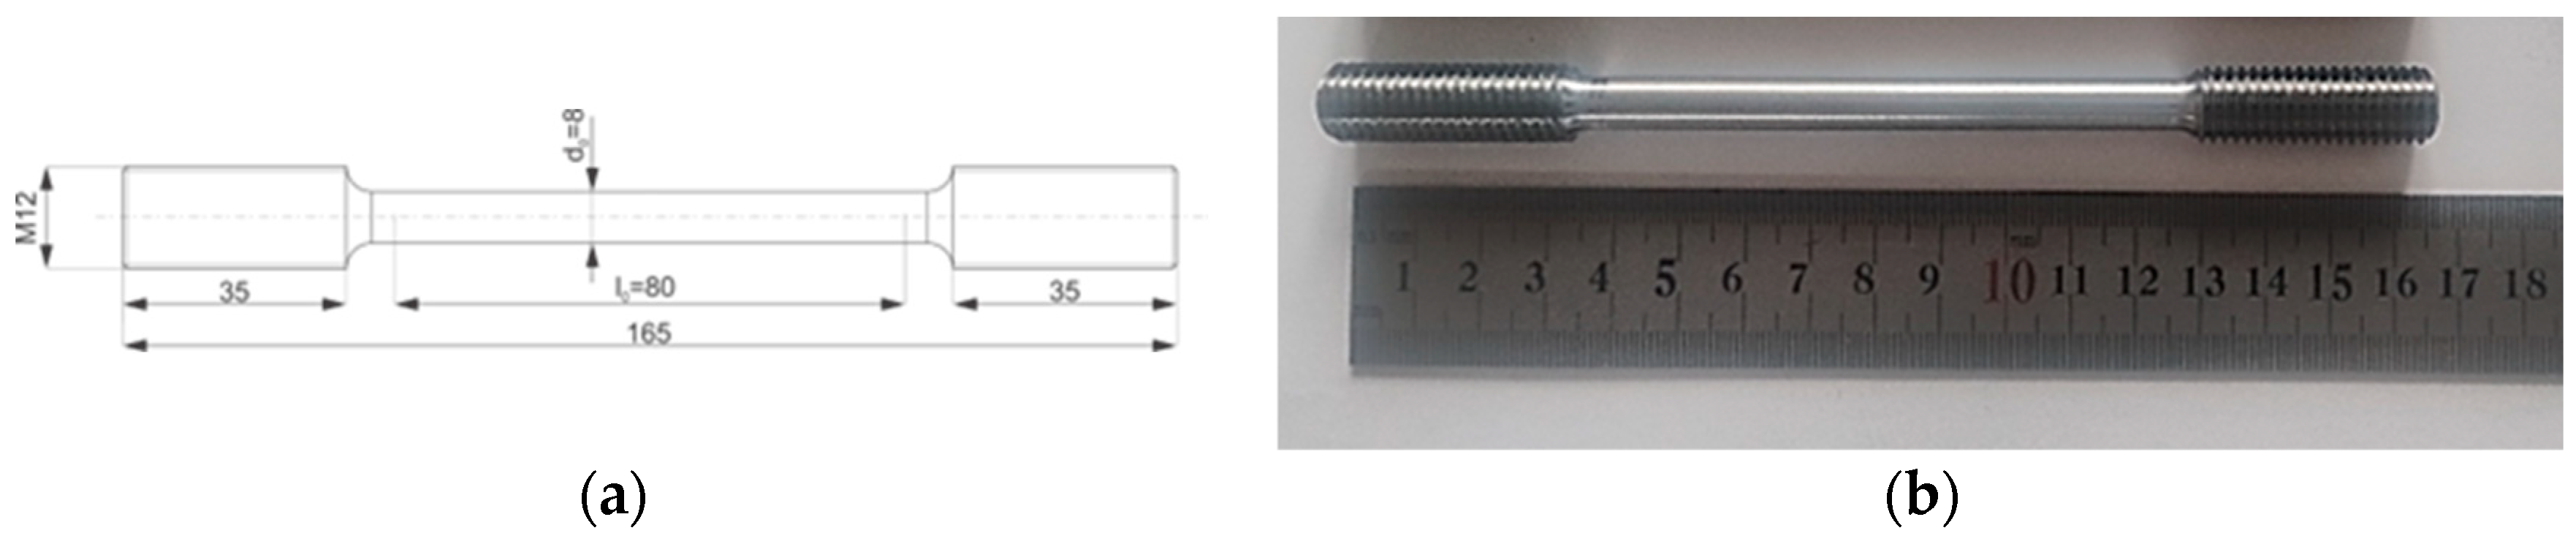
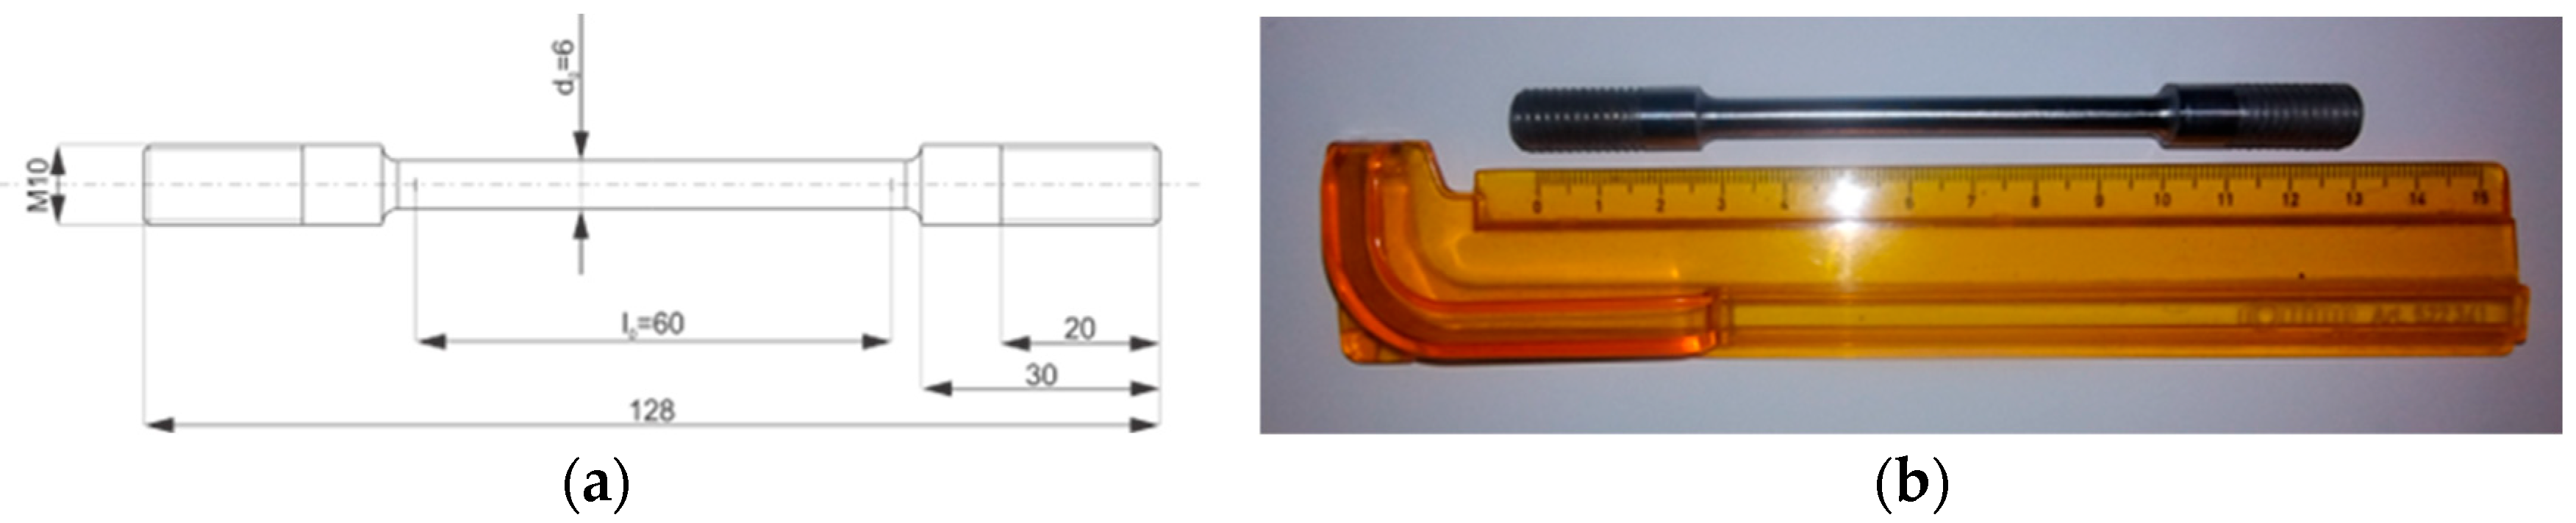
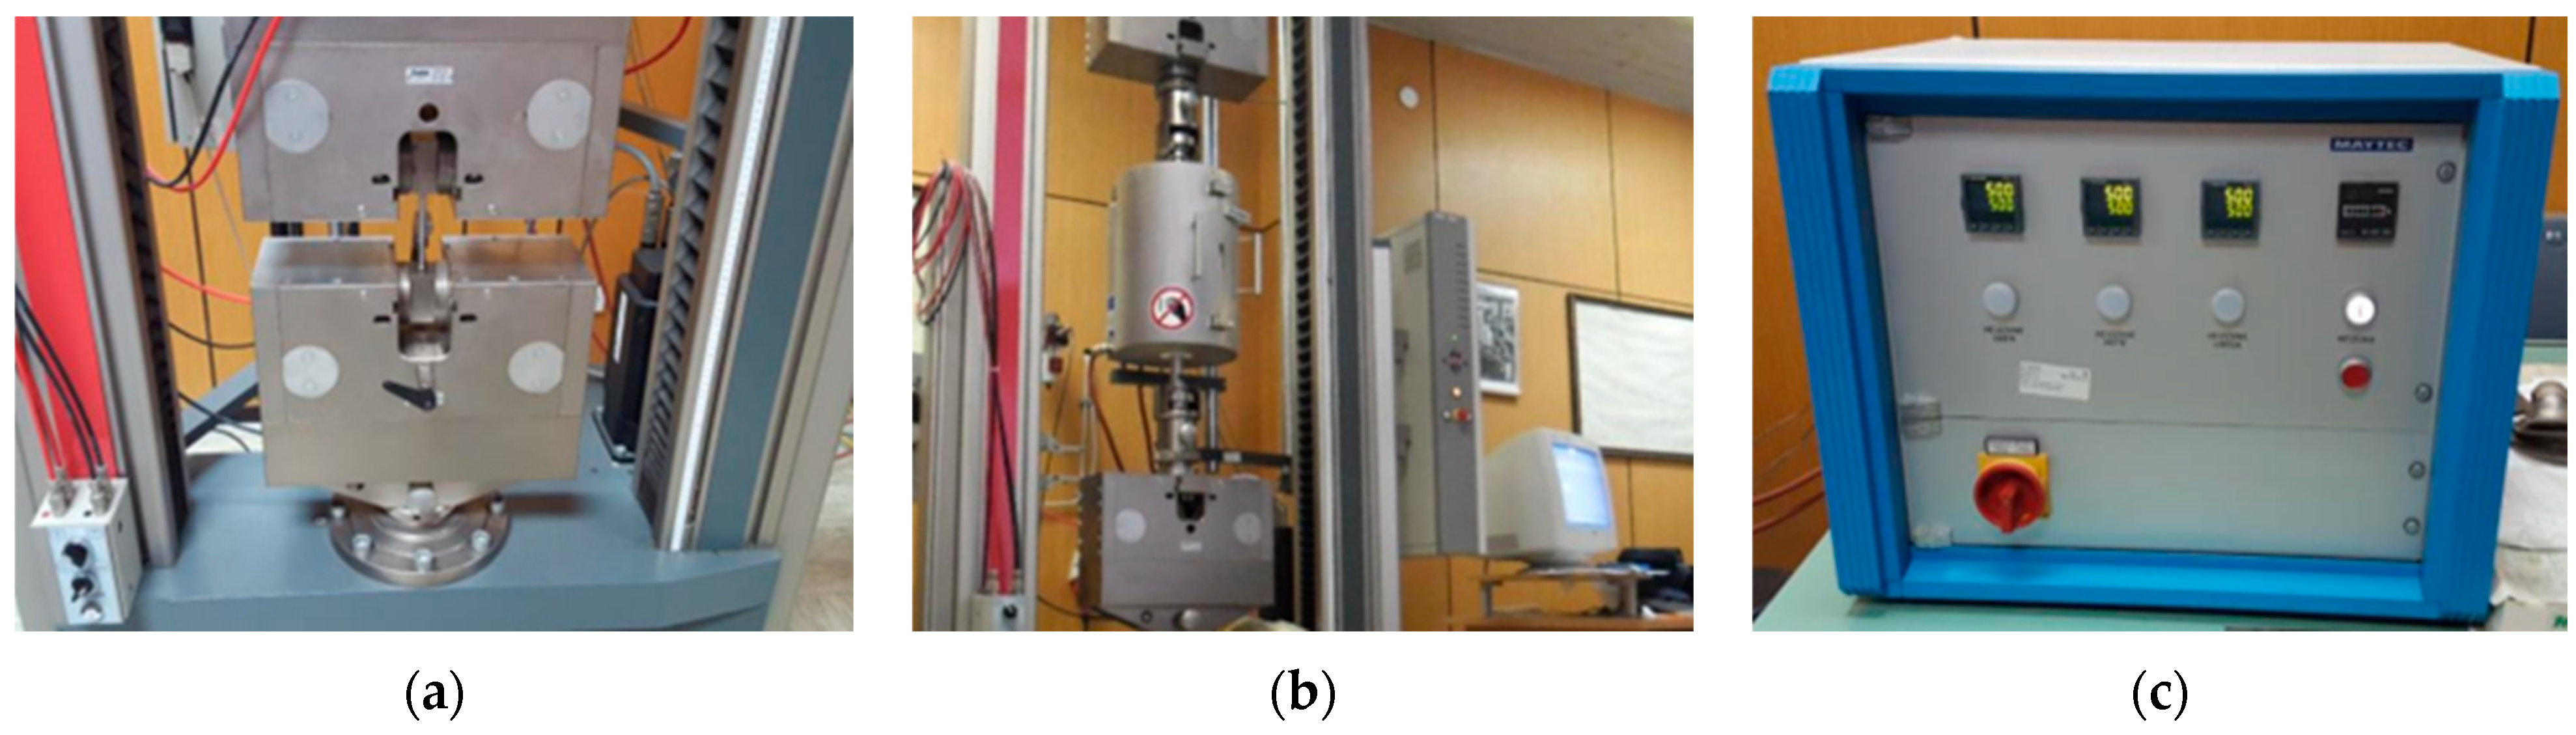
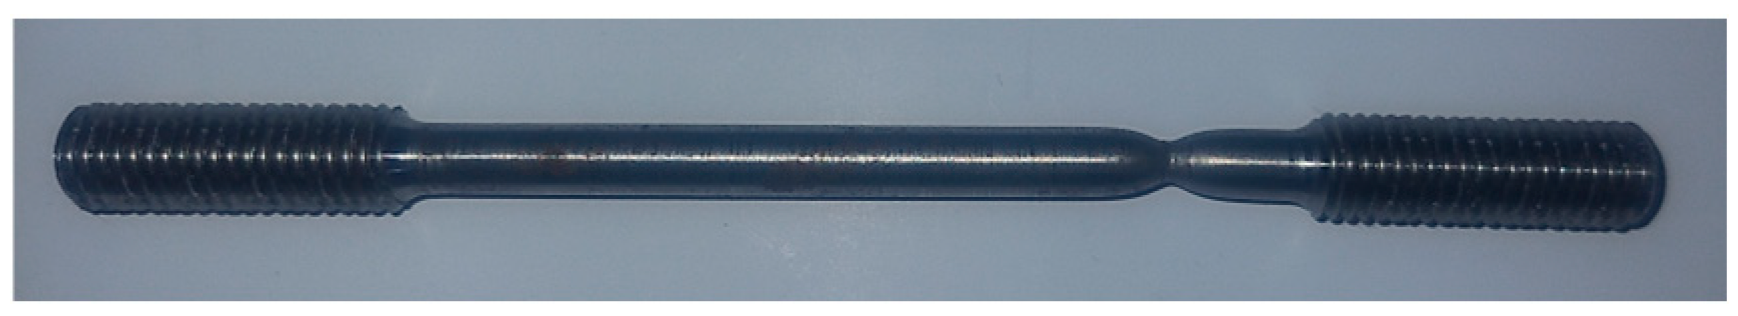
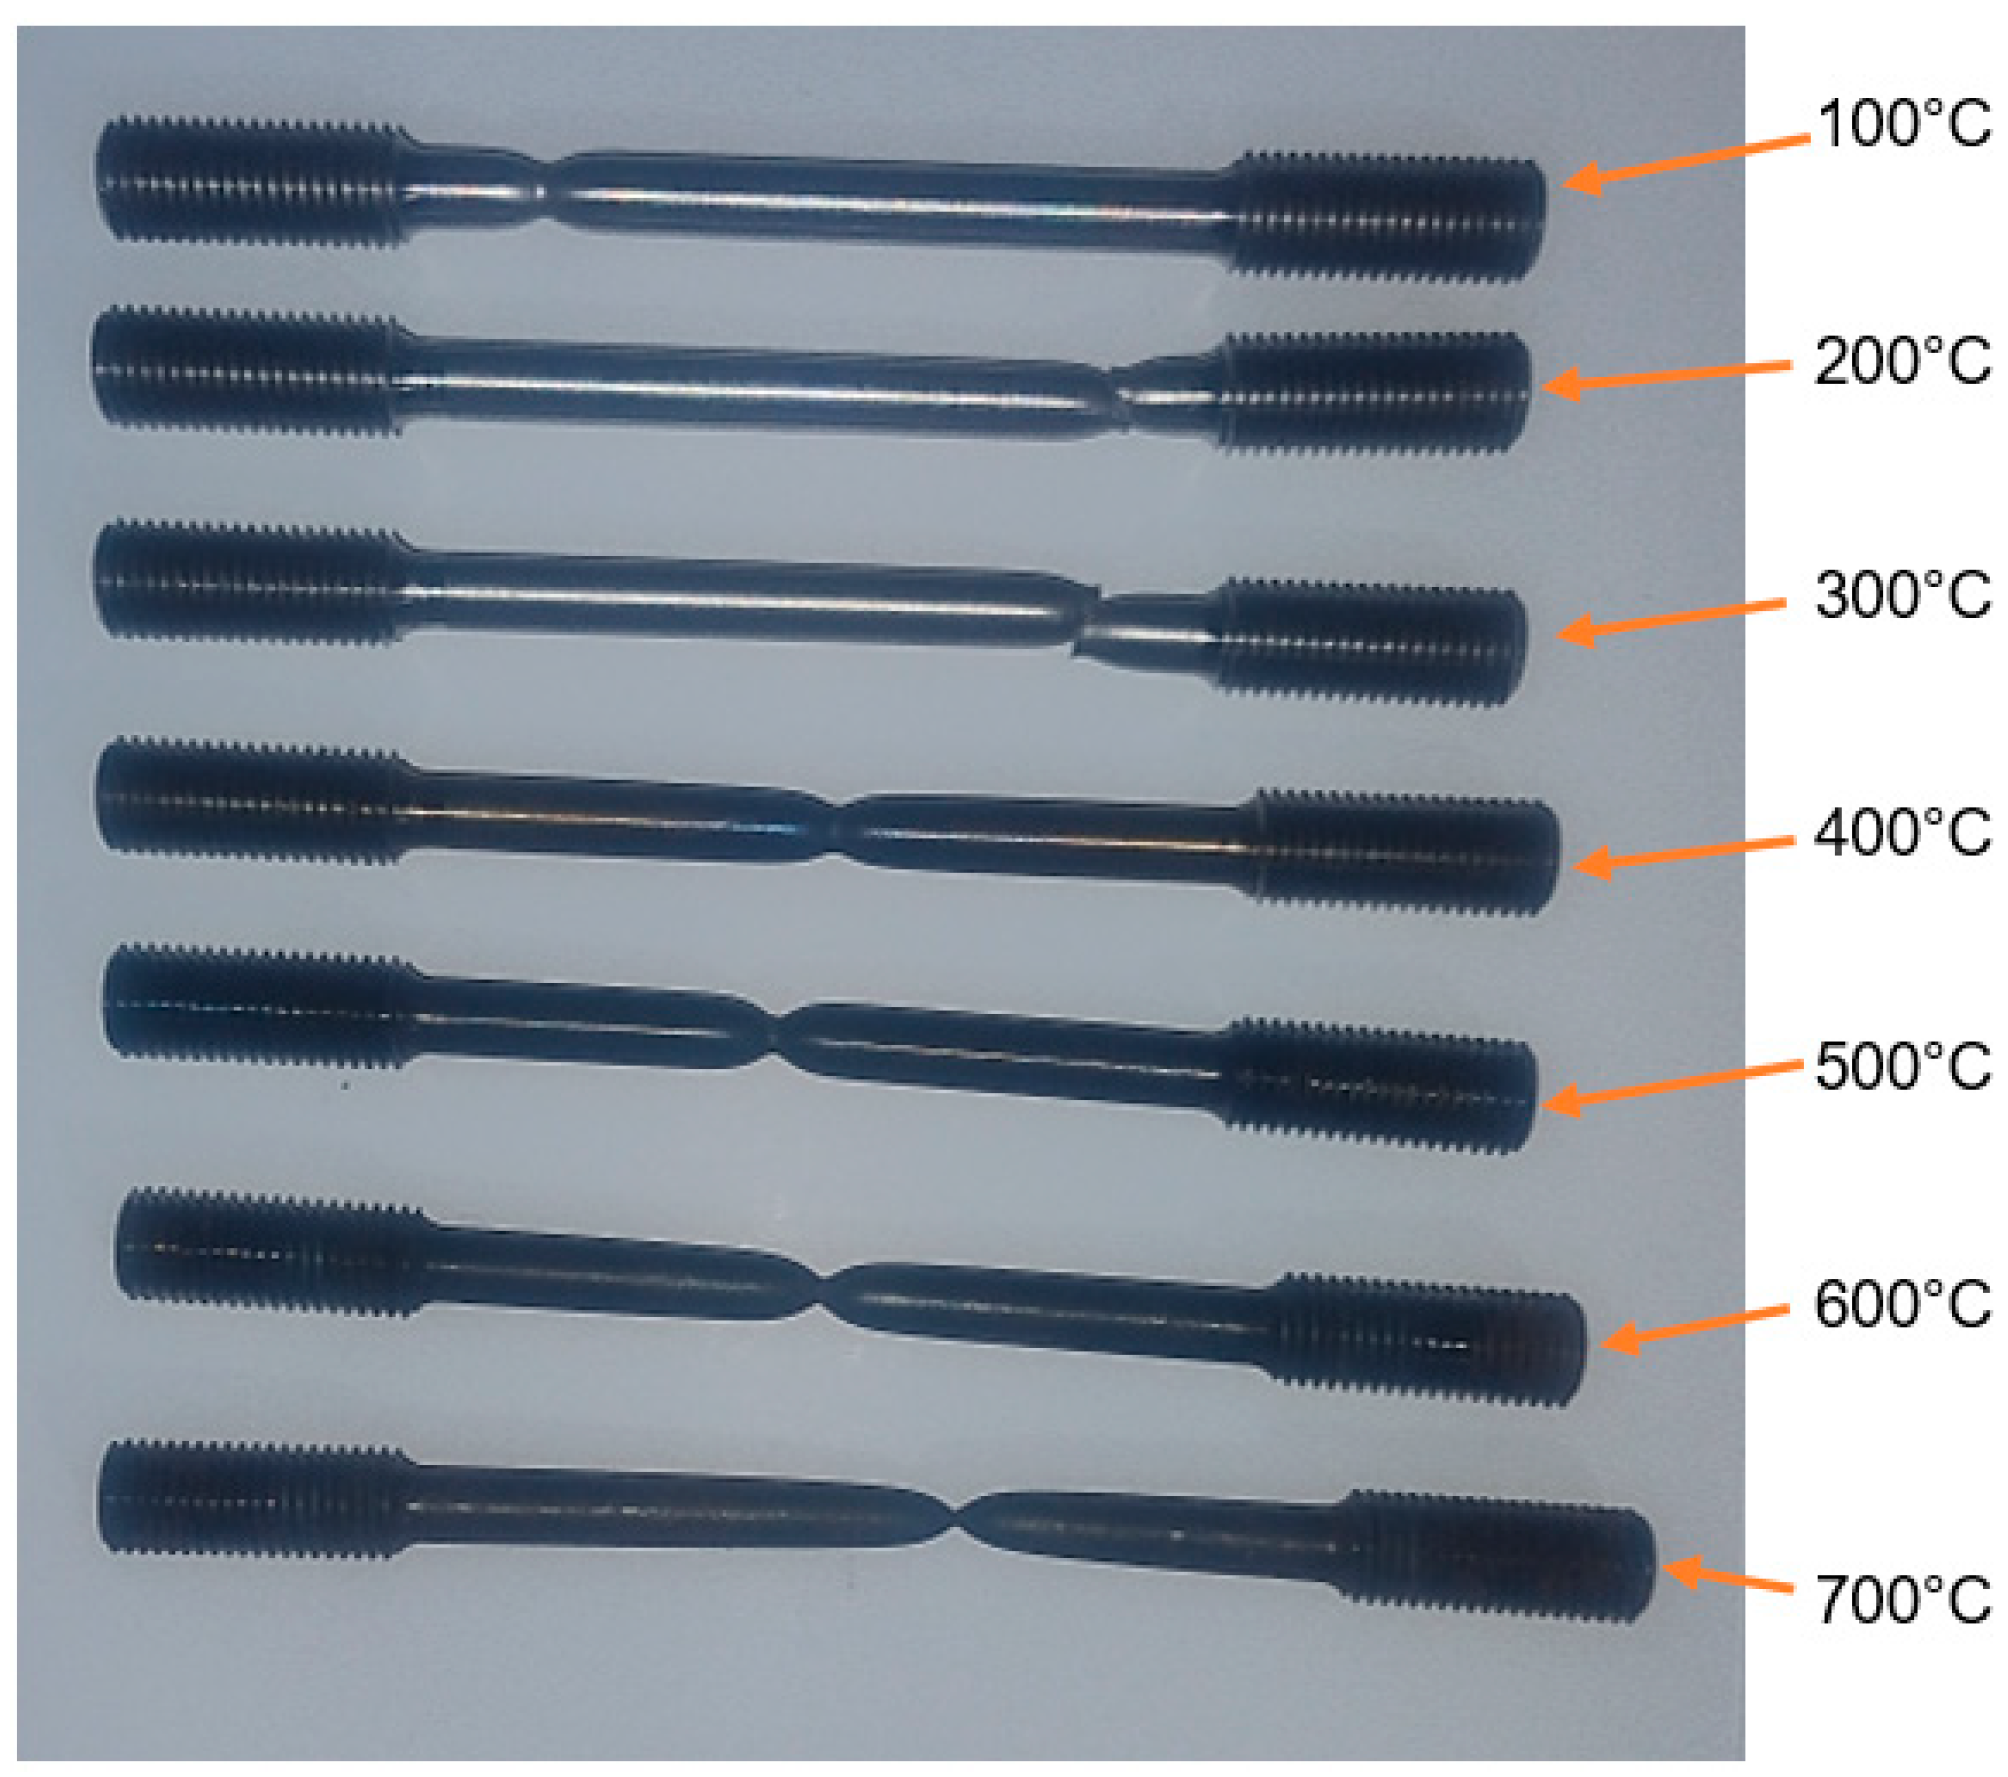
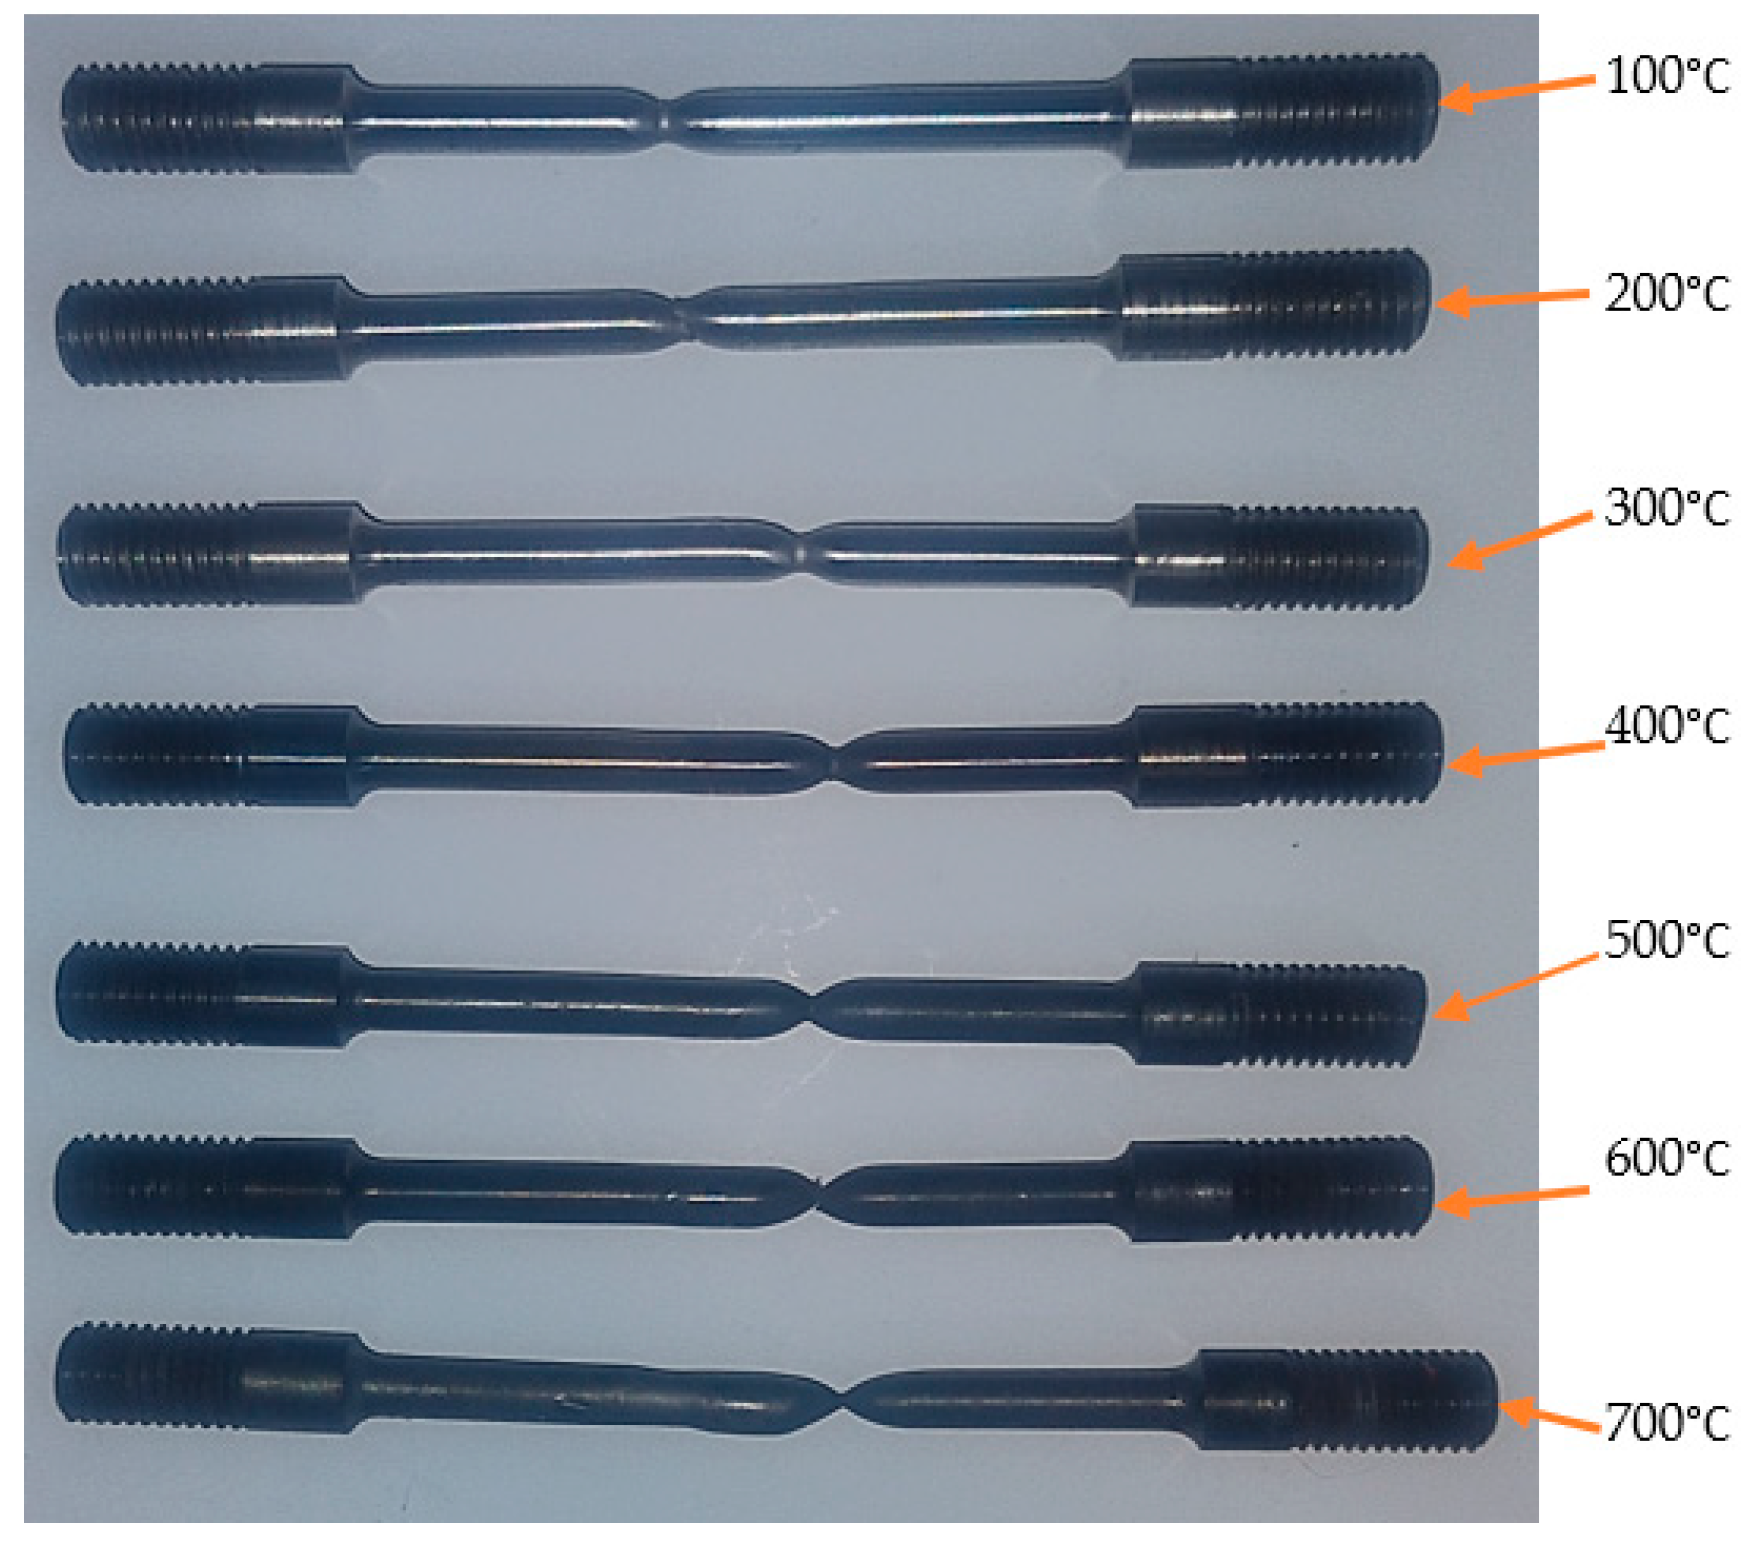
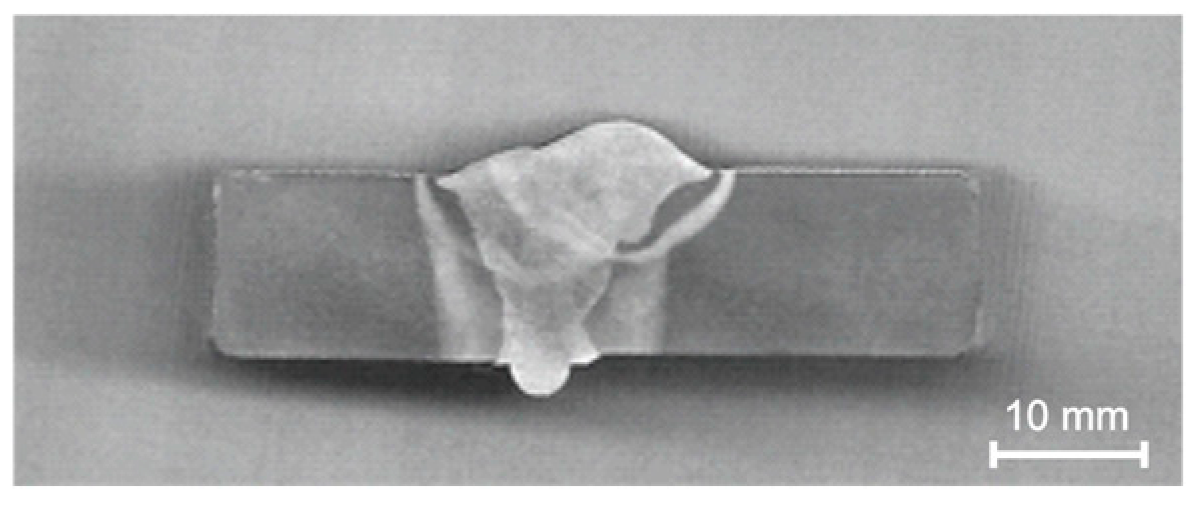
2.6.1. Tensile Testing
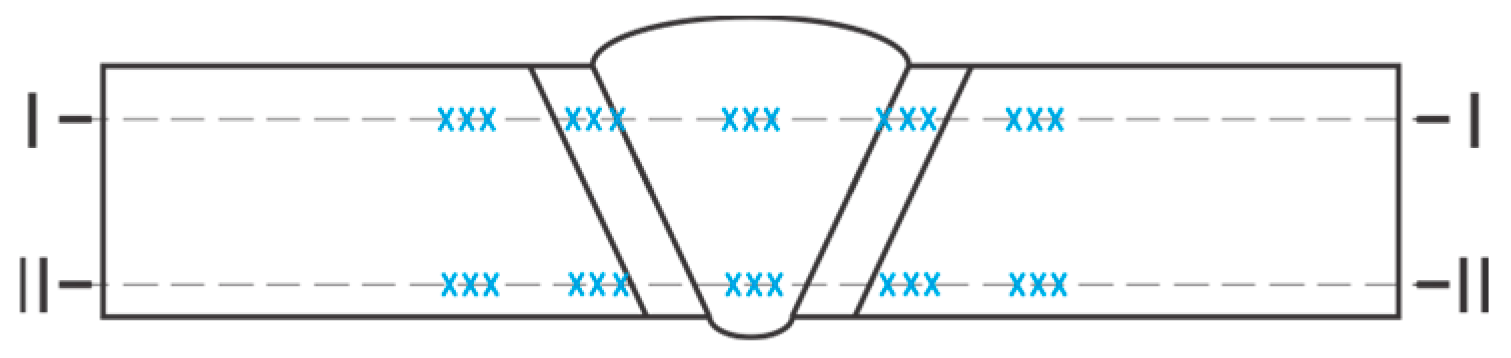
2.6.2. Metallography Testing
2.6.3. Hardness Measurement
3. Results
3.1. Results of Tensile Testing at Room and Elevated Temperatures
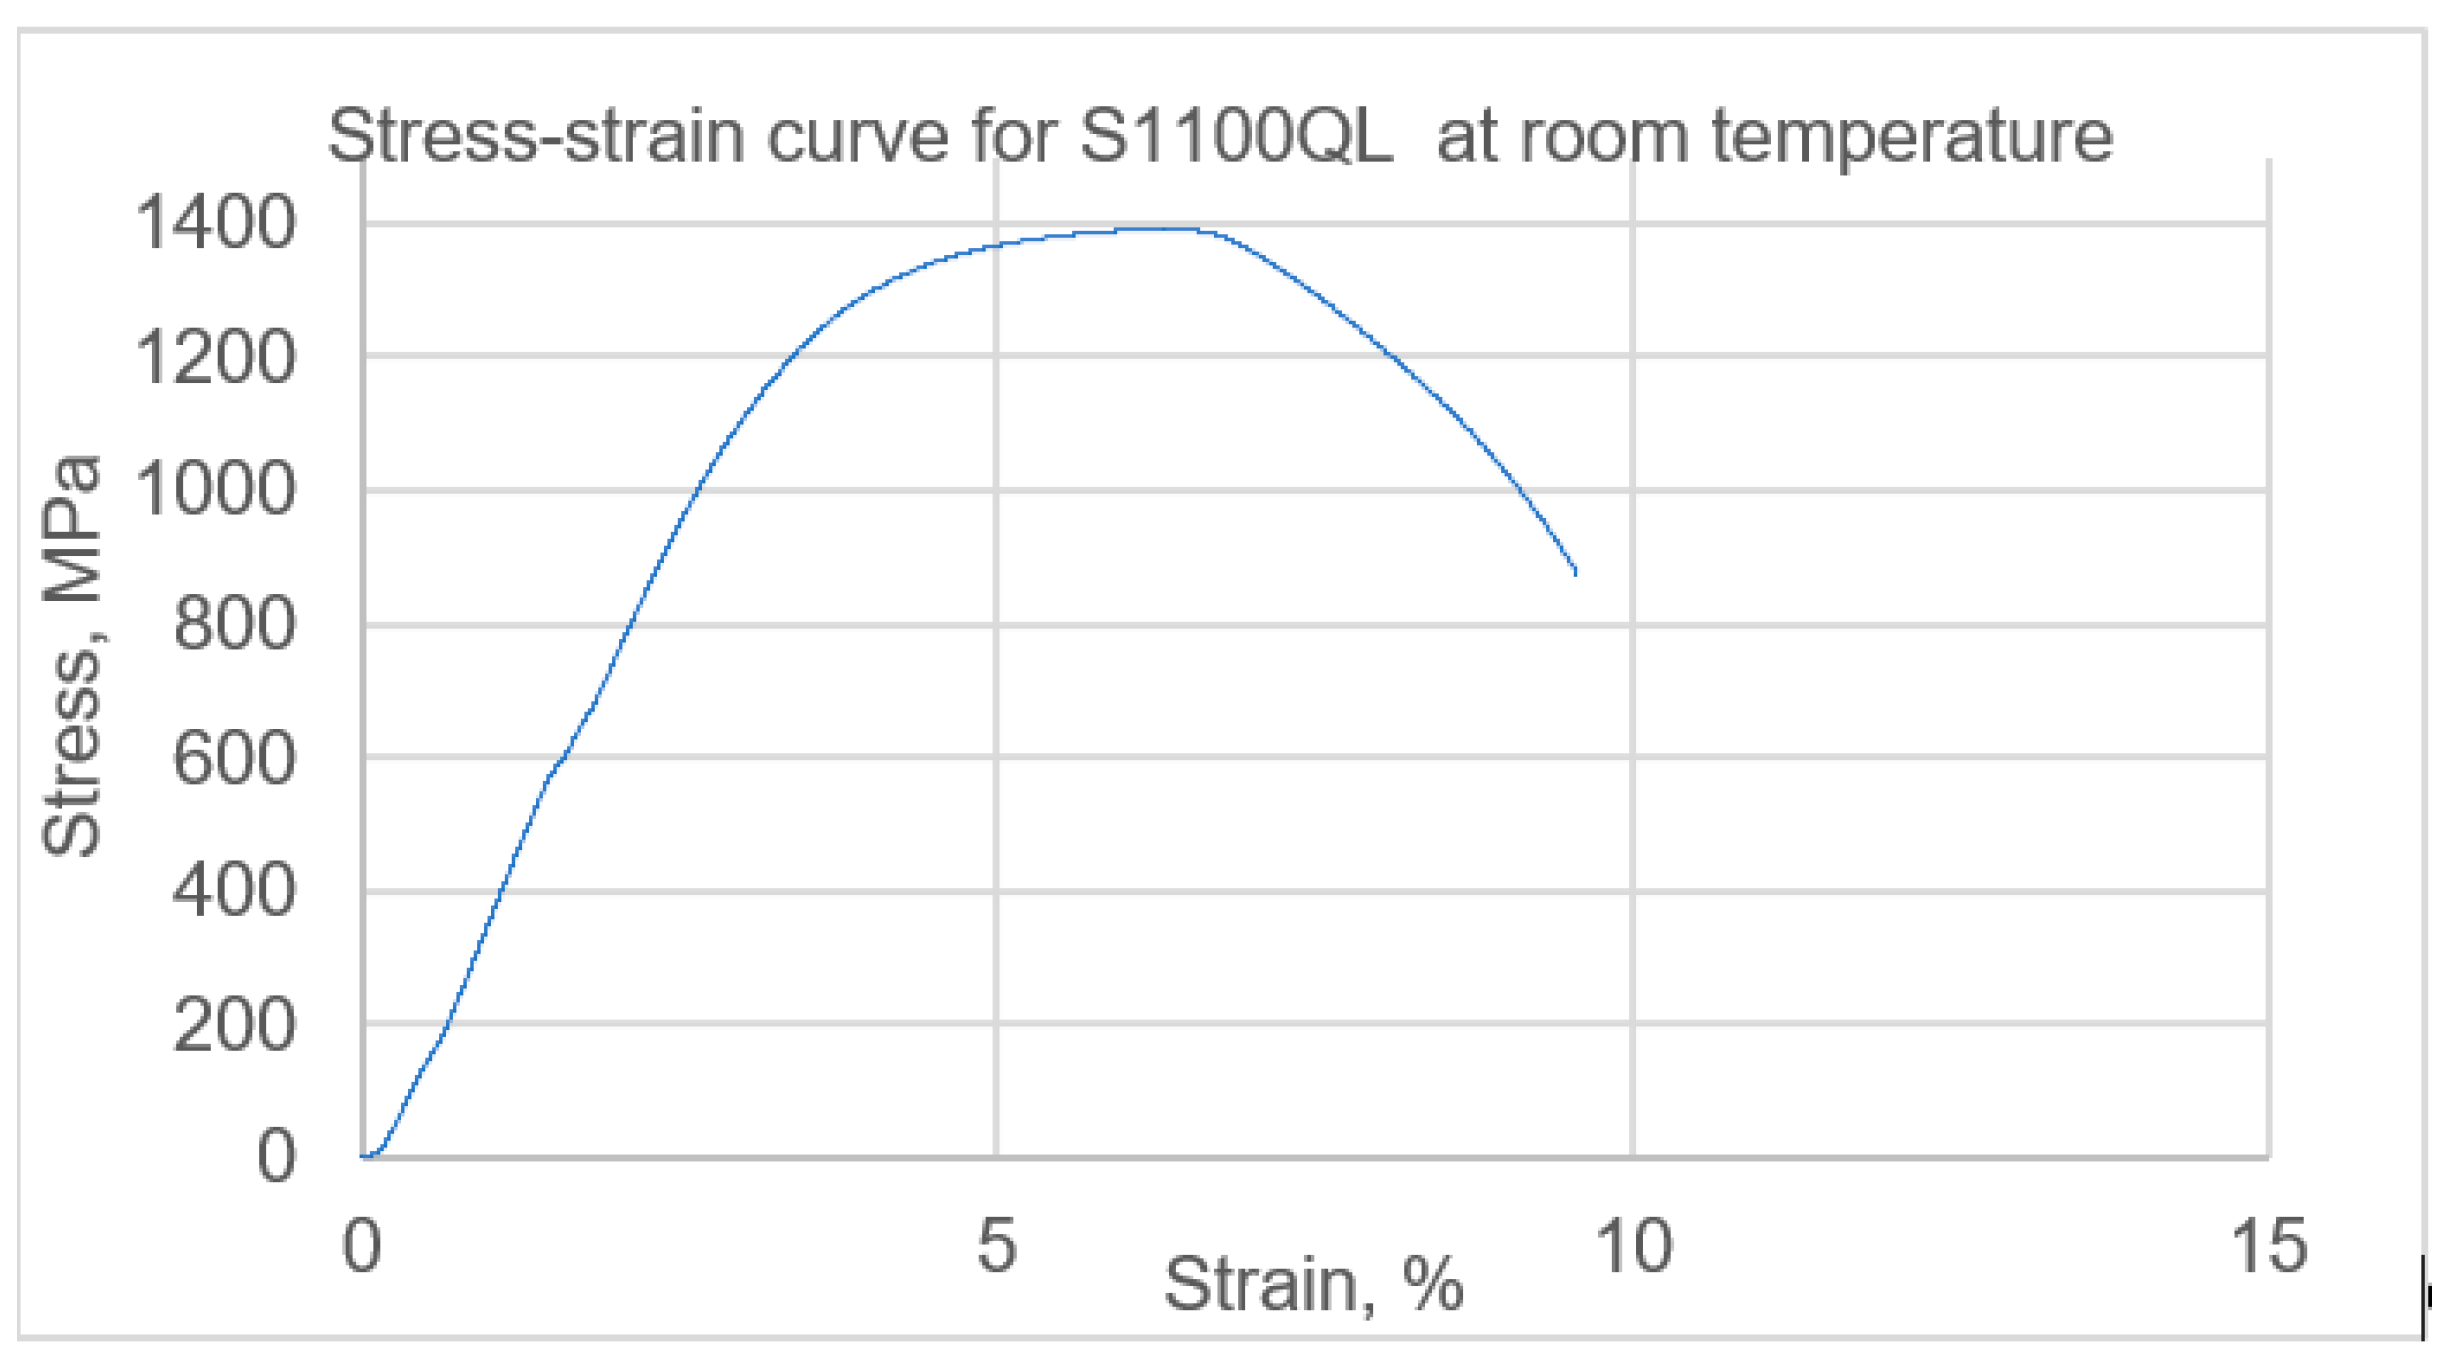
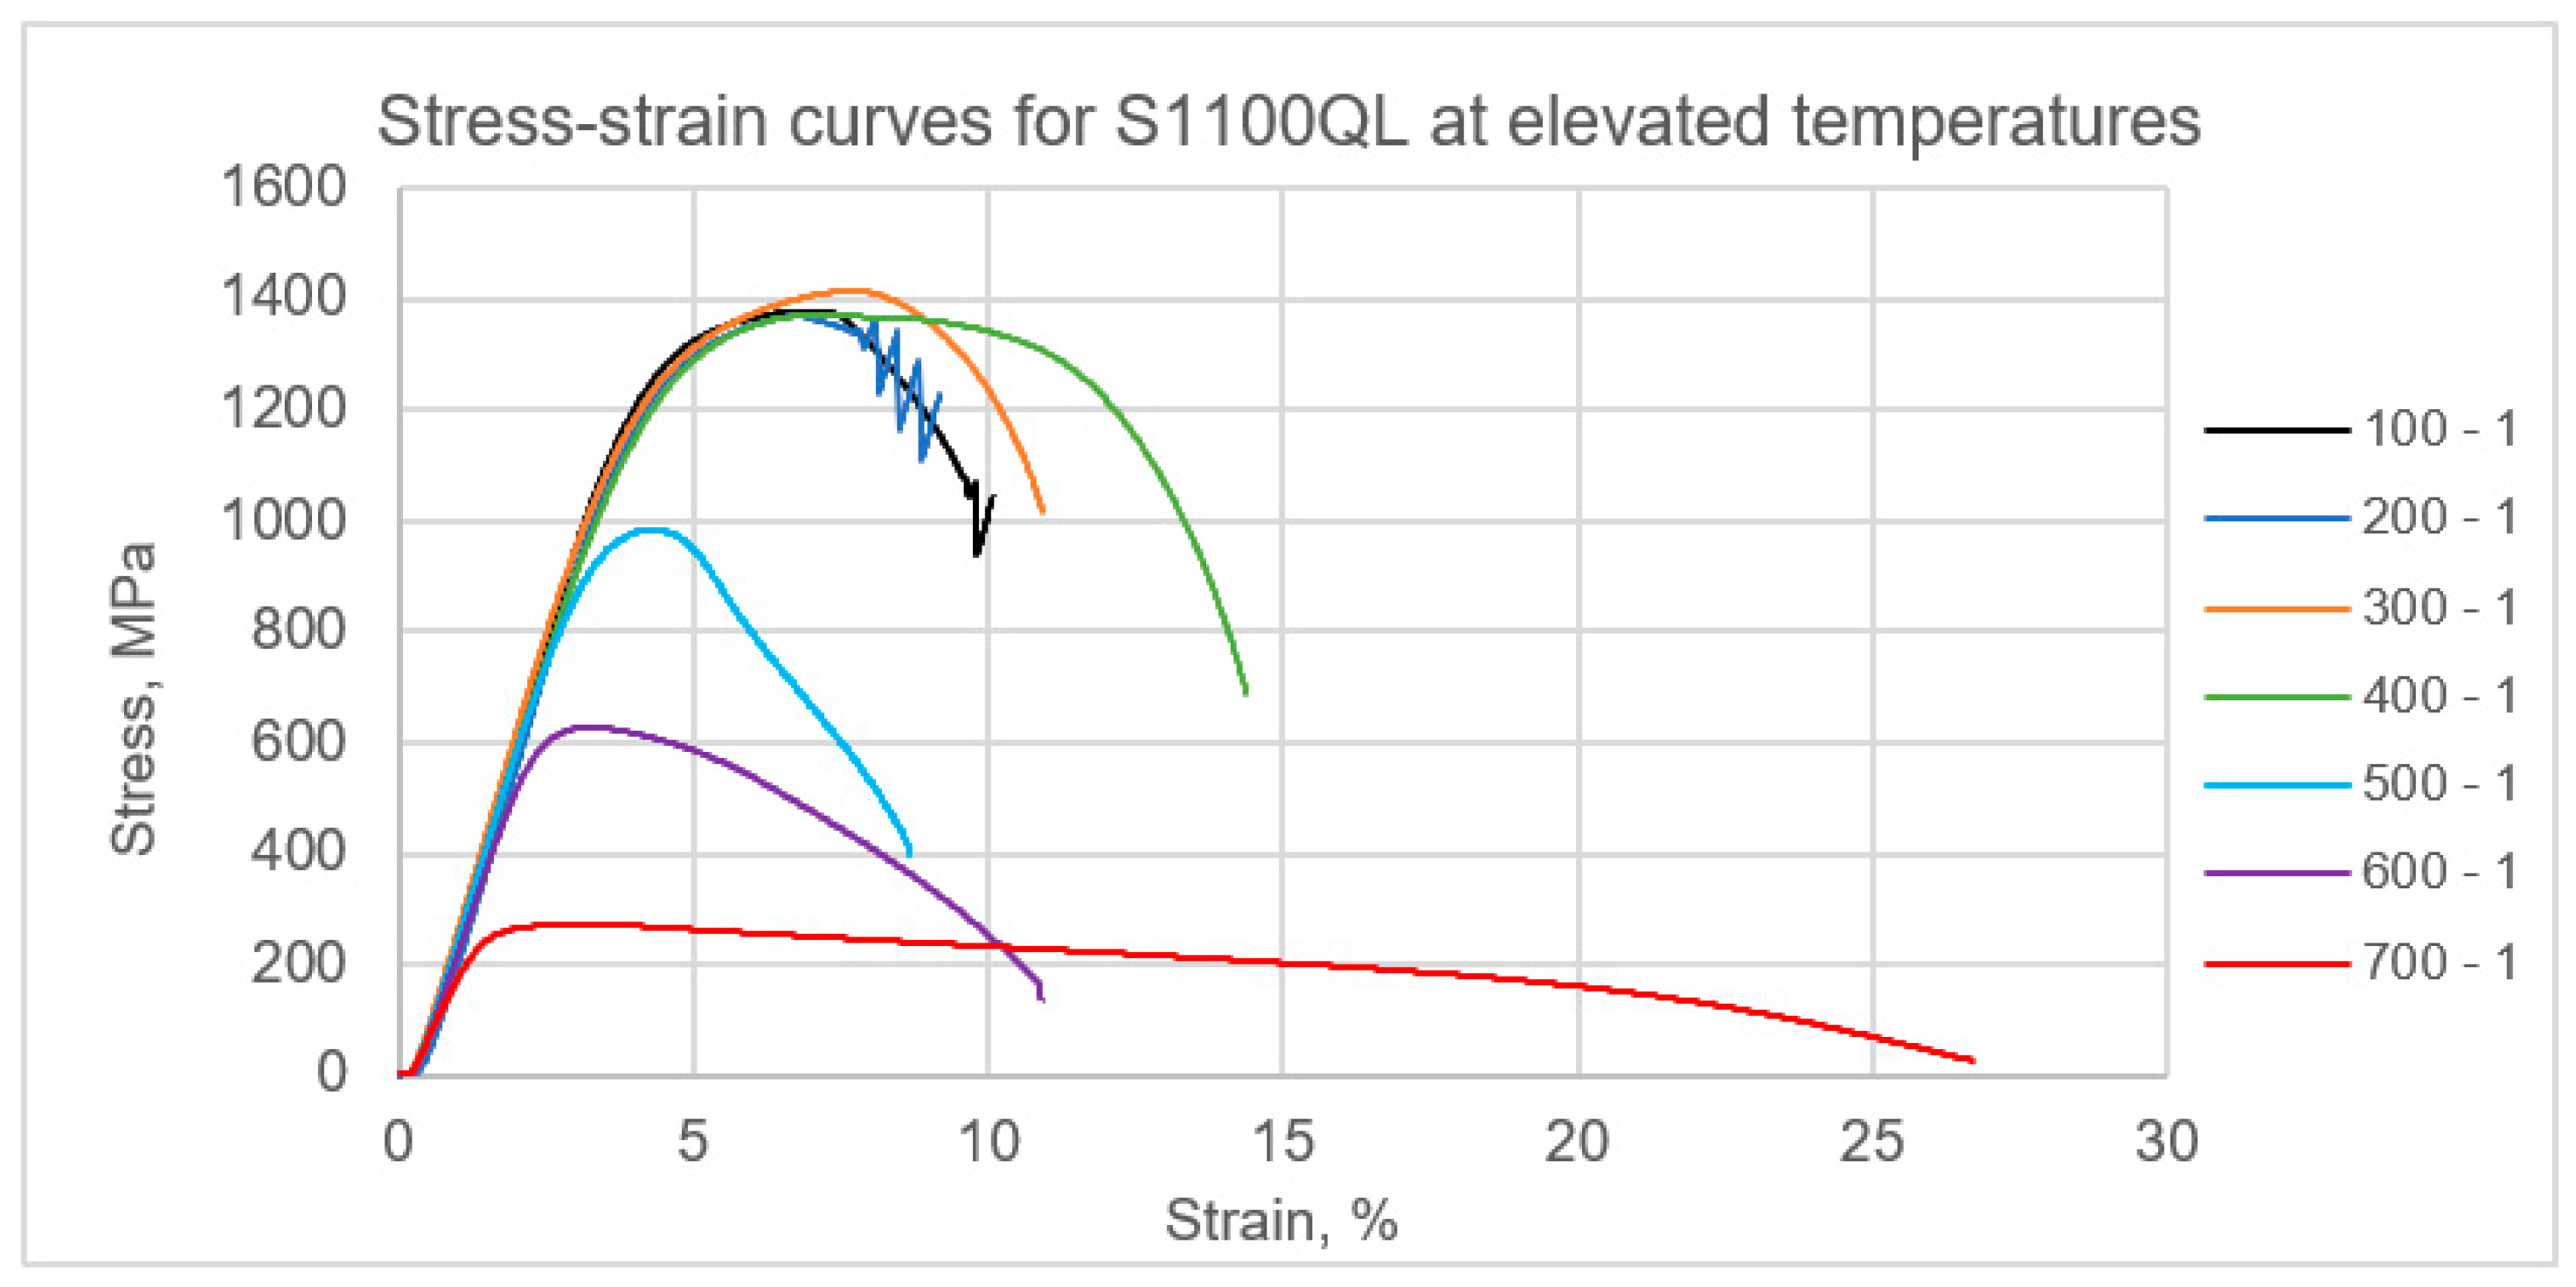
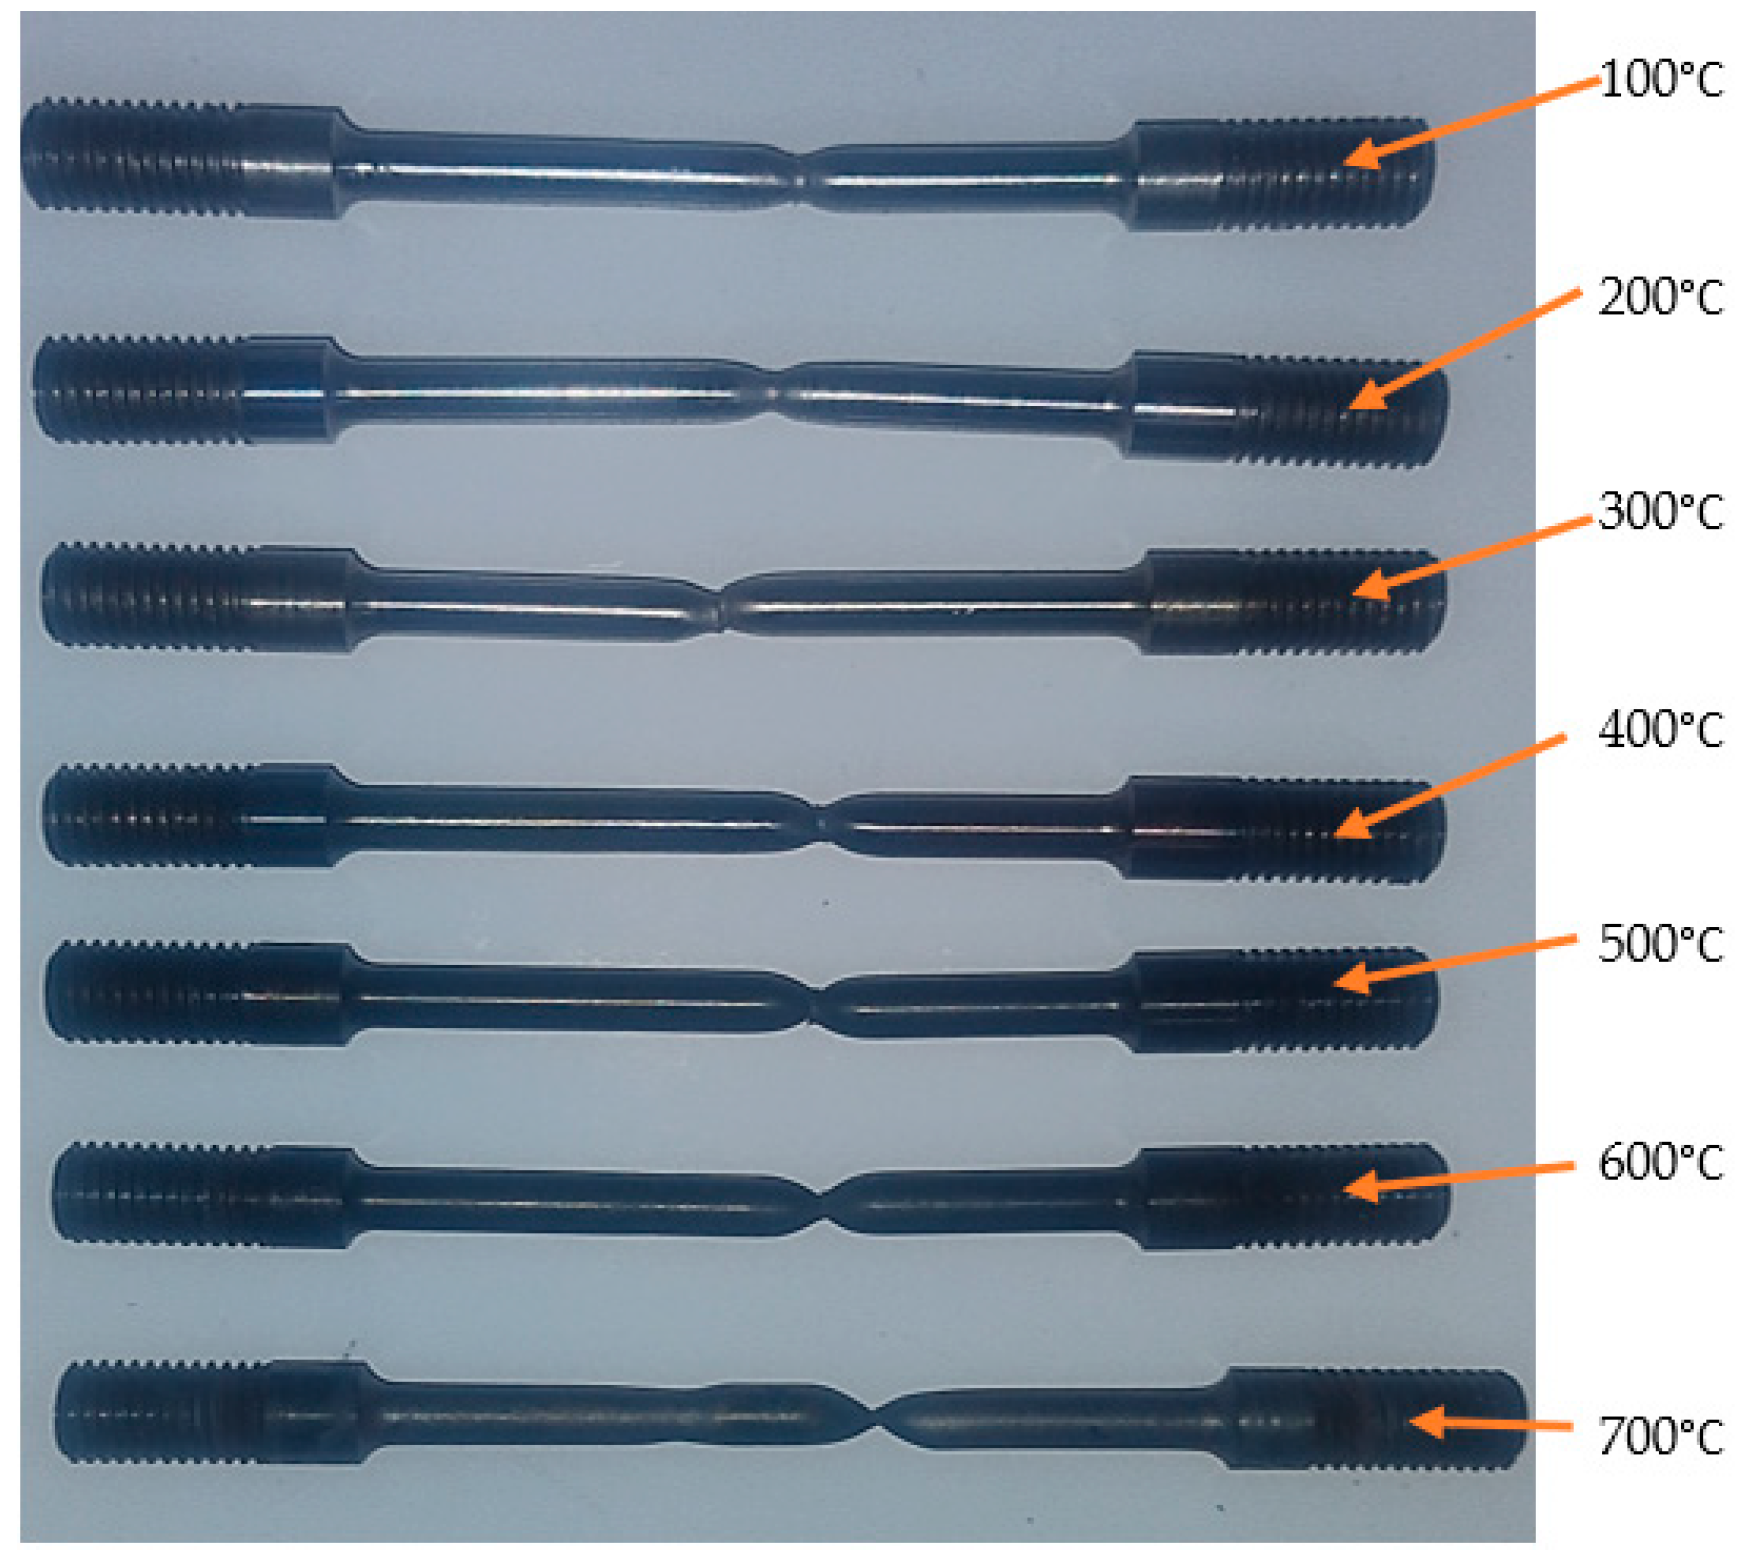
3.1.1. Base Material
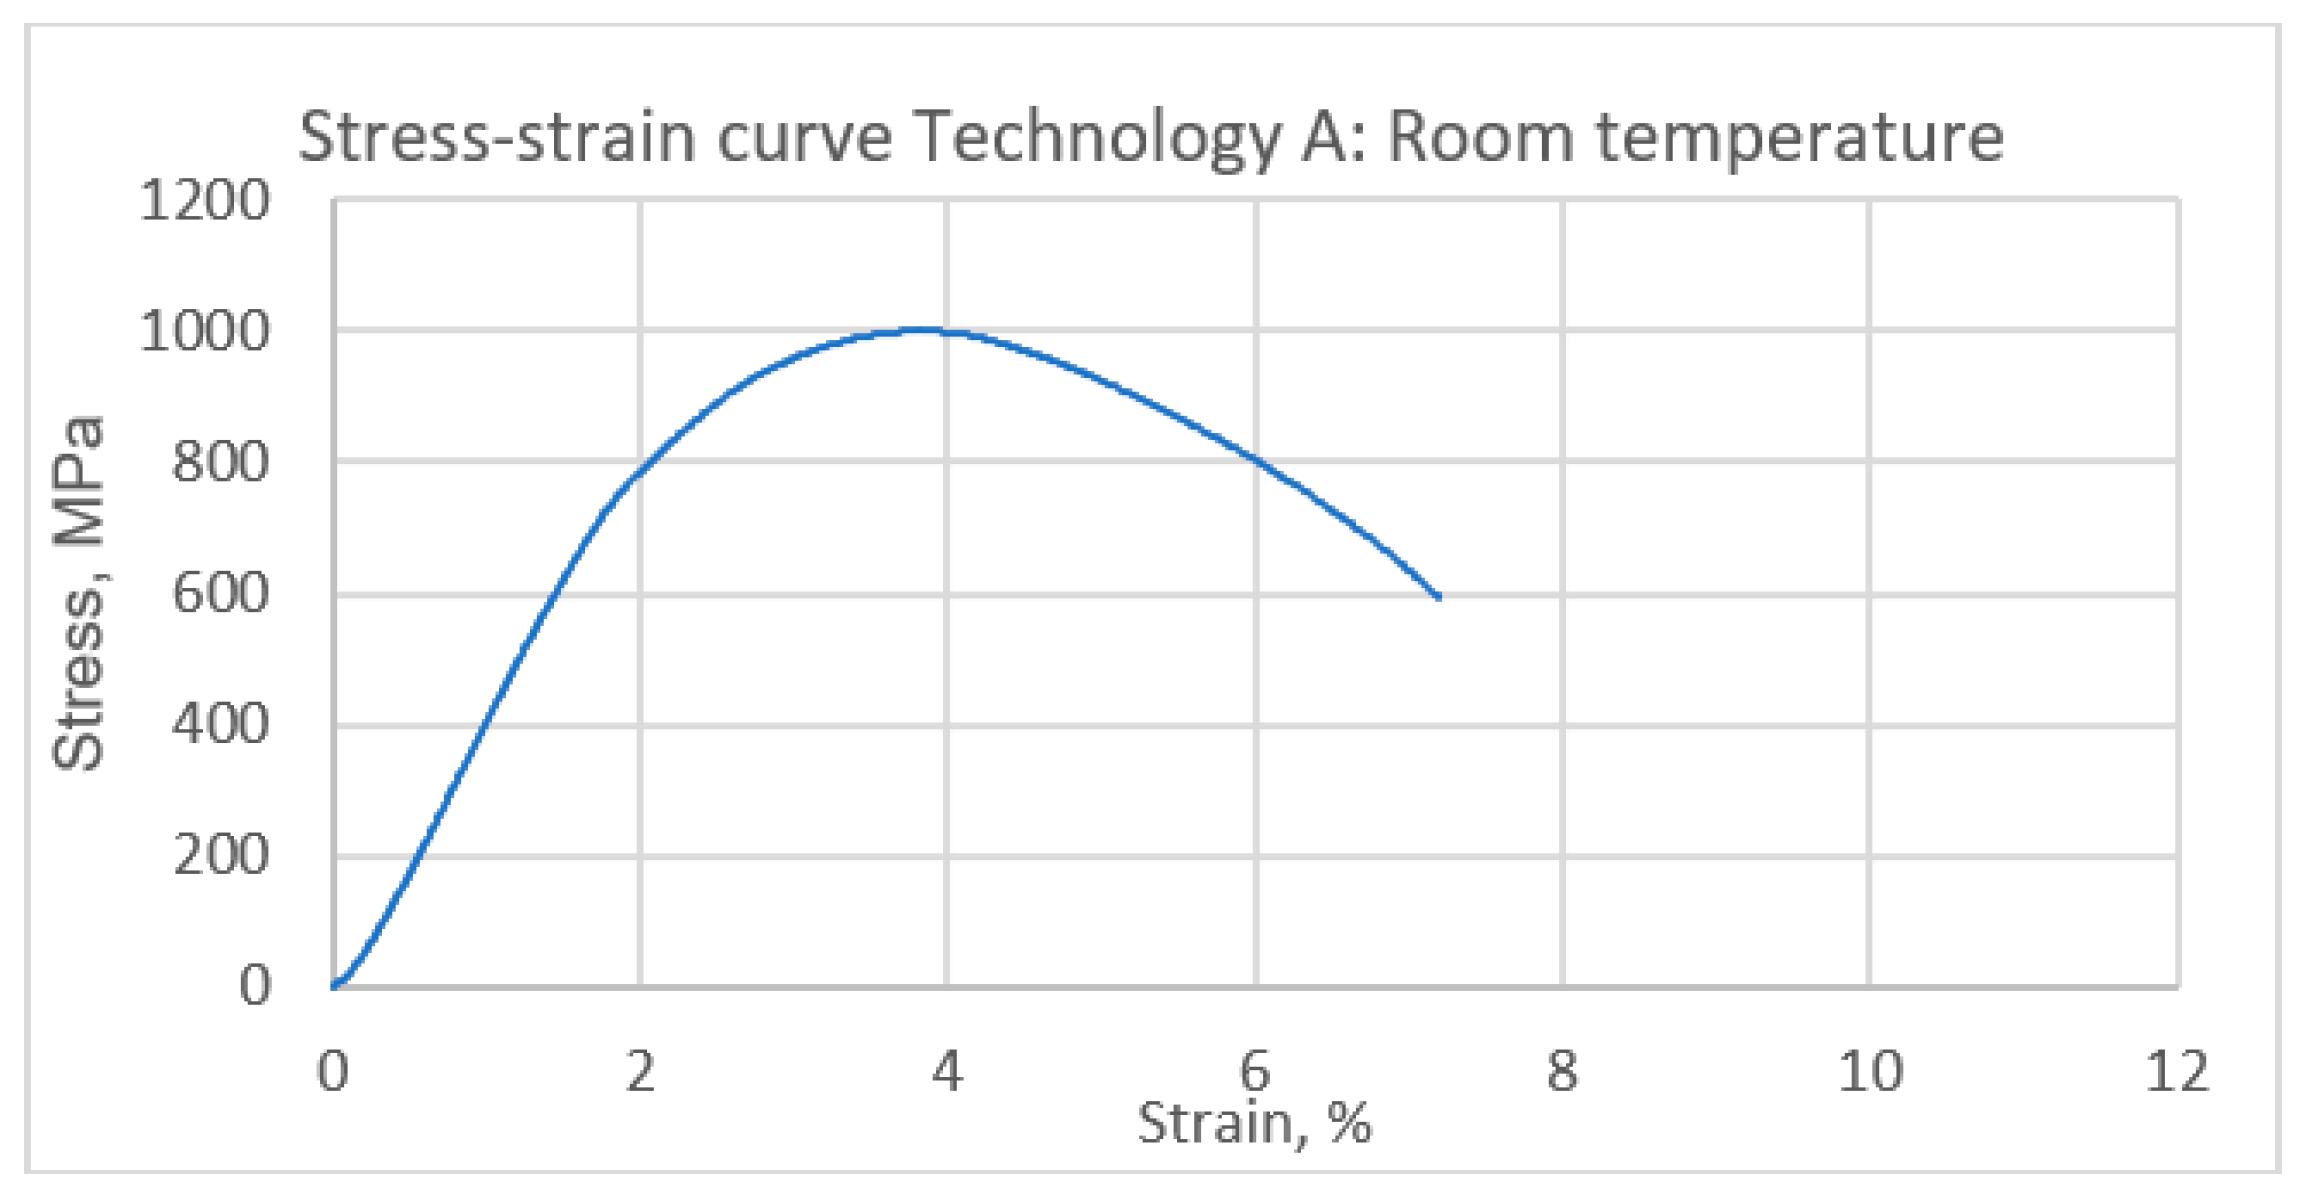
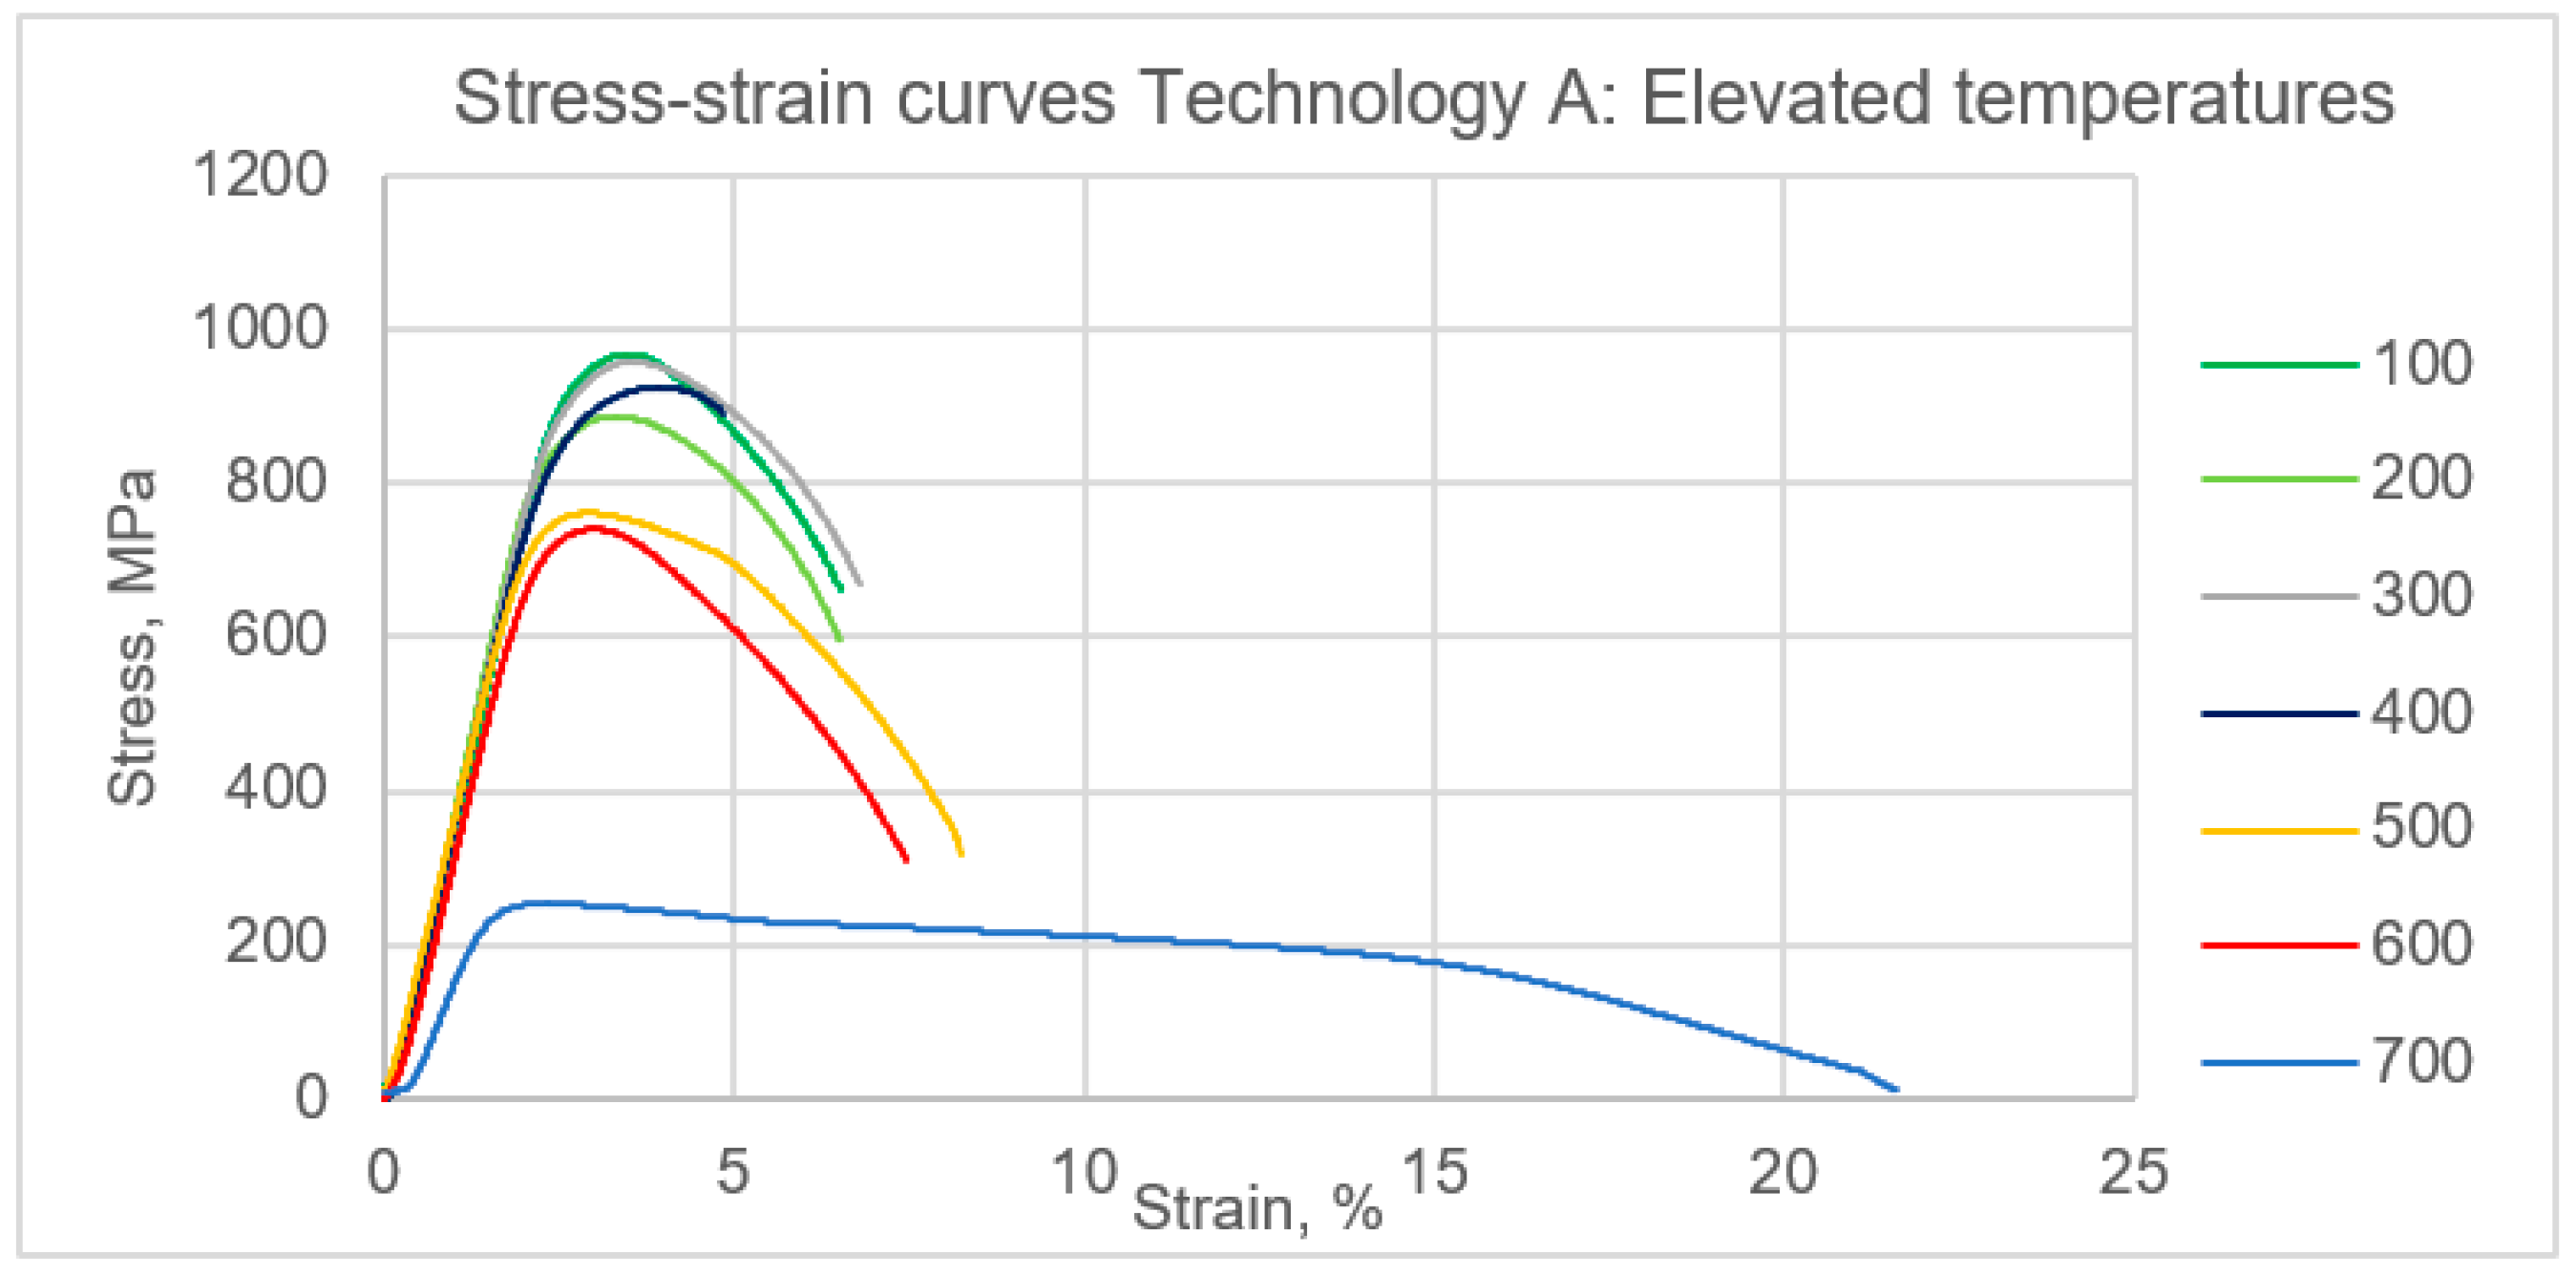
3.1.2. Technology A
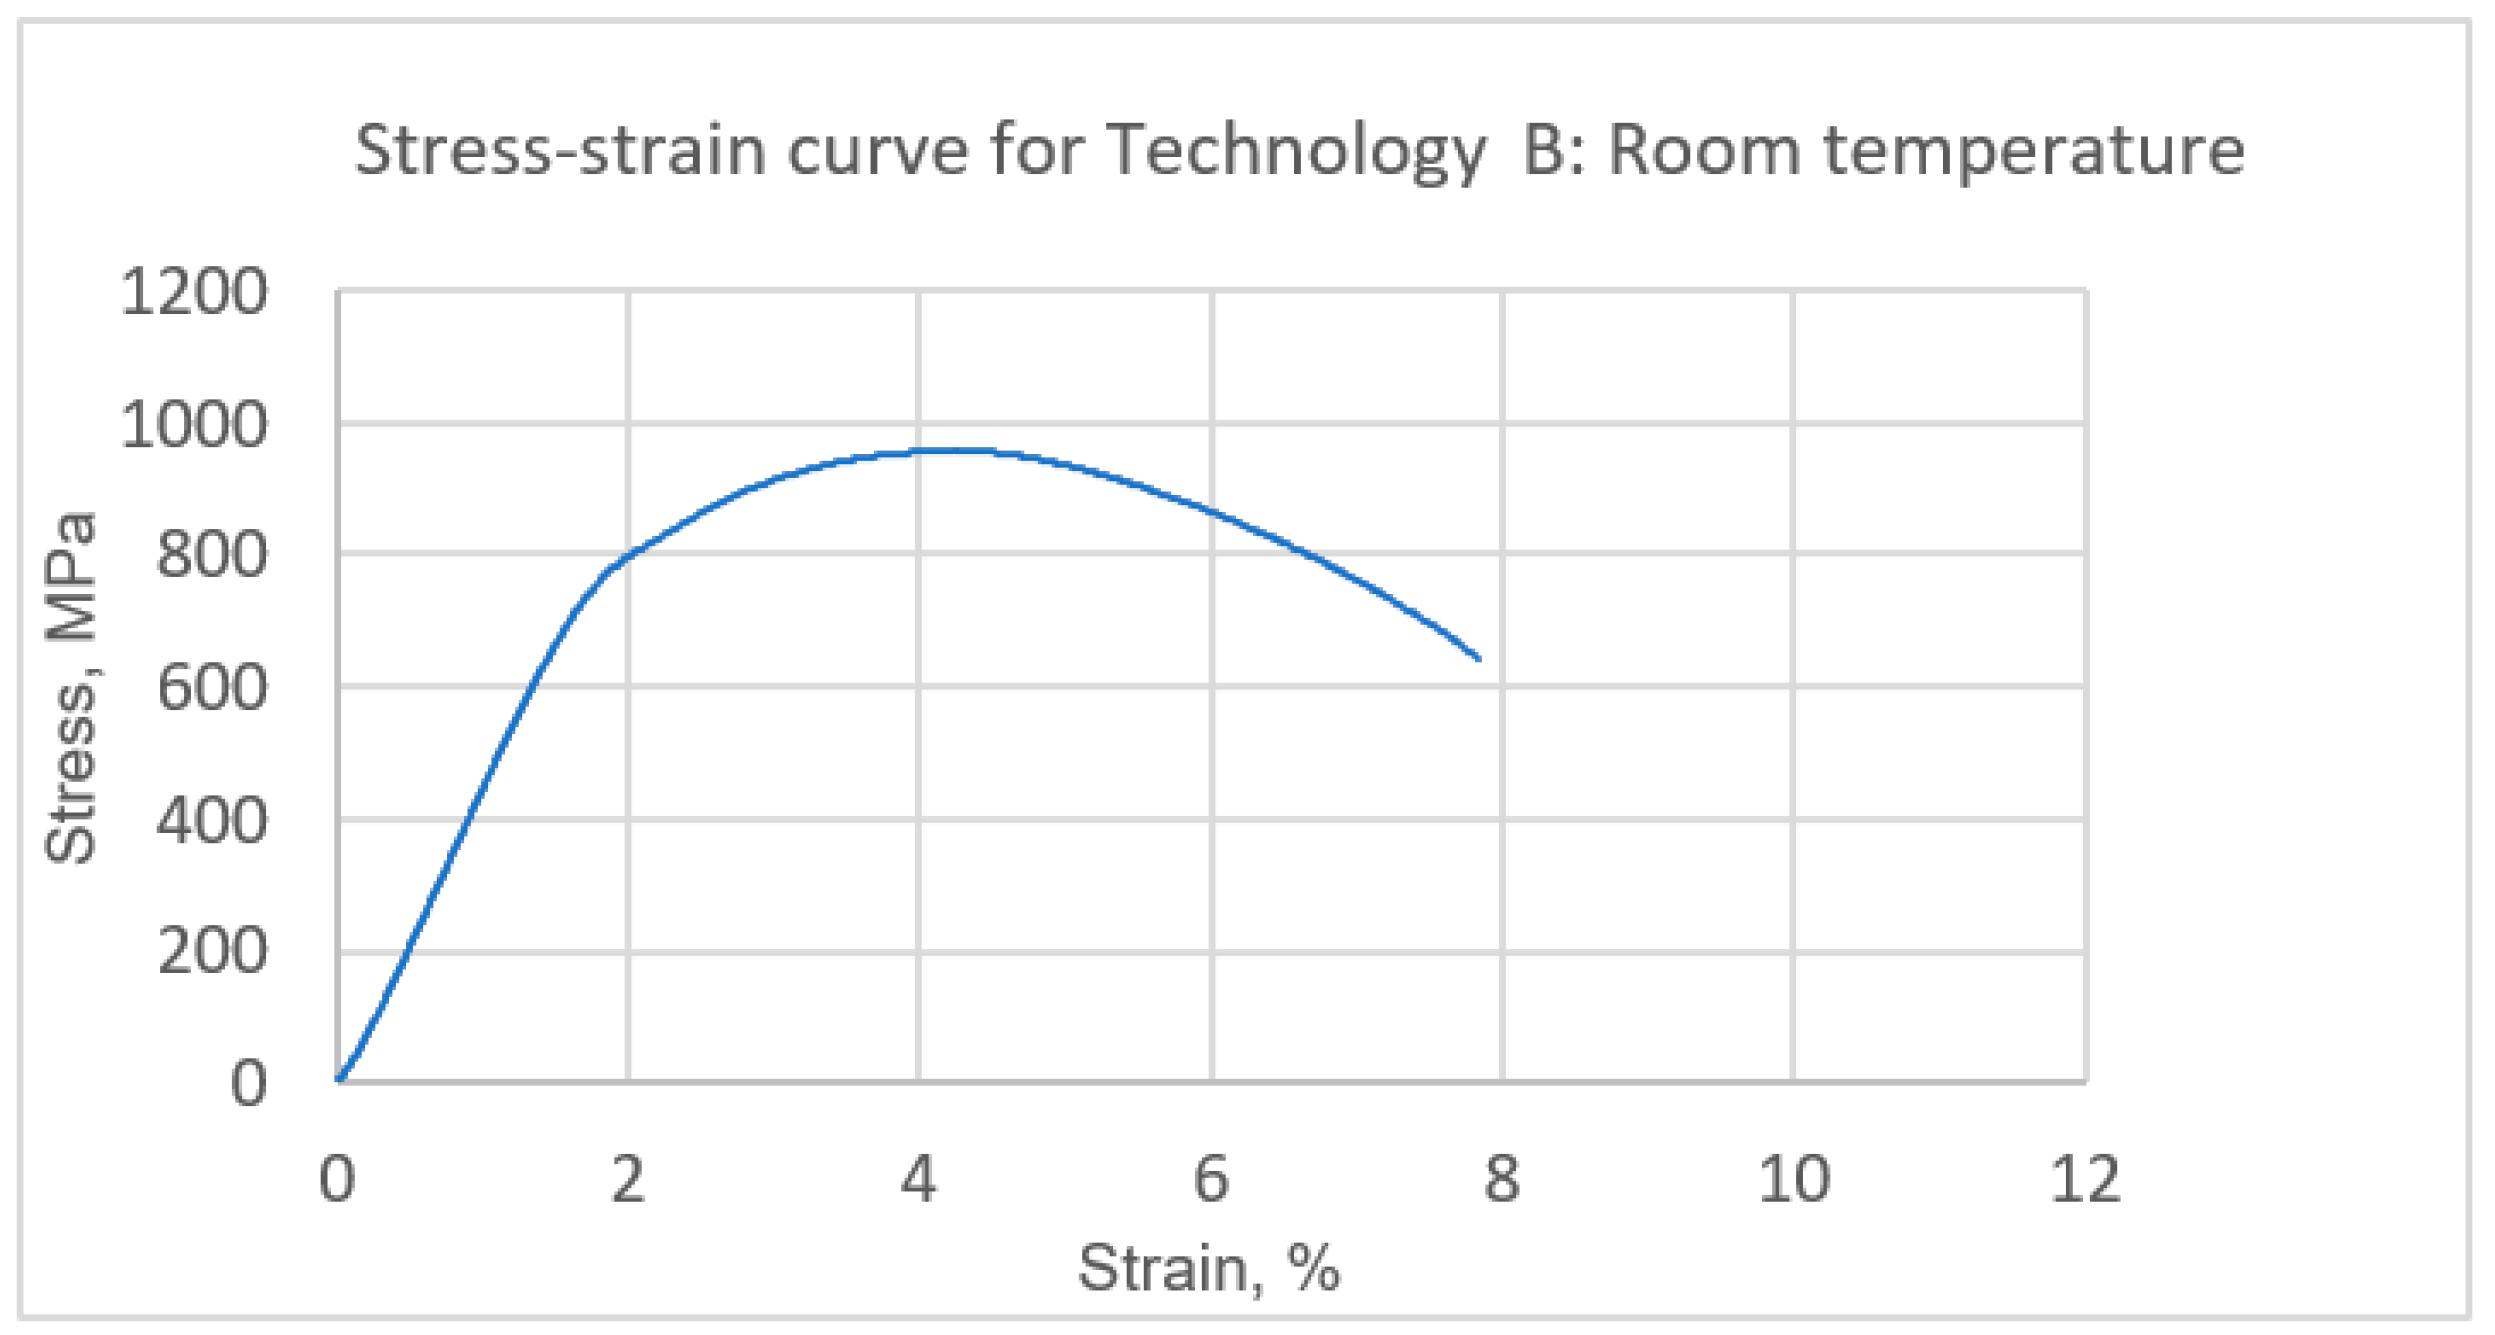
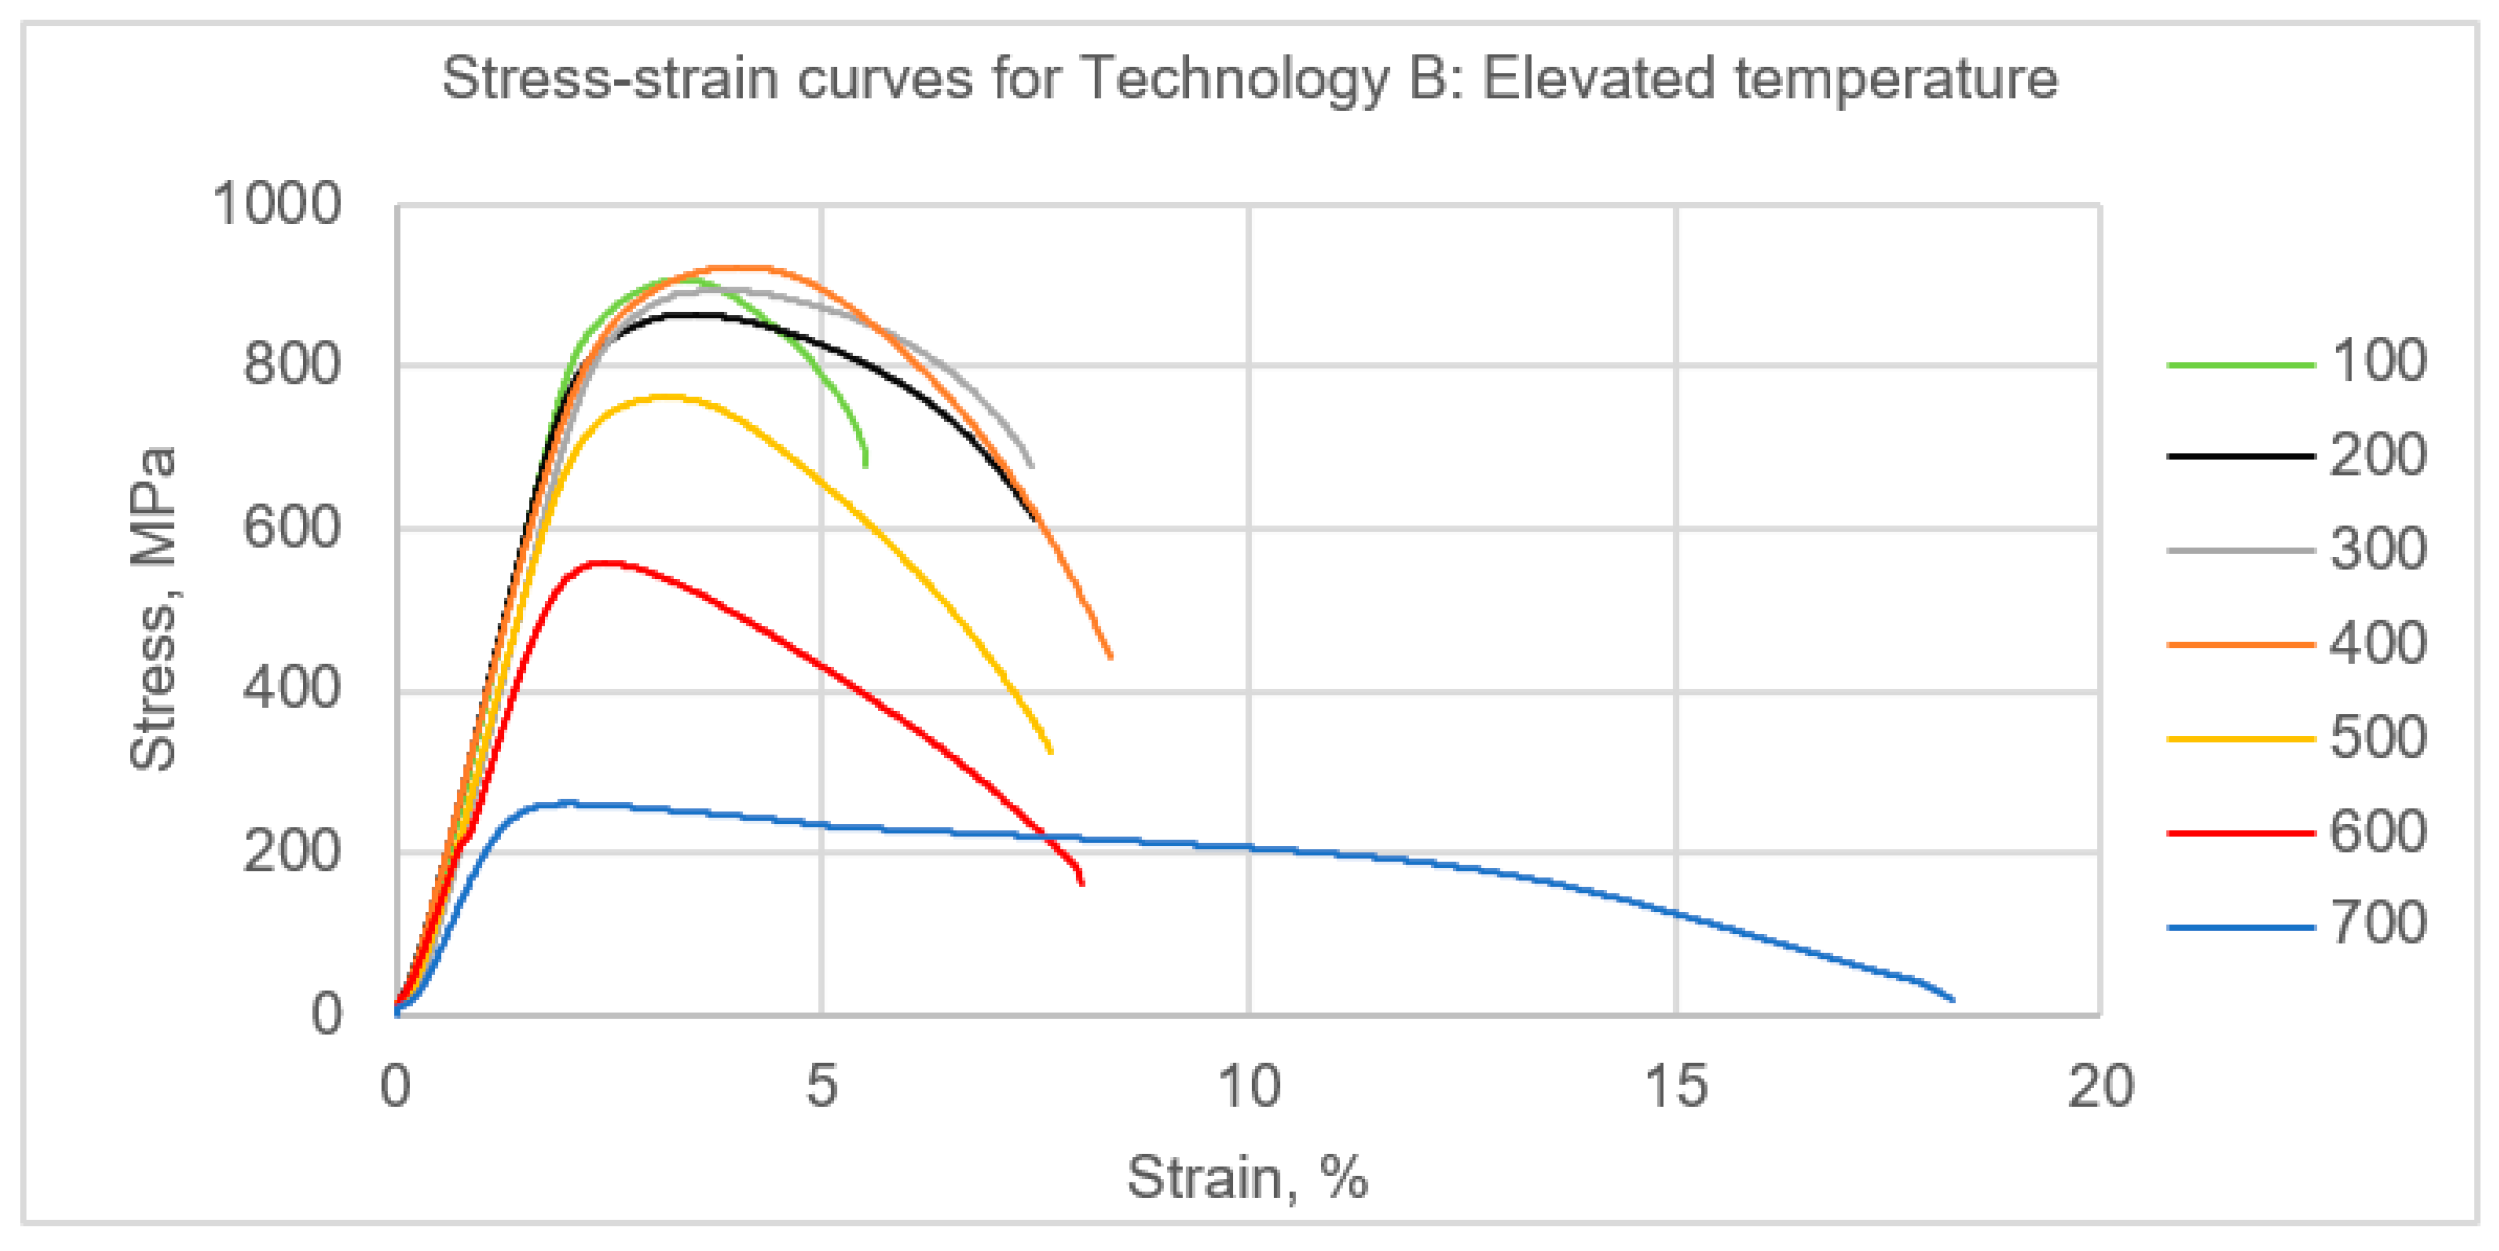
3.1.3. Technology B
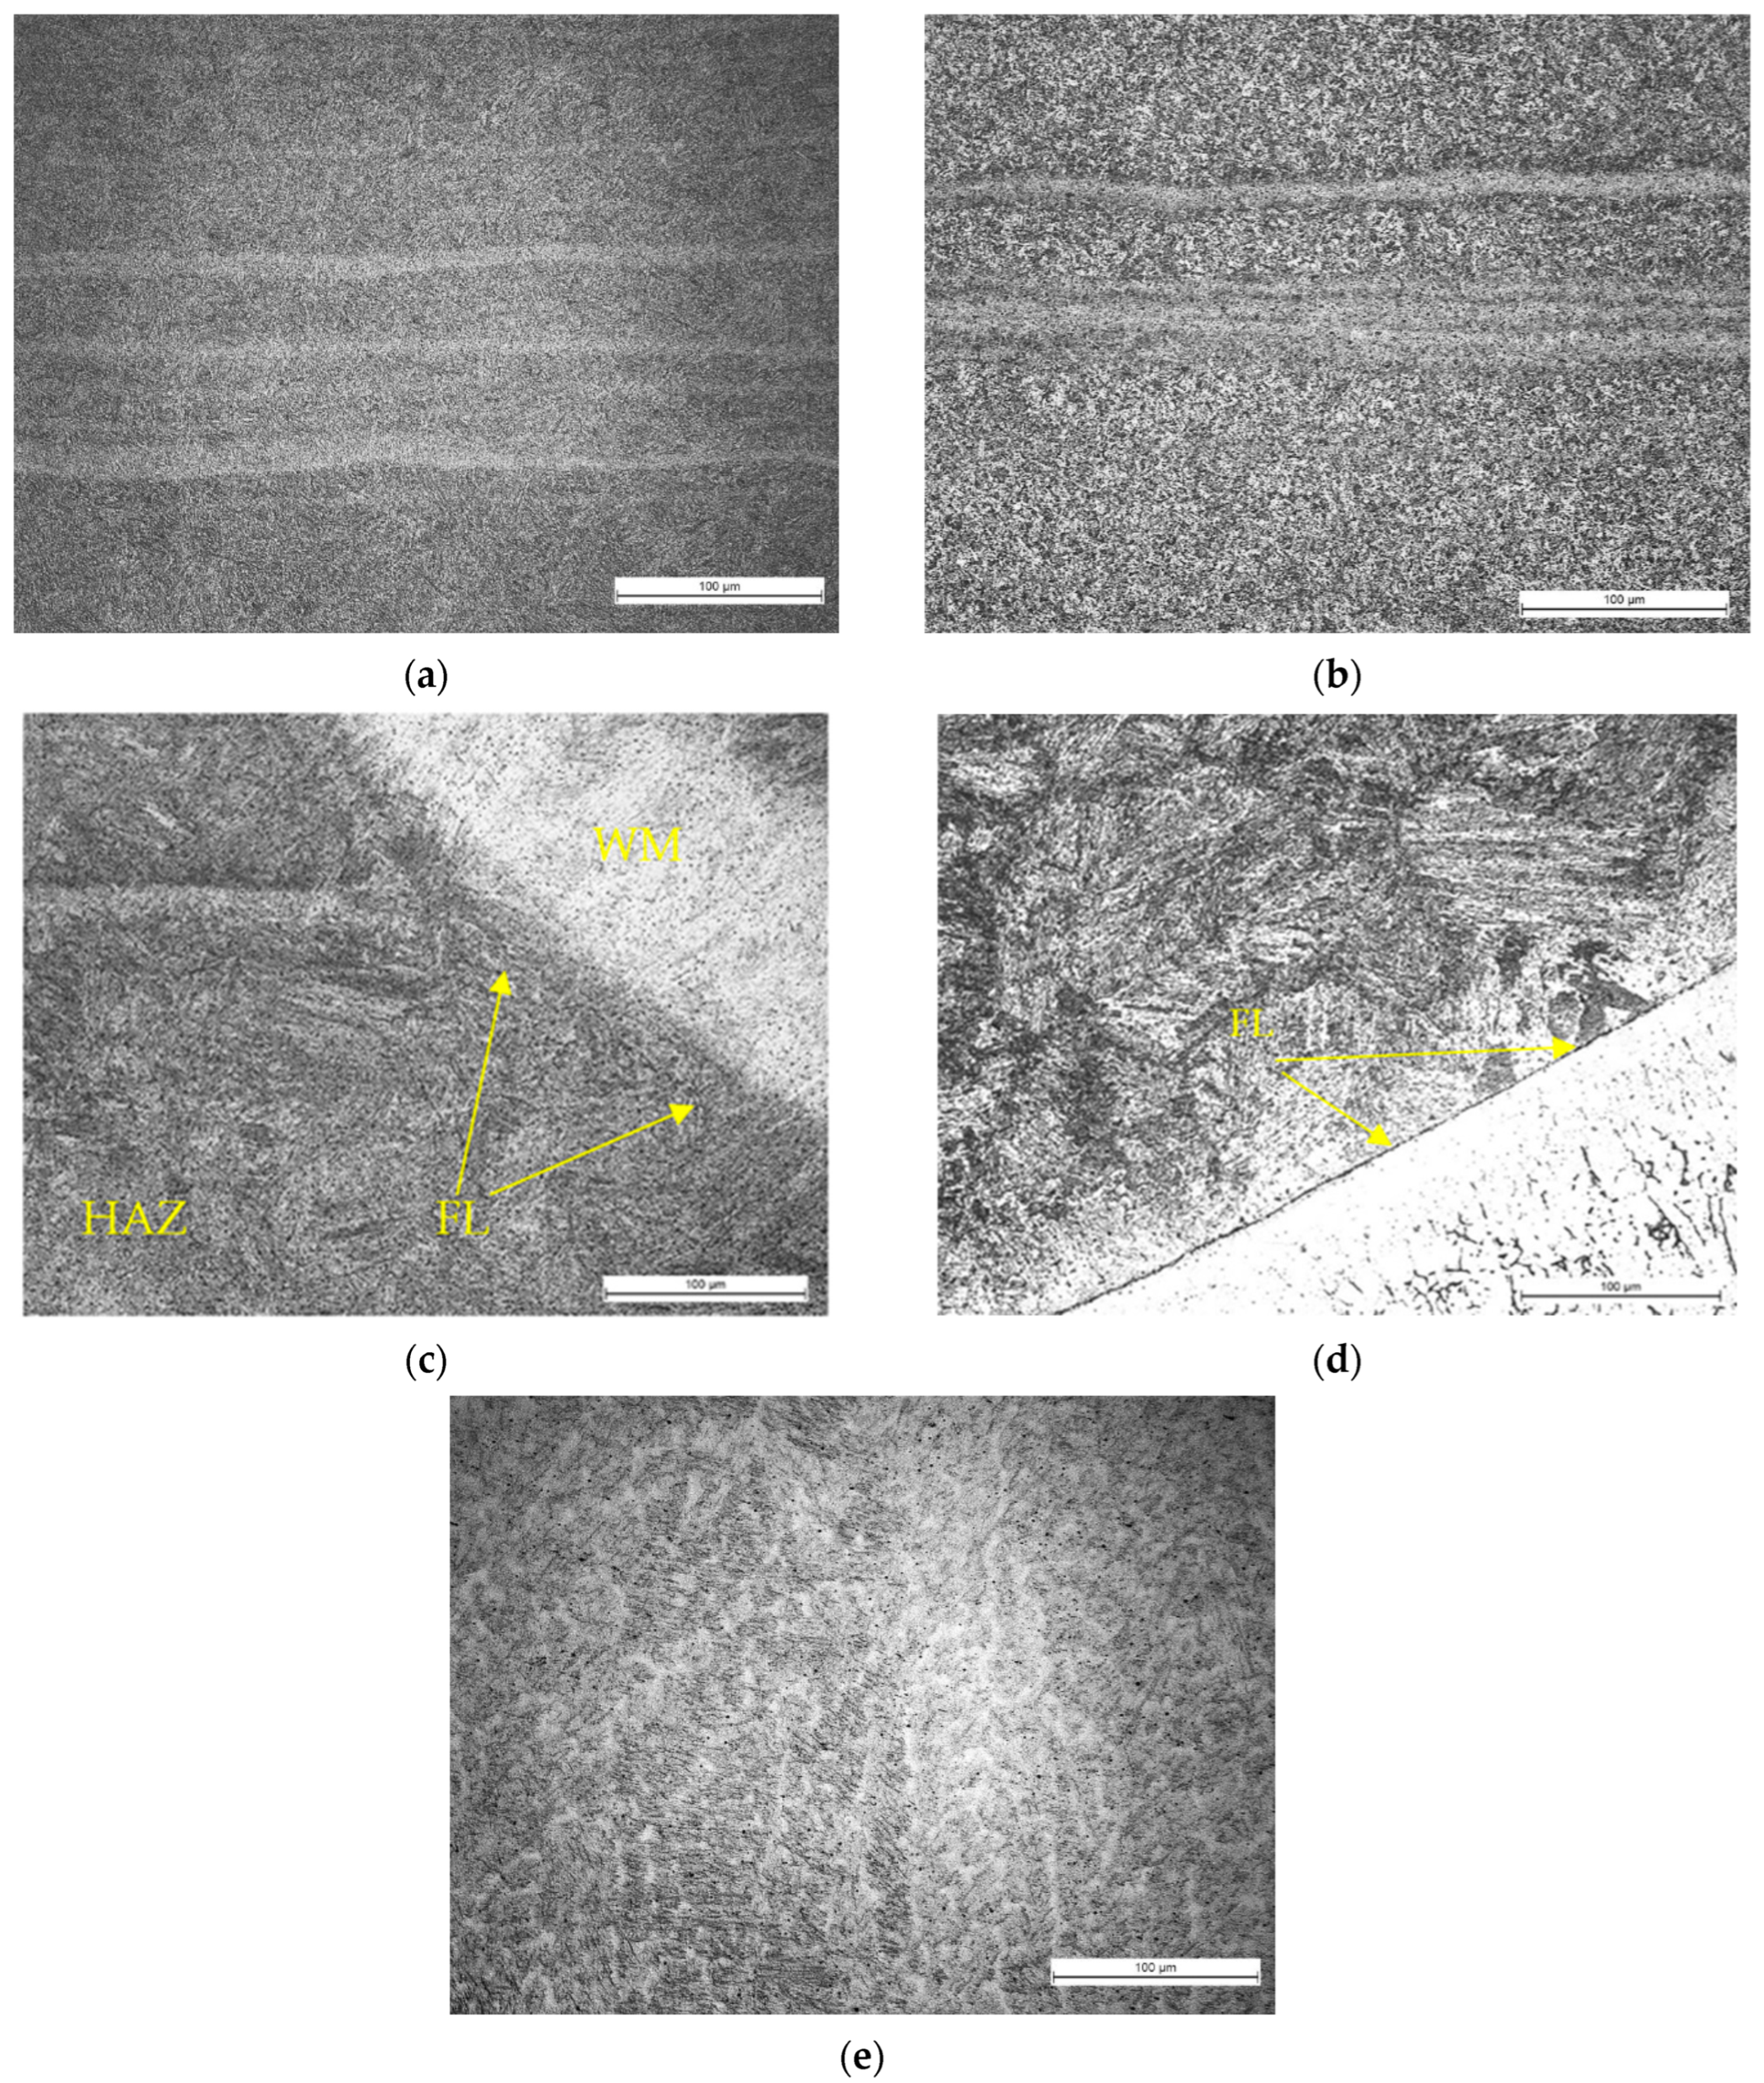
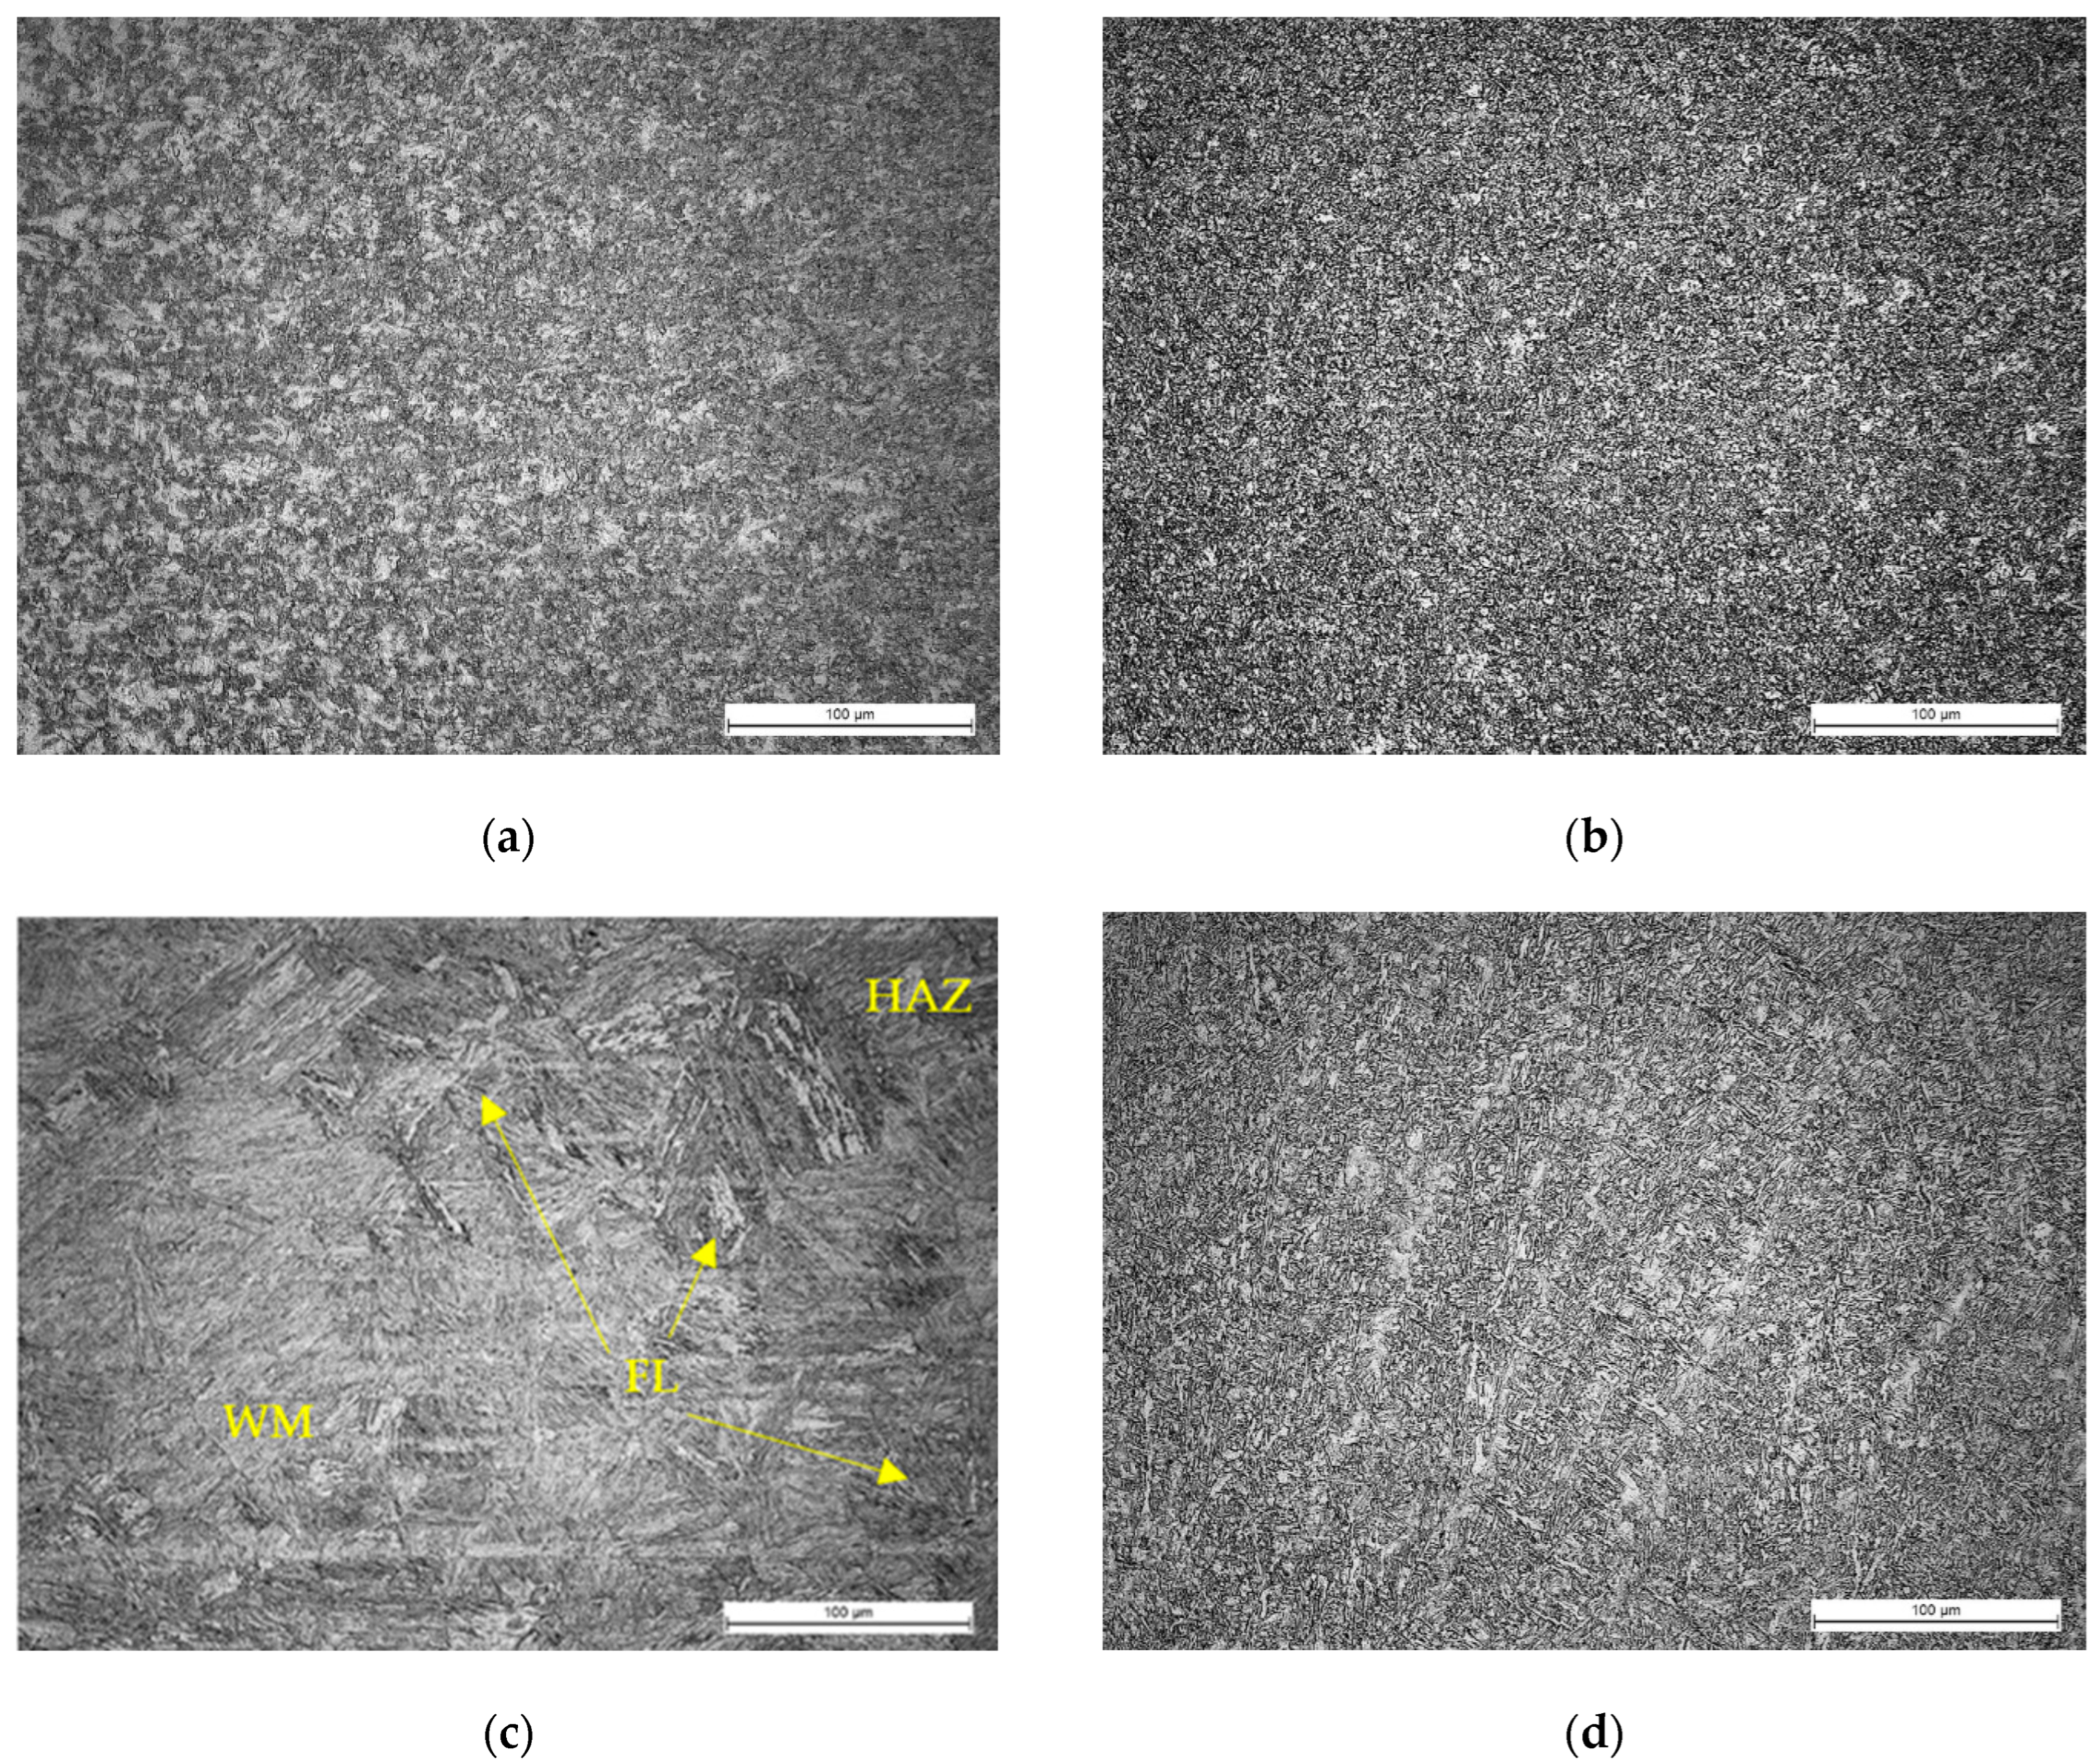
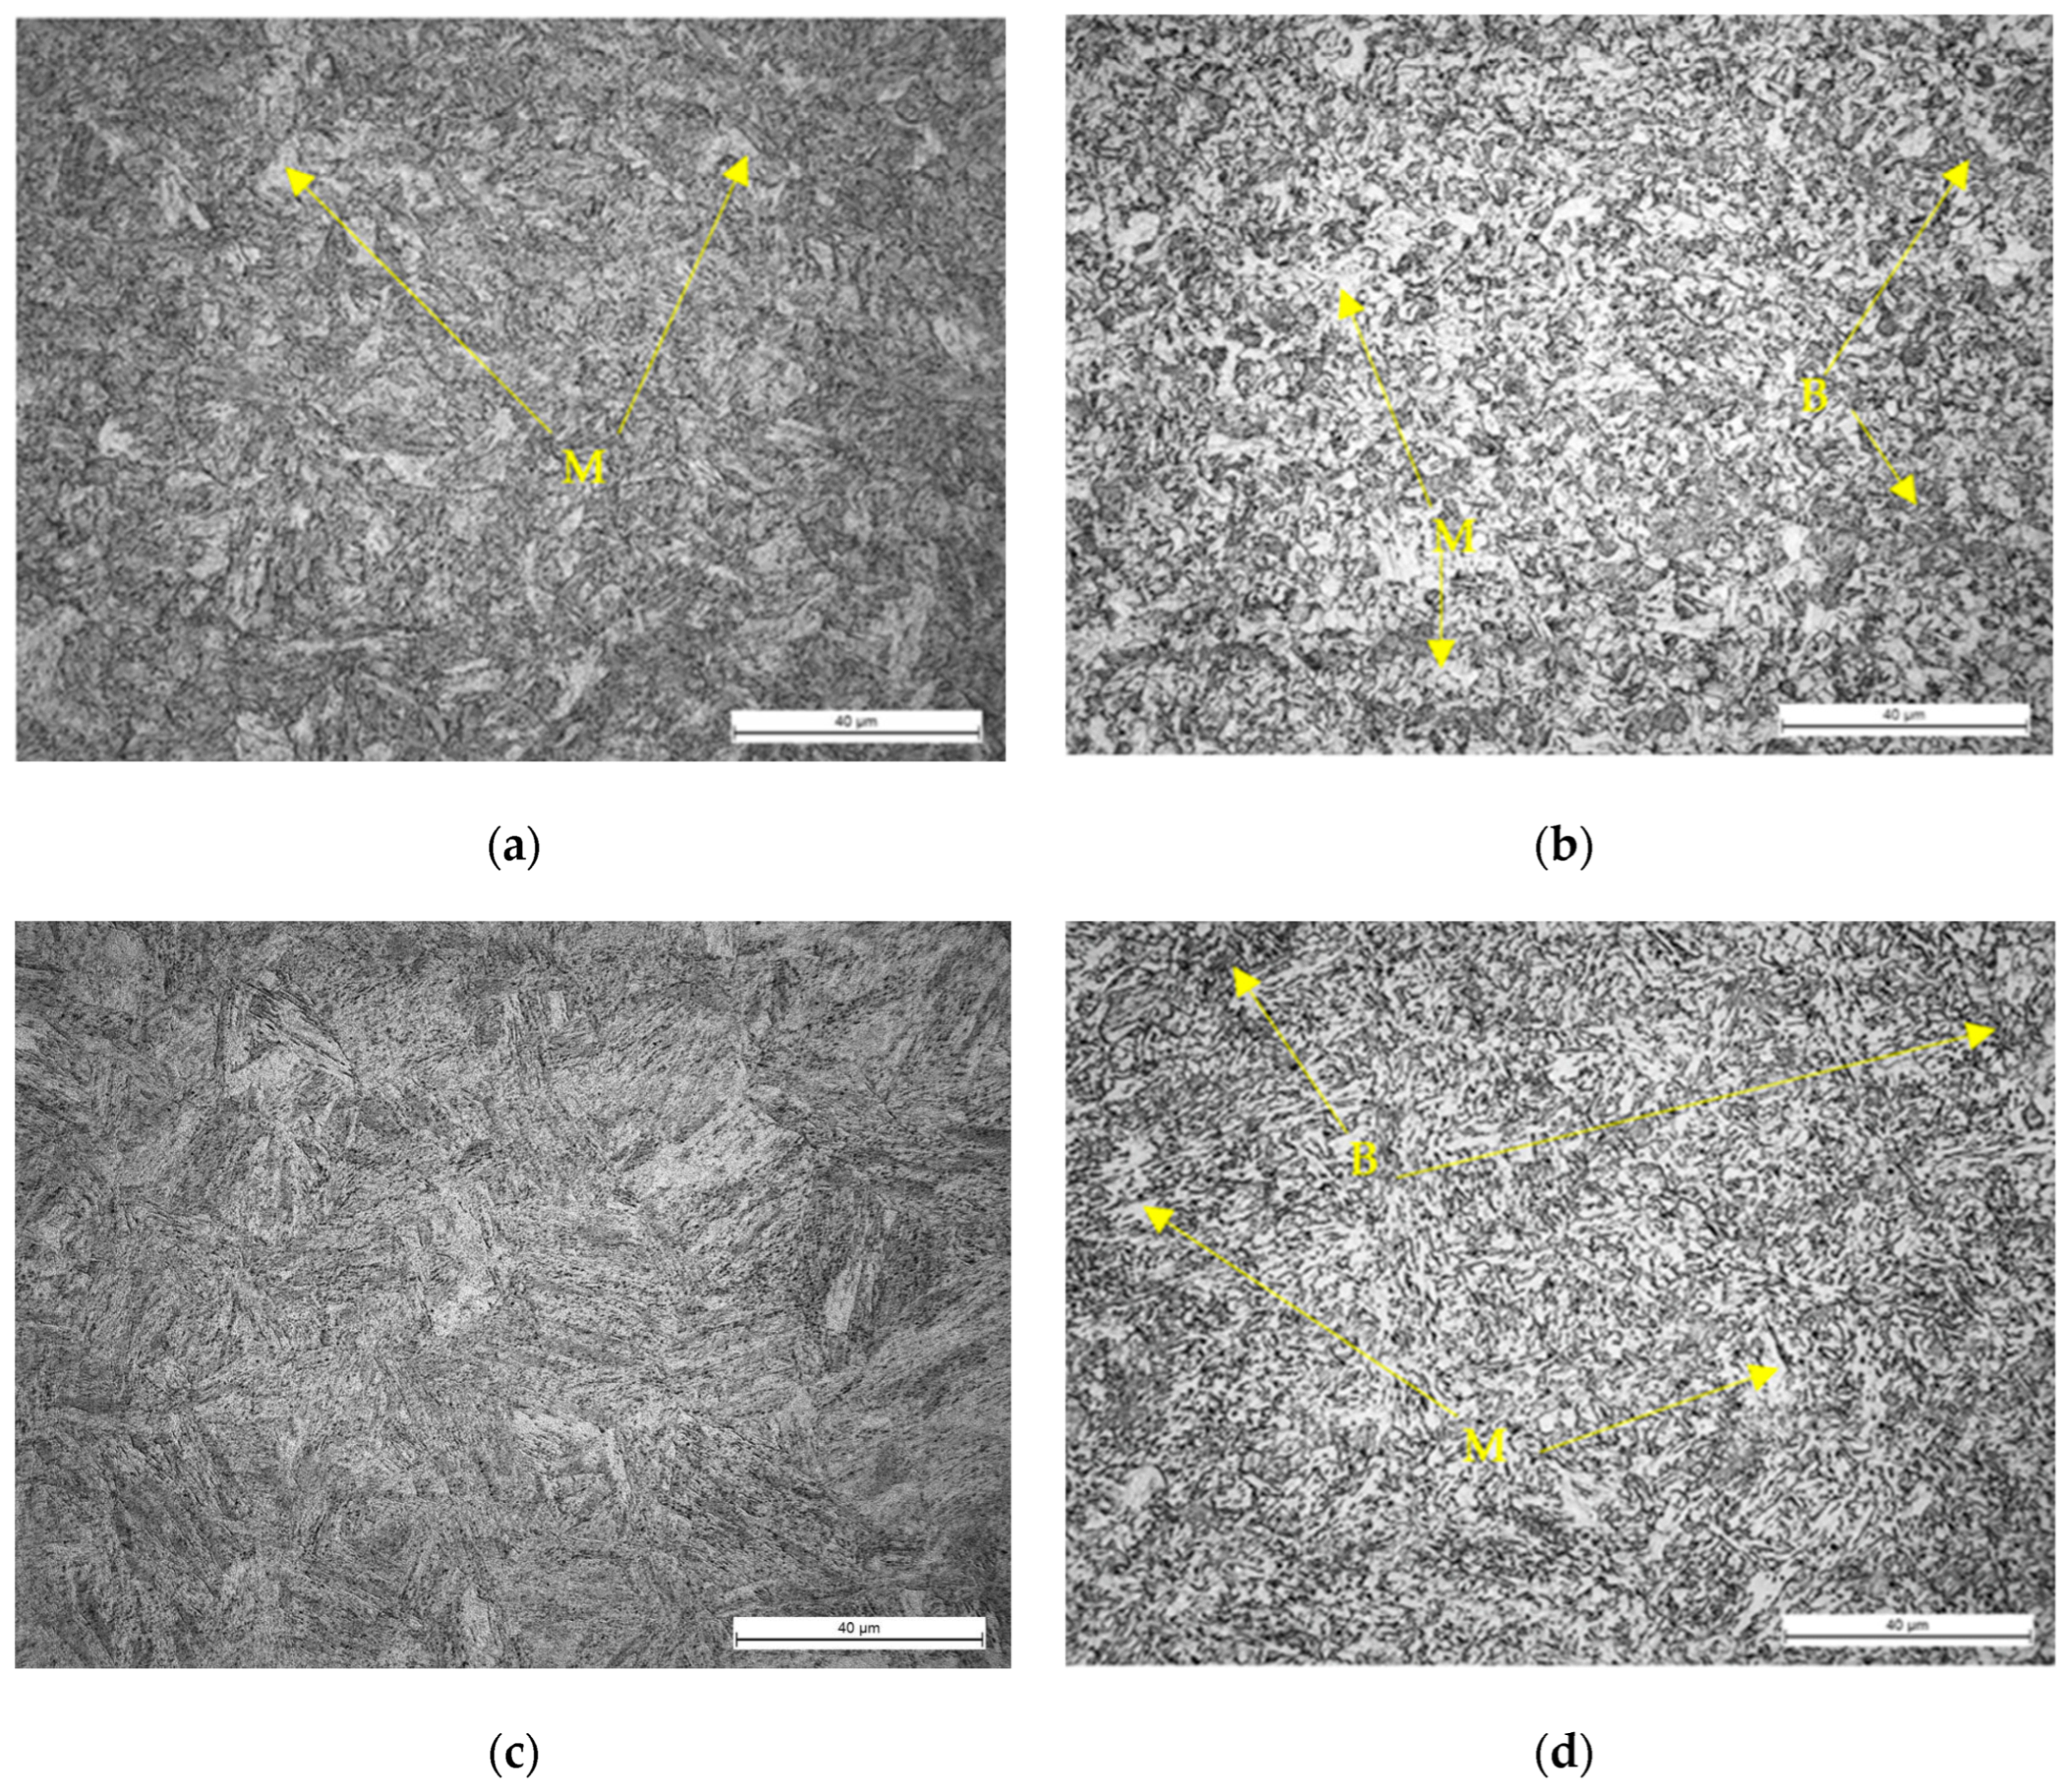
3.2. Metallography Investigation
3.2.1. Technology A
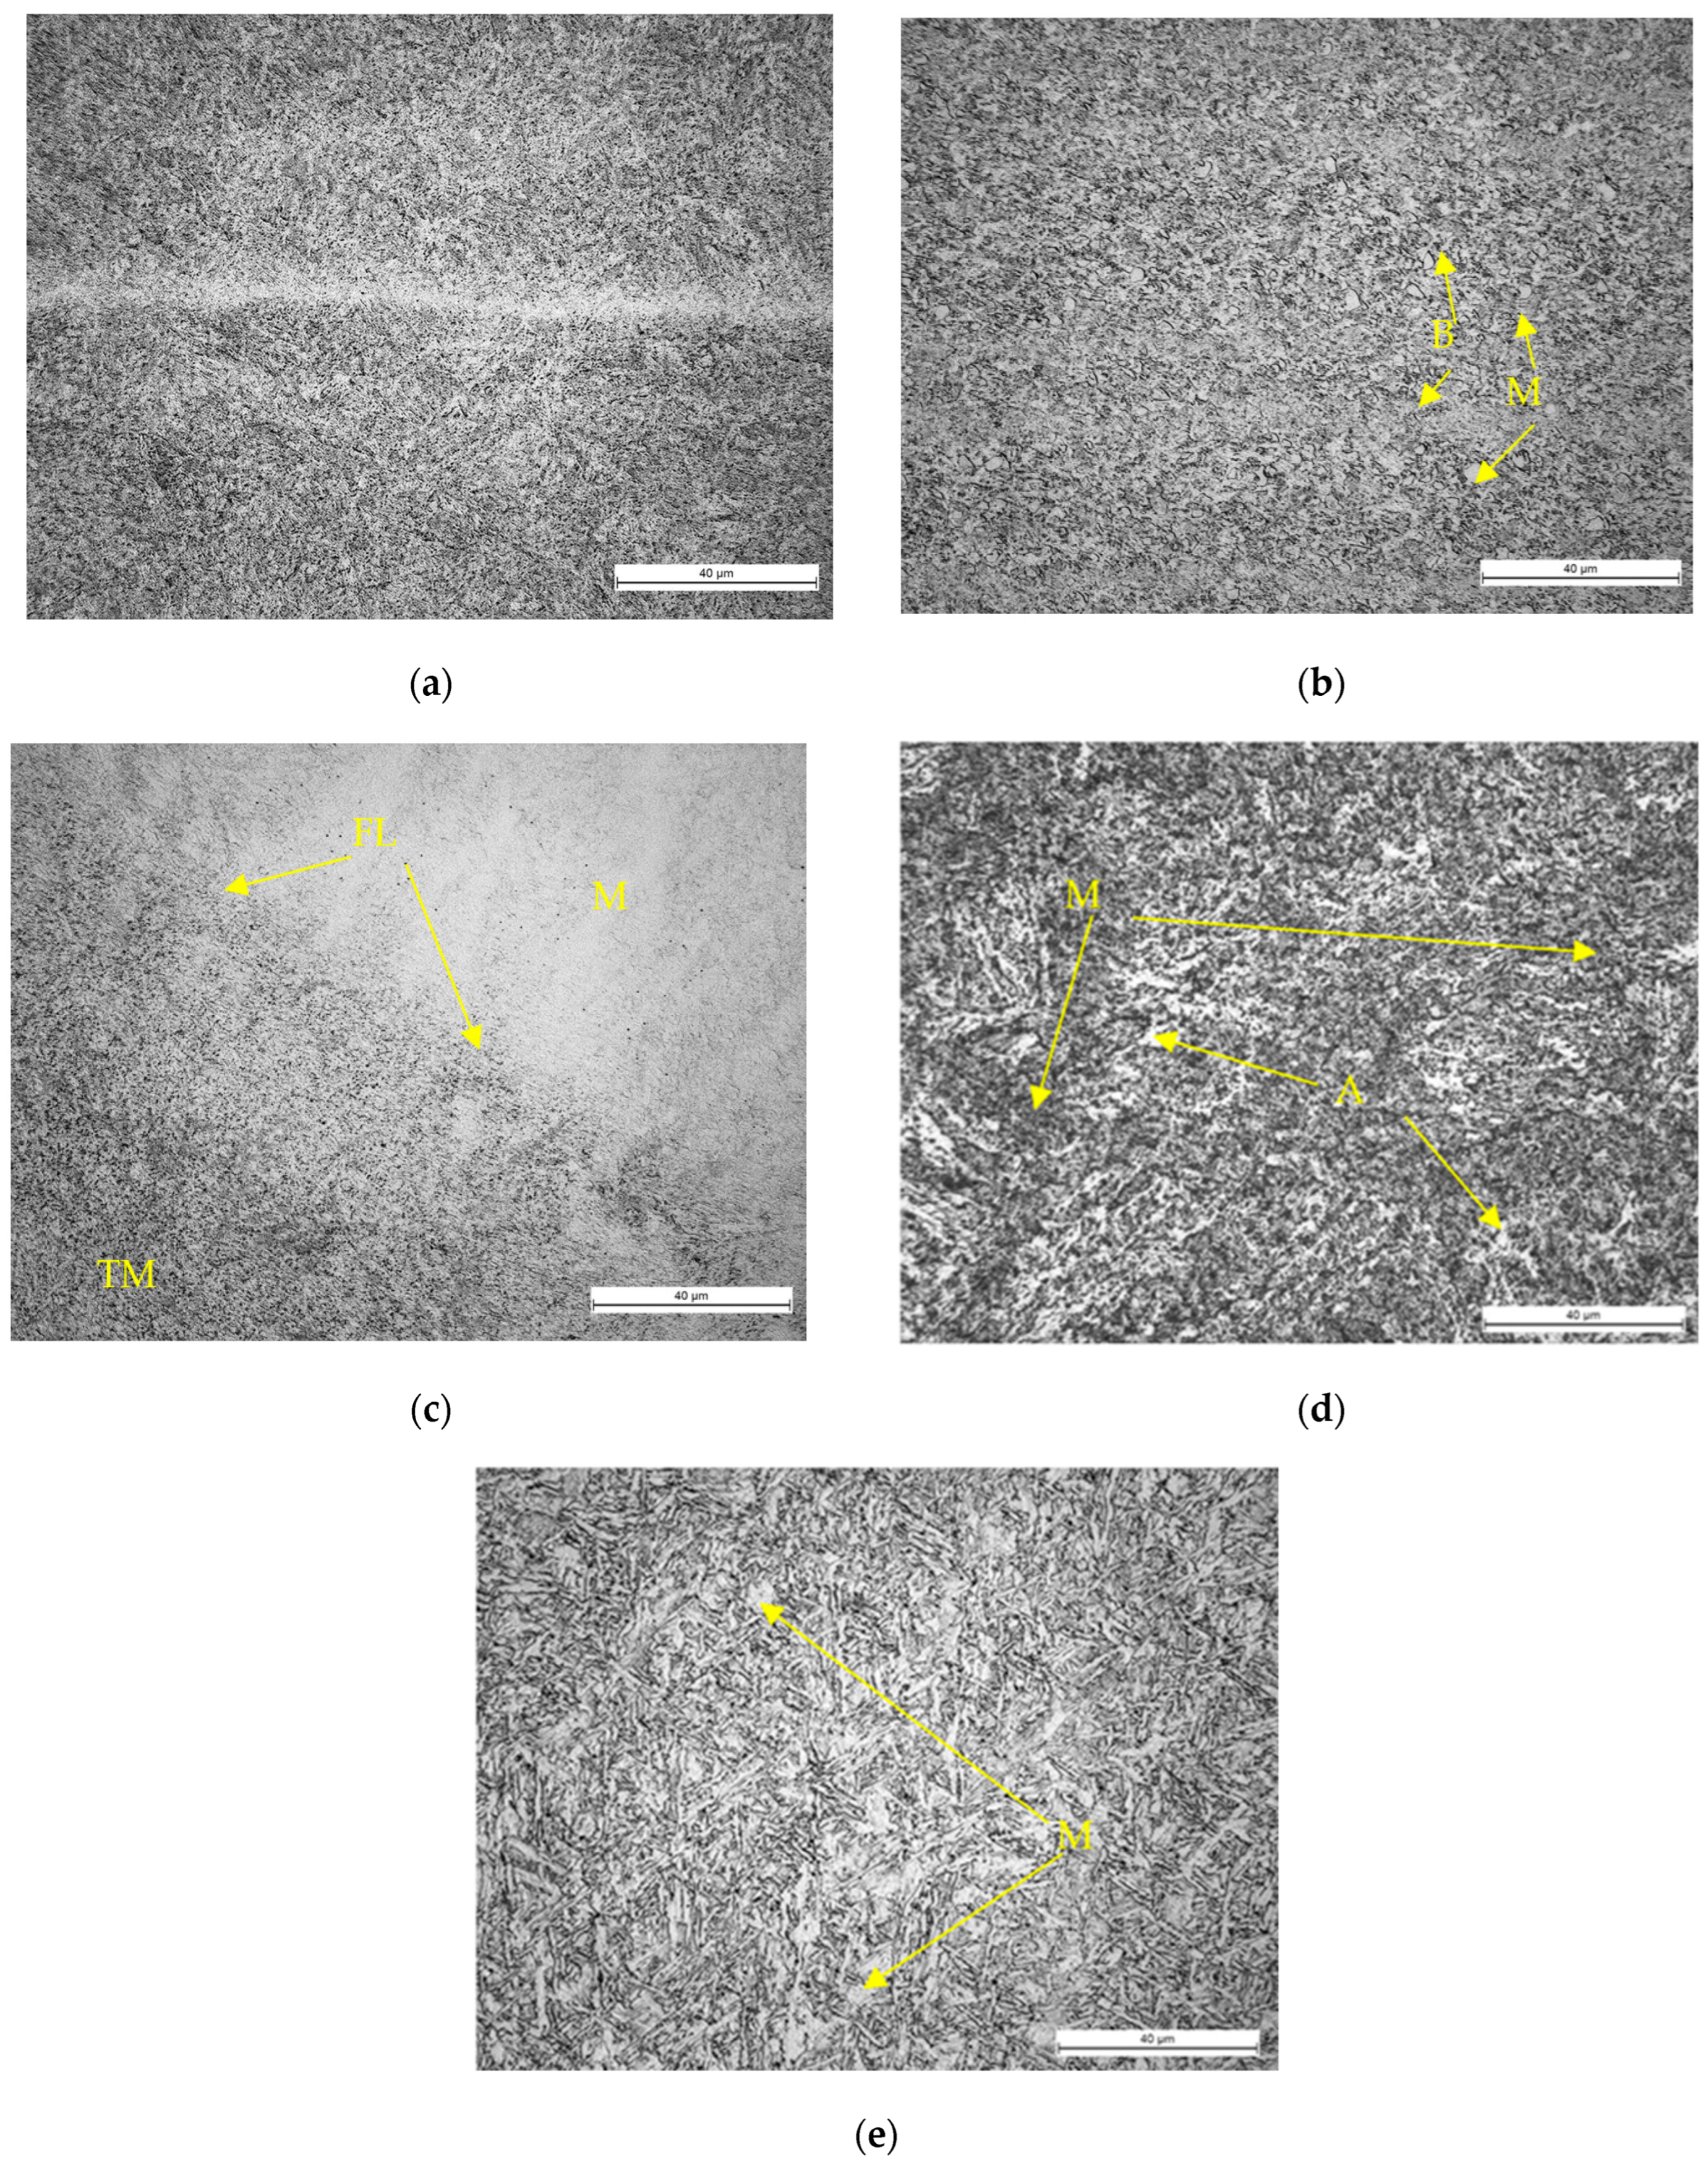
3.2.2. Technology B
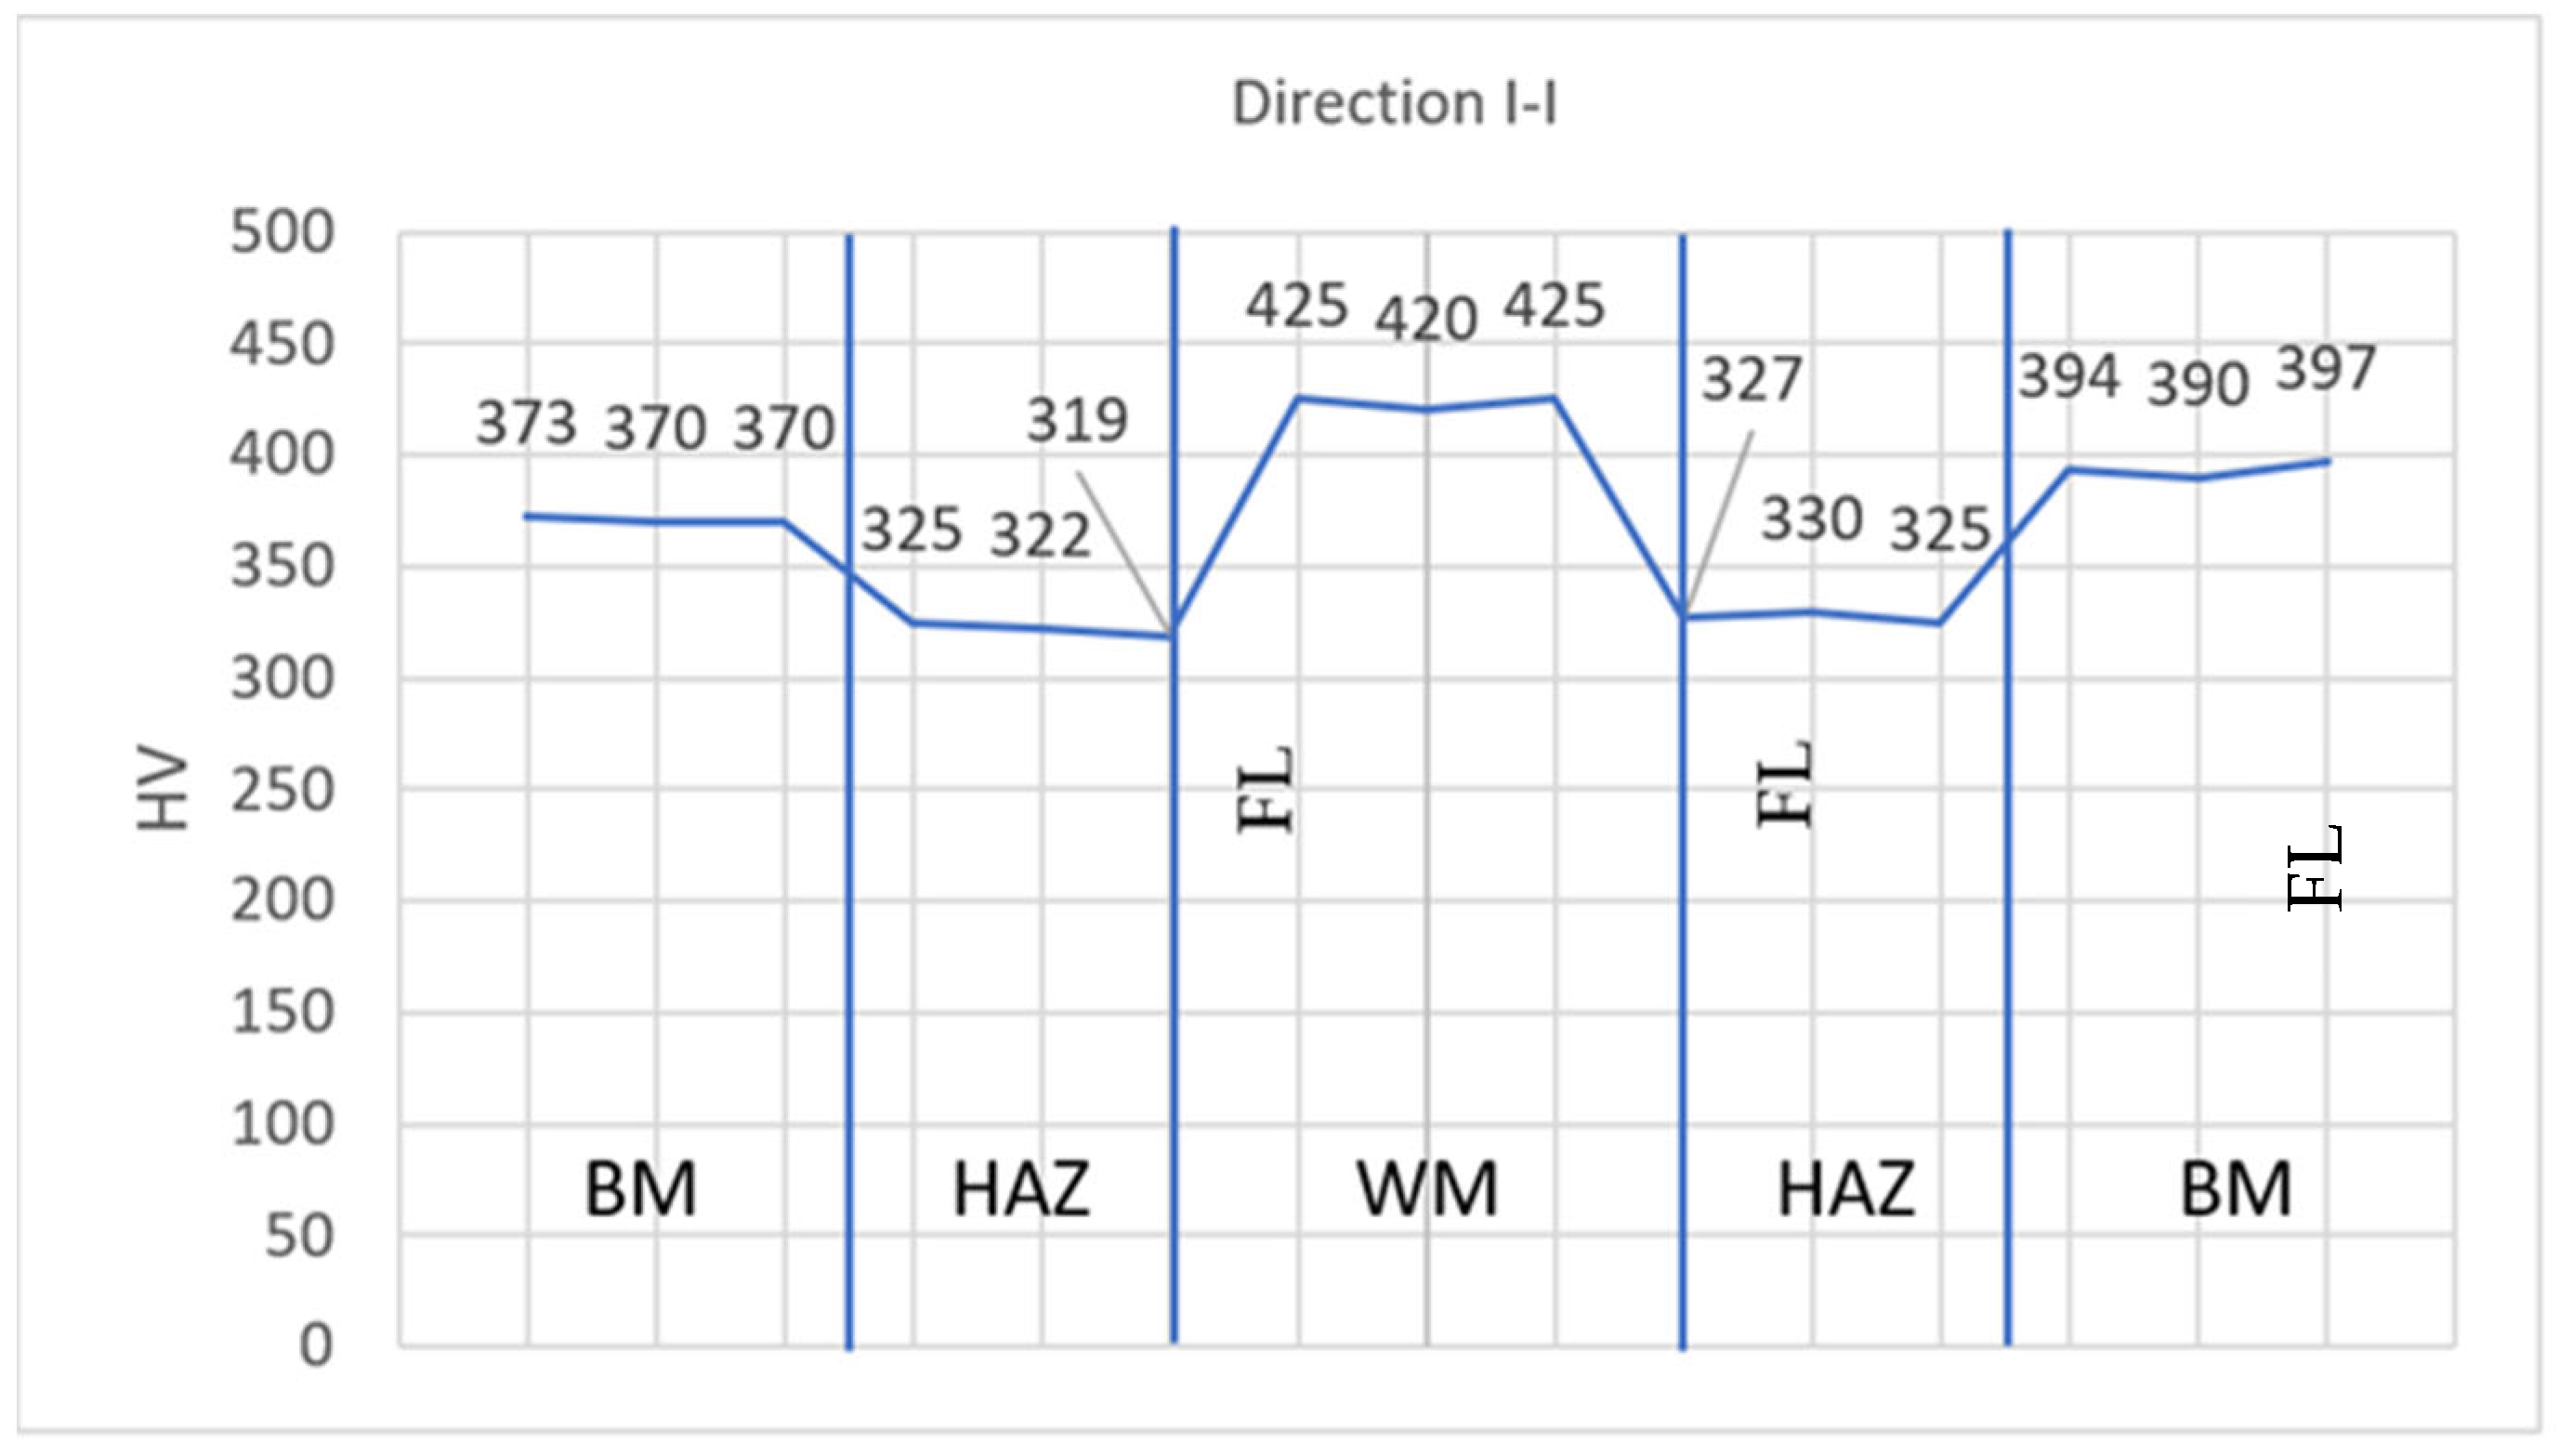
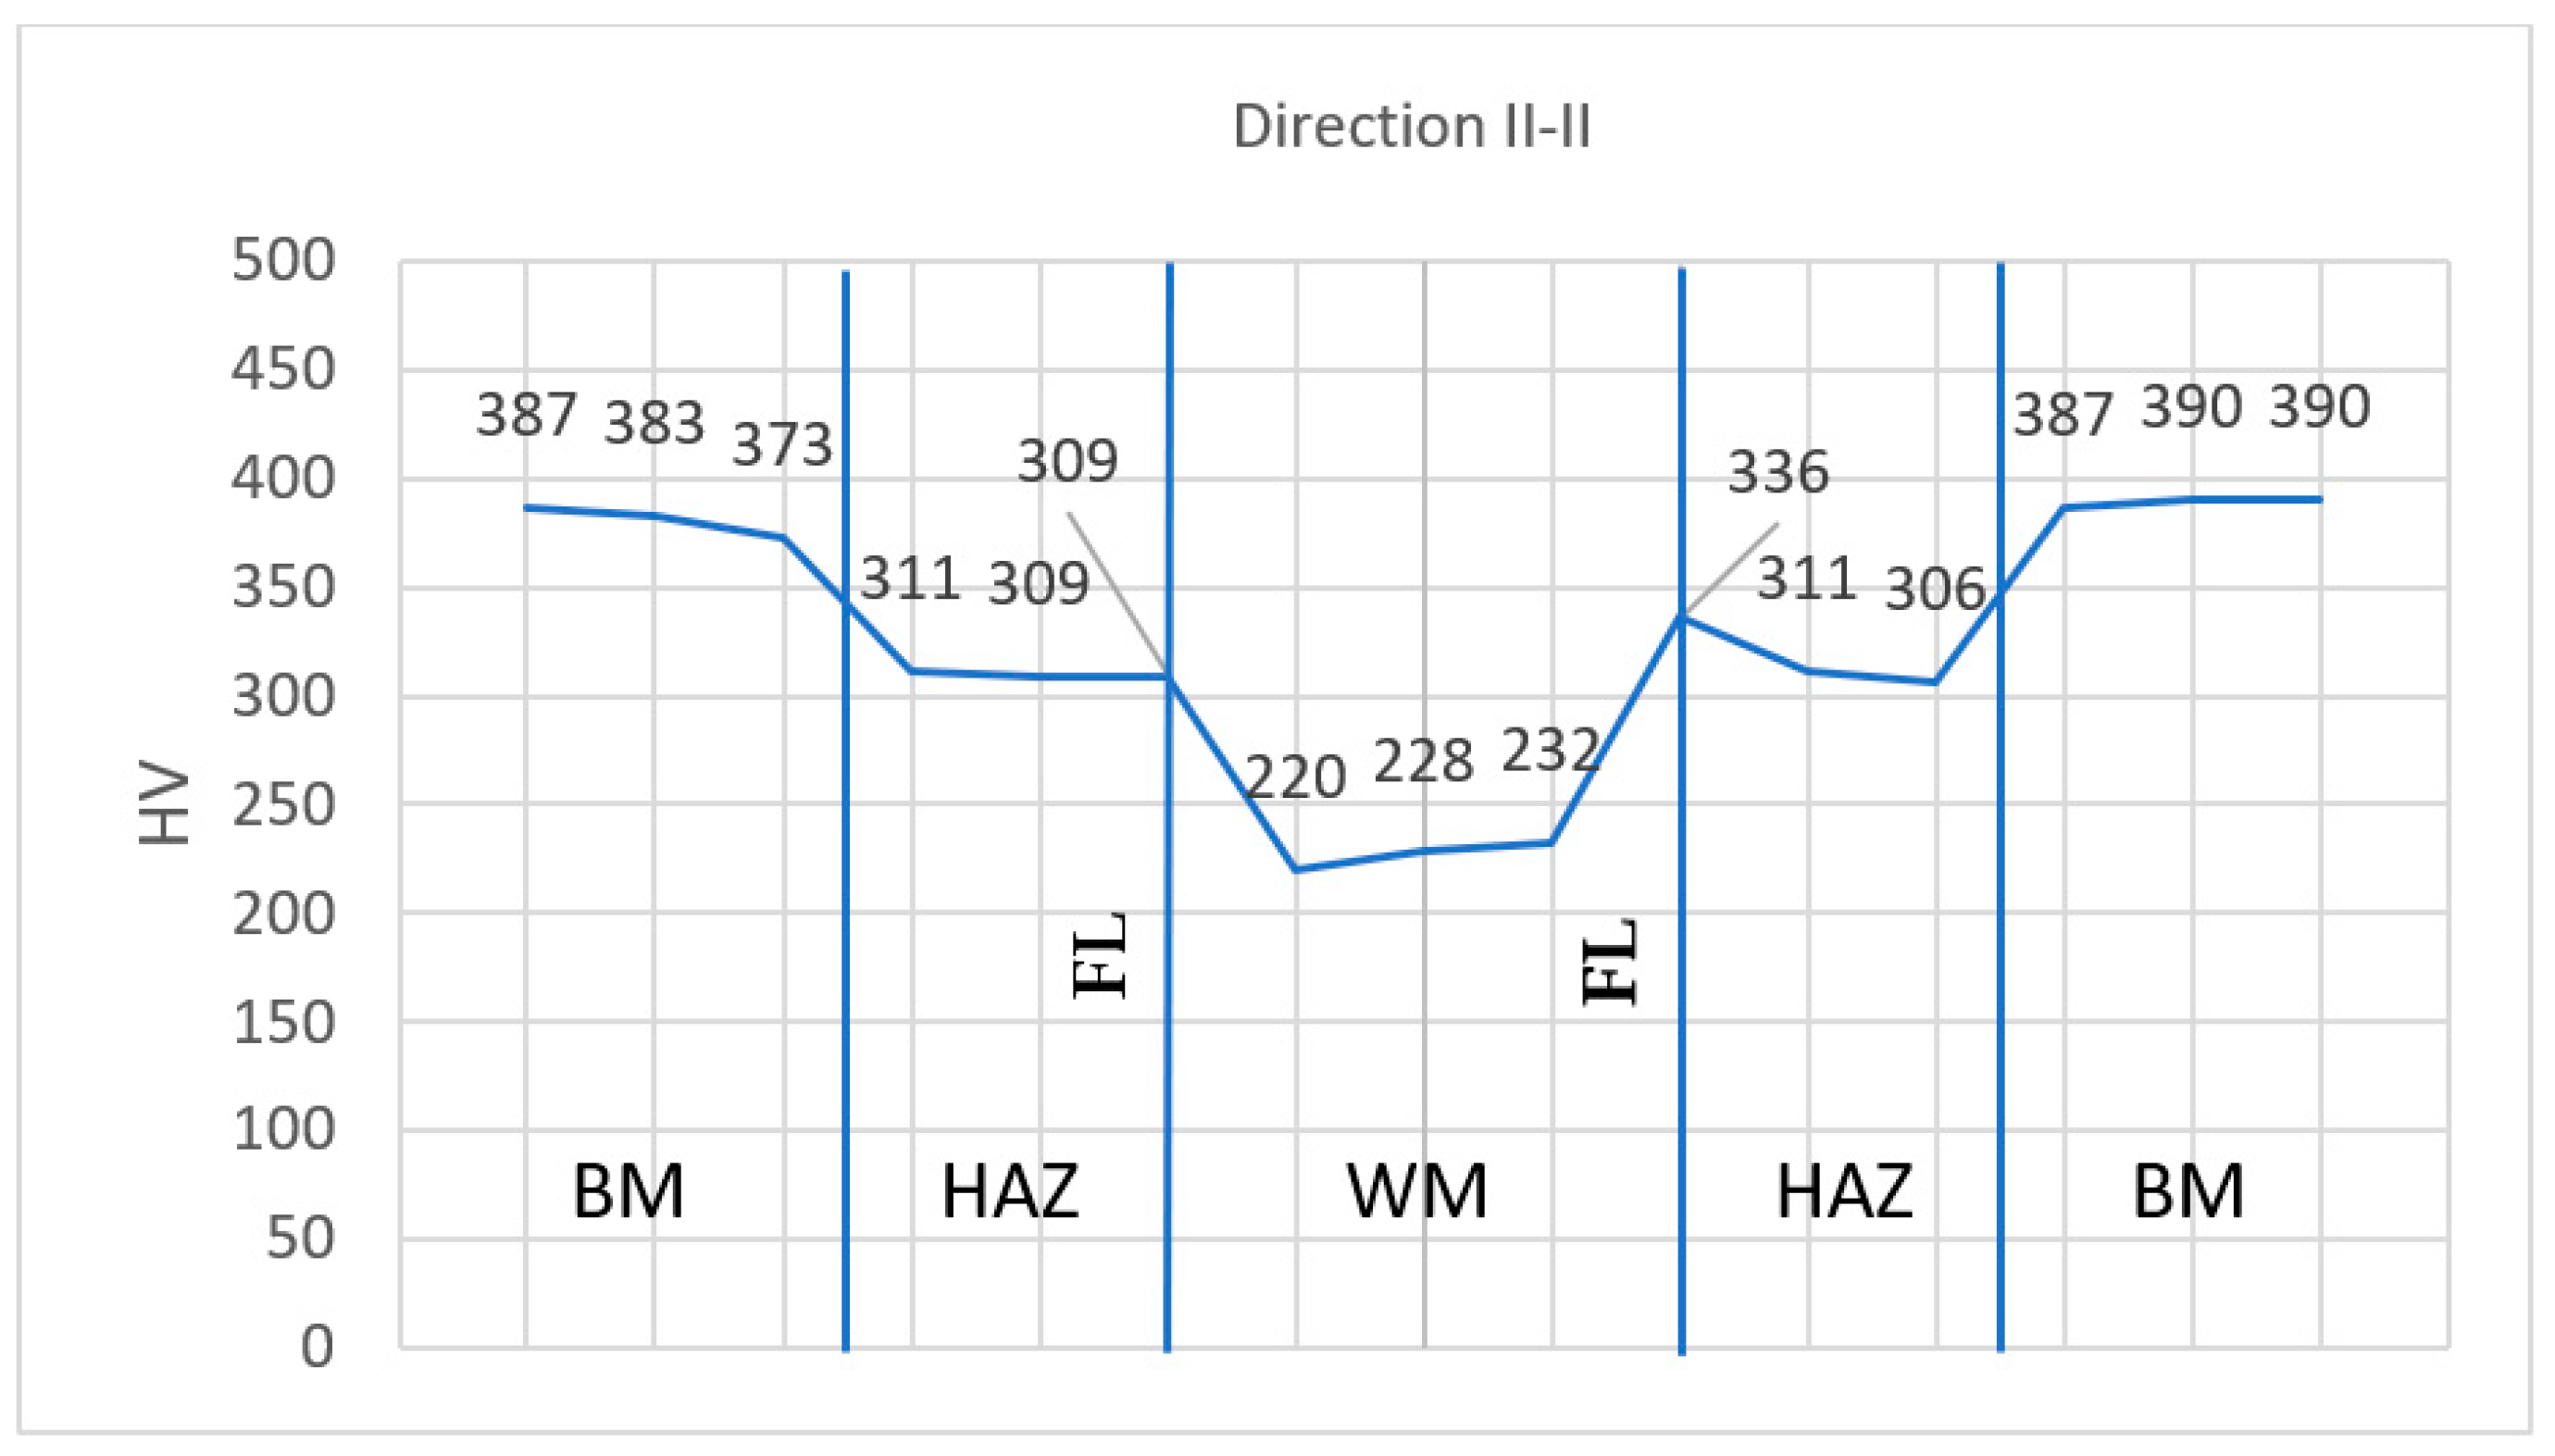
3.3. Hardness Measurement
3.3.1. Technology A
3.3.2. Technology B
4. Discussion
5. Conclusions
- S1100QL holds high strength up to 400 °C. Above this temperature, at 500 °C or above, there is a sudden decrease in the yield stress and ultimate tensile strength. Vice versa, elongation values increase due to the increase in material plasticity. The critical temperature for the use of this steel without significant strength loss is 400 °C.
- The welded specimens indicated that the mechanical properties of the welded joint depend on the applied welding technology. Technology A uses a combination of austenitic and steel filler material, resulting in higher joint strength but lower ductility and structural heterogeneity. These potentially affect the concentration of stress and the presence of local damage.
- Technology B only uses G89 (ARISTOROD 89) filler material and provides welded joints with a homogenous microstructure. This is confirmed throughout the hardness measurement along the entire joint. Even though the strength of the joints is slightly lower compared to technology A, a homogeneous structure contributes to more stable behavior under variable load conditions.
- Analyses of the microstructure confirm the presence of a martensite and bainite structure in the weld metals and heat-affected zones. Depending on the weld technology, differences in phase distribution and grain size are observed. Technology B showed a more uniform microstructure and better integration of the weld zones and the base material.
- For future structures operating at elevated temperatures, application of technology B is recommended, since it provides better reliability and homogeneity of the structure, while technology A is more suitable when high strength is the priority. In this case, careful analysis of loads and operating conditions needs to be conducted.
Author Contributions
Funding
Institutional Review Board Statement
Informed Consent Statement
Data Availability Statement
Acknowledgments
Conflicts of Interest
Correction Statement
References
- Cobb, H.M. The History of Stainless Steel; ASM International Materials Park: Novelty, OH, USA, 2010. [Google Scholar]
- Pang, S.; Wang, W. Fire resistance design of high strength steel H-section columns under axial compression. J. Constr. Steel Res. 2025, 227, 109414. [Google Scholar] [CrossRef]
- Qiang, X.; Jiang, X.; Bijlaard, F.S.K.; Kolstein, H. Mechanical properties and design recommendations of very high strength steel S960 in fire. Eng. Struct. 2016, 112, 60–70. [Google Scholar] [CrossRef]
- Neuenschwander, M.; Scandella, C.; Knobloch, M.; Fontana, M. Modeling elevated-temperature mechanical behavior of high and ultra-high strength steels in structural fire design. Mater. Des. 2017, 136, 81–102. [Google Scholar] [CrossRef]
- Lassi, K.; Kangaspuoskari, M.; Niskanen, J. Ultra high-strength steels at elevated temperatures. J. Constr. Steel Res. 2021, 183, 106739. [Google Scholar] [CrossRef]
- Lazić, V.; Aleksandrović, S.; Arsić, D.; Sedmak, A.; Ilić, A.; Đorđević, M.; Ivanović, L. The influence of temperature on mechanical properties of the base material and welded joint made of steel S690QL. Metallurgy 2016, 55, 213–216. [Google Scholar]
- Arsić, D.; Djordjević, M.; Zivković, J.; Sedmak, A.; Aleksandrović, S.; Lazić, V.; Rakić, D. Experimental-numerical study of tensile strength of the high-strength steel S690QL at elevated temperatures. Strength Mater. 2016, 48, 687–695. [Google Scholar] [CrossRef]
- Arsić, D.; Lazić, V.; Sedmak, A.; Aleksandrović, S.; Živković, J.; Djordjević, M.; Mladenović, G. Effect of the elevated temperatures on mechanical properties of the ultra-high strength hot-work tool steel H11. Trans. Famena 2020, 44, 71–82. [Google Scholar] [CrossRef]
- Ghafouri, M.; Amraei, M.; Pokka, A.-P.; Björk, T.; Larkiola, J.; Piili, H.; Zhao, X.-L. Mechanical properties of butt-welded ultra-high strength steels at elevated temperatures. J. Constr. Steel Res. 2022, 198, 107499. [Google Scholar] [CrossRef]
- Amraei, M.; Ahola, A.; Afkhami, S.; Björk, T.; Heidarpour, A.; Zhao, X.L. Effects of heat input on the mechanical properties of butt-welded high and ultra-high strength steels. Eng. Struct. 2019, 198, 109460. [Google Scholar] [CrossRef]
- Afkhami, S.; Björk, T.; Larkiol, J. Weldability of cold-formed high strength and ultra-high strength steels. J. Constr. Steel Res. 2019, 158, 86–98. [Google Scholar] [CrossRef]
- Afkhami, S.; Skriko, T.; Lipiäinen, K.; Björk, T. Fracture, deformation route, and mechanical performance of welded cold-formed ultra-high strength steel S1100. Procedia Struct. Integr. 2024, 61, 53–61. [Google Scholar] [CrossRef]
- Mandal, S.; Tewary, N.K.; Ghosh, S.K.; Chakrabarti, D.; Chatterjee, S. Thermo-mechanically controlled processed ultra high strength steel: Microstructure, texture and mechanical properties. Mater. Sci. Eng. A 2016, 663, 126–140. [Google Scholar] [CrossRef]
- Javidan, F.; Heidarpour, A.; Zhao, X.L.; Hutchinson, C.R.; Minkkinen, J. Effect of weld on the mechanical properties of high strength and ultra-high strength steel tubes in fabricated hybrid sections. Eng. Struct. 2016, 118, 16–27. [Google Scholar] [CrossRef]
- Moe, Y.A.; Hasib, M.T.; Paul, M.J.; Amraei, M.; Ahola, A.; Kruzic, J.; Heidarpour, A.; Zhao, X.L. Experimental study on the fatigue crack growth rates of welded ultra-high strength steel plates. Adv. Struct. Eng. 2023, 26, 2307–2324. [Google Scholar] [CrossRef]
- Samardžić, I.; Ćorić, A.; Dunđer, M. Weldability investigation of fine-grained S1100QL steel. Metalurgy 2016, 55, 453–456. [Google Scholar]
- Tümer, M.; Pixner, F.; Vallant, R.; Warchomicka, F.G.; Domitner, J.; Enzinger, N. Welding of S1100 Ultra high-Strength Steel Plates with Matching Metal-Cored Filler Wire: Microstructure, Residual Stresses, and Mechanical Properties, Steel. Res. Int. 2024, 95, 2300675. [Google Scholar] [CrossRef]
- Liang, H.; Shi, X.; Li, Y. Effect of Ultrasonic Assistance on Properties of Ultra-High-Strength Steel in Laser-Arc Hybrid Welding. Coatings 2025, 15, 389. [Google Scholar] [CrossRef]
- Available online: https://www.ssab.com/en/brands-and-products/strenx/product-offer/1100/e-f (accessed on 31 March 2025).
- SSAB. A Guide to Better Welding of HARDOX and STRENX, Welding Handbook, 2nd ed.; SSAB: Oxelösund, Sweden, 2019; ISBN 978-91-978573-0-7. [Google Scholar]
- Arsić, D.; Lazić, V.; Nikolić, R.R.; Sczygiol, N.; Krstić, B.; Ivković, D.J.; Hadzima, B.; Pastorek, F.; Ulewicz, R. Weldability Assessment of Various Steels by Hard-Facing. Materials 2022, 15, 3082. [Google Scholar] [CrossRef]
- Jesenice, S.I.E. Catalog of Filler Materials. Available online: https://karikadoo.com/wp-content/uploads/2018/01/Jesenice-katalog.pdf (accessed on 25 November 2023). (In Serbian).
- Available online: https://esab.com/lv/eur_en/products-solutions/product/filler-metals/low-alloy/mig-wires-tig-rods-gmaw-gtaw/ok-aristorod-89/ (accessed on 25 November 2023).
- Christ, H.-J. Fatigue of Carbon and Alloy Steels. In Encyclopedia of Materials: Science and Technology; Buschow, K.H.J., Robert, C., Cahn, R., Merton, C.F., Bernhard, I., Edward, J.K., Subhash, M., Patrick, V., Eds.; Elsevier: Amsterdam, The Netherlands, 2001; pp. 2955–2963. [Google Scholar] [CrossRef]
- Geng, L.; Tian, Z.; Sun, D.; Feng, X.; Zhang, F. Effects of Tempering Temperature on the Microstructure and Mechanical Properties of Vanadium-Microalloyed Medium-Carbon Bainitic Steel. Coatings 2025, 15, 503. [Google Scholar] [CrossRef]
- Zachariah, S.A.; Shenoy, S.; Pai, D. Experimental analysis of the effect of the woven aramid fabric on the strain to failure behavior of plain weaved carbon/aramid hybrid laminates. FACTA Univ. Ser. Mech. Eng. 2024, 22, 13–24. [Google Scholar] [CrossRef]
- Prijanovič, U.; Prijanovič, T.M.; Trdan, U.; Pleterski, M.; Jezeršek, M.; Klobčar, D. Remote Fibre Laser Welding of Advanced High Strength Martensitic Steel. Metals 2020, 10, 533. [Google Scholar] [CrossRef]
- Younise, B.; Rakin, M.; Gubeljak, N.; Medjo, B.; Sedmak, A. Effect of material heterogeneity and constraint conditions on ductile fracture resistance of welded joint zones—Micromechanical assessment. Eng. Fail. Anal. 2017, 82, 435–445. [Google Scholar] [CrossRef]
- Busari, Y.O.; Manurung, Y.H.P. Welded high strength low alloy steel influence on fatigue crack propagation using LEFM: A practical and thematic review. Struct. Int. Life 2020, 20, 263–279. [Google Scholar]


| Yield Strength, Rp0.2, MPa | Tensile Strength, Rm, MPa | Elongation, A5, % | Impact Toughness, KV(−40), J |
|---|---|---|---|
| min 1100 | 1250–1550 | min 10 | min 27 |
| %C | %Si | %Mn | %P | %S | %Cr | %Cu | %Ni | %Mo | %B |
|---|---|---|---|---|---|---|---|---|---|
| max 0.21 | max 0.5 | max 1.4 | max 0.02 | max 0.005 | max 0.8 | max 0.3 | max 3 | max 0.7 | max 0.005 |
| Technology A: Without Preheating | |||
|---|---|---|---|
| Preheating Temperature | Max 120 °C | ||
| Heat input | 8–12 kJ/cm | ||
| Filler materials | Root pass | G 18 8 Mn (according to EN 12072) | M12 shielding gas (according to ISO 14175) |
| Filler passes | G 89 (according to EN ISO 16834) | M21 shielding gas (according to ISO 14175) | |
| Technology B: With Preheating | |||
|---|---|---|---|
| Preheating Temperature | Max 200 °C | ||
| Heat input | 8–12 kJ/cm | ||
| Filler materials | Root and filler passes Filler passes | G 89 (according to EN IS 16834) | M21 shielding gas (according to ISO 14175) |
| %C | %Mn | %Si | %Ni | %Cr |
|---|---|---|---|---|
| 0.08 | 7.0 | 0.8 | 9.0 | 18.5 |
| Rp0.2, MPa | Rm, MPa | A5, % | KV20°C, J |
|---|---|---|---|
| min 320 | 560–660 | 35 | min 40 |
| Welding Current, I, A | Welding Voltage, U, V | Shielding Gas |
|---|---|---|
| N/A | N/A | M12 (97.5% Ar + 2.5% CO2) |
| %C | %Mn | %Si | %Ni | %Cr | %Mo |
|---|---|---|---|---|---|
| 0.081 | 1.75 | 0.8 | 2.22 | 0.41 | 0.533 |
| Rp0.2, % | Rm, % | A | KV−40°C, J |
|---|---|---|---|
| 920 | 960 | 18 | 55 |
| Welding Current, I, A | Welding Voltage, U, V | Shielding Gas |
|---|---|---|
| 80–280 | 18–28 | M21 (82% Ar + 18% CO2) |
| Type of Pass | No. of Pass | I, A | U, V | Tp, °C | vz, cm/s | ql, J/cm | Q, l/min | Ti, °C |
|---|---|---|---|---|---|---|---|---|
| Root pass | 1 | 175 | 22 | 120 | 0.4 | 7700 | 20 | 120 |
| 2 | 175 | 22 | 120 | 0.4 | 7700 | 20 | 120 | |
| 3 | 175 | 22 | 120 | 0.4 | 7700 | 20 | 120 | |
| Filler pass | 4 | 250 | 30.1 | 175 | 0.6 | 10,033 | 20 | 175 |
| 5 | 250 | 30.1 | 175 | 0.6 | 10,033 | 20 | 175 |
| Type of Pass | No. of Pass | I, A | U, V | Tp, °C | vz, cm/s | ql, J/cm | Q, l/min | Ti, °C |
|---|---|---|---|---|---|---|---|---|
| Root pass | 1 | 180 | 23.6 | 175 | 0.4 | 8496 | 20 | 175 |
| Filler pass | 2 | 250 | 30.1 | 175 | 0.6 | 10,033 | 20 | 175 |
| 3 | 250 | 30.1 | 175 | 0.6 | 10,033 | 20 | 175 | |
| 4 | 250 | 30.1 | 175 | 0.67 | 8985 | 20 | 175 | |
| 5 | 250 | 30.1 | 175 | 0.67 | 8985 | 20 | 175 |
| Rp0.2, MPa | Rm, MPa | A, % | |
|---|---|---|---|
| 1 | 1140.47 | 1391.77 | 7.30 |
| 2 | 1192.86 | 1395.10 | 7.73 |
| Specimen Number | Rp0.2, MPa | Rm, MPa | A, % | T, °C |
|---|---|---|---|---|
| 1 | 1131.99 | 1379.02 | 6.86 | 100 |
| 2 | 1112.99 | 1374.06 | 6.77 | 100 |
| 3 | 1101.49 | 1370.09 | 5.35 | 200 |
| 4 | 1076.79 | 1375.45 | 6.05 | 200 |
| 5 | 1052.00 | 1416.95 | 7.85 | 300 |
| 6 | 1055.72 | 1436.45 | 7.43 | 300 |
| 7 | 1045.55 | 1373.82 | 12.07 | 400 |
| 8 | 1031.73 | 1334.91 | 12.35 | 400 |
| 9 | 876.27 | 983.98 | 7.21 | 500 |
| 10 | 846.36 | 936.09 | 7.87 | 500 |
| 11 | 568.02 | 627.38 | 10.51 | 600 |
| 12 | 575.58 | 606.96 | 13.55 | 600 |
| 13 | 253.95 | 272.49 | 30.07 | 700 |
| 14 | 241.66 | 259.30 | 38.8 | 700 |
| T, °C | Rp0.2, MPa Mean Value | Rp0.2, MPa Standard Deviation | Rm, MPa Mean Value | Rm, MPa Standard Deviation | A, % Mean Value | A, % Standard Deviation |
|---|---|---|---|---|---|---|
| RT | 1166.67 | 37.05 | 1393.44 | 2.35 | 7.52 | 0.30 |
| 100 | 1122.49 | 13.44 | 1376.54 | 3.51 | 6.82 | 0.06 |
| 200 | 1089.14 | 17.47 | 1372.77 | 3.79 | 5.70 | 0.49 |
| 300 | 1053.86 | 2.63 | 1426.70 | 13.79 | 7.64 | 0.30 |
| 400 | 1038.64 | 9.77 | 1354.37 | 27.51 | 12.21 | 0.20 |
| 500 | 861.32 | 21.15 | 960.04 | 33.86 | 7.54 | 0.47 |
| 600 | 571.80 | 5.35 | 617.17 | 14.44 | 12.03 | 2.15 |
| 700 | 247.81 | 8.69 | 265.90 | 9.33 | 34.44 | 6.17 |
| T, °C | Confidence Interval Rp0.2, MPa | Confidence Interval Rm, MPa | Confidence Interval A, % | |||
|---|---|---|---|---|---|---|
| Lower Bound | Upper Bound | Lower Bound | Upper Bound | Lower Bound | Upper Bound | |
| RT | 833.83 | 1726.27 | 1372.28 | 1414.59 | 4.78 | 10.25 |
| 100 | 1001.78 | 1243.20 | 1345.03 | 1408.05 | 6.24 | 7.39 |
| 200 | 932.22 | 1246.06 | 1338.72 | 1406.82 | 1.25 | 10.15 |
| 300 | 1030.23 | 1077.49 | 1302.81 | 1550.59 | 4.97 | 10.31 |
| 400 | 950.84 | 1126.44 | 1107.17 | 1601.56 | 10.43 | 13.99 |
| 500 | 671.29 | 1051.34 | 655.78 | 1264.29 | 3.35 | 11.73 |
| 600 | 523.77 | 619.83 | 487.44 | 746.90 | 0 | 31.34 |
| 700 | 169.73 | 325.88 | 182.10 | 349.69 | 0 | 89.90 |
| Specimen Number | Rp0.2, MPa | Rm, MPa | A, % |
|---|---|---|---|
| 1 | 884.97 | 1016.28 | 4.23 |
| 2 | 800.20 | 1000.67 | 5.79 |
| Specimen Number | Rp0.2, MPa | Rm, MPa | A, % | T, °C |
|---|---|---|---|---|
| 1 | 915.69 | 968.23 | 4.71 | 100 |
| 2 | 880.88 | 897.5 | 0.48 | 100 |
| 3 | 858.69 | 894.07 | 0.64 | 200 |
| 4 | 825.52 | 887.71 | 4.97 | 200 |
| 5 | 852.13 | 931.32 | 5.28 | 300 |
| 6 | 883.52 | 958.46 | 5.01 | 300 |
| 7 | 816.72 | 936.12 | 2.54 | 400 |
| 8 | 875.85 | 956.8 | 6.78 | 400 |
| 9 | 725.2 | 752.4 | 6.43 | 500 |
| 10 | 719.94 | 761.36 | 7.35 | 500 |
| 11 | 570.31 | 582.9 | 7.27 | 600 |
| 12 | 507.88 | 528.87 | 1.95 | 600 |
| 13 | 255.57 | 270.12 | 17.61 | 700 |
| 14 | 239.91 | 253.56 | 21.24 | 700 |
| T, °C | Rp0.2, MPa Mean Value | Rp0.2, MPa Standard Deviation | Rm, MPa Mean Value | Rm, MPa Standard Deviation | A, % Mean Value | A, % Standard Deviation |
|---|---|---|---|---|---|---|
| RT | 842.59 | 59.94 | 1008.48 | 11.04 | 5.01 | 1.10 |
| 100 | 898.29 | 24.61 | 932.87 | 50.01 | 2.60 | 2.99 |
| 200 | 842.11 | 23.45 | 890.89 | 4.50 | 2.81 | 3.06 |
| 300 | 867.83 | 22.20 | 944.89 | 19.19 | 5.15 | 0.19 |
| 400 | 846.29 | 41.81 | 946.46 | 14.62 | 4.66 | 3.00 |
| 500 | 722.57 | 3.72 | 756.88 | 6.34 | 6.89 | 0.65 |
| 600 | 539.10 | 44.14 | 555.89 | 38.20 | 4.61 | 3.76 |
| 700 | 247.74 | 11.07 | 261.84 | 11.71 | 19.43 | 2.57 |
| T, °C | Confidence Interval Rp0.2, MPa | Confidence Interval Rm, MPa | Confidence Interval A, % | |||
|---|---|---|---|---|---|---|
| Lower Bound | Upper Bound | Lower Bound | Upper Bound | Lower Bound | Upper Bound | |
| RT | 304.03 | 1381.14 | 909.30 | 1107.65 | 0 | 14.92 |
| 100 | 677.13 | 1119.44 | 483.51 | 1382.22 | 0 | 29.47 |
| 200 | 631.37 | 1052.84 | 850.48 | 931.30 | 0 | 30.31 |
| 300 | 668.40 | 1067.25 | 772.47 | 1117.31 | 0 | 6.86 |
| 400 | 470.63 | 1221.94 | 815.08 | 1077.84 | 0 | 31.60 |
| 500 | 689.15 | 755.99 | 699.96 | 813.80 | 1.05 | 12.73 |
| 600 | 142.47 | 935.72 | 212.63 | 899.14 | 0 | 38.41 |
| 700 | 148.25 | 347.23 | 156.63 | 367.05 | 0 | 42.49 |
| Specimen Number | Rp0.2, MPa | Rm, MPa | A, % |
|---|---|---|---|
| 1 | 785.36 | 957.99 | 6.42 |
| 2 | 770.32 | 942.52 | 6.09 |
| Rp0.2, MPa | Rm, MPa | A, % | T, °C | |
|---|---|---|---|---|
| 1 | 804.06 | 852.77 | 2.07 | 100 |
| 2 | 853.51 | 907.97 | 3.77 | 100 |
| 3 | 839.35 | 890.94 | 5.48 | 200 |
| 4 | 802.99 | 864.89 | 5.93 | 200 |
| 5 | 817.02 | 881.62 | 5.58 | 300 |
| 6 | 826.54 | 894.79 | 5.55 | 300 |
| 7 | 813.49 | 916.18 | 4.96 | 400 |
| 8 | 808.82 | 923.54 | 7.21 | 400 |
| 9 | 693.82 | 764.70 | 6.40 | 500 |
| 10 | 709.17 | 762.53 | 6.65 | 500 |
| 11 | 551.01 | 567.03 | 7.21 | 600 |
| 12 | 539.35 | 558.16 | 7.44 | 600 |
| 13 | 234.40 | 245.44 | 20.79 | 700 |
| 14 | 248.54 | 261.48 | 18.01 | 700 |
| T, °C | Rp0.2, MPa Mean Value | Rp0.2, MPa Standard Deviation | Rm, MPa Mean Value | Rm, MPa Standard Deviation | A, % Mean Value | A, % Standard Deviation |
|---|---|---|---|---|---|---|
| RT | 777.84 | 10.63 | 950.26 | 10.94 | 6.26 | 0.23 |
| 100 | 828.79 | 34.97 | 880.37 | 39.03 | 2.92 | 1.20 |
| 200 | 821.17 | 25.71 | 877.92 | 18.42 | 5.71 | 0.32 |
| 300 | 821.78 | 6.73 | 888.21 | 9.31 | 5.57 | 0.02 |
| 400 | 811.16 | 3.30 | 919.86 | 5.20 | 6.09 | 1.59 |
| 500 | 701.50 | 10.85 | 763.62 | 1.53 | 6.53 | 0.18 |
| 600 | 545.18 | 8.24 | 562.60 | 6.27 | 7.33 | 0.16 |
| 700 | 241.47 | 10.00 | 253.46 | 11.34 | 19.40 | 1.97 |
| T, °C | Confidence Interval, Rp0.2, MPa | Confidence Interval, Rm, MPa | Confidence Interval, A, % | |||
|---|---|---|---|---|---|---|
| Lower Bound | Upper Bound | Lower Bound | Upper Bound | Lower Bound | Upper Bound | |
| RT | 682.29 | 873.39 | 851.97 | 1048.54 | 4.16 | 8.35 |
| 100 | 514.62 | 1142.95 | 529.68 | 1231.06 | 0 | 13.72 |
| 200 | 590.17 | 1052.17 | 712.42 | 1043.41 | 2.85 | 8.56 |
| 300 | 761.30 | 882.26 | 804.53 | 971.88 | 5.37 | 5.76 |
| 400 | 781.49 | 840.82 | 873.10 | 966.62 | 0 | 20.38 |
| 500 | 603.97 | 799.02 | 749.83 | 777.40 | 4.94 | 8.11 |
| 600 | 471.10 | 619.26 | 506.24 | 618.95 | 5.86 | 8.79 |
| 700 | 151.64 | 331.30 | 151.56 | 355.36 | 1.74 | 37.06 |
| Technology A | |||||||||||||||
|---|---|---|---|---|---|---|---|---|---|---|---|---|---|---|---|
| Direction/Zone | BM | HAZ | FL | WM | FL | HAZ | BM | ||||||||
| No. | 1 | 2 | 3 | 1 | 2 | 1 | 1 | 2 | 3 | 1 | 1 | 2 | 1 | 2 | 3 |
| I-I | 373 | 370 | 370 | 325 | 322 | 319 | 425 | 420 | 425 | 327 | 330 | 325 | 394 | 390 | 397 |
| II-II | 387 | 383 | 373 | 311 | 309 | 309 | 220 | 228 | 232 | 336 | 311 | 306 | 387 | 390 | 390 |
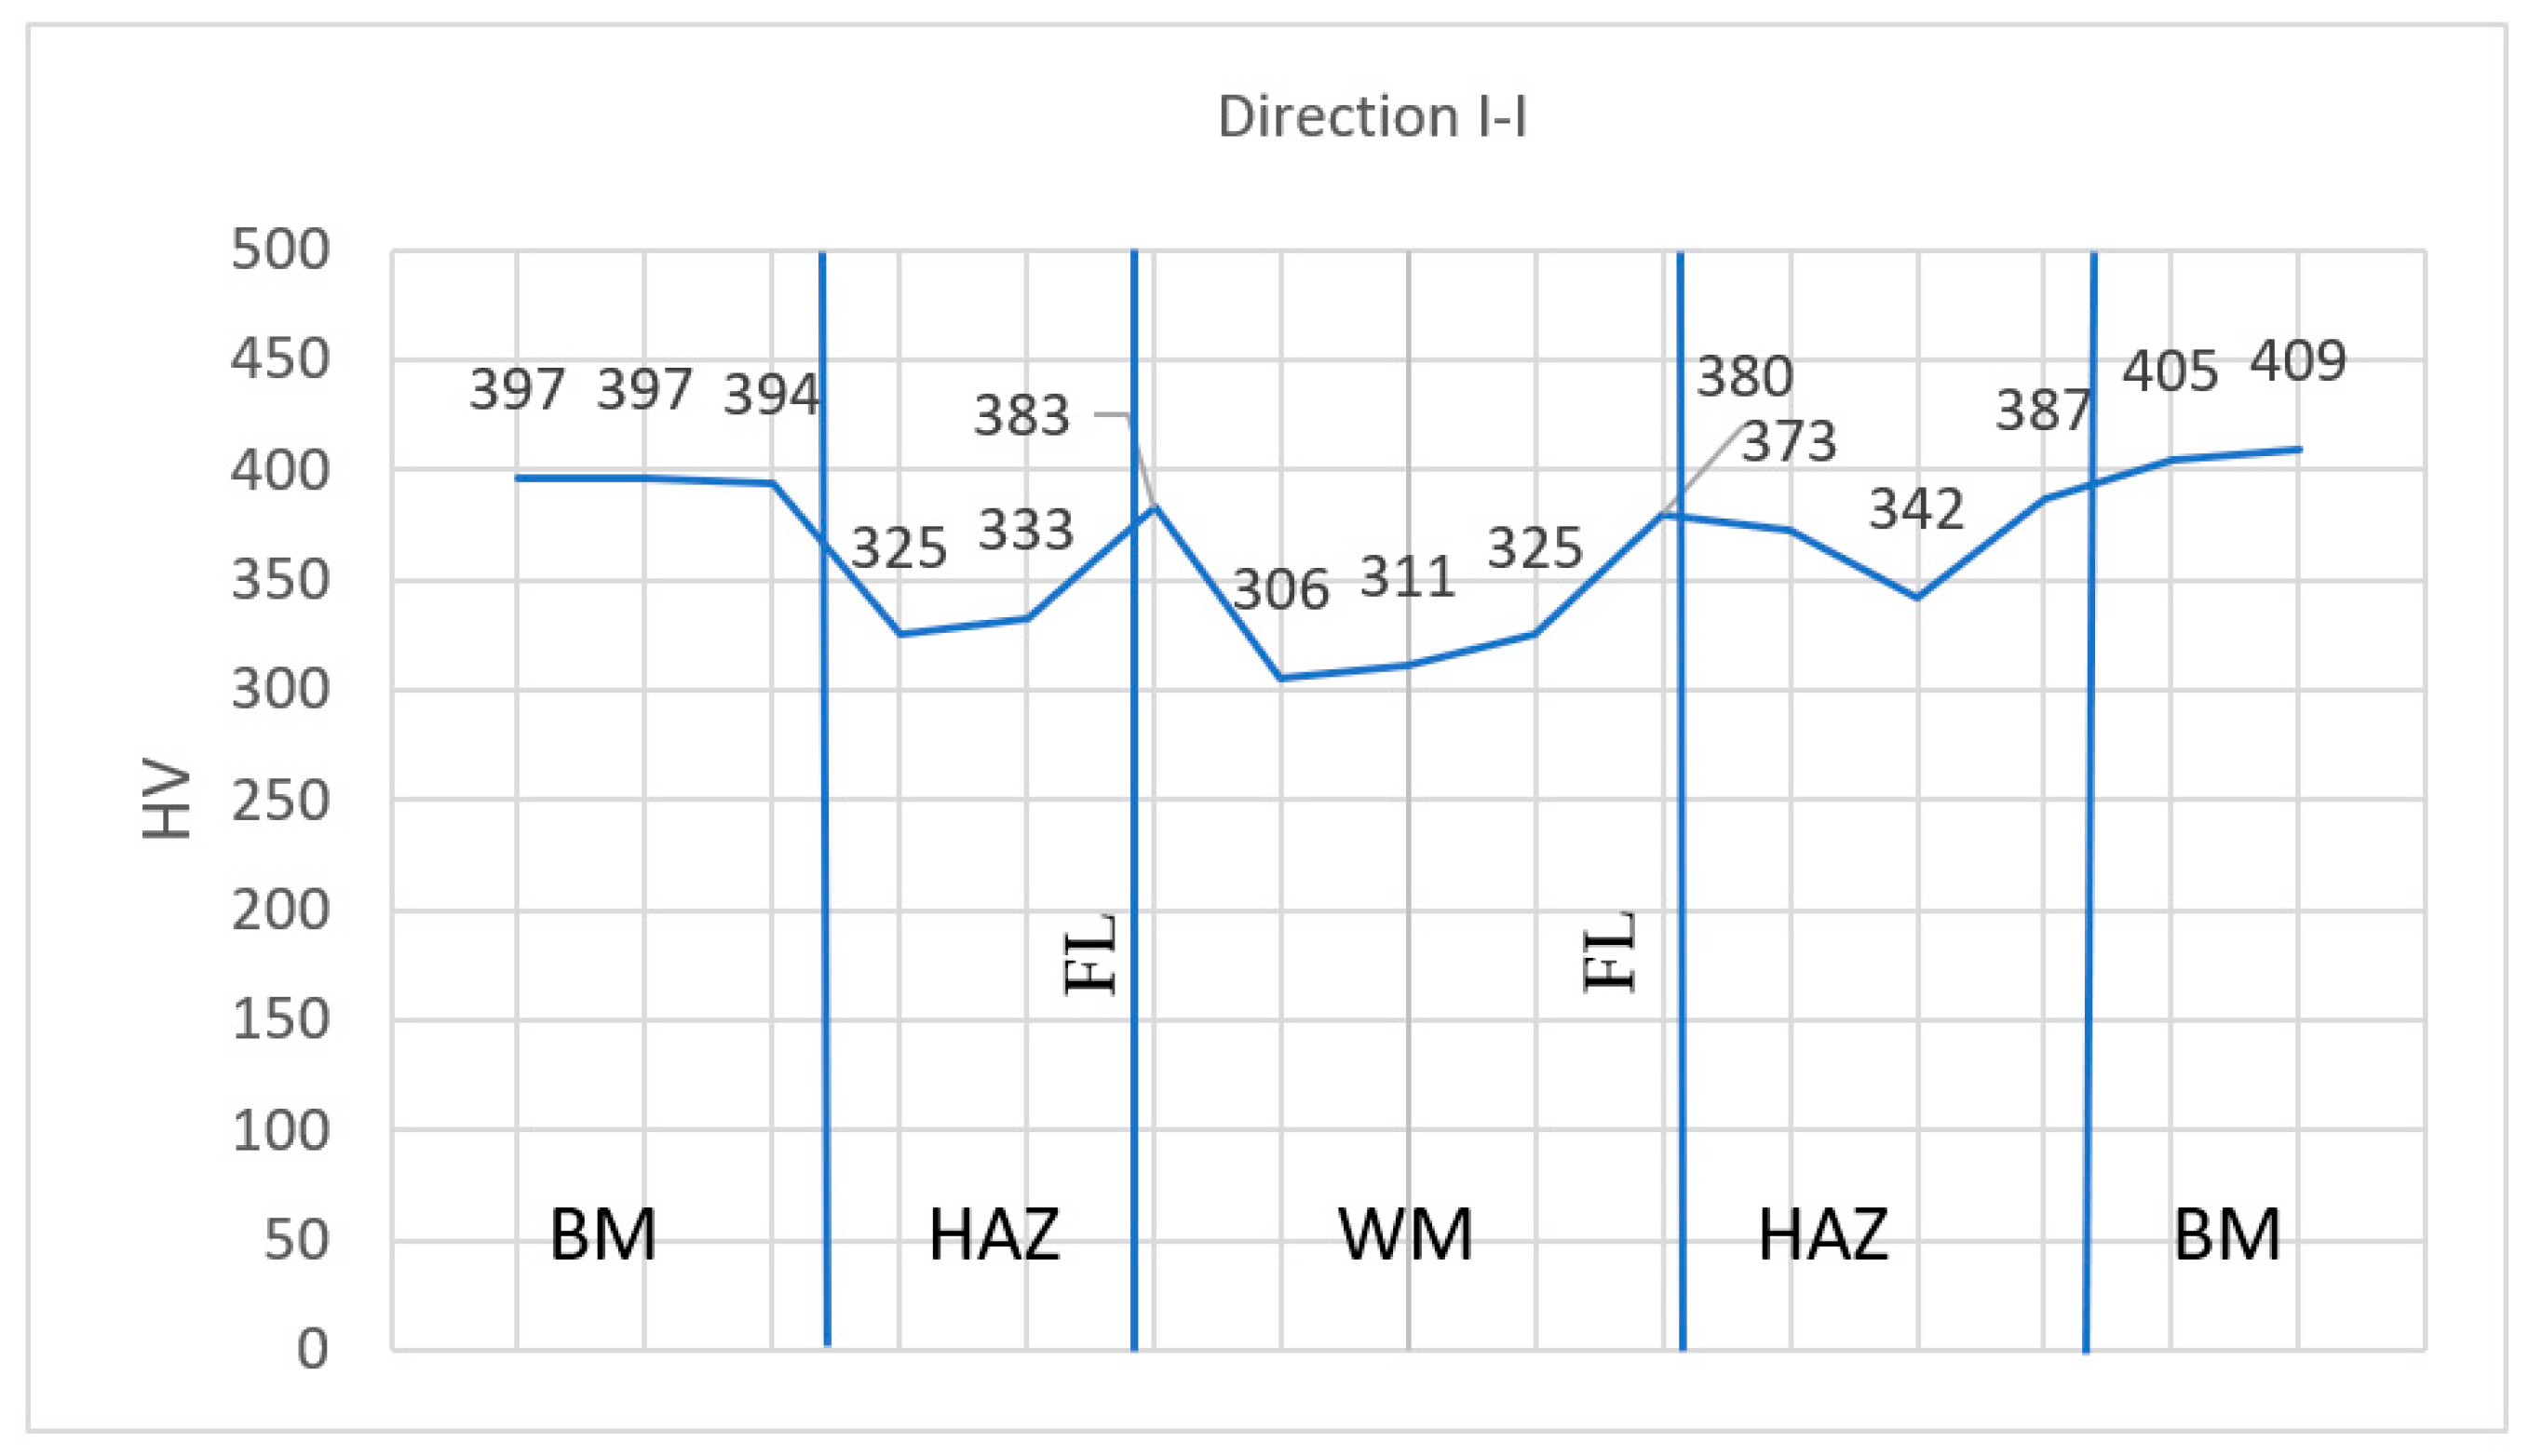
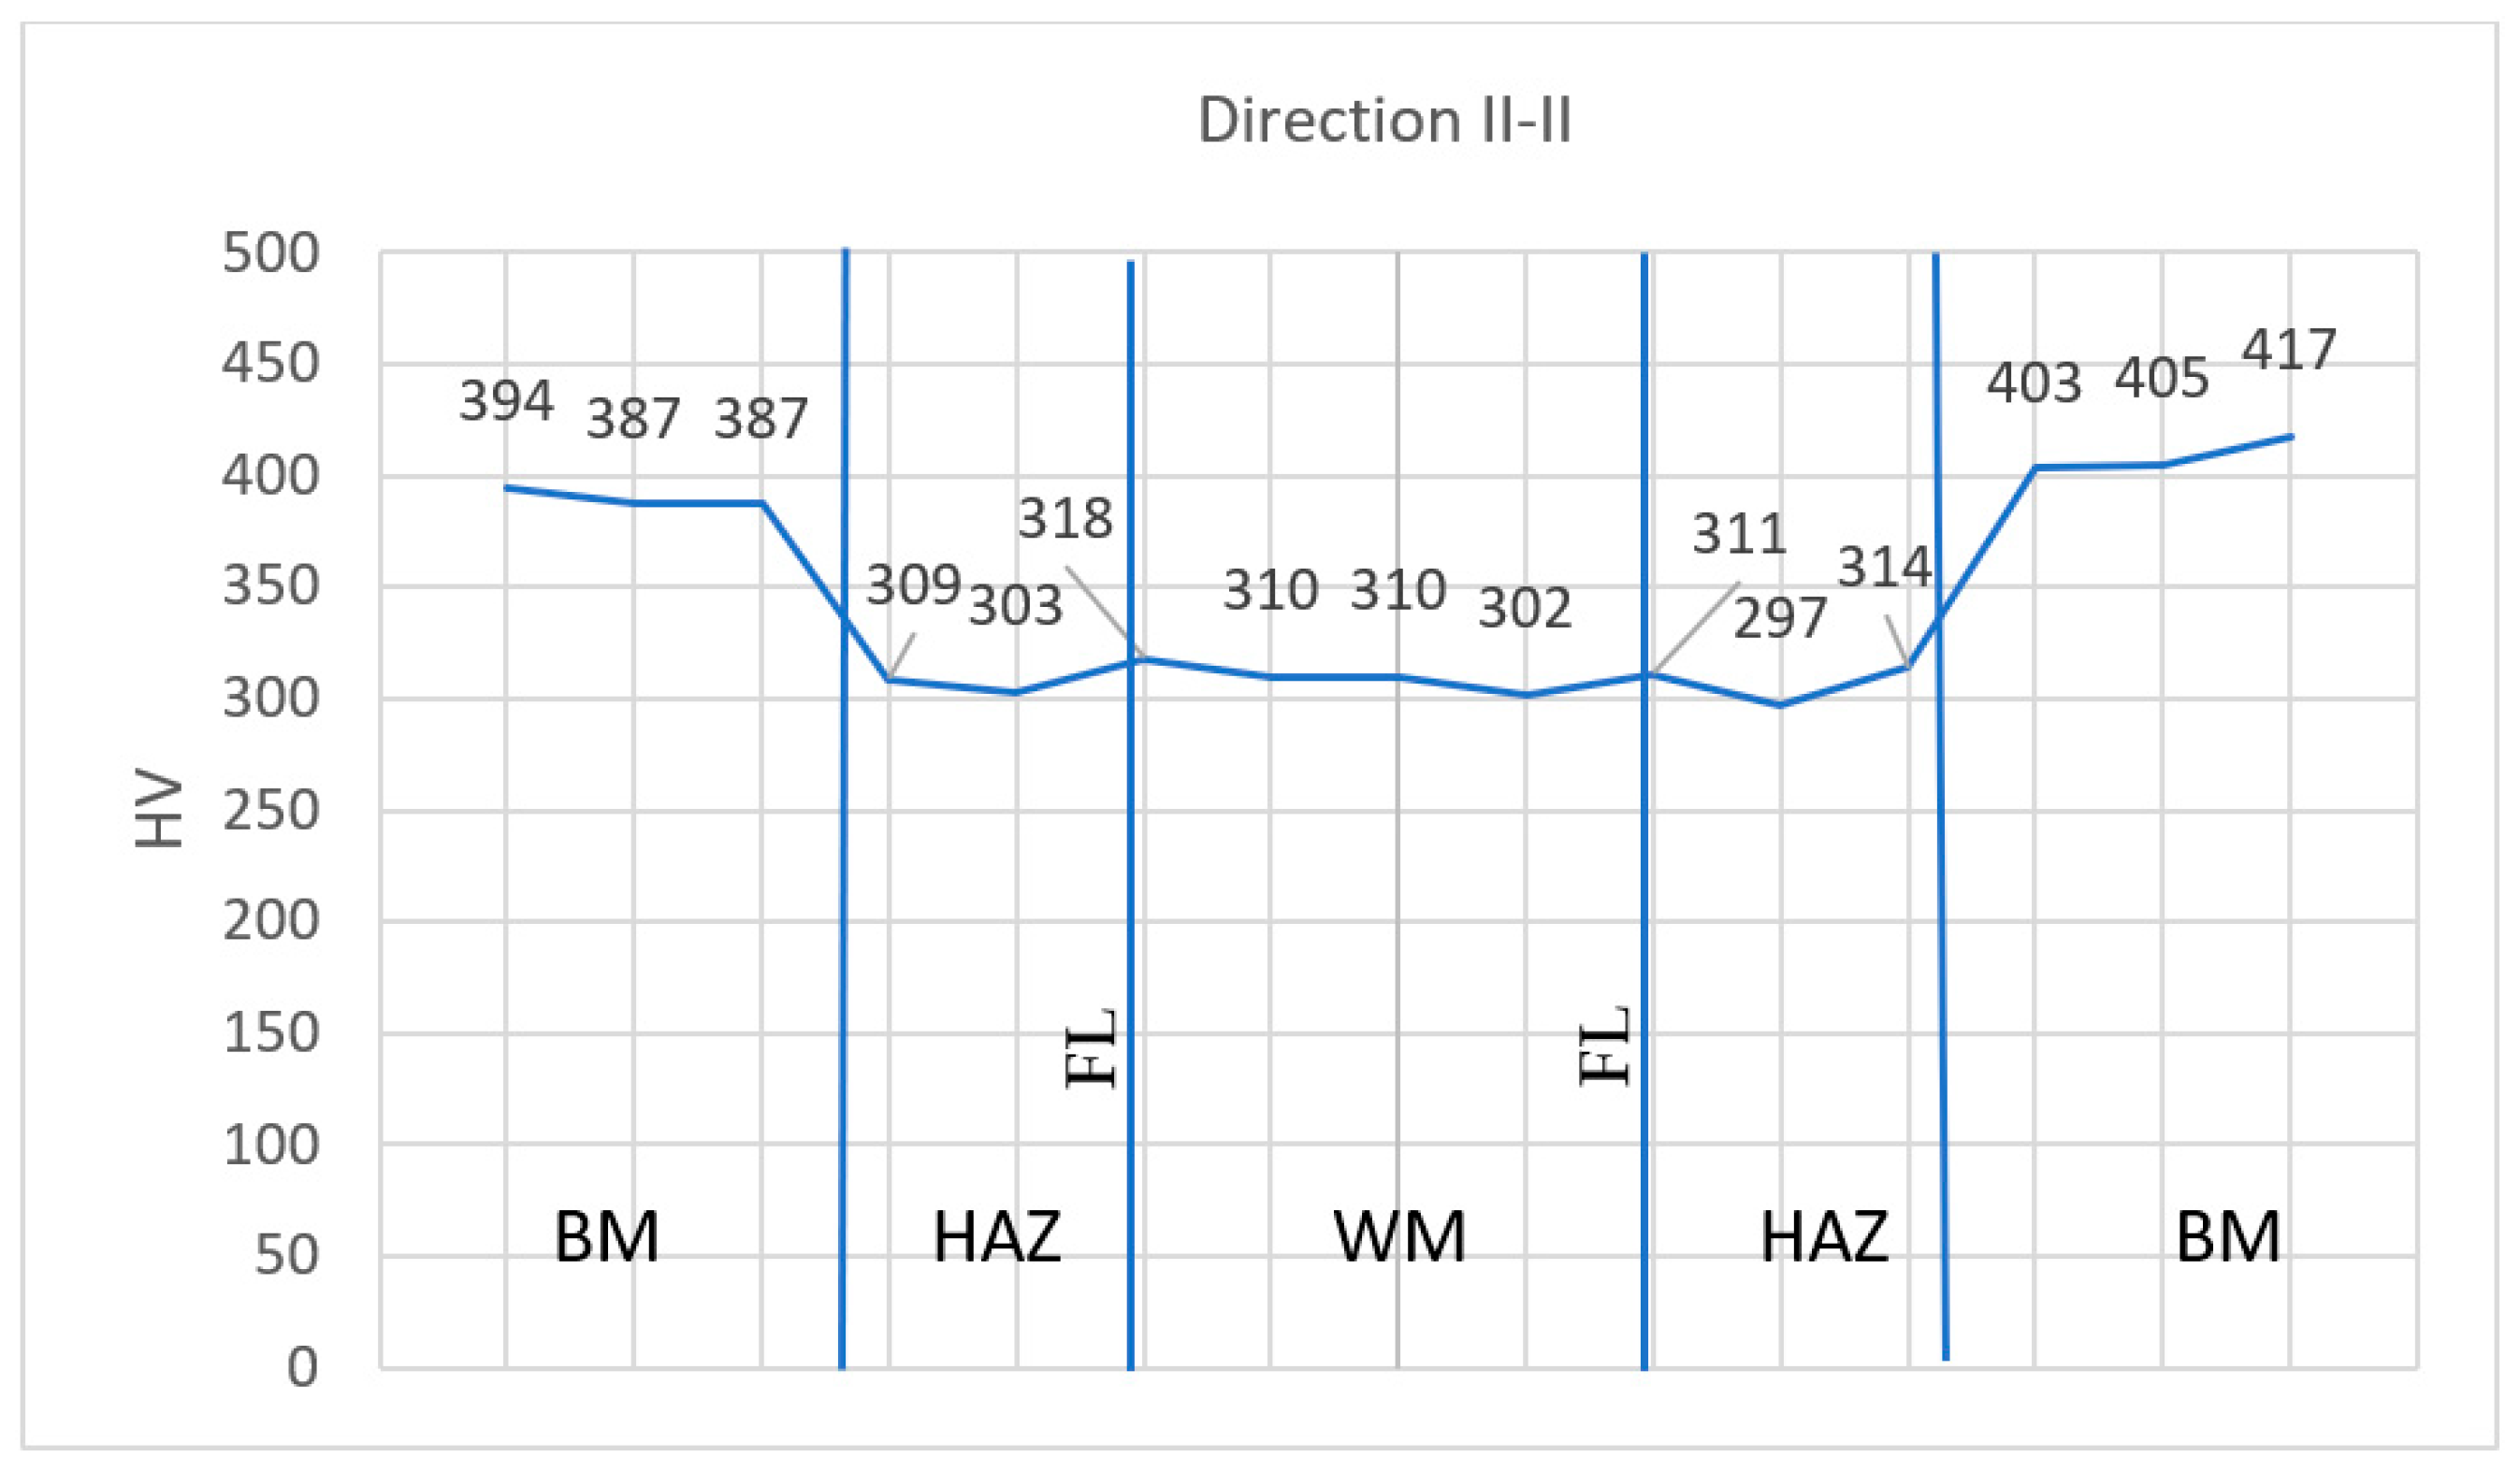
| Technology B | |||||||||||||||
|---|---|---|---|---|---|---|---|---|---|---|---|---|---|---|---|
| Direction/Zone | BM | HAZ | FL | WM | FL | HAZ | BM | ||||||||
| No. | 1 | 2 | 3 | 1 | 2 | 1 | 1 | 2 | 3 | 1 | 1 | 2 | 1 | 2 | 3 |
| I-I | 397 | 397 | 394 | 325 | 333 | 383 | 306 | 311 | 325 | 380 | 372 | 342 | 387 | 405 | 409 |
| II-II | 394 | 387 | 387 | 309 | 303 | 318 | 310 | 310 | 302 | 311 | 297 | 314 | 403 | 405 | 417 |
Disclaimer/Publisher’s Note: The statements, opinions and data contained in all publications are solely those of the individual author(s) and contributor(s) and not of MDPI and/or the editor(s). MDPI and/or the editor(s) disclaim responsibility for any injury to people or property resulting from any ideas, methods, instructions or products referred to in the content. |
© 2025 by the authors. Licensee MDPI, Basel, Switzerland. This article is an open access article distributed under the terms and conditions of the Creative Commons Attribution (CC BY) license (https://creativecommons.org/licenses/by/4.0/).
Share and Cite
Ivković, D.; Arsić, D.; Radović, L.; Ilić, N.; Mandić, J.; Delić, M.; Ivković, A. Investigation of Tensile Properties at Room and Elevated Temperatures of S1100QL Steel and Its Welded Joints. Coatings 2025, 15, 696. https://doi.org/10.3390/coatings15060696
Ivković D, Arsić D, Radović L, Ilić N, Mandić J, Delić M, Ivković A. Investigation of Tensile Properties at Room and Elevated Temperatures of S1100QL Steel and Its Welded Joints. Coatings. 2025; 15(6):696. https://doi.org/10.3390/coatings15060696
Chicago/Turabian StyleIvković, Djordje, Dušan Arsić, Ljubica Radović, Nada Ilić, Jovana Mandić, Marko Delić, and Andjela Ivković. 2025. "Investigation of Tensile Properties at Room and Elevated Temperatures of S1100QL Steel and Its Welded Joints" Coatings 15, no. 6: 696. https://doi.org/10.3390/coatings15060696
APA StyleIvković, D., Arsić, D., Radović, L., Ilić, N., Mandić, J., Delić, M., & Ivković, A. (2025). Investigation of Tensile Properties at Room and Elevated Temperatures of S1100QL Steel and Its Welded Joints. Coatings, 15(6), 696. https://doi.org/10.3390/coatings15060696