Article

Study of Lithium-Ion Battery Charge State Estimation Based on BP Neural Network Fusion Optimized Sparrow Algorithm

School of Energy and Power Engineering, North University of China, Taiyuan 030051, China
*
Authors to whom correspondence should be addressed.
Coatings 2025, 15(6), 697; https://doi.org/10.3390/coatings15060697
Submission received: 26 April 2025 / Revised: 5 June 2025 / Accepted: 6 June 2025 / Published: 10 June 2025
(This article belongs to the Special Issue Advances and Challenges in Coating Materials for Battery Cathodes)

Abstract

Due to the complex linear relationships within a battery, the prediction of state of charge (SOC) has become a significant challenge. This paper designs a three-layer backpropagation (BP) neural network to predict the battery’s SOC. To enhance the prediction accuracy, based on the charge–discharge mechanism of lithium batteries, the battery’s voltage, current, and temperature are selected as input variables, with the state of charge as the output variable. Under three different operating conditions, the BP neural network can achieve certain predictive effects. However, due to the instability and large error fluctuations of the BP neural network during the SOC prediction process, the BP neural network is optimized. The Sparrow Search Algorithm (SSA) can enhance the model’s ability to search for optimal values. By improving the Sparrow Search Algorithm, the uniform distribution of the initial population can be enhanced. The prediction results after optimizing the BP network show that, compared to the unimproved version, the stability of the prediction results can be improved, achieving more accurate predictions of SOC values, which has strong application value.

Graphical Abstract

1. Introduction

With the accelerating depletion of fossil energy resources and increasing environmental concerns, the development of electric vehicles (EVs) has gained significant momentum as part of the global pursuit of low-carbon transportation. As the core component of new energy vehicles, power batteries are becoming a pivotal technology for facilitating the transition to green energy. In EVs, the battery not only serves as the primary energy source but also directly influences the vehicle’s driving range, energy efficiency, and operational safety [1,2,3]. The battery management system (BMS), acting as a critical interface between the battery pack and the vehicle control system, is responsible for the real-time monitoring and accurate regulation of battery states. Under dynamic driving conditions—such as frequent starts, rapid acceleration, and regenerative braking—power batteries are prone to issues like overcharging, over-discharging, and abnormal temperature rises, which can accelerate performance degradation or even trigger thermal runaway. Therefore, the accurate estimation of the state of charge (SOC) is essential for ensuring reliable energy management and battery safety [4,5,6,7,8].
In onboard applications, the accuracy of SOC estimation directly affects range prediction, energy scheduling, and fault protection strategies. Estimation errors may lead to overcharge or deep discharge, accelerated battery aging, system failures, and distorted range displays. Such inaccuracies can mislead drivers and create safety risks, including “phantom” residual charge or sudden power loss. As such, developing a highly accurate and robust SOC estimation method is a central challenge in BMS research. Traditional approaches—such as the open-circuit voltage (OCV) method, Coulomb counting, and Kalman filtering—suffer from dependence on battery parameters and limited adaptability to changing environmental and load conditions, making them less effective under complex dynamic scenarios [9,10,11,12,13,14,15]. Neural networks offer powerful capabilities for modeling nonlinear relationships and are thus promising for SOC estimation. However, their performance can be hindered by sensitivity to initial parameters and weak generalization, limiting their reliability in real-world vehicular environments [16,17,18,19].
To address these challenges, this paper proposes an SOC estimation method based on a backpropagation (BP) neural network optimized using an Improved Sparrow Search Algorithm (ISSA) [20,21,22,23,24]. By incorporating Tent chaotic mapping, a sine–cosine search strategy, and local disturbance mechanisms, the proposed ISSA enhances global search performance and algorithmic robustness, thereby improving adaptability to nonlinear and dynamic operating conditions [24,25,26,27,28,29,30]. Specifically, a neural network model is constructed with voltage, current, and temperature as the inputs and the SOC as the output. The SSA optimization framework is then extended with multi-strategy enhancements to form the ISSA-BP model. Finally, the proposed method is validated by comparing the BP, SSA-BP, and ISSA-BP models using standard working condition datasets. Prediction performance is evaluated using the mean squared error (MSE) and other metrics to assess accuracy and stability in dynamic scenarios.
The structure of the paper is as follows: In Section 2, a neural network evaluation model for the battery SOC is established. The battery voltage, current, and temperature are defined as the input layers, while the battery SOC value is defined as the output layer. Section 3 introduces the improved model, where the SSA is used to optimize the BP neural network. The optimized algorithm is then integrated with Tent chaotic mapping, the sine–cosine algorithm, and firefly disturbance strategies. Finally, the implementation process of the ISSN-BP-based model is described. In Section 4, the same dataset is used to test the three models under three operating conditions, and the accuracy of SOC estimation is demonstrated by comparing the mean squared error (MSE) between the predicted and actual values. The conclusion is presented in Section 5.

2. SOC Prediction Model of Lithium Battery Based on BP Neural Network

The BP neural network (error backpropagation, BP), also known as the error backpropagation network, is a type of neural network that functions by storing and learning the mapping relationships between input and output data. It possesses strong learning and adaptive capabilities. The BP neural network employs the gradient descent learning method, which continuously adjusts the network parameters in reverse based on the calculation results of the input data, minimizing the network’s error. Due to its broad applicability and effectiveness, the BP neural network is one of the most widely used neural networks today.
Owing to the complex nonlinear relationships within the battery, the state of charge (SOC) of the battery cannot be directly measured using physical instruments. However, certain measurable physical quantities inside the battery exhibit a linear mapping relationship with the SOC. Although many physical quantities can establish mapping relationships with the SOC, the complexity of these relationships results in slower processing speeds, and some physical quantities require high-precision, large-scale instruments for measurement. Taking these factors into consideration, this paper selects the battery’s operating voltage (V), current (I), and temperature (T) as the input state variables for the model. These three physical quantities can be directly measured using different sensors. The SOC of the battery is used as the output state variable to establish a three-input, single-output BP neural network model.
In theory, increasing the number of hidden layers can enable the network to map more complex data relationships and improve the network’s prediction accuracy. However, this also increases the computational complexity of the network. When the number of hidden layers reaches a certain threshold, it no longer significantly improves the network’s estimation performance and may lead to wasted computational resources. Therefore, this paper sets the neural network to a single hidden layer. As for the number of nodes in the hidden layer, it is typically determined based on empirical formulas. Several common empirical formulas for determining the number of hidden layer nodes are as follows:
m = a + n + l
m = l o g 2 n
where
n: the number of nodes in the input layer;
m: the number of nodes in the hidden layer;
l: the number of nodes in the output layer;
a: a constant within the range [1, 10].
Through continuous testing and adjustment of the network based on empirical formulas, the number of nodes in the hidden layer of the network is ultimately set to seven. After analyzing the network structure, the final selected network structure is 3-7-1. This means the input layer has three nodes, the hidden layer has seven nodes, and the output layer has one node. The structure of the network model is shown in Figure 1.

3. BP Neural Network Based on ISSN Optimization

3.1. Sparrow’s Algorithm to Optimize BP Neural Networks

Although the BP neural network demonstrates a certain level of accuracy in SOC estimations, it may exhibit significant estimation errors at certain SOC nodes, leading to fluctuations in the SOC estimation results. To address this issue, the Sparrow Search Algorithm (SSA) can be introduced to optimize the BP neural network. The SSA simulates the behavior of sparrows foraging and avoiding danger, dividing the population into discoverers, followers, and alerters. Through the clear division of labor within the population, the SSA not only ensures the acquisition of food sources but also enhances the ability to cope with complex environments. As a novel swarm intelligence optimization algorithm, the SSA offers significant advantages in terms of precision and convergence speed compared to traditional optimization algorithms, providing an effective solution for improving SOC estimation errors.
(1)
Generation of the Sparrow Population
Assuming a d-dimensional space and a population of n sparrows, the initial positions of the sparrows in the population are as follows:
X = x 11   x 12   x 1 d x 21   x 22   x 2 d x n 1   x n 2   x n d
Here, n represents the number of sparrow individuals, and d represents the dimensionality of the vector to be optimized. In this optimization, the variables to be optimized are the weights and thresholds of the BP neural network. Therefore, considering the input layer, hidden layer, and output layer, the value of d is 36.
(2)
Calculation of Fitness for Each Sparrow in the Population
The fitness of each sparrow in the population is calculated using the following expression:
F x = f x 11   x 12   x 1 d f x 21   x 22   x 2 d                 f x n 1   x n 2   x n d
Here, fitness represents the fitness calculation for each sparrow. The matrix expression above indicates the fitness calculation for all sparrow individuals in the population.
(3)
In the population, producers with higher fitness values are prioritized in obtaining energy during the search process. At the same time, producers are responsible for leading the entire population, guiding the population toward the food source. The position update for producers follows the formula below:
X i j t + 1 = X i j t e x p i α i t e r m a x i f   R 2 < S T X i j t + Q L i f   R 2 S T
Among them, t represents the number of iterations for the sparrow population. Itermax represents the maximum number of iterations. α represents a random number between (0, 1]. ST represents the warning value. When R2 < ST, it means that there is no danger around the sparrow, and the producer enters the extensive search mode and updates according to Formula (1); on the contrary, when the individual sparrow has found the danger and all the sparrows need to fly to the safe area, there is an update according to Formula (2).
X i j t + 1 = Q e x p X w o r s t t X i j t i 2   i f   i  >  n / 2 X P t + 1 + X i j t X P t + 1   A + L otherwise
where Xp and Xworst represent the global optimal and worst positions of the sparrow, respectively. A is denoted as a 1 × d matrix; matrix elements are randomly assigned as 1 or −1. When I > n/2, this indicates that the i sparrow is in the worst position and needs to pursue higher energy elsewhere.
X i j t + 1 = X b e s t t + β X i j t X b e s t t i f   f i > f g X i j t + K X i j t X w o r s t t f i f w + ε i f   f i   =   f g
Among them, Xbest indicates the current globally optimal position.
β is a step control parameter that satisfies a random number with mean 0 and variance 1 and conforms to a normal distribution. K is a [−1, 1] random number. When fi > fg, this indicates that the sparrow is at the edge of the population and is vulnerable to attack; when fi = fg, this indicates that the sparrow is in the middle of the population and that the sparrow is aware of the danger.

3.2. Optimizing the Sparrow Algorithm
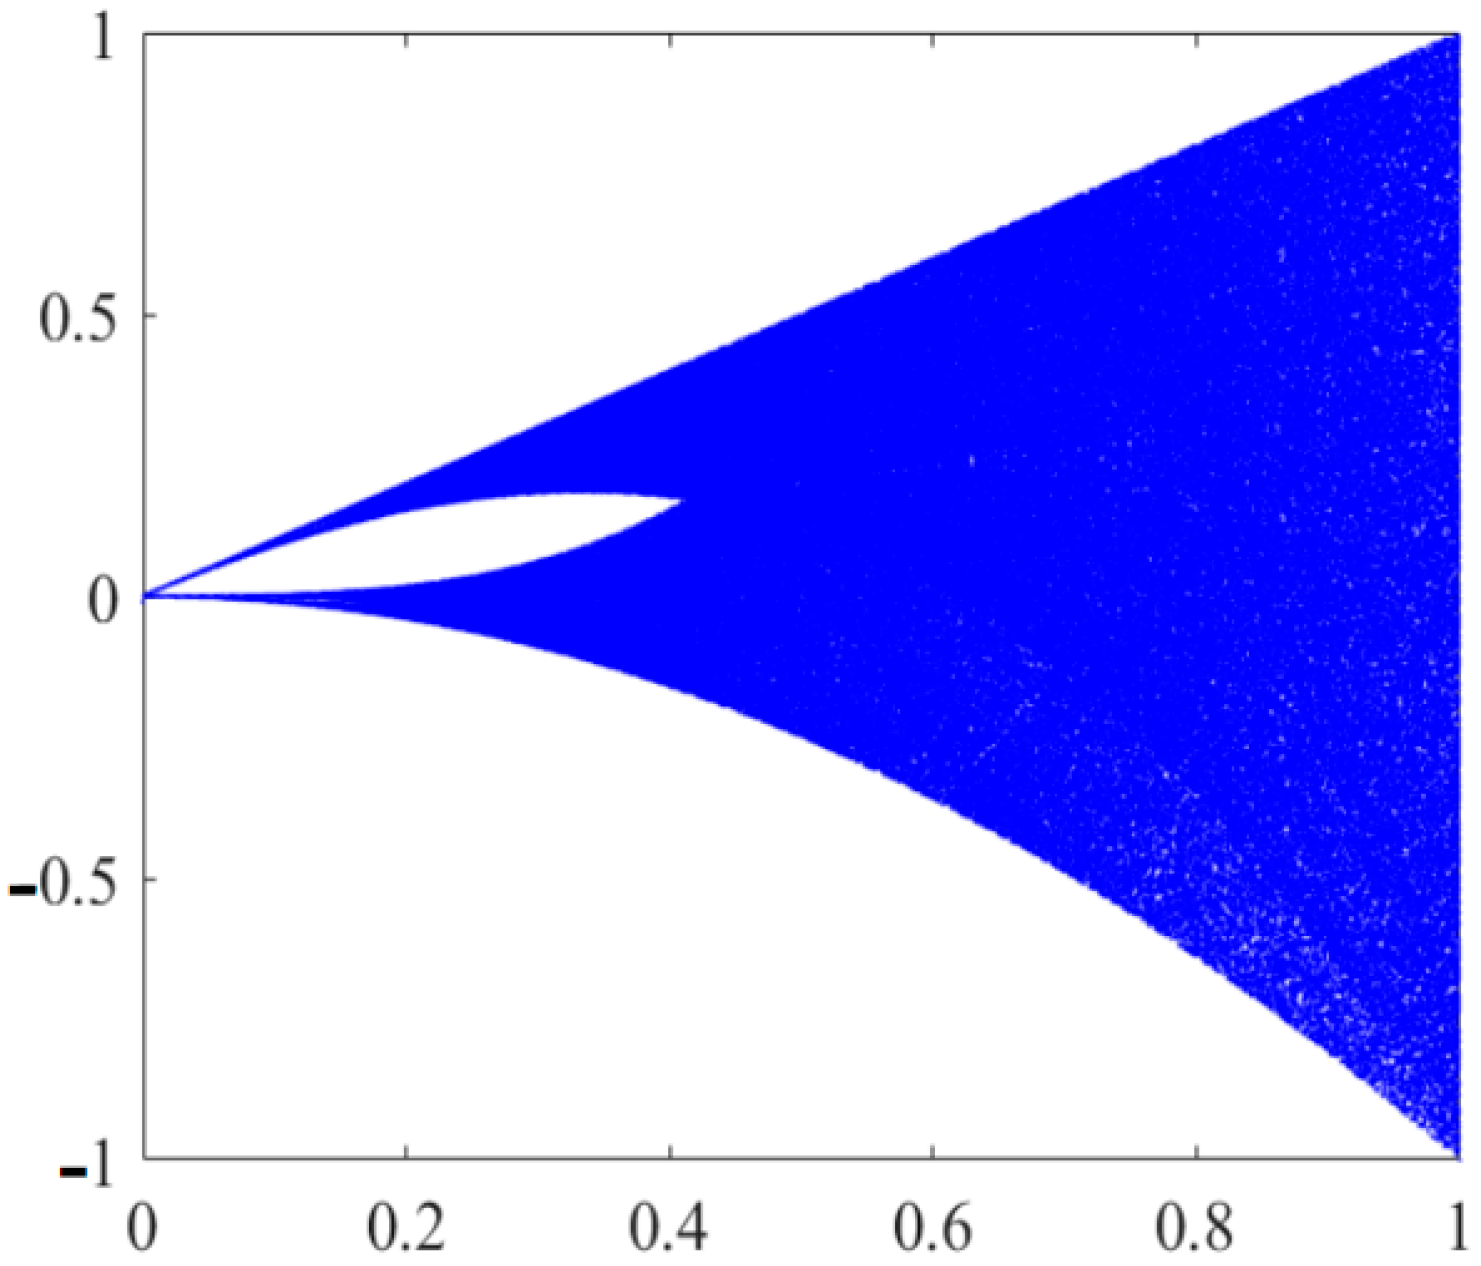
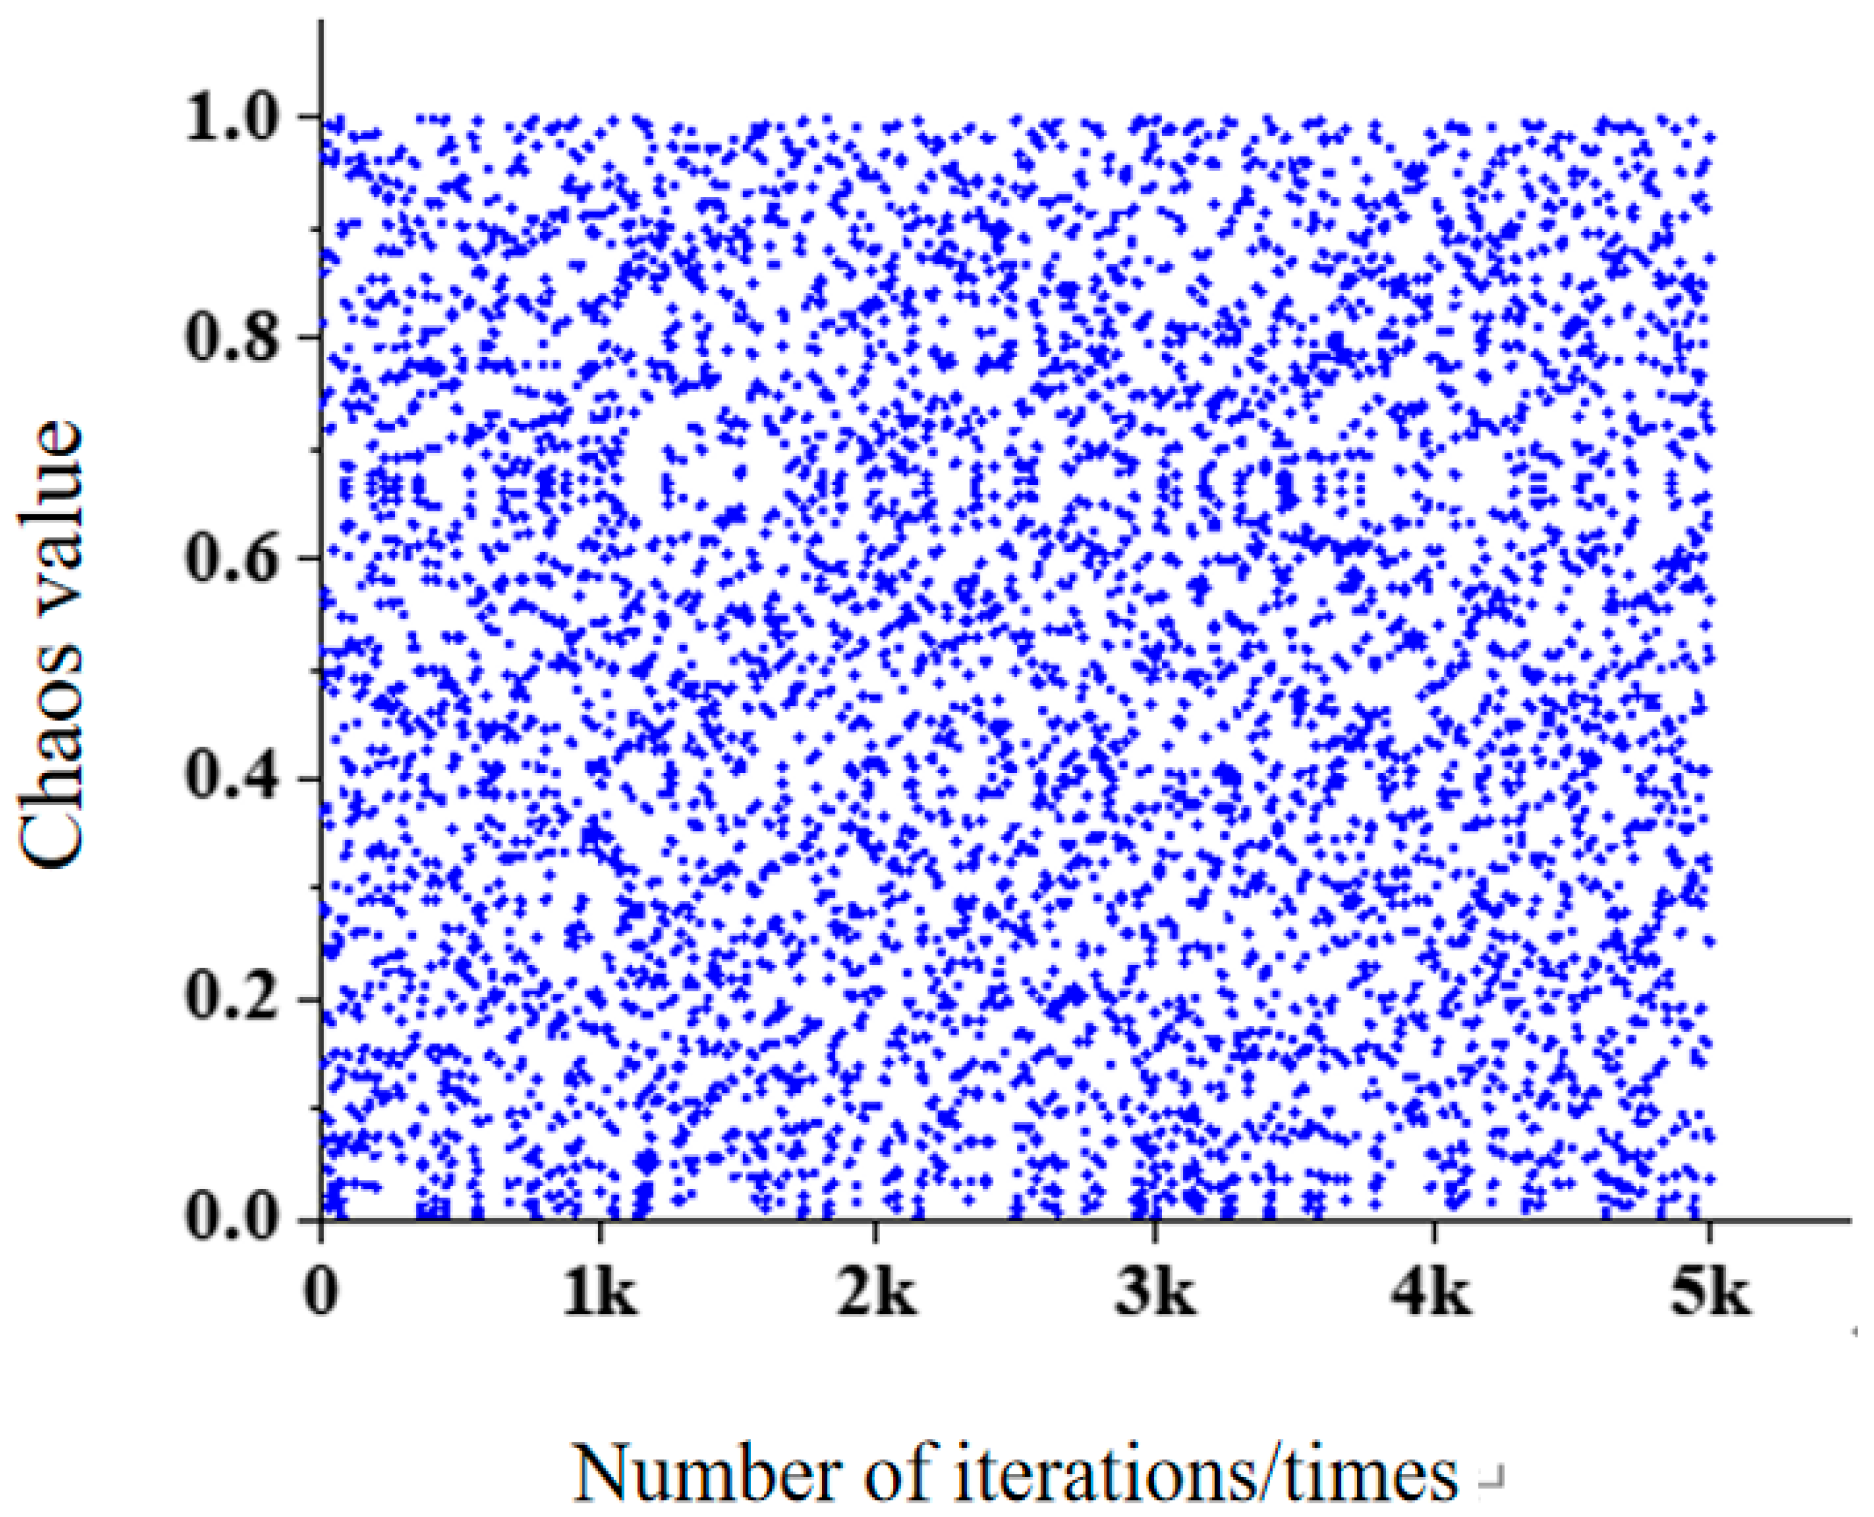
(1)
Tent Chaos Mapping
Chaotic mappings are random sequences generated by simple deterministic systems and play an important role in optimization algorithms. Chaotic mapping can make the swarm optimization algorithm avoid the problem of falling into local lastness due to traversability and semi-randomness. It can play a better optimization effect on the population in the process of the initialization, selection, and crossover of the population. Since Tent mapping can use the characteristics of chaotic sequences to improve the diversity of the population and make the distribution of the population more uniform in the swarm optimization algorithm, Tent chaos mapping is used to initialize the sparrow population. Tent chaos mapping involves relatively few parameters and is simple to operate, and its original mathematical representation is as follows:
x n + 1 = 2 x n 0  <  x n < 0.5 2 1 x n 0 . 5 x n 1
Figure 2 shows the distribution schematic of Tent mapping. Figure 3 shows the distribution of 5000 times of Tent chaos mapping, from which it can be seen that Tent chaos mapping has a good uniformity of distribution.
(2)
Sine–cosine algorithm
In the process of searching for food in a sparrow population, due to the continuous updating of individual sparrows, when the producer is still in the optimal position, a large number of sparrows will swarm, resulting in an increase in the probability of the population falling into the localization. The sine–cosine fusion algorithm utilizes the oscillatory variational property of the sine–cosine function, which is able to make the population solution converge to the global optimum. The introduction of the nonlinear learning factor can improve the global search ability of the population in the pre-search stage of the population and improve the local pioneering ability of the population in the later stage of the search, so as to improve the accuracy. The formula of the learning factor is expressed as follows:
ω = ω min + ω max ω min s i n t π i t e r max
With the improvement, the new position update formula for the producer is shown below:
X i j t + 1 = 1 ω X i j t + ω s i n r 0 r 1 X b e s t X i j t i f R 2  <  S T 1 ω X i j t + ω c o s r 0 r 1 X b e s t X i j t i f R 2 S T
where r0 is a random number between (0, 2π), and r1 is a random number between (0, 2π).
(3)
Firefly Perturbation Strategy
The firefly algorithm is based on the characteristic of firefly organisms attracting the opposite sex and transferring information through luminescence. The feature is an important way of information transfer and the organization of group-like organisms. Between fireflies, information is transferred between different individuals through luminescence intensity, causing individuals with weak luminescence to move toward individuals with high luminescence intensity. If an individual’s luminous intensity in the group is in the highest level, the individual will move randomly, constantly updated, until finally all the fireflies are gathered in the best position to complete the optimization process.
The formula for calculating the luminous intensity of individual fireflies is shown below:
I = I 0 e γ r i j 2
where I0 denotes the maximum intensity of the light source of the firefly population, and the better the individual, the greater the luminous intensity of the firefly. γ represents the light absorption coefficient. The luminous intensity of fireflies is affected by the external propagation medium as well as the distance, other factors, and change.
Fireflies are attracted to each other, and the change of position occurs, with the formula being expressed as follows:
β = β 0 e γ r i j 2
where
β0 is denoted as the maximum attraction of the population.
The fireflies move towards the optimal position by constant updating with the following position updating the equation.
f i = f i + β f j f i + α r a n d 0.5
where fj and fi are the spatial locations j and i that only have fireflies, respectively; α is [0, 1] for the regulation step; and rand is a random number between [0, 1].

3.3. Comparison of Optimization Algorithms

To support the rationale for selecting the Improved Sparrow Search Algorithm (ISSA) as the optimization strategy for the BP neural network, this section provides a comparative analysis of several widely used metaheuristic algorithms, including Particle Swarm Optimization (PSO), the Genetic Algorithm (GA), the Grey Wolf Optimizer (GWO), and the standard Sparrow Search Algorithm (SSA) [31,32,33,34]. Table 1 summarizes their key strengths and limitations in the context of neural network parameter optimization.
This comparison demonstrates that while conventional optimization algorithms offer specific advantages, they also face limitations such as premature convergence, sensitivity to initial conditions, and reduced adaptability in complex problem spaces. The proposed ISSA addresses these issues by integrating Tent chaotic mapping, sine–cosine adjustments, and firefly-inspired perturbation strategies. These enhancements improve search diversity, convergence stability, and robustness, making the ISSA particularly effective for optimizing BP neural networks in the SOC estimation context.

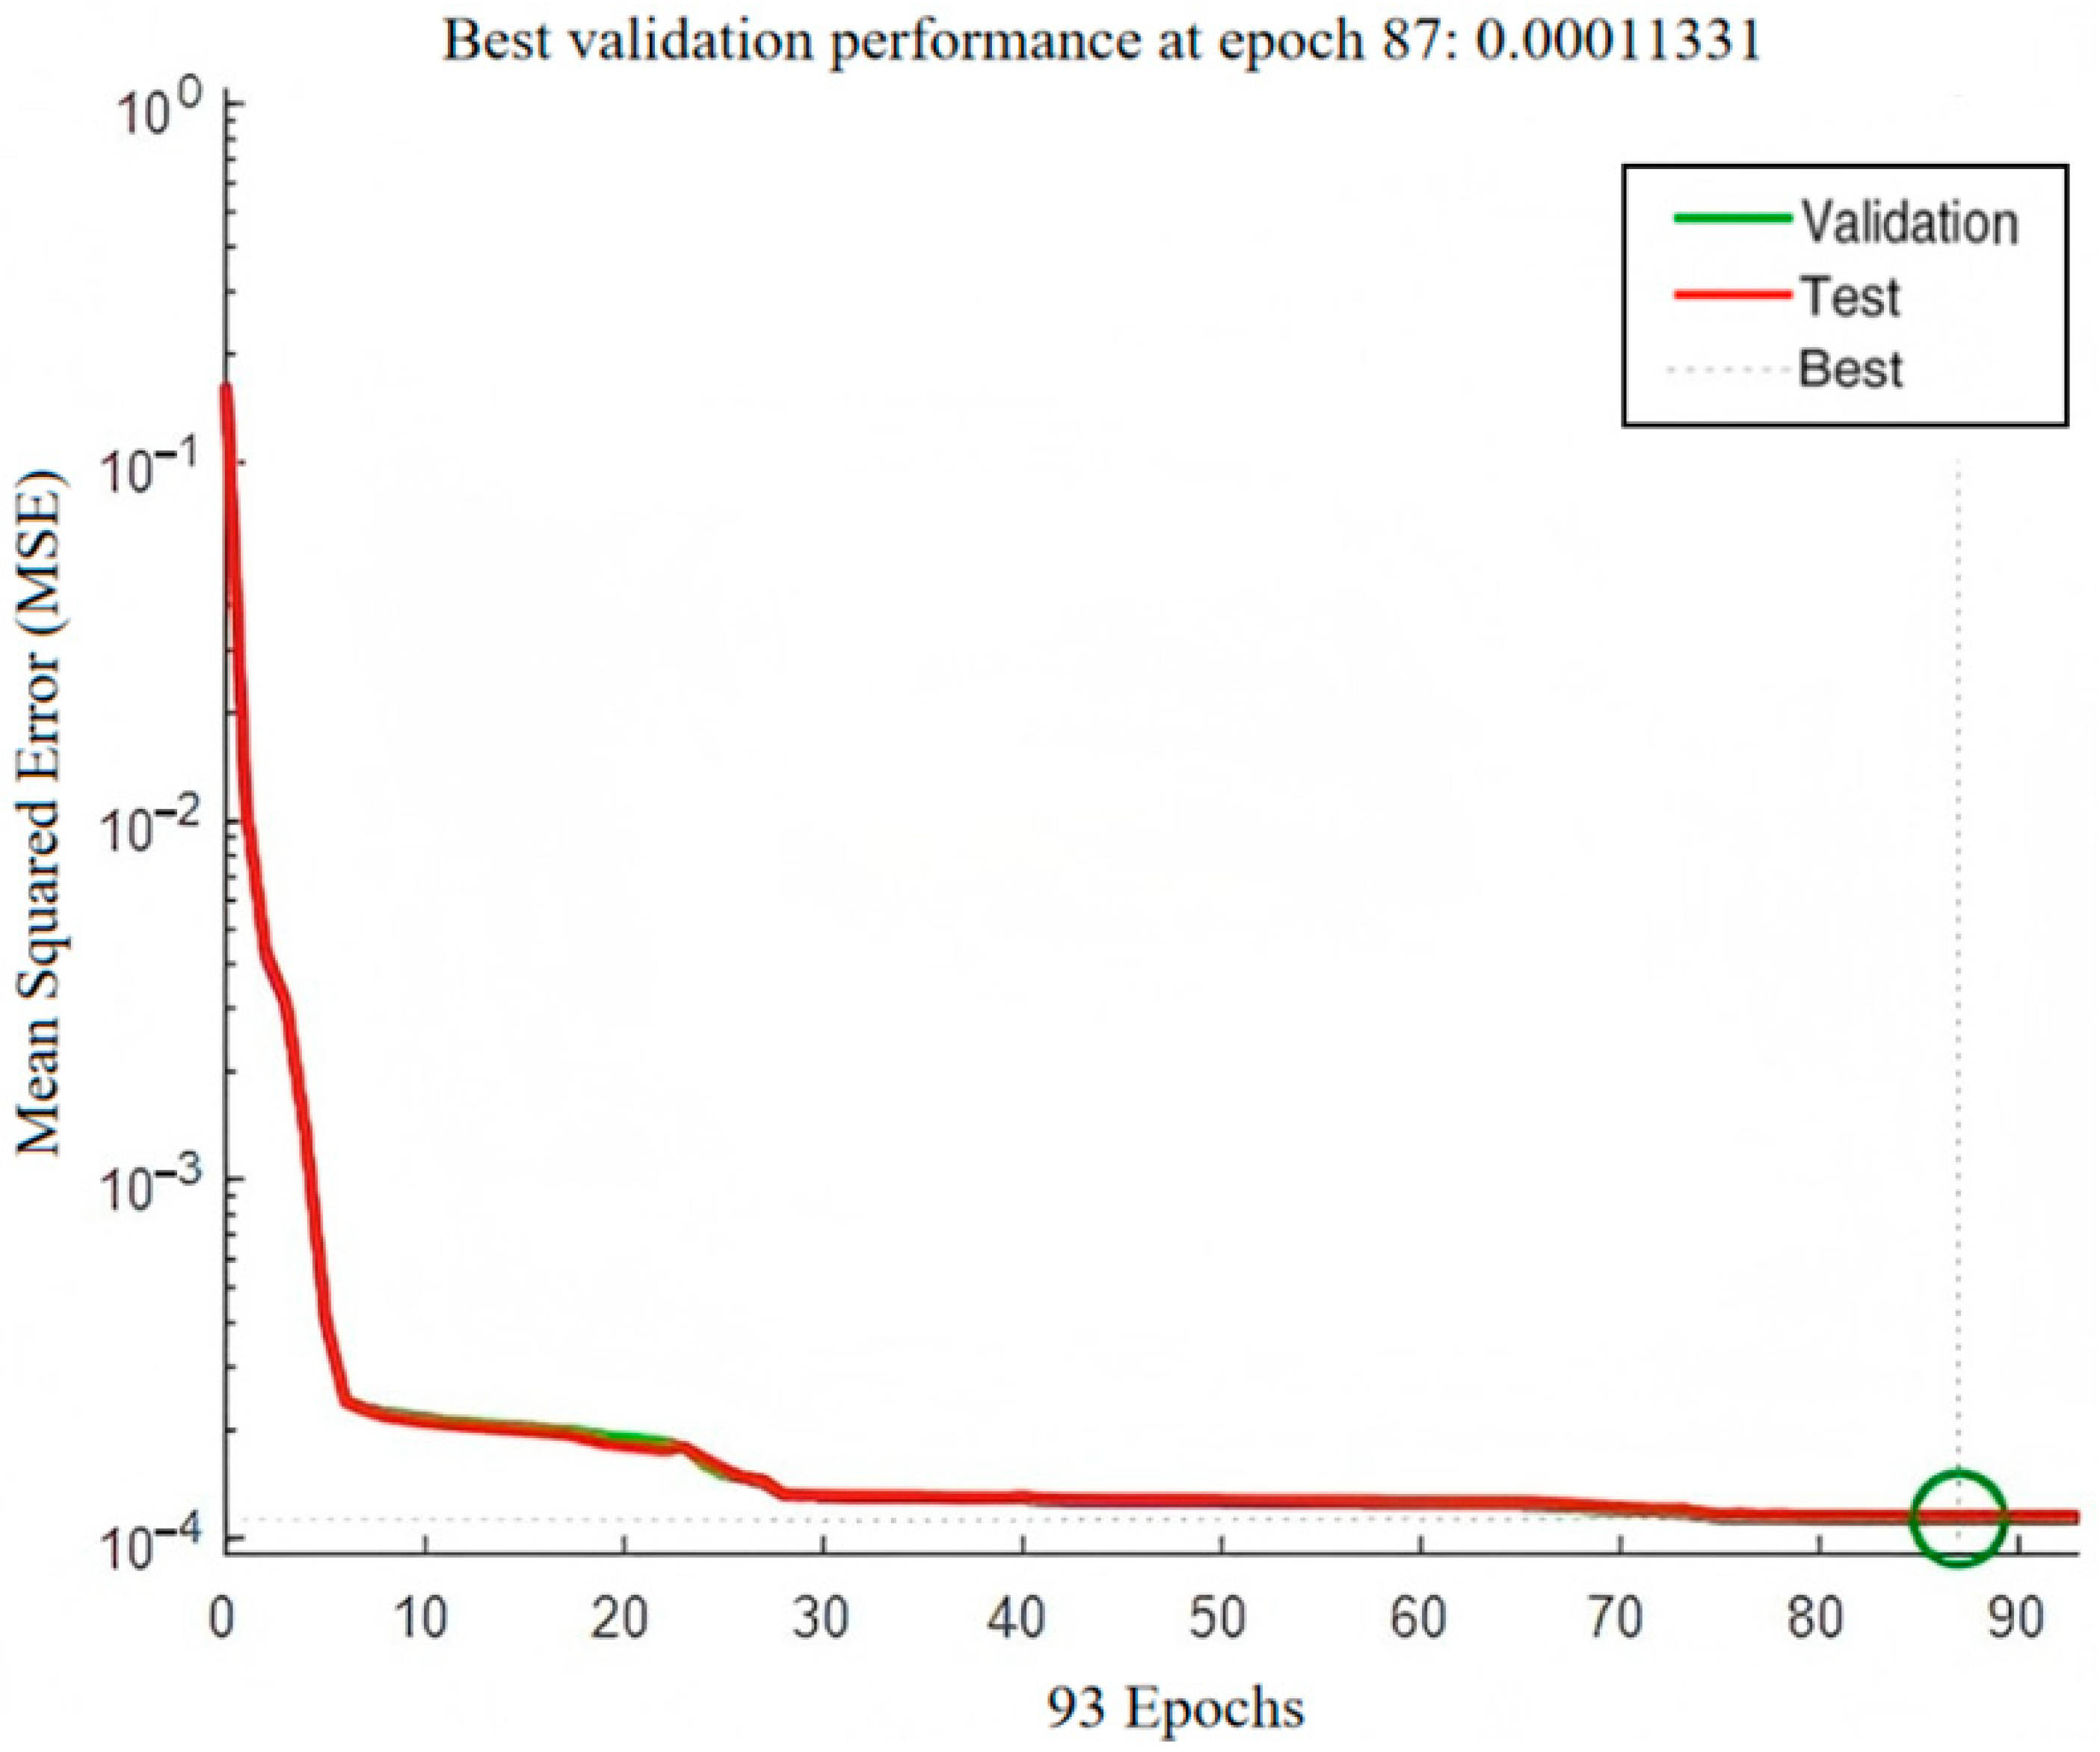
3.4. Model Training and Convergence

During the model training phase, the convergence dynamics were quantitatively evaluated by continuously monitoring the mean squared error (MSE) across the training, validation, and testing datasets. The complete MSE loss trajectories are depicted in Figure 4. As illustrated, the model exhibits rapid error minimization within the initial 20 epochs, after which the convergence behavior transitions into a gradual refinement phase with diminishing error fluctuations. The optimal validation performance was obtained at epoch 87, reaching an MSE of 0.00011331, which demonstrates both an effective learning capability and robust generalization performance. Furthermore, the close alignment and parallel trends of the training, validation, and testing loss curves throughout the entire training process indicate that the model maintains stable learning dynamics, mitigates the overfitting risk, and achieves consistent predictive performance across distinct data subsets.

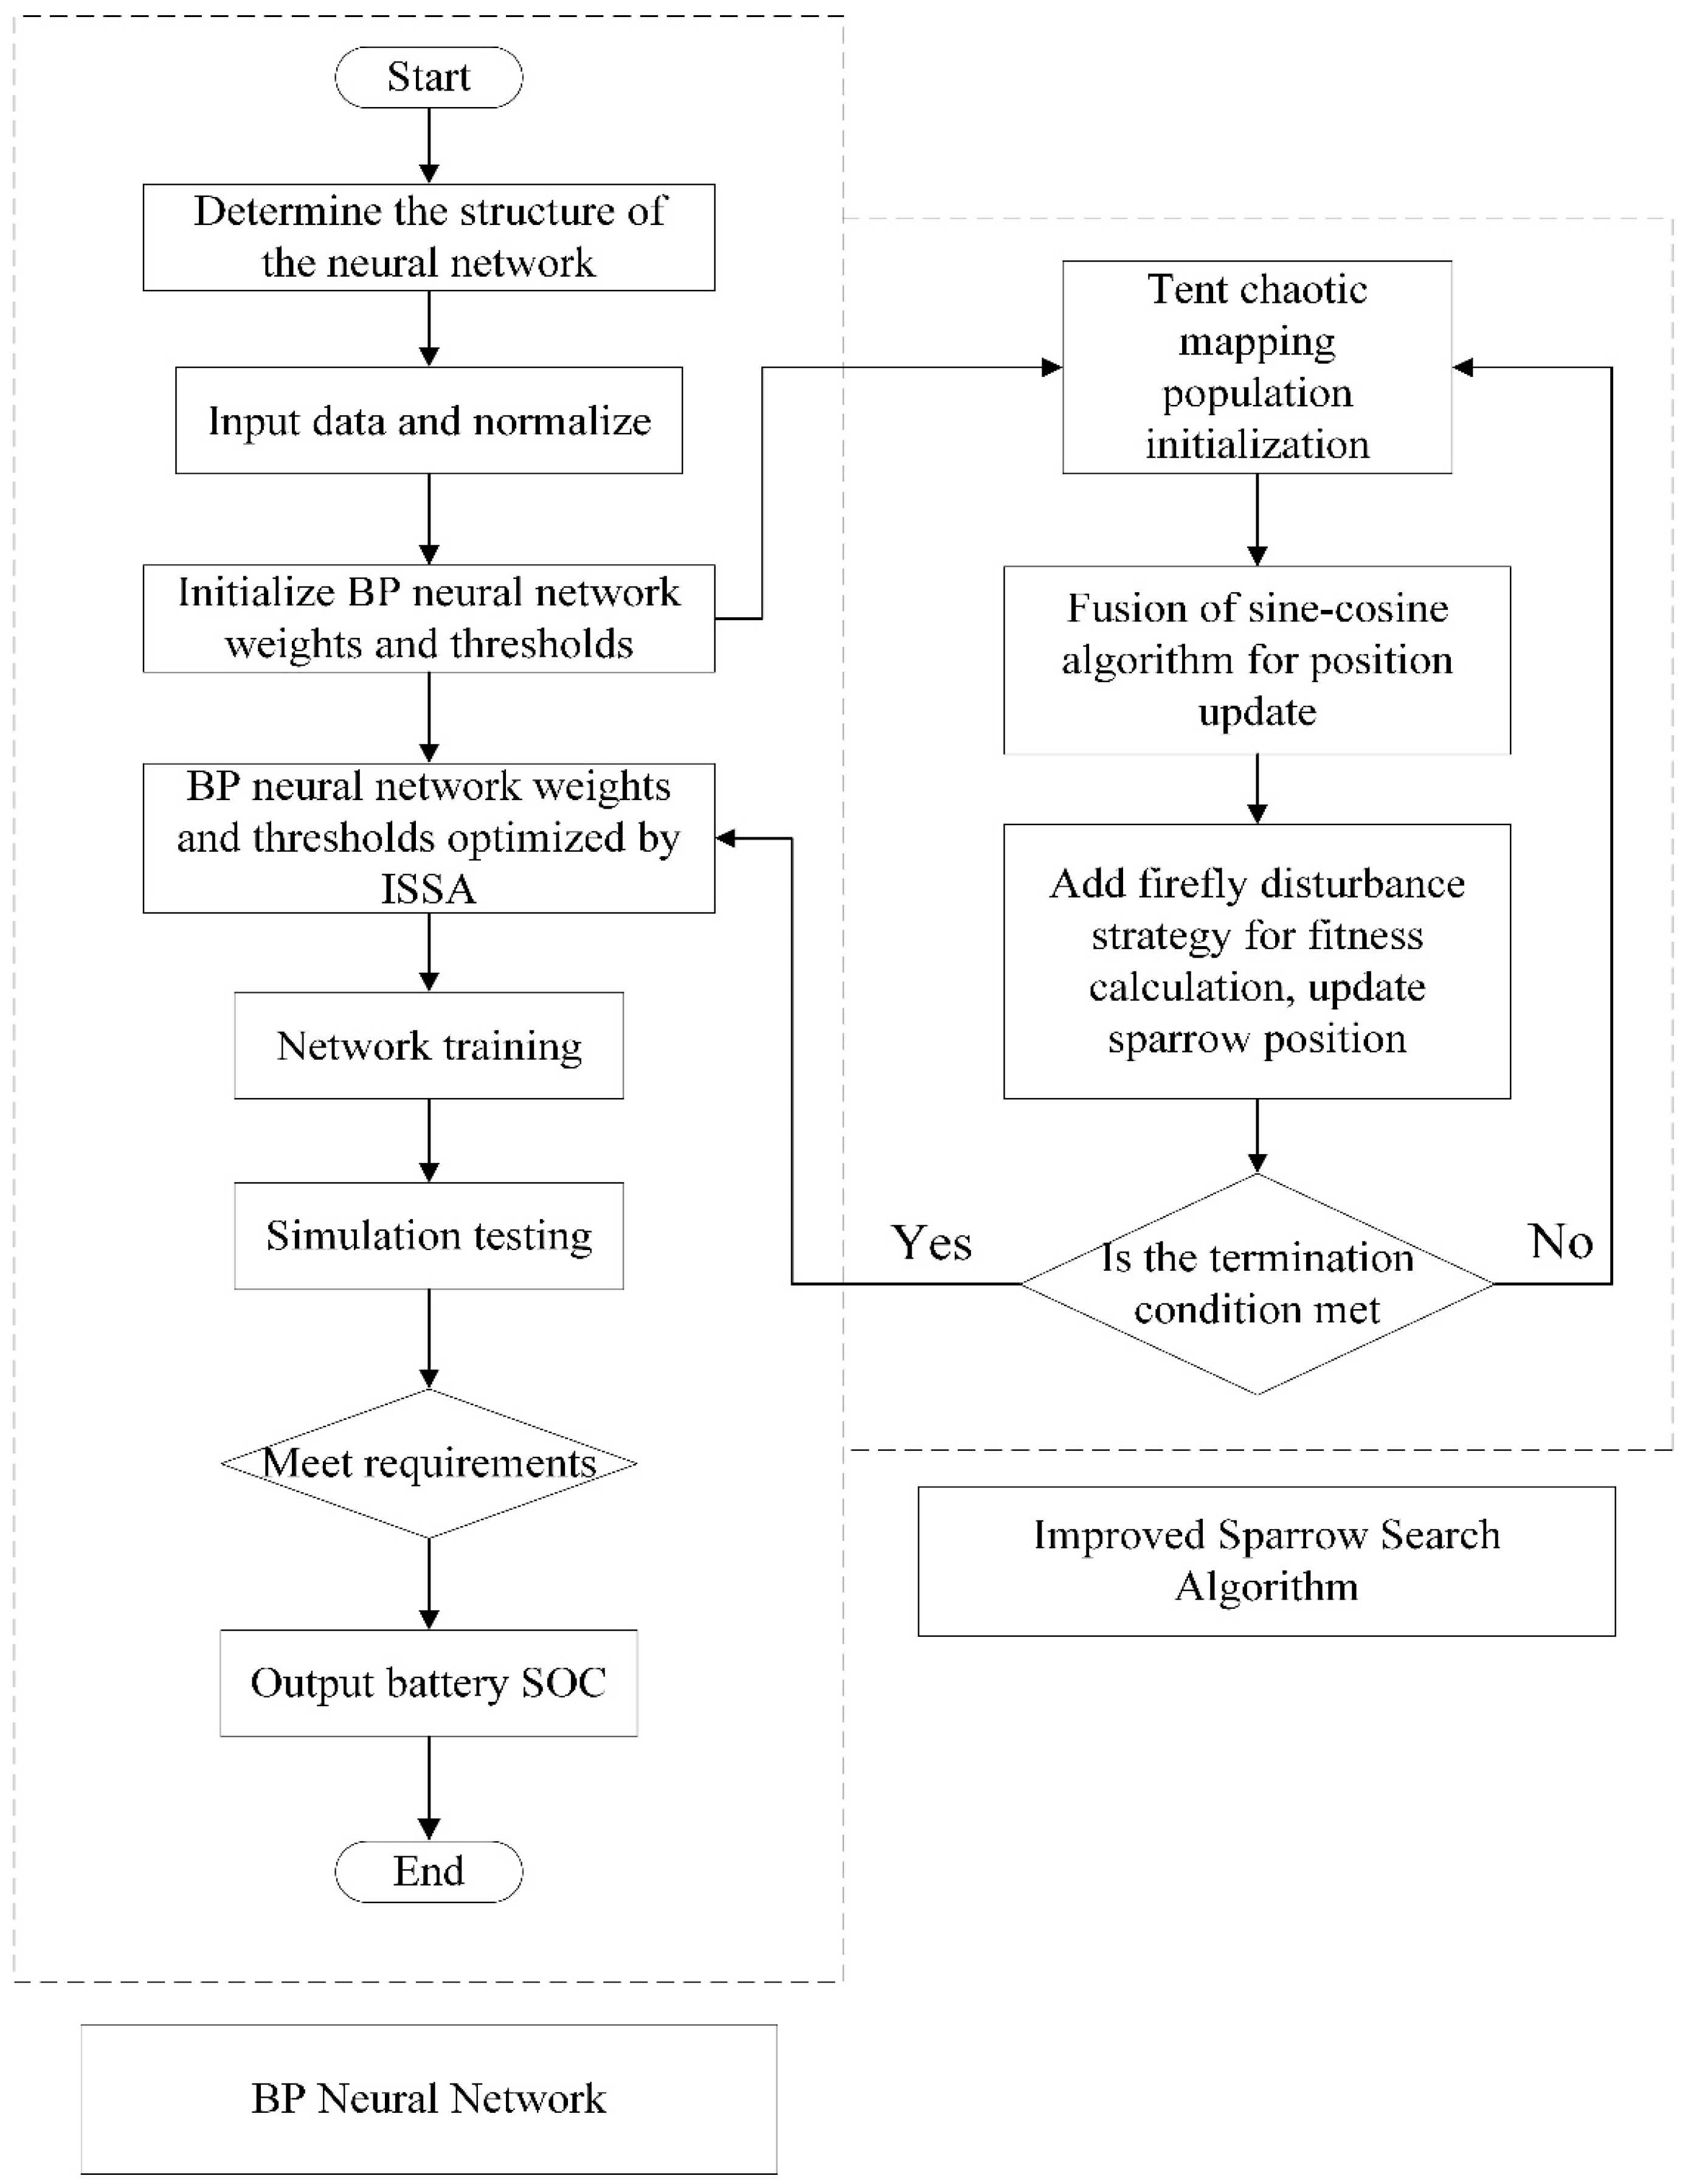
3.5. ISSNBP-Based Model Realization Process

Through the introduction of the Sparrow Search Algorithm (SSA) and its improvements, the global optimization capability of swarm intelligence algorithms is utilized to search for the optimal weights and thresholds of the neural network. The main steps of this method are as follows:
(1)
Normalize the input and output data, and set the basic parameters of the BP neural network, such as the maximum number of iterations, learning rate, etc.
(2)
Set the basic parameters of the Sparrow Search Algorithm, including the maximum number of iterations, population size, safety threshold, upper and lower bounds of initial values, etc.
(3)
Initialize the population using Tent chaotic mapping, and calculate the fitness of each sparrow individual in every generation.
(4)
Update each individual in the sparrow population, selecting individuals with high fitness values as producers.
(5)
Introduce the sine–cosine algorithm into the update of producers, update the positions of producers, and select individuals with high fitness as producers.
(6)
Update the positions of followers and alerters in the sparrow population, and calculate their fitness.
(7)
Add firefly disturbance to the updated population, calculate the fitness of the updated sparrow population, and update the positions of the sparrows.
(8)
Calculate the fitness, determine the optimal position of the population, and input the optimal structural parameters into the BP neural network for training.
(9)
Judge whether the training requirements are met based on the training error. If not, continue training the network; if met, stop the calculation and output the battery’s SOC value.
The steps for SOC training and prediction using the Improved Sparrow Search Algorithm to optimize the BP neural network can be summarized as shown in Figure 5.

4. Simulation Experiment and Analysis

4.1. Sampling Data Selection

In this paper, all the data utilized were obtained from controlled physical experiments conducted on lithium-ion batteries in our laboratory. To ensure the reliability and representativeness of the model training and validation process, three typical dynamic operating conditions were specifically designed: a DST (Dynamic Stress Test), UDDS (Urban Dynamometer Driving Schedule), and FUDS (Federal Urban Driving Schedule). During the experiments, the key operational parameters of the battery, including the charging/discharging voltage, current, and temperature, were continuously recorded, accurately capturing the battery’s behavior under complex dynamic load profiles. Additionally, the sample data were normalized to ensure that all samples had the same weight, which helped to avoid training errors caused by large differences in the magnitude of the input data. Furthermore, the samples were shuffled to disrupt their overall order, preventing the concentration of input data and achieving better expected results. Figure 6 shows the battery SOC obtained by processing the experimental data using the ampere-hour integration method under normal-temperature DST, UDDS, and FUDS conditions, respectively. In this paper, the battery SOC calculated by the ampere-hour integration method is used as the true value of the battery SOC.

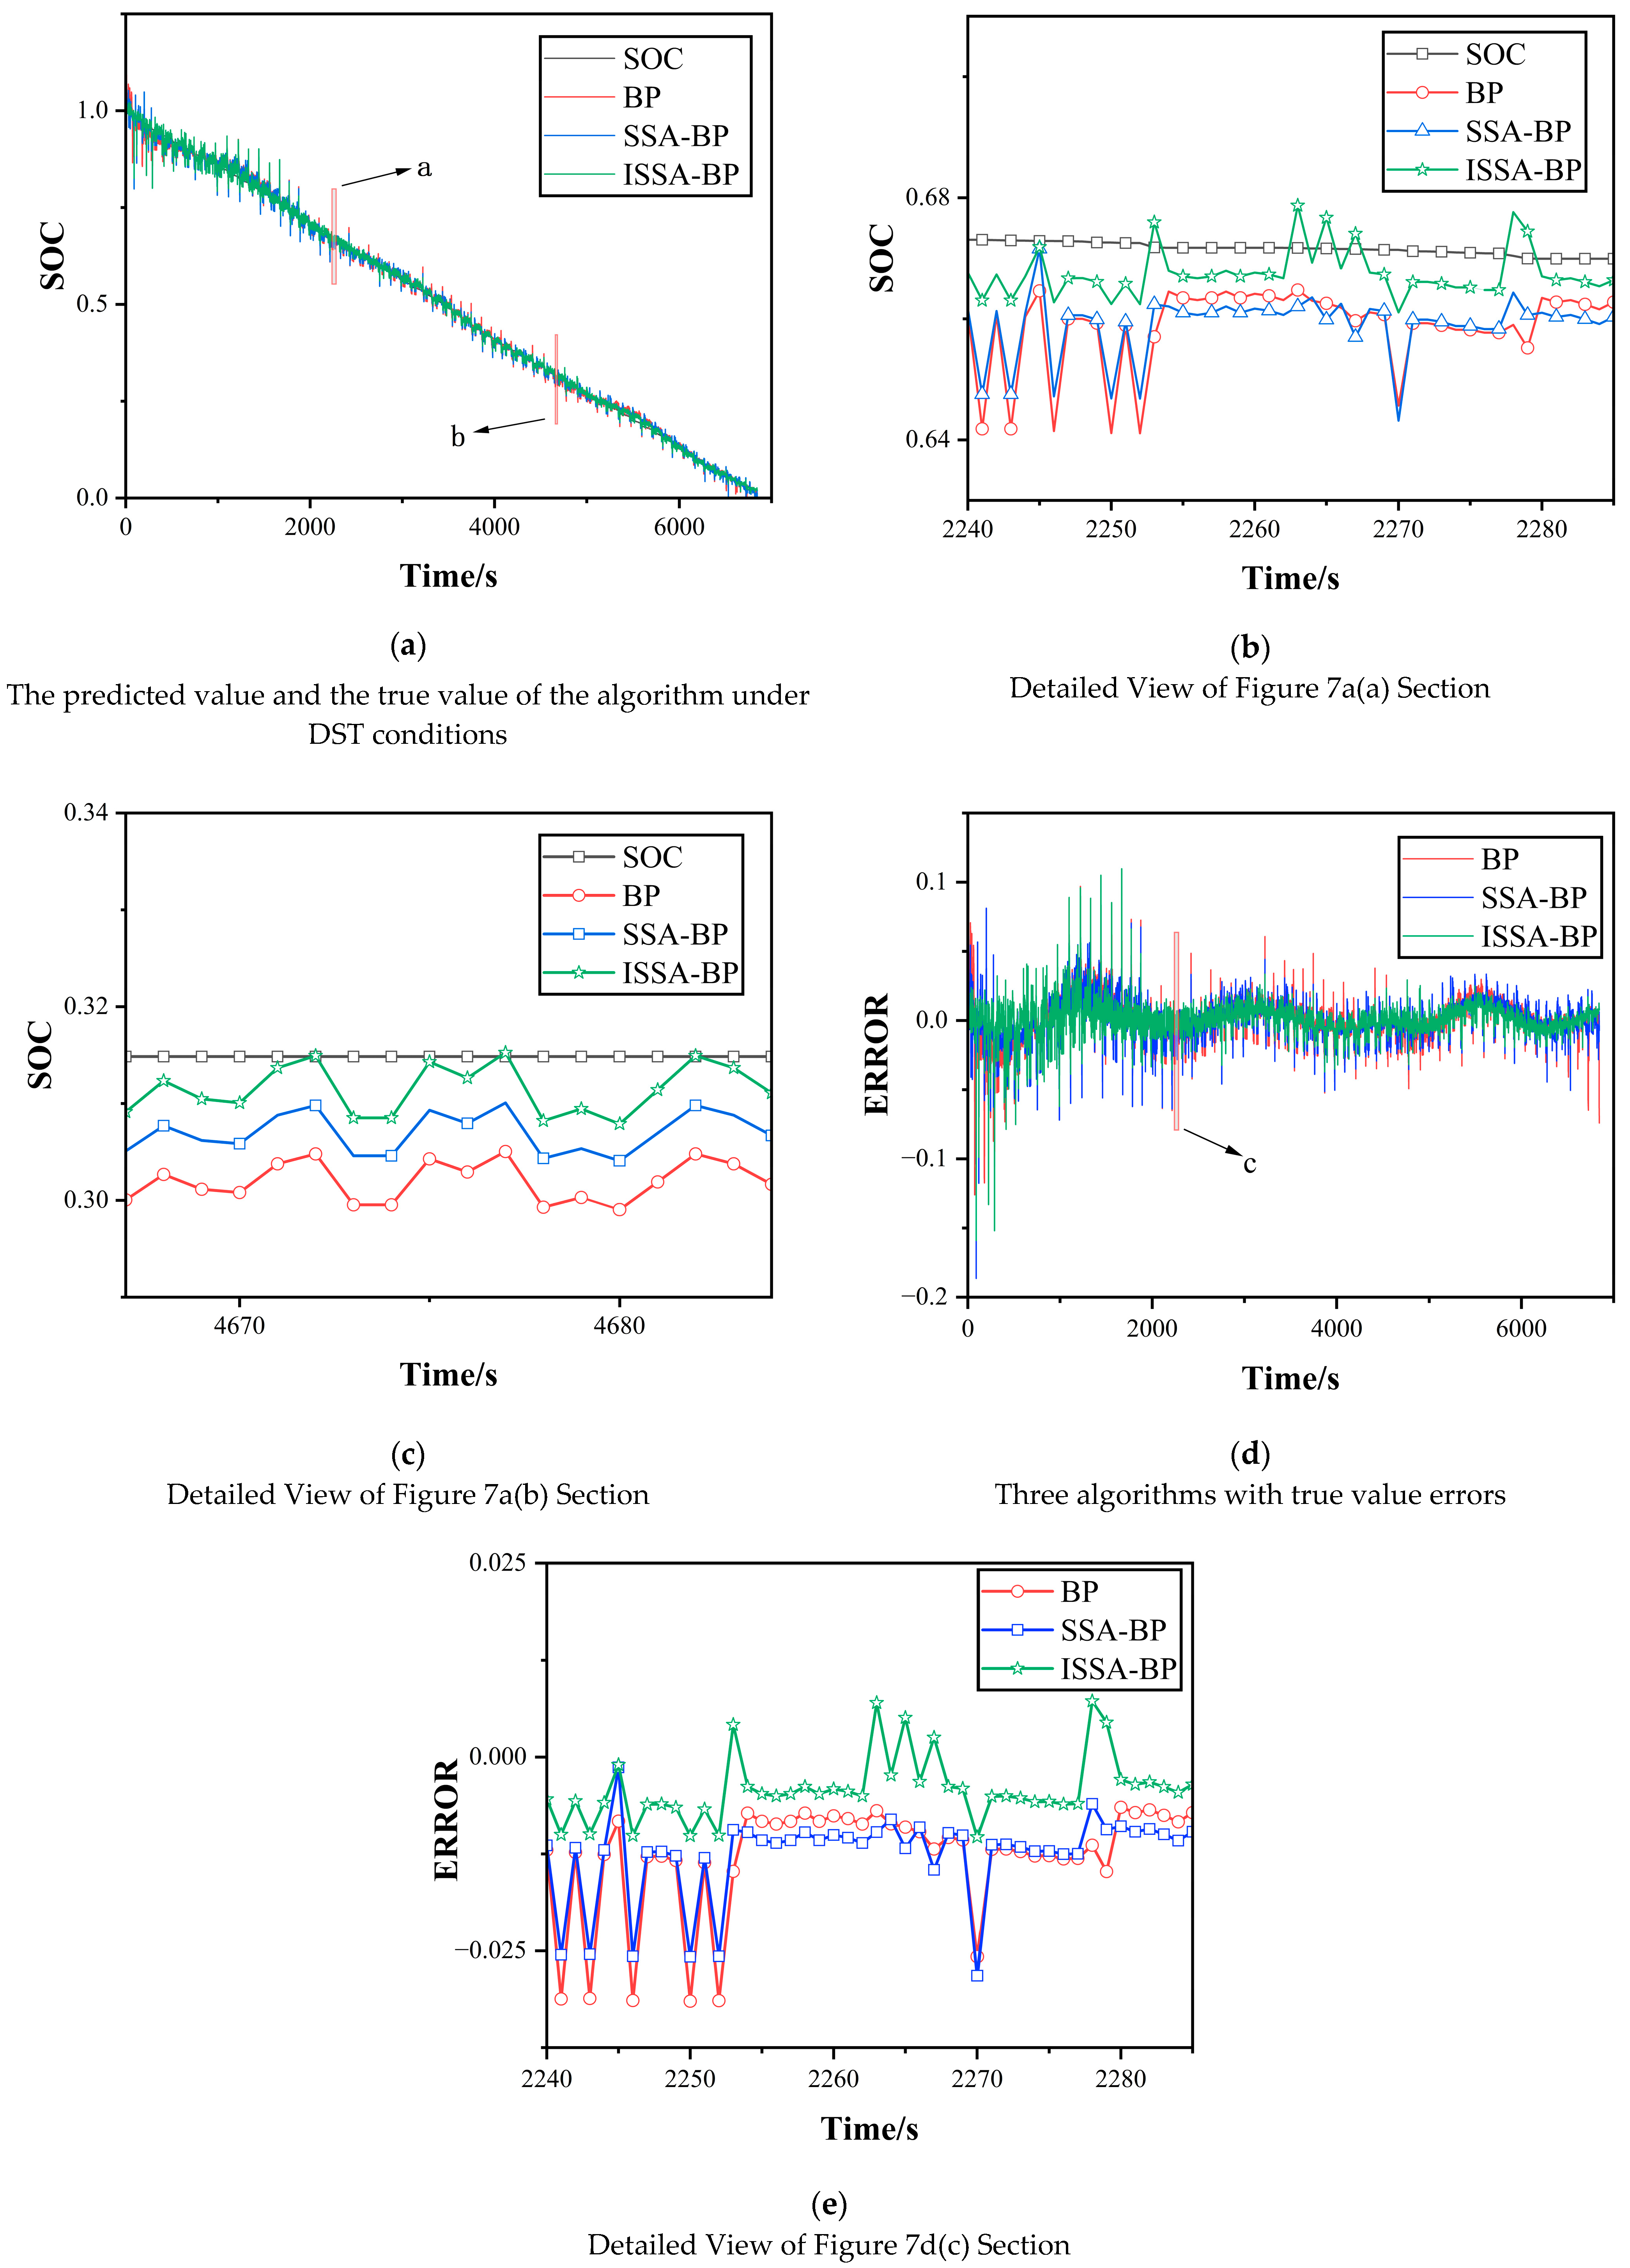
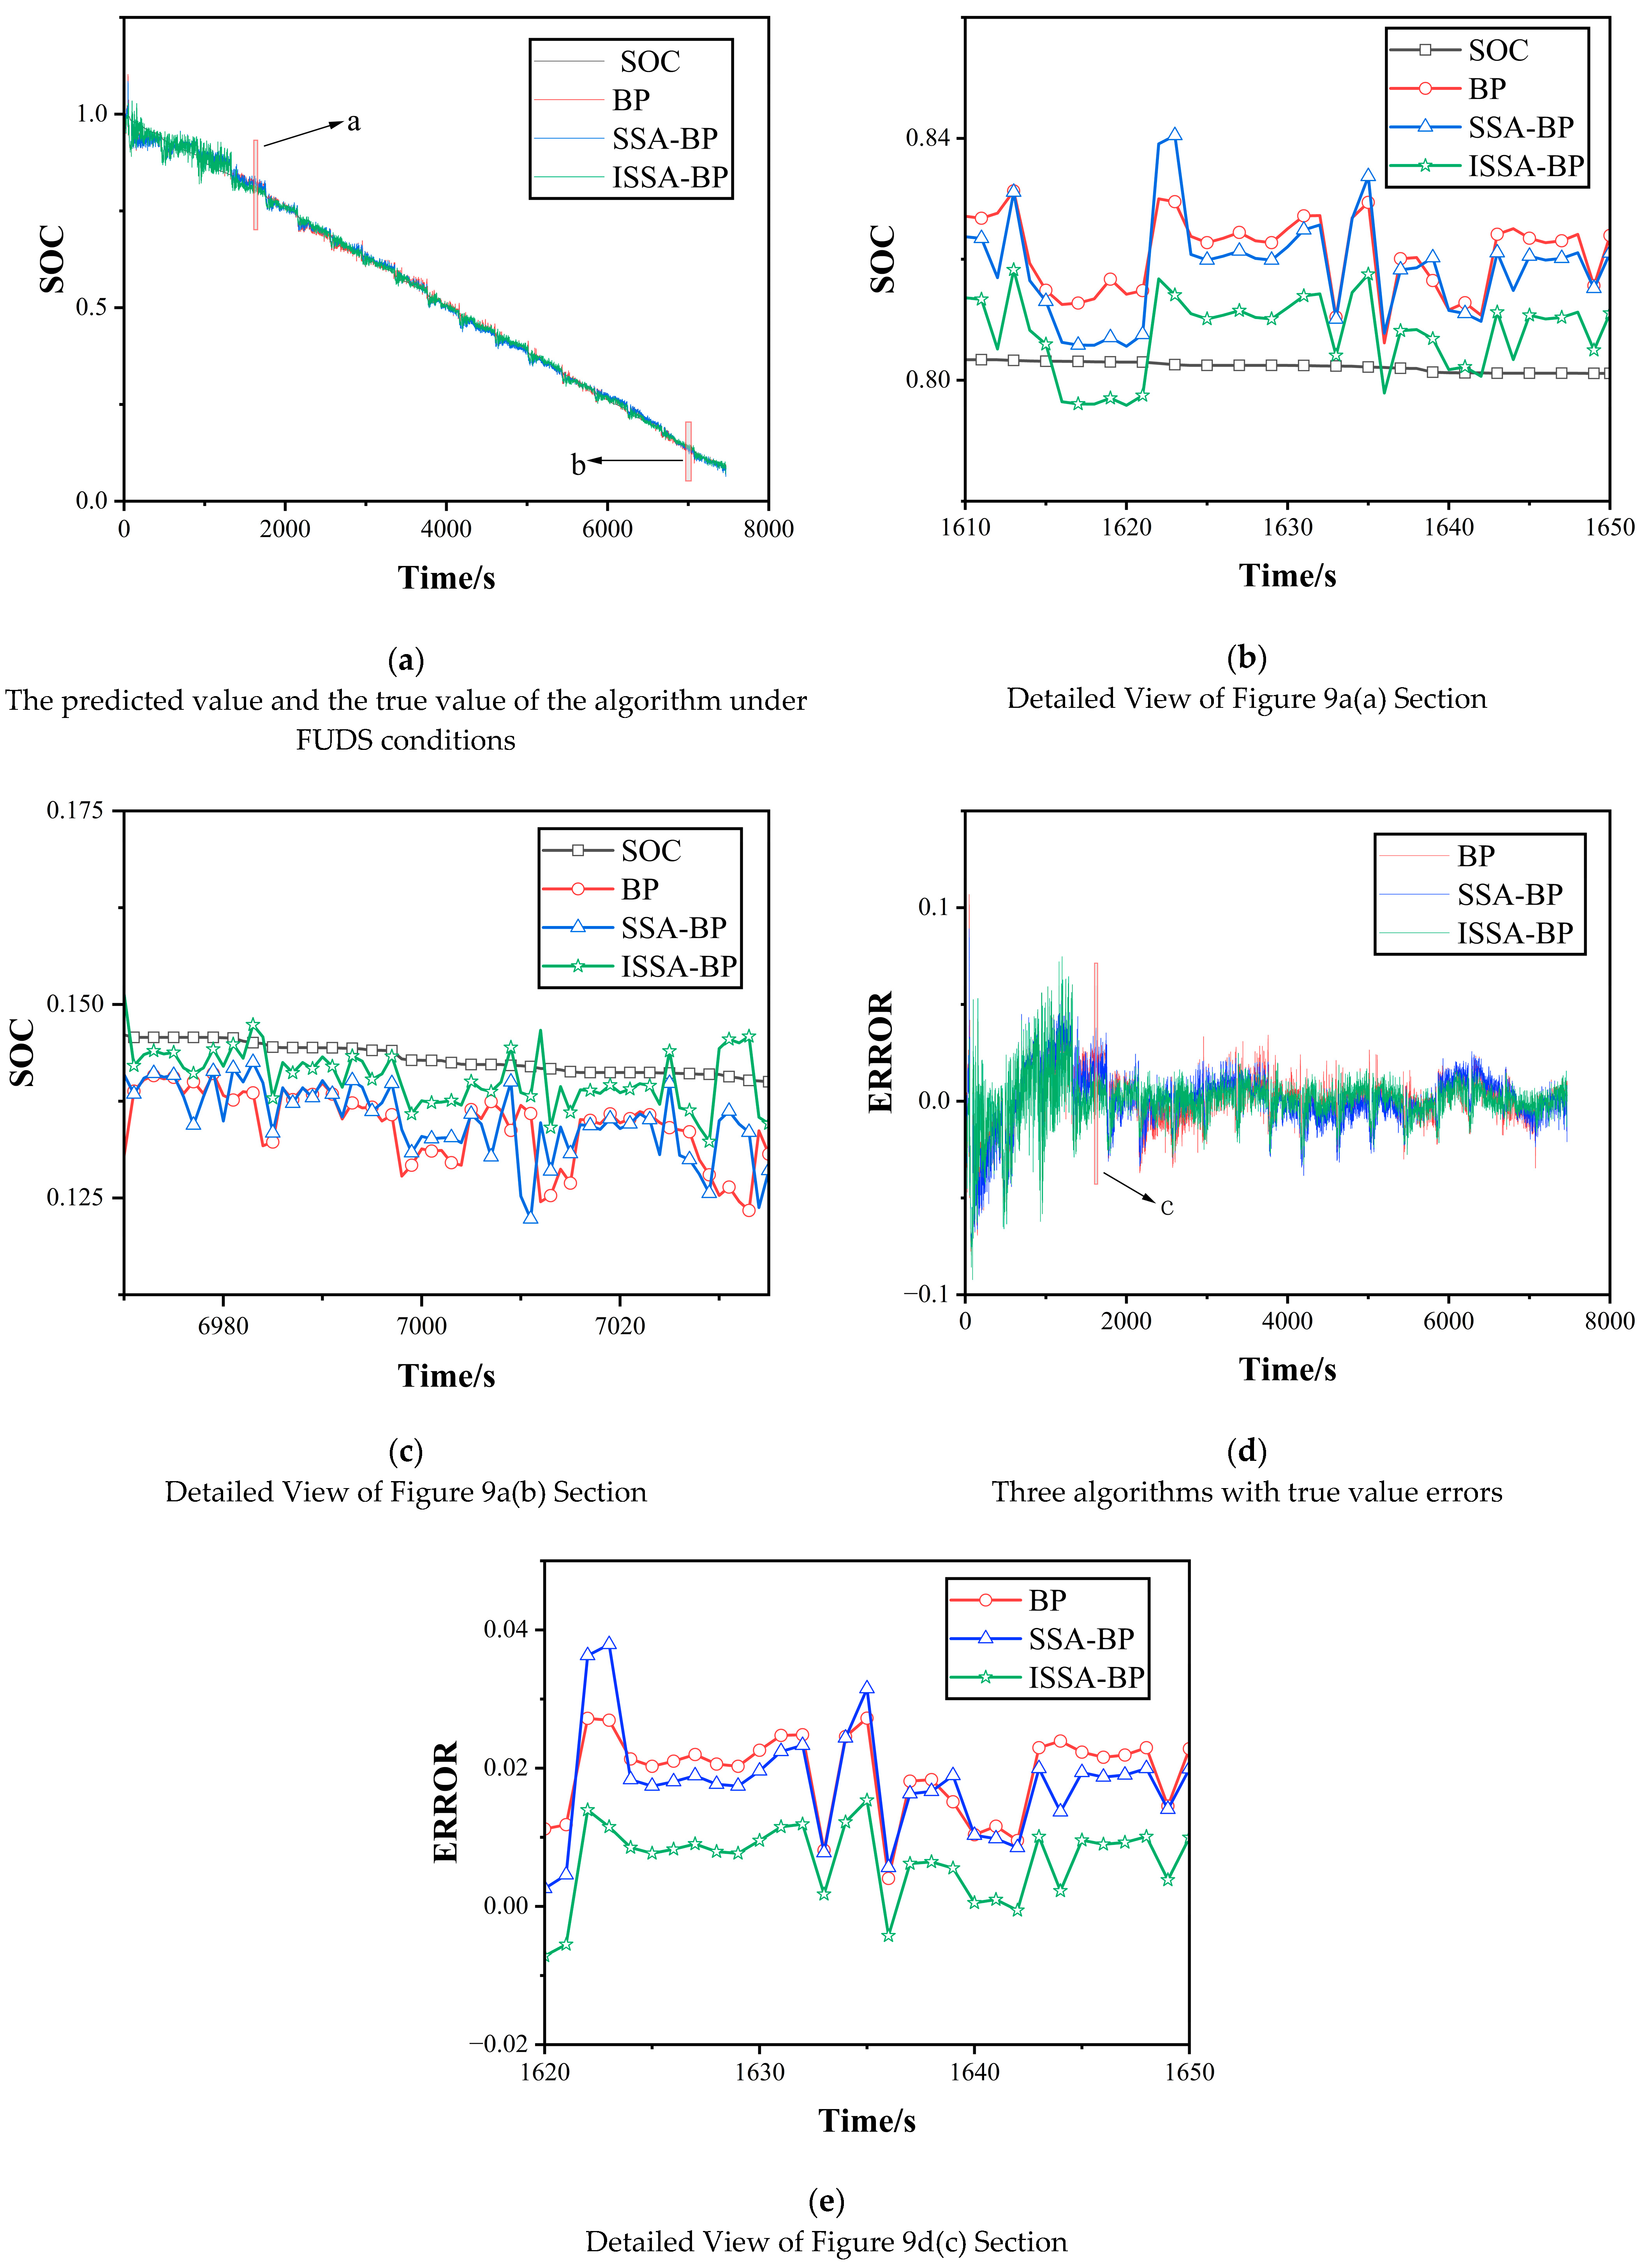
4.2. Results and Discussion

The results of SOC prediction using the BP neural network, SSA-BP network, and ISSA-BP network are compared. The prediction performance of the improved networks is validated under DST, UDDS, and FUDS conditions. The prediction results are evaluated based on the mean absolute error (MAE), mean squared error (MSE), and Root Mean Squared Error (RMSE).
Under DST Conditions:
The results and errors of each algorithm are shown in Figure 7. Figure 7a displays the true SOC values and the SOC values predicted by the BP neural network, SSA-BP neural network, and ISSA-BP neural network. Figure 7b shows the detailed view of part (a) in Figure 7a. Figure 7c shows the detailed view of part (b) in Figure 7a. Figure 7d illustrate the errors between the SOC predicted by the three algorithms and the true SOC values. Figure 7e shows the detailed view of part (c) in Figure 7d.
The evaluation metrics for the test are presented in Table 2.
Under UDDS Conditions:
The results and errors of each algorithm are shown in Figure 8.
Figure 8a displays the true SOC values and the SOC values predicted by the BP neural network, SSA-BP neural network, and ISSA-BP neural network.
Figure 8b shows the detailed view of part (a) in Figure 8a. Figure 8c shows the detailed view of part (b) in Figure 8a. Figure 8d illustrate the errors between the SOC predicted by the three algorithms and the true SOC values. Figure 8e shows the detailed view of part (c) in Figure 8d.
The evaluation metrics for the test are presented in Table 3.
Under FUDS Conditions:
The results and errors of each algorithm are shown in Figure 9.
Figure 9a displays the true SOC values and the SOC values predicted by the BP neural network, SSA-BP neural network, and ISSA-BP neural network.
Figure 9b shows the detailed view of part (a) in Figure 9a. Figure 9c shows the detailed view of part (b) in Figure 9a. Figure 9d illustrate the errors between the SOC predicted by the three algorithms and the true SOC values. Figure 9e shows the detailed view of part (c) in Figure 9d.
The evaluation metrics for the test are presented in Table 4.
From the evaluation metrics of the prediction results of the three different networks, the following can be observed.
The experimental results under three representative operating conditions—DST, UDDS, and FUDS—demonstrate that the ISSA-BP model consistently achieves higher prediction accuracy and greater stability compared to both the traditional BP and SSA-BP networks. Under the DST condition, the mean absolute error (MAE) of ISSA-BP is 0.0073, which is significantly lower than that of SSA-BP (0.0109) and BP (0.0122). This is accompanied by a corresponding reduction in THE MSE and RMSE, indicating not only improved accuracy but also smoother error performance in conditions involving frequent load changes.
In the UDDS cycle, the MAE of ISSA-BP is 0.0079, again outperforming SSA-BP (0.0102) and BP (0.0111). Under the FUDS condition, ISSA-BP maintains its advantage with an MAE of 0.0081, compared to 0.0107 for SSA-BP and 0.0108 for BP. In all three working conditions, ISSA-BP achieves the lowest error values across all evaluation metrics.
These results show that ISSA-BP performs better than the other two models in all the tested scenarios. The differences in error values are stable and significant across different types of driving cycles, reflecting the enhanced optimization capability brought by the improved search strategy. Based solely on the available data, it is clear that the ISSA-BP model provides the most accurate and reliable SOC prediction results among the three methods tested.

5. Conclusions

In this study, a BP neural network optimized by an Improved Sparrow Search Algorithm was developed to achieve accurate and robust SOC estimation for lithium-ion batteries. The proposed framework integrates Tent chaotic mapping, sine–cosine modulation, and firefly-inspired perturbation strategies into the standard SSA to enhance its global search capability and convergence stability. The resulting ISSA-BP model was constructed with voltage, current, and temperature as the input features and trained to map the complex nonlinear relationship with the SOC.
The model was comprehensively evaluated under three representative operating conditions—a DST, UDDS, and FUDS. The experimental results show that the ISSA-BP model significantly outperforms conventional BP and SSA-BP methods, achieving a mean absolute error below 1% and demonstrating superior accuracy and robustness under dynamic load profiles.
Although the proposed method has shown promising performance in simulation environments, further validation under real-world operating conditions is still required.
Future research will focus on experimental verification using real-world datasets, integration into BMS platforms, and an extension to multi-task frameworks for the joint estimation of SOC and SOH.

Author Contributions

Conceptualization, S.H.; data curation, S.H.; methodology, T.W. and Z.J.; software, X.L. and R.Z.; validation, T.W. and Z.J.; writing—original draft, S.H. and D.C.; writing—review and editing, L.W. All authors have read and agreed to the published version of the manuscript.

Funding

Supported by the Scientific and Technological Innovation Programs of Higher Education Institutions in Shanxi (2024L175); supported by the Fundamental Research Program of Shanxi Province (202403021222149); supported by the Fundamental Research Program of Shanxi Province (No. 202303021211161).

Informed Consent Statement

Not applicable.

Data Availability Statement

The original contributions presented in the study are included in the article; further inquiries can be directed to the corresponding author.

Conflicts of Interest

The authors declare no conflicts of interest.

Abbreviations

The following abbreviations are used in this manuscript:
BMSBattery management system
SOCState of charge
SSASparrow Search Algorithm
BPBackpropagation
DSTDynamic Stress Test
UDDSUrban Dynamometer Driving Schedule
FUDSFederal Urban Driving Schedule
MAEMean absolute error
MSEMean squared error
RMSERoot Mean Squared Error

References

  1. Jiang, M.; Li, D.; Li, Z.; Chen, Z.; Yan, Q.; Lin, F.; Yu, C.; Jiang, B.; Wei, X.; Yan, W.; et al. Advances in battery state estimation of battery management system in electric vehicles. J. Power Sources 2024, 612, 234781. [Google Scholar] [CrossRef]
  2. Bentley, P.; Bhangu, B.; Bingham, C.; Stone, D. Nonlinear observers for predicting state-of-charge and state-of-health of lead-acid batteries for hybrid-electric vehicles. IEEE Trans. Veh. Technol. 2005, 54, 783–794. [Google Scholar]
  3. Zhu, X.Q.; Wang, Z.P.; Wang, H. Review of research on thermal runaway and safety management of lithium-ion power battery. Chin. J. Mech. Eng. 2020, 56, 18–91. [Google Scholar]
  4. Yu, Q.; Huang, Y.; Tang, A.; Wang, C.; Shen, W. OCV-SOC-Temperature Relationship Construction and State of Charge Estimation for a Series–Parallel Lithium-Ion Battery Pack. IEEE Trans. Intell. Transp. Syst. 2023, 24, 6362–6371. [Google Scholar] [CrossRef]
  5. Chouhan, S.; Guha, A. Incremental State-of-Charge determination of a Lithium-ion battery based on Capacity update using Particle Filtering framework. In Proceedings of the 2023 IEEE Transportation Electrification Conference & Expo (ITEC), Detroit, MI, USA, 21–23 June 2023; pp. 1–6. [Google Scholar]
  6. Xu, Y.; Hu, M.; Fu, C.; Cao, K.; Su, Z.; Yang, Z. State of Charge Estimation for Lithium-Ion Batteries Based on Temperature-Dependent Second-Order RC Model. Electronics 2019, 8, 1012. [Google Scholar] [CrossRef]
  7. Tong, S.; Klein, M.P.; Park, J.W. On-line optimization of battery open circuit voltage for improved state-of-charge and state-of-health estimation. J. Power Sources 2015, 293, 416–428. [Google Scholar] [CrossRef]
  8. Xu, X.; Huang, C.-S.; Chow, M.-Y.; Luo, H.; Yin, S. Data-driven SOC Estimation with Adaptive Residual Generator for Li-ion Battery. In Proceedings of the IECON 2020 the 46th Annual Conference of the IEEE Industrial Electronics Society, Singapore, 18–21 October 2020; pp. 2612–2616. [Google Scholar]
  9. Zhang, X.; Jin, Y.; Zhang, R.; Dong, H. Lithium Battery SOC Prediction Based on mproved BP eural etwork Algorithm. In Proceedings of the 2021 3rd Asia Energy and Electrical Engineering Symposium (AEEES), Chengdu, China, 26–29 March 2021; pp. 882–886. [Google Scholar]
  10. Wang, W.; Wang, X.; Xiang, C.; Wei, C.; Zhao, Y. Unscented Kalman Filter-Based Battery SOC Estimation and Peak Power Prediction Method for Power Distribution of Hybrid Electric Vehicles. IEEE Access 2018, 6, 35957–35965. [Google Scholar] [CrossRef]
  11. Mao, X.; Song, S.; Ding, F. Optimal BP neural network algorithm for state of charge estimation of lithium-ion battery using PSO with Levy flight. J. Energy Storage 2022, 49, 104139. [Google Scholar] [CrossRef]
  12. Zhou, K.; Li, R.; Xu, S.; Li, S.; Zhou, Y.; Liu, X.; Yao, J. State of Charge Prediction Algorithm of Lithium-Ion Battery Based on PSO-SVR Cross Validation. IEEE Access 2020, 8, 10234–10242. [Google Scholar]
  13. Hong, J.; Wang, Z.; Chen, W.; Wang, L.-Y.; Qu, C. Online joint-prediction of multi-forward-step battery SOC using LSTM neural networks and multiple linear regression for real-world electric vehicles. J. Energy Storage 2020, 30, 101459. [Google Scholar] [CrossRef]
  14. Haus, B.; Mercorelli, P. Polynomial Augmented Extended Kalman Filter to Estimate the State of Charge of Lithium-Ion Batteries. IEEE Trans. Veh. Technol. 2020, 69, 1452–1463. [Google Scholar] [CrossRef]
  15. Mohammadi, F. Lithium-ion battery State-of-Charge estimation based on an improved Coulomb-Counting algorithm and uncertainty evaluation. J. Energy Storage 2022, 48, 104061. [Google Scholar] [CrossRef]
  16. Zhao, F.; Li, P.; Li, Y.; Li, Y. The Li-ion Battery State of Charge Prediction of Electric Vehicle Using Deep Neural Network. In Proceedings of the 2019 Chinese Control And Decision Conference (CCDC), Nanchang, China, 3–5 June 2019; pp. 773–777. [Google Scholar]
  17. Shen, Y. Adaptive online state-of-charge determination based on neuro-controller and neural network. Energy Convers. Manag. 2010, 51, 1093–1098. [Google Scholar] [CrossRef]
  18. El Fallah, S.; Kharbach, J.; Hammouch, Z.; Rezzouk, A.; Jamil, M.O. State of charge estimation of an electric vehicle’s battery using Deep Neural Networks: Simulation and experimental results. J. Energy Storage 2023, 62, 106904. [Google Scholar] [CrossRef]
  19. Bhattacharyya, H.S.; Yadav, A.; Choudhury, A.B.; Chanda, C.K. Convolution Neural Network-Based SOC Estimation of Li-ion Battery in EV Applications. In Proceedings of the 2021 5th International Conference on Electrical, Electronics, Communication, Computer Technologies and Optimization Techniques (ICEECCOT), Mysuru, India, 10–11 December 2021; pp. 587–592. [Google Scholar]
  20. Qi, Y.; Jiang, A.; Gao, Y. A Gaussian convolutional optimization algorithm with tent chaotic mapping. Sci. Rep. 2024, 14, 31027. [Google Scholar] [CrossRef]
  21. Ren, X.; Chen, S.; Wang, K.; Tan, J. Design and application of improved sparrow search algorithm based on sine cosine and firefly perturbation. Math. Biosci. Eng. 2022, 19, 11422–11452. [Google Scholar] [CrossRef]
  22. Wei, F.; Feng, Y.; Shi, X.; Hou, K. Improved sparrow search algorithm with adaptive multi-strategy hierarchical mechanism for global optimization and engineering problems. Cluster Comput. 2025, 28, 215. [Google Scholar] [CrossRef]
  23. Fei, T.; Wang, H.; Liu, L.; Zhang, L.; Wu, K.; Guo, J. Research on multi-strategy improved sparrow search optimization algorithm. Math. Biosci. Eng. 2023, 20, 17220–17241. [Google Scholar] [CrossRef]
  24. Liu, Y.; Lu, P.; Zhang, L.; Qi, Q.; Zhou, Q.; Chen, Y.; Hu, Y.; Ma, B. Enhanced Sparrow Search Algorithm With Mutation Strategy for Global Optimization. IEEE Access 2021, 9, 159218–159261. [Google Scholar]
  25. Sun, L.; Si, S.; Ding, W.; Wang, X.; Xu, J. Multiobjective sparrow search feature selection with sparrow ranking and preference information and its applications for high-dimensional data. Appl. Soft Comput. 2023, 147, 110837. [Google Scholar] [CrossRef]
  26. Dong, J.; Dou, Z.; Si, S.; Wang, Z.; Liu, L. Optimization of Capacity Configuration of Wind–Solar–Diesel–Storage Using Improved Sparrow Search Algorithm. J. Electr. Eng. Technol. 2022, 17, 1–14. [Google Scholar] [CrossRef]
  27. Guo, X.; Hu, Y.; Song, C.; Zhao, F.; Jiang, J. An improved sparrow search algorithm based on multiple strategies. In Proceedings of the 2024 5th International Conference on Computing, Networks and Internet of Things (CNIOT ‘24), Tokyo, Japan, 24–26 May 2024; Association for Computing Machinery: New York, NY, USA, 2024; pp. 112–118. [Google Scholar]
  28. Gao, B.; Shen, W.; Guan, H.; Zheng, L.; Zhang, W. Research on Multistrategy Improved Evolutionary Sparrow Search Algorithm and its Application. IEEE Access 2022, 10, 62520–62534. [Google Scholar] [CrossRef]
  29. Wang, Z.; Peng, Q.; Li, D.; Rao, W. An improved sparrow search algorithm with multi-strategy integration. Sci. Rep. 2025, 15, 3314. [Google Scholar] [CrossRef] [PubMed]
  30. Wang, Z.; Qin, J.; Hu, Z.; He, J.; Tang, D. Multi-Objective Antenna Design Based on BP Neural Network Surrogate Model Optimized by Improved Sparrow Search Algorithm. Appl. Sci. 2022, 12, 12543. [Google Scholar] [CrossRef]
  31. Dang, M.; Zhang, C.; Yang, Z.; Wang, J.; Li, Y.; Huang, J. An estimation method for the state-of-charge of lithium-ion battery based on PSO-LSTM. AIP Adv. 2023, 13, 115204. [Google Scholar] [CrossRef]
  32. Wang, Y.; Tang, J.; Xu, L.; Wang, L.; Li, W.; Wang, F. SOC estimation of lead–carbon battery based on GA-MIUKF algorithm. Sci. Rep. 2024, 14, 3347. [Google Scholar] [CrossRef]
  33. Zhang, X.; Hou, J.; Wang, Z.; Jiang, Y. Joint SOH-SOC Estimation Model for Lithium-Ion Batteries Based on GWO-BP Neural Network. Energies 2023, 16, 132. [Google Scholar] [CrossRef]
  34. Zhou, J.; Wang, S.; Cao, W.; Xie, Y.; Fernandez, C. State of health prediction of lithium-ion batteries based on SSA optimized hybrid neural network model. Electrochim. Acta 2024, 487, 144146. [Google Scholar] [CrossRef]
Figure 1. BP The structure of the network model.
Coatings 15 00697 g001
Figure 2. Tent distribution schematic diagram.
Coatings 15 00697 g002
Figure 3. Distribution after 5000 iterations.
Coatings 15 00697 g003
Figure 4. MSE loss curves of ISSA-BP.
Coatings 15 00697 g004
Figure 5. ISSA-BP network process.
Coatings 15 00697 g005
Figure 6. Calculation of the SOC using the ampere-hour integration method.
Coatings 15 00697 g006
Figure 7. DST condition test results.
Coatings 15 00697 g007
Figure 8. UDDS condition test results.
Coatings 15 00697 g008
Figure 9. FUDS condition test results.
Coatings 15 00697 g009
Table 1. Comparison of optimization algorithms for BP neural network training.
AlgorithmAdvantagesDisadvantages
PSOFast convergence
Simple implementation
Prone to local optima
GAStrong global search ability
Adaptive crossover mechanisms
Slow convergence
Sensitive to noise
GWOGood balance between exploration and exploitationPerformance degrades in high dimensions
SSAGood global exploration
Fewer control parameters
Accurate
Sensitive to initial population quality
ISSAHigh accuracy
Improved robustness
Better convergence
Increased complexity due to hybridization
Table 2. DST condition evaluation metrics.
BPSSA-BPISSA-BP
MAE0.01220.01090.0073
MSE2.8494 × 10−42.2003 × 10−41.1927 × 10−4
RMSE0.01690.01480.0109
Table 3. UDDS condition evaluation metrics.
BPSSA-BPISSA-BP
MAE0.01110.01020.0079
MSE2.0756 × 10−41.9204 × 10−41.1193 × 10−4
RMSE0.01440.01390.0106
Table 4. FUDS condition evaluation metrics.
BPSSA-BPISSA-BP
MAE0.01080.01070.0081
MSE2.3585 × 10−42.3547 × 10−41.5821 × 10−4
RMSE0.01540.01530.0126
Disclaimer/Publisher’s Note: The statements, opinions and data contained in all publications are solely those of the individual author(s) and contributor(s) and not of MDPI and/or the editor(s). MDPI and/or the editor(s) disclaim responsibility for any injury to people or property resulting from any ideas, methods, instructions or products referred to in the content.

