3.1. Coating Topography and Thickness Characterization
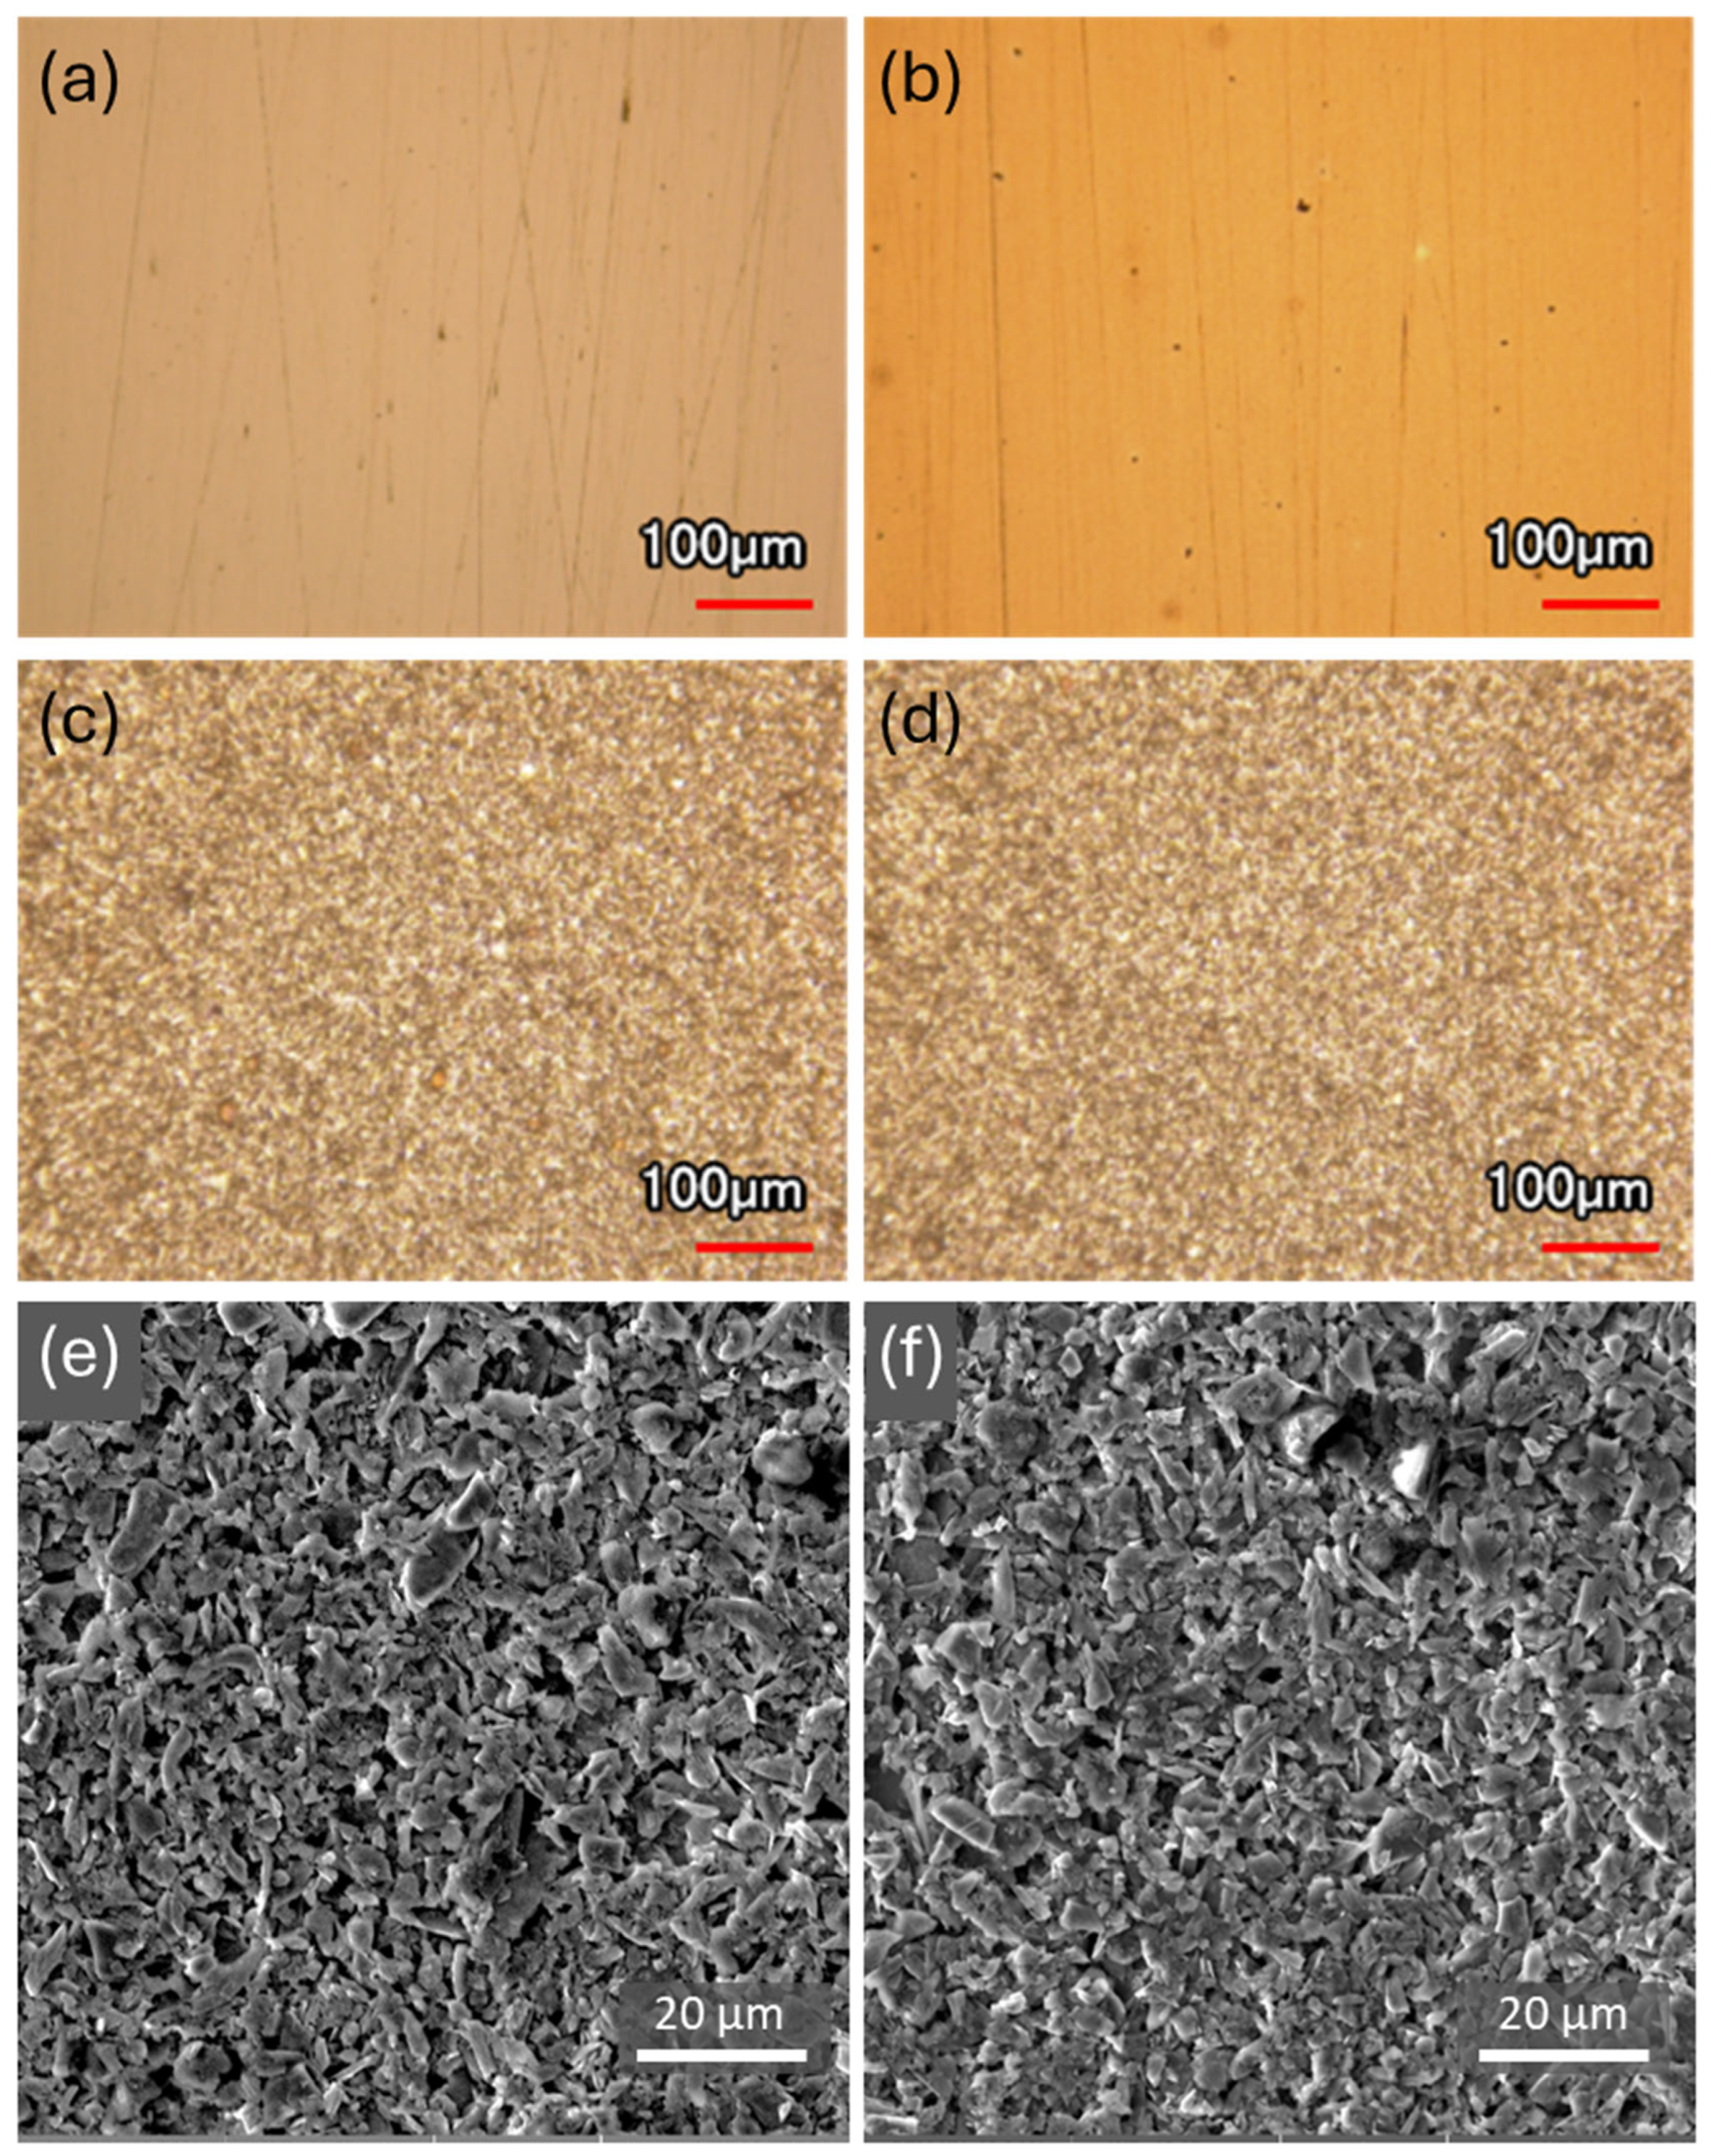
Figure 3 illustrates the key stages of the coating fabrication process through microscope images. In
Figure 3a, the cleaned substrate shows distinct polishing lines, highlighting the surface preparation prior to coating. After PDA deposition (
Figure 3b), the substrate exhibits a golden-brown hue, a characteristic observed in previous studies. The substrate polishing lines are still visible, indicating the coating is very thin, less than 100 nm as we previously reported [
25]. Additionally, small dark aggregates are visible across the surface, further indicating the presence of PDA coating.
The graphite coatings, with and without a PDA underlayer, appear similar in optical images (
Figure 3c,d), with no major visual differences between the two. This resemblance is further supported by SEM images (
Figure 3e,f), which show graphite flakes aligned parallel to the substrate and closely packed. The coatings exhibit minimal porosity or visible gaps, suggesting uniform surface coverage. These images also reveal that the SS/PDA/graphite coating is slightly more densely and uniformly packed than the SS/graphite coating. The overall morphology is consistent with previously reported graphite coatings for solar cell electrodes, which display comparable porosity and flake edge visibility at similar magnifications [
34].
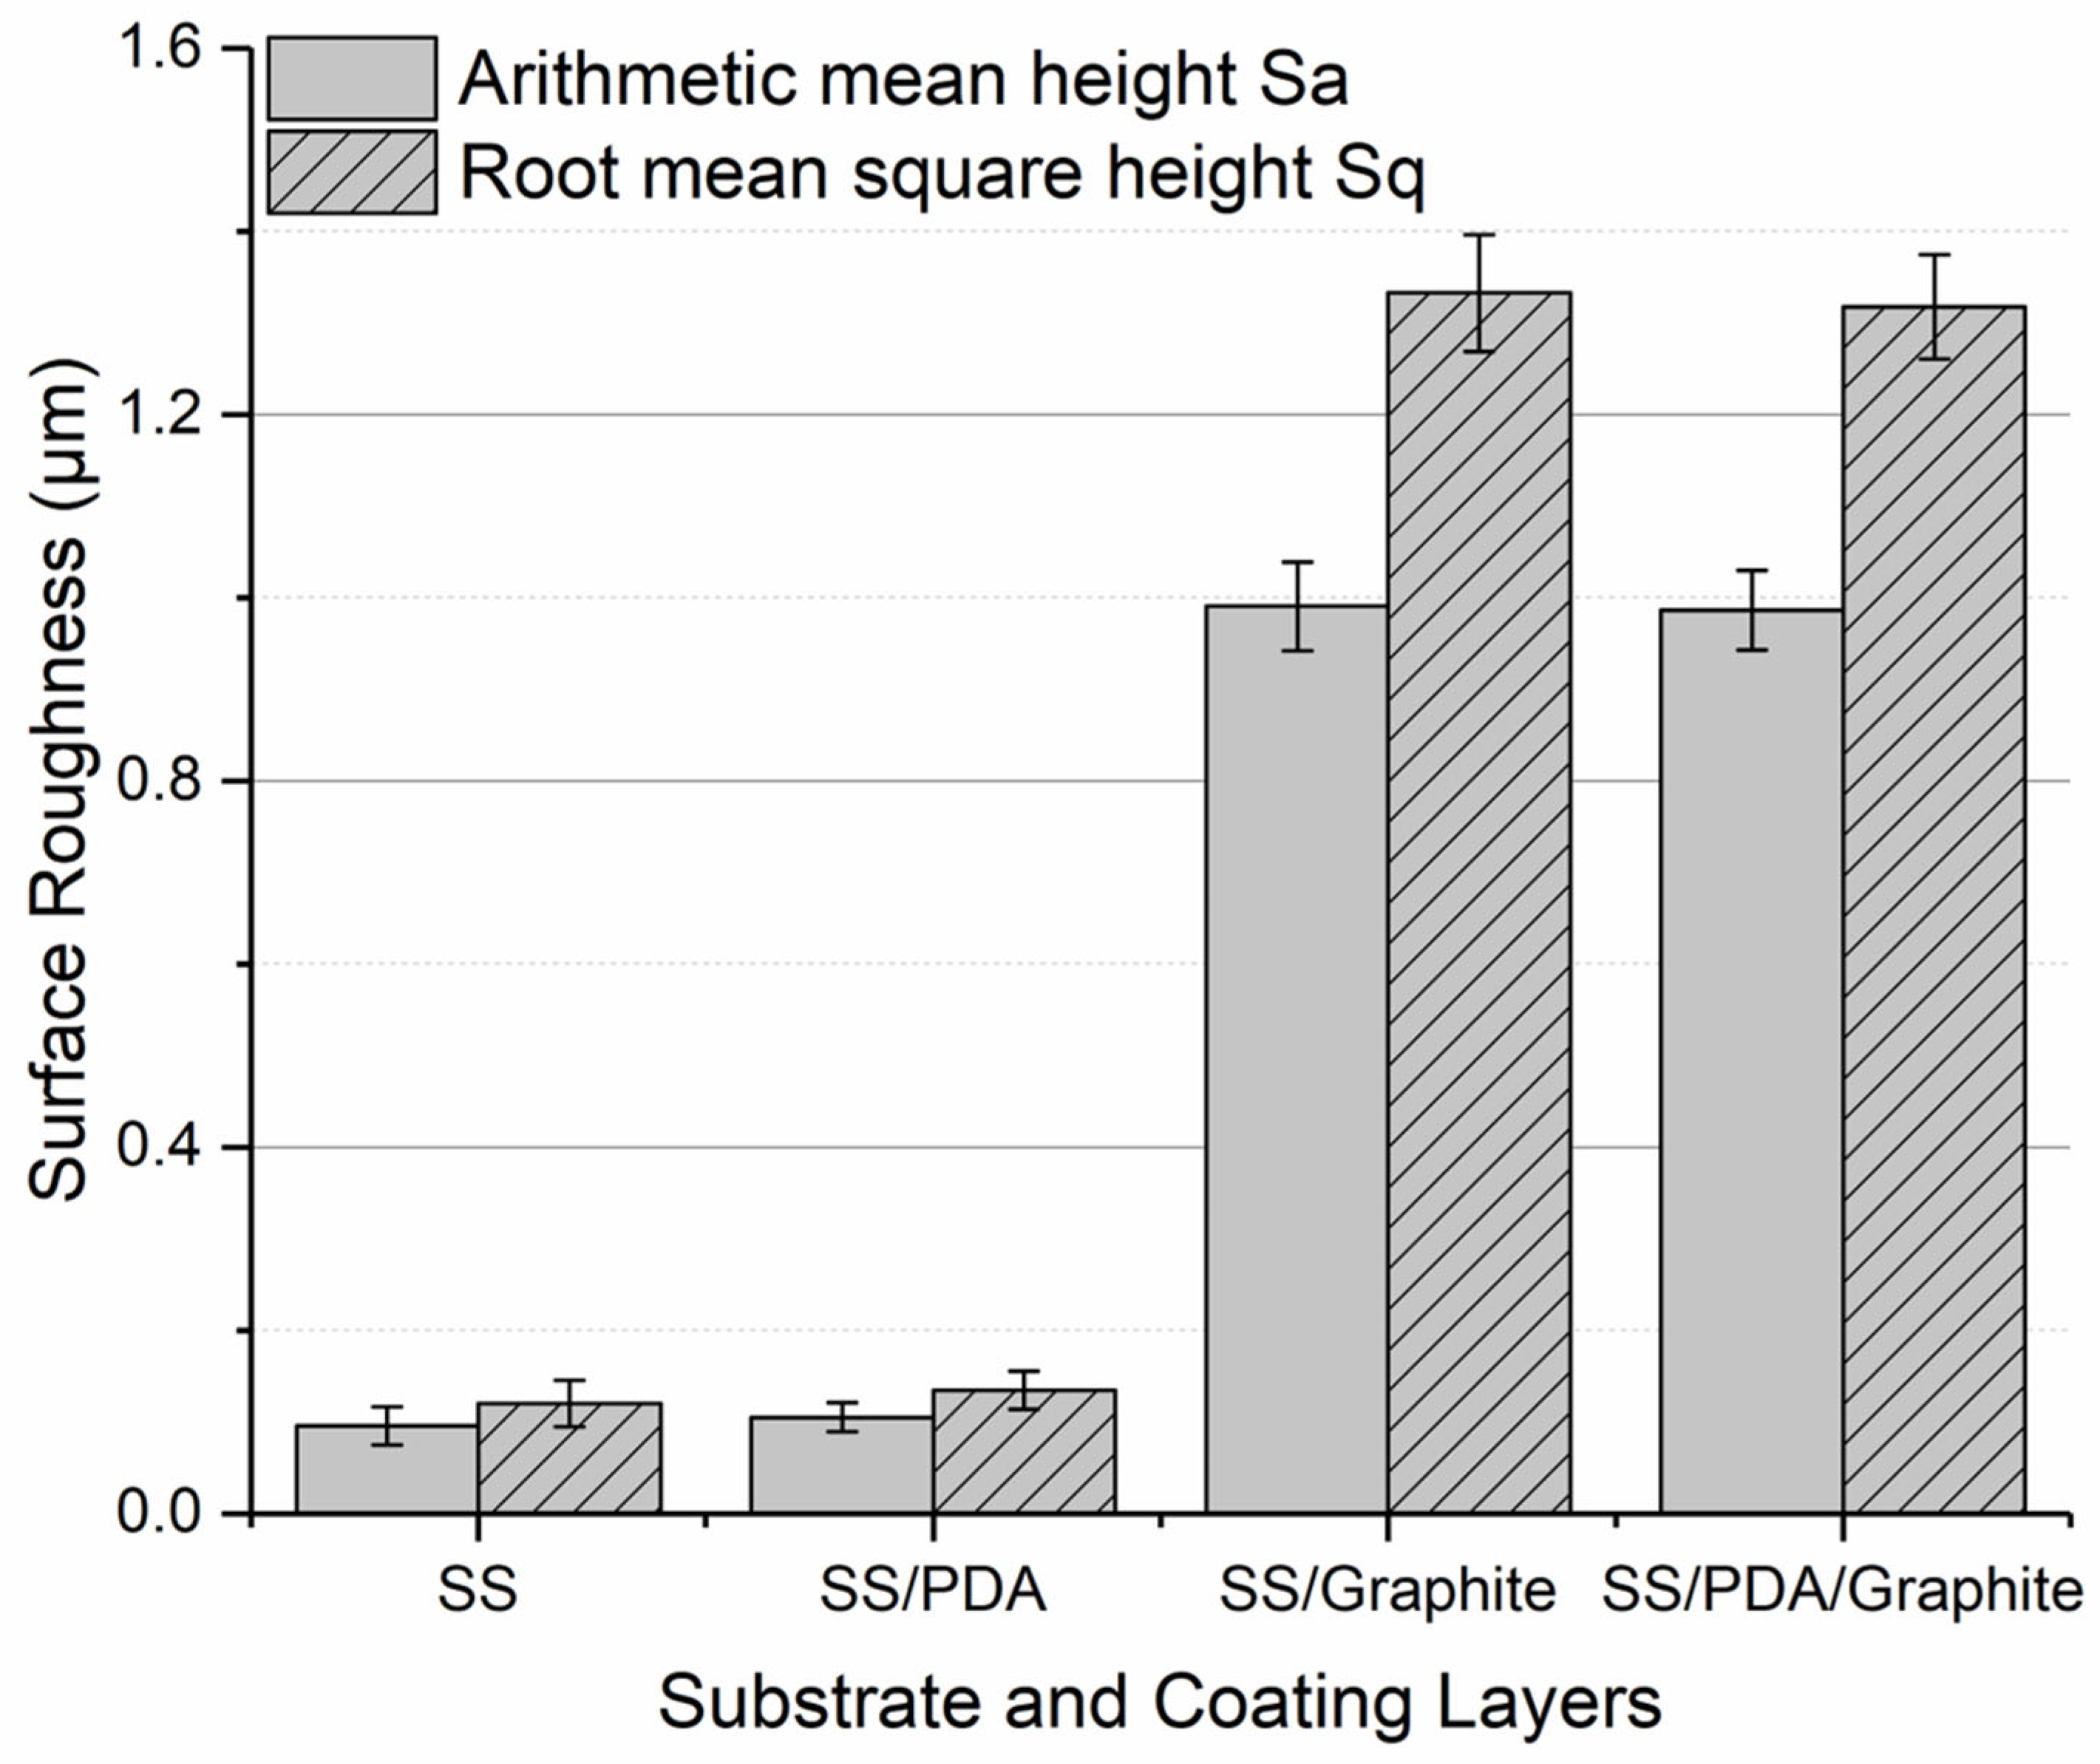
Figure 4 presents the surface roughness measurements for the different coating layers. The polished SS substrate exhibits low roughness due to its smooth surface finish. Adding a PDA coating results in a slight increase in roughness; however, this change is not statistically significant, as confirmed by a
t-test. The graphite coatings, both with and without a PDA underlayer, show similar roughness values. Notably, the PDA underlayer contributes to a minor reduction in roughness for the SS/PDA/graphite configuration compared to the SS/graphite coating.
The averaged coating thicknesses were measured as 6.01 ± 0.67 µm for the SS/graphite coating and 6.41 ± 0.29 µm for the SS/PDA/graphite coating. All sample coating thicknesses fall within the 5.5–7 µm range. While the SS/PDA/graphite coating is marginally thicker, the difference is not statistically significant, as confirmed by a t-test.
Overall, the roughness and thickness data indicate that the SS/graphite and SS/PDA/graphite coatings are comparable. This similarity enables a direct comparison to evaluate the effect of the PDA underlayer on the adhesion and performance of the graphite coatings.
3.2. Material Transfer, Coefficient of Friction, and Wear Track Analysis
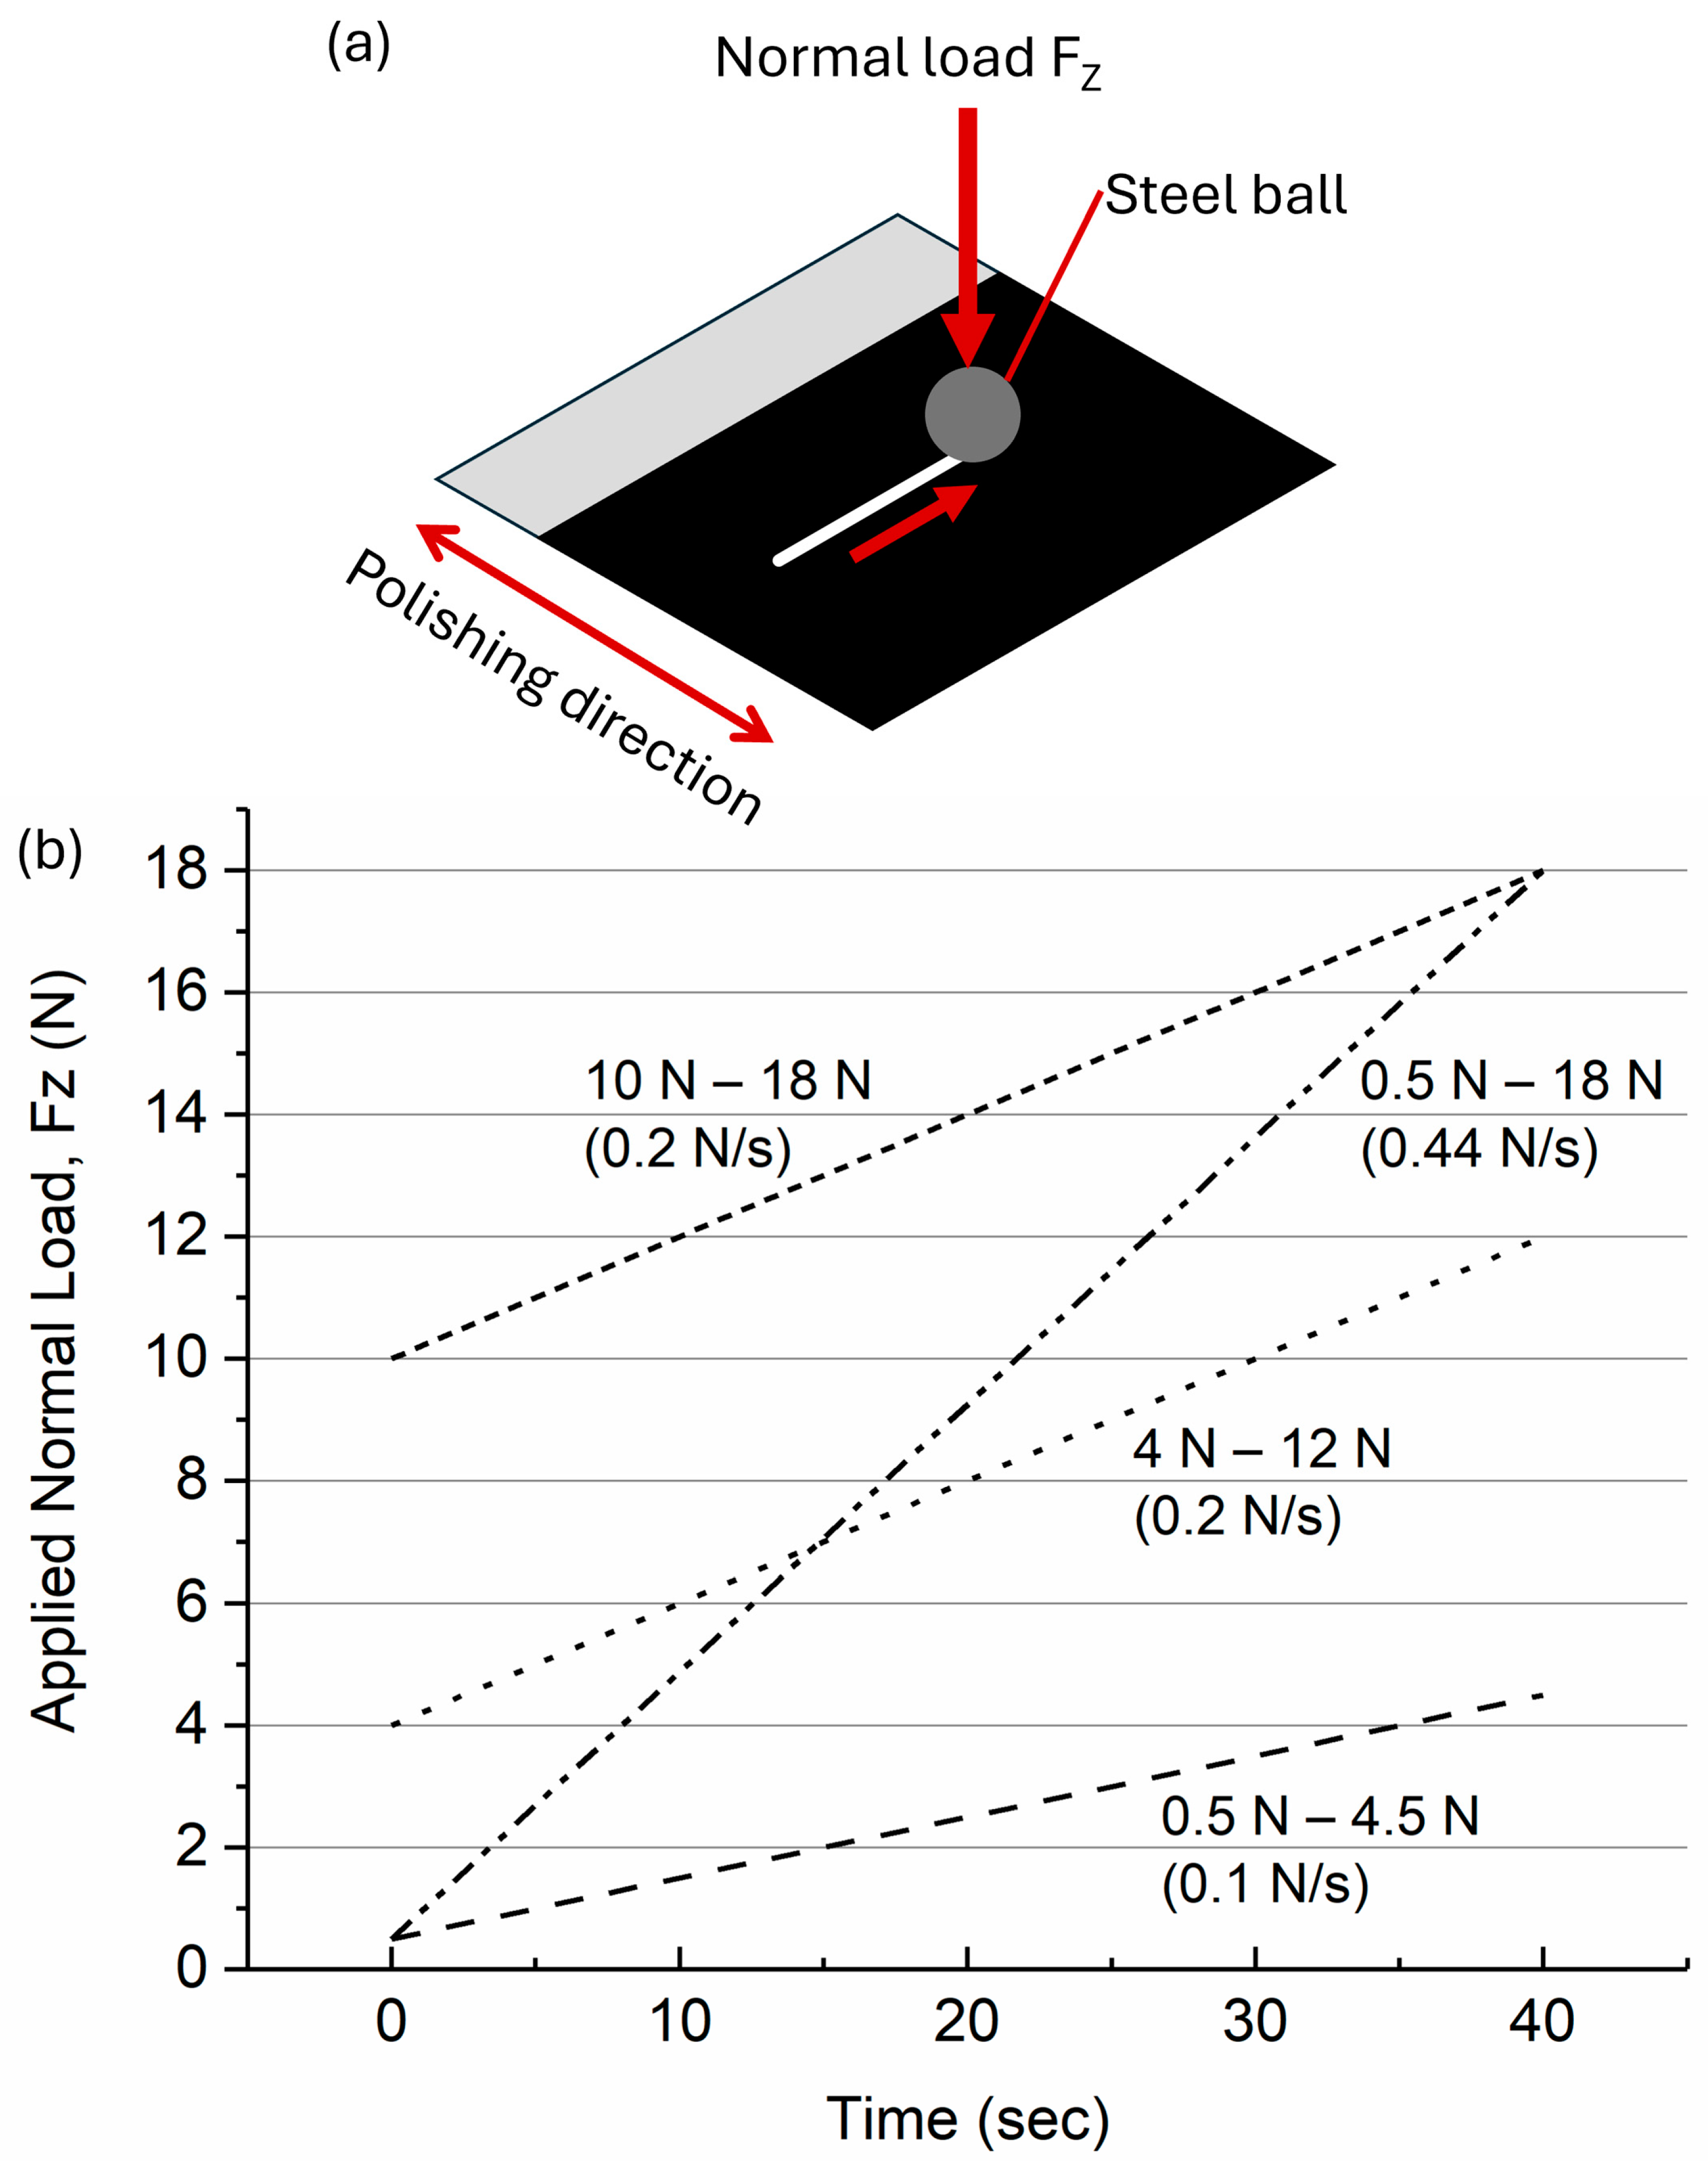
The scratch test applied loads ranging from 0.5 N to 4.5 N, corresponding to Hertzian contact pressures of approximately 475 MPa to 990 MPa on the steel substrate when the coating effect is not considered [
35].
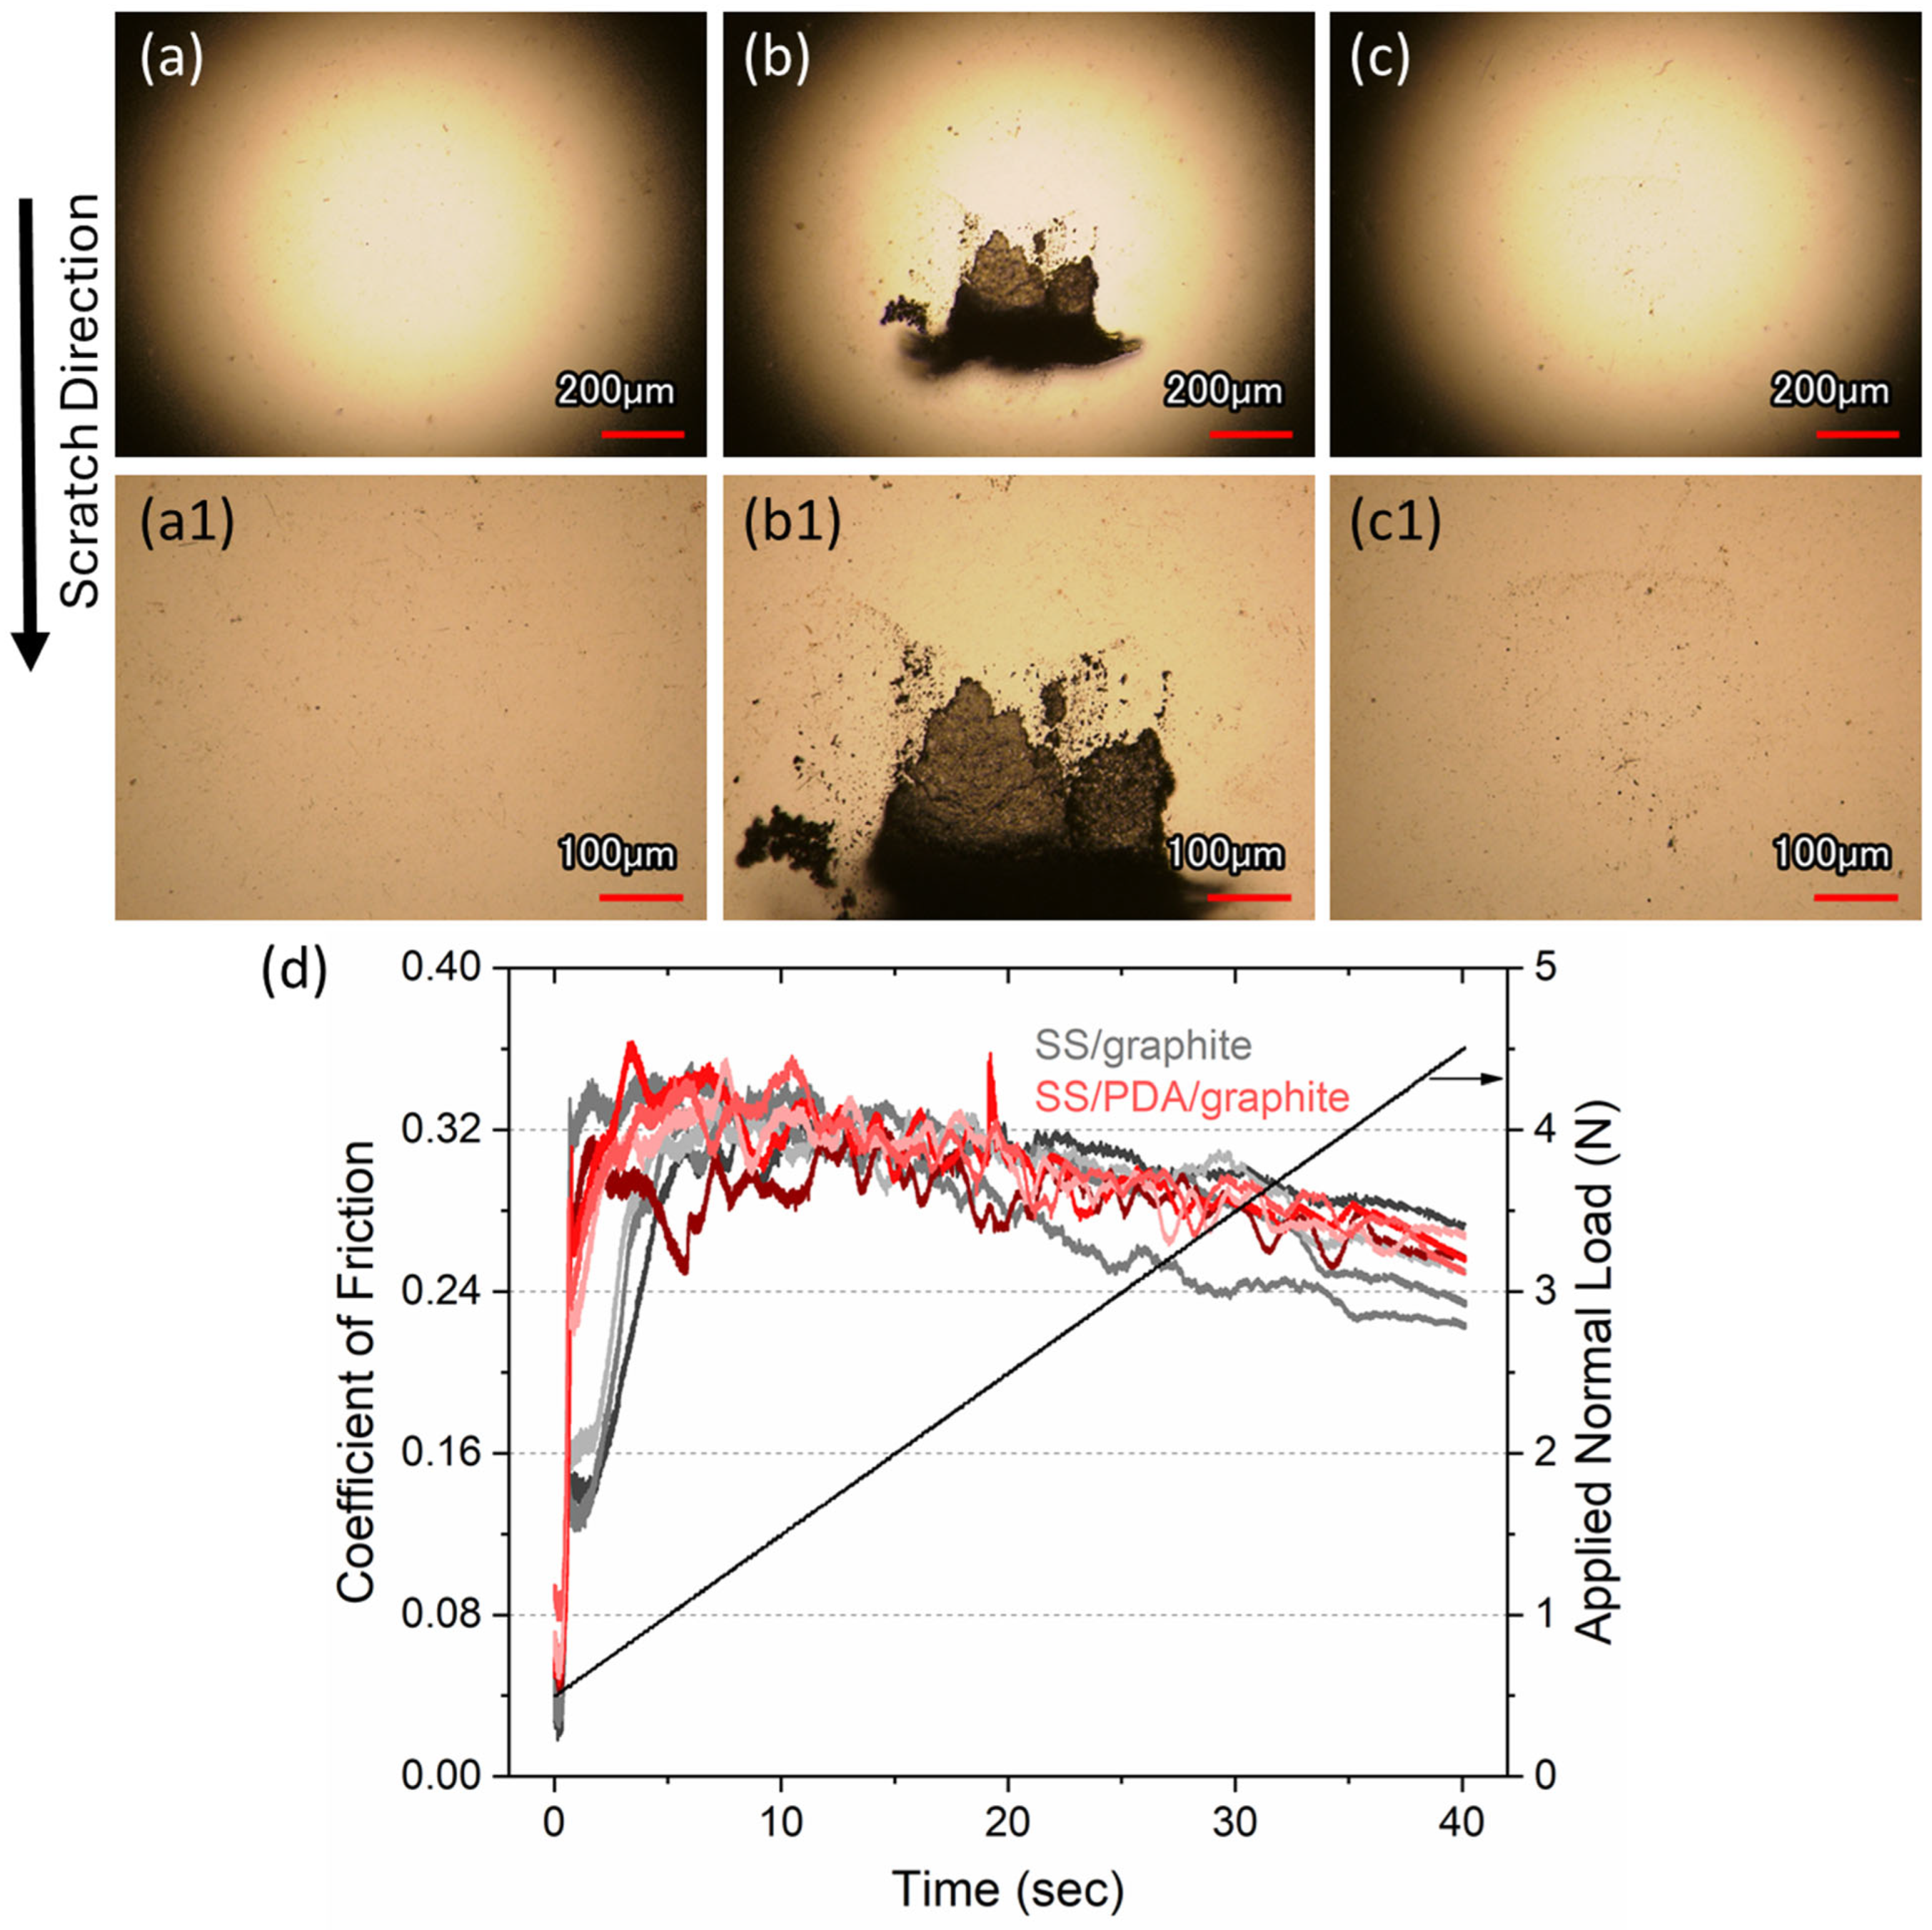
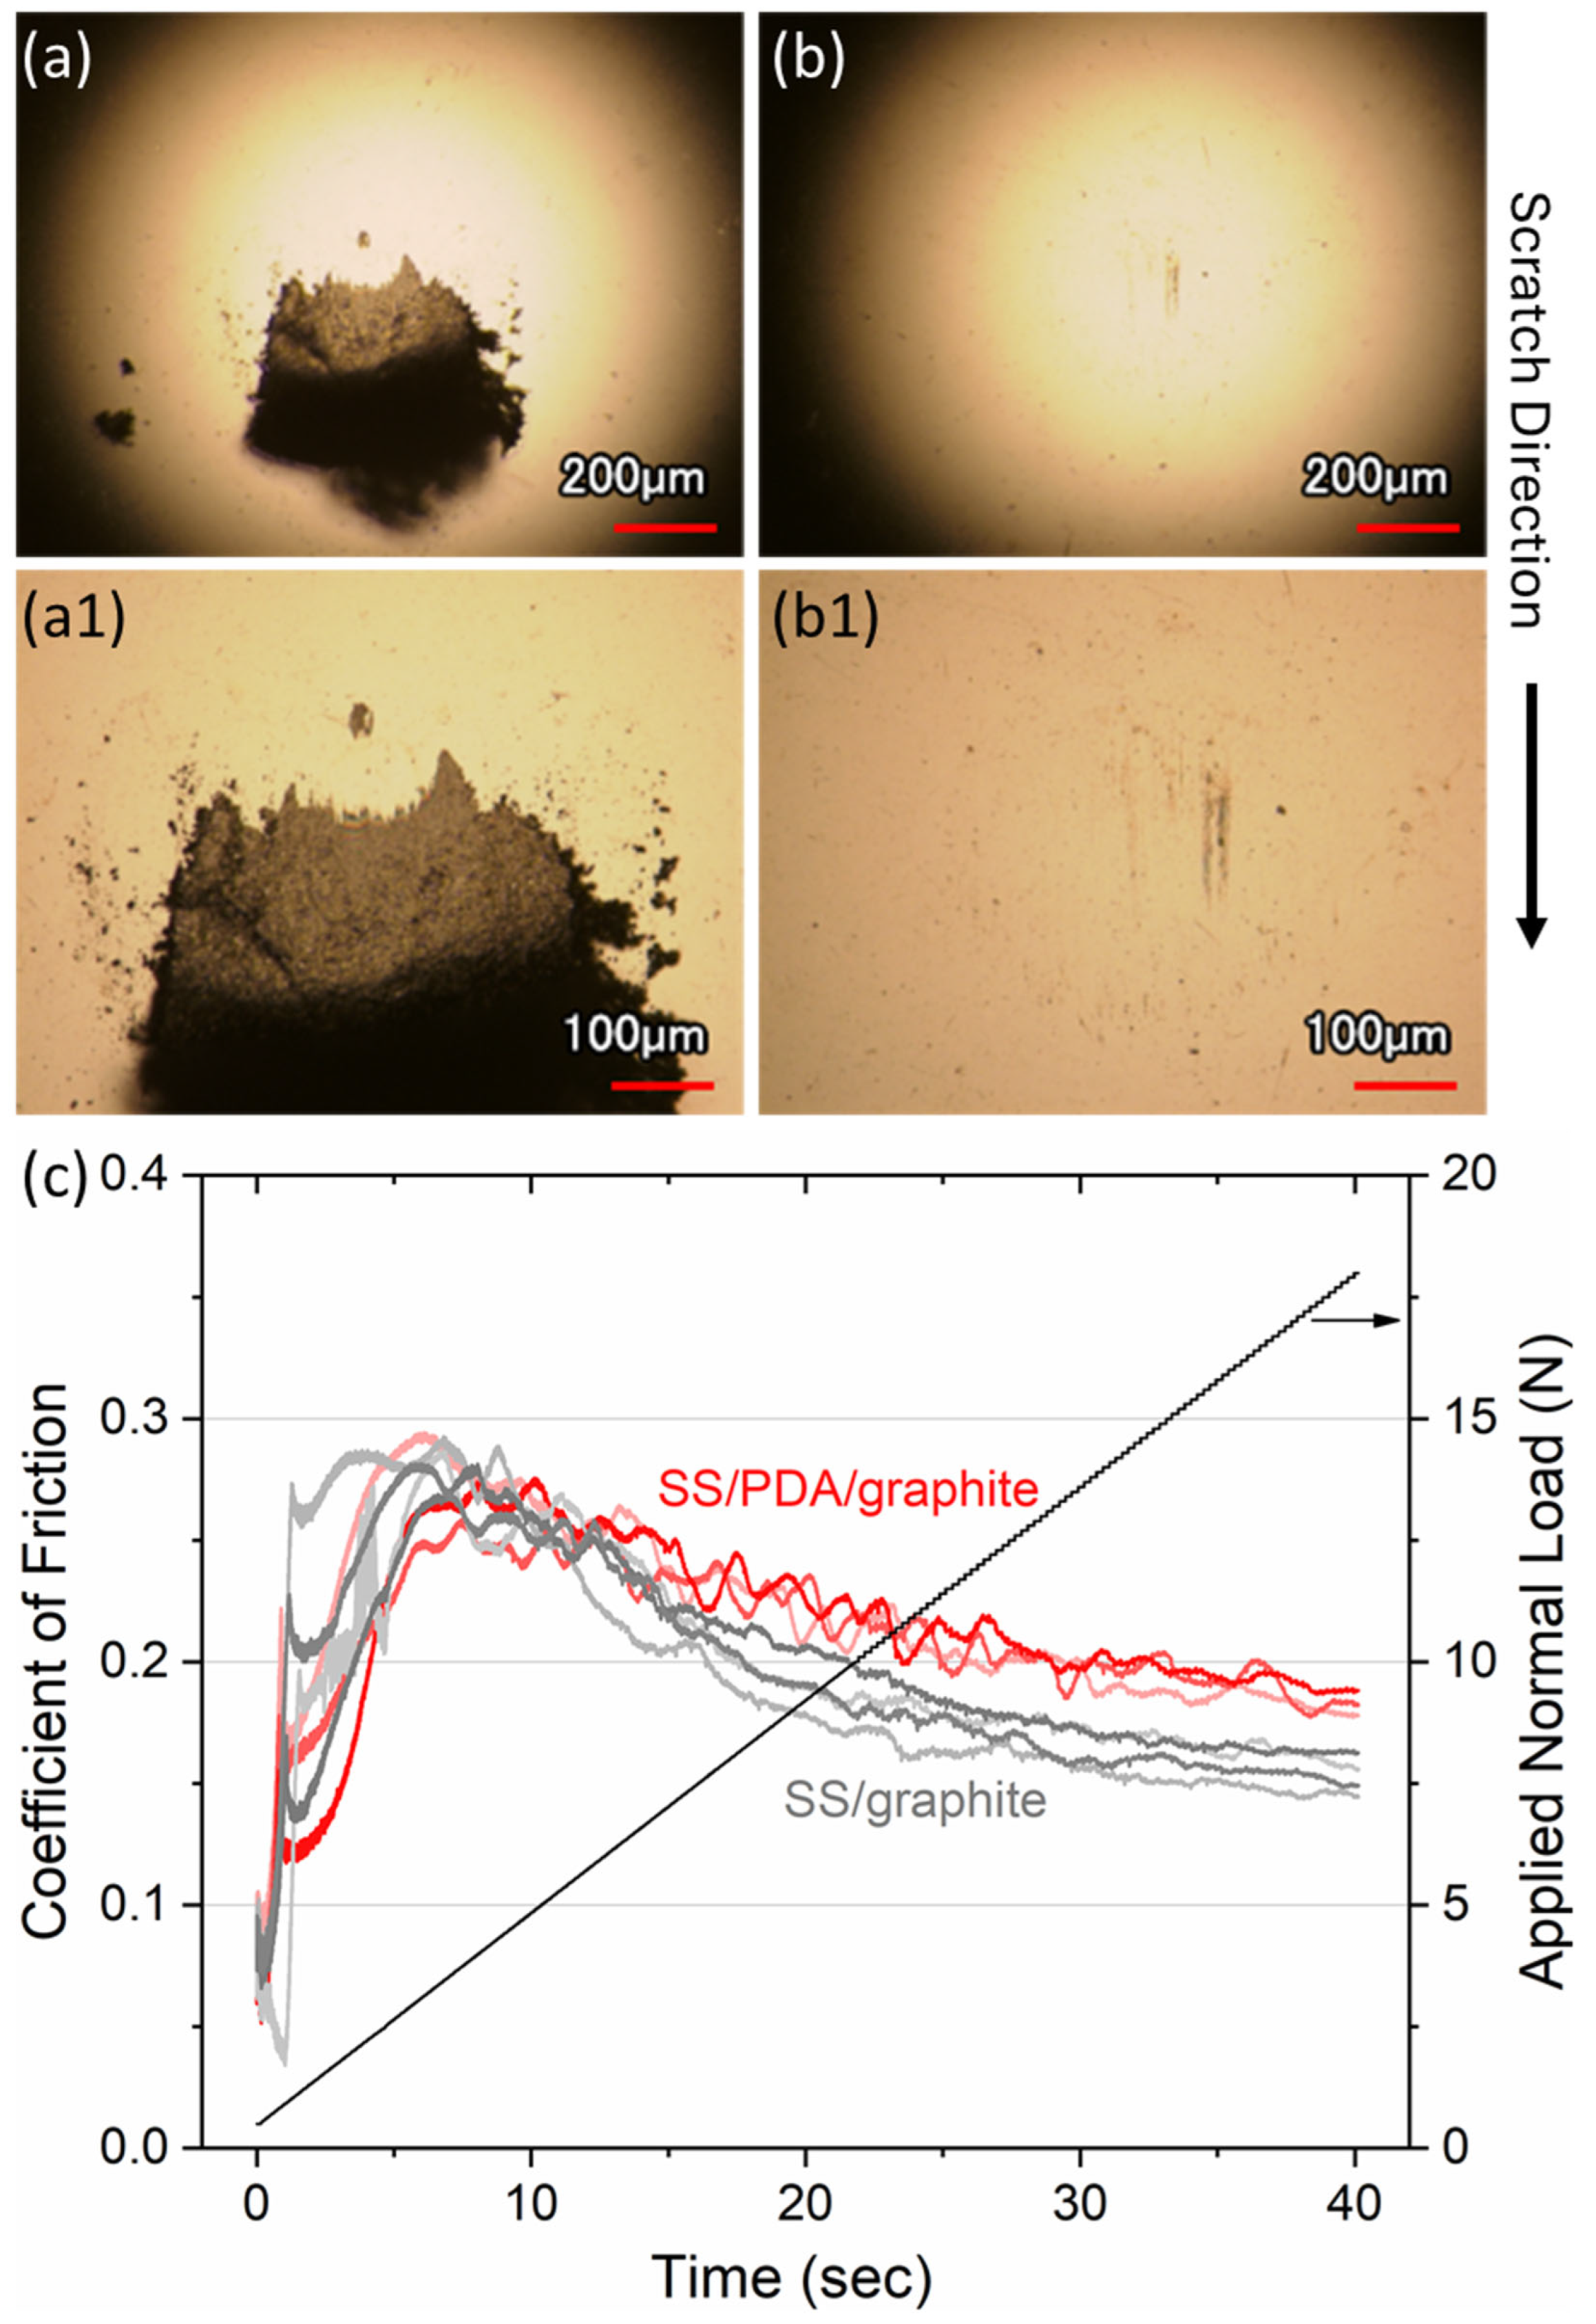
Figure 5a,a1 show the counterpart ball prior to scratching, with a clean surface and no material transfer. After scratching against the SS/graphite coating (
Figure 5b,b1), substantial graphite transfer to the ball is observed, indicating significant material detachment. In contrast, the ball scratched against the SS/PDA/graphite coating (
Figure 5c,c1) exhibits only minimal graphite adhesion. This stark difference underscores the effectiveness of the PDA layer in enhancing the interfacial adhesion of the graphite flakes to the substrate, which in turn helps preserve coating integrity during sliding contact. Previous studies have shown that metal oxides can form on the ball surface during its interaction with graphite in air, anchoring graphite and promoting transfer film formation [
35]. However, the reduced transfer observed in the PDA-coated system suggests that improved adhesion outweighs these transfer-promoting effects of the counterface. This suggests that strong internal bonding within the PDA/graphite coating limits flake detachment, reducing the amount of material available for transfer.
The coefficient of friction (COF) during scratching was similar for both graphite coatings (
Figure 5d). As expected, the COF decreased with increasing normal load. At the final load of 4.5 N, the COF values for the SS/PDA/graphite coatings are tightly clustered, indicating consistent behavior. In contrast, the COF values for the SS/graphite coatings have larger variations. This variation is likely due to the inconsistent size and distribution of the transferred graphite material, which can act as a lubricant at the interface. Once detached from the SS/graphite coating, these graphite particles interact dynamically with the counterface ball, reducing friction but introducing inconsistency in performance.
Although the SS/graphite coating shows visible material accumulation on the counterface ball, this phenomenon is better interpreted as localized material transfer and plowing rather than classical adhesive wear. The transferred graphite accumulates primarily at the front edge of the ball contact, not uniformly across the surface, indicating mechanical displacement of loosely bound flakes rather than strong adhesive bonding. As a result, the COF remains relatively stable and does not exhibit fluctuations typical of adhesive failure modes.
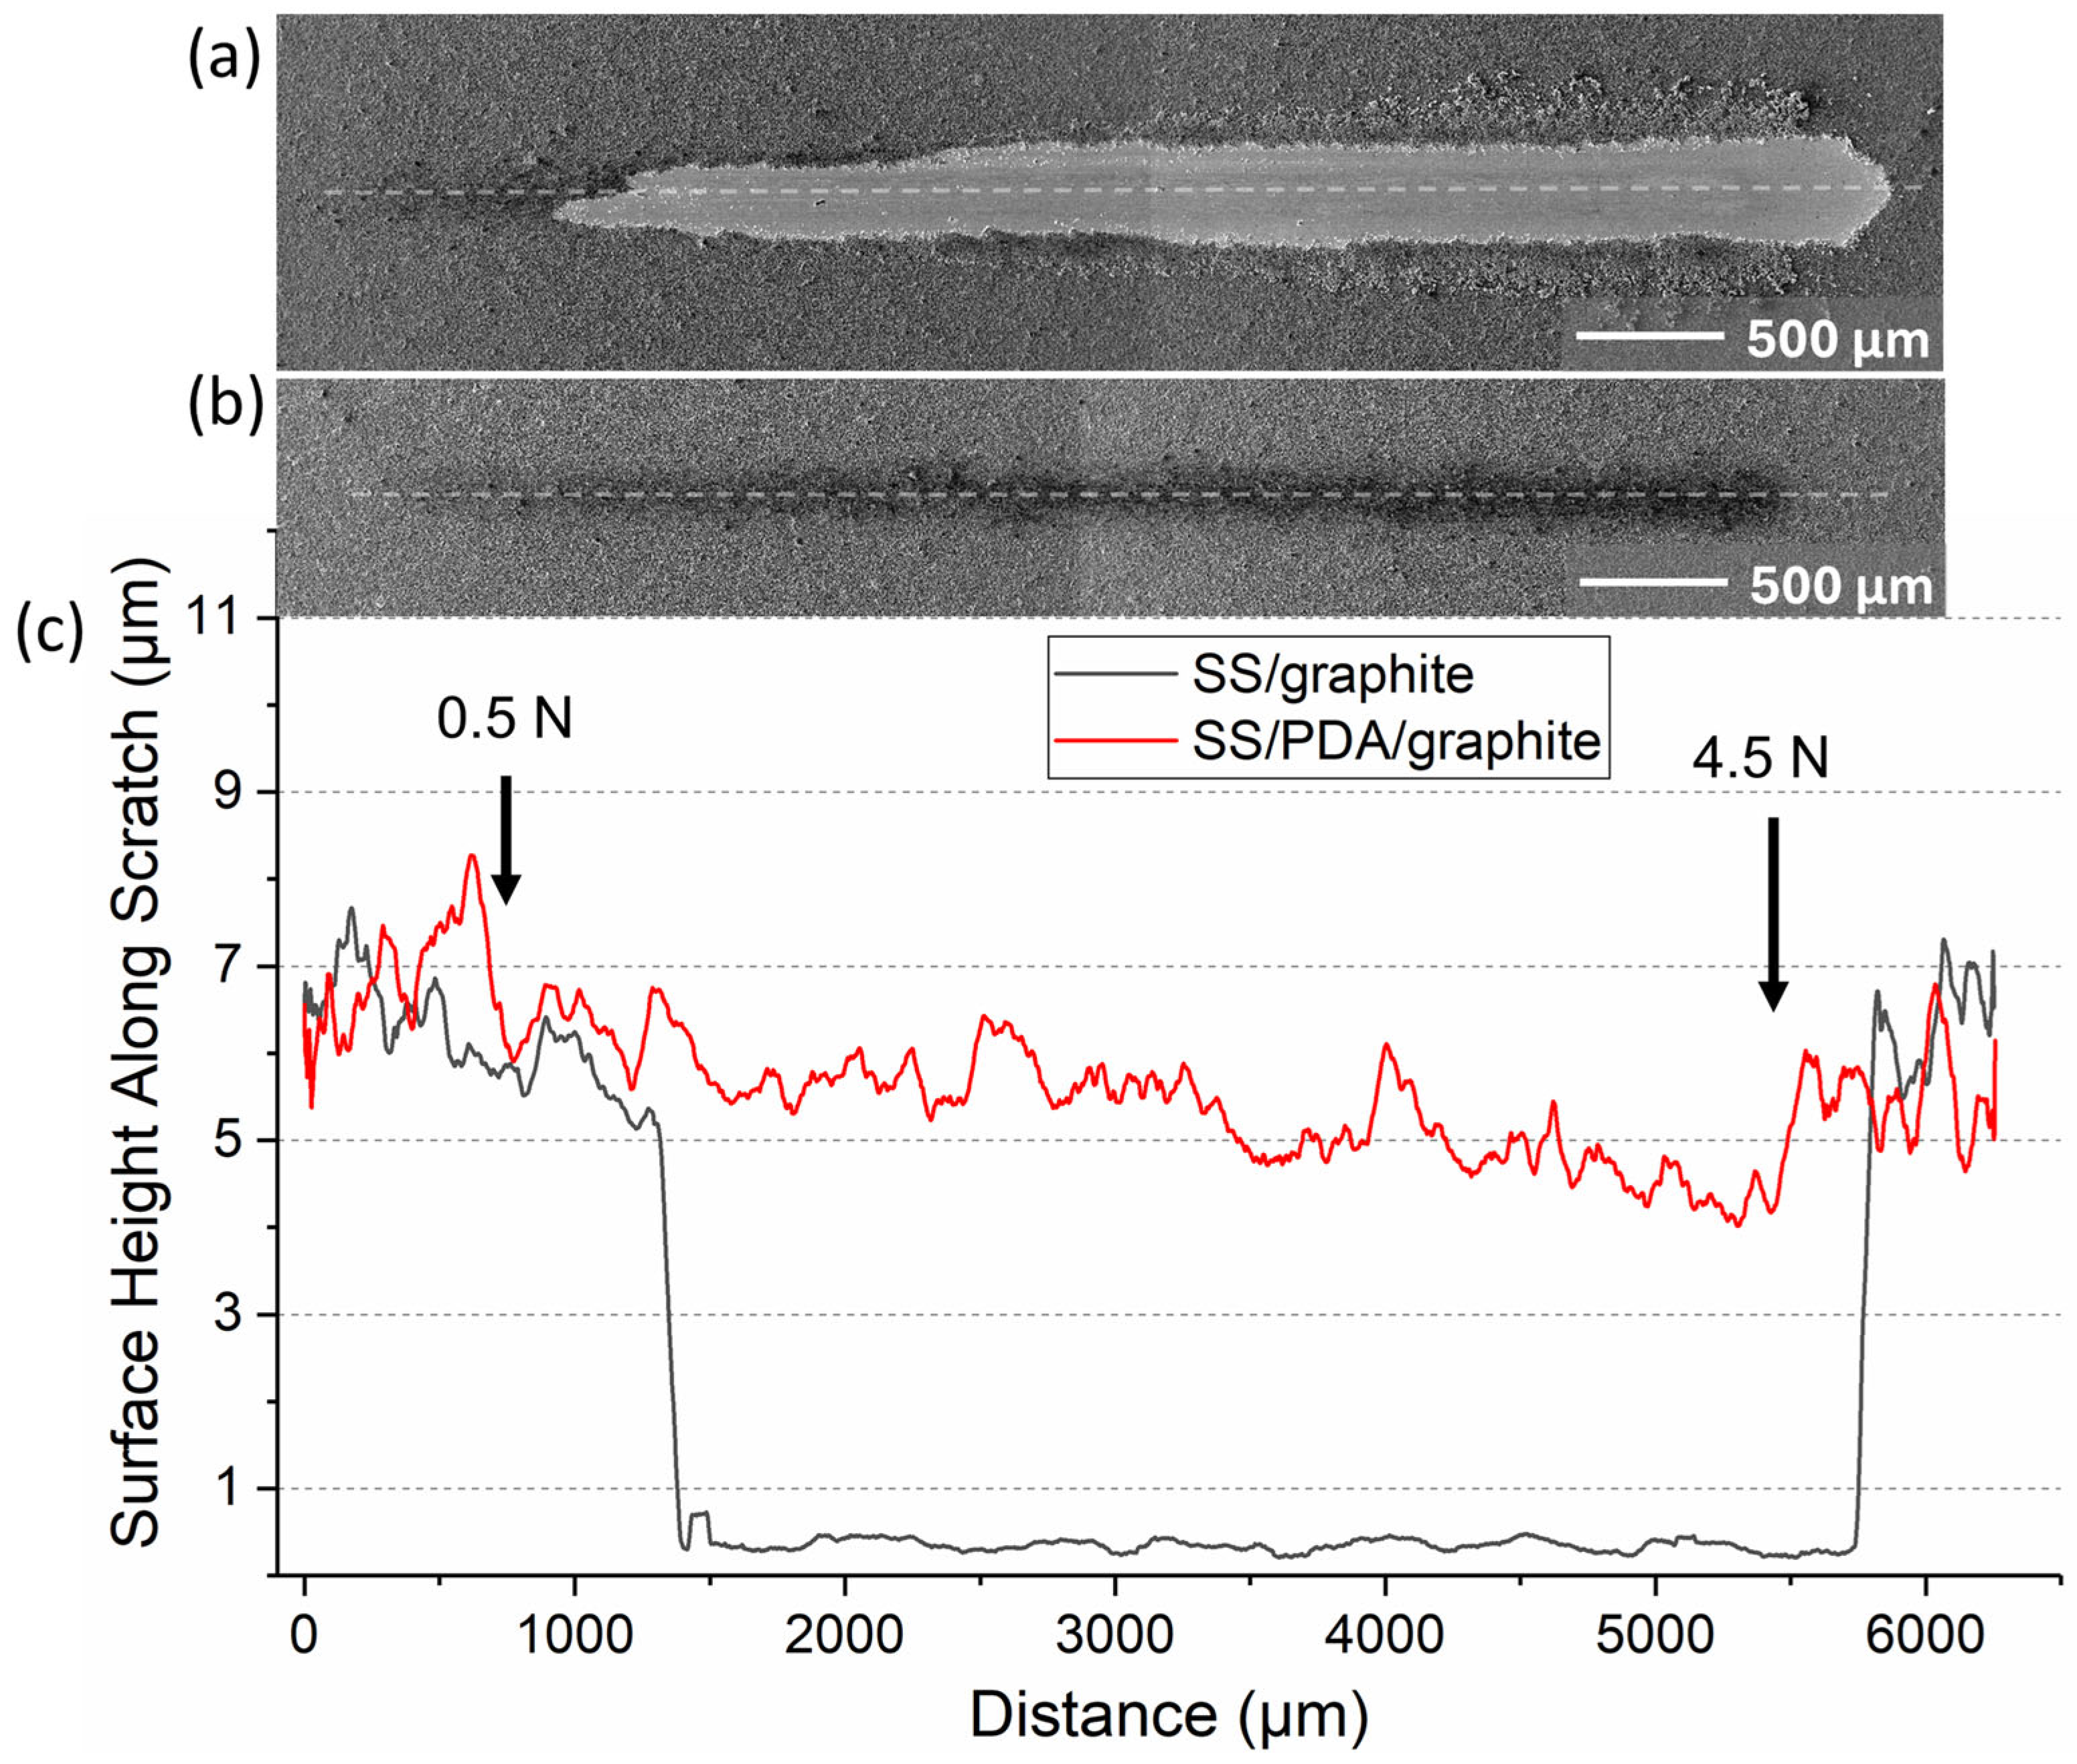
Figure 6 illustrates the scratch wear tracks and their progression for the SS/graphite and SS/PDA/graphite coatings. In
Figure 6a, the SS/graphite coating exhibits early failure, with the coating being removed at lower loads. This is reflected in the steep drop in surface height along the scratch seen in
Figure 6c. The height drop is approximately the coating thickness, indicating substrate exposure. In contrast, the SS/PDA/graphite coating in
Figure 6b undergoes gradual compression throughout the test without complete removal, maintaining full coverage even under higher loads. While extensive graphite transfer from coating to the counterface has been reported in reciprocating wear tests [
36], our results show that similar material displacement can also occur in single-pass scratch tests. The early coating failure observed in the SS/graphite sample indicates weak interfacial adhesion, underscoring the role of adhesion-promoting layers such as PDA. PDA acts as a molecular adhesive, strengthening the bonding between the graphite flakes and the SS substrate. This enhanced interfacial adhesion mitigates material removal, limits lateral displacement, and prevents early delamination under increasing load. This observation, combined with the absence of tearing or internal fracture within the graphite layer, supports the conclusion that the critical load primarily reflects interfacial adhesion rather than cohesive failure within the coating. These findings suggest that when adhesion is insufficient, even the initial loading cycles, particularly under high normal loads, can trigger premature coating failure.
The compression of both coatings is visible as darker areas on the wear tracks. For the SS/graphite coating, the darker region is only present in a small portion of the scratch before the coating is removed, where the SS substrate becomes exposed as shown as brighter color in the SEM (
Figure 6a). Conversely, for the SS/PDA/graphite coating, the darker region broadens with increasing load with no indication of substrate exposure, demonstrating improved wear resistance and coating retention. Although some compaction of graphite flakes may improve surface conformity during sliding, the improved scratch resistance of SS/PDA/graphite coatings is attributed primarily to the PDA-induced adhesion rather than any intrinsic increase in coating stiffness. Regions of interest within the wear tracks are analyzed in greater detail in
Figure 7, providing further insights into the performance differences between the two coatings.
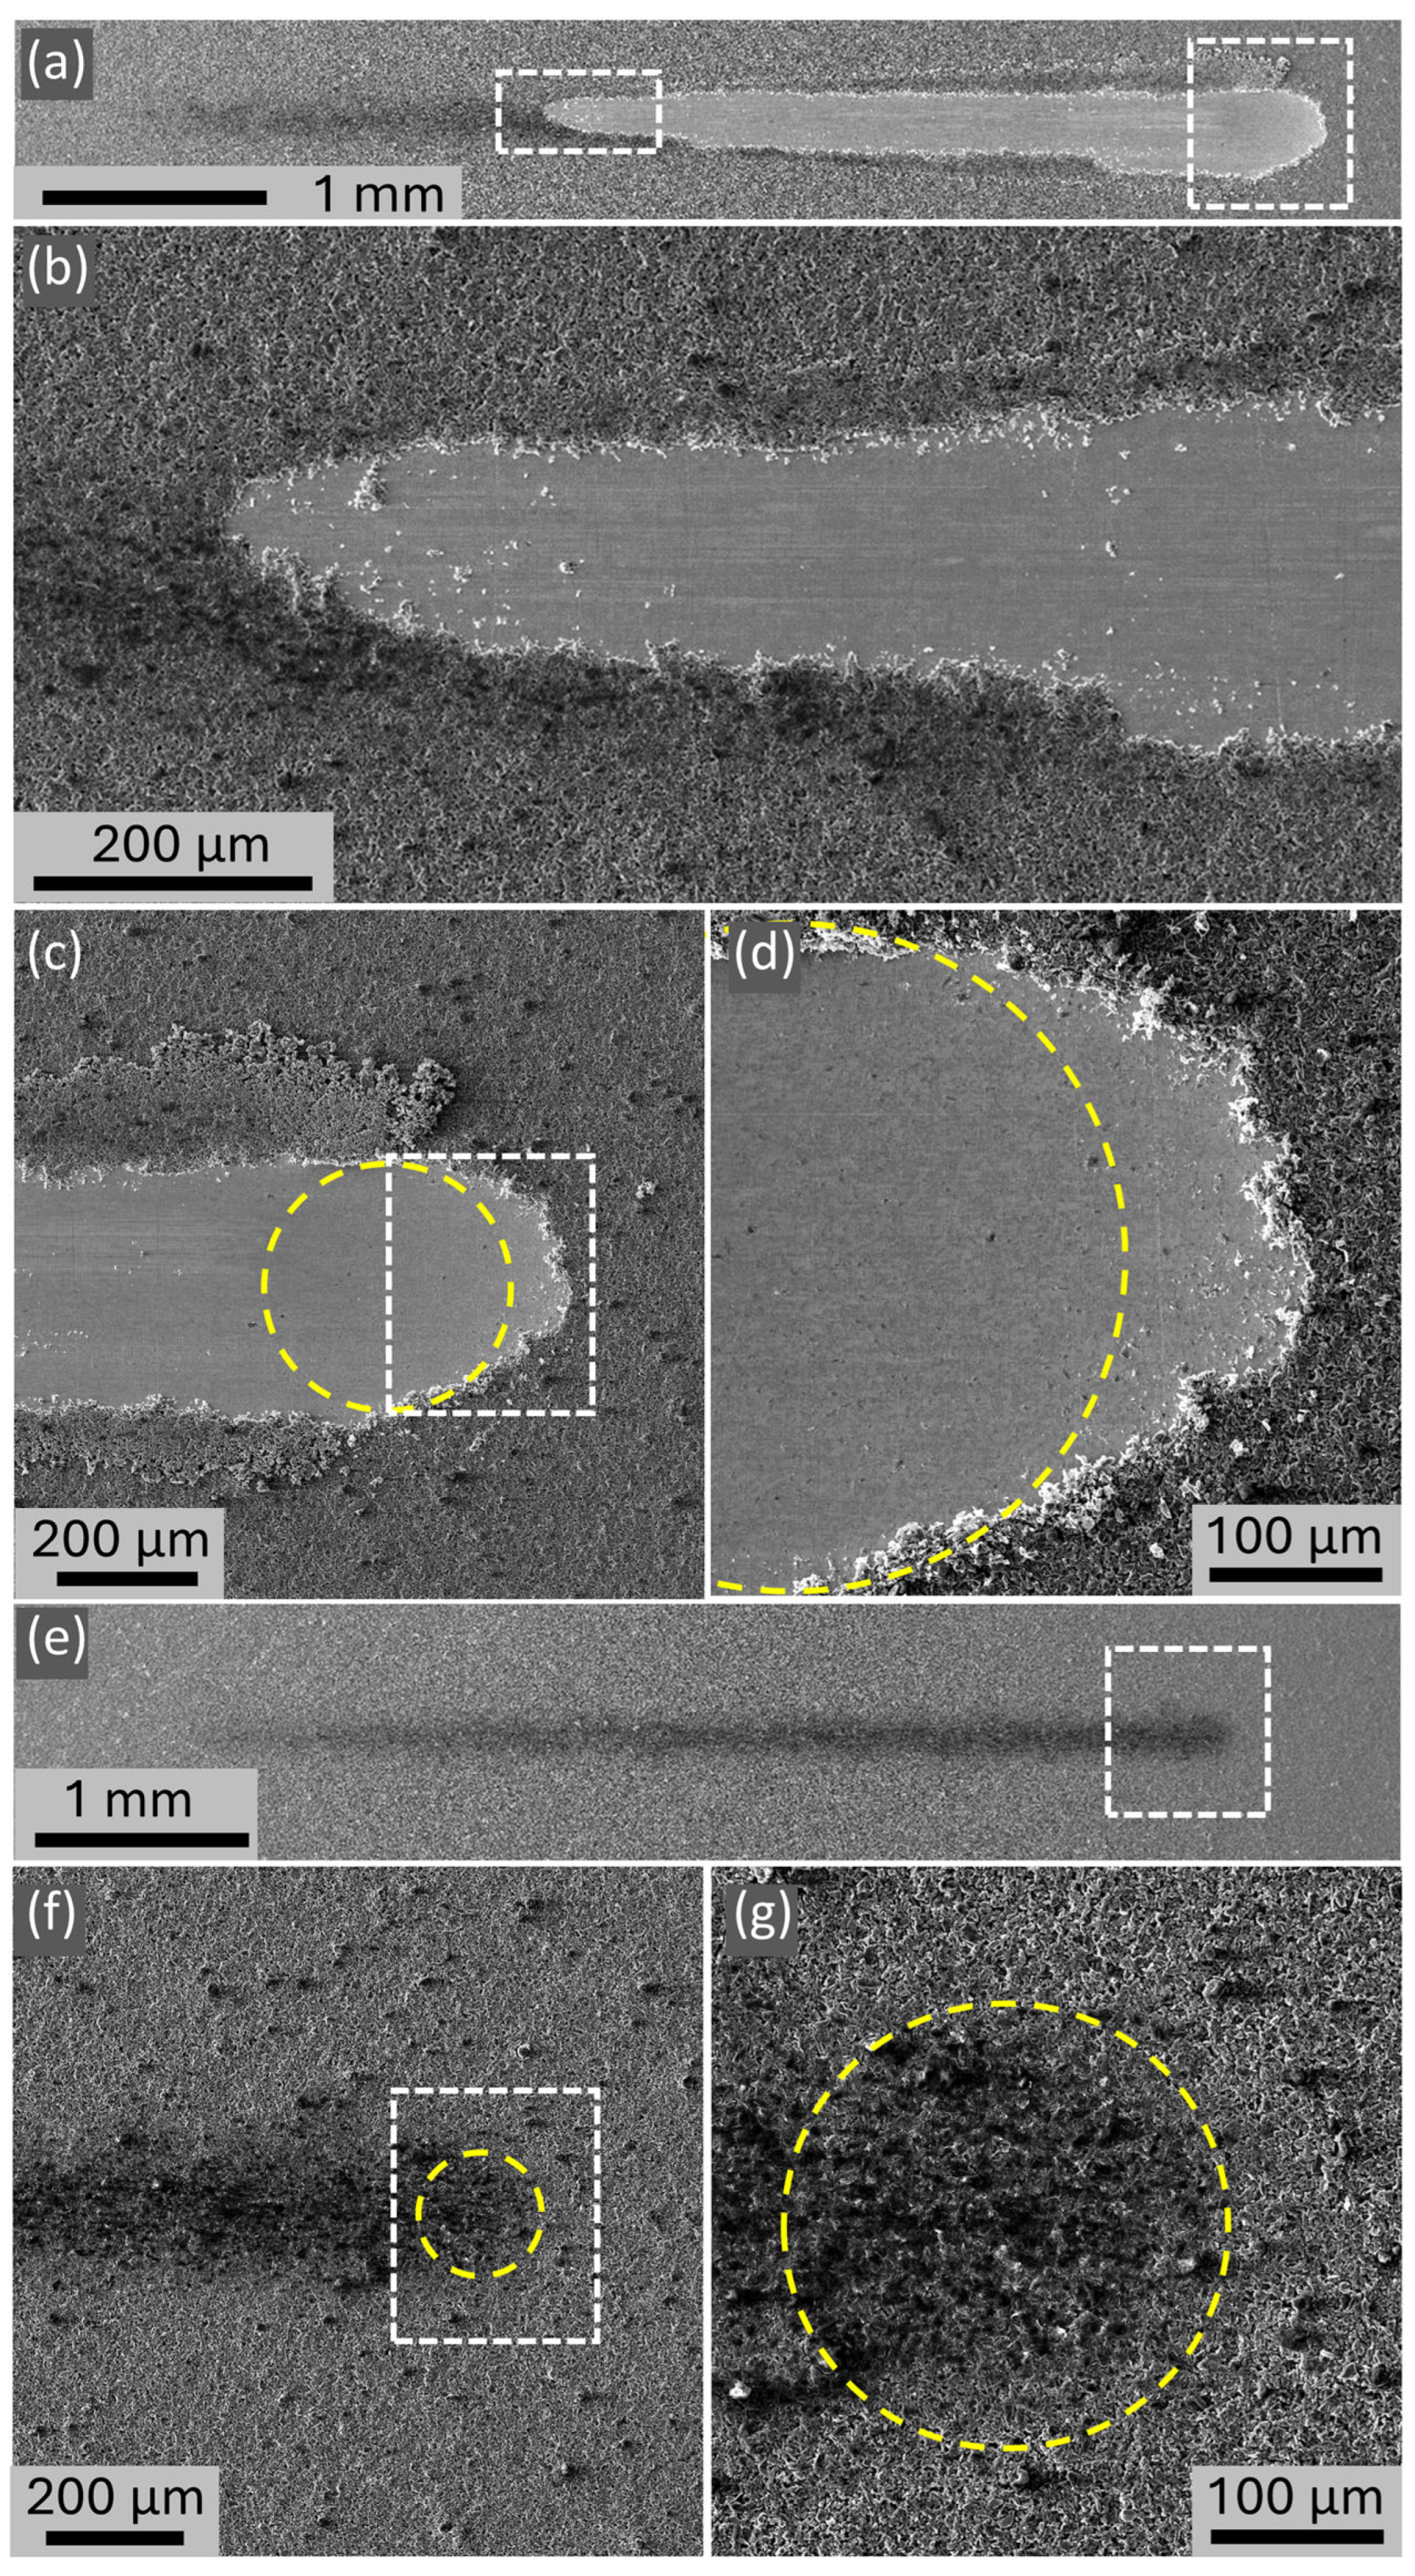
Figure 7 compares the wear tracks of the SS/graphite coating (
Figure 7a) and the SS/PDA/graphite coating (
Figure 7e), with magnified views of specific regions shown in the corresponding subfigures. In the SS/graphite coating (
Figure 7a), coating removal begins shortly after initial material compression. This progression is clearly visible in the magnified view (
Figure 7b), where a compacted region transitions into an area of exposed substrate. On average, coating removal started at 1.4 N, 1.04 ± 0.85 mm from the scratch initiation point, representing about 22% of the total track length. The detachment begins in a small, compressed zone and expands with increasing normal load during the scratch.
Abrasion marks were observed on the exposed stainless steel substrate, aligned with the direction of ball motion and perpendicular to the initial polishing lines. These features are indicative of abrasive wear. Although graphite flakes are significantly softer than 316 stainless steel, with hardness values around 10–30 HV (0.1–0.3 GPa) compared to ~1.5–2.0 GPa for annealed 316 stainless steel, the observed wear can still be attributed to a plowing mechanism. When weak interfacial adhesion allows graphite flakes to detach, their sharp edges can act as third-body debris. In addition to the graphite particles, steel wear debris is generated when the coating protection is no longer present and the counterface is in direct contact with the substrate. Both the harder steel particles and sharp edges of the soft graphite flakes are combined to produce three-body abrasion under the localized stress concentration. This leads to micro-cutting or plowing of the substrate surface, producing finely divided wear particles. This mechanism is consistent with prior studies on graphite-based tribological systems [
37], but in our case, the onset of such wear is clearly tied to early coating failure due to inadequate flake retention in the absence of a PDA adhesion layer.
At the end of the wear track (
Figure 7c), abrasion caused by the ball is evident, surrounded by regions where the coating has been displaced beyond the wear track boundaries indicated by the dashed circle. This displacement indicates that the SS/graphite coating material was easily removed and pushed aside during testing. A closer inspection (
Figure 7d) clearly shows that material removal extends beyond the ball’s path in the direction of motion, reaffirming the coating’s low adhesion to the substrate. Similar outward material displacement has been reported in other graphite coating systems [
14], where high wear was observed under various test conditions.
In contrast, the SS/PDA/graphite coating (
Figure 7e) shows significantly improved performance. The wear track displays a smaller affected area, with no exposure of the underlying substrate. Magnified views at the end of the wear track (
Figure 7f,g) reveal compacted graphite particles, visible as darker regions formed under the applied load during scratching. In
Figure 7g, the compacted graphite is localized directly beneath the ball’s path and contrasts with the surrounding unaffected coating. The improved adhesion provided by the PDA underlayer prevents coating removal and ensures better resistance to the applied scratch load.
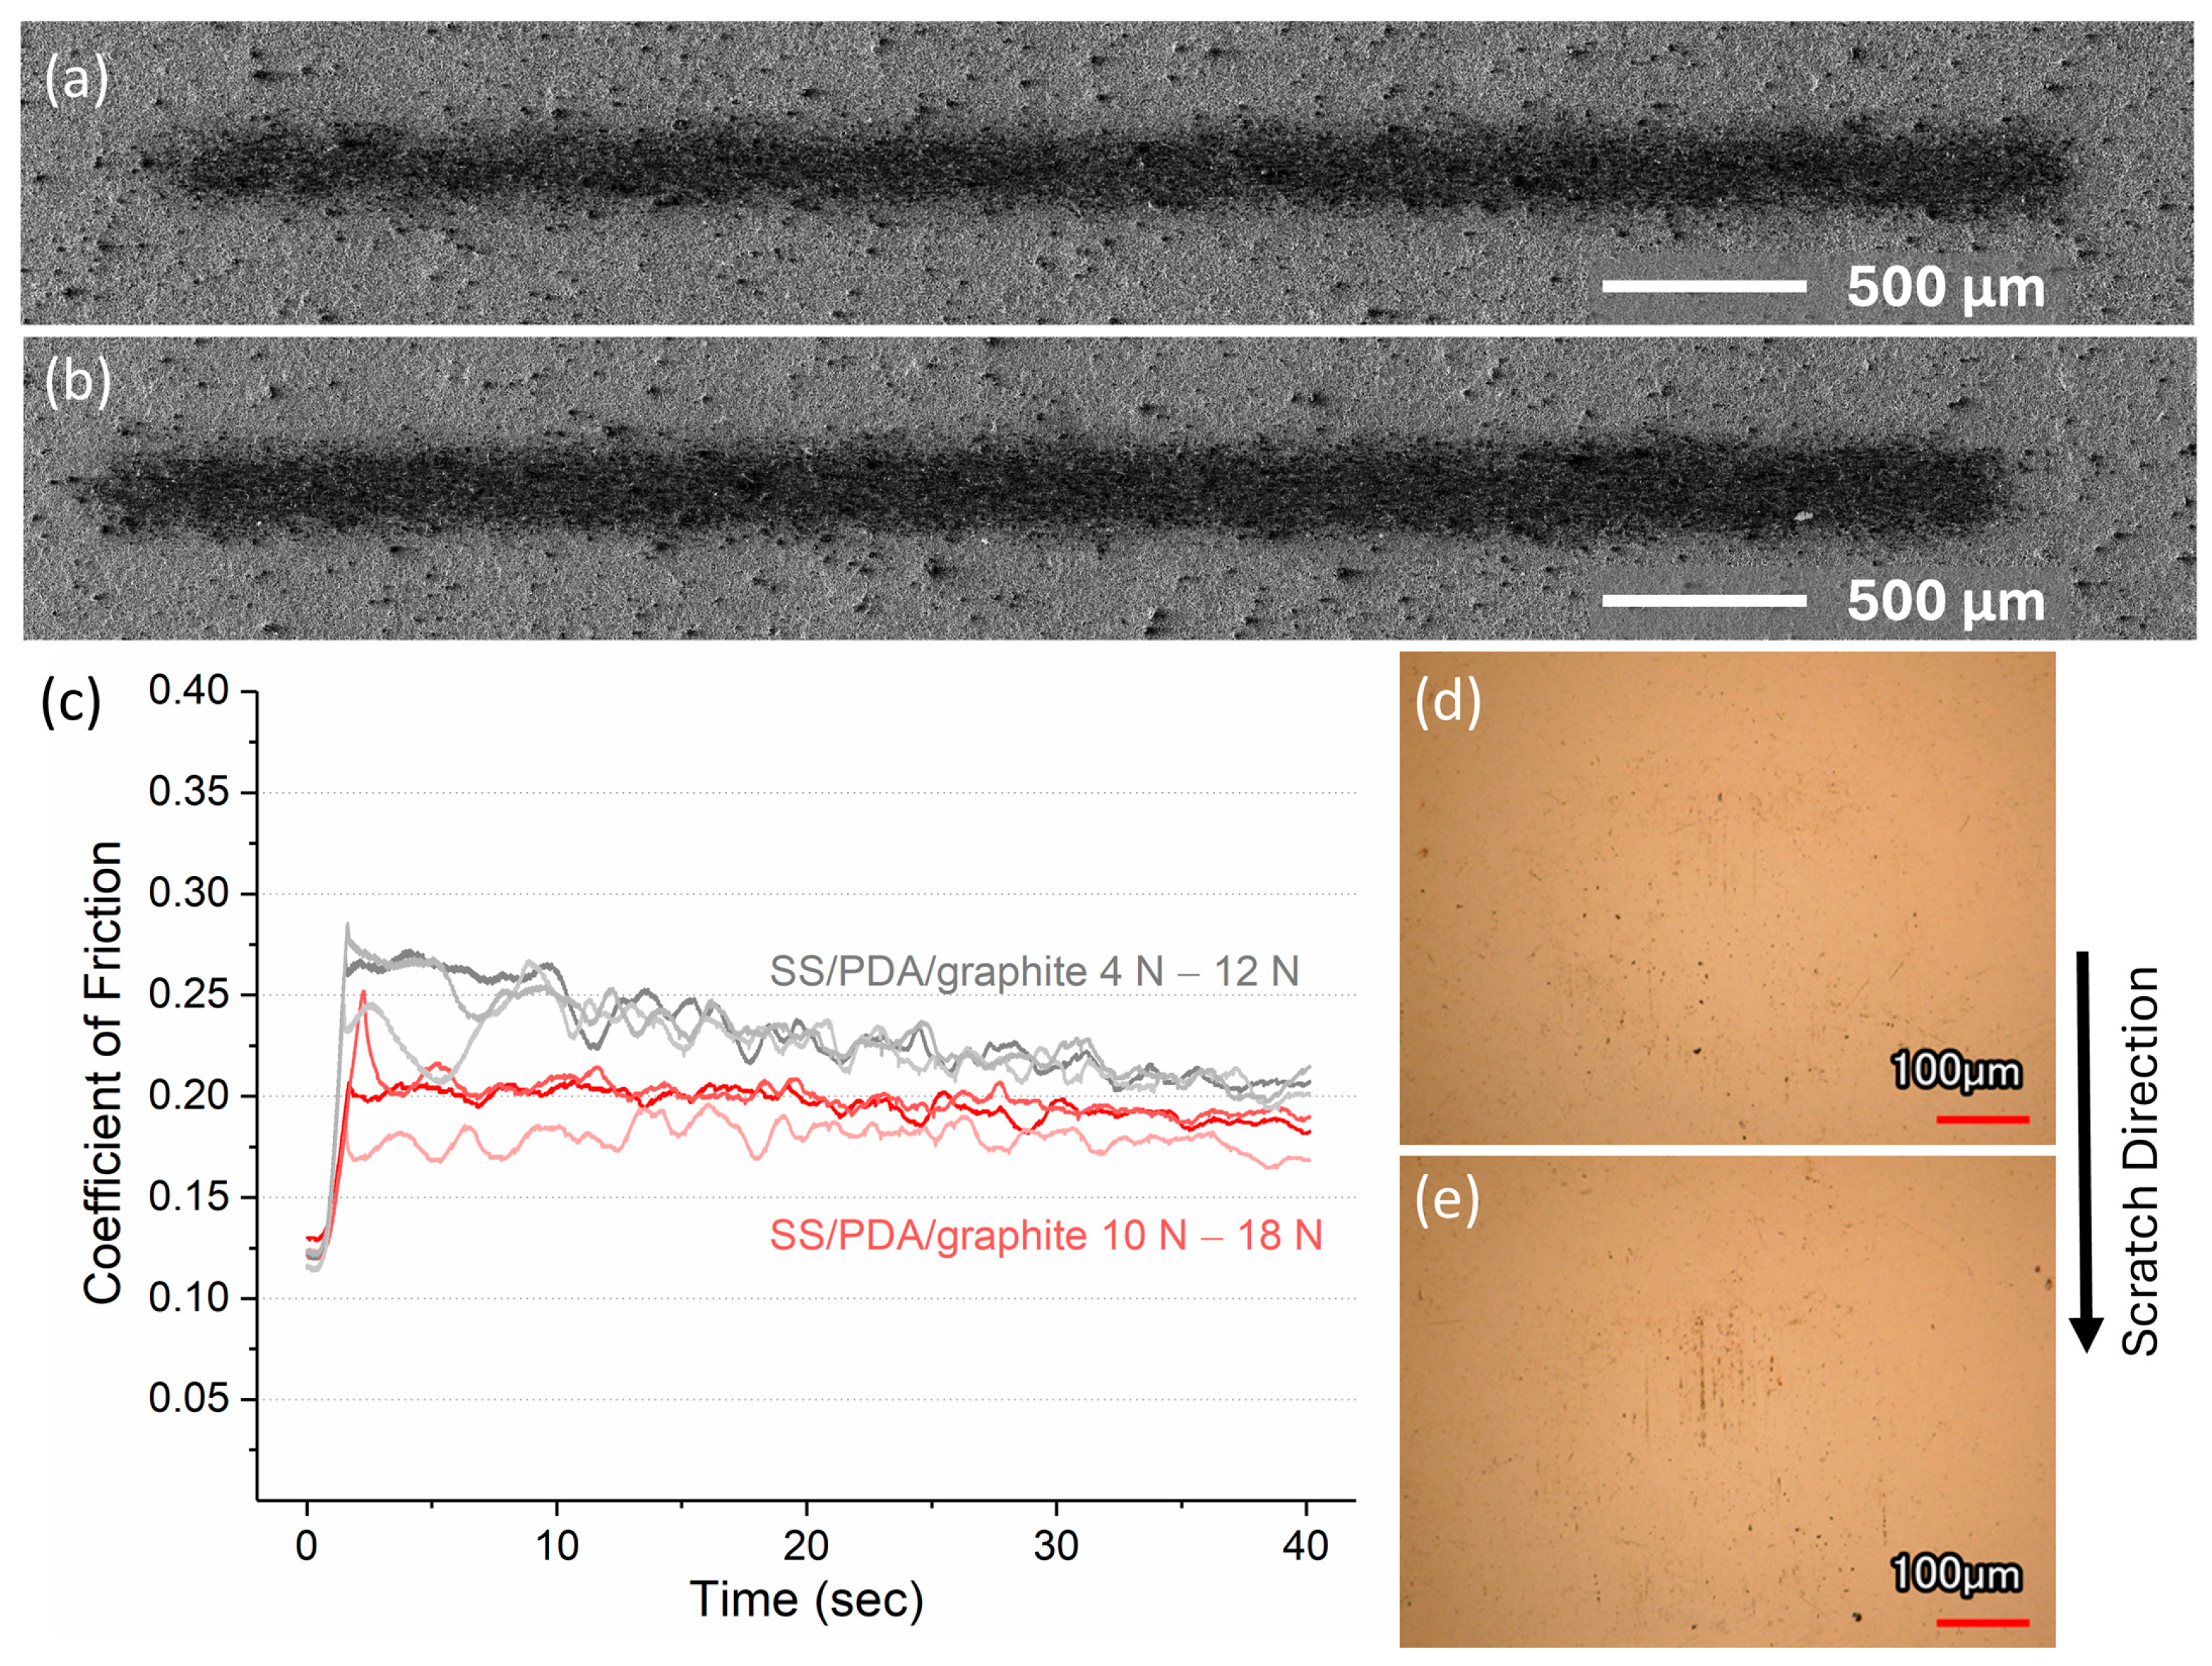
At a higher loading rate of 0.2 N/s, two scratch tests were conducted on SS/PDA/graphite coatings over load ranges of 4–12 N and 10–18 N, corresponding to Hertzian contact pressures of 950 MPa–1.375 GPa and 1.295–1.575 GPa, respectively. The resulting wear tracks, counterface balls, and COF measurements are presented in
Figure 8.
At these increased load ranges, the SS/PDA/graphite coatings exhibit greater compression, as indicated by the darker and wider wear tracks in
Figure 8b compared to
Figure 8a. The COF decreases at higher loads, likely due to reduced adhesion contributions to friction. Furthermore, the enhanced alignment of graphite flakes with the substrate under higher contact pressures reduces resistance to sliding at the interface, contributing to lower friction [
11]. Despite the elevated loads and loading rates, both counterface balls (
Figure 8d,e) exhibit no significant graphite transfer, highlighting the effectiveness of the PDA underlayer in maintaining strong coating adhesion under these demanding conditions.
3.3. Wear Track Analysis Under 0.5–18 N Linearly Increasing Loads
Wear tracks created on SS/graphite and SS/PDA/graphite coatings under linearly increasing loads of 0.5 N to 18 N (corresponding to Hertzian contact pressures of 475 MPa to 1.575 GPa) at a loading rate of 0.44 N/s clearly demonstrate the influence of the PDA underlayer. Coating failure in SS/graphite is evident in the SEM image (
Figure 9a) and the corresponding surface height profile (
Figure 9c), with coating removal initiating at approximately 2.01 N at 0.41 ± 0.18 mm along the scratch track. Grooves in the direction of ball motion visible in
Figure 9a are consistent with prior reports linking increased normal loads to increased abrasive wear in graphite–steel contacts [
14]. The negative height values observed toward the end of the scratch track are due to plastic deformation of the stainless steel substrate under high contact pressure. At these loads, which exceed the yield strength of the substrate, the surface is permanently indented below the initial reference level. In contrast, the SS/PDA/graphite coating shows no evidence of substrate exposure, as illustrated by the SEM image in
Figure 9b and the surface height profile in
Figure 9c.
The wear track of the SS/PDA/graphite coating (
Figure 9b) reveals a progressively darker coloration that widens toward the end of the test, indicating increasing compression of the coating under higher loads. Conversely, the SS/graphite coating (
Figure 9a) undergoes only initial compression before failing, leading to coating displacement and subsequent substrate exposure. The displaced graphite is visible on the counterface ball, as shown in
Figure 10.
The counterface ball in contact with the SS/graphite coating shows substantial material transfer, as seen in
Figure 10a, whereas only a few graphite flakes are visible on the ball tested against the SS/PDA/graphite coating (
Figure 10b). The higher magnification images (
Figure 10a1,b1) emphasize this contrast, clearly showing that the PDA underlayer significantly reduces graphite detachment. Consistent with previous studies [
36], material transfer increases with normal load: the ball in
Figure 10, tested at 18 N, exhibits more pronounced graphite accumulation than the one in
Figure 5, which was tested at 4.5 N. These results highlight the effectiveness of the PDA layer in enhancing coating adhesion and minimizing debris generation, even under high contact pressures, thereby limiting material transfer to the counterface during scratch loading.
Despite these differences in material transfer, the COF values for both coatings remain comparable under identical loading conditions (
Figure 10c), as the ball interacts primarily with a graphite surface in both cases. However, the SS/graphite coating exhibits a slightly lower final COF, which may be attributed to the greater amount of graphite transferred to the ball surface. This transfer promotes graphite-on-graphite sliding, a well-known mechanism for friction reduction [
35]. Moreover, loosely detached graphite flakes can easily reorient and align along the sliding direction, forming a lubricious transfer film that further lowers friction. In contrast, the strong interfacial adhesion provided by the PDA underlayer minimizes graphite detachment, thereby limiting transfer film formation and resulting in a marginally higher COF for the SS/PDA/graphite coating [
22]. In this case, the ball remains in contact with a compacted, well-adhered graphite layer rather than sliding over displaced, mobile graphite material.
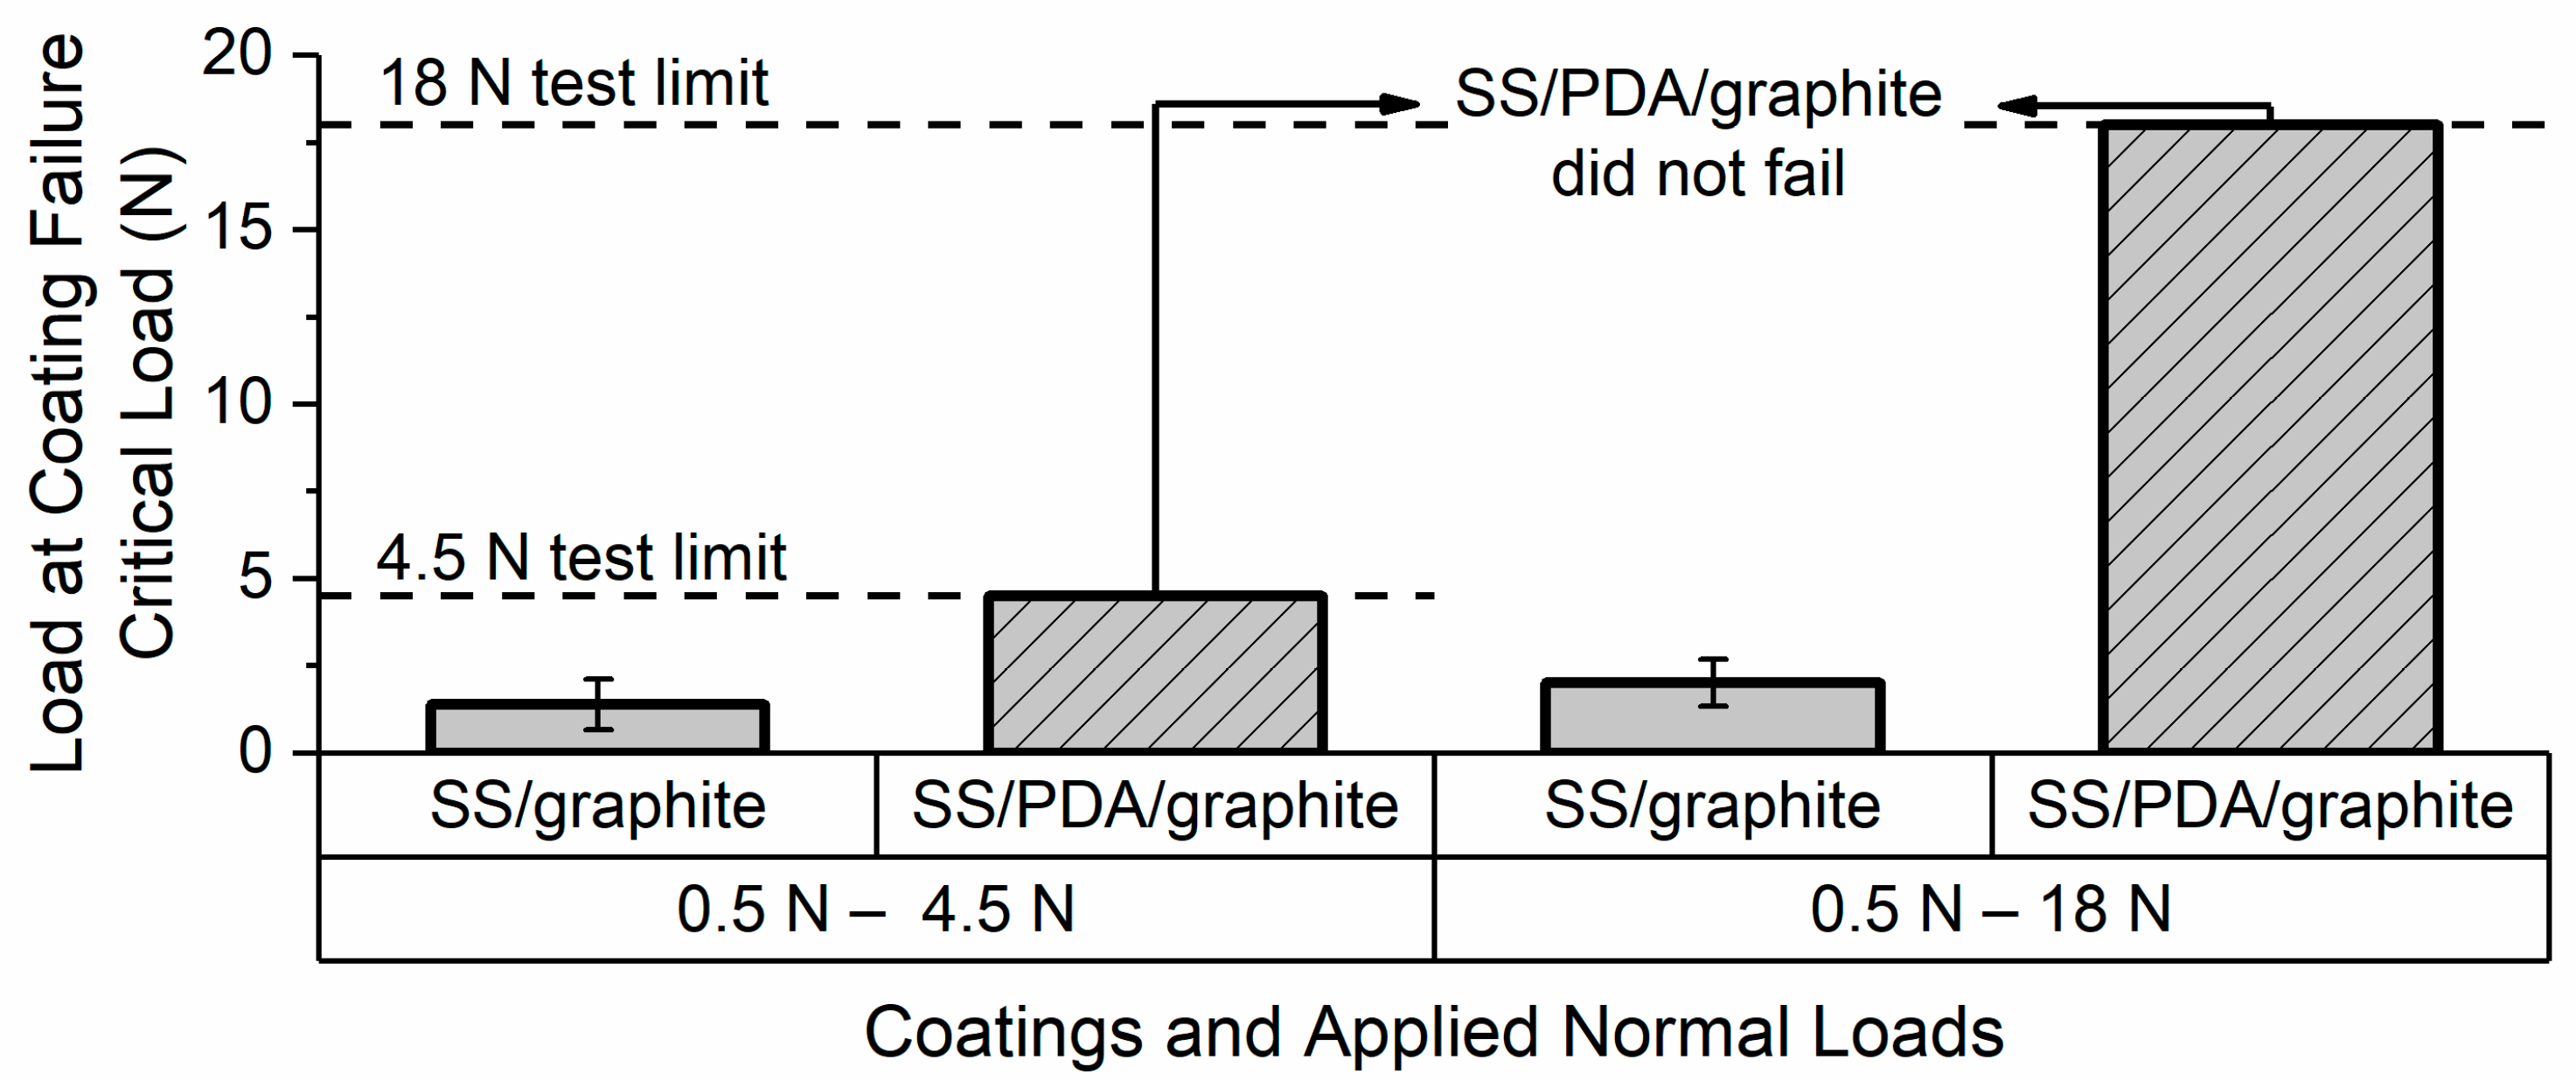
The average critical loads for SS/graphite coating failure were measured as 1.4 N in the 0.5–4.5 N scratch tests and 2.01 N in the 0.5–18 N scratch tests, as shown in
Figure 11. In sharp contrast, the PDA/graphite coatings exhibited no failure, even under the maximum applied loads in both test ranges. This remarkable performance demonstrates that the PDA underlayer significantly enhances the scratch resistance of graphite coatings and wear resistance by preventing coating removal and failure, even under elevated loading conditions.
3.4. Comparison of Scratch Wear Track Profiles
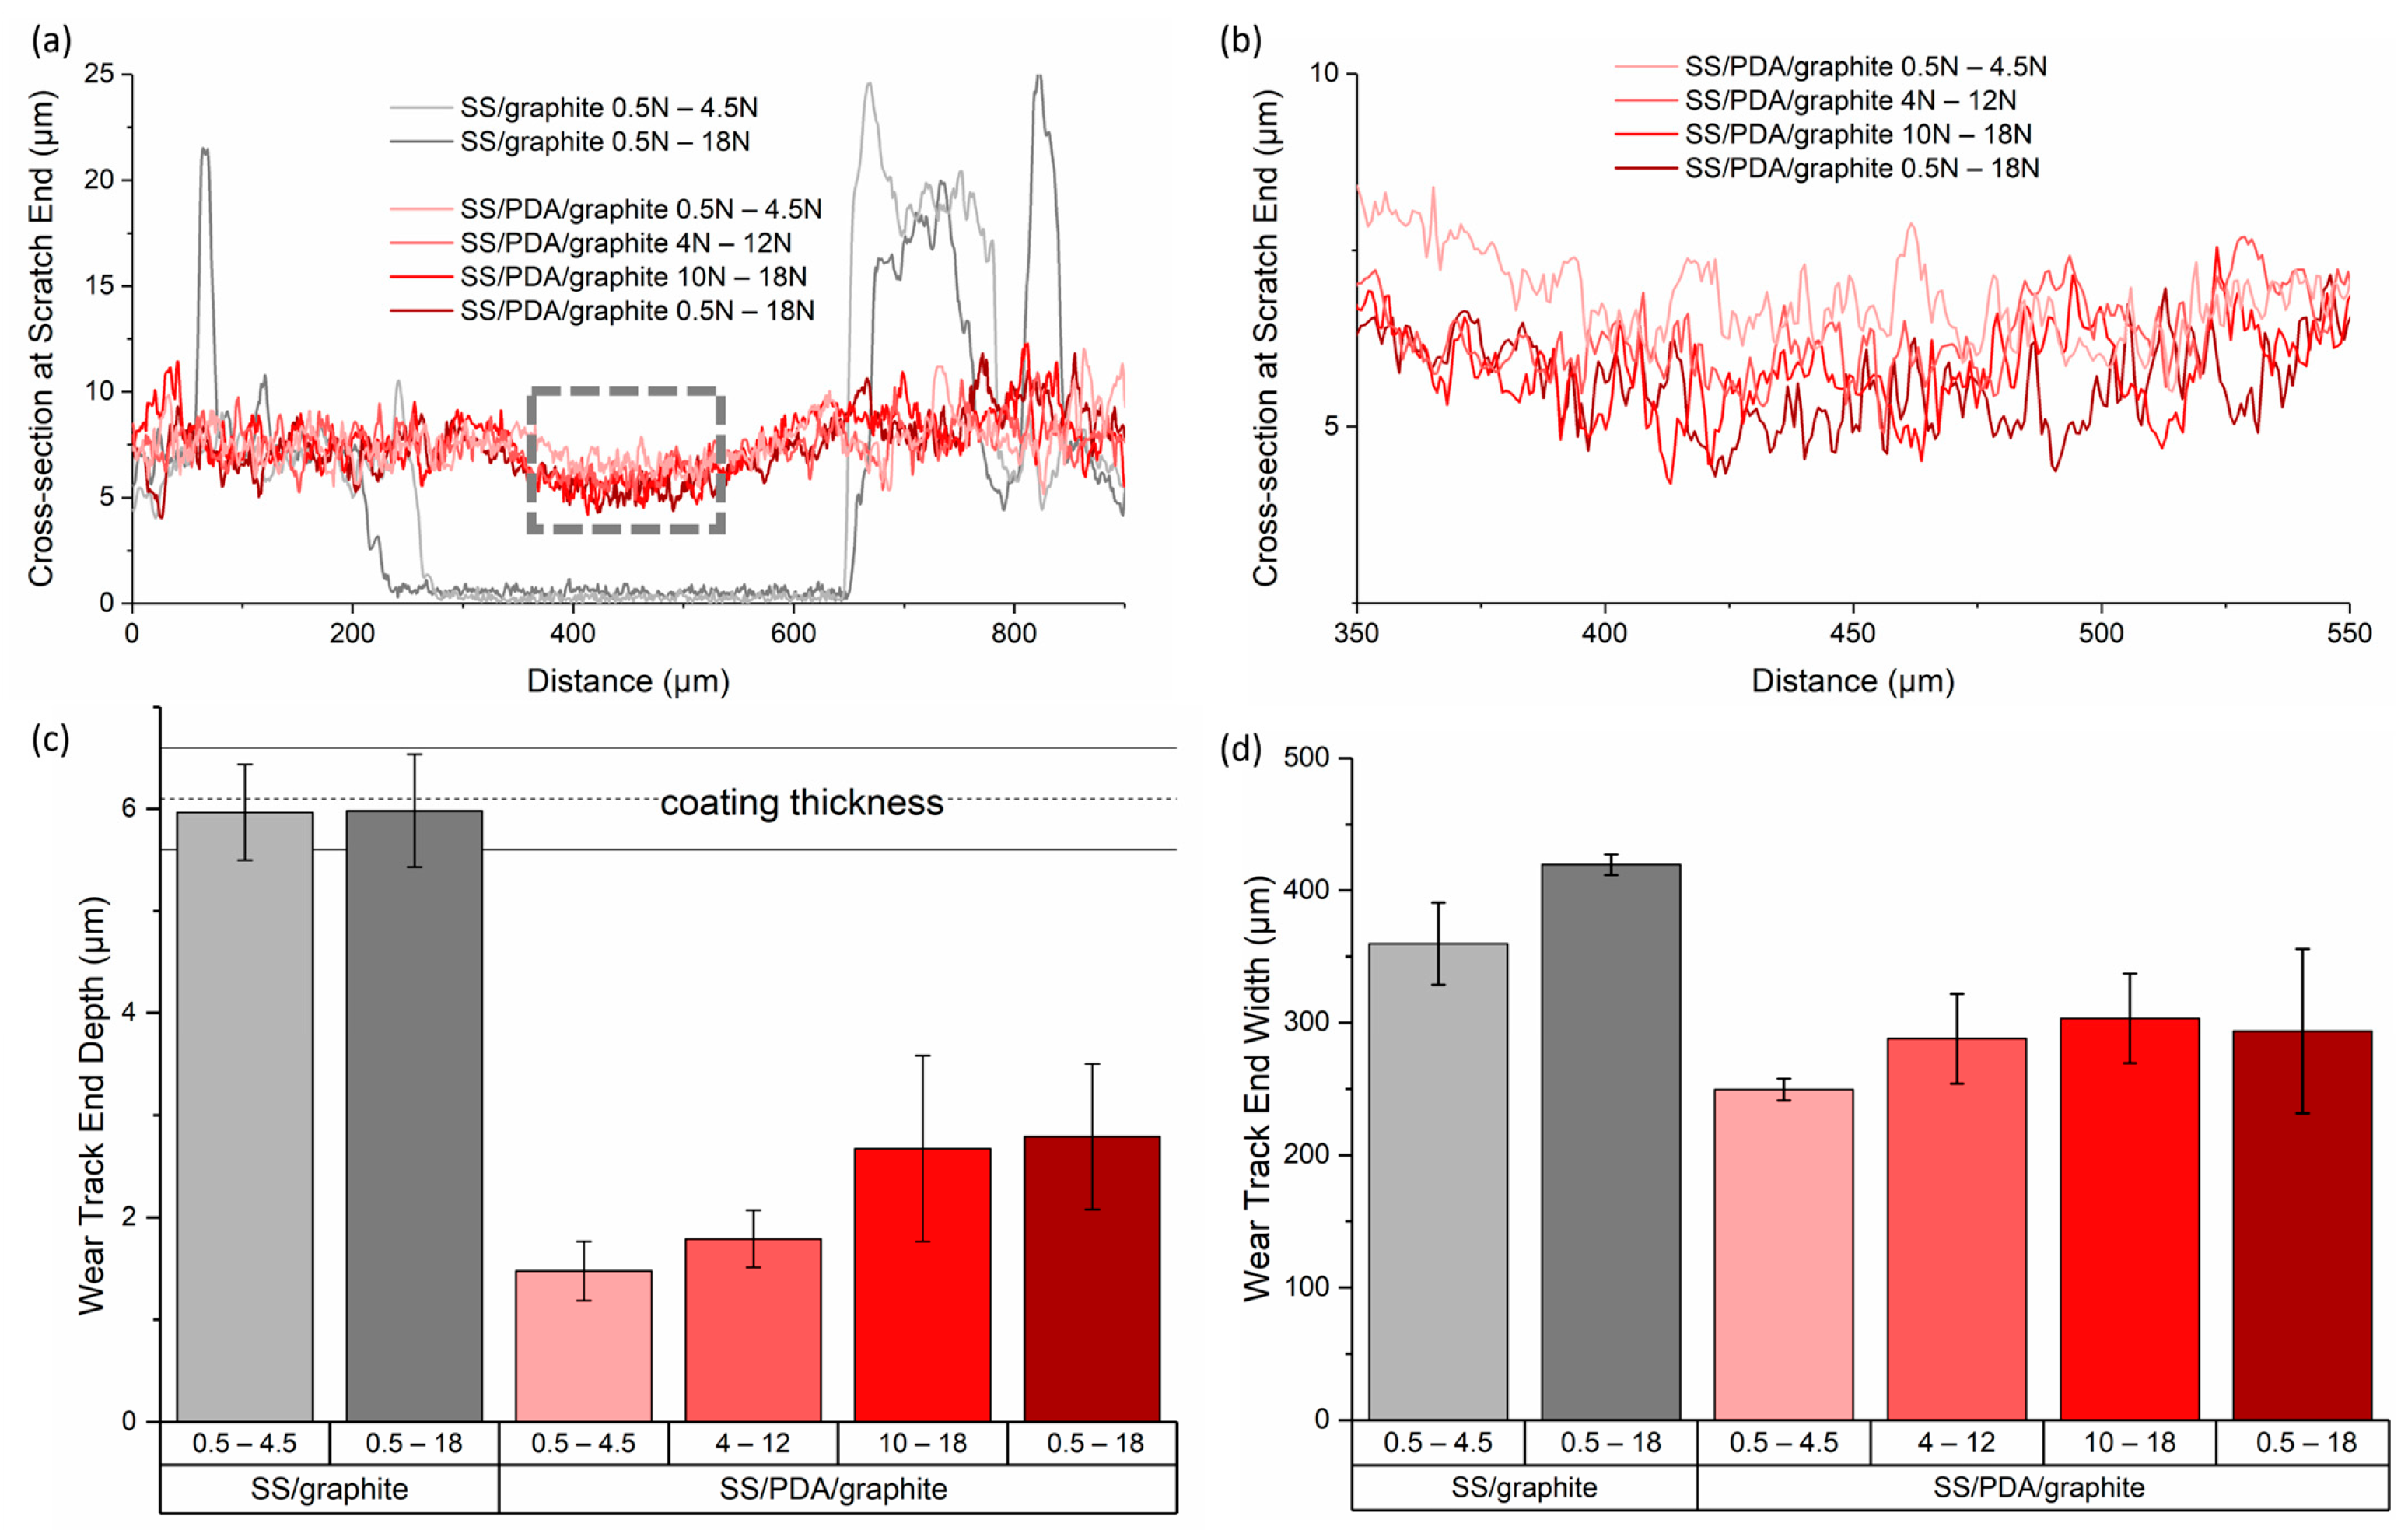
Figure 12a shows the transverse cross-sectional profiles at the ends of the wear tracks. The SS/graphite coatings exhibit square-shaped profiles, indicating complete material removal, while the SS/PDA/graphite coatings display rounded profiles, suggesting compression rather than material removal.
In terms of depth, the square-shaped profiles of the SS/graphite coatings are significantly deeper, corresponding to the full coating thickness, and expose the underlying substrate. In contrast, the rounded profiles of the SS/PDA/graphite coatings are shallower and confined to the coating layer, with no evidence of substrate exposure.
Regarding width, the wear tracks on the SS/graphite samples are significantly wider than those on the SS/PDA/graphite samples. This difference indicates better coating integrity and greater resistance to lateral displacement in the PDA-modified coatings. In the SS/graphite case, coating material is displaced during scratching and accumulates along the track edges, forming the high peaks observed in the cross-sectional profiles. These peaks represent loose graphite flakes that have been pushed outward due to poor interfacial adhesion. In contrast, the SS/PDA/graphite coatings exhibit compressed but confined deformation, with minimal material displacement and no significant peak formation at the track edges, reflecting stronger cohesion and adhesion.
Figure 12b provides a close-up view of the SS/PDA/graphite wear track profiles, emphasizing the effect of increasing the scratch normal load. The roughness of the graphite coating is shown in the compressed profiles. The test ending in 4.5 N had the shallowest wear track, as expected due to the lowest load and loading rate. As the final scratch load increases, the compression depth increases, with the scratches ending at 18 N displaying the deepest wear tracks. The faster loading rate of 0.44 N/s results in slightly deeper compression compared to the slower 0.2 N/s rate.
Figure 12c presents the average depth measurements of the wear tracks. For the SS/graphite coatings, the depth is similar to the coating thickness, indicating complete material removal down to the substrate. In contrast, the SS/PDA/graphite coatings exhibit progressively deeper profiles as the load increases, reflecting compression rather than material loss. At the maximum load of 18 N, the depth of the compressed SS/PDA/graphite tracks is comparable for both loading rates, suggesting that loading speed plays only a minor role in the deformation behavior of the SS/PDA/graphite coating.
Figure 12d presents the average wear track widths at the ends of the tracks, emphasizing the significant differences between SS/graphite and SS/PDA/graphite coatings. The wear track widths for SS/graphite coatings are approximately 1.5 times those of SS/PDA/graphite coatings, highlighting the effectiveness of the PDA underlayer in enhancing adhesion and reducing wear track dimensions.
These results indicate that the applied normal load during scratching is a key factor influencing the depth and width of wear tracks for both coatings. However, the presence of a PDA underlayer substantially reduces wear track depth and width, demonstrating its ability to improve the coating’s durability and performance under varying load conditions.
3.5. Mechanism of Compression in PDA/Graphite Morphology
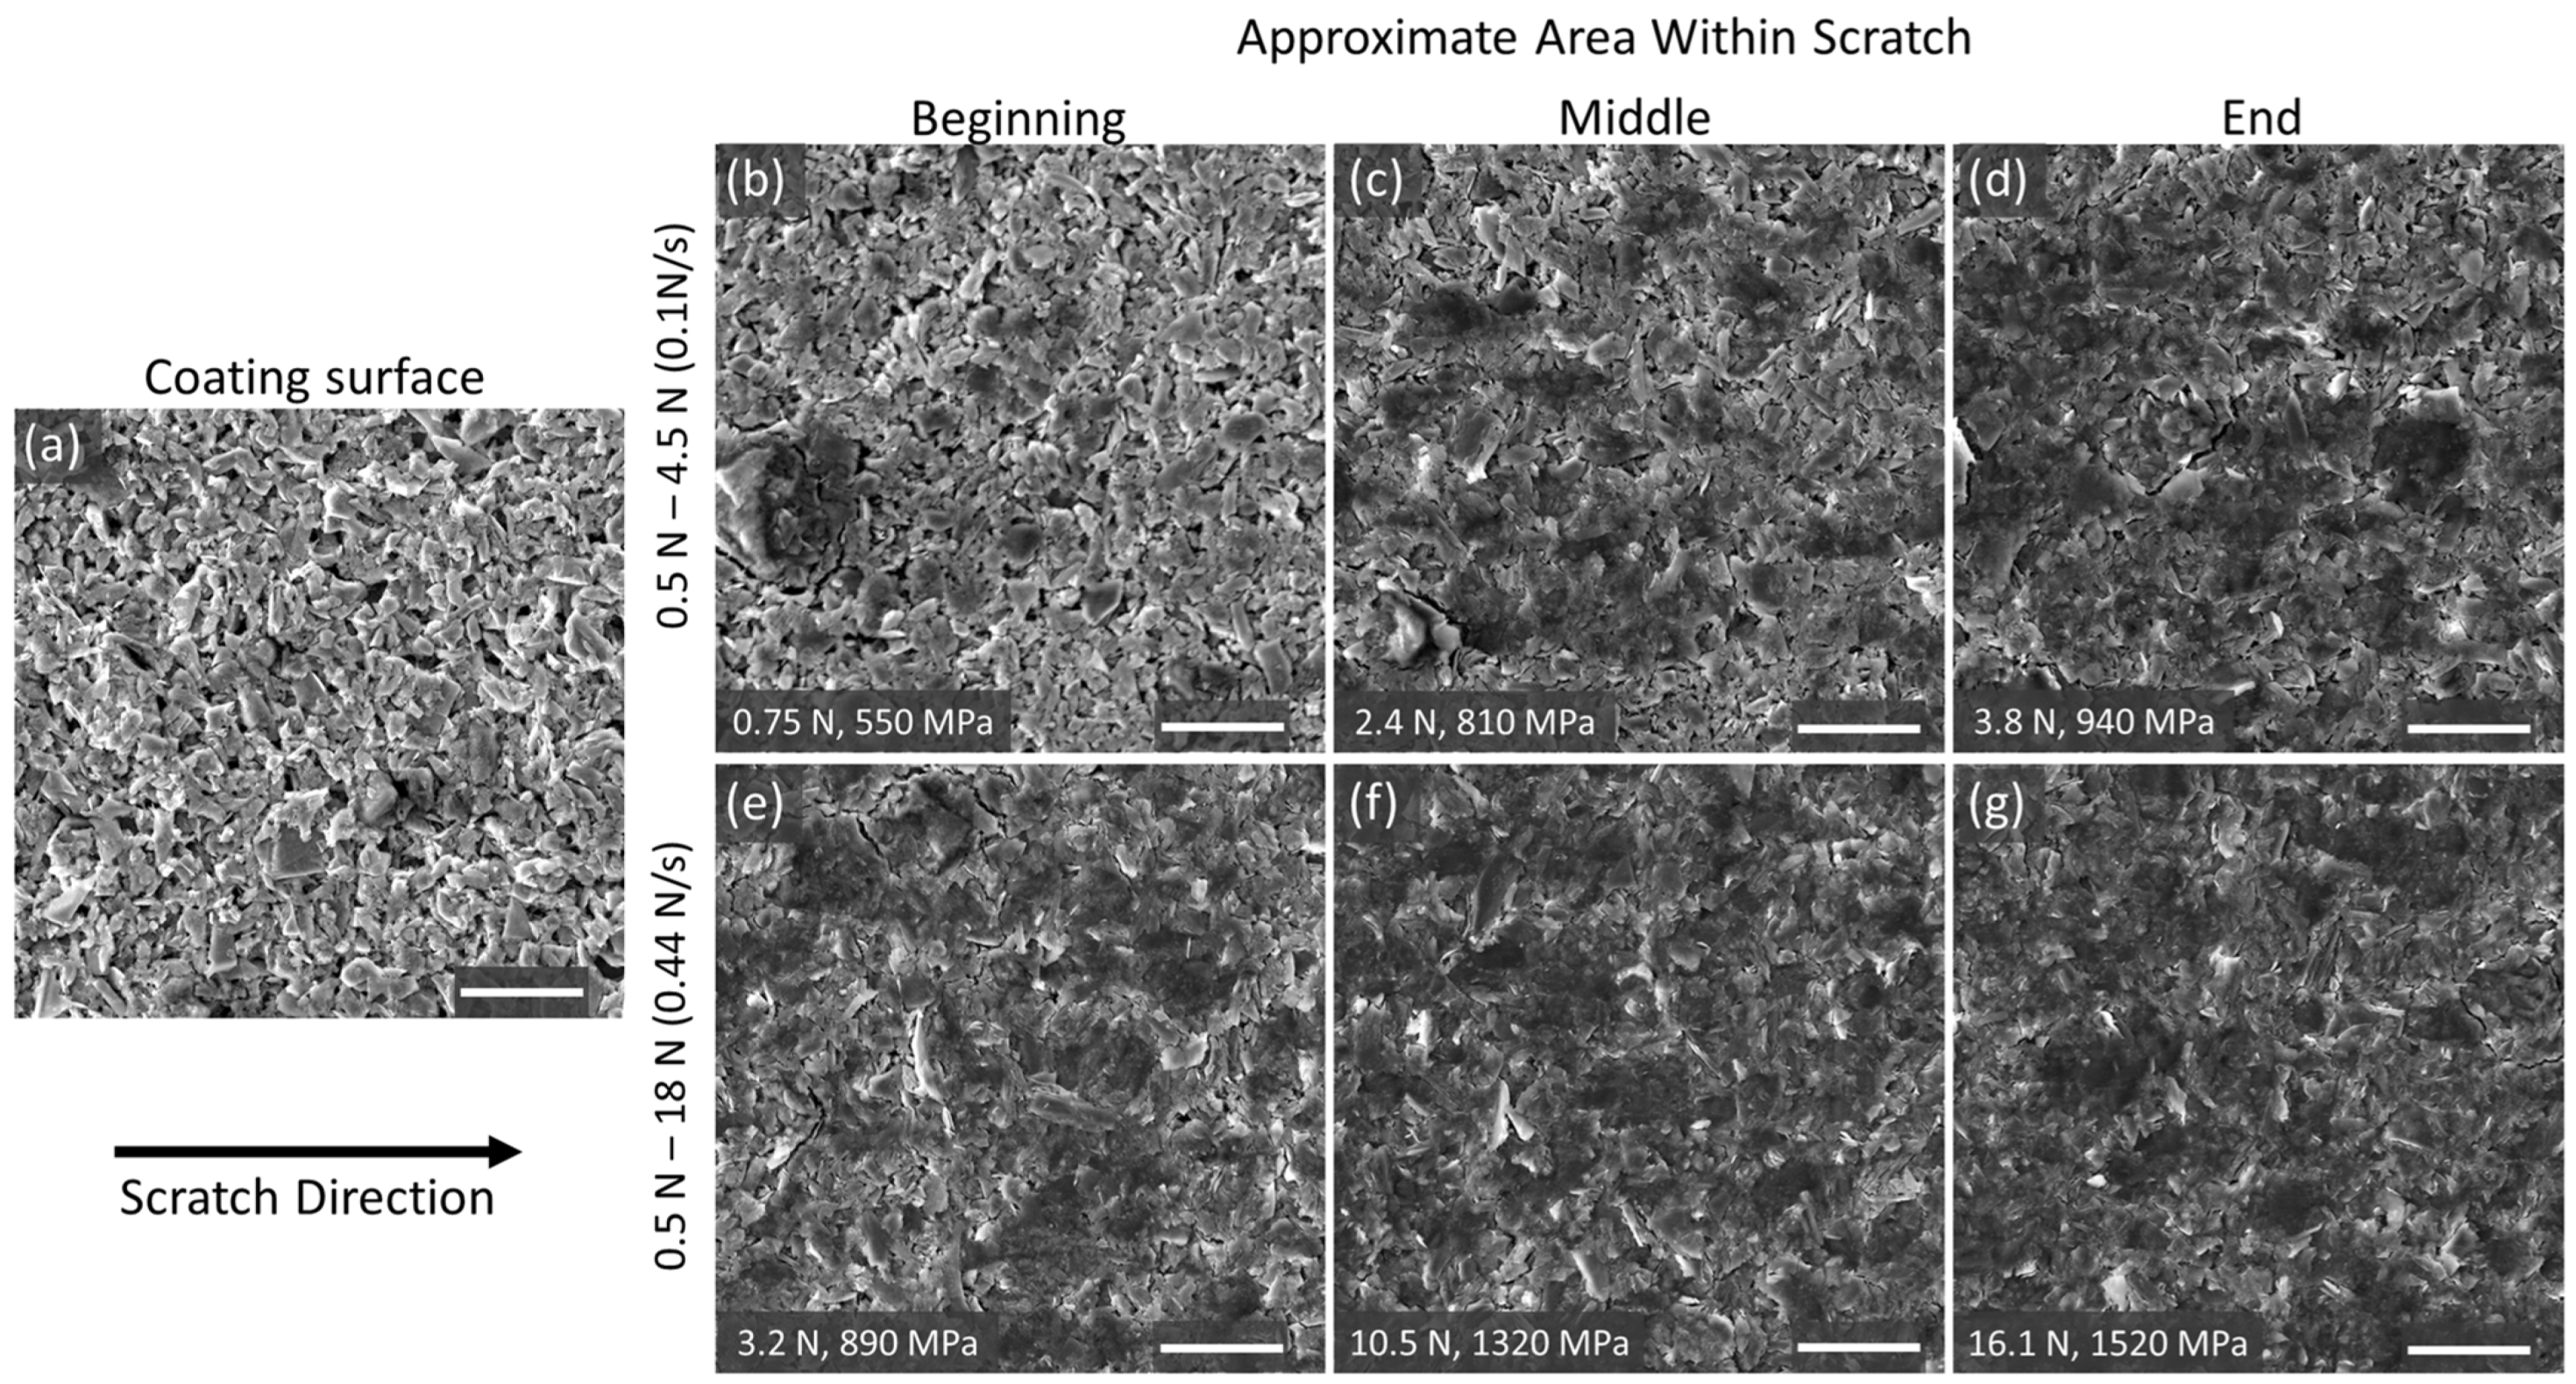
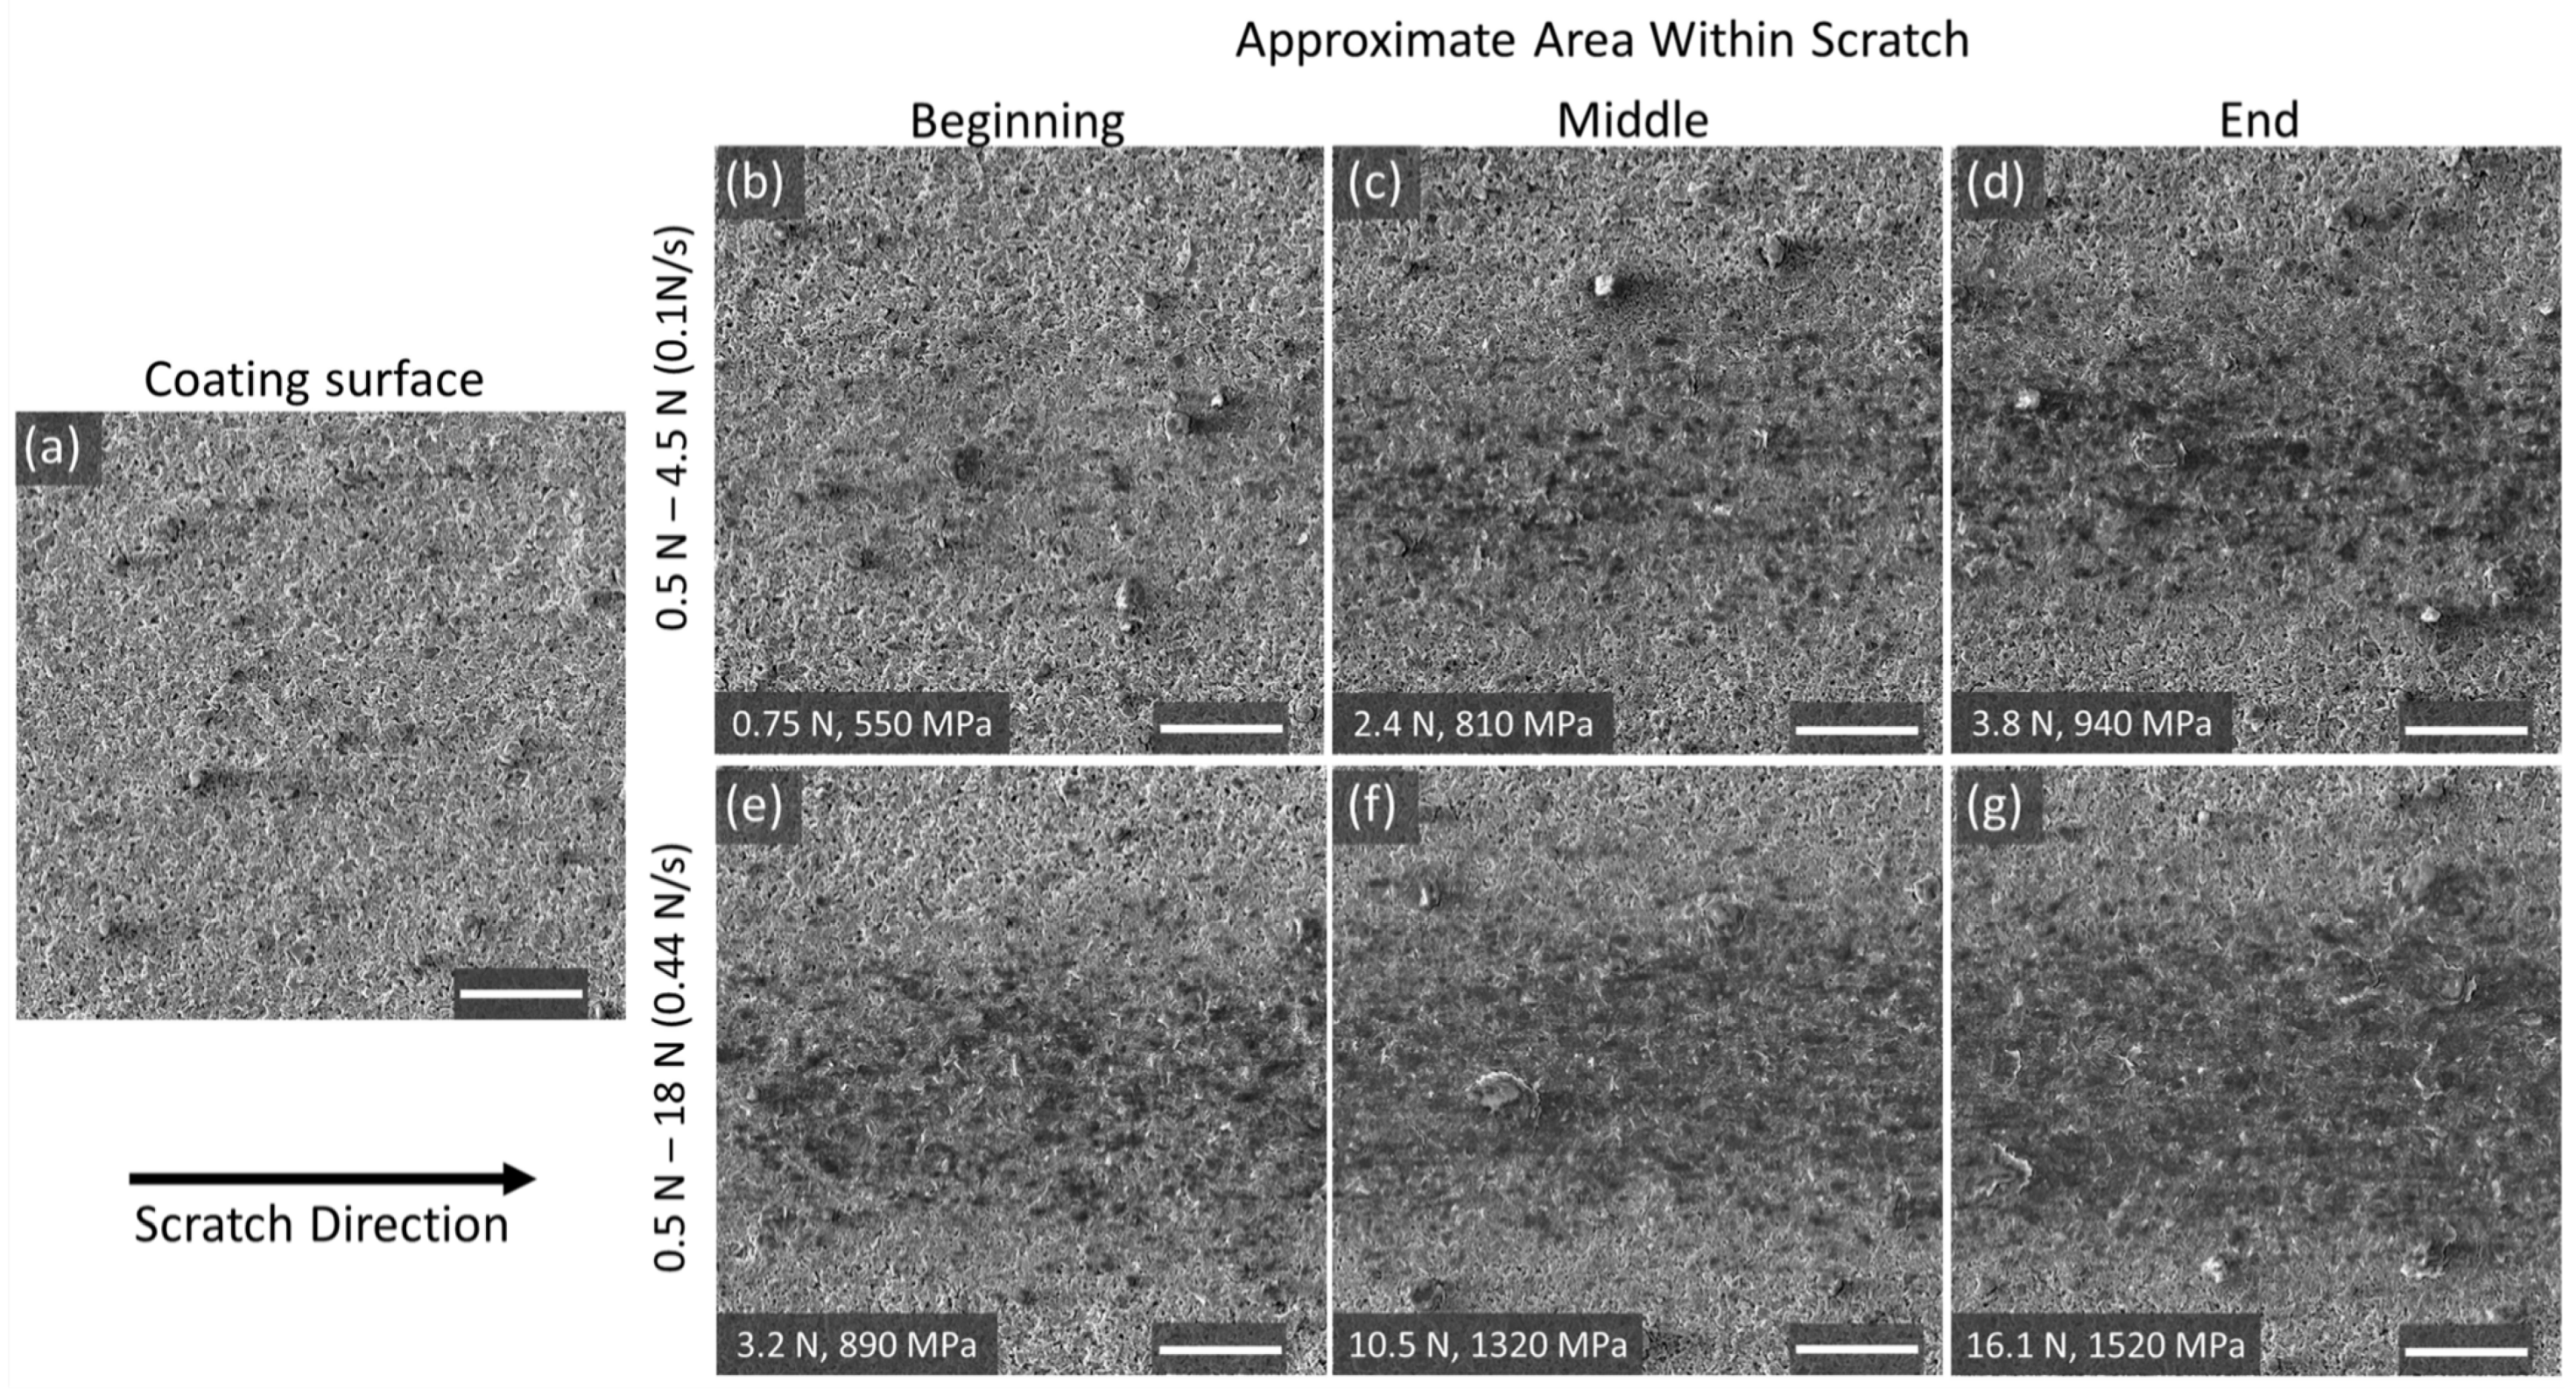
Figure 13 provides detailed insights into the compression behavior of SS/PDA/graphite coatings under loading ranges of 0.5–4.5 N and 0.5–18 N. The approximate load and corresponding Hertzian contact pressure at each imaged location are indicated, with the uncompressed coating surface in
Figure 13a serving as a reference.
As the applied load increases, graphite flakes undergo progressive compaction, resulting in a noticeable reduction in porosity, as shown in
Figure 13b–d. The loosely stacked flakes flatten into tightly packed platelets, creating a denser, more uniform structure. These platelets appear darker in the SEM images, likely due to reduced secondary electron emission caused by their smoother surfaces and higher packing density. The compacted morphology scatters or absorbs more incident electrons, diminishing the secondary electron yield. These changes in surface structure and image contrast illustrate the compressive effect of increasing load during sliding contact.
This compaction behavior becomes even more pronounced under higher loads and faster loading rates. In the 0.5–18 N scratch test conducted at a maximum loading rate of 0.44 N/s (
Figure 13e–g), flakes at the beginning of the wear track (
Figure 13e) already appear more compressed than those in the lower-load 0.5–4.5 N test (
Figure 13b), reflecting the influence of increased contact pressure. By the end of the scratch (
Figure 13g), the graphite forms a smooth, highly compacted layer with minimal visible flake edges, indicating substantial flake alignment and densification under high stress.
These observations are consistent with prior studies on compression-induced morphological changes in graphite coatings. For instance, compression under a flat plate at 3 MPa led to an ~11% thickness reduction and smoother surfaces with fewer flake edges—features similar to those seen in
Figure 13b–d of our study [
34]. Moreover, investigations using spherical indenters under Hertzian contact pressures of 50 MPa to 1 GPa reported nonuniform compaction, densification, and even tribo-induced transformation of graphite into turbostratic carbon structures [
36]. These transformations deepened with increasing load, paralleling the progressive morphological evolution observed in
Figure 13e–g. Together, these comparisons reinforce our conclusion that both the magnitude of applied load and the geometry of contact play critical roles in driving flake alignment, mechanical densification, and structural reorganization in graphite coatings.
Figure 14 provides zoomed-out views of the same regions, emphasizing the coating’s surface roughness in untested areas and the effects of compression within the wear tracks. In the untested regions, prominent asperities are visible on the coating surface, which are progressively flattened under increasing load during scratching. Compression is most pronounced at the center of the wear track, where the applied pressure is greatest. The affected area expands with increasing load, as illustrated by the comparison between
Figure 14b (beginning of the test) and
Figure 14d (end of the test) for the 0.5–4.5 N range. A similar trend is observed at the higher loading rate, with
Figure 14e–g showing more severe compression and a wider compressed region toward the end of the scratch.
The morphology within the scratches corresponds to the observed increases in compression depth. The compacted regions result from the displacement of air and the reduction in porosity in the coating, forming a denser and smoother layer more closely aligned with the substrate surface.
These findings highlight the critical role of the PDA underlayer in enhancing the mechanical resilience of the graphite coating. The gradual compaction and the absence of coating removal, even under high loads, demonstrate the effectiveness of the PDA/graphite configuration in maintaining coating integrity across varying load rates and magnitudes.
Future work will investigate how the enhanced adhesion, demonstrated through systematic scratch testing in this study, influences long-term wear performance under repeated sliding cycling.


