Article

Multi-Objective Optimization of Laser Cleaning Quality of Composite Paint Layers Based on Response Surface

1
Key Laboratory High Efficiency & Clean Mech Manufacture, School of Mechanical Engineering, Shandong University, Ministry of Education, 17923 Jingshi Rd., Jinan 250061, China
2
Laser Institute, Qilu University of Technology (Shandong Academy of Sciences), Jinan 250104, China
3
Shandong Qiangyuan Laser of SDIIT Ltd., Liaocheng 252000, China
4
Zibo Xincai IC Co., Ltd., Zibo 255020, China
5
School of Mechanical Engineering and Automation, Beihang University, Beijing 100191, China
*
Authors to whom correspondence should be addressed.
Coatings 2025, 15(6), 647; https://doi.org/10.3390/coatings15060647
Submission received: 10 April 2025 / Revised: 22 May 2025 / Accepted: 23 May 2025 / Published: 27 May 2025
(This article belongs to the Section Laser Coatings)

Abstract

:
To improve the laser cleaning surface quality of composite layers on Al alloy surfaces, a method of determining the optimal cleaning parameters is proposed that is based on the response surface methodology. It involves constructing a mathematical model of the input variables (laser power, scanning speed, repetition frequency, and defocusing amount). Laser cleaning experiments were conducted to analyze the effects of process parameters on paint removal performance. Using the response surface methodology (RSM), a relationship model was developed to link key factors, including paint layer removal thickness and surface roughness. The results indicate that the optimal process parameters are as follows: a laser power of 291 W, frequency of repetition of 166 kHz, scanning speed of 8425 mm/s, and defocusing amount of −17 mm. A verification test was performed to confirm the optimal parameters for the process. The error ranges for the thickness and roughness of the laser paint removal were within 1.9 μm~3.8 μm and −0.573 μm~−0.419 μm, respectively, indicating that the response surface method can be used to predict and optimize the quality of laser paint removal. These findings provide valuable insights into the laser treatment of composite paint layers on Al alloys and contribute to advances in surface treatment technology for Al alloys.

1. Introduction

Composite paint is usually used for the colored outer layer on large components, such as ships, aircraft, and tunnels. The layer of paint on the surface of the substrate is damaged by ageing, peeling, cracking, and rusting as the time spent in service increases [1,2]. The old layer of paint must be removed from the surface and a new layer applied. Taking into account maintenance costs and safety, the maintenance concept of removing the composite paint layer at the end of service has been progressively replaced by the maintenance concept of partial paint removal. Attention should be paid to the controllability of the removal of a multiple-layer superstructure [3,4]. Laser cleaning technology, as an effective and environmentally friendly method of removing paint, has significant advantages in the cleaning of composite paint layers [5,6,7]. The quality of the laser cleaning of composite paint layers (such as thickness of the removal layer and surface roughness) depends on the parameters of the laser process, such as laser power, scanning speed, and repetition rate. Controlled cleaning of the composite paint layer may be achieved by appropriate adjustment of the parameters of the laser cleaning process [8,9].
The effect of laser cleaning is mainly influenced by the parameters of the laser cleaning process. An adequate adjustment of process parameters can effectively remove attachments and ensure high surface quality. Mateo et al. [10] demonstrated that adjusting the appropriate pulse frequency and laser parameters could remove the paint layer without damaging the substrate. Hu et al. [11] found that appropriate laser cleaning parameters can remove surface contaminants and increase the surface efficiency of the substrate. Jasim [12], among others, showed that different strengths and frequencies of repeat testing affect the microscopic morphology of the cleaning sample, resulting in different hardnesses. Brygo et al. [13] found that laser energy density has a significant impact on the quality of laser paint removal. Razab et al. [14] performed laser cleaning on two different types of layers of pigment. The results showed that different elements in the paint layer also had a significant influence on the removal results of the stain. Shi et al. [15] found that cleaning efficiency can be improved by increasing the maximum laser power density, and that non-destructive cleaning of the substrate surface can be achieved by adjusting the intensity of spot overlap. Li et al. [16] pointed out that non-destructive cleaning of the paint layer of marine steel plates can be achieved by adjusting the pulsed laser parameters. Yang et al. [17] found that the degree of spot overlap had the greatest influence on the cleaning of acrylic resins on stainless steel, followed by laser power.
The parameters of laser cleaning are numerous and complicated to deal with. The cleaning quality of the paint layer is fully reflected by the combined action of several process parameters. Accordingly, Ding et al. [18] established a mathematical theorem focused on the parameters of the laser process and the quality of carbon black layer cleaning by the response surface method; they obtained a Pareto solution using an optimization algorithm that provides a choice of parameters for the technical requirements of carbon black layer cleaning. Yang [19] analyzed the influence of laser cleaning parameters on the controllability index based on the response surface method. The results showed that the influence of scanning time, laser power, and spot overlap rate on the thickness of the paint layer are positively correlated. The surface roughness increases with increasing laser power and decreases with an increasing degree of spot overlap. Sun et al. [20] used the response surface method and particle swarm optimization algorithm to optimize the laser cleaning parameters. The experiment showed that the optimized parameters could effectively remove corrosion from the surface of the pipe thread, and the cleaning effect was good without melting.
The literature cited above mainly examines the effect of process parameters on the cleaning effect of a single layer of paint, but the laser cleaning process of a composite layer of paint and the surface quality after layer cleaning are also worth further investigation. Liu et al. [21] carried out laser cleaning on the surface of a 2A12 aluminum alloy substrate coated with a composite paint layer. The results showed that changing the combination of laser process parameters could regulate the quality of laser cleaning, which verified the feasibility of laser layered cleaning. Zhang [22] developed a mathematical model focused on the parameters of the laser paint removal process, the amount of paint residue and deposition, the surface roughness, and the efficiency of paint removal by analyzing the surface response. After variance analysis and model validation, the proposed model was shown to effectively improve the quality and efficiency of the laser paint removal process.
A comprehensive representation of the laser cleaning performance of a composite paint layer under the combined action of several process parameters should be established, and the interaction between parameters should be further investigated. It is very important to undertake research with the objective of optimizing the quality of laser cleaning of composite paint layers. In this paper, two regression prediction models for the thickness of the paint removal and surface roughness were constructed using the response surface method, and the models’ reliability was assessed by means of a variance analysis. An analysis of the perturbation and response surface diagrams investigated the effects of the parameters of the laser cleaning process and their interactions on the thickness of the paint removal and the surface roughness. The laser cleaning process parameters for 30 μm paint removal thickness and large surface roughness were obtained. A validation test was performed using an optimized combination of parameters. The test results show that the response surface method can achieve the prediction and optimization of surface quality after laser paint removal.

2. Materials and Experimental Design

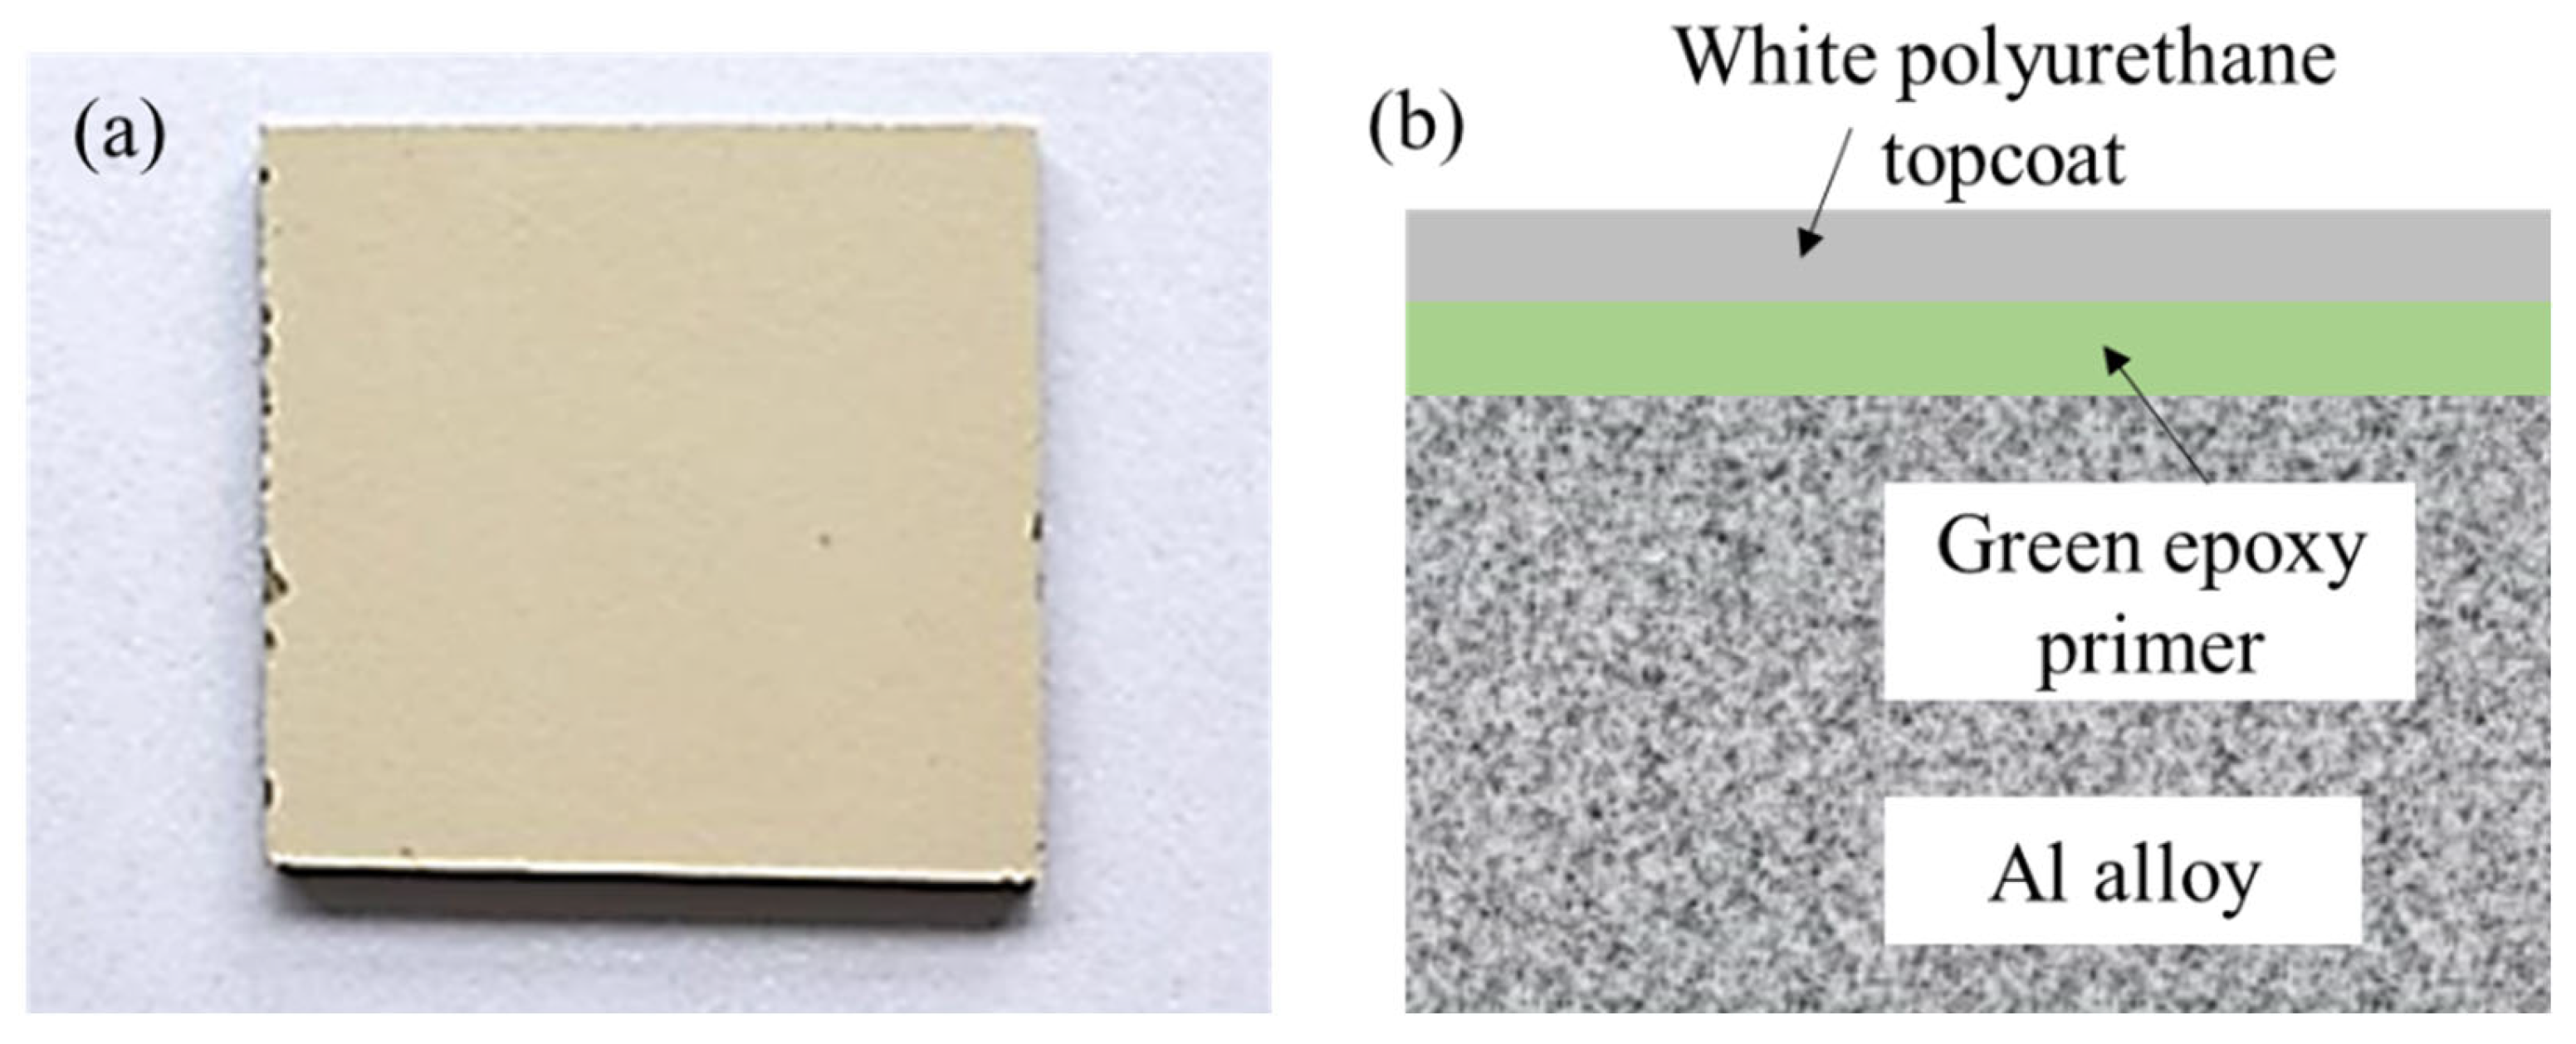
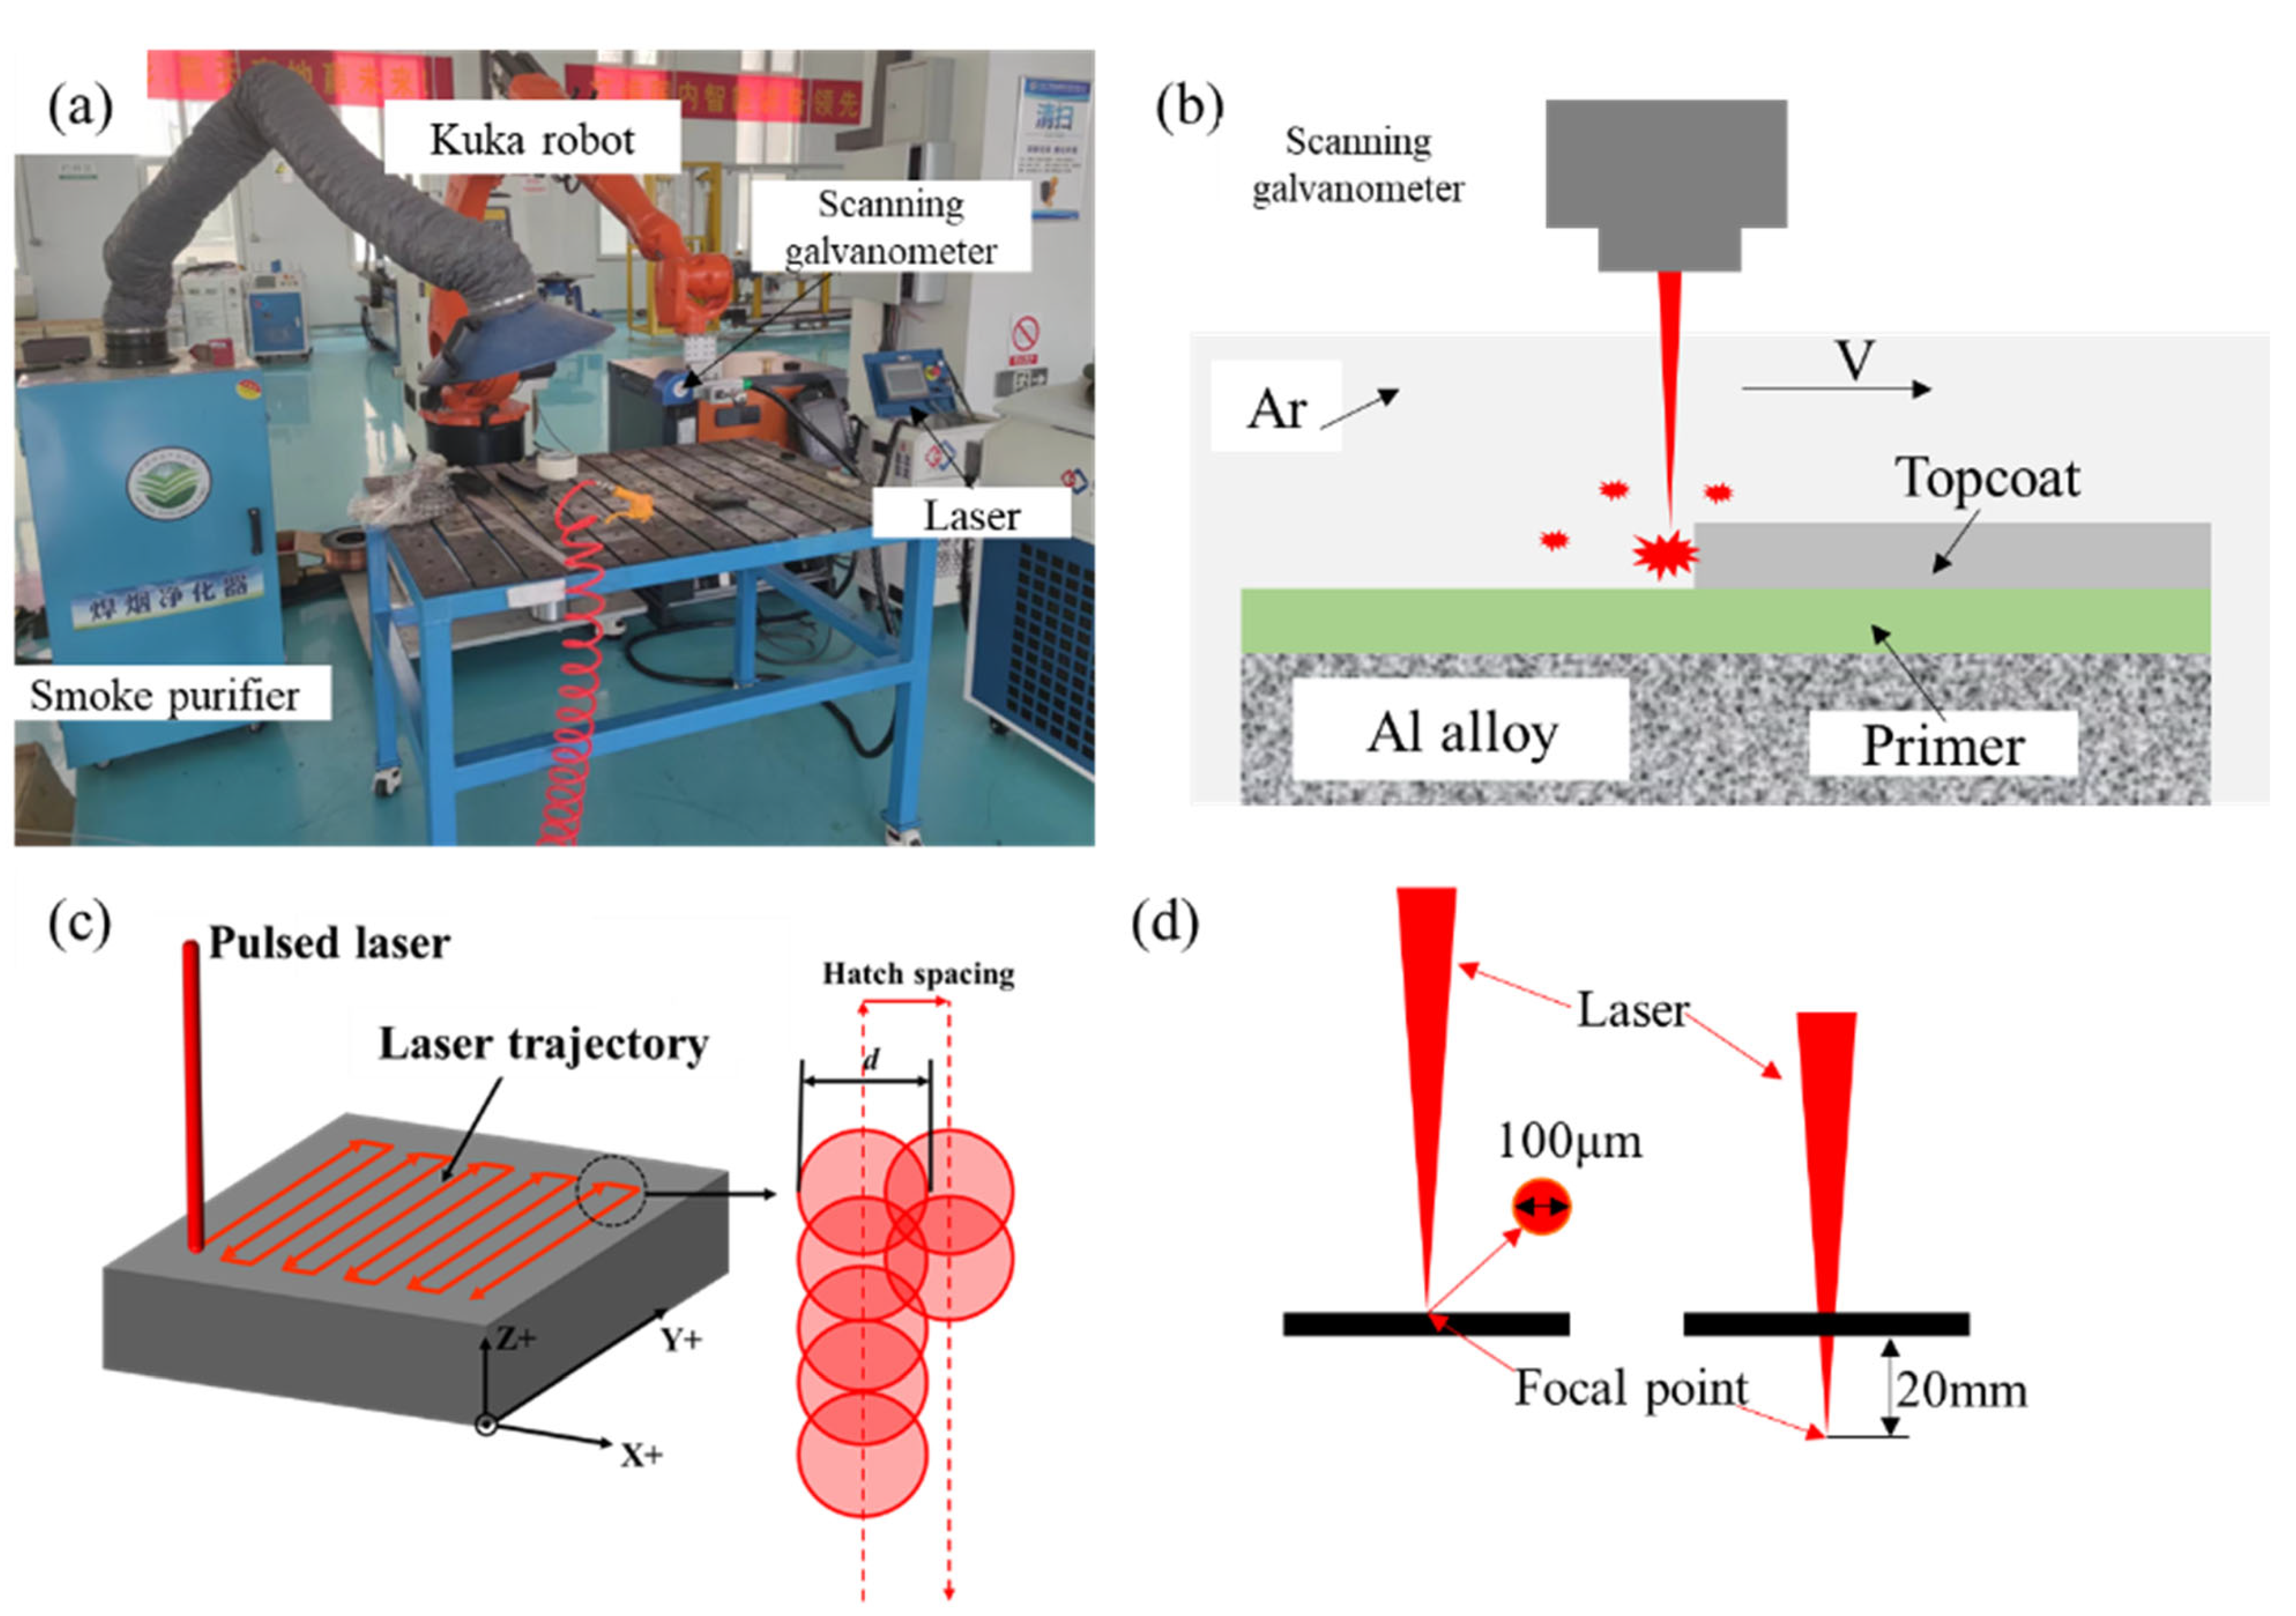
2.1. Preparation and Treatment of Experimental Materials

The test sample is a commonly used Al alloy for aircraft skin. The thickness is approximately 2 mm thick. The surface was uniformly sprayed with a white polyurethane topcoat (30 ± 3 μm) and a green epoxy primer (20 ± 3 μm thick). The surface roughness is Ra 4.35 μm. To facilitate the purification test and subsequent detection and analysis, a high-frequency electric spark wire cutting machine was used to cut the plate to a test sample of approximately 20 mm × 20 mm. The test sample is shown in Figure 1a and the diagram of the sample surface is shown in Figure 1b.
The composite-paint-layer laser cleaning system is described in Figure 2. The laser cleaning system consists essentially of two main components: a laser cleaning machine and a cleaning auxiliary device. A laser cleaning machine consists of a fiber-pulsed laser (QYCL-FP100, Qiangyuan Laser, Liaocheng, China), a human–machine interface display, a controller, a laser output head, a galvanometer, a motor, and an optical system (Figure 2a). The parameters of the laser cleaning process can be adjusted by means of an interface on the display screen, and parameters such as laser power, repetition frequency, and scanning speed can be adjusted. The key parameters of the laser cleaning machine are presented in Table 1. The auxiliary part of the cleaning system includes key equipment, such as water coolant, protective gas, a vacuum cleaner, and a KUKA robot. A schematic diagram illustrating the laser cleaning of a composite paint layer is presented in Figure 2b.

2.2. Experimental Design

To better study the effect of the parameters of the laser cleaning process on the cleaning quality of the composite paint layer, the parameters were optimized using the response surface method (RSM) by applying a regression equation between each factor and the response [23,24].
f x = α 0 + i = 1 n α i x i + i = 1 n α i i x i 2 + i = 1 , i , j n α i j x i x j + ε
where f(x) is the predicted response value (exam factor), xi and xj are the examining factors, α0, αi, αii, and αij are regression coefficients, and ε is the noise or error term.
The RSM is more effective than other methods in establishing predictive models for inputs and outputs, is suitable for the precise optimization of continuous variables, and offers greater flexibility in the post-experimental phase. A four-factor, three-level Box–Behnken design (BBD) was used to design the experimental plan, and the RSM was applied to optimize the parameters of the laser cleaning process. The laser power (P), scanning speed (v), repetition frequency (f), and defocusing amount (h) were considered as independent variables for laser cleaning and composite paint removal. According to the results of previous experiments, the experiment levels were coded using the statistical software Design Expert, as shown in Table 2. The response value for optimization analysis comprised paint layer removal thickness (H) and surface roughness (Ra). Table 3 presents the design and results of the response surface test.
The surface morphology of the sample after cleaning is shown in the legend below (Figure 3). After cleaning, the thickness of the paint removal and the surface roughness of the paint layer were measured. The results of the tests are given in Table 3. Combined with the data in the table, it is apparent that when the thickness of the removal layer is low, as in samples (19), (20), and (24), the surface is red-brown, due to the small effect of the laser energy on the surface, which only removes the thinner coating. If the thickness of the paint is too thick, the top layer is removed, revealing a light green primer, as shown in the samples (1)~(6). There are also big differences in the surface finish of the different components. This shows that the quality of the laser cleaning process (other than the thickness of the paint and the roughness of the surface) can be adjusted by changing the parameters of the laser cleaning process.

3. Results and Discussions

3.1. Mathematical Modelling and Analysis of Variance

According to the paint removal data in Table 3, the Design-Expert response surface analysis software was used to perform polynomial regression fitting on the laser cleaning process parameters and paint layer removal thickness and surface roughness in Table 3. The regression prediction model of the laser cleaning process parameters and the paint layer removal thickness and surface roughness was obtained:
Y1 = −11.024 + 0.138x1 + 0.218x2 − 1.708 × 10−4x3 − 1.621x4 + 1.875 × 10−4x1x2 + 1.25 × 10−6x1x3 − 2.5 × 10−3x1x4 − 6.093 × 10−6x2x3 + 7 × 10−3x2x4 + 1.875 × 10−6x3x4 − 2.513 × 10−4x12 − 3.38 × 10−4x22 − 3.224 × 10−8x32 − 0.084x42
Y2 = 22.165 − 0.047x1 − 0.09x2 − 9.029 × 10−4x3 + 0.063x4 − 4 × 10−6x1x2 − 1.281 × 10−6x1x3 − 5.99 × 10−4x1x4 + 1.233 × 10−6x2x3 + 8.444 × 10−4x2x4 + 4.788 × 10−6x3x4 + 1.052 × 10−4x12 + 2.02 × 10−4x22 + 4.716 × 10−8x32 + 9.72 × 10−3x42
Y1 is the paint removal thickness, Y2 is the surface roughness, x1 is the laser cleaning power, x2 is the laser repetition frequency, x3 is the scanning speed of laser cleaning, and x4 is the defocusing amount. The variance analysis of the regression model of paint layer removal thickness and surface roughness is shown in Table 4.
According to the results of the variance analysis in Table 4, the F-values of the regression model for the thickness of the paint removal and surface roughness are 51.32 and 13.66, respectively. The p-values were below 0.0001, indicating that the regression model was highly significant. The p-values for lack of fit are 0.5045 and 0.3523, both above 0.05, suggesting that the lack of fit is not significant. Moreover, the model R2 values are 0.9816 and 0.9318, which are close to 1, respectively. The difference between the adjusted R2 and predicted R2 was less than 0.2. This demonstrates that the regression model is reliable and can be used to simulate the thickness of the paint removal and surface roughness data.
In Table 4, the p values for the paint removal thickness of the laser power P, scanning speed v, and defocusing amount h are all less than 0.0001. This shows that these three factors have a significant influence on the thickness of the paint layer removed.
The F-values for laser power P, repetition frequency f, scanning speed v, and defocusing amount h are 73.83, 1.73, 208.37, and 280.63, respectively. This shows that the order of the coefficients for the thickness of paint removal is as follows: h > v > p > f. The p-value of x2x4 in the variance analysis table is less than 0.05. This shows that the interaction between repetition frequency f and defocusing amount h also has a significant effect on the thickness of paint removal.
At the same time, the p-values for the surface roughness of the scanning speed v and the defocusing amount h are both less than 0.0001. The effect on roughness is very significant. The p-value of laser power P is less than 0.05, indicating that this factor is more significant. The F-values of laser power P, repetition frequency f, scanning speed v, and defocusing amount h are 6.11, 0.41, 29.97, and 37.33, respectively. This shows that the order of influence of each factor on roughness is as follows: h > v > p > f. The p-value of x2x4 in the analysis of variance table is less than 0.05. This shows that the interaction between repetition frequency f and defocusing amount h also has a significant effect on roughness.
To further test the reliability of the laser paint removal thickness regression model, the residual normal distribution diagram of the analysis model is shown in Figure 4a. The data points in the graph are evenly distributed around the fitting line and there are no outliers, indicating that the fitting is high. Meanwhile, the residual normal distribution diagram of the regression model is demonstrated, as shown in Figure 4c. The data points in the graph are evenly distributed along the fit line and there are no outliers, indicating that the regression model is highly fixable. A regression model was used to predict the paint removal thickness and roughness values in several sets of parameters of the laser cleaning process, and the predicted values were compared with experimental data. As shown in Figure 4b,d, most data points are close to the fitting line, suggesting that the regression predictor model considering the parameters of the laser cleaning process and the thickness of the paint and roughness is well formed. In summary, the regression predictor model considering the parameters of the laser cleaning process and the thickness of the paint removal and roughness is highly relevant and has high prediction accuracy, and it can be used to optimize the quality of paint removal thickness.

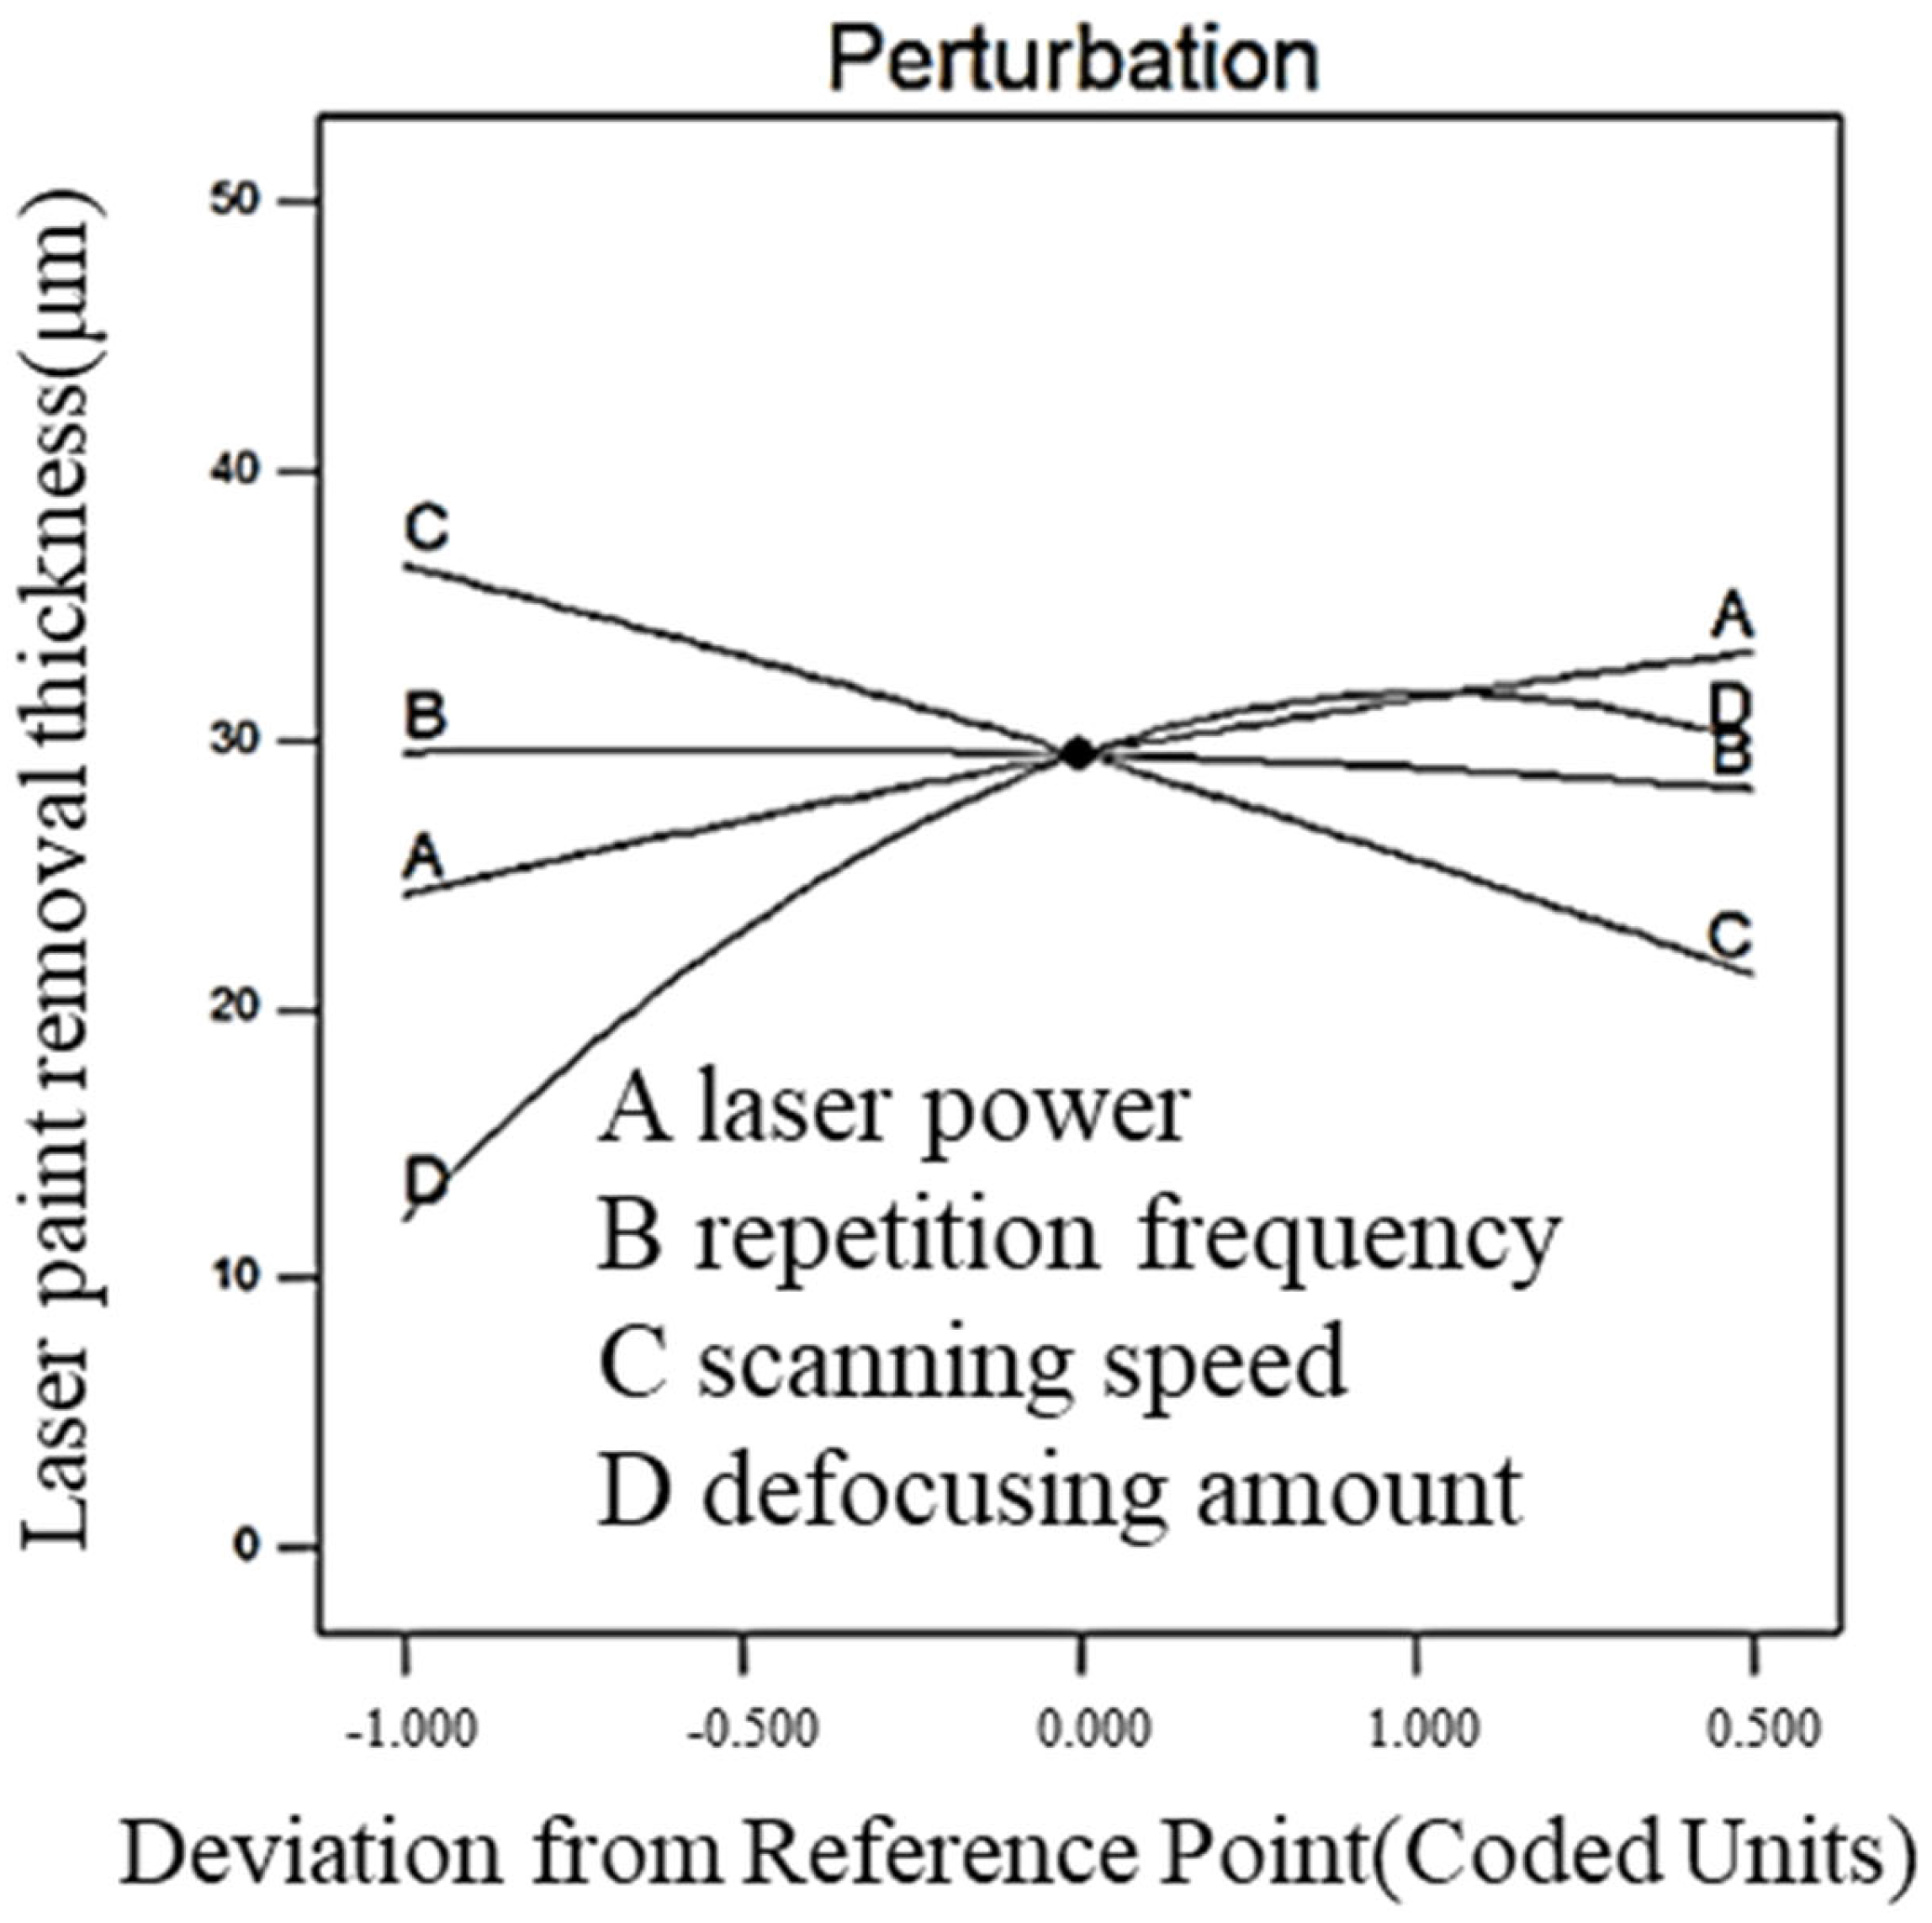
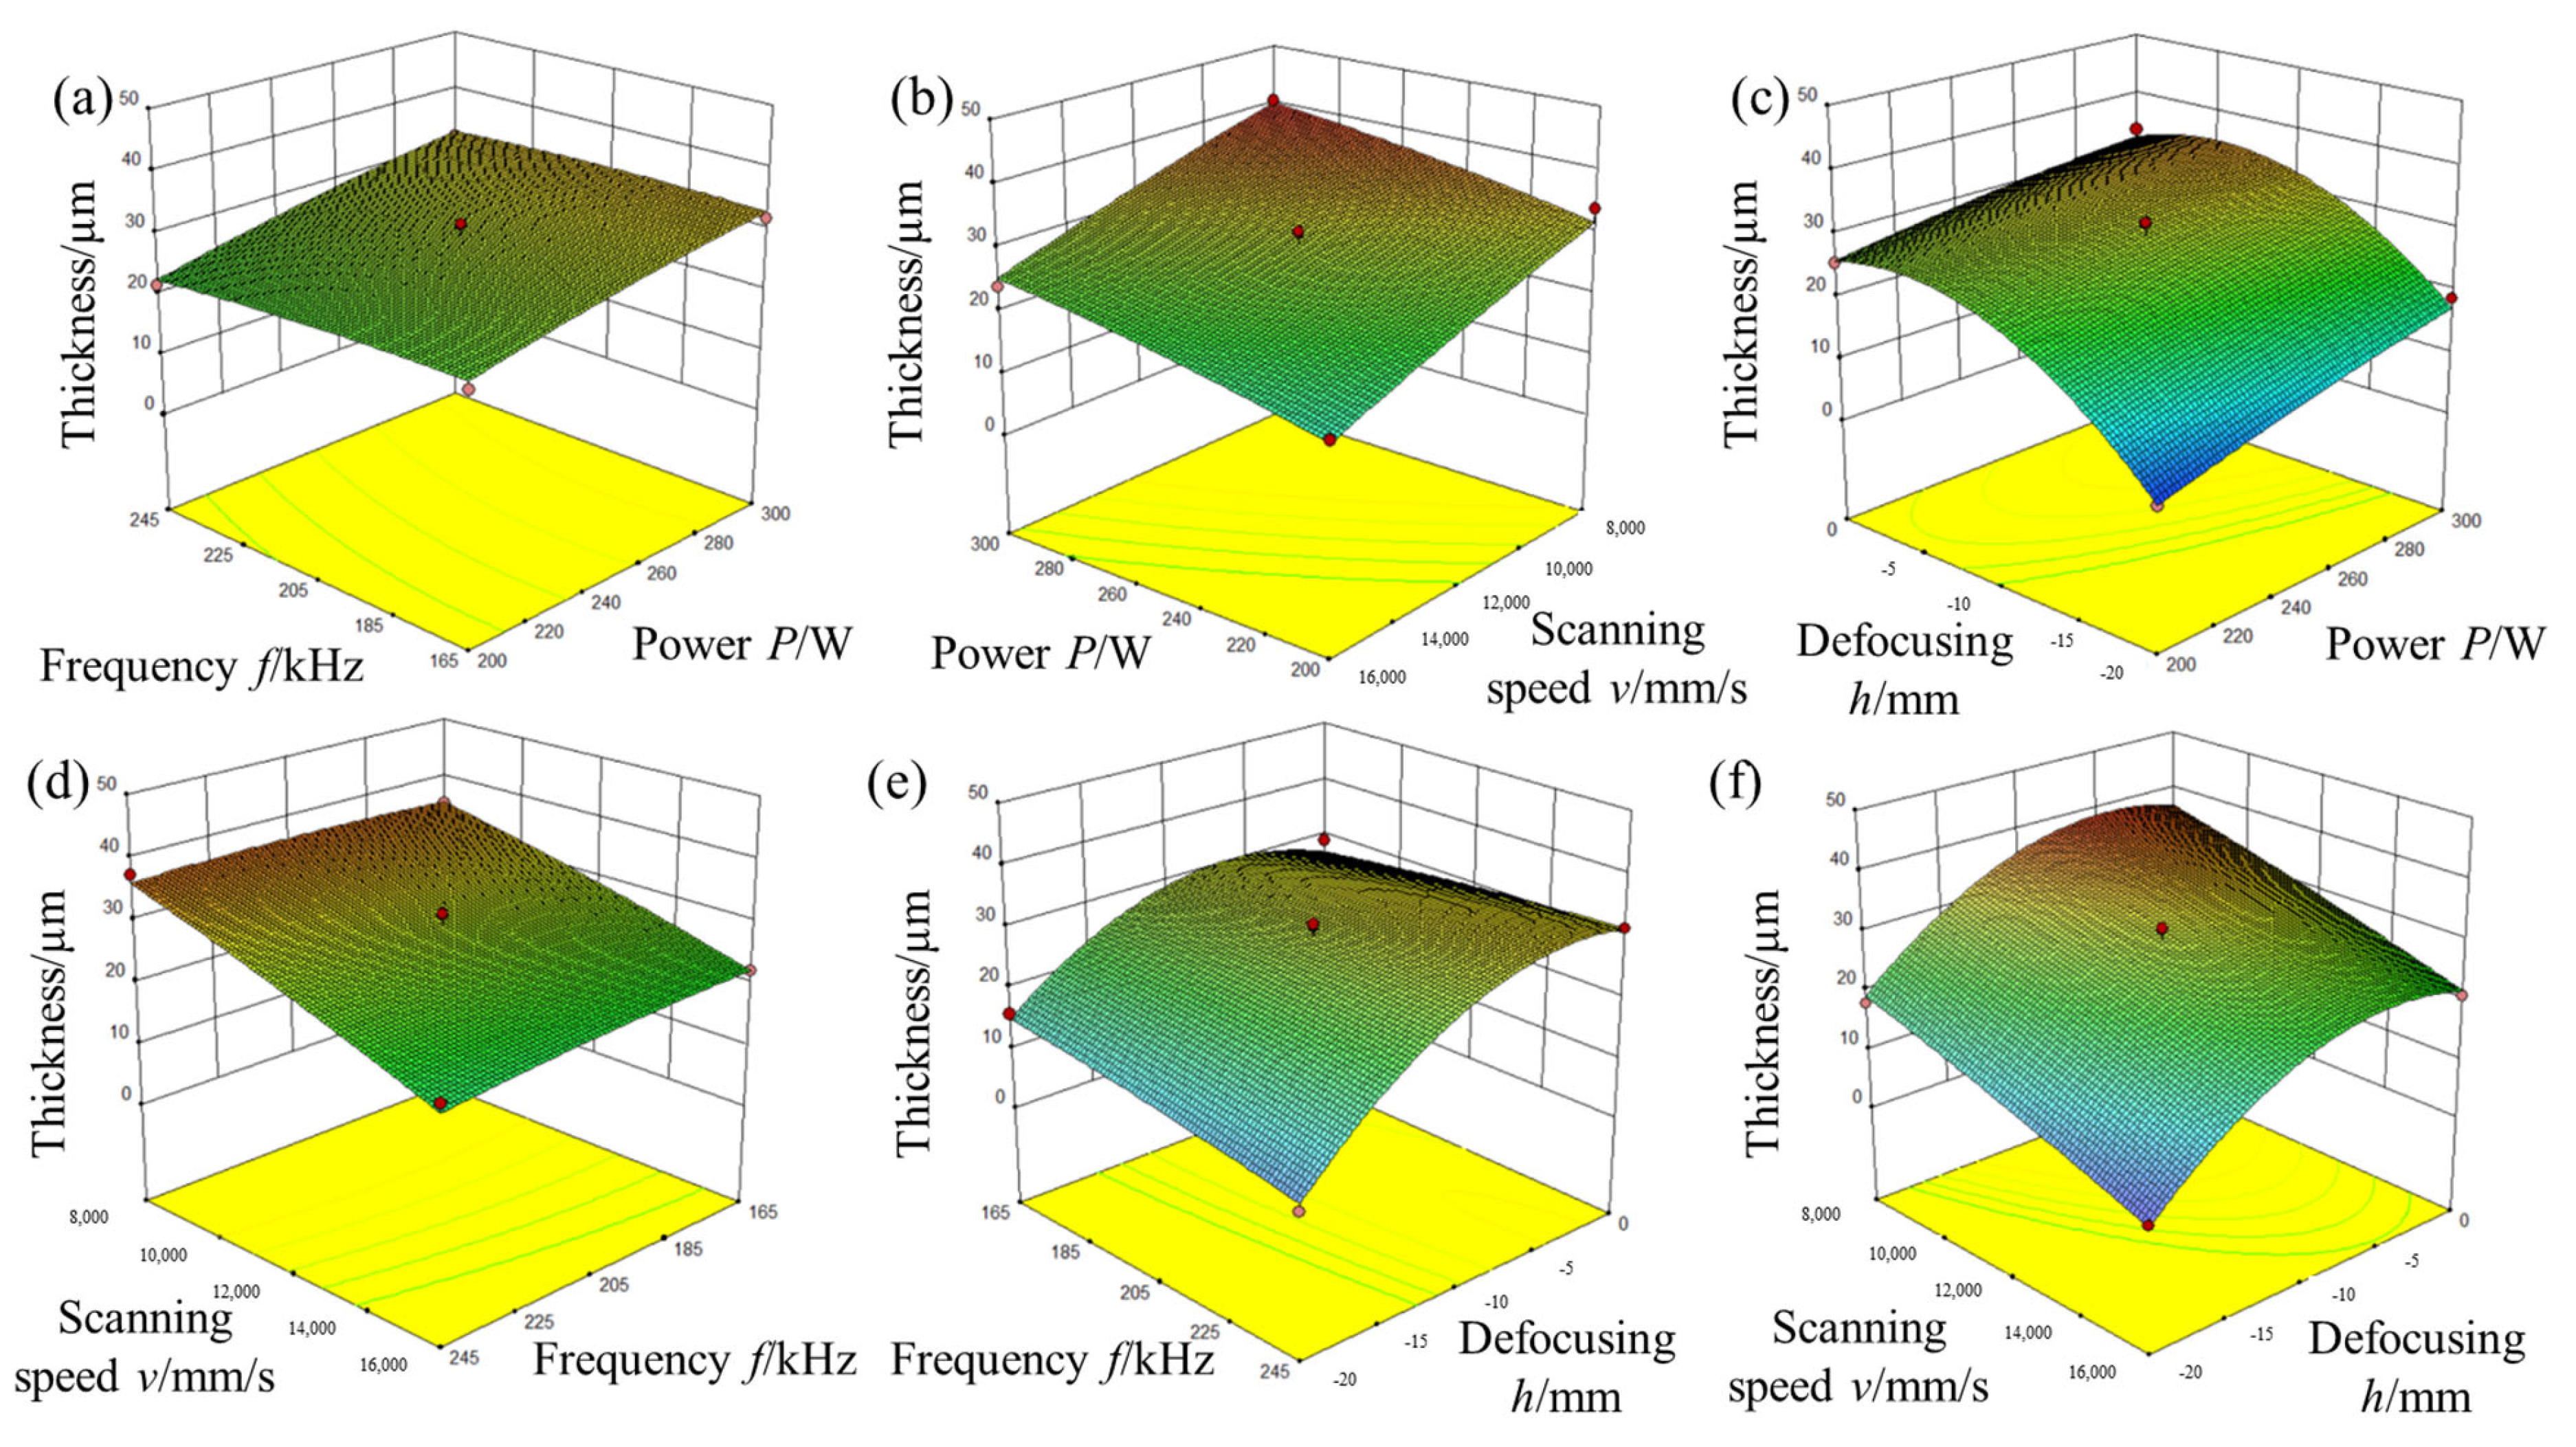
3.2. Influence of Process Parameters on the Amount of Paint Residue

To further investigate the influence of the process parameters of the laser cleaning process and their interaction on the thickness of the paint removal, the influence trends of the process parameters were analyzed using perturbation and response surface diagrams. The perturbation diagram is used to reflect the effect of one process parameter on the thickness of the paint removal and the response surface diagram is the result of the interaction of various process parameters.
Figure 5 shows a perturbation diagram of the thickness of the paint removal, where A is the laser power, B is the repetition frequency, C is the scanning speed, and D is the defocusing amount. As the laser output increases, the laser energy density increases and the energy absorbed by the substrate per square centimeter increases, which results in a stronger ablation and an increase in the thickness of the paint removal. The increase in repetition rate leads to a decrease in energy density and an increase in laser energy superposition per unit area. Therefore, the change in the frequency of repetitions does not have any apparent effect on the thickness of the paint removal. The parameter most influencing the thickness of the paint removal is the scanning speed. As the scanning speed increases, the superposition of the laser energy becomes less efficient and the absorption of the laser per unit area of substrate is reduced. The reduction in thickness of the paint removal thickness decreases accordingly. During the defocusing amount from −20 mm to 0 mm, the thickness of the paint removal increases first and then decreases. If the magnitude of the defocusing amount is 0 mm, the spot is smallest and the −20 mm spot is the largest. The size of the spot affects both the energy density and the spot overlap rate. The energy density of the spot increases as the spot decreases, and the spot overlap rate increases as the spot decreases. Both factors interact with one another. If the spot is approximately −5 mm, the interaction between the two is most significant and the thickness of the paint removal is the greatest.
The effect of the interaction of the different process parameters on the thickness of the paint removal is shown in Figure 6. According to the response surface diagram of the interactions of the process parameters, the thickness of the paint removal is significantly influenced by the interaction between the defocusing amount and repetition frequency, and the defocusing amount and scanning speed. As shown in Figure 6e, if the laser power and scanning speed are constant, the lower frequency of repetition and the lower defocusing amount (close to 0 defocusing amount) will cause the paint layer to absorb more laser energy, leading to a decrease in the thickness of the paint removal. This is because the spot is larger when it is far from the focal point, and the increase in the frequency of the repetition results in a reduction in the energy of the single pulse. Therefore, the thickness of the laser paint removal is reduced. From Figure 6f, it is apparent that the laser power and repetition frequency are constant, i.e., the laser single-pulse energy is constant. The smaller the defocusing amount (close to 0) and the slower the scanning speed, the more the laser energy is absorbed by the paint layer, resulting in a thicker layer of paint being removed. As the defocusing amount increases (away from the focus) and the scanning speed increases, the laser energy is less applied to the surface of the paint layer. The thickness of the laser paint removal is the smallest.

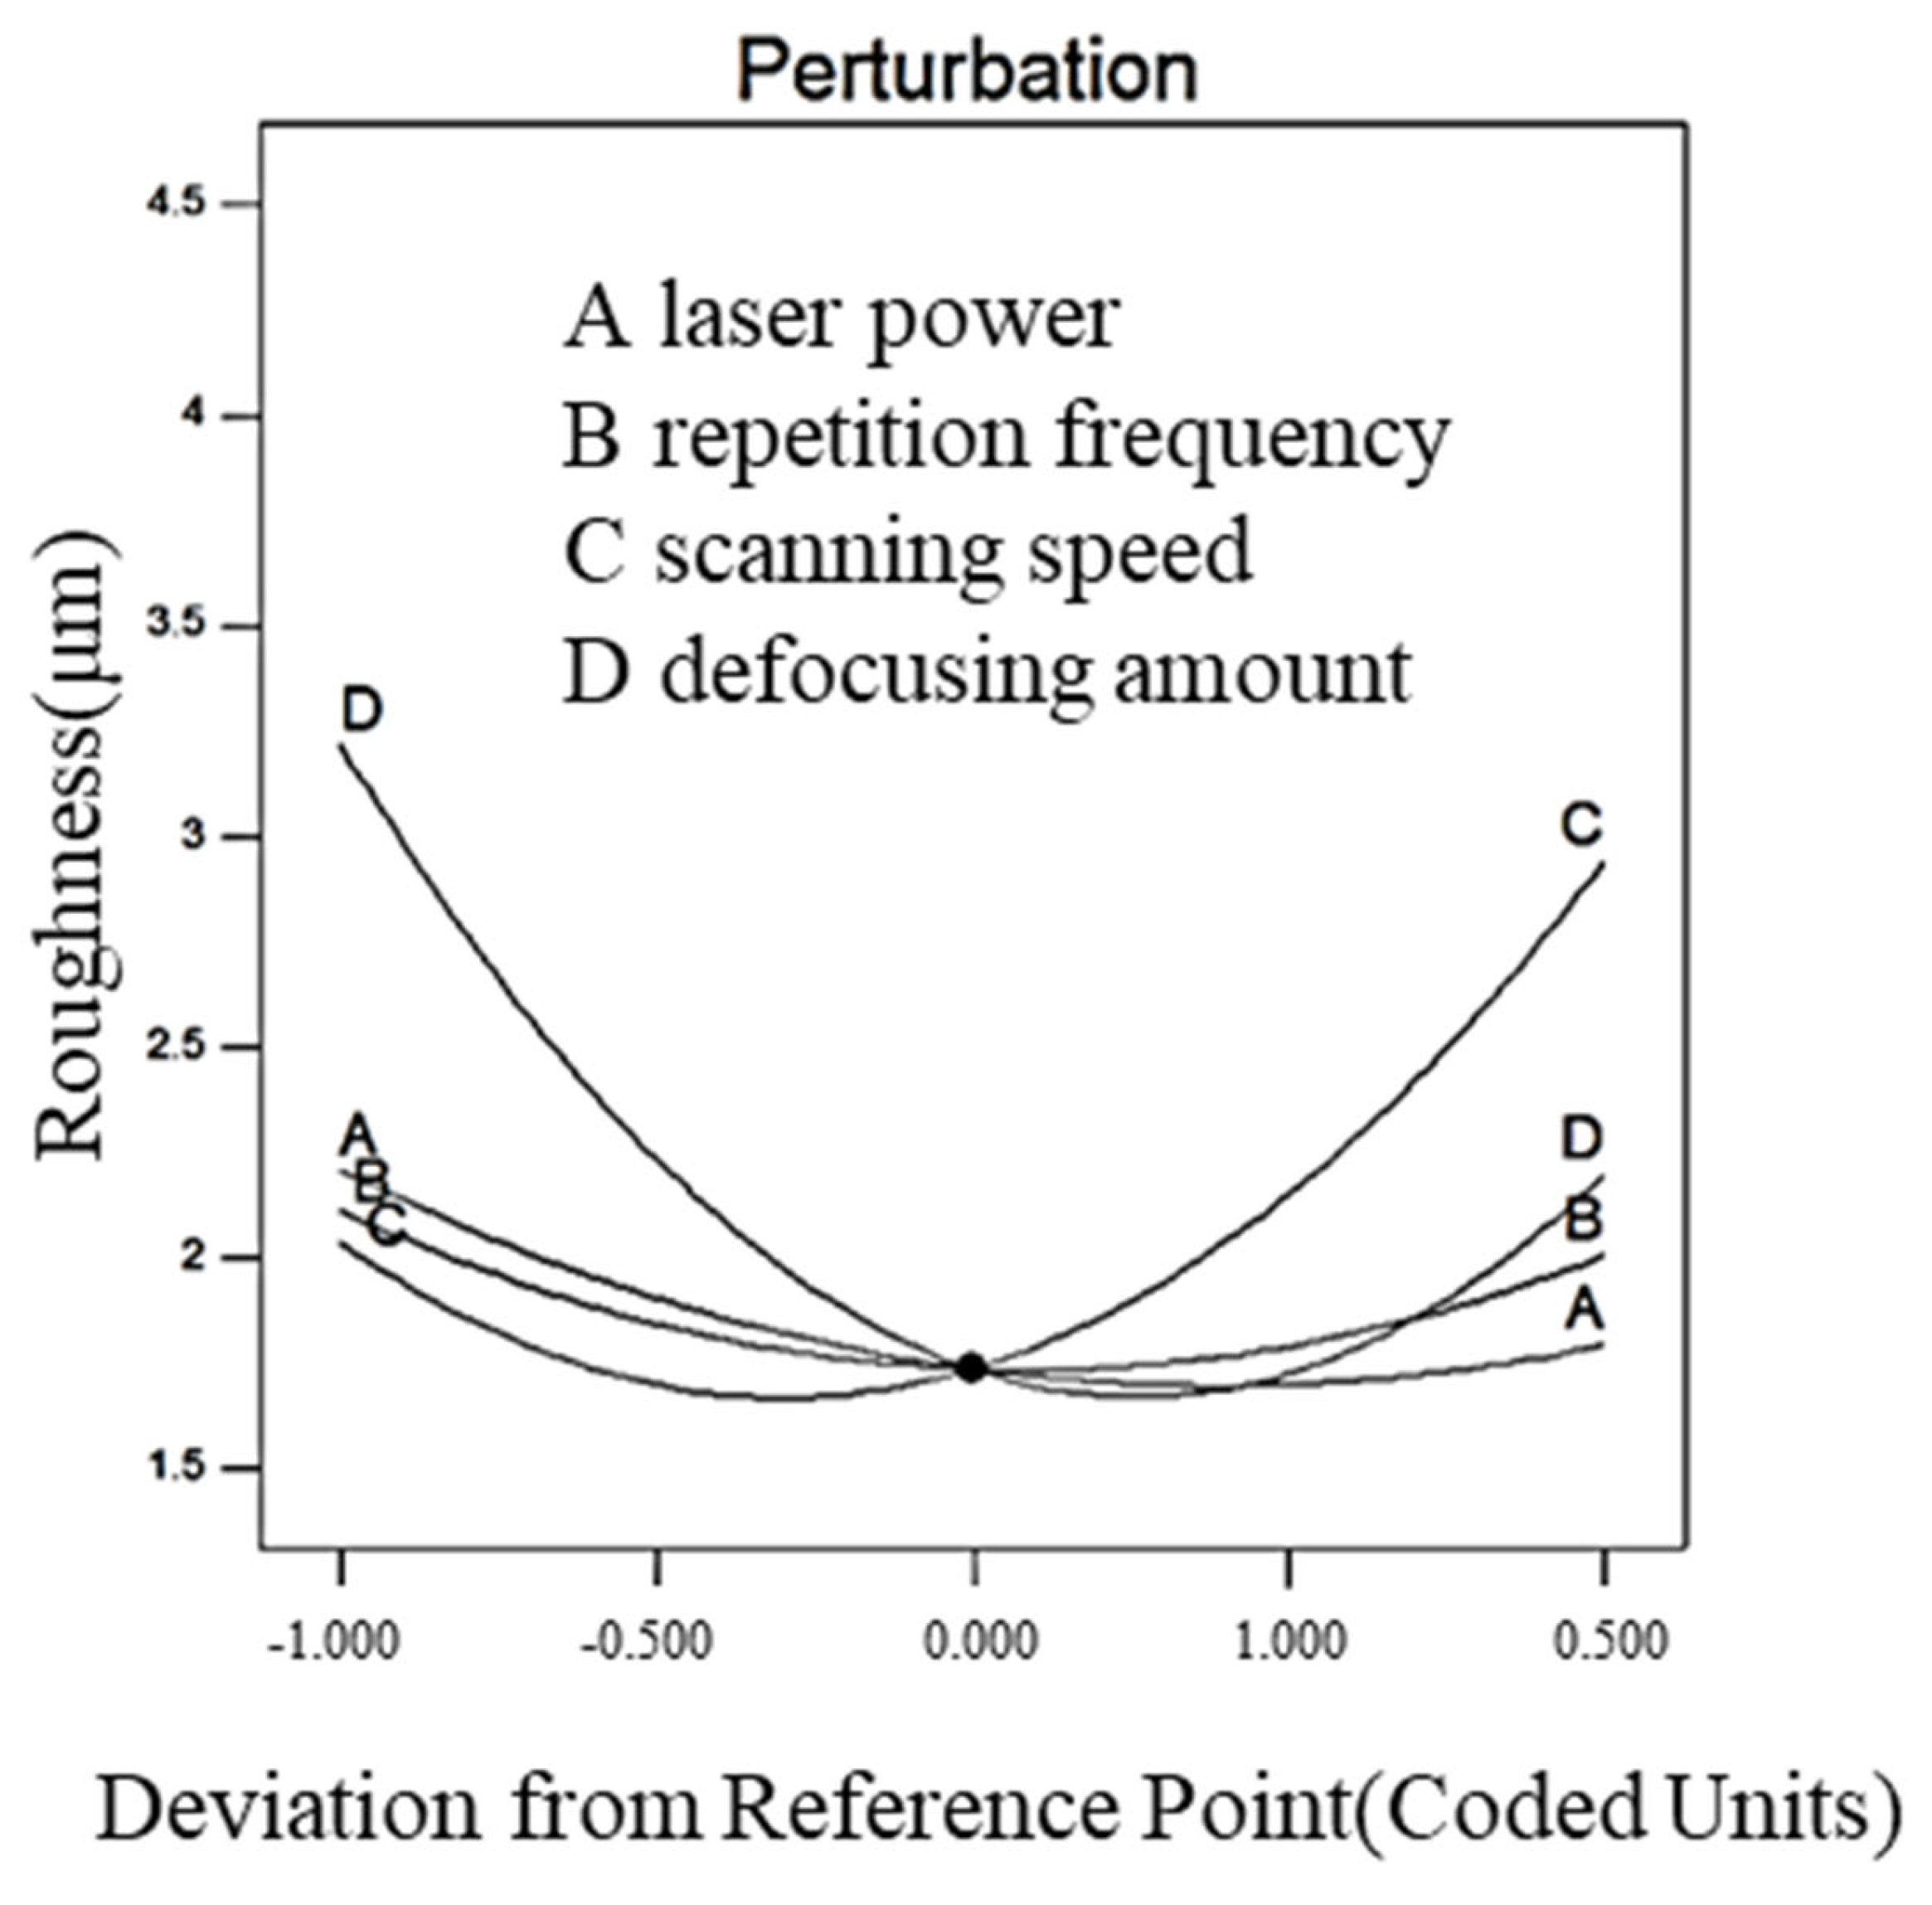
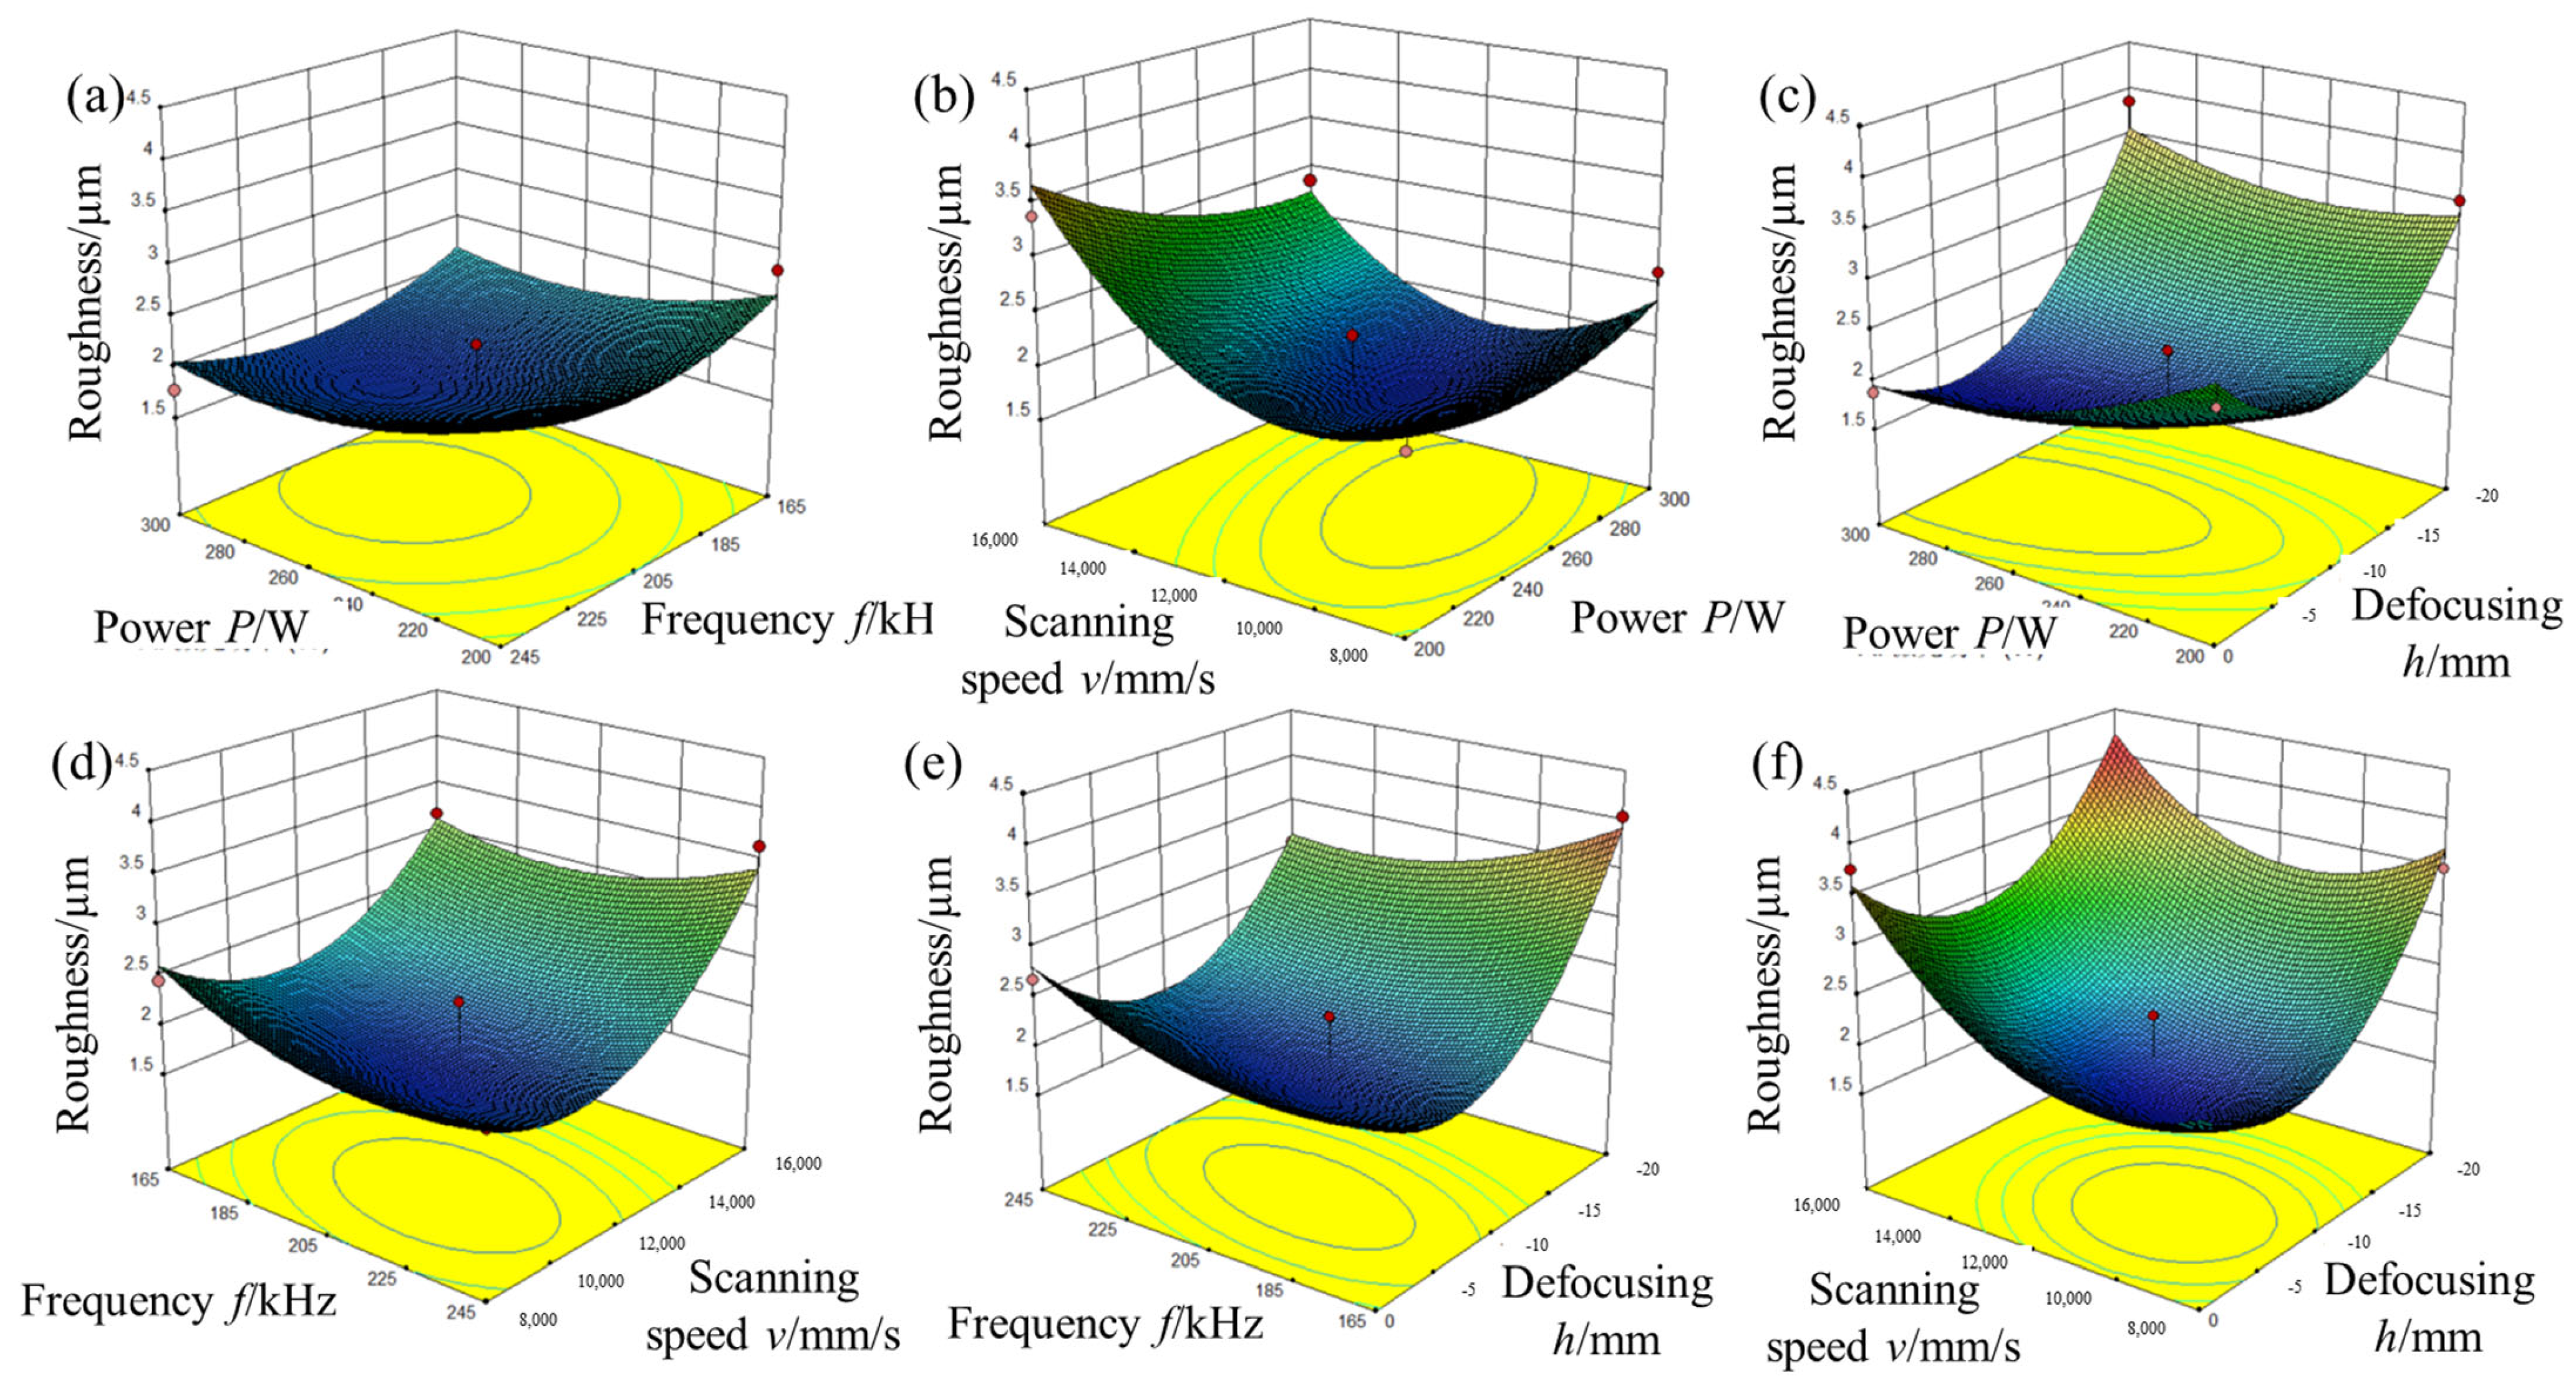
3.3. Effect of Process Parameters on Surface Roughness

In order to further investigate the influence of the laser cleaning process parameters and their interaction on the surface roughness of the paint layer after cleaning, the trends in the influence of the process parameters were analyzed using perturbation and response surface diagrams.
A perturbation diagram of the relationship between the surface roughness and the laser cleaning parameters is shown in Figure 7, where A is the laser power, B is the repetition frequency, C is the scanning speed, and D is the defocusing amount. If other parameters of the laser cleaning process are not changed and only the laser power or repetition frequency is adjusted, the effect on roughness is not apparent. Increasing the laser power and repetition frequency has a major effect on the energy density of the laser. Thus, the change in the energy density has a significant effect on the thickness of laser paint removal but does not have a significant effect on the surface roughness. As the scanning speed increases, the surface roughness of the layer of paint decreases slowly and then rapidly, reaching a maximum value of 10,000 mm/s. Generally, the faster the scanning speed, the rougher the surface layer is. As the defocusing amount approaches 0, the size of the spot decreases. After laser cleaning, the surface roughness of the layer of paint is first reduced rapidly, then slowly increased, with a general downward trend. The bigger the spot, the rougher the surface.
The effects of the interaction of the laser cleaning parameters on surface roughness are shown in Figure 8. According to the response surface diagram of the interaction of the process parameters, the surface roughness after laser cleaning is strongly influenced by the interactions between laser power and defocusing amount, and defocusing amount and repetition frequency. As shown in Figure 8c, when the defocusing amount is −10 mm and the power is about 250 W, the surface roughness is small after laser cleaning. Increased laser power and increased defocusing amount (close to −20 mm) will increase the roughness of the surface of the paint after laser cleaning. As shown in Figure 8e, the roughness is the smallest when the defocusing amount is −10 mm and the repetition frequency is 250 kHz. Higher frequencies of repetition and higher defocusing amounts (close to −20 mm) will result in increased surface roughness.

3.4. Evaluation Method for Laser Paint Removal from Al Alloy and Its Optimization

Based on the above analysis, the prediction results of both models for the thickness of the paint removal and roughness are in accordance with the requirements. Therefore, a double regression model may be used to optimize the laser cleaning quality. The optimization target for the laser cleaning quality of composite paint layers is given in Table 5. The target thickness for paint stripper removal is 30 μm; that is, only the top layer is removed. The goal of surface roughness optimization is a larger value, which results in a larger bonding force when the topcoat is reapplied after the removal of paint.
Using Design-Expert software to determine the optimal combination of process parameters, the optimization objectives encompassed the following: (a) Minimizing the values of both the amount of paint residue and paint deposited after ablation to ensure the cleanliness of the paint removal surface; (b) Attaining a surface roughness closely consistent with the original oxide film’s roughness of 8.49 µm. This alignment ensures that the paint removal surface exhibits a roughness similar to the original oxide film, meeting the requirements of industrial reuse; (c) Maximize paint removal efficiency to simultaneously ensure an effective paint removal and enhance overall efficiency. The optimization criteria and corresponding weights are detailed in Table 5.
The optimization objectives in Table 5 are solved using the Design-Expert software. Optimal parameters for the laser cleaning of composite paint layers with the highest reliability are selected from a number of sets of optimal parameters: laser power P = 291 W, repetition frequency f = 166 kHz, scanning speed v = 8425 mm/s, defocusing amount h = −17 mm, paint removal thickness H = 30 μm, surface roughness Ra = 4.051 um.
To demonstrate the reliability of the optimization results, we performed a follow-up test on laser composite paint removal using the parameters that were optimized. The results of three laser cleaning samples are shown in Figure 9. After the paint is removed, the sample is exposed to the primer, and the surface is light green. The topcoat is basically removed, meaning that the removal of the specified thickness of the composite paint layer is achieved, and the surface has a certain roughness, which is convenient for subsequent coating to increase the adhesion between the topcoat and primer.
The error analysis of the thickness of the paint removal and roughness results is given in Table 6. The table shows that the relative error of thickness is 1.9–3.8 μm and the relative error of roughness is 0.573–0.419 μm.
It was verified that the optimized process parameters take into account the layer cleaning of the composite paint primer and ensure a high surface roughness. There are some errors in the surface coating and there are also some errors in the cleaning process of the laser and in the measurements. Therefore, it is acceptable for there to be some errors between the measured values and the predicted target optimization values. This therefore demonstrates that the response surface method can realize the prediction and optimization of the laser cleaning quality of composite paint.

4. Conclusions

In the present research, a mathematical model focused on the parameters of the laser paint removal process and the thickness and surface roughness of the paint removal was determined using surface response analysis. After a variance analysis and model validation, the proposed model is shown to effectively improve the quality and efficiency of the laser cleaning process of the composite paint layer. Some conclusions may be drawn from this:
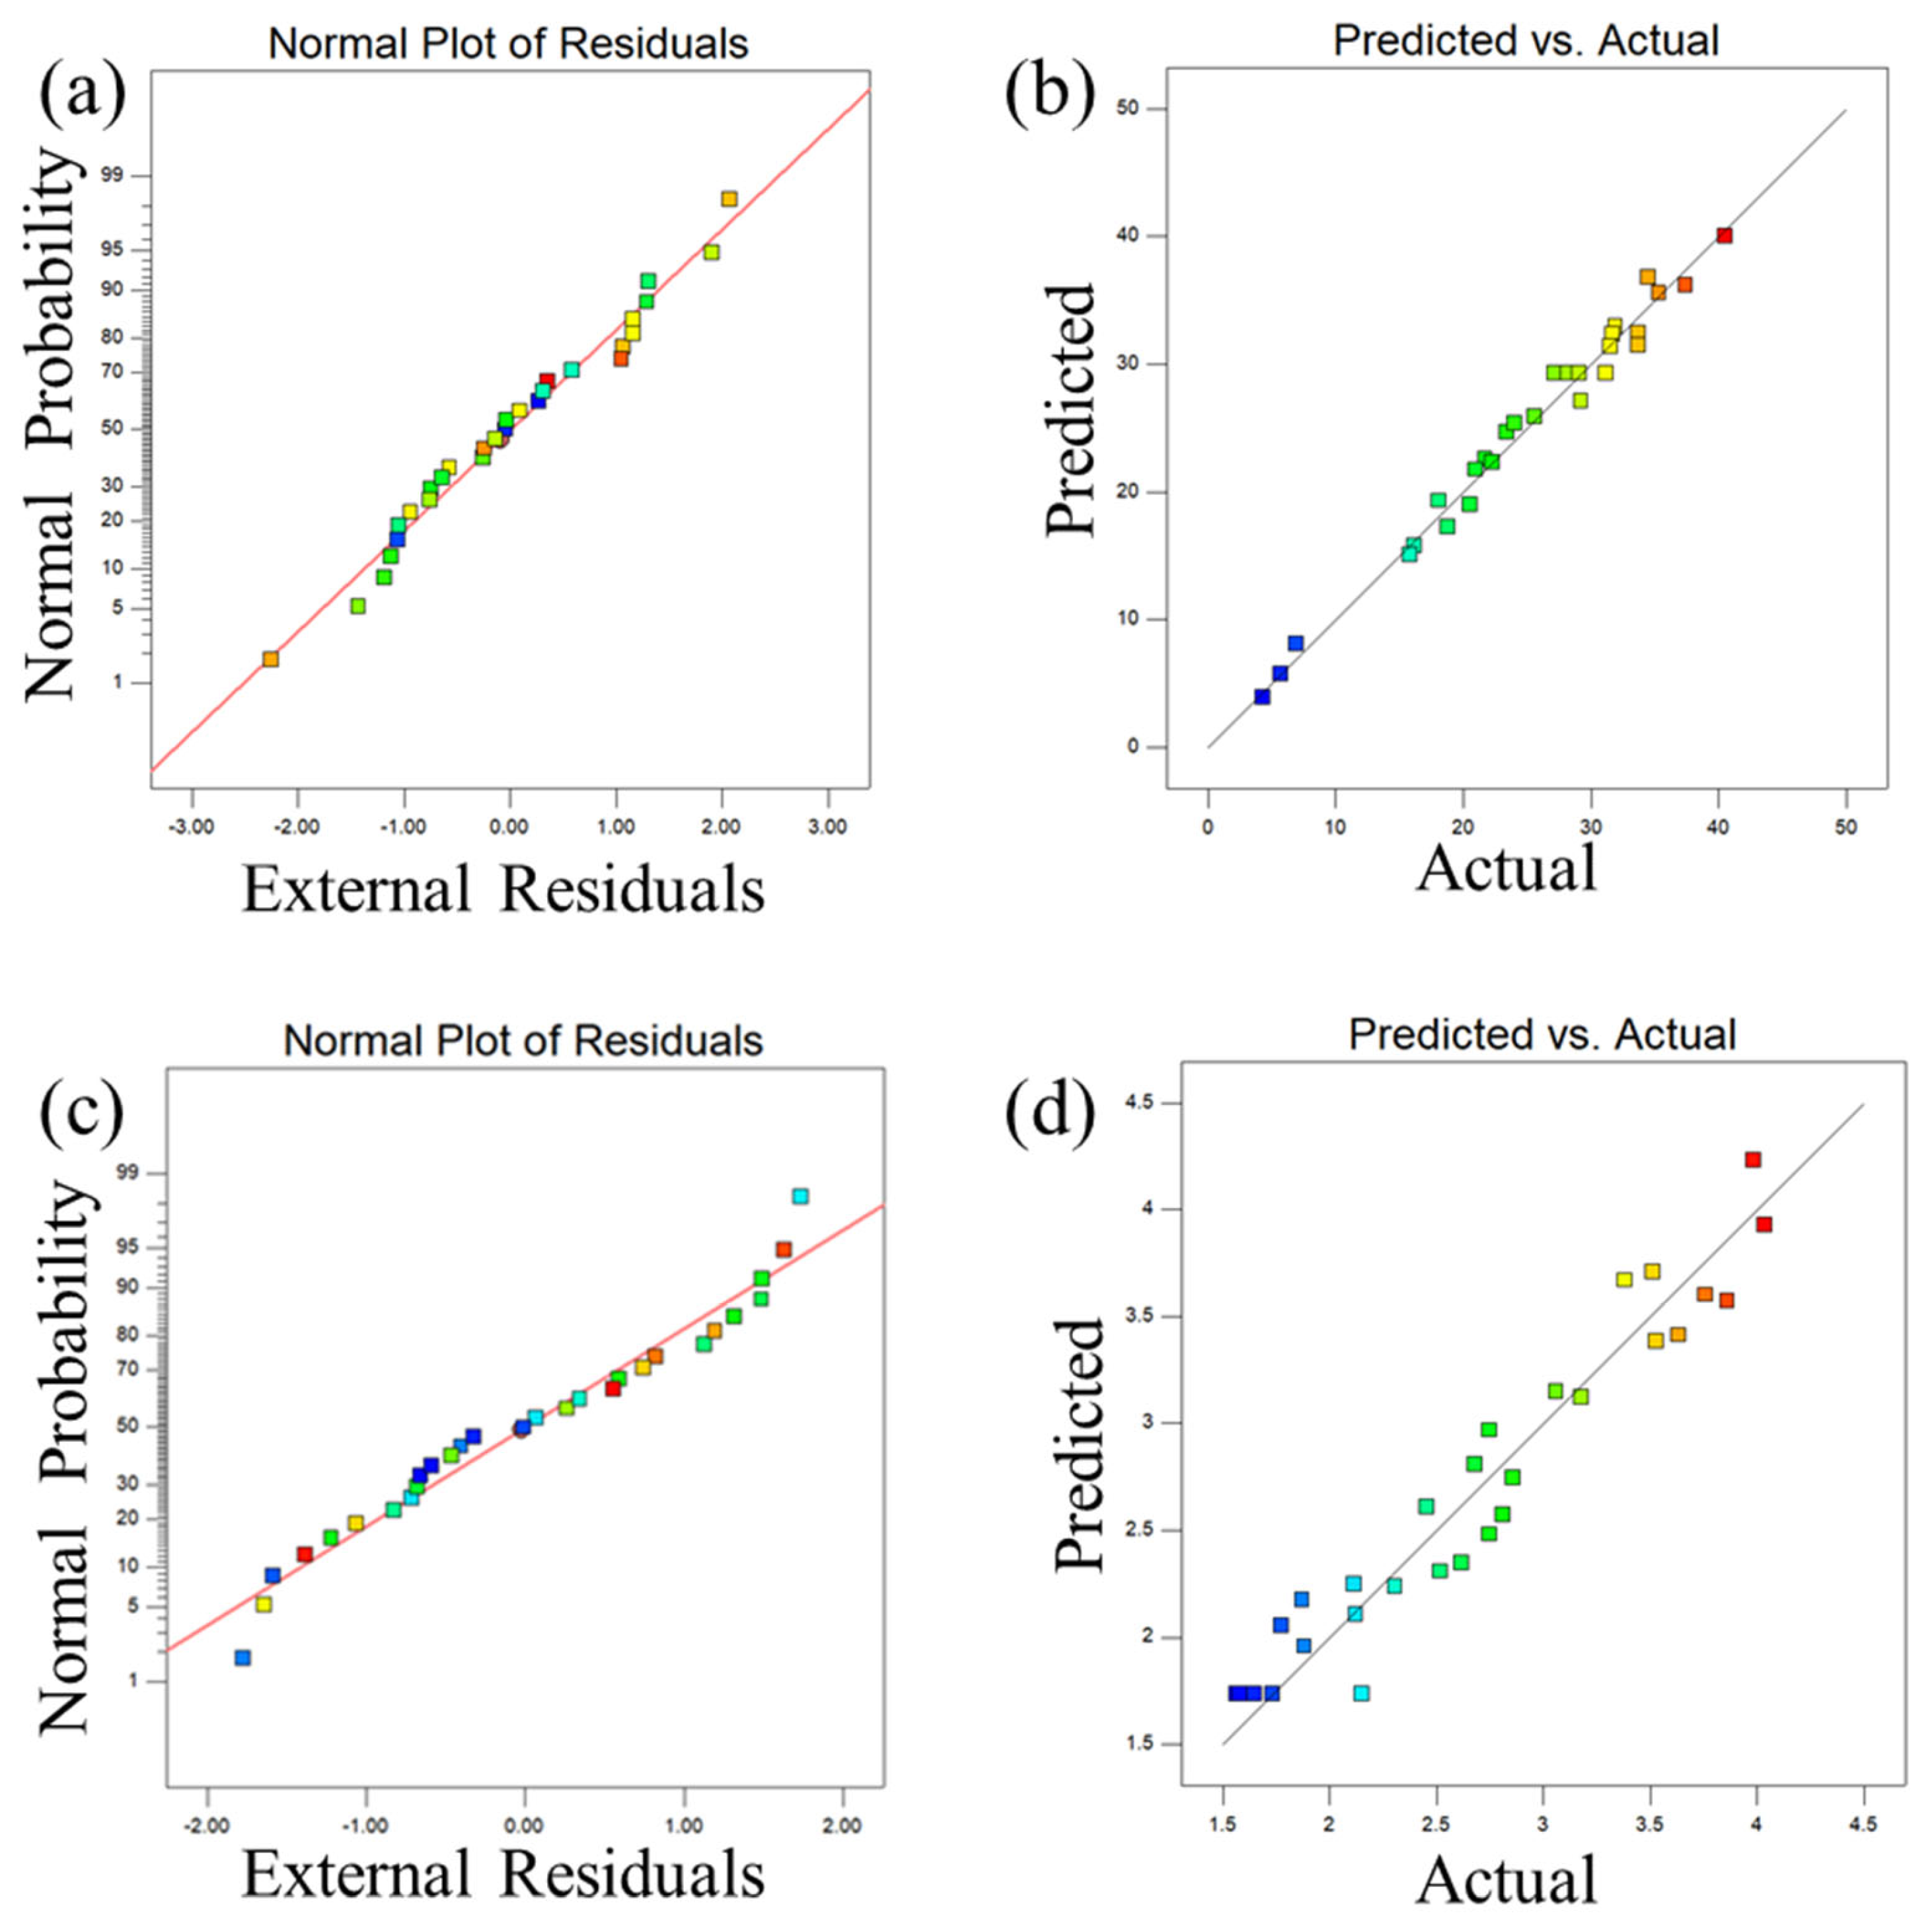
  • Based on the response surface methodology (RSM), a regression prediction model was constructed for the paint layer removal thickness and surface roughness. A model variance analysis showed that both regression models are reliable. This approach can be used for simulating the laser cleaning quality data of composite paint layers.
  • The effects of the parameters of the laser cleaning process and their interaction with the thickness of the laser paint removal and the surface roughness of the paint layer after cleaning were examined. The regression predictor model is analyzed and the order of influence on the thickness of the paint stripper is as follows: defocusing rate > scanning speed > laser power > repeat rate. The order of magnitude of the effect on sharpness is as follows: defocusing amount > scanning speed > laser power > repetition rate.
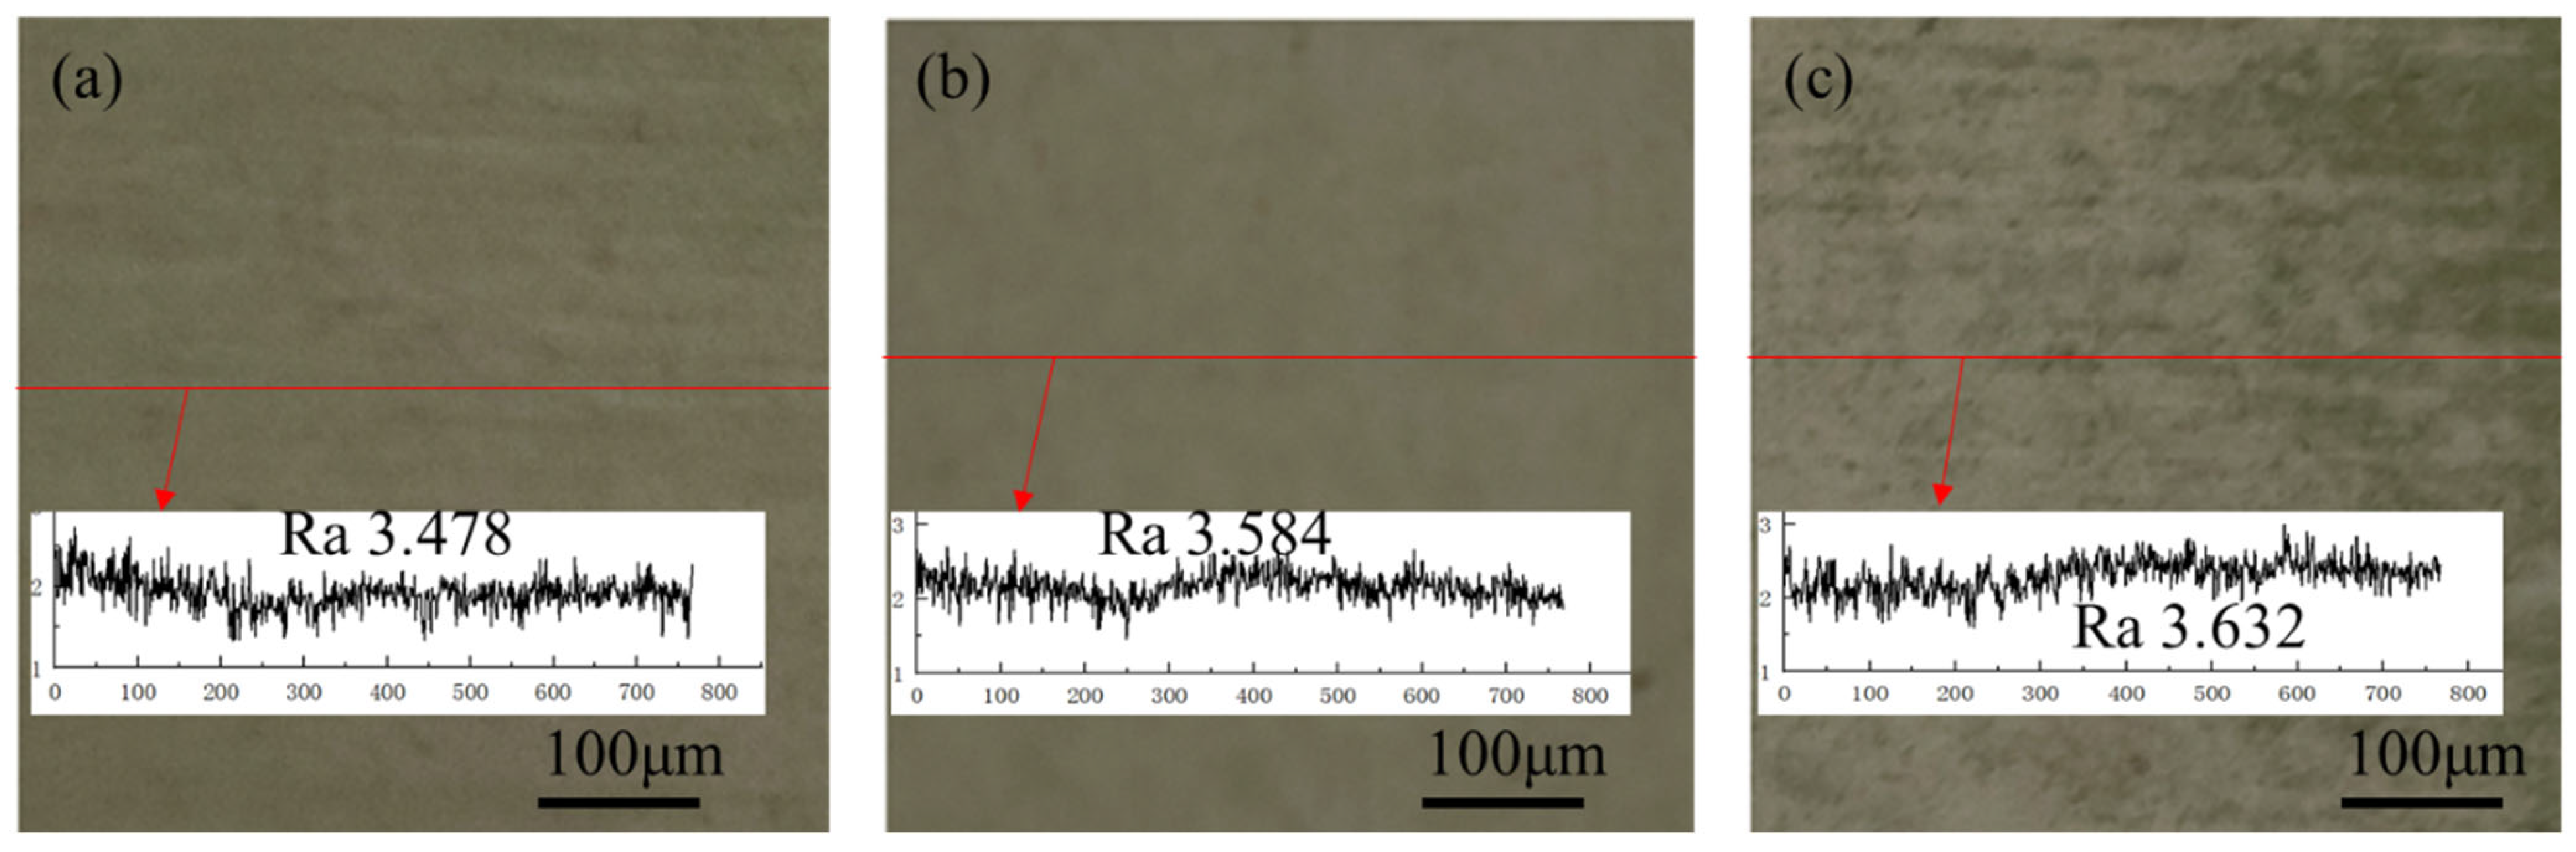
  • To achieve the optimum values of laser paint removal thickness and surface roughness of the paint layer after cleaning, Design-expert software was used to solve the parameters of the laser cleaning process under the optimal target. The parameters for the laser cleaning process that are most reliable were selected: laser power P = 291 W, frequency of repetition f = 166 kHz, scanning speed v = 8425 mm/s, and refractive index h = −17 mm. The optimal parameters of the process were verified via randomization. The relative error for the thickness of the paint stripper is 1.9–3.8 m and the relative error for roughness is −0.573–−0.419 m. This demonstrates that the response surface method can be used to predict and optimize the surface quality of laser paint removal.

Author Contributions

Conceptualization, X.H., methodology, Y.Z., validation, Y.R. and W.G., formal analysis, Y.Z. and Y.R., investigation, X.H. and X.Q., resources, W.G., data curation, Z.X., writing—original draft preparation, X.M., writing—review and editing, Z.X. and W.C., supervision, W.C. and Q.Z., project administration, X.Q., funding acquisition, X.M. and Q.Z. All authors have read and agreed to the published version of the manuscript.

Funding

The authors would like to acknowledge the financial support for this research by National Natural Science Foundation of China (Grant No. 52405381), Taishan Industrial Experts Program (NO. tscy20231268), Shandong Provincial Natural Science Foundation (ZR2024QE535), Major Science and Technology Innovation Projects in Shandong Province (2024CXGC010105) and Jinan ‘20 New Universities’ Funding Project (202333031).

Institutional Review Board Statement

Not applicable.

Informed Consent Statement

Not pplicable.

Data Availability Statement

The original contributions presented in the study are included in the article, further inquiries can be directed to the corresponding author.

Conflicts of Interest

Authors Xinqiang Ma, Yuan Ren and Xiangli Qin were employed by the Shandong Qiangyuan Laser of SDIIT Ltd. and Zibo Xincai lC Co., Ltd. The remaining authors declare that the research was conducted in the absence of any commercial or financial relationships that could be construed as a potential conflict of interest.

References

  1. Yang, H.; Liu, H.; Gao, R.; Liu, X.; Yu, X.; Song, F.; Liu, L. Numerical simulation of paint stripping on CFRP by pulsed laser. Opt. Laser Technol. 2022, 145, 107450. [Google Scholar] [CrossRef]
  2. Xu, Z.; Ouyang, W.; Jiao, J.; Liu, Y.; Gao, X.; Luo, W.; Zhang, W.; Liu, Y. Investigation on repairing 30CrMnSiNi2A steel with laser additive and subtractive hybrid remanufacturing technology. Opt. Lasers Eng. 2023, 160, 107254. [Google Scholar] [CrossRef]
  3. Zhang, T.; Liu, T.; Ban, G.; Zou, J.; Zhang, Z.; Liu, Y.; Zhong, C. Effect of scanning speed on laser cleaning of composite paint layer on aluminum alloy. Opt. Laser Technol. 2024, 171, 110470. [Google Scholar] [CrossRef]
  4. Song, Y.; Wang, S.; Pan, Y.; Li, Z.; Yu, L. Current research status of laser cleaning of carbon fiber reinforced polymers. Mater. Today Commun. 2024, 39, 109312. [Google Scholar] [CrossRef]
  5. Ma, X.; Liu, T.; Ren, Y.; Zhang, Y.; Xu, Z.; Cheng, W.; Zhang, Z.; Zhu, Y.; Zhang, Q. Influence of Different Spot Pattern Lasers on Cleaning Effect of TC4 Titanium Alloy. Materials 2025, 18, 61. [Google Scholar] [CrossRef]
  6. Xu, Z.; Xu, L.; Su, L.; Ouyang, W.; Sun, S.; Cheng, W.; Guo, W.; Ma, X.; Zhang, W.; Jiao, J. Enhancing high-temperature performance of Inconel 718 LDED samples through hybrid laser polishing post-treatment. Virtual Phys. Prototyp. 2024, 19, 2345391. [Google Scholar] [CrossRef]
  7. Xu, Z.; Qin, X.; Liu, X.; Su, L.; Sun, Z.; Li, W.; Ma, X.; Guo, W.; Cheng, W. Effect of surface morphology and microstructure on the corrosion behavior of Inconel 718 superalloy prepared by laser additive and subtractive hybrid manufacturing. Mater. Today Commun. 2025, 44, 112176. [Google Scholar] [CrossRef]
  8. Zhao, Y.; Yang, X.; Lu, Y.; Duan, X. Electrical discharge-mechanical hybrid drilling of micro-holes in carbon fibre-reinforced polymers. Int. J. Mach. Tools Manuf. 2025, 205, 104243. [Google Scholar] [CrossRef]
  9. Zhang, T.; Zou, J.; Liu, T.; Zhao, S.; Zhang, Z. Single-pulse and multi-pulse cleaning mechanism study on laser paint removal of composite paint layer on surface of 2A12 aluminum alloy. Mater. Today Commun. 2025, 45, 112292. [Google Scholar] [CrossRef]
  10. Mateo, M.P.; Ctvrtnickova, T.; Fernandez, E.; Ramos, J.; Yáñez, A.; Nicolas, G. Laser cleaning of varnishes and contaminants on brass. Appl. Surf. Sci. 2009, 255, 5579–5583. [Google Scholar] [CrossRef]
  11. Hu, T.; Qiao, H.; Lu, Y. Effects of Laser De-painting on Microstructure and Properties of Ti17 Alloy. Surf. Technol. 2018, 47, 7–12. [Google Scholar]
  12. Jasim, H.; Demir, A.; Previtali, B.; Taha, Z.A. Process development and monitoring in stripping of a highly transparent polymeric paint with ns-pulsed fiber laser. Opt. Laser Technol. 2017, 93, 60–66. [Google Scholar] [CrossRef]
  13. Brygo, F.; Dutouquet, C.; Le Guern, F.; Oltra, R.; Semerok, A.; Weulersse, J. Laser fluence, repetition rate and pulse duration effects on paint ablation. Appl. Surf. Sci. 2006, 252, 2131–2138. [Google Scholar] [CrossRef]
  14. Razab, M.; Jaafar, M.; Abdullah, N.; Amin, M.F.M.; Mohamed, M. Influence of elemental compositions in laser cleaning for automotive coating systems. J. Russ. Laser Res. 2016, 37, 197–206. [Google Scholar] [CrossRef]
  15. Shi, S.; Du, P.; Li, W.; Song, F.; Wang, C.; Chen, N. Research on Paint Removal with 1064 nm Quasi-Continuous-Wave Laser. Chin. J. Lasers 2012, 39, 63–69. [Google Scholar]
  16. Li, X.; Huang, T.; Chong, A.W.; Zhou, R.; Choo, Y.S.; Hong, M. Laser cleaning of steel structure surface for paint removal and repaint adhesion. Opto-Electron. Eng. 2017, 44, 340–344. [Google Scholar]
  17. Yang, J.; Zhou, J.; Sun, Q.; Meng, X.; Zhu, M.; Guo, Z.; Fu, Q. Laser Paint Removal Process Parameter Optimization via Response Surface Methodology. Laser Optoelectron. Prog. 2019, 56, 190–197. [Google Scholar]
  18. Ding, H.; Dai, Z.; Ding, J.; Xu, J. Multi-objective optimization of laser cleaning quality based on response surface and genetic algorithm. Laser Optoelectron. Prog. 2022, 1–13. Available online: http://kns.cnki.net/kcms/detail/31.1690.tn.20220713.1645.454.html (accessed on 22 May 2025).
  19. Yang, W.; Lin, D.; Zhong, M.; Li, S.; Qian, Z.; Liu, G.; Cao, Y.; Xu, X.; Zhang, Z.; Li, G. Controllability of Laser Removal of Aircraft Skin Paint Layer Based on Response Surface Analysis. Laser Optoelectron. Prog. 2023, 60, 241–248. [Google Scholar]
  20. Sun, X.; Zhang, Z.; Yang, H. Optimization of Laser Cleaning Process Parameters for Petroleum Pipe Threads Based on Response Surface Method and Particle Swarm Algorithm. Chin. J. Lasers 2022, 49, 40–52. [Google Scholar]
  21. Liu, W.; Zhao, Z.; Li, Q.; Wang, M.; Bian, H.; Zhang, D. Laser cleaning Technology of 2A12 Aluminum Alloy Composite Paint Layer. Chin. J. Lasers 2022, 49, 140–150. [Google Scholar]
  22. Zhang, Z.; Du, R.; Li, C.; Zhang, T.; Liu, H.; Wu, D. Optimizing laser cleaning quality for composite paint layer on aluminum alloy surface using response surface methodology. Opt. Laser Technol. 2025, 183, 112386. [Google Scholar] [CrossRef]
  23. Wang, G.; Deng, J.; Lei, J.; Tang, W.; Zhou, W.; Lei, Z. Multi Objective Optimization of Laser Cleaning Quality of Q390 Steel Rust Layer Based on Response Surface Methodology and NSGA-II Algorithm. Materials 2024, 17, 3109. [Google Scholar] [CrossRef] [PubMed]
  24. Zhang, W.; Huang, Z.; Kang, M.; Shi, M.; Deng, R.; Yan, Y.; Zhu, Q. Research on multivariate nonlinear regression model of specific energy of rock with laser drilling based on response surface methodology. Opt. Commun. 2021, 489, 126865. [Google Scholar] [CrossRef]
Figure 1. (a) Laser paint removal sample; (b) cross-section diagram of the sample.
Coatings 15 00647 g001
Figure 2. (a) The composite-paint-layer laser cleaning system. (b) Schematic diagram of composite-paint-layer laser cleaning. (c) Laser cleaning path diagram. (d) Defocusing amount definition diagram.
Coatings 15 00647 g002
Figure 3. Surface topography of composite-paint-layer samples of numbers 1–29 after laser cleaning.
Coatings 15 00647 g003
Figure 4. (a) Residual normal distribution of the laser paint removal thickness regression model. (b) Comparison of the predicted value with the actual laser paint removal thickness. (c) Residual normal distribution of the roughness regression model. (d) Comparison of the predicted value with the actual roughness.
Coatings 15 00647 g004
Figure 5. Perturbation diagram of the relationship between the thickness of the laser paint removal and the parameters.
Coatings 15 00647 g005
Figure 6. Effects of the interaction of the parameters of the laser cleaning process on the thickness of paint removal: (a) frequency vs. power, (b) power vs. scanning speed, (c) defocusing vs. power, (d) scanning speed vs. frequency, (e) frequency vs. defocusing, (f) scanning speed vs. defocusing.
Coatings 15 00647 g006
Figure 7. Perturbation diagram of the relationship between surface roughness and laser cleaning parameters.
Coatings 15 00647 g007
Figure 8. Effects of the interaction of the parameters of the laser cleaning process on the surface roughness: (a) power vs. frequency, (b) scanning speed vs. power, (c) power vs. defocusing, (d) frequency vs. scanning speed, (e) frequency vs. defocusing, (f) scanning speed vs. defocusing.
Coatings 15 00647 g008
Figure 9. Surface morphology after paint removal after optimization (a) Sample 1, (b) Sample 2, (c) Sample 3.
Coatings 15 00647 g009
Table 1. The main parameters of the laser.
SymbolParameterValueUnit
λLaser wavelength1060nm
DSpot diameter100μm
PLaser power0–300W
fRepetition frequency0–300kHz
nPulse width70ns
vScanning speed0–20,000mm/s
Table 2. BBD experiment factors and level design.
Horizontal Coding of Each Factor/FactorLevel
Low (−1)Medium (0)High (1)
Laser power P/W200250300
Repetition frequency f/kHz165205245
Scanning speed v/mm/s800012,00016,000
Defocusing h/mm−20−100
Table 3. Experimental design matrix and experimental results.
NoProcess ParametersResult
P/Wf/kHzv/mm/sh/mmH/µmRa/µm
125020512,000−1031.21.563
225020512,000−1029.11.650
325024516,000−1020.53.631
430020516,000−1024.02.859
530024512,000−1031.71.776
625024512,000031.52.680
725020516,000021.03.756
820020512,000025.62.746
925016512,000029.22.305
1025016516,000−1022.33.175
1125016512,000−2015.84.035
122502058000−2018.13.511
1330020512,000−2018.83.859
142002058000−1033.72.113
1525020512,000−1031.21.733
1620016512,000−1023.42.811
1725020512,000−1027.12.153
1820024512,000−1021.72.748
1925020516,000−204.33.984
2025024512,000−206.93.059
2120020516,000−1016.23.382
222501658000−1035.32.455
232502058000034.52.517
2420020512,000−205.73.525
253002058000−1040.52.615
262502458000−1037.42.122
2730016512,000−1031.91.871
2830020512,000033.71.882
2925020512,000−1028.11.581
Table 4. Response values of the ANOVA.
Variance SourceResponse Value
Paint Layer Removal ThicknessRoughness
F-Valuep-ValueF-Valuep-Value
Model51.85<0.000113.66<0.0001
x174.64<0.00016.110.0269
x21.70.21310.410.5335
x3210.54<0.000129.97<0.0001
x4283.88<0.000137.33<0.0001
x1x20.170.68563.095 × 10−30.9564
x1x30.0760.78693.180.0965
x1x41.90.18994.340.0561
x2x31.160.30071.880.1918
x2x49.530.0085.520.034
x3x40.0068350.93531.770.2042
x120.780.39275.420.0354
x220.580.46048.190.0126
x320.520.48144.65<0.0001
x42137.48<0.000174.09<0.0001
Lack of Fit0.960.56591.570.3523
R20.98110.9318
Adjusted R20.96220.8636
Predicted R20.91430.6654
Adeq Precision27.66512.071
Table 5. Optimization criteria and weights.
Technical ParameterGoalParameterWeight
Laser power P/WIn range200~3001
Repetition frequency f/kHzIn range165~2451
Scanning speed v/mm/sIn range8000~16,0001
Defocusing h/mmIn range−20~01
Paint layer removal thickness H/μmTarget301
Surface roughness Ra/μmMaximizeMax1
Table 6. Error analysis of paint removal thickness and roughness test results.
SamplePaint Layer Removal Thickness HSurface Roughness Ra
OptimalActualRelative ErrorOptimalActualRelative Error
130 μm32.6 ± 1.2 μm2.6 μm4.051 μm3.478 ± 0.53 μm−0.573 μm
230 μm31.9 ± 2.4 μm1.9 μm4.051 μm3.584 ± 0.75 μm−0.467 μm
330 μm33.8 ± 0.8 μm3.8 μm4.051 μm3.632 ± 0.35 μm−0.419 μm
Disclaimer/Publisher’s Note: The statements, opinions and data contained in all publications are solely those of the individual author(s) and contributor(s) and not of MDPI and/or the editor(s). MDPI and/or the editor(s) disclaim responsibility for any injury to people or property resulting from any ideas, methods, instructions or products referred to in the content.

