Article

Steel-Reinforced Concrete Corrosion Crack Detection Method Based on Improved VGG16

1
School of Civil and Hydraulic Engineering, Bengbu University, Bengbu 233030, China
2
School of Management Science and Engineering, Anhui University of Finance and Economics, Bengbu 233030, China
*
Author to whom correspondence should be addressed.
Coatings 2025, 15(6), 641; https://doi.org/10.3390/coatings15060641
Submission received: 11 April 2025 / Revised: 19 May 2025 / Accepted: 20 May 2025 / Published: 26 May 2025

Abstract

:
With the rapid development of urban construction, the demand for safety monitoring of reinforced concrete structures has been increasing. However, current crack detection methods still struggle with limited accuracy, poor real-time performance, and difficulty recognizing extremely small or low-contrast cracks in complex environments. To address these challenges, this study proposes a new method that combines the improved Visual Geometry Group Network 16, U-Net, and You Only Look Once target detection technologies. A new model for detecting concrete corrosion cracks has been developed based on this method. After 100 training epochs, the model achieved a precision of 94.4% and a loss rate of 2.6%, with an average Intersection over Union exceeding 85.0%. In high-roughness field tests, the proposed model achieved a crack width detection error of ±4.0 mm. For cracks that were soil-covered or partially occluded, the detection errors were ±5.4 mm and ±5.1 mm, respectively. Based on the original model, two additional lightweight variants were constructed, with the inference speeds of the three models recorded as 36 ms, 28 ms, and 24 ms in descending order. The results demonstrate that the proposed detection model offers an efficient and intelligent solution for structural health monitoring, with strong potential for engineering applications and urban infrastructure renewal. However, the model still presents a risk of misclassification when identifying fine cracks under low-contrast or complex background conditions. Future work will incorporate adaptive image enhancement and more refined feature extraction algorithms to further improve detection robustness and real-time performance.

1. Introduction

The widespread use of steel-reinforced concrete structures has increased the demands for structural health monitoring, making efficient and accurate corrosion crack detection a critical challenge. In practical engineering, the detection of corrosion-induced cracks in reinforced concrete typically relies on traditional techniques such as ultrasonic pulse velocity, impact echo, digital image processing, and manual visual inspection [1]. For example, Kuchipudi et al. proposed an ultrasonic shear wave imaging method for detecting and grading corrosion damage, applying k-means clustering to classify corrosion severity based on image amplitude [2]. Crognale et al. compared various image processing-based damage identification techniques, including Otsu thresholding, Markov random field segmentation, RGB color detection, and k-means clustering algorithms [3]. While digital image-based methods are widely used in industrial environments due to their ease of deployment and relatively low cost, they still fail to meet engineering standards such as ASTM C823-21, ASTM C1583, and RILEM TC187-SOC under challenging conditions like lighting variation, surface contamination, and diverse crack scales [4,5]. In recent years, deep learning techniques have rapidly advanced the field of structural health monitoring, with convolutional neural networks, attention mechanisms, and generative adversarial networks achieving notable results in feature extraction, object localization, and anomaly identification [6]. Both eliminating manual inspection and annotation and achieving end-to-end automation, from data acquisition to real-time alerting, have become a key goal to reduce costs, avoid high-altitude risks, and ensure routine monitoring of large-scale structures [7]. Industry standards likewise emphasize the importance of automation in increasing inspection frequency and data traceability, while deep learning-driven end-to-end models serve as the technological cornerstone for realizing this closed-loop automation. In this context, real-time crack detection is not only one of the core objectives of this study, but also a key means of transforming structural monitoring systems’ outputs from reactive responses to proactive warnings. The goal of real-time detection is to leverage the model’s fast inference capability to continuously track crack formation and respond instantly, thereby meeting the real-world demands for high-frequency monitoring on engineering sites.
Among deep learning architectures, the improved Visual Geometry Group Network 16 (VGG16) has been widely adopted as a backbone for feature extraction due to its strong representation capacity. For instance, Rehman et al. proposed a hybrid model combining sequential VGG16 and convolutional neural networks to diagnose knee osteoarthritis, achieving over 93% accuracy on training, validation, and testing datasets [8]. Guo et al. addressed the challenge of low river extraction accuracy in remote sensing images by using VGG16 and ResNet-50 as feature extractors in a dual-branch fusion model comprising scale-level and semantic-level outputs [9]. However, existing models still struggle with multi-scale crack detection, real-time inference, and preserving edge details, prompting further exploration of technical enhancements. In urban infrastructure applications, Koh et al. developed an automated sidewalk crack detection framework, demonstrating robustness on a dataset of 8000 real-world images [10]. Luo et al. proposed a method that combines adaptive Canny edge detection and semantic segmentation, achieving over 6.5% improvement in mean Intersection over Union (mIoU) compared to single algorithms on the CRACK500 dataset [11]. To address real-time requirements, Mishra’s weakly supervised method and Li’s lightweight embedded U-Net showed promising results when monitoring concrete bridge and pavement cracks, with the latter achieving an mIoU of 79.38% [12,13]. Existing research shows that VGG16 offers a good balance between representational power and scalability, whereas VGG19, with its additional convolutional and fully connected layers, imposes significantly higher computational overhead and slower convergence in industrial deployment. U-Net, on the other hand, excels in enhancing pixel-level segmentation of crack regions [14], while the YOLO (You Only Look Once) framework achieves real-time object localization through a single forward pass, thus offering advantages in detection speed and robustness [15].
Therefore, this study proposes an integrated model—UY-VGG16—that combines improved VGG16, U-Net, and YOLO architectures. The model is designed to achieve precise segmentation and real-time localization of corrosion cracks, aiming to overcome the limitations of existing detection technologies in complex environments. Through its multi-scale feature fusion and enhanced real-time capabilities, UY-VGG16 provides an accurate, efficient, and multi-technology collaborative solution for structural health monitoring.

2. Steel-Reinforced Concrete Corrosion Crack Detection Model Based on Improved VGG16

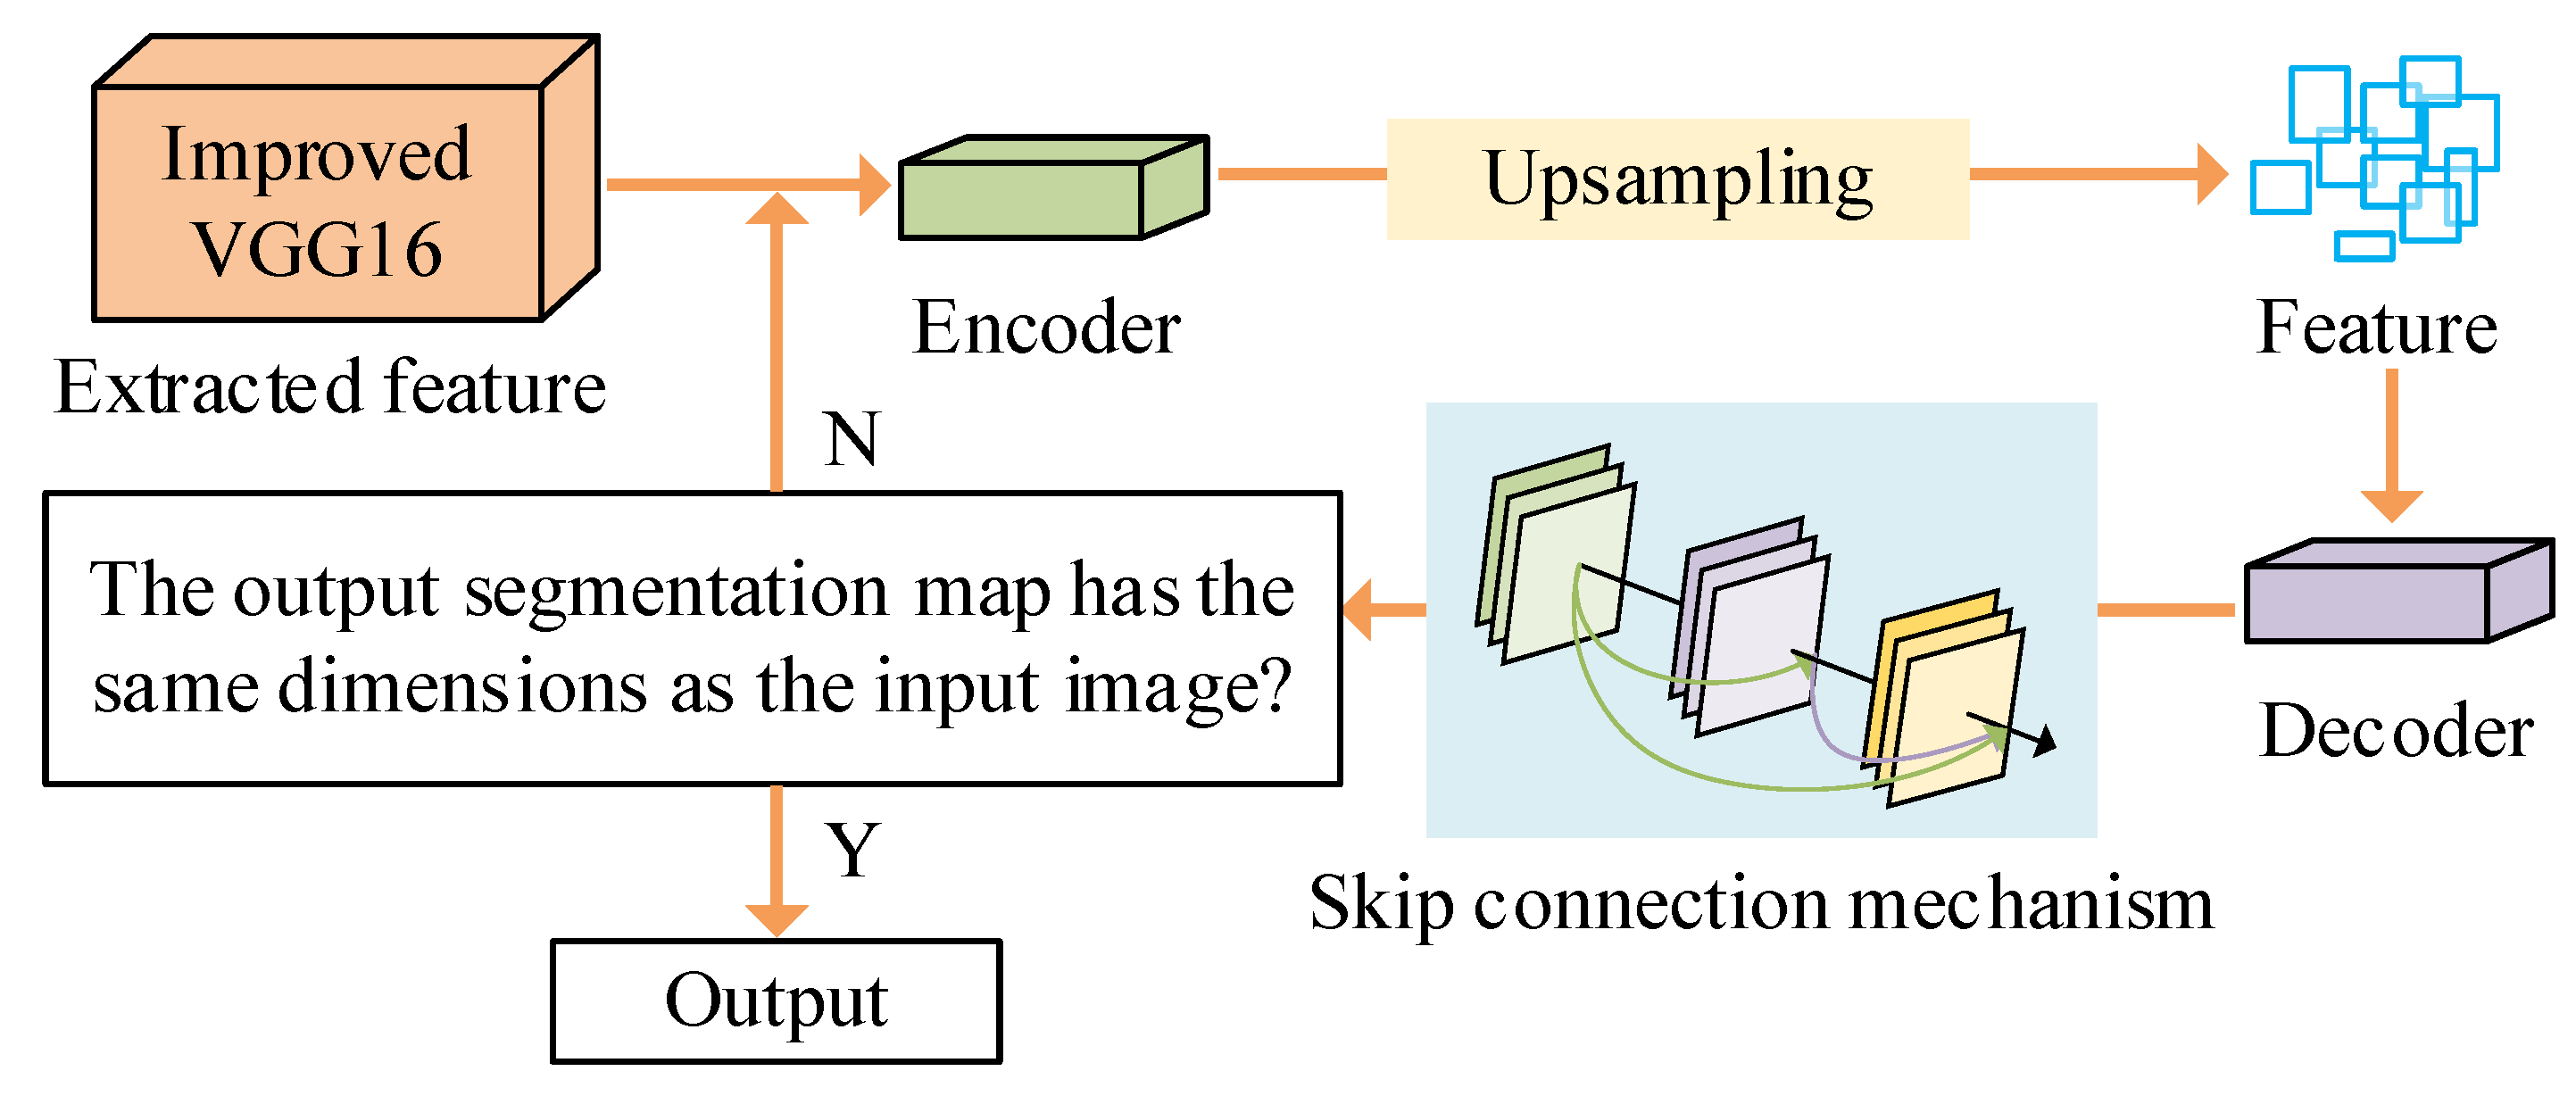
2.1. Image Segmentation Framework Combining Improved VGG16 and U-Net for Steel Surface Analysis

To construct an efficient crack detection model, VGG16 was combined with U-Net. VGG16 excels in deep feature extraction, while U-Net offers advantages in fine image segmentation [16,17]. Specifically, the core advantages of U-Net lie in its strong capability regarding precise boundary segmentation, its suitability for learning from small sample datasets, and its symmetric and easily extensible architecture. These advantages contribute to its outstanding performance in structural health monitoring tasks such as crack detection, defect identification, and pavement distress extraction [18]. To address the difficulty of detecting low-contrast, detail-blurred crack images, the network layers of VGG16 are optimized, with the convolution layers re-allocated and divided into three stages. In the first stage, two convolution layers are used, each with 64 filters to reduce the image’s dimensions. The specific expression is shown in Equation (1).
X 1 = C o n v 2 D ( X 0 , F 1 , K 1 ) X 2 = C o n v 2 D ( X 1 , F 1 , K 1 )
In Equation (1), X 0 is the input image with size H 0 × W 0 × C 0 , F 1 represents the 64 filters, K 1 is the convolution kernel with size 3 × 3 , and X 1 and X 2 are feature maps with 64 output channels. In the second stage, image features are extracted, and the specific expression is shown in Equation (2).
X 3 = C o n v 2 D ( X 2 , F 2 , K 2 ) X 4 = C o n v 2 D ( X 3 , F 2 , K 2 ) X 5 = M a x P o o l i n g 2 D ( X 4 )
In Equation (2), X 3 and X 4 are the new outputs, F 2 represents 128 filters, and X 5 is the feature map after pooling. In the third stage, new convolution operations and global average pooling are applied, as shown in Equation (3).
X 6 = C o n v 2 D ( X 5 , F 3 , K 3 ) X 7 = C o n v 2 D ( X 6 , F 3 , K 3 ) X 8 = G l o b a l A v e r a g e P o o l i n g 2 D ( X 7 ) X 9 = D e n s e ( x 8 )
In Equation (3), K 3 has 256 filters, X 8 is the feature map obtained by global average pooling, averaging each channel’s feature map to generate a vector with a length equal to the number of classes, and X 9 is the fully connected layer output used for classification. A bottleneck layer is then introduced, as shown in Equation (4).
X b o o t l e n e c k = C o n v 2 D ( X p r e v , F b o t t l e n e c k , K b o t t l e n e c k = 1 )
In Equation (4), X b o o t l e n e c k uses the convolution of 1 × 1 , and F b o t t l e n e c k reduces the computational load by decreasing the number of output channels compared to the input channels. The improved VGG16 architecture is shown in Figure 1.
In Figure 1, the first stage of the improved VGG16 architecture consists of two convolution layers, which extract preliminary features from the input image and reduce its size. A bottleneck layer is introduced to reduce channel redundancy. The second stage includes three consecutive convolution layers aimed at further capturing local textures and structural information from the image. The third stage consists of two convolution layers to extract high-level semantic features, followed by another max-pooling layer for spatial dimension reduction, and then a global average pooling layer averages the feature maps of each channel, producing a vector corresponding to the number of classes. This replaces the traditional fully connected layer, resulting in lower computation. After feature extraction using the improved VGG16, U-Net performs image segmentation with the goal of separating the crack area from the background to identify the crack’s shape and location. U-Net achieves this through its encoder–decoder architecture and skip connections. The convolution operation for each layer in the encoder part is shown in Equation (5).
X i = C o n v 2 D ( X i 1 , F i , K i )
In Equation (5), X i is the feature map after the i -th layer convolution, F i is the number of convolution filters in the i -th layer, and the number of filters increases as the layer number increases. To reduce the spatial dimensions of the feature maps, each convolution layer is followed by a pooling layer. The pooling operation is expressed in Equation (6).
X i + 1 = M a x P o o l i n g 2 D ( X i )
In Equation (6), M a x P o o l i n g 2 D represents the max-pooling operation, which reduces the image resolution using a 2 × 2 -sized pooling window. The decoder part of U-Net restores the image’s spatial resolution through transposed convolution. The convolution operation in the decoder part is shown in Equation (7).
X u p = U p S a m p l i n g 2 D ( X i ) X i + 1 = C o n v 2 D ( X u p , F d , K d )
In Equation (7), X u p is the feature map obtained from upsampling, X i + 1 is the convolution output from the decoder part, and F d is the number of filters in the decoder part, which remains consistent with the encoder’s filter count. This is followed by the skip connection operation. Skip connections combine features from the encoder and decoder parts to retain low-level features, as expressed in Equation (8).
X s k i p = C o n c a t e n a t e ( X i , X u p )
In Equation (8), X s k i p is the concatenated feature map that combines low-level and high-level features. Finally, a convolution layer outputs the segmentation result, generating a binarized crack region image. The final segmentation output is shown in Equation (9).
Y s e g = S i g m o i d ( X s k i p )
In Equation (9), Y s e g is the final segmentation map, outputting the probability of the crack region. The Sigmoid activation function maps each pixel value to between [ 0 , 1 ] , representing the probability of each pixel belonging to the crack region. The framework that applies the improved VGG16 for feature extraction and uses it in U-Net is shown in Figure 2.
As shown in Figure 2, the application of U-Net in crack detection primarily focuses on its efficient image segmentation capabilities. The basic process of applying U-Net consists of three steps. First, the feature map extracted by the improved VGG16 is input into the U-Net decoder part, which progressively restores the image’s spatial resolution through upsampling operations, transforming abstract features into low-level features with spatial localization information. Second, to avoid information loss, the skip connection mechanism in U-Net combines low-level features with high-level features to preserve the edge and detail information of the cracks. Third, after continuous convolution and upsampling operations, a segmentation map of the same size as the original input image is output, where the crack region is accurately separated and clearly marked.

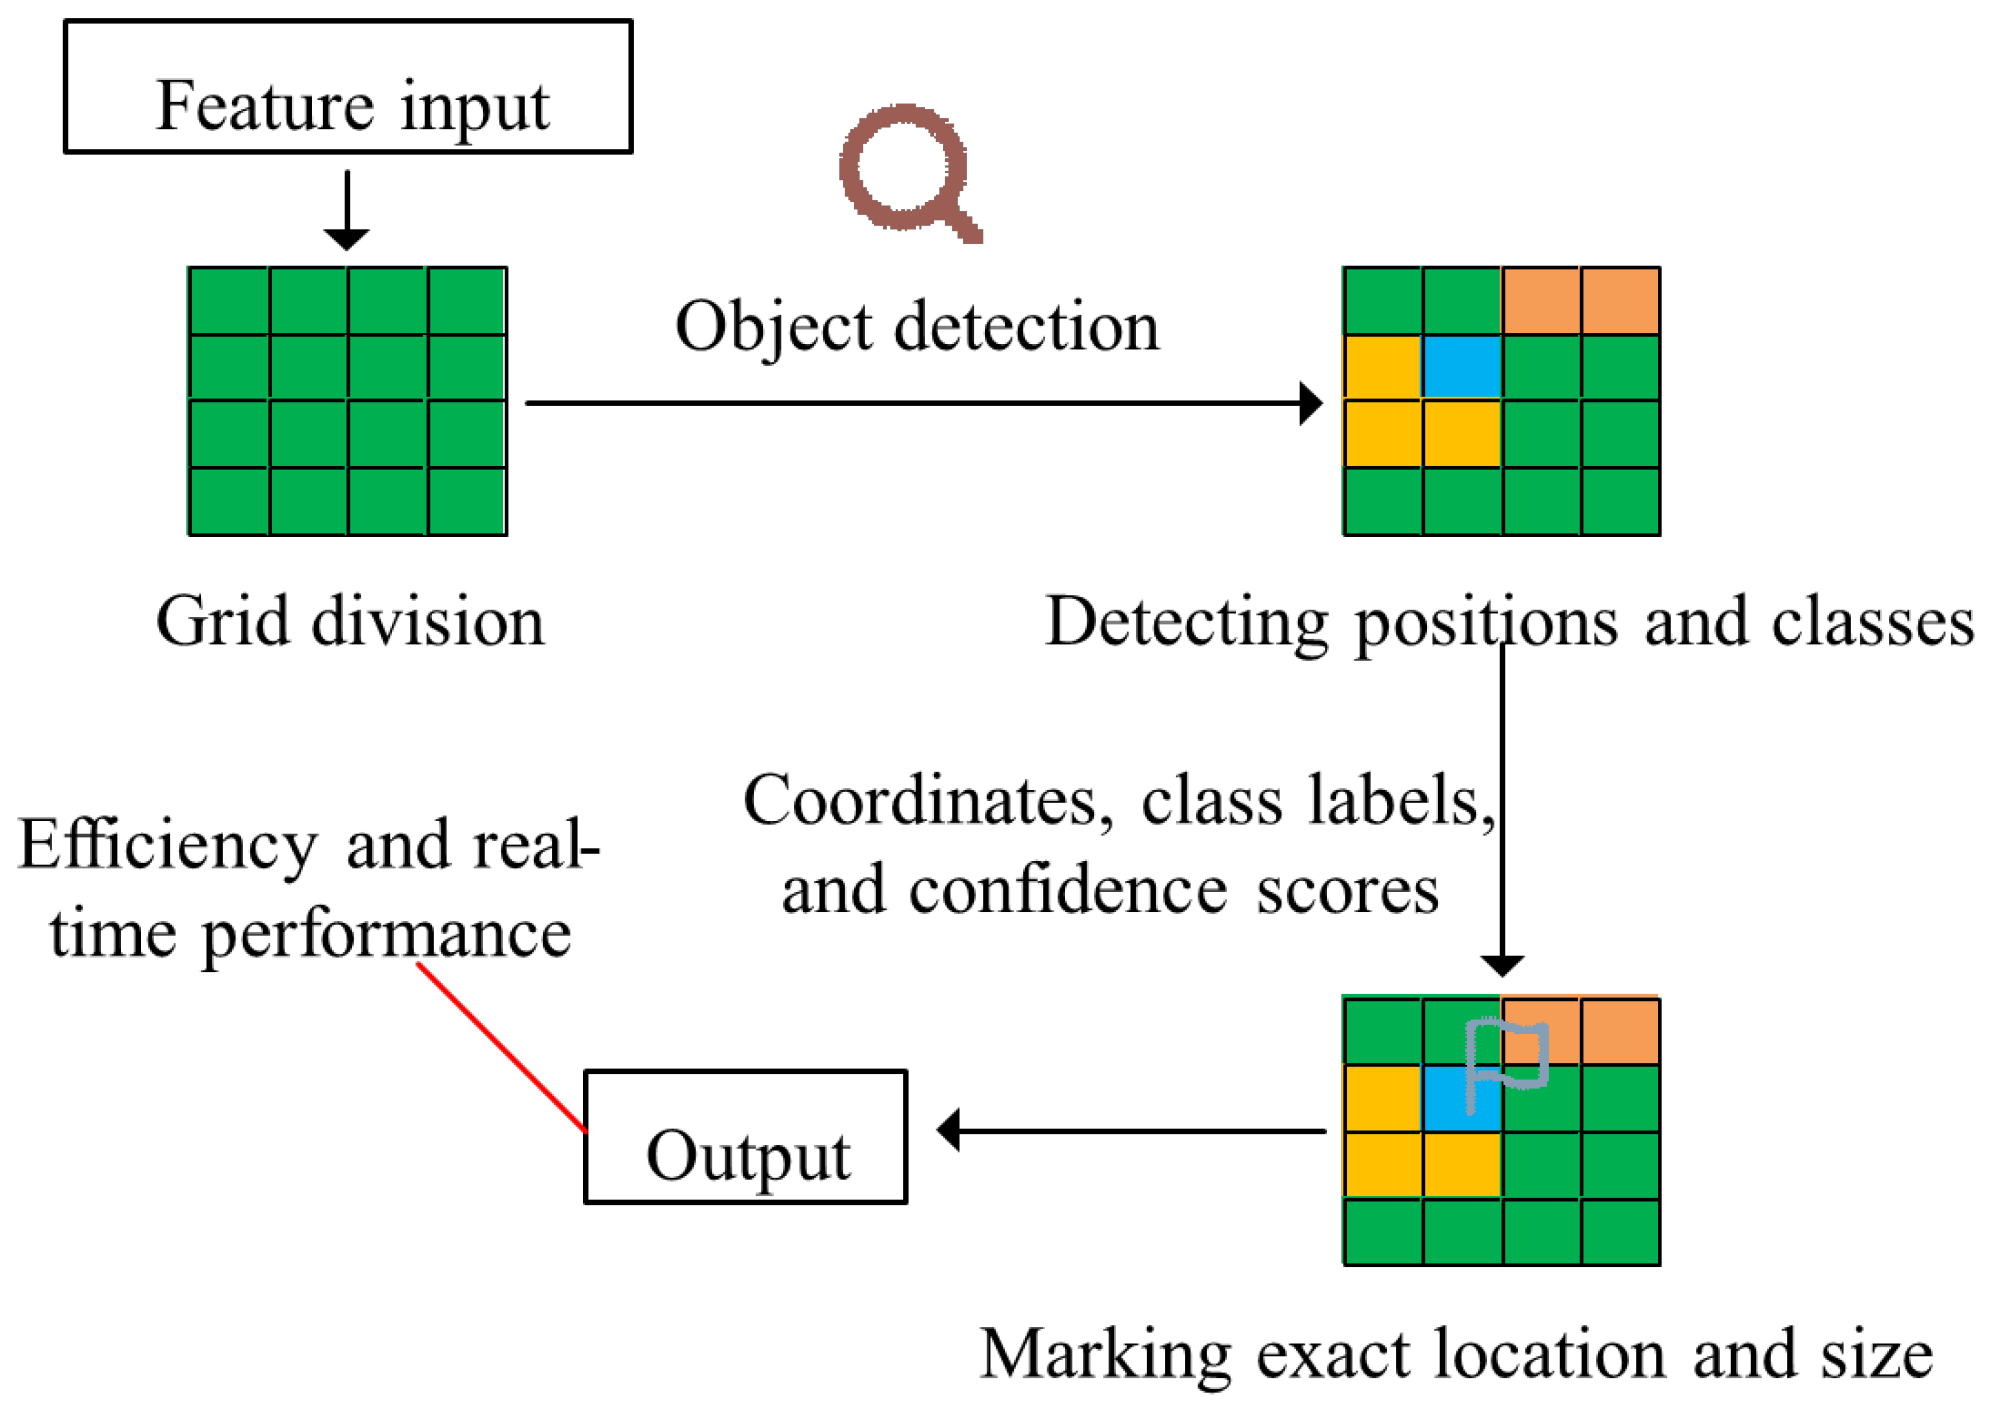
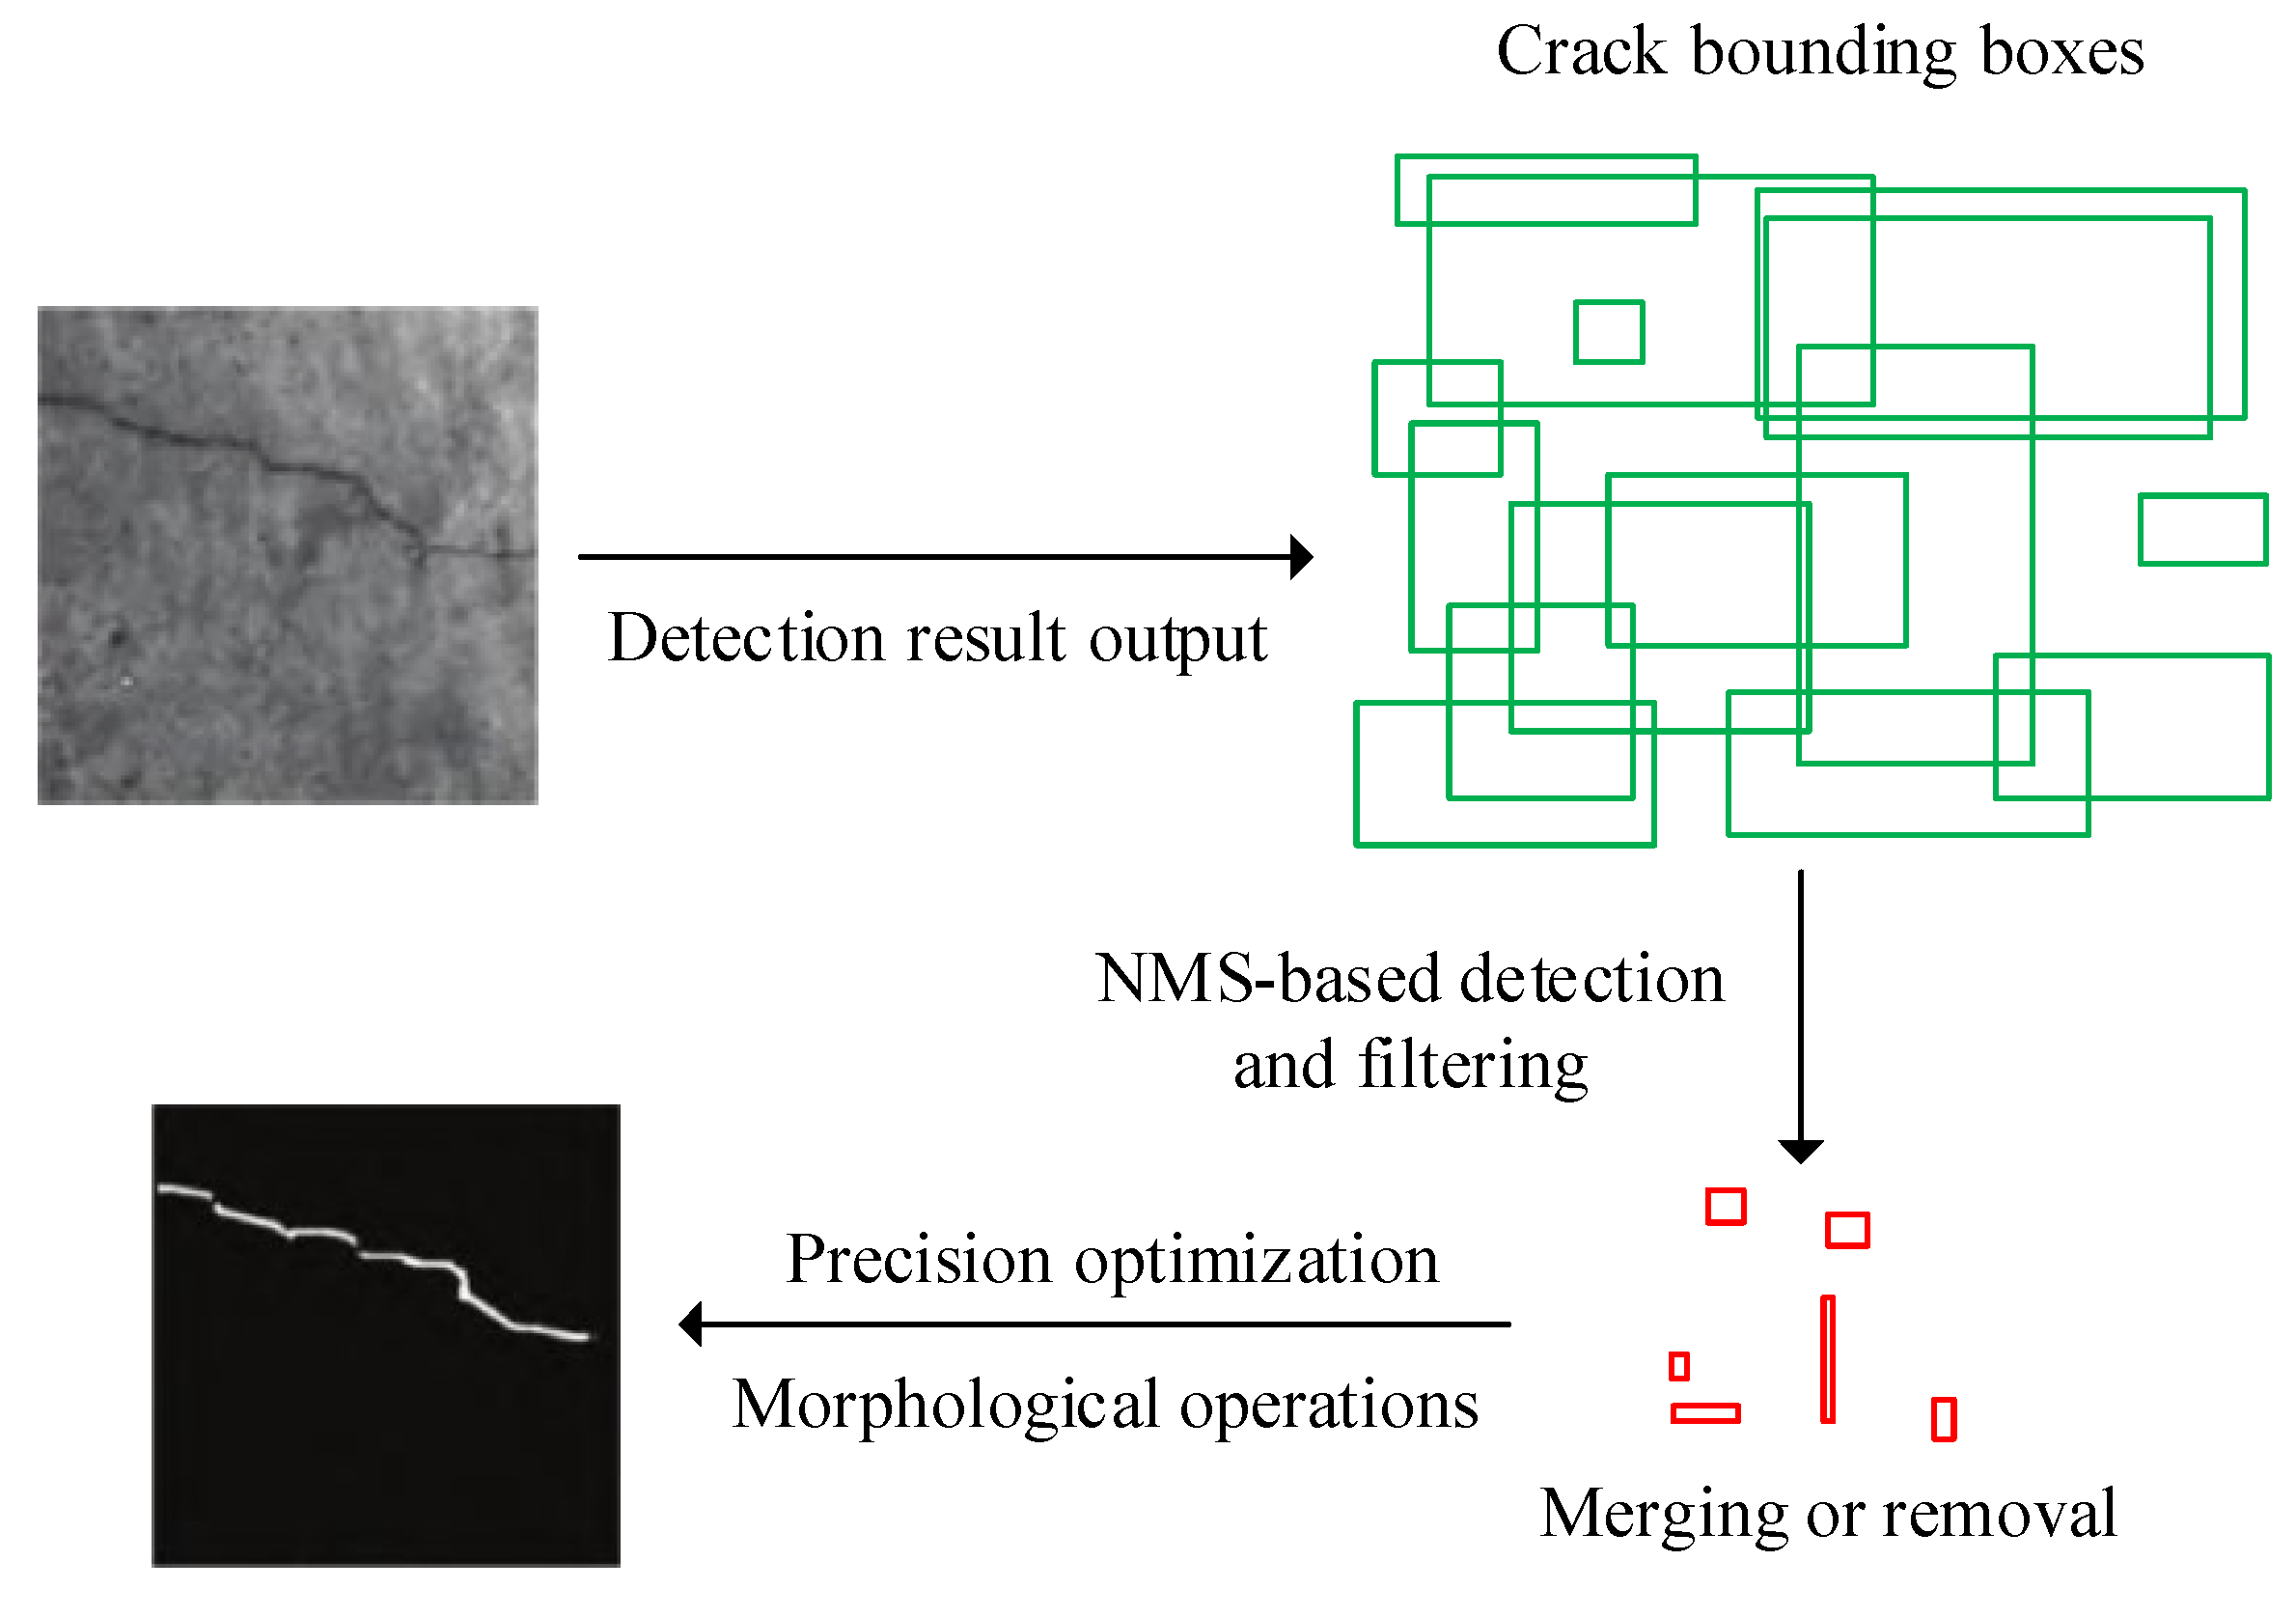
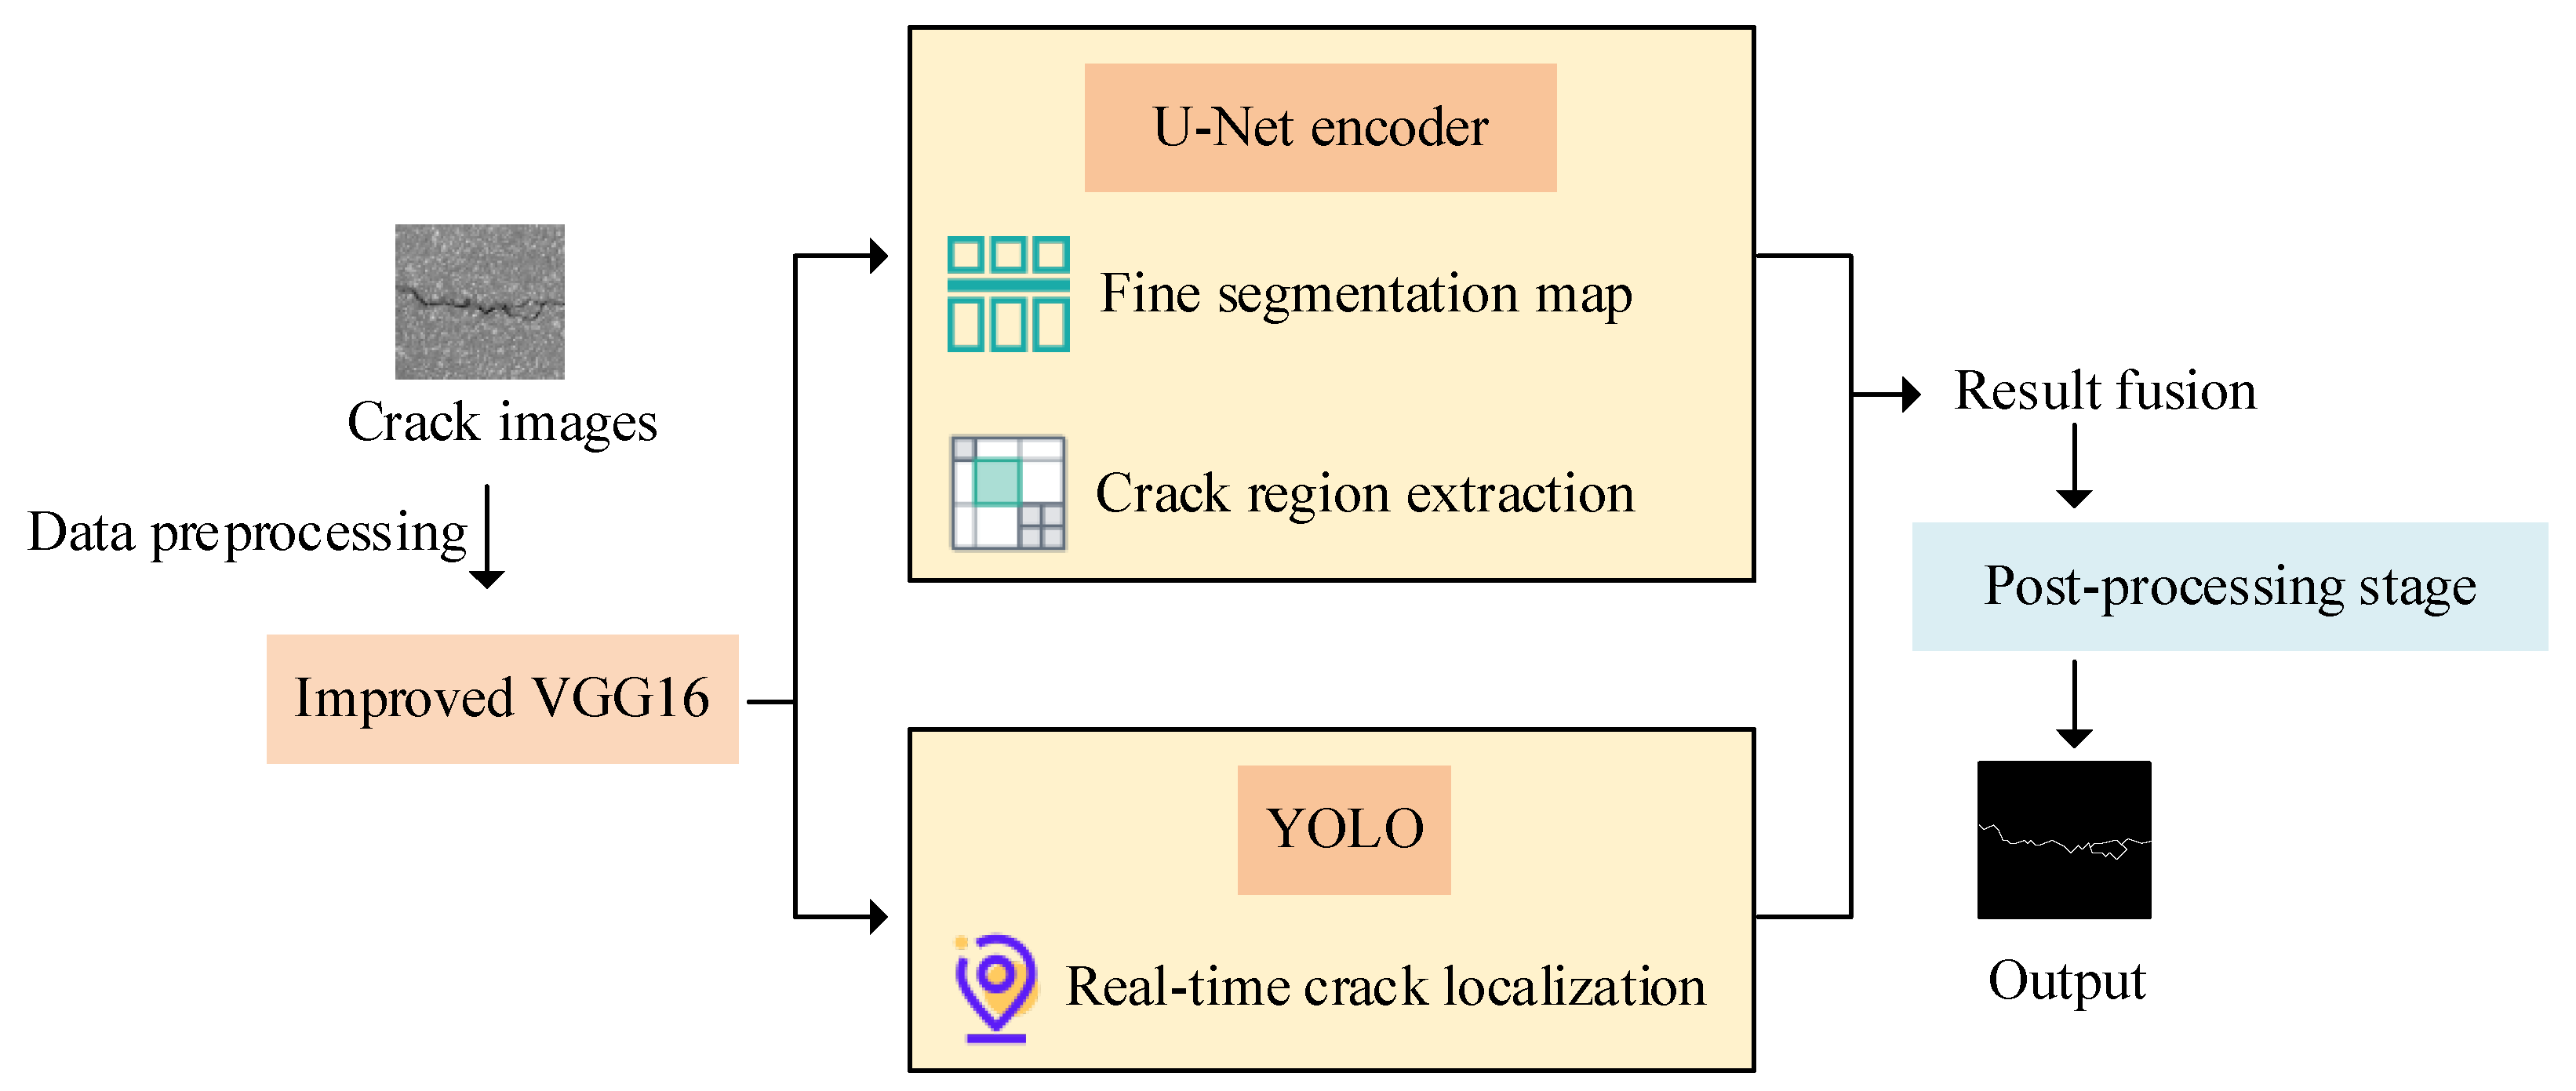
2.2. Steel-Reinforced Crack Detection Model Construction Integrating Image Segmentation and Target Detection

The image segmentation framework provides a solid foundation for crack detection. This study further combines the YOLO-based object detection framework to achieve real-time crack location and accurate labeling, thereby constructing a complete crack detection model. The main task of YOLO object detection is to locate and classify the crack area, directly detecting the position and category of cracks through a regression task [19]. Since its initial introduction, YOLO has been widely applied in image recognition, object localization, and industrial vision tasks due to its end-to-end architecture, high speed, and suitability for real-time detection, making it particularly effective for scenarios involving rapid multi-object identification [20]. The YOLO framework’s principle is shown in Figure 3.
In Figure 3, YOLO divides the input image into several grids, where each grid cell regresses multiple bounding boxes and their confidence values in a single forward pass, then it predicts the target’s category probability based on the confidence values. Afterward, based on confidence thresholds and post-processing operations such as Non-Maximum Suppression (NMS), the final detection results with target categories and bounding boxes are output, thus achieving efficient target localization and identification. In the object detection stage, the feature map X i extracted by the improved VGG16 is input to the detection layer of the YOLO network, as shown in Equation (10).
Y y o l o = C o n v 2 D ( X i , F y o l o , K y o l o )
In Equation (10), Y y o l o , F y o l o , and K y o l o represent the feature map, filter count, and kernel size of the YOLO layer, respectively. YOLO then predicts the coordinates, category probabilities, and confidence values of each detection box through a regression task. The output of each box is shown in Equation (11).
b i = ( x i , y i , w i , h i , c i )
In Equation (11), ( x i , y i ) represents the center coordinates of the box, ( w i , h i ) represents the width and height of the box, and c i represents the confidence value. The crack detection framework using YOLO is shown in Figure 4.
As shown in Figure 4, the object detection phase uses the YOLO detection framework to process the feature map extracted by the improved VGG16. By dividing the image into fixed grids, the YOLO layer regresses the detection boxes in each grid and outputs bounding boxes with coordinates, crack categories, and confidence scores, thus achieving accurate localization of the crack’s position and size. This design not only accurately marks the crack region, but also takes advantage of YOLO’s real-time detection capabilities to quickly complete detection tasks, meeting the efficiency and real-time requirements of steel-reinforced concrete corrosion crack detection. YOLO’s loss function includes position loss, confidence loss, and category loss. If the predicted value of box b i is ( x i , y i , w i , h i , c i ) and the actual value is ( x i t r u e , y i t r u e , w i t r u e , h i t r u e , c i t r u e ) , the total YOLO loss is as expressed in Equation (12).
L y o l o = i [ λ c o o r d 1 o b j ( Δ x + Δ y + Δ w + Δ h ) + λ o b j 1 o b j Δ c + λ n o o b j 1 n o o b j c i 2 + λ c l a s s c 1 o b j ( p i , c p i , c t r u e ) 2 ]
In Equation (12), Δ x = ( x i x i t r u e ) 2 , Δ y = ( y i y i t r u e ) 2 , Δ w = ( w i w i t r u e ) 2 , Δ h = ( h i h i t r u e ) 2 , Δ c = ( c i c i t r u e ) 2 , and 1 o b j are indicator functions, where 1 o b j is 1 when the box contains the target, and 0 otherwise. 1 n o o b j is also an indicator function, where 1 n o o b j is 1 when the box does not contain the target, and 0 otherwise. λ c o o r d , λ o b j , λ n o o b j , and λ c l a s s are weight hyperparameters in the loss function. p i , c is the predicted probability of the category c for the i -th box. The final YOLO output for each detection box’s position, confidence, and crack category probability is expressed in Equation (13).
B y o l o = { b 1 , b 2 , , b m }
In Equation (13), B y o l o represents the detection box set processed by the YOLO layer. In the face of complex backgrounds and overlapping cracks, to ensure that each crack is only marked once and avoid duplicate detection, post-processing optimization is used. The process of this stage is shown in Figure 5.
As shown in Figure 5, the post-processing optimization stage includes three steps: handling overlapping areas, precision optimization, and morphological operations. First, NMS is used to filter the multiple crack boxes detected, merging or removing highly overlapping boxes. Then, combining the segmentation map with the detection box information, the positions and sizes of the boxes are precisely adjusted to better fit the true boundaries of the cracks. Finally, morphological operations such as erosion and dilation are used to remove noise and false cracks. NMS plays a critical role in this process, as it removes redundant detection boxes and retains the most optimal ones by discarding overlapping boxes with high IoU. For the input, a set of candidate boxes B = { b 1 , b 2 , , b n } is given, each with position coordinates and corresponding confidence values. IoU is used to calculate the overlap between boxes. The IoU formula is shown in Equation (14).
IoU = ( b i , b j ) = A r e a ( b i b j ) A r e a ( b i b j )
In Equation (14), A r e a ( b i b j ) represents the intersection area of boxes b i and b j , while A r e a ( b i b j ) is the union area of boxes b i and b j . Through IoU, the final output is shown in Equation (15).
B f i n a l = N M S ( B , θ )
In Equation (15), B f i n a l is the final detection box set after NMS. θ is the IoU threshold, set to 0.6. Each candidate box is sorted by confidence c i , and the box with the highest confidence is kept as the retained box. For each remaining box b j , if the IoU with b j is greater than θ , it is removed, and the process is repeated until no boxes remain. The remaining boxes are the optimal detection box set B f i n a l , which is the final predicted result of the model. The final model is a hybrid optimized crack detection model combining improved VGG16, U-Net, and YOLO, as shown in Figure 6.
As shown in Figure 6, crack images must undergo preprocessing before being input into the model. The improved VGG16 serves as a shared backbone for feature extraction, encoding multi-scale structural information. On the one hand, the U-Net decoder performs fine-grained semantic segmentation of the crack regions; on the other hand, mid- and high-level features are passed into the YOLO object detection module for rapid position-level identification. This architecture enables parallel coordination between segmentation and detection, which significantly enhances response speed without imposing substantial computational overhead, thereby fulfilling the core requirement of real-time crack detection in structural health monitoring. In the post-processing and optimization stages, the model fuses the segmentation output with detection bounding boxes, applies Non-Maximum Suppression (NMS) to eliminate redundant detections, and employs morphological operations to remove noise, ultimately producing high-precision crack detection results with the UY-VGG16 model.

3. Performance Evaluation of UY-VGG16 Concrete Corrosion Crack Detection Model

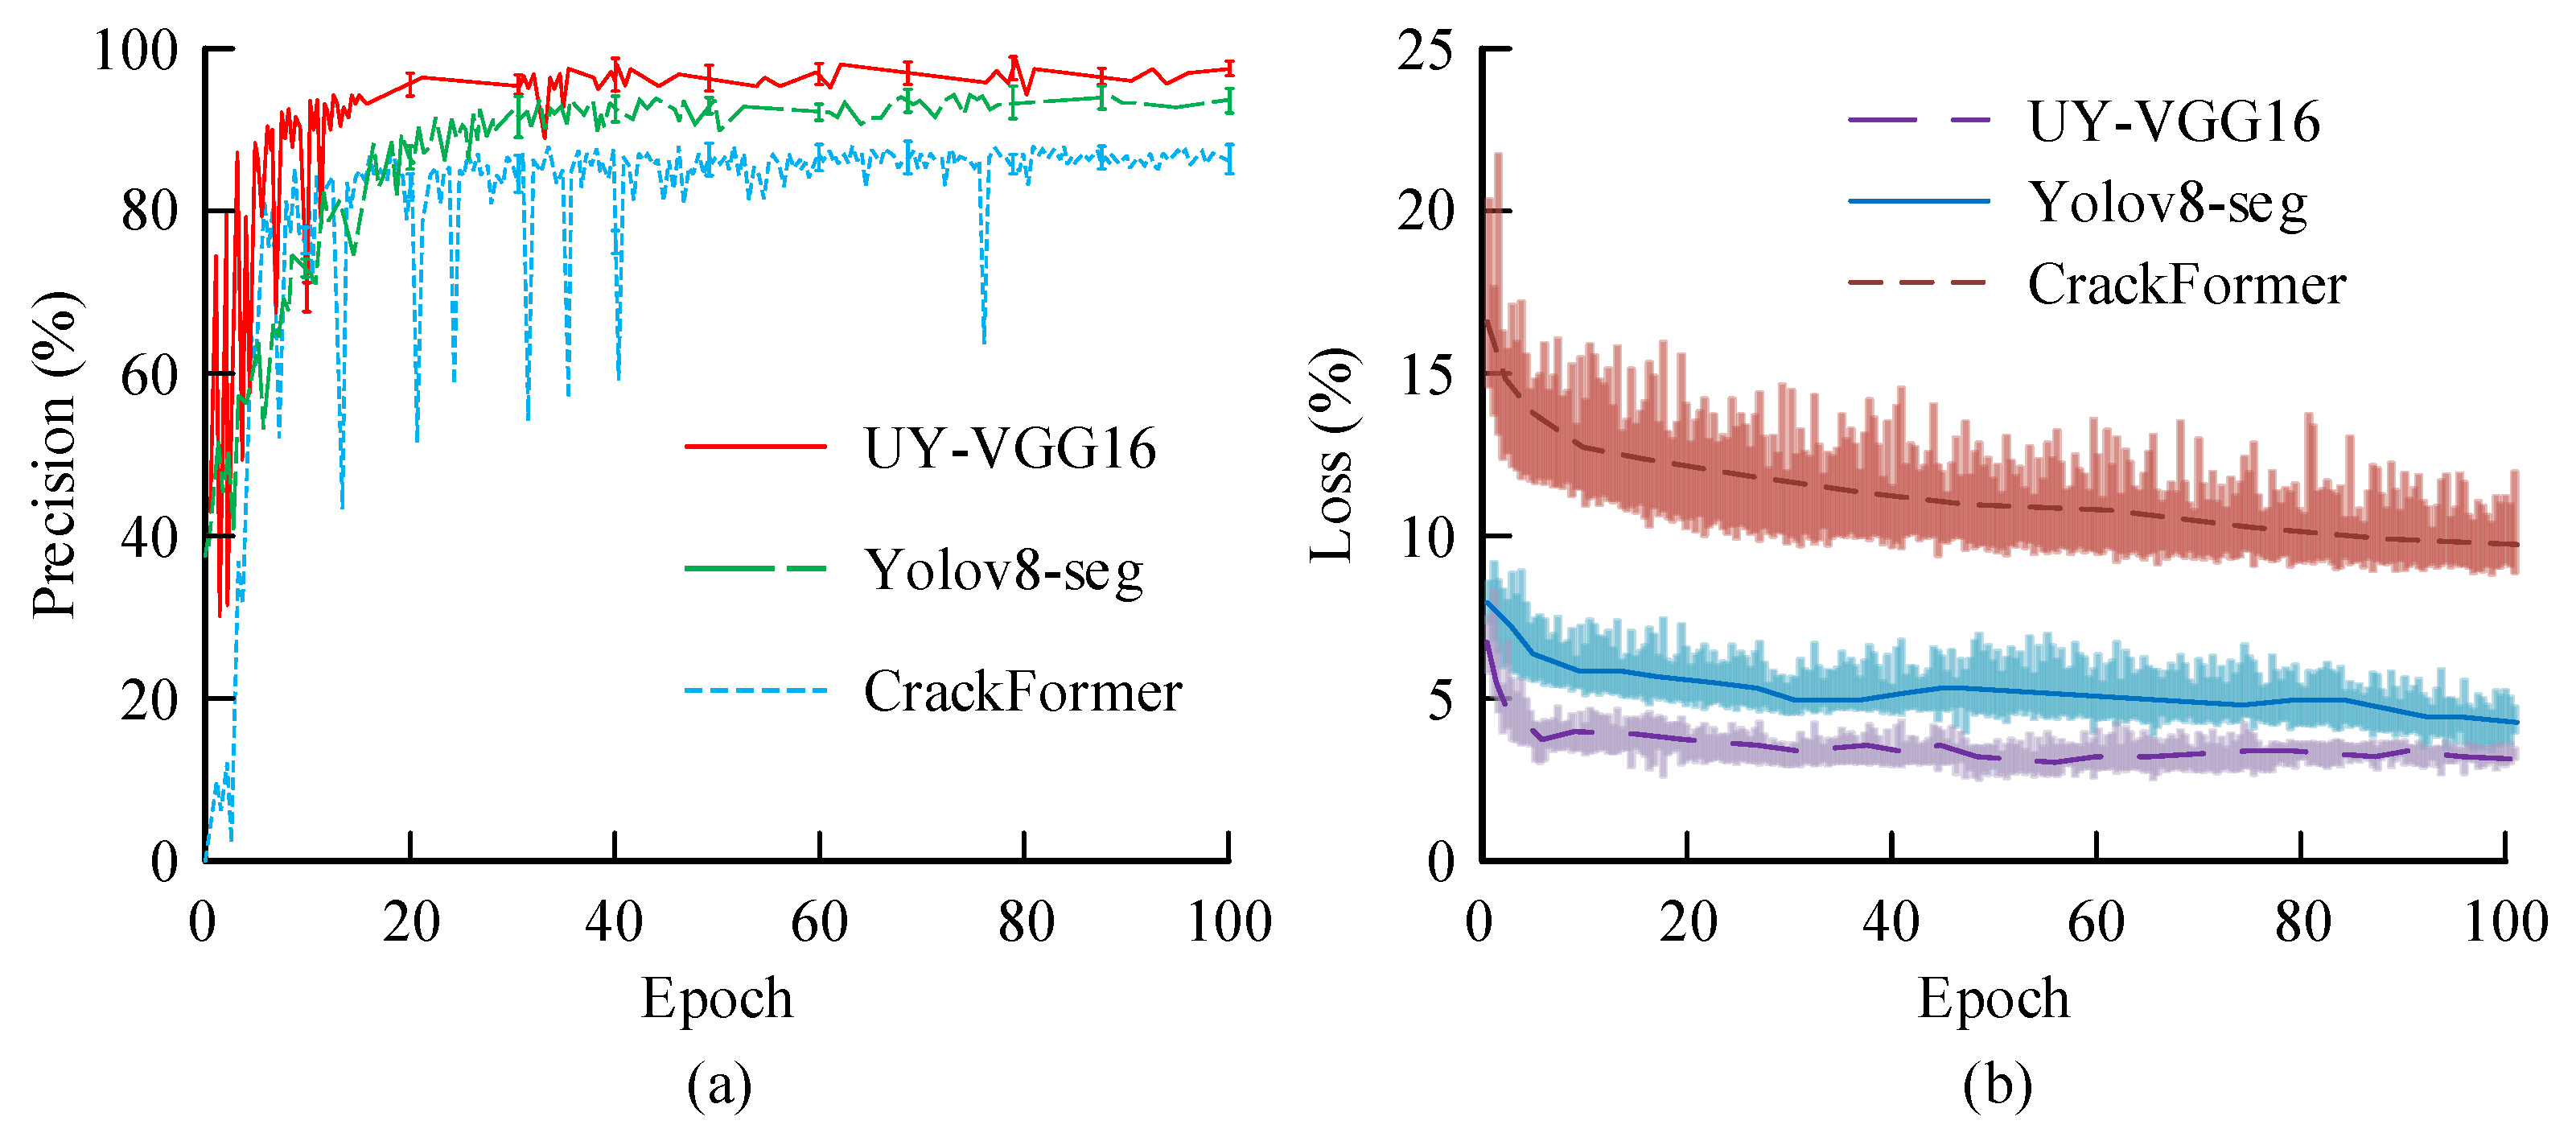
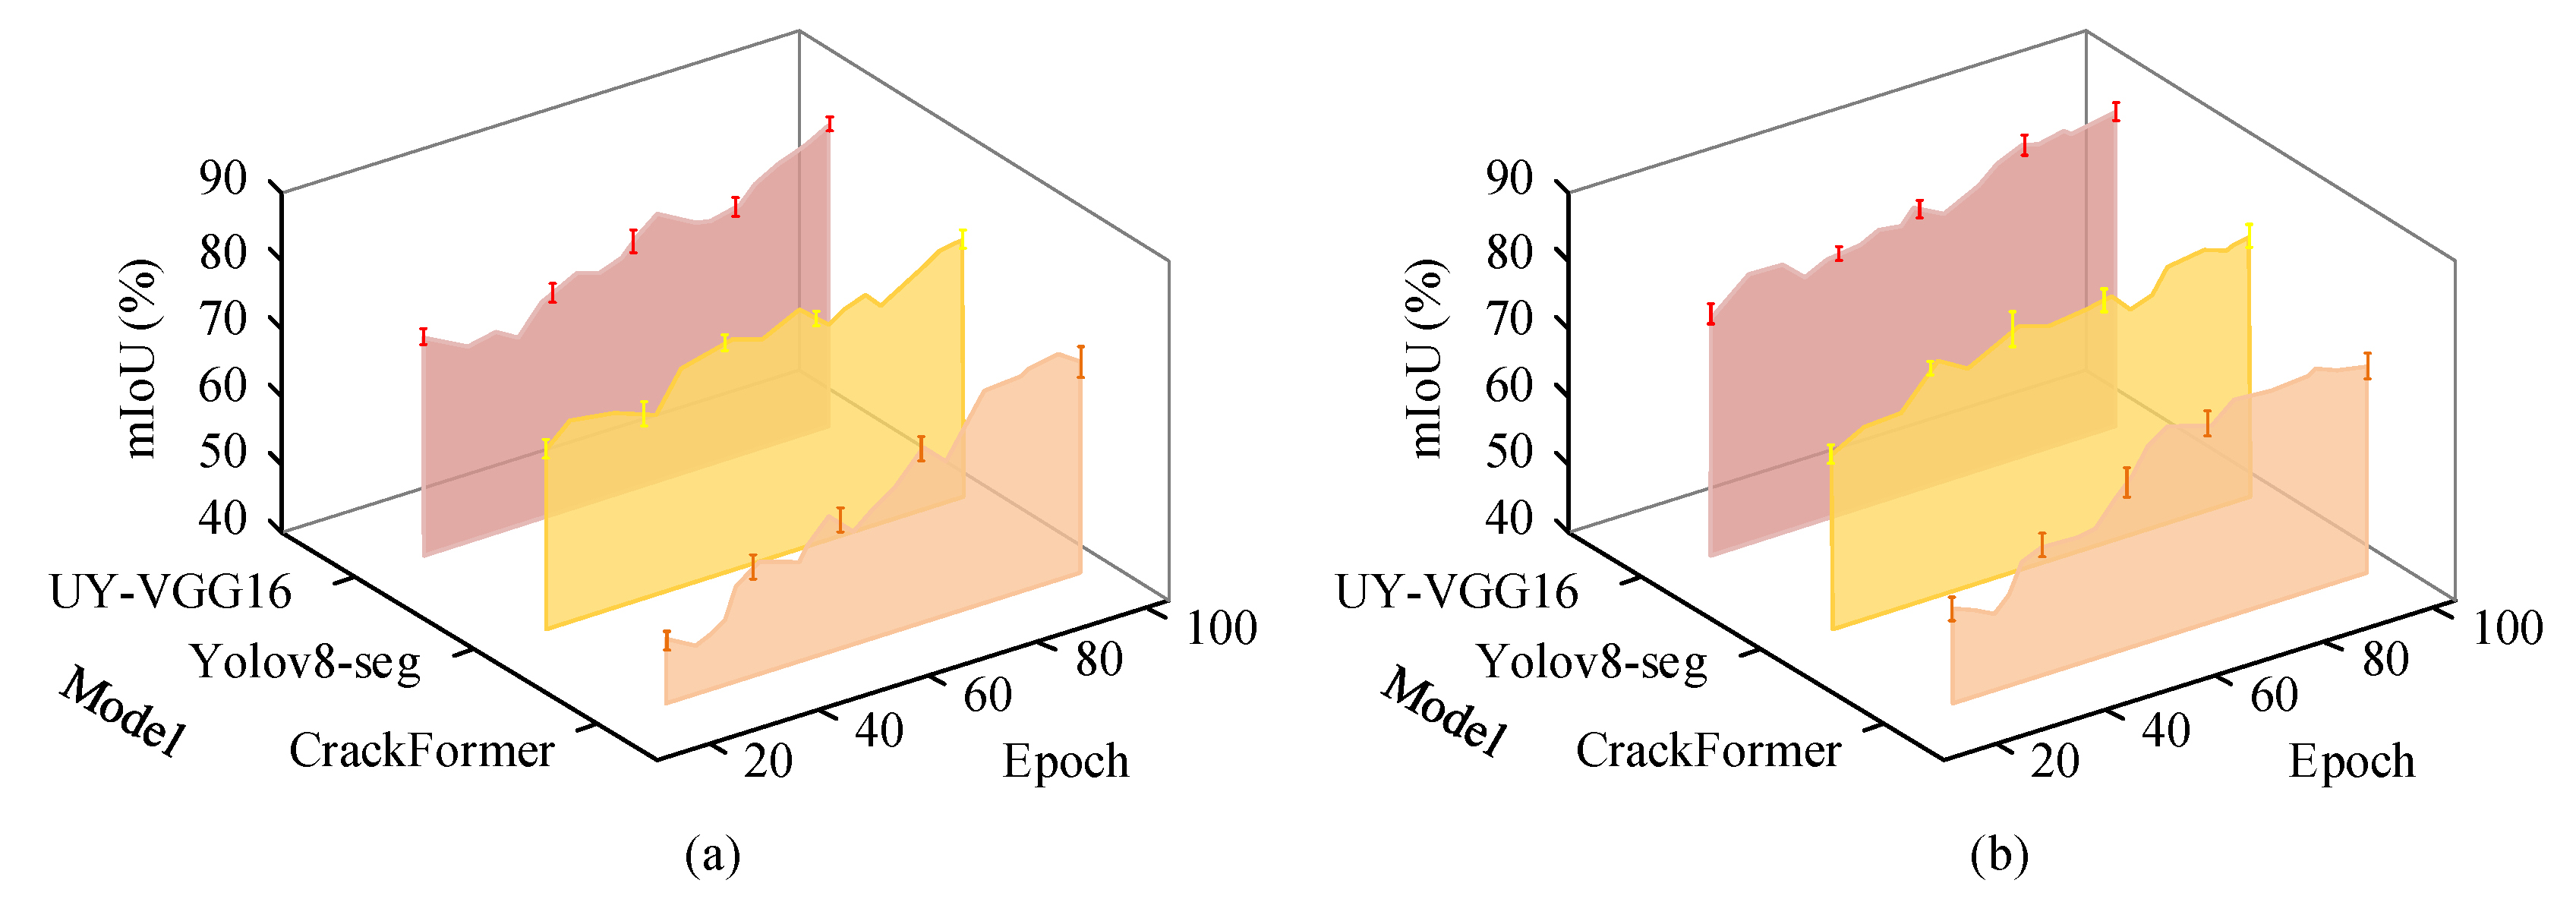
3.1. Comprehensive Performance Evaluation of UY-VGG16 During Training

The study verified the effectiveness of the proposed UY-VGG16 model during crack detection by selecting the SDNET2018 and DeepCrack concrete crack datasets for training and testing. You Only Look Once version 8-Segment (YOLOv8-seg) and CrackFormer were chosen as comparative models. The experiments were conducted using a workstation equipped with a 16 GB graphics card, an Intel Core i7 processor, a NVIDIA GeForce RTX series GPU, and 32 GB of RAM, running on the Ubuntu 20.04 operating system. The deep learning framework used was PyTorch1.10 in a Python environment. The training parameters included an initial learning rate of 0.001, a batch size of 16, the Adam optimizer, and a random data augmentation strategy to enhance the model’s generalization capability. The model’s performance was compared using identical hardware and software environments. During crack recognition tasks, precision and loss rate are key indicators for evaluating model performance. According to internationally accepted evaluation criteria and mainstream research literature, a precision above 90% and a loss rate below 5% are generally considered the minimum acceptable performance thresholds for crack detection models under laboratory conditions. However, during engineering deployment, additional considerations such as convergence speed, robustness across datasets, and generalization ability in diverse scenarios become critical. First, the precision and loss rate of each model were compared, and the results are shown in Figure 7.
As shown in Figure 7a, the precision of UY-VGG16 fluctuated significantly before the 20th epoch. After the 20th epoch, the precision stabilized and rapidly increased to over 90%. By the 100th epoch, it reached a steady value of 94.4%, while the precision of YOLOv8-seg and CrackFormer remained at 91.7% and 83.6%, respectively. These results indicate that UY-VGG16 demonstrates stronger learning potential and faster convergence in feature recognition and classification. In Figure 7b, UY-VGG16’s loss rate rapidly decreased and converged around the 5th epoch. After the 20th epoch, it stabilized at approximately 2.8%, ultimately reaching a loss rate of 2.6%. In contrast, YOLOv8-seg and CrackFormer had loss rates of 5.0% and 11.6%, respectively, after the same number of epochs. Overall, UY-VGG16 exhibited advantages in optimization efficiency and stability. To validate the model’s localization accuracy, the mIoU was measured, and the results are shown in Figure 8.
As shown in Figure 8a, UY-VGG16 achieved an mIoU of 70% with the SDNET2018 dataset after the 60th epoch, and by the 100th epoch, it exceeded 85.6%. YOLOv8-seg’s mIoU was slightly higher than UY-VGG16’s before the 60th epoch but slowed down after that, with a final value of 76.2%. CrackFormer reached only 68.7% by the 100th epoch. In Figure 8b, UY-VGG16 exhibited superior performance with the DeepCrack dataset. Its mIoU was nearly 70% by the 20th epoch and stabilized at 87.5% by the 100th epoch. YOLOv8-seg and CrackFormer, on the other hand, reached 74.2% and 63.9%, respectively, showing a significant slowdown in improvement. These results demonstrate UY-VGG16’s excellent performance in recognizing diverse crack features and adapting to complex scenarios. To further accommodate varying operational conditions, two lightweight variants—UY-VGG16-Fast and UY-VGG16-Tiny—were developed based on the original UY-VGG16 framework. A comparative analysis of the runtime efficiency across five different models was conducted, with evaluation metrics including image processing speed measured in frames per second (FPS), inference latency during real-time detection, and average precision (AP), as summarized in Table 1.
As shown in Table 1, among the efficiency metrics, UY-VGG16-Tiny demonstrates the best inference speed of 47 FPS and a processing latency of 24 ms, making it particularly suitable for scenarios with stringent real-time requirements. UY-VGG16, on the other hand, leads in detection accuracy, achieving an average precision (AP) of 93.2%, outperforming all baseline models while also maintaining a processing latency of 36 ms and an FPS of 38, thus balancing both accuracy and speed. Among the three proposed models, UY-VGG16-Fast achieves the optimal balance between performance and efficiency. In comparison, Yolov8-seg reaches an AP of 90.5% with a latency of 43 ms and 31 FPS, which is slightly inferior to UY-VGG16-Fast, whereas CrackFormer shows the weakest performance overall. In summary, the UY-VGG16 model family outperforms mainstream crack detection models in terms of accuracy, inference speed, and deployment flexibility.

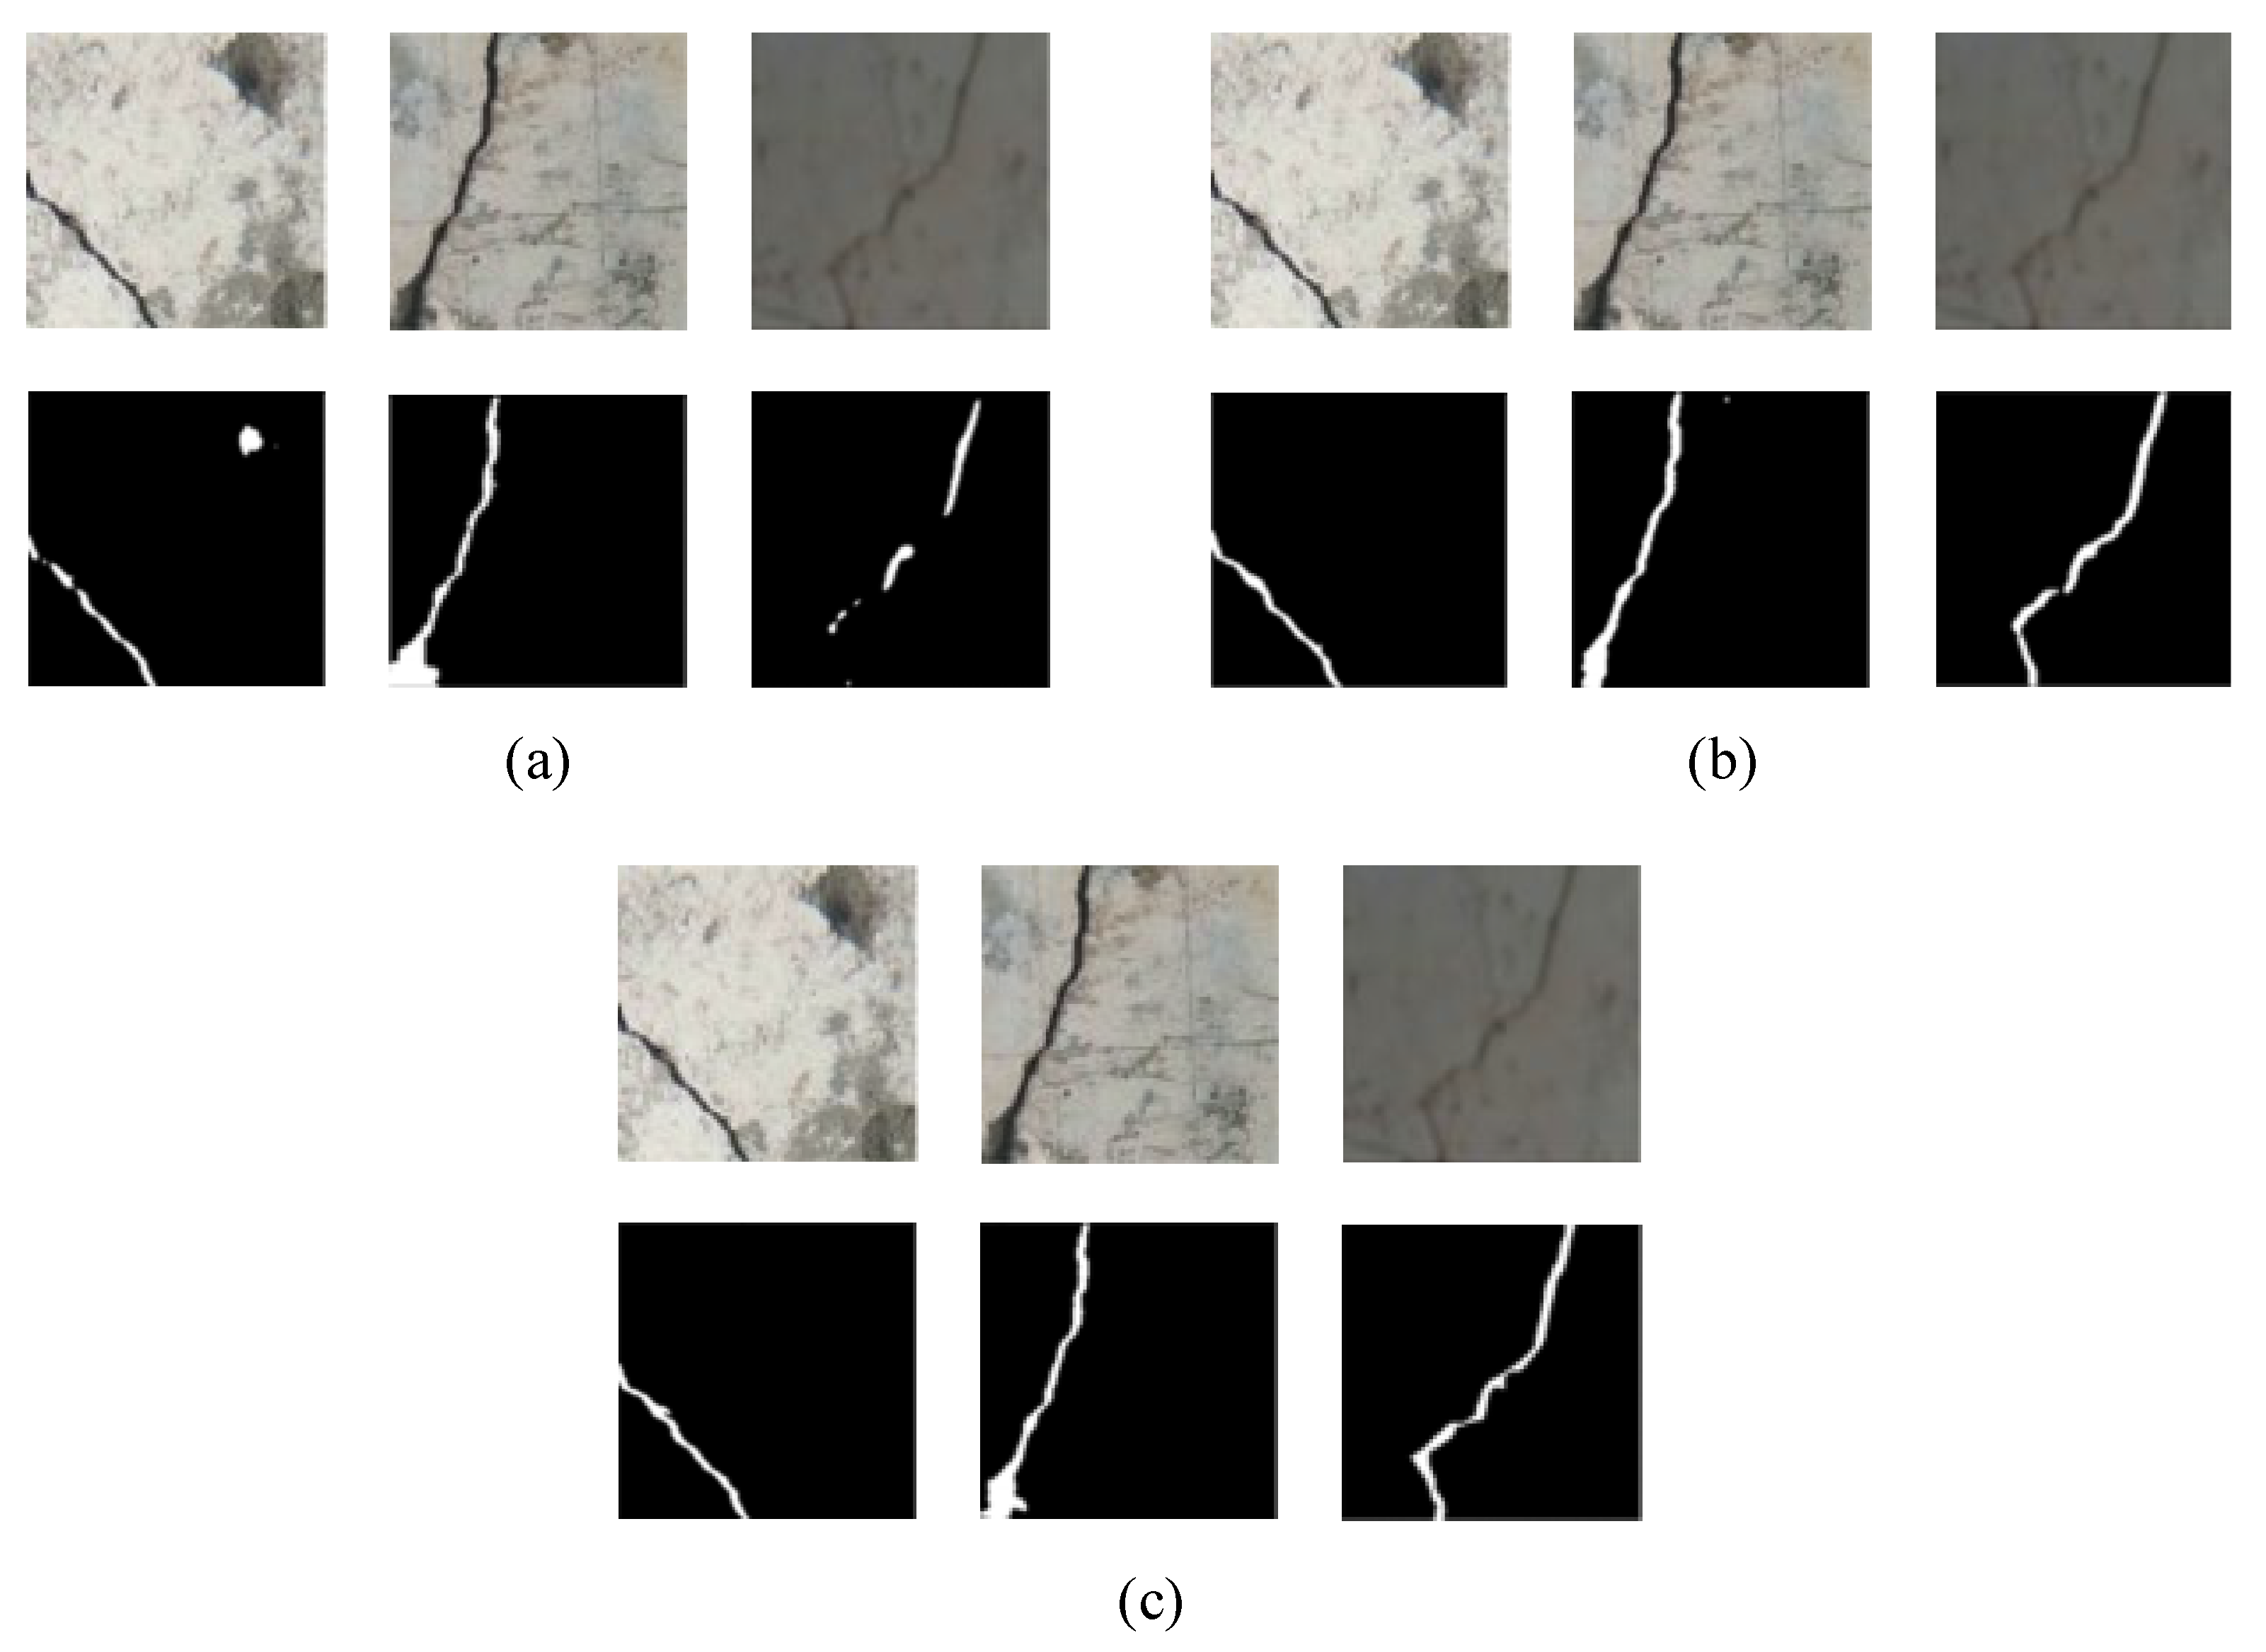
3.2. Crack Size Detection and Environmental Adaptability Analysis of UY-VGG16

After verifying the indicators of the different models during training, the study also compared UY-VGG16’s practical performance in crack detection using real-world images. A total of 140 rebar-concrete corrosion crack images from the SDNET2018 and DeepCrack datasets were selected for recognition. The MAE result is shown in Figure 9.
In Figure 9a, UY-VGG16’s MAE for crack width detection ranged from 3.8 mm to 5.9 mm. YOLOv8-seg and CrackFormer models had MAEs ranging from 4.3 mm to 9.2 mm and 4.9 mm to 11.1 mm, respectively. The overall trend indicates that UY-VGG16 has a significant advantage in accuracy. In Figure 9b, UY-VGG16’s MAE for crack length detection was concentrated at around 2.1 cm, while those of YOLOv8-seg and CrackFormer were approximately 3.2 cm and 3.9 cm, respectively. These results demonstrate UY-VGG16’s superiority in crack size measurement accuracy. The study conducted crack sampling on steel-reinforced concrete structures from Project W, which was completed over ten years ago. Three real-world images were subsequently selected as representative samples, and crack extraction and recognition were performed using three different models. The results are shown in Figure 10.
As shown in Figure 10a, the CrackFormer model was able to recognize the overall crack region, but there were some fractures and noise at the edges, and some misidentifications were present. Figure 10b shows that the YOLOv8-seg model produced a more complete crack contour but still made some misjudgments at fine cracks and intersections, with a relatively smooth edge. As can be seen in Figure 10c, UY-VGG16 achieved the best extraction results for the real images, with clear crack contours and better detail restoration, and the edges had minimal fractures or artifacts. The results from the three real-world crack images highlight UY-VGG16’s advantage in crack extraction and segmentation. The study conducted further on-site sampling of concrete from Project W, selecting several samples on which to perform crack recognition under different noise levels and lighting conditions. The accuracy and classification results are presented in Figure 11.
As shown in Figure 11a, 30 samples with signal-to-noise ratios (SNR) ranging from −20 dB to 20 dB were used for accuracy verification. UY-VGG16 showed a higher overall recognition accuracy than the other two models. When the SNR was less than 0 dB, UY-VGG16’s accuracy ranged from 77.6% to 82.3%. At an SNR of 18 dB, UY-VGG16’s crack detection accuracy reached 94.2%. As seen in Figure 11b, 50 concrete crack images under different lighting conditions were selected for classification. A, B, and C represent UY-VGG16, YOLOv8-seg, and CrackFormer, respectively, with 1 and 2 indicating normal and low-light conditions. The results showed that UY-VGG16 had the strongest classification ability, correctly classifying 46 images under low light and 48 images under normal lighting. However, CrackFormer performed the worst, misclassifying 12 images under low light. In conclusion, the proposed model outperformed the other models in terms of crack detection performance under various noise and environmental conditions. Finally, the study tested the UY-VGG16, UY-VGG16-Tiny, and UY-VGG16-Fast models on field data under a broader range of extreme conditions, with the detailed results presented in Table 2.
As shown in Table 2, the UY-VGG16 model exhibits the lowest overall width error, with a deviation of only ±4.0 mm under smooth surface conditions and a maximum error of ±5.6 mm under high-roughness conditions. In contrast, UY-VGG16-Tiny produced the highest error values across all test conditions, reaching ±6.7 mm and ±8.3 mm for moderately and highly rough surfaces, respectively. Under interference scenarios, UY-VGG16 maintained strong robustness, with width errors of ±5.4 mm for soil-covered cracks and ±5.1 mm for partially occluded cracks, significantly outperforming both UY-VGG16-Tiny and UY-VGG16-Fast. Overall, UY-VGG16-Fast maintained moderate error levels across all conditions, effectively balancing crack width recognition accuracy with faster inference speed, demonstrating high adaptability for deployment in practical applications.

4. Conclusions

To improve the accuracy of crack detection, this study proposed a crack detection method that combines an improved VGG16 model with a convolutional neural network architecture. The U-Net was used to achieve fine segmentation of the crack regions, and YOLO was utilized to quickly locate the crack targets, resulting in the development of a hybrid crack detection model, UY-VGG16. The inference speed of UY-VGG16 improved to 38 FPS after training. When extracting cracks, the model’s width error ranged from 3.8 mm to 5.9 mm, and the length error was approximately 2.1 cm. Additionally, the real images extracted by UY-VGG16 displayed clear crack contours, with edges nearly free of fractures. Under negative SNR conditions, the crack detection accuracy reached up to 82.3%. The experimental results demonstrate that UY-VGG16 exhibits excellent performance in the detection of reinforced concrete corrosion cracks, offering an efficient and intelligent solution for practical engineering applications. However, the model still faces a risk of misclassification when identifying fine cracks under low-contrast or complex background conditions. In real-world environments involving factors such as soil occlusion or water stain interference, the accuracy of crack boundary recognition tends to degrade, resulting in more blurring and misidentification compared to results obtained under standard lighting and clear viewing angles. Future work should focus on expanding the diversity of training data and incorporating environment-aware modules or active learning mechanisms to enhance the model’s adaptability and scalability in real-world scenarios.

Author Contributions

Methodology, L.C.; Formal analysis, Z.W.; Writing—original draft, L.C. and Z.W.; Writing—review & editing, H.L.; Project administration, H.L.; Funding acquisition, Z.W. All authors have read and agreed to the published version of the manuscript.

Funding

This paper was supported by the Ministry of Education’s Industry University Cooperation Collaborative Education Project (220605848083139), the Bengbu Science and Technology Plan Project (2023hm04), and the China and Natural Science Foundation (LS0232, 00011082, 00011064, 00011001) of Bengbu University, China.

Institutional Review Board Statement

Not applicable.

Informed Consent Statement

Not applicable.

Data Availability Statement

The data supporting the findings of this study are available within the article.

Conflicts of Interest

The authors declare no conflict of interest.

Abbreviations

VGG16Visual Geometry Group Network 16
YOLOYou Only Look Once
UY-VGG16integrated model combining U-Net, You Only Look Once, and Visual Geometry Group Network 16
mIoUmean Intersection over Union
NMSNon-Maximum Suppression
MAEmean absolute error
YOLOv8-segYou Only Look Once version 8-Segment
FPSframes per second
APaverage precision
SNRsignal-to-noise ratios

References

  1. Afanda, R.; Zaki, A. Effects of Repair Grouting and Jacketing on Corrosion Concrete Using Ultrasonic Method. SDHM Struct. Durab. Health Monit. 2025, 19, 266–284. [Google Scholar] [CrossRef]
  2. Kuchipudi, S.T.; Ghosh, D.; Ganguli, A. Imaging-based detection and classification of corrosion damages in reinforced concrete using ultrasonic shear waves. J. Build. Eng. 2025, 105, 112490. [Google Scholar] [CrossRef]
  3. Crognale, M.; De Iuliis, M.; Rinaldi, C.; Gattulli, V. Damage detection with image processing: A comparative study. Earthq. Eng. Eng. Vib. 2023, 22, 333–345. [Google Scholar] [CrossRef]
  4. Reyes, E.; Gálvez, J.C.; Planas, J. Final Report of RILEM Technical Committee TC 187-SOC: Experimental Determination of the Stress-Crack Opening Curve for Concrete in Tension; RILEM Publications: Paris, France, 2007. [Google Scholar]
  5. Brandtner-Hafner, M.H. Assessing the natural-healing behavior of adhesively bonded structures under dynamic loading. Eng. Struct. 2019, 196, 109303. [Google Scholar] [CrossRef]
  6. Liang, H.; Qiu, D.; Ding, K.L.; Zhang, Y.; Wang, Y.; Wang, X.; Wan, S. Automatic pavement crack detection in multisource fusion images using similarity and difference features. IEEE Sens. J. 2023, 24, 5449–5465. [Google Scholar] [CrossRef]
  7. Cui, J.; Qin, Y.; Wu, Y.; Shao, C.; Yang, H. Skip connection YOLO architecture for noise barrier defect detection using UAV-based images in high-speed railway. IEEE Trans. Intell. Transp. 2023, 24, 12180–12195. [Google Scholar] [CrossRef]
  8. Rehman, S.U.; Gruhn, V. A Sequential VGG16+ CNN based Automated Approach with adaptive input for efficient detection of knee Osteoarthritis stages. IEEE Access 2024, 12, 62407–62415. [Google Scholar] [CrossRef]
  9. Guo, B.; Zhang, J.; Li, X. River extraction method of remote sensing image based on edge feature fusion. IEEE Access 2023, 11, 73340–73351. [Google Scholar] [CrossRef]
  10. Koh, C.Y.; Ali, M.; Hendawi, A. CrackLens: Automated Sidewalk Crack Detection and Segmentation. IEEE Trans. Artif. Intell. 2024, 5, 5418–5430. [Google Scholar] [CrossRef]
  11. Luo, J.; Lin, H.; Wei, X.; Wang, Y. Adaptive canny and semantic segmentation networks based on feature fusion for road crack detection. IEEE Access 2023, 11, 51740–51753. [Google Scholar] [CrossRef]
  12. Mishra, A.; Gangisetti, G.; Khazanchi, D. An Investigation Into the Advancements of Edge-AI Capabilities for Structural Health Monitoring. IEEE Access 2024, 12, 25325–25345. [Google Scholar] [CrossRef]
  13. Li, B.; Guo, H.; Wang, Z.; Wang, F. Automatic Concrete Crack Identification based on Lightweight Embedded U-Net. IEEE Access 2024, 12, 148387–148404. [Google Scholar] [CrossRef]
  14. Gul, S.; Khan, M.S. A survey of audio enhancement algorithms for music, speech, bioacoustics, biomedical, industrial, and environmental sounds by image U-Net. IEEE Access 2023, 11, 144456–144483. [Google Scholar] [CrossRef]
  15. Hussain, M. Yolov1 to v8: Unveiling each variant—A comprehensive review of yolo. IEEE Access 2024, 12, 42816–42833. [Google Scholar] [CrossRef]
  16. Khankeshizadeh, E.; Mohammadzadeh, A.; Arefi, H.; Mohsenifar, A.; Pirasteh, S.; Fan, E.; Li, J. A novel weighted ensemble transferred U-Net based model (WETUM) for postearthquake building damage assessment from UAV data: A comparison of deep learning-and machine learning-based approaches. IEEE Trans. Geosci. Remote Sens. 2024, 62, 1–17. [Google Scholar] [CrossRef]
  17. Naseer, I.; Akram, S.; Masood, T.; Rashid, M.; Jaffar, A. Lung cancer classification using modified u-net based lobe segmentation and nodule detection. IEEE Access 2023, 11, 60279–60291. [Google Scholar] [CrossRef]
  18. He, M.; Lau, T.L. Crackham: A novel automatic crack detection network based on u-net for asphalt pavement. IEEE Access 2024, 12, 12655–12666. [Google Scholar] [CrossRef]
  19. Alruwaili, M.; Atta, M.N.; Siddiqi, M.H.; Khan, A.; Alhwaiti, Y.; Alanazi, S. Deep learning-based YOLO models for the detection of people with disabilities. IEEE Access 2023, 12, 2543–2566. [Google Scholar] [CrossRef]
  20. Bai, T.; Lv, B.; Wang, Y.; Gao, J.; Wang, J. Crack Detection of track slab based on RSG-YOLO. IEEE Access 2023, 11, 124004–124013. [Google Scholar] [CrossRef]
Figure 1. Improved VGG16 architecture.
Coatings 15 00641 g001
Figure 2. Framework of crack image segmentation based on improved VGG16 and U-Net.
Coatings 15 00641 g002
Figure 3. Schematic diagram of YOLO’s operating principle.
Coatings 15 00641 g003
Figure 4. YOLO-based target detection framework.
Coatings 15 00641 g004
Figure 5. Post-processing flowchart for overlapping areas.
Coatings 15 00641 g005
Figure 6. UY-VGG16 operation process diagram.
Coatings 15 00641 g006
Figure 7. Comparison of precision and loss rates of models during training. (a) Precision of models. (b) Loss rates of models.
Coatings 15 00641 g007
Figure 8. Comparison of positioning accuracy of different models using two datasets. (a) Localization accuracy of SDNET2018. (b) Localization accuracy of DeepCrack.
Coatings 15 00641 g008
Figure 9. Comparison of detection errors of models in terms of crack width and length. (a) MAE in crack width detection. (b) MAE in crack length detection.
Coatings 15 00641 g009
Figure 10. Comparison of crack extraction effects of different models. (a) Crack detection of CrackFormer. (b) Crack detection of Yolov8-seg. (c) Crack detection of UY-VGG16.
Coatings 15 00641 g010
Figure 11. Comparison of recognition accuracy of models under different conditions. (a) Model crack detection accuracy under different noise conditions. (b) Crack recognition under different illumination conditions.
Coatings 15 00641 g011
Table 1. Comparison of efficiency metrics across different models.
ModelFPSProcessing Time (ms)AP (%)
UY-VGG16383693.2
UY-VGG16-Tiny472484.6
UY-VGG16-Fast402889.7
Yolov8-seg314390.5
CrackFormer166782.4
Table 2. Crack width detection errors of different models under various conditions.
ModelUY-VGG16 (mm)UY-VGG16-Tiny (mm)UY-VGG16-Fast (mm)
Surface roughnessSmooth±4.0±5.3±4.6
Moderate±4.9±6.7±5.7
Rough±5.6±8.3±6.6
InterferenceSoil-covered±5.4±7.4±6.1
Partial occlusion±5.1±6.8±5.9
Water stain±4.8±6.6±5.6
Disclaimer/Publisher’s Note: The statements, opinions and data contained in all publications are solely those of the individual author(s) and contributor(s) and not of MDPI and/or the editor(s). MDPI and/or the editor(s) disclaim responsibility for any injury to people or property resulting from any ideas, methods, instructions or products referred to in the content.

