Article

The Development and Experimental Validation of a Surface Roughness Prediction Model for the Vertical Vibratory Finishing of Blisks

by
Yan Zhang
1,2,
Yashuang Zhang
3,
Liaoyuan Zhang
1,2,
Wenhui Li
1,2,*,
Xiuhong Li
1,2 and
Kun Shan
3
1
College of Mechanical Engineering, Taiyuan University of Technology, Taiyuan 030024, China
2
Shanxi Key Laboratory of Precision Machining, Taiyuan 030024, China
3
AECC Shenyang Liming Aero-Engine Co., Ltd., Shenyang 110043, China
*
Author to whom correspondence should be addressed.
Coatings 2025, 15(6), 634; https://doi.org/10.3390/coatings15060634
Submission received: 1 May 2025 / Revised: 21 May 2025 / Accepted: 23 May 2025 / Published: 25 May 2025

Abstract

:
The surface roughness of blisks during vibratory finishing is a critical evaluation index for their processing effect. Establishing a surface roughness prediction model helps reveal the processing mechanism and guide the optimization of process parameters. Therefore, based on wear theory and the least squares centerline system, a relationship between the surface roughness and material removal depth was established, and a scratch influence factor was introduced to correct the impact of surface scratches on the theoretical model. Interaction parameters between the blisk and granular media were obtained through discrete element simulations and used as input parameters for the model. Machining experiments were conducted to solve the model coefficients and verify the model’s effectiveness. The results show that the average error between the surface roughness model predictions and experimental results is 11.8%. As the machining time increases, the surface roughness exhibits three successive stages: accelerated decrease, decelerated decrease, and stability. The surface roughness decreases most rapidly at 48 min of machining and reaches the machining limit at 198 min. The surface roughness prediction model established in this study effectively reveals the coupling mechanism between the scratch accumulation and material removal during vibratory finishing, providing a basis and methodology for determining the process parameters in blisk vibratory finishing.

Graphical Abstract

1. Introduction

The blisk (an integrated structure of blades and disks widely used in precision machinery such as aero-engines) has the advantages of a stable structure, light weight, etc., which can significantly improve the performance of aero-engines [1,2]. The blisk serves for a long time under complex working conditions of high temperatures, high pressures, and high speeds. Its surface integrity has a great impact on the service performance and lifespan of the engine [3]. Vibratory finishing (a non-cutting process that achieves surface grinding through the vibration of granular media, such as silicon carbide abrasive particles) has the advantages of a high processing efficiency, good processing effect, simple equipment operation, etc. While reducing the surface roughness, it can effectively introduce residual compressive stress [4,5]. At present, vibratory finishing has been widely applied in the finishing process of blisks [6].
During vibratory finishing, the blisk is in a forced dynamically balanced liquid–particle coupled flow field. The granular media (abrasive materials with both a high hardness and cutting ability, as well as a certain strength and toughness, are used for grinding or lapping, e.g., silicon carbide abrasive particles) exert a comprehensive trace grinding effect on the surface of the blisk through collision, rolling, sliding friction, scratching, etc., with different degrees of force, thus achieving the finishing processing of the blisk surface. Among them, the dynamic behavior of the granular media is the main factor affecting the processing effect of the blisk. Kang et al. [7] established a motion model for vibratory finishing using the discrete element method (DEM) and predicted the motion trajectories and speeds of the granular media. Zhang et al. [8] conducted a combined simulation of the flow field in vibratory finishing using EDEM and RecurDyn and tested the motion of granular media and workpieces using X-rays. Their motion is a combined movement of circular motion, radial elliptical motion, and rotational motion. Yabuki et al. [9] used a new type of freely moving sensor to test the normal and tangential forces of the granular media, indicating that the action behaviors of the granular media include collision, direct rolling, and indirect rolling. Wang et al. [10] proposed a method for classifying the action behaviors of the granular media based on the duration of the normal force, dividing the normal force into collision, short-term scratching, and long-term scratching. They believed that the movement of the granular media mainly characterized by short-term scratching has a higher processing efficiency for the workpiece.
The surface roughness is an important factor affecting the service performance and service life of parts [11,12]. Xia et al. [13] found through research that when the surface roughness of the bearing decreases from 0.4 μm to 0.02 μm, the fatigue life can increase by three times. Hao et al. [14] revealed the differences in the evolution of the surface topography caused by tangential force and normal force and illustrated the influencing rules of the forces in the forms of collision and scratching on the change in the surface roughness. Establishing an accurate surface roughness model is crucial for revealing the machining mechanism, optimizing process parameters, and improving the product quality and performance. Deng et al. [15] established an empirical model of surface roughness for the chemical mechanical finishing of single-crystal SiC based on the backpropagation neural network method, which can accurately predict the process parameters after finishing with this machining method, but it cannot reveal the machining mechanism therein. Yang et al. [16] better revealed the evolution mechanism of the chemical and mechanical effects on the surface topography by establishing a numerical model of the evolution of the surface topography during chemical mechanical finishing. Peng et al. [17] simplified the initial surface topography into a triangular array and established a prediction model of surface roughness for superfinishing chemical mechanical finishing, revealing the relationship between the material removal and surface roughness and obtaining the optimal process parameters. Empirical models are affected by the experimental environment and have the problem of a small applicable range. Relatively speaking, theoretical models can better reveal the machining mechanism and have a wider range of applicability.
Establishing a surface roughness model for the vibratory finishing and grinding of blisks can, on the one hand, reveal its machining mechanism and, on the other hand, optimize the process parameters to achieve the goals of improving the machining efficiency and enhancing the machining uniformity. What differentiates the vertical vibratory finishing and grinding of blisks from other mechanical finishing methods is that the granular characteristics of the granular medium lead to the inability to quantitatively represent the interaction state (force and relative velocity) between it and the blisk. Therefore, a method for constructing a surface roughness prediction model combining simulation and theoretical models is proposed. Based on the wear theory and the least squares median line system of surface roughness, this paper introduces the formula for the influence of surface roughness scratches to obtain a theoretical model of surface roughness. The vibratory finishing and grinding simulation and machining experiments of blisks are carried out to solve and verify the model coefficients, and a surface roughness prediction model for the vertical vibratory finishing and grinding of blisks is constructed, which has a better universality. It provides a research method for predicting the machining effect and optimizing the process parameters of the vibratory finishing and grinding of blisks.

2. Vertical Vibratory Finishing of Blisks

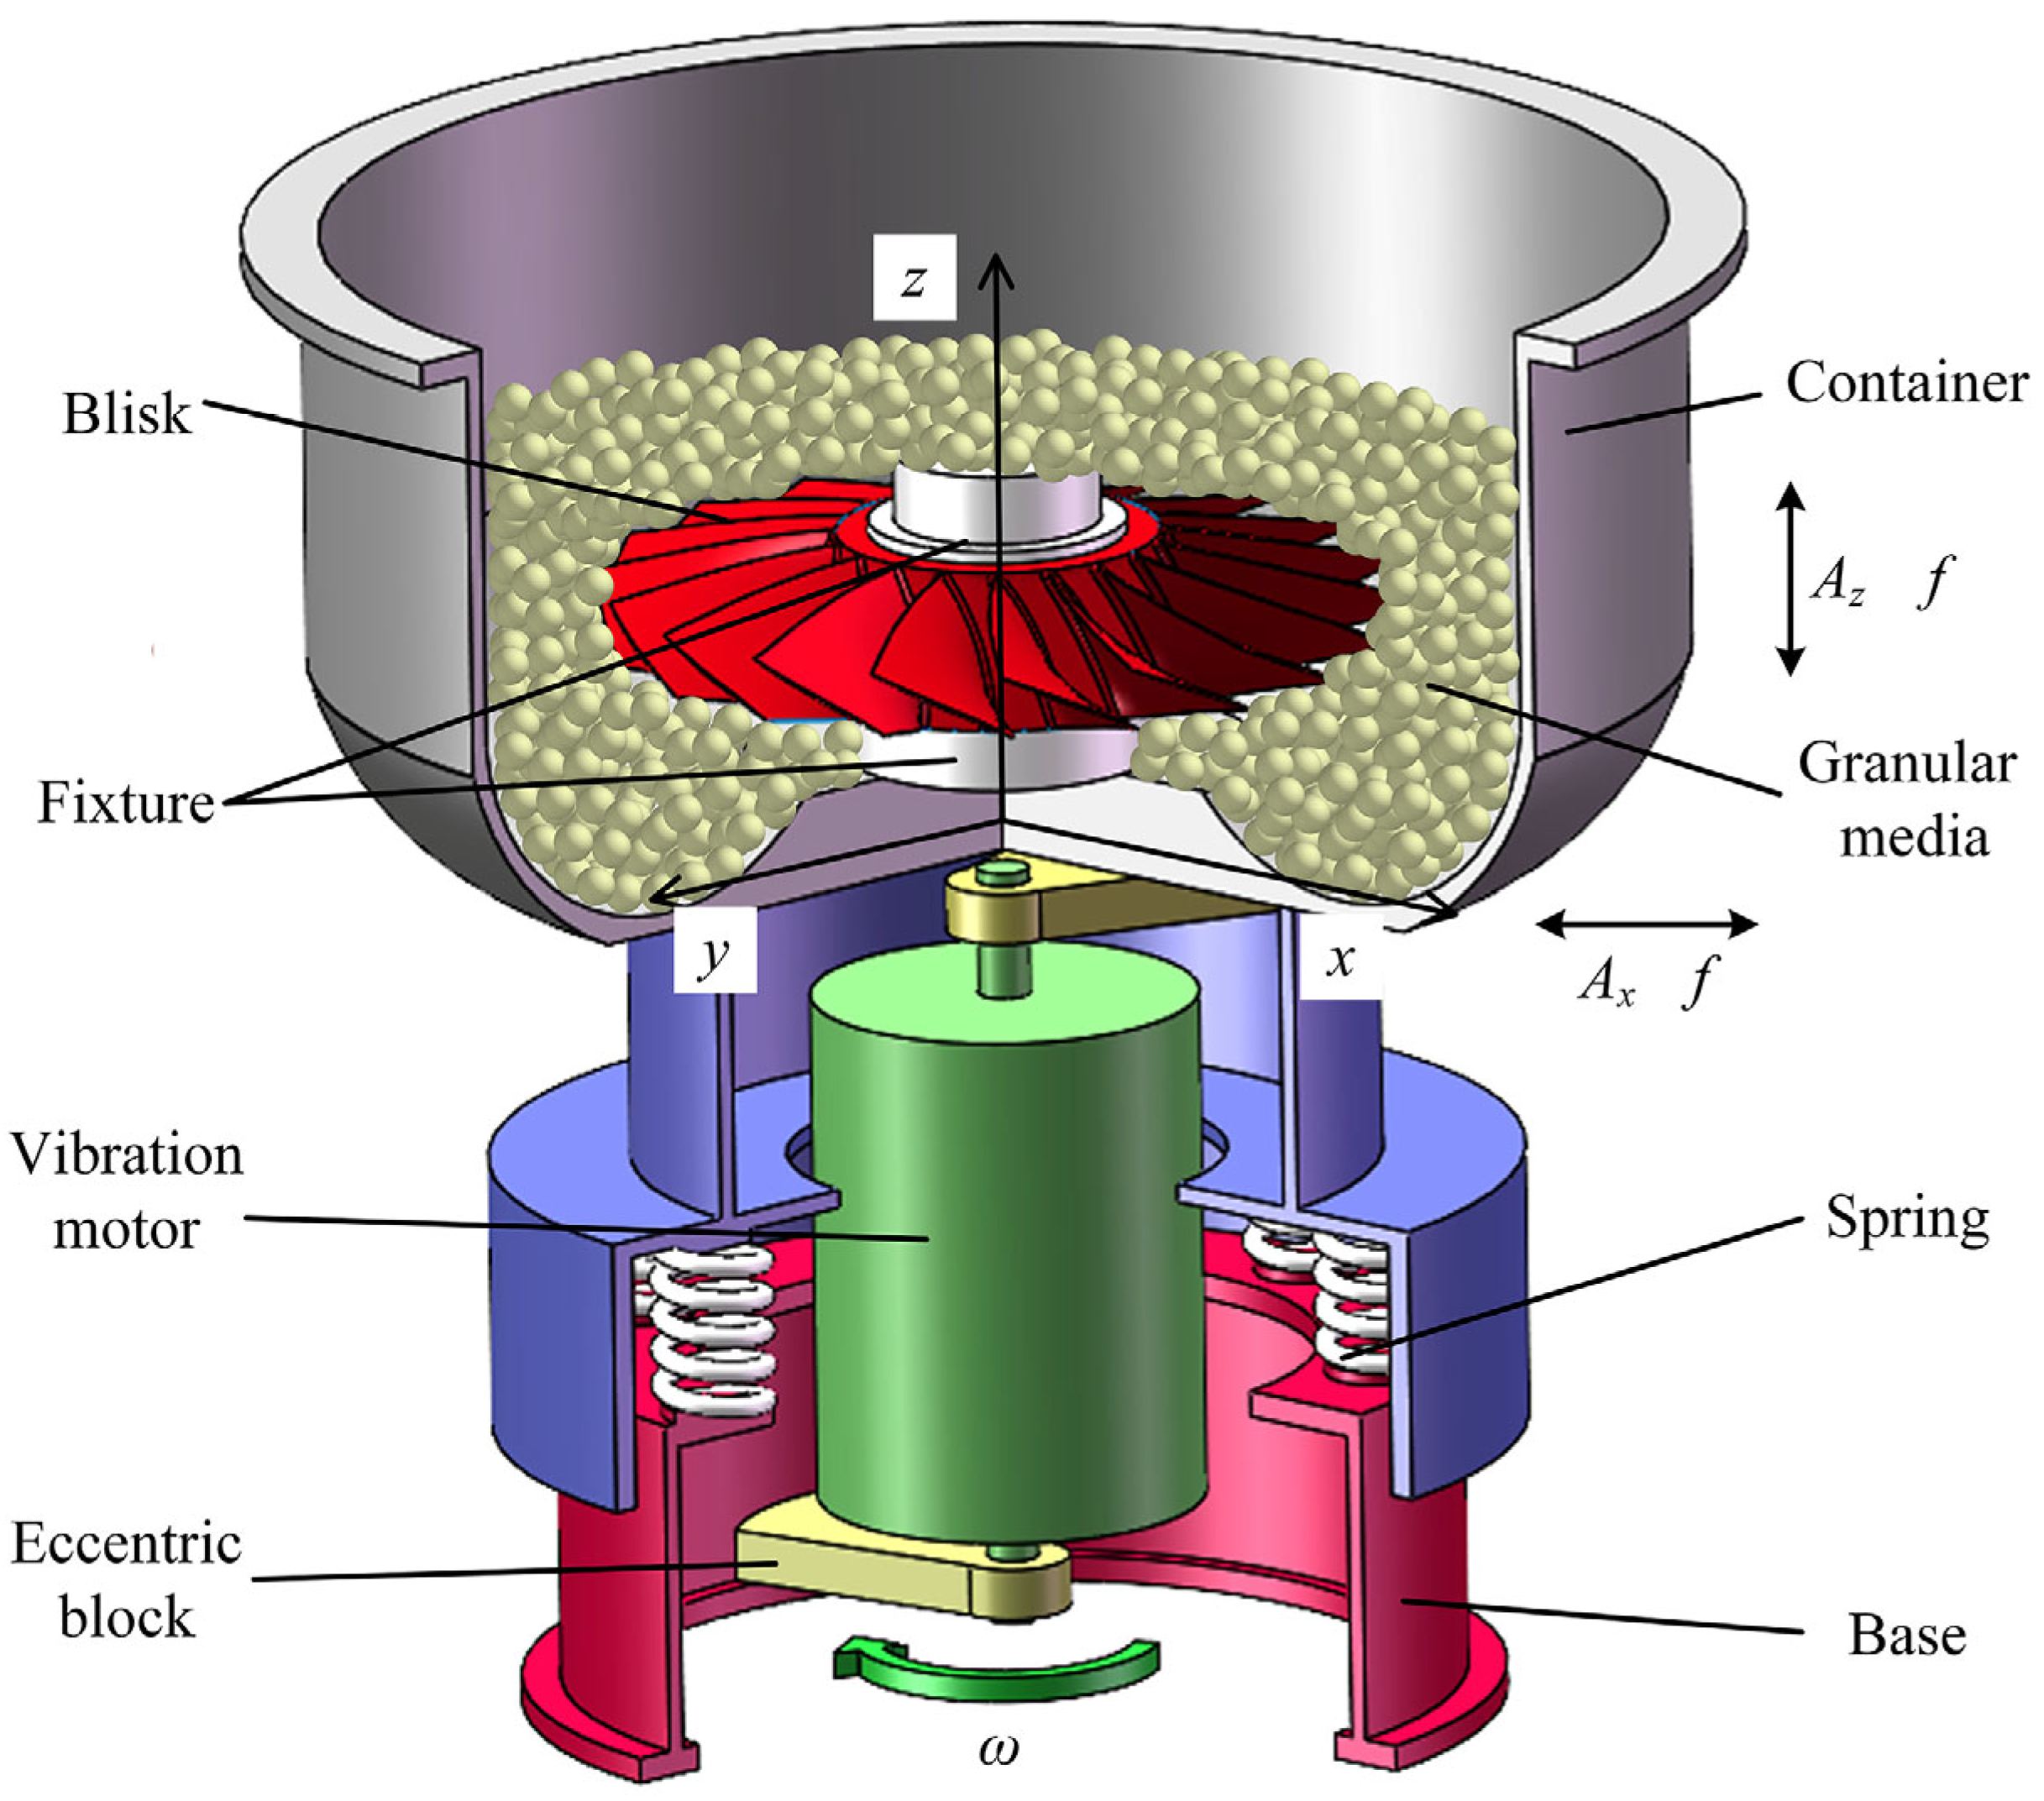
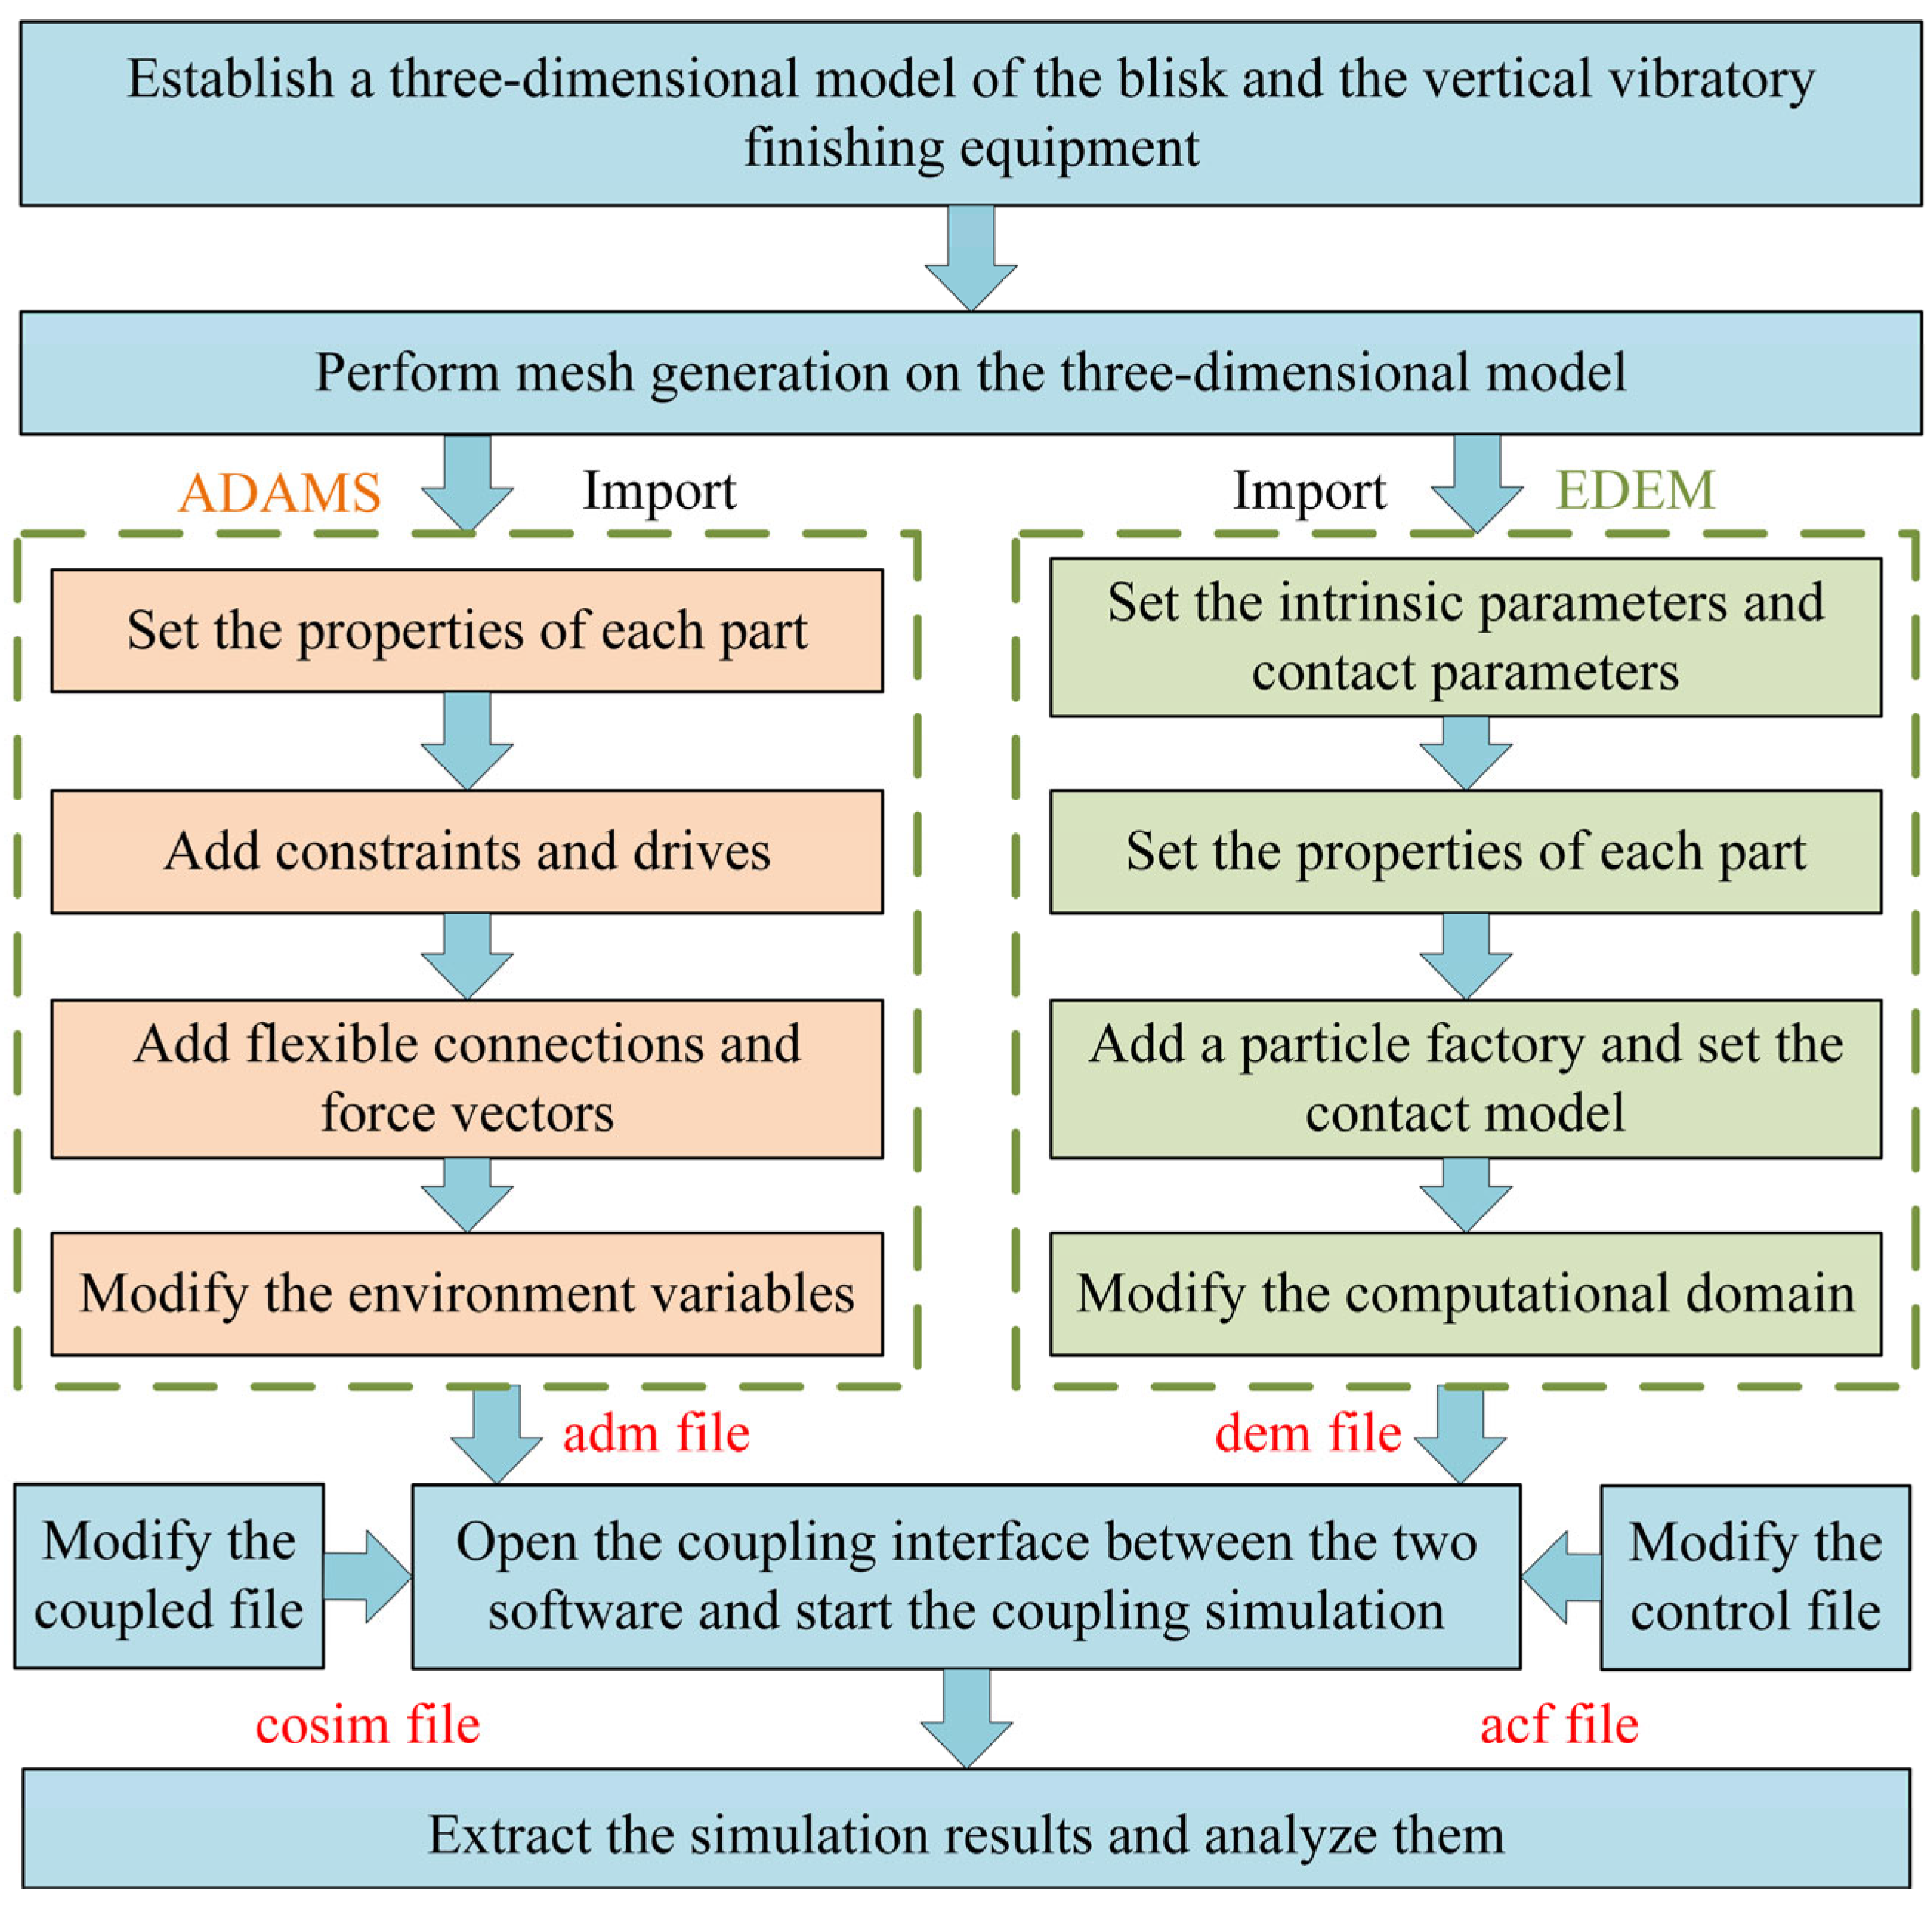
2.1. Processing Principle and Simulation Parameters

The processing principle of the vertical vibratory finishing of the blisk is shown in Figure 1. Before processing, a fixture is used to coaxially fix the blisk and the container, and the granular medium and liquid medium are added. During processing, the blisk is in a forced dynamically balanced liquid–particle coupling flow field. The container and the blisk perform a complex three-dimensional elliptical motion in space. While in motion, the granular medium exerts comprehensive negligible grinding effects, such as collision, rolling, sliding, and scratching, on the surface of the blisk with different degrees of force, so as to achieve the finishing of the blisk.
The vertical vibratory finishing system, as a multi-body dynamics system of rigid–flexible and granular bodies, uses an ADAMS-EDEM coupling simulation to analyze the interaction behavior between the granular medium and the parts. As shown in Figure 2, the principle of the ADAMS-EDEM coupling simulation is that within each time step, ADAMS transmits the motion information, such as the displacement and velocity of each geometric body, in its model to the corresponding geometric body in the EDEM model. The geometric body in EDEM undergoes a corresponding motion and is subjected to the forces and torques exerted by the granular medium on it. Then, the information, such as the forces and torques, is calculated and transmitted to the corresponding geometric body in ADAMS. At the beginning of the next time step, ADAMS will recalculate the motion of each geometric body according to its own motion information and the transmitted force information. Eventually, the two interact and transmit data cyclically to achieve coupling.
The maximum outer diameter of the container of the vertical vibratory finishing equipment used in this paper is 560 mm, the maximum depth is 220 mm, and the volume is approximately 60 L. The equipment parameters are shown in Table 1. The vibrating body includes the blisk, the container, the granular medium, and the vibratory motor.
The discrete element method (DEM) is a computational method for dealing with the mechanical problems of discontinuous media [18]. It has been widely used in predicting granular media system behaviors, including vibratory finishing. The material and contact parameters simulated using the EDEM 2021 software simulation are shown in Table 2 and Table 3 [19]. We use spherical alumina granular media with a diameter of 6 mm to fill 60% of the container’s volume and set the Rayleigh time step as 20%.
The normal force exerted by the granular medium on the blisk and the tangential relative velocity are important factors affecting the machining effect. The complex curved surface structure of the blade leads to differences in the forces and velocities of the granular medium at different positions on it. In order to analyze the machining differences in the granular medium on the blisk, the normal forces and tangential relative velocities at different positions of the blade are extracted, and the extraction positions are shown in Figure 3. The red dots indicate the positions of data blocks, and the numbers are the labels of the data blocks. Specifically, the direction from the blade tip to the blade root is labeled as 1 to 5, and the direction from the exhaust edge to the intake edge is labeled as I to V.

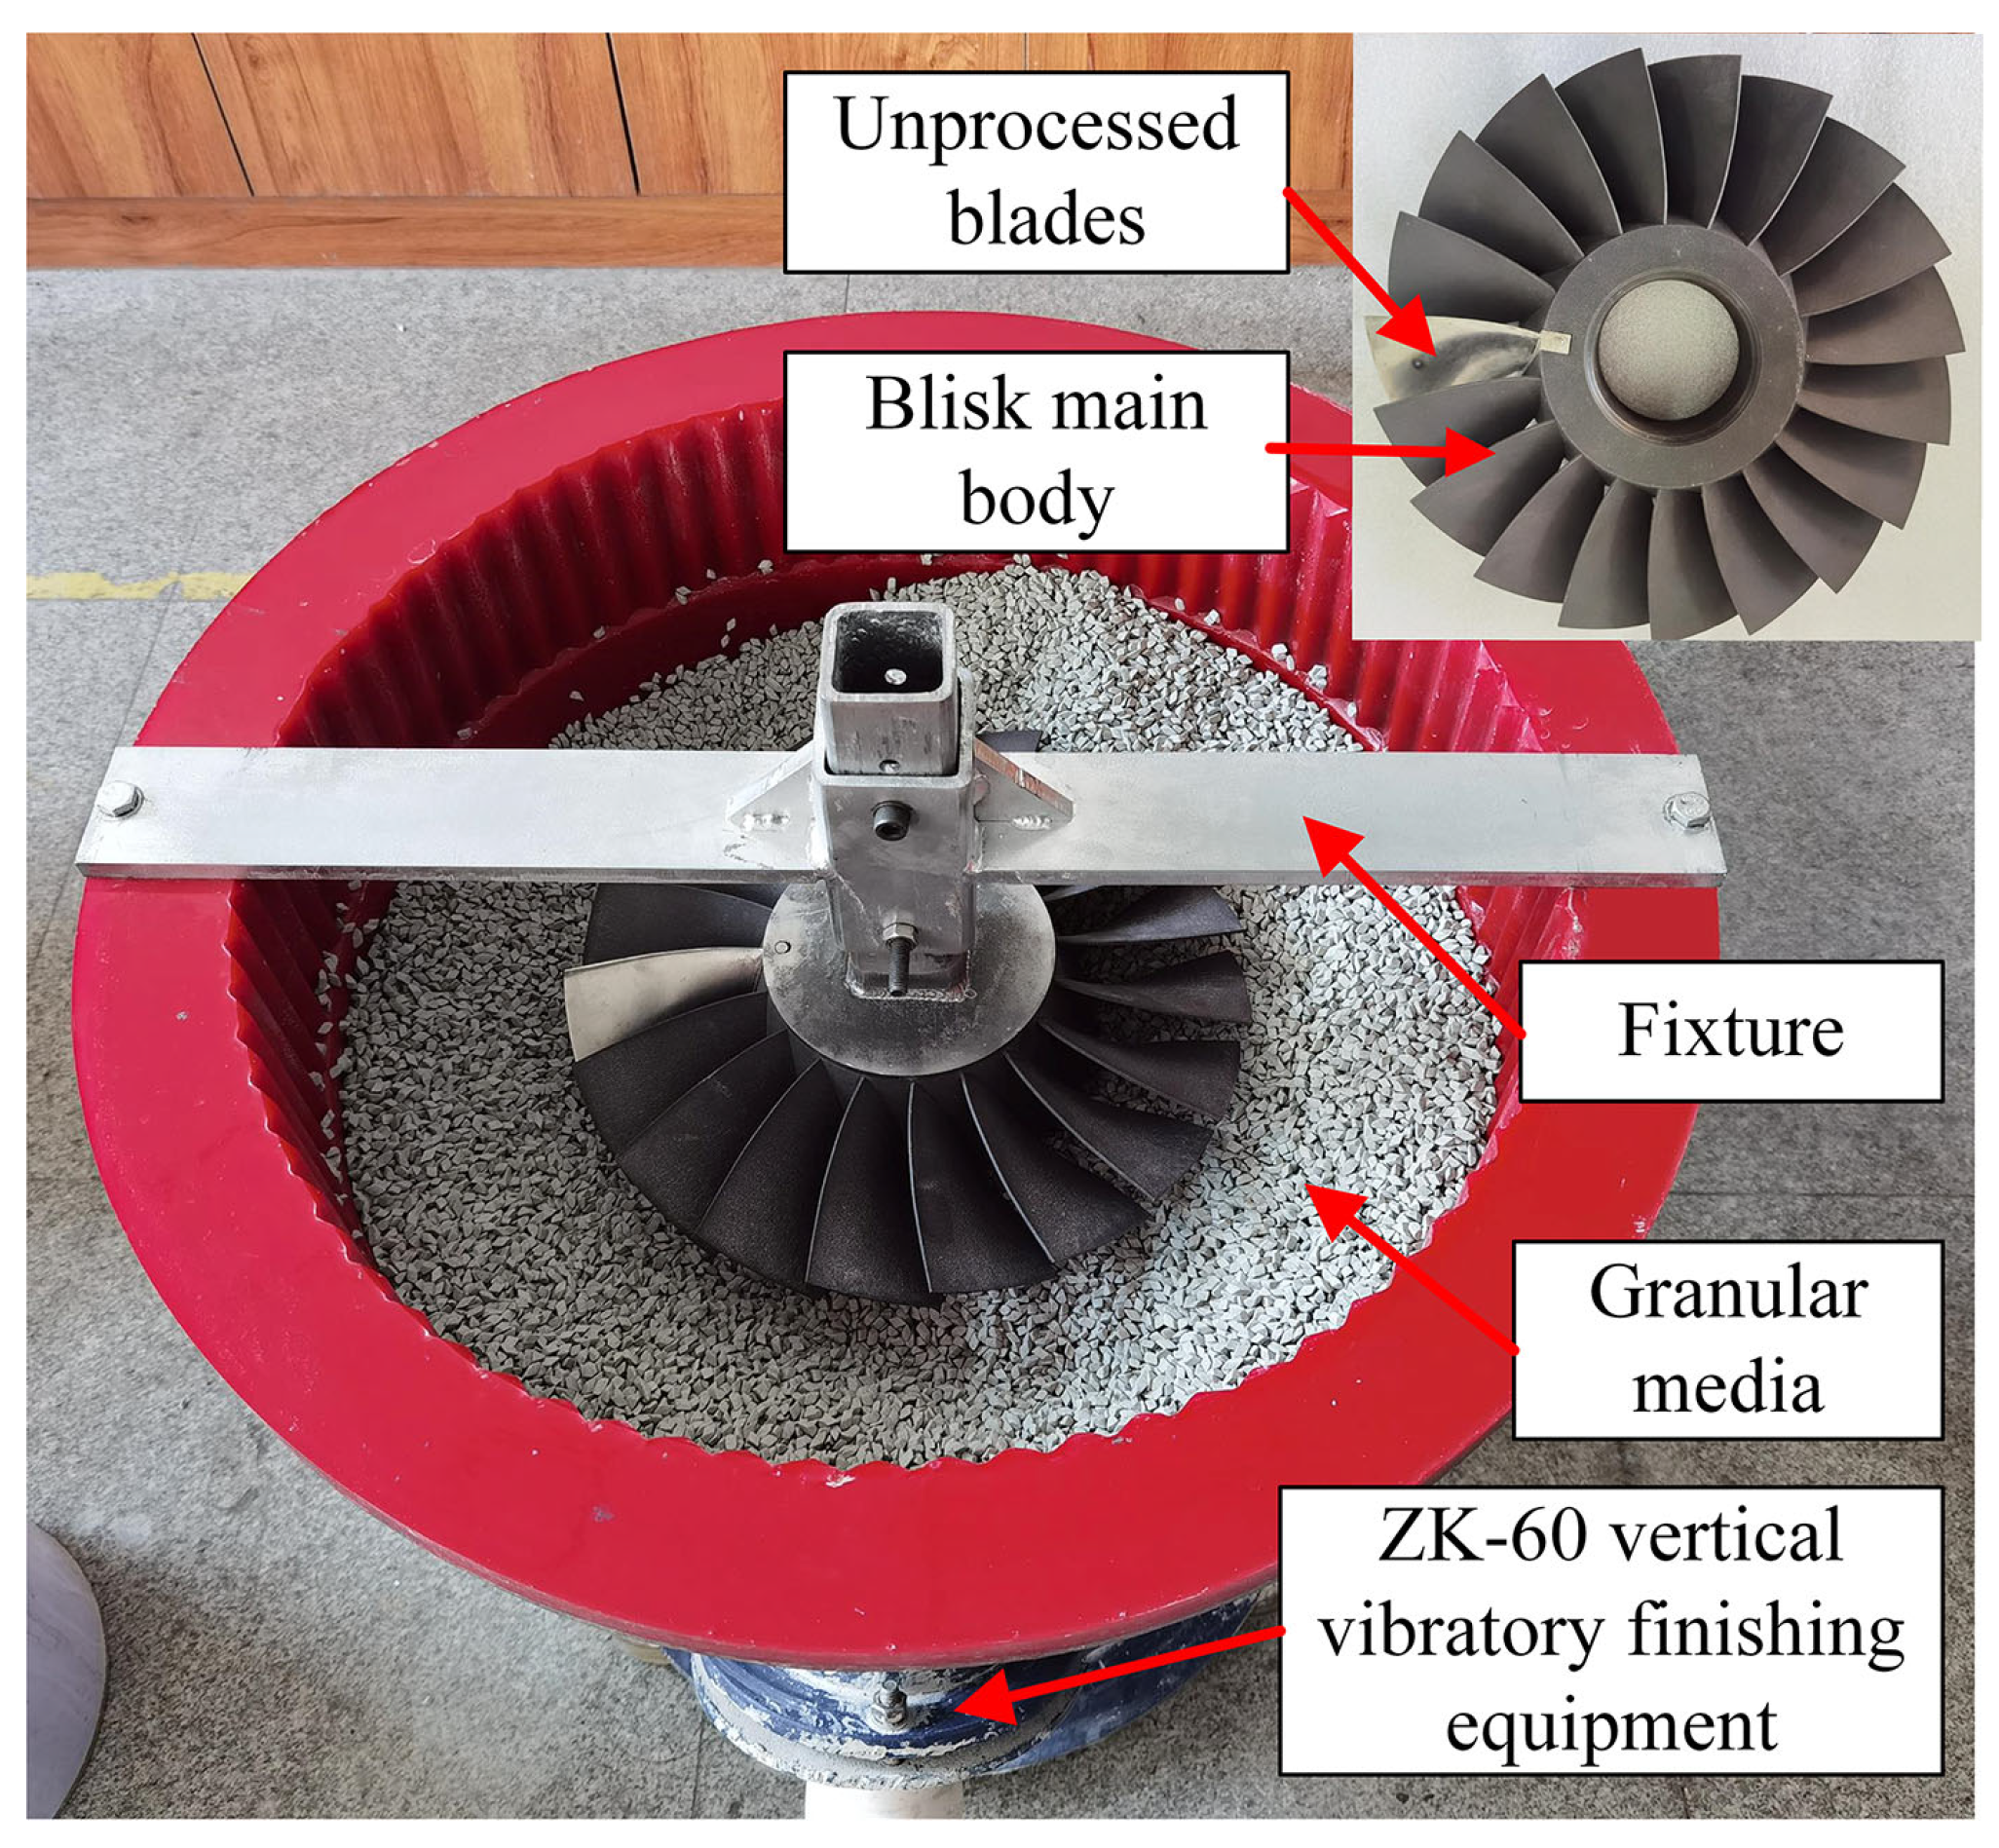
2.2. Experimental Device and Testing Method

The vertical vibratory finishing device for the blisk is shown in Figure 4. For the convenience of the measurement in this experiment, the blisk is composed of a blade to be processed and the blisk body. The blisk body is a PTFE-modified 3D-printed part, and the blade to be processed is a titanium alloy 3D-printed part which has been roughly milled and ground with a grinding wheel [20,21]. The blisk is coaxially fixed with the container of the vertical vibratory finishing equipment through a fixture, and its installation height is 40 mm. In the experiment, a 5 × 5 mm oblique triangular silicon carbide granular medium is selected, and the filling amount is 70% of the container volume. The granular medium is an important factor affecting the processing effect. The shape and size of the granular medium in the experiment are different from those in the simulation. This is because only a spherical granular medium can be used in the simulation, while the use of an oblique triangular granular medium in vibratory finishing can achieve a better processing effect. A spherical granular medium with a diameter of 6 mm and an oblique triangular granular medium with a size of 5 × 5 are selected. Their volumes are the same to ensure that the forces exerted by the two types of particulate media on the blisk are of the same magnitude. The liquid medium is 200 mL of an HYF liquid medium (Beifang Tianyu Electromechanical Co., Ltd., Langfang, China), which is mixed with water at a ratio of 1:10.
In order to compare the material removal depth and surface roughness changes at different positions of the blisk blade, it is necessary to ensure that the test position is the same each time. The method of punching positioning + measurement is used to test the material removal depth and surface roughness of the blade surface. That is, before processing, the micro-axis electrical discharge punching technology is used to punch and mark the position to be measured. The diameter of the small hole is approximately 170 μm, and the depth is 50–100 μm. By testing the hole profile and surface roughness before and after processing, and calculating the hole height difference, the material removal depth is obtained.

3. The Construction of the Theoretical Model of Surface Roughness

During the vibratory finishing process of the blisk, the removal of surface materials is accompanied by changes in surface roughness. Hashimoto et al. [22] believe that there are three basic laws in vibratory finishing:
  • There is a limit value for the surface roughness of the parts in vibratory finishing.
  • The greater the difference between the surface roughness and the limit value of the surface roughness, the faster the change rate of the roughness.
  • Vibratory finishing has a constant material removal rate during the steady-state process.
During the vibratory finishing process of the blisk, with the increase in the processing time, the surface tool marks are removed, and the crests and troughs are reduced. Among them, there are mainly two removal states of the surface topography, namely the transient removal state and the steady-state removal state, and the principle is shown in Figure 5. In the early and middle stages of processing, it shows a combined removal state of transient removal and steady-state removal, and in the later stage of processing, it shows a steady-state removal state.

3.1. The Steady-State Stage

Based on Archard’s [23] wear theory, the formula for the volume of the material removal Vs is
V s = k s F n L s H
where ks is the steady-state material removal coefficient; Fn is the normal force acting on the worn surface of the action area; Ls is the relative sliding distance; and H is the surface hardness of the workpiece.
In order to obtain the expression of the material removal depth hs varying with the processing time t in the steady-state stage, we transform Formula (1) into
A h s = k s p s A v t t H
where A is the contact area; ps is the average pressure on the contact surface; vt is the tangential velocity of the relative sliding; and t is the duration of the relative sliding distance.
The model of the material removal depth in the steady-state stage is expressed as
h s = k s p s v t H t
The surface roughness value Ra in the steady-state stage has been dynamically fluctuating around the processing limit value of the surface roughness. Therefore, the surface roughness value Ra in the steady-state stage is expressed as
R a s = R a min

3.2. The Transient Stage Model

In order to establish the surface roughness model for the transient stage, it is necessary to simplify the surface topography into an idealized geometric shape. For example, Misra et al. [24] regarded the initial contour surface as an array of uniform triangular ridges. As shown in Figure 6a, the surface topography of the blade of the blisk after grinding, although there is slight randomness on the real surface in the sense of large-scale statistics, can be approximated as a regular ridge arrangement, ignoring the microscopic local differences. Due to wear, the tips of the triangular ridges on the surface contour of the blisk will have a certain degree of incompleteness. In order to more accurately represent the changes in the surface contour, a simplified two-dimensional surface contour of a trapezoidal array is established, as shown in Figure 6b. Among them, x1 is the length in the x direction at the top of the initial surface contour, h1 is the height difference in the y direction between the triangular ridge contour and the initial surface trapezoidal contour, xt is the length in the x direction at the top of the surface contour at time t, ht is the material removal depth at time t, x0 is the length in the x direction at the bottom of the surface contour, and h0 is the height in the y direction of the initial surface contour. The black dashed line is the least squares center line of the trapezoidal ridge topography at time t.
After processing for time t, the surface topography can be expressed as [25]
h 0 h t = y ( x t )
Through Formula (1), it can be obtained that
0 h t n t x t L t d h t = 0 t n t k s p s x 0 L t v t H d t
where nt is the number of trapezoidal ridges; Lt is the length of the trapezoidal ridges in the z direction.
The Preston equation [26] is an empirical formula widely used in machining processes such as grinding and finishing, and its expression is
h p = k p p s v t = k p F n v t A
where hp is the material removal depth per unit time; kp is the Preston coefficient, which is related to the type of particle medium (particle size, shape, and hardness), the material properties of the machined workpiece, and the characteristics of the surface topography, etc.
According to Formula (3), under the condition that the processing conditions remain unchanged, the material removal depth is inversely proportional to the contact area. Therefore, the material removal depth at time t can be expressed as
y ( x t ) = c x t L t
where c is a constant.
After substituting Formula (5) into Formula (3):
0 h t c h 0 h t d h t = 0 t k s p s x 0 v t H d t
Taking kt = ksx0/c, the expression for the material removal depth in the transient stage is
h t = h 0 ( 1 e k t p s v t H t )
where kt is the dimensionless transient material removal coefficient.
At present, the evaluation method of the surface roughness adopts the center line system standard, which is a calculation system for evaluating the contour with the center line (the least squares center line of the contour) as the reference line. For the convenience of the solution, taking the valley point as the origin o, the direction at the bottom of the surface contour as the x-axis direction, and the direction perpendicular to the x-axis as the y-axis direction, a rectangular coordinate system xoy is established. The surface trapezoidal contour at machining time t can be expressed as
y = 2 ( h 0 h t ) x 0 x t x ( 0 x x 0 x t 2 ) h 0 h t ( x 0 x t 2 x x 0 + x t 2 ) 2 ( h 0 h t ) x 0 x t x + 2 x 0 ( h 0 h t ) x 0 x t ( x 0 + x t 2 x x 0 )
Let the expression of the least squares center line at time t be
y = y t
In order to solve for yt, let the objective function be
min f ( y t ) = 0 x 0 y ( x ) y t d x
The expression for the least squares center line is obtained as
y = h 0 + h 1 2 ( 0 h t h 0 + h 1 2 ) h 0 h t ( h 0 + h 1 2 h t h 0 )
By statistically analyzing the length relationship between x1 and x0 in the surface topography, it is found that after calculating the average values of the two within the sampling length, the relationship is approximately x0/x1 = 4, that is, h1 = h0/3. At this time, (h1 + h0)/2 = 2h0/3 and ht = h0/3. The relationship model between the surface roughness and the material removal depth in the transient stage is expressed as
R a = 1 x 0 x y y t d x = 8 h 0 2 ( 3 h t + h 0 ) 2 24 h 0   ( 0 h t h 0 3 ) 3 ( h 0 h t ) 2 8 h 0 ( h 0 3 h t h 0 )
Based on Formula (15), the variation law of the surface roughness with the material removal depth is obtained, as shown in Figure 7. The initial surface roughness of the trapezoidal ridge profile is 7h0/24. In the transient stage, the surface roughness decreases first at an accelerating rate and then at a decelerating rate as the material removal depth increases. When the material removal depth is h0/3, the surface roughness decreases at the fastest speed, and, at this time, the value of the surface roughness is h0/6.

3.3. Surface Roughness Model

By combining the transient material removal model and the steady-state removal model, the material removal dept h(t) is expressed as
h ( t ) = h 0 ( 1 e k t p s v s H t ) + k s p s v t H t
The surface topography of the test piece after the vibratory finishing reaches the processing limit is shown in Figure 8a. The surface topography is not a smooth surface, but a typical P-shaped texture with characteristics such as fine particles, protrusions, and no specific direction. During the vibratory finishing process, while the granular media exert minor effects such as impacts, sliding friction, and scratching on the surface of the test piece, it will also leave processing marks on the surface of the test piece and form a P-shaped texture. These processing marks will prevent the surface roughness from decreasing further and lead to the achievement of the processing limit. In order to establish a more accurate surface roughness model, it is necessary to further consider the influence of the processing marks of the granular media on the surface roughness based on the relationship between the surface roughness and the material removal depth. Therefore, the processing scratches are simplified into smaller triangular ridge-shaped protrusions, and the two-dimensional surface contour at time t is shown in Figure 8b. As the processing time increases, the proportion of the processing marks on the surface of the test piece increases linearly, and the influence on the surface roughness also increases.
When the limit value of the surface roughness is reached, the peak-to-valley value of the scratches generated by the action of the granular media on the surface of the blisk is the same as the peak-to-valley value remaining after the initial surface processing. Let the processing limit time be t2, and, at this time, the material removal depth is ht = h0—4Ramin. In the vibratory finishing process, due to the influence of the processing marks of the granular media on the surface roughness, the surface roughness scratch influence formula Ra1 is proposed, and its expression is
R a 1 = ( R a min 6 R a min 2 h 0 ) t t 2
Finally, the surface roughness value Ra(t) is expressed as
R a ( t ) = 8 h 0 2 ( 4 h 0 3 e k t p s v t H t + 3 k s p s v t H t ) 2 24 h 0 + ( R a min 6 R a min 2 h 0 ) t t t s ( 0 t t 1 ) 3 ( h 0 e k t p s v t H t k s p s v t H t ) 2 8 h 0 + ( R a min 6 R a min 2 h 0 ) t t t s ( t 1 t t 2 ) R a min ( t t 2 )
The variation law of the surface roughness is shown in Figure 9. The surface roughness value Ra is divided into a stage of accelerating decrease, a stage of decelerating decrease, and a stable stage as the processing time increases. When the processing time reaches t1, the stage of the accelerating decrease ends, and, at this time, the surface roughness value is h0/6. When the processing time reaches t2, the stage of the decelerating decrease ends and the surface roughness reaches the processing limit and remains stable. The duration of the stage of the accelerating decrease and the decrease value of the surface roughness are lower than the duration of the stage of the decelerating decrease and the decrease value of the surface roughness.

4. The Verification of the Surface Roughness Model

4.1. Solution of Model Coefficients

Through a systematic extraction and in-depth analysis of the simulation data, the average normal force Fn of the granular media at the position Ⅲ-3 on the back of the blade is 0.308 N, and the average tangential velocity vt is 0.246 m /s. The acting area A is calculated as 1.6 × 10⁻⁵ m2, and the surface hardness H of the processed test piece is measured to be 4.01 GPa using a nano-indentation tester.
The method of the punching positioning and measurement is used to test the material removal depth and surface roughness at the position Ⅲ-3 on the back of the blade. The surface topography at different processing times is shown in Figure 10. Before processing, there are a large number of grinding textures on the surface of the blade, with an obvious differentiation between wave crests and wave troughs. The surface roughness Ra near the hole is 0.775 ± 0.253 μm. After 90 min of vibratory finishing, most of the scratches are removed, and there are still a few grinding textures remaining. The surface roughness Ra near the hole is 0.348 ± 0.145 μm. After 240 min of vibratory finishing, all the grinding textures are effectively removed, and the surface shows obvious anisotropy. The surface topography is significantly improved, and the surface roughness Ra near the hole is 0.169 ± 0.07 μm approximately.
The average height h0 of the initial surface contour of the blisk is 2.79 μm. When t is 150 min, the material removal depth h(150) is 2.23 μm. The steady-state material removal rate MMRh is 2.4 × 10⁻³ μm /min, and the limit value Ramin of the surface roughness is 0.169 μm.
The steady-state material removal coefficient ks can be expressed as
K s = M R R h H p s v t
where MMRh is the steady-state material removal rate.
The transient material removal coefficient kt can be expressed as
K t = H ln ( 1 H h ( t ) k s p s v t t H h 0 ) p s v t t
Through calculation, the steady-state material removal coefficient is ks = 3.37 × 10⁻⁵ and the transient material removal coefficient is kt = 1.35 × 10⁻⁴. We substitute the steady-state material removal coefficient ks and the transient material removal coefficient kt into the formula, and the surface roughness model of the vertical vibratory finishing for the blisk is
R a ( t ) = 0.0159 ( 8.373 e t 104 + 0.0723 t + 11.16 ) 2 + 0.000592 t ( 0 t 48 ) 0.134 ( 2.791 e t 104 0.00241 t ) 2 + 0.000592 t ( 48 t 194 ) 0.169 ( t 194 )

4.2. Model Validation

The evolution of the surface roughness of position Ⅲ-3 on the back of the blade during the vertical vibratory finishing and grinding of the blisk is shown in Figure 11. The surface roughness value rapidly decreases from the initial 0.775 μm to 0.328 μm after 100 min of machining and then slowly decreases to 0.169 μm during the subsequent 140 min of machining and remains dynamically fluctuating around 0.169 μm. In the early stage of the machining, the decreasing speed of the results of the surface roughness model is lower than the actual results. This is because there are oxide layers and impurities on the surface of the blisk before finishing, making the surface texture easier to remove, which leads to a faster decrease in the surface roughness value in the early stage of machining. In the middle stage of machining, that is, from 100 min to 240 min, the decreasing speed of the results of the surface roughness model is greater than the actual results. This is because the actual parts have surface textures of different depths, and the lower texture valleys will reduce the decreasing speed of the surface roughness value. The results show that the variation patterns of the results of the theoretical model of the surface roughness value Ra and the experimental results are generally consistent. The average error of 8.40% between the two verifies the correctness of the variation in the surface roughness with time.
The normal forces and the relative tangential velocities with the granular media acting on different positions of the blisk are different, which leads to differences in the surface roughness. In order to verify the applicability of the surface roughness model at different positions of the blisk, the normal forces and relative tangential velocities at 25 positions on the back side of the blades of the blisk were extracted, as shown in Figure 12a,b. The normal force acting on the blade is 0.186~0.565 N. The normal force experienced by the blade tip area of the blade is greater than that of the blade root area. This is mainly because the blisk is coaxially fixed with the container, and the vertical vibratory finishing system has a swinging motion during its operation [27]. This swinging motion leads to a larger motion amplitude in the blade tip area, thus making the normal force exerted by the granular media on this area greater. The relative velocity between the blade and the granular media is 0.148~0.782 m/s. Due to the granular characteristics of the granular media, the fluidity of the granular media in the edge area of the blisk is better. Therefore, the relative tangential velocity between the edge area of the blisk and the granular media is greater than that in the profile area.
To prevent the surface roughness data from being invalid due to excessive machining, the machining time was set to 100 min. Through model calculations and experimental testing, the model results and experimental results of the surface roughness at different positions of the blisk were obtained, as shown in Figure 12c,d. By comparing the model results with the experimental results, it is found that the experimental results of the surface roughness in the edge area of the blisk are smaller, such as at positions Ⅰ-5 and Ⅴ-5. This is because the simulation data results are for a small area, and the experimental test positions are smaller and closer to the edge. Therefore, the experimental results are more likely to reach the limit value of the surface roughness. In the surface roughness model, the machining limit value is a fixed value, while in actual machining, the limit value of the surface roughness fluctuates dynamically. The distribution patterns of the surface roughness model results and the experimental results at different positions during the vertical vibratory finishing of the blisk are the same; the model results are 0.169~0.472 μm and the experimental results are 0.162~0.493 μm. The average error of 11.8% between the two indicates that the prediction accuracy of the constructed surface roughness model is unaffected by the part’s shape and structure, enabling the prediction of the surface roughness at different positions of complex parts.

5. Conclusions

In order to predict the surface roughness of the blisk, this paper proposes a method for predicting the surface roughness by combining simulation and theoretical models. Based on Archard’s wear theory and the two-dimensional surface profile of the trapezoidal ridge, the characteristics of the transient and steady-state stages of vibratory finishing are analyzed. Based on the calculation system of the least squares center line, taking into account the influence of scratches on the surface roughness, a formula for the influence of scratches on the surface roughness is introduced, and a surface roughness prediction model is established. The discrete element simulation of the vertical vibratory finishing of the blisk and machining experiments are carried out to solve the model coefficients and verify the effectiveness of the model. The main conclusions are as follows:
  • The change in the surface roughness during the vertical vibratory finishing and grinding of the blisk is divided into a transient stage and a steady-state stage. In the transient stage, as the depth of the material removal increases, the surface roughness decreases first at an accelerating rate and then at a decelerating rate. When the depth of the material removal is h0/3, the rate of the decrease in the surface roughness is the fastest. In the steady-state stage, the depth of the material removal increases linearly, and the surface roughness value does not change.
  • In order to improve the accuracy of the prediction model, a simplified two-dimensional surface profile of a trapezoidal array is established based on the initial surface profile of the blisk. The machining marks caused by the granular media on the parts are the main factors affecting the machining limit of the surface roughness. A formula for the influence of scratches is introduced, and a theoretical model of surface roughness is established. The surface roughness value Ra, with the increase in the machining time, can be divided into three stages: the stage of the decreasing growth rate, the stage of decreasing at a decelerated speed, and the stable stage.
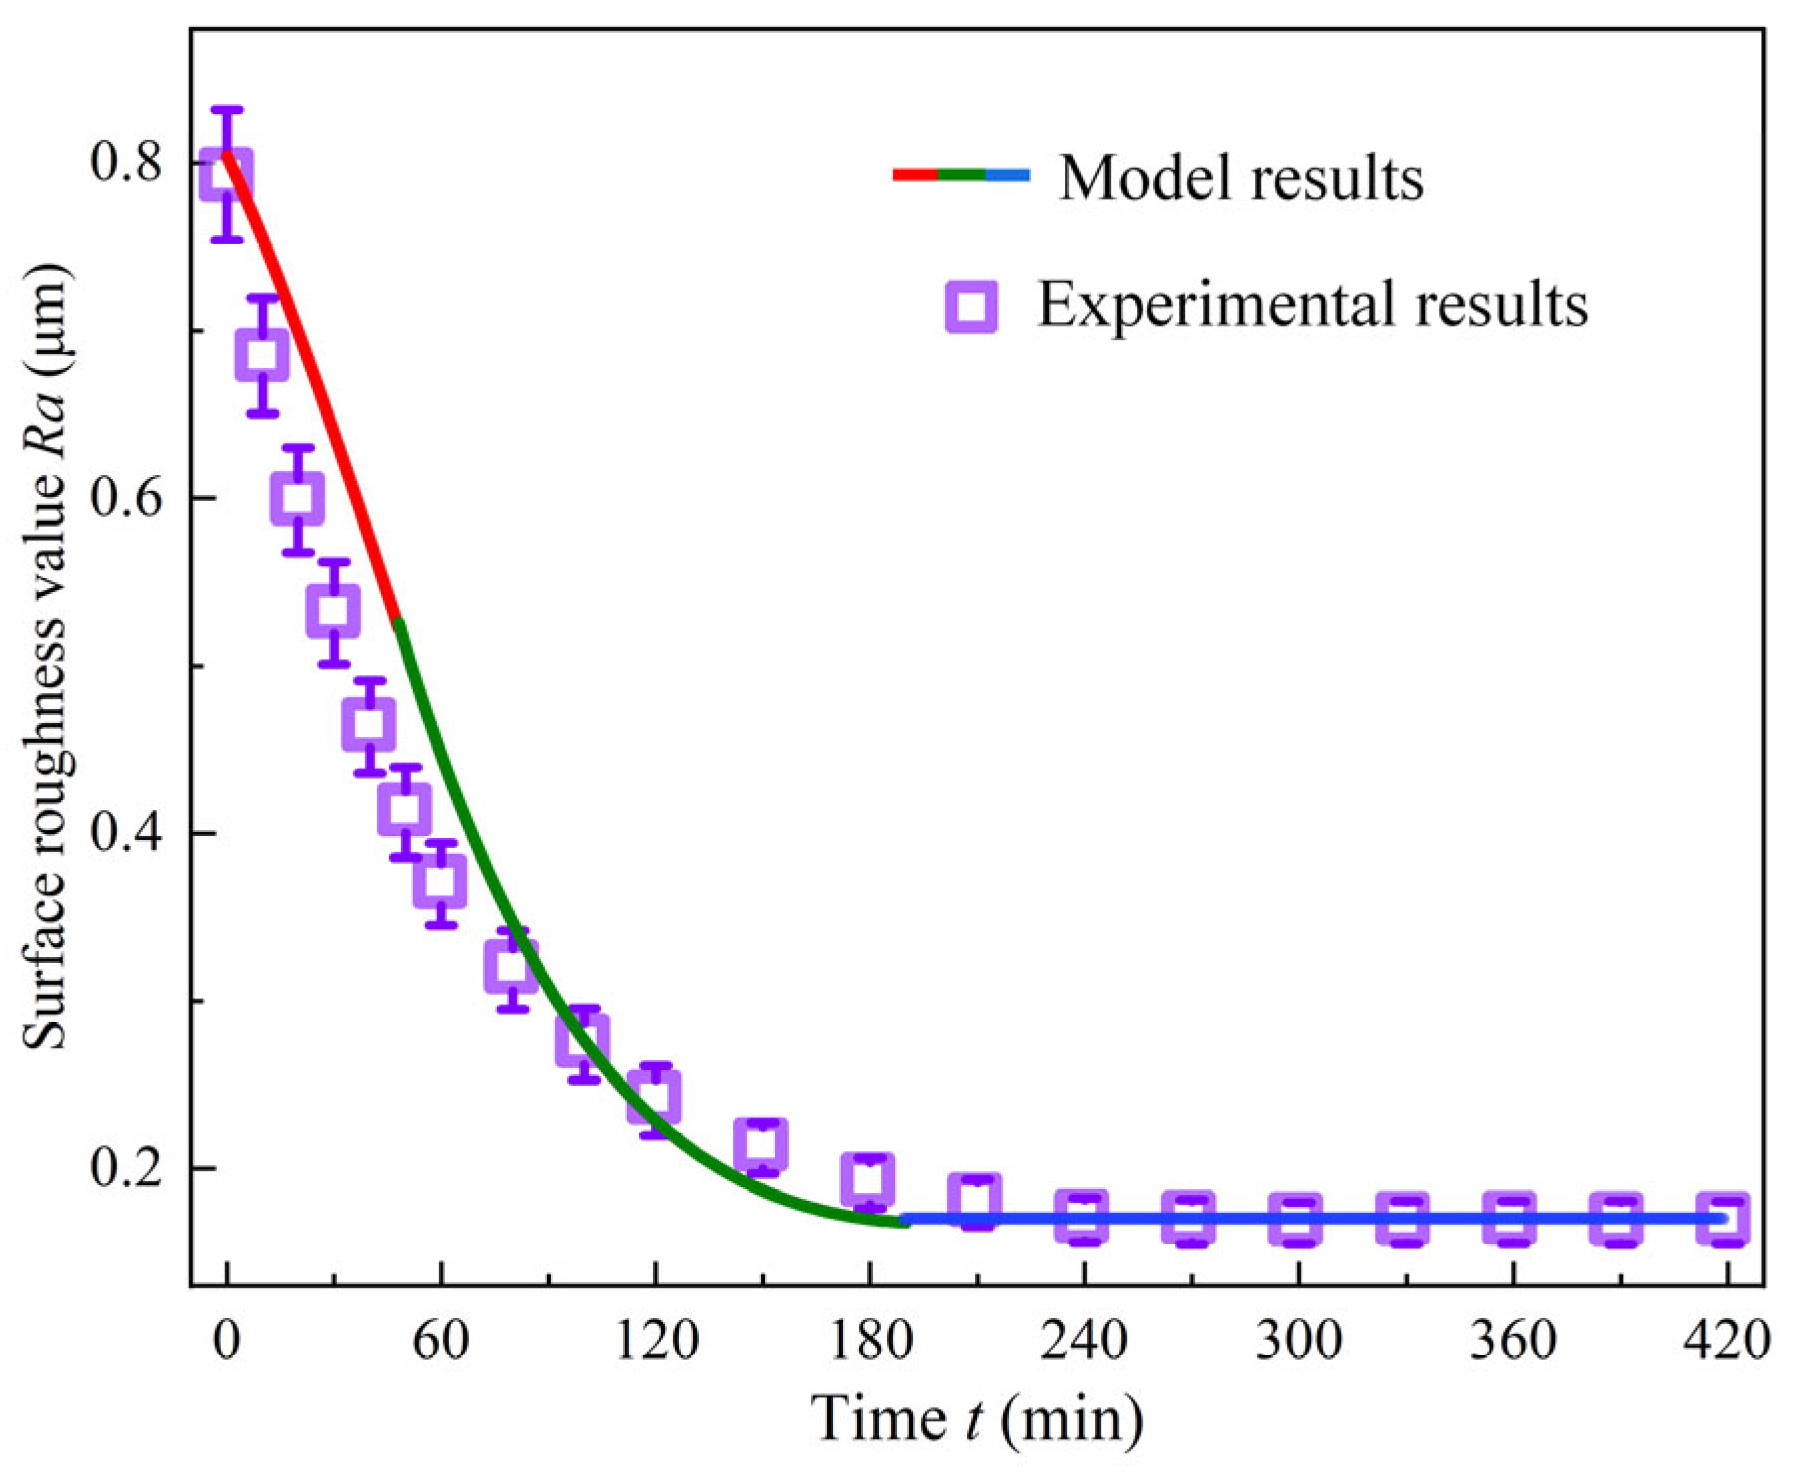
  • The vertical vibratory finishing and grinding experiment of the blisk was carried out. In combination with the results of the normal force and relative tangential velocity from the simulation, the steady-state material removal coefficient, ks = 3.37 × 10⁻⁵, and the transient material removal coefficient, kt = 1.35 × 10⁻⁴, were solved. As the machining time increases, the results of the prediction model for the vertical vibratory finishing and grinding of the blisk and the experimental results both decrease. The average error between the two is 8.40%, which verifies the correctness of the model.
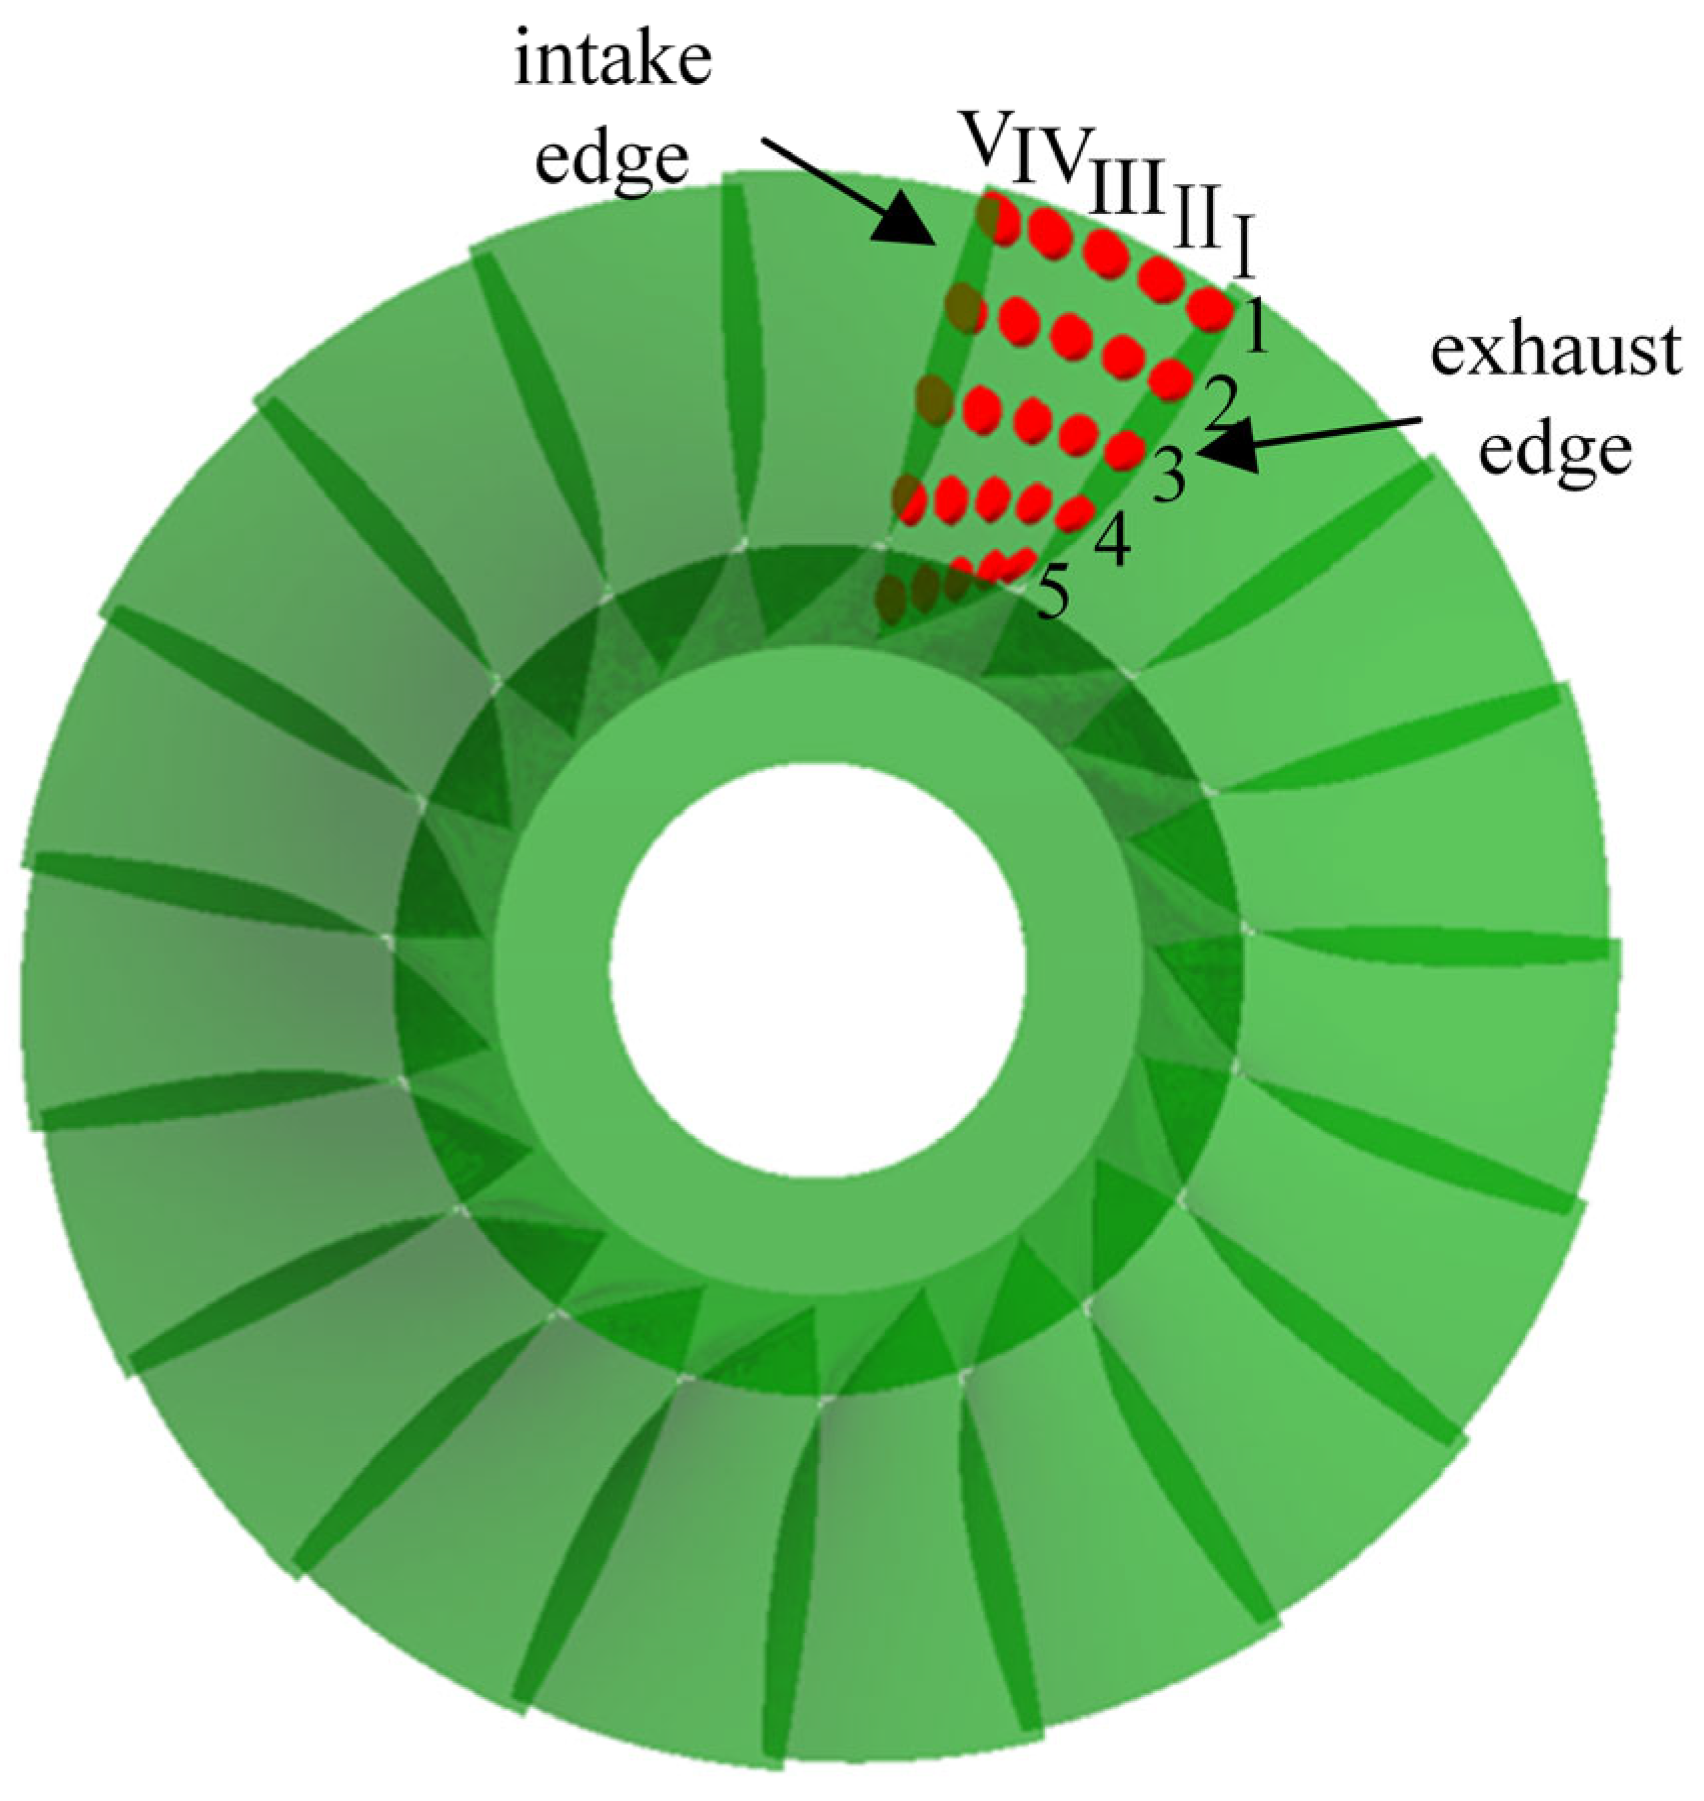
  • The normal force acting on the blade tip area of the blade is greater than that on the blade root area, and the relative tangential velocity between the edge area and the granular media is greater than that in the profile area. After 100 min of machining, the model results are 0.169~0.472 μm, and the experimental results are 0.162~0.493 μm. The average error between the two is 11.8%, which further demonstrates the effectiveness of the constructed surface roughness model.
This paper constructs a prediction model for the surface roughness of the vertical finishing of blisks by combining simulation and theoretical models, achieving a high prediction accuracy. It provides a research method for predicting the processing effects of the vibratory finishing and grinding of blisks and optimizing the process parameters. Since the granular media is an important factor affecting the limit value of the surface roughness. In the future, research will be carried out on the influence of the material, shape, and size of the granular media on the processing efficiency of blisks and the limit value of the surface roughness, so as to improve this prediction model.

Author Contributions

Conceptualization, Y.Z. (Yan Zhang) and W.L.; data curation, Y.Z. (Yan Zhang), Y.Z. (Yashuang Zhang) and L.Z.; formal analysis, Y.Z. (Yan Zhang), Y.Z. (Yashuang Zhang) and L.Z.; funding acquisition, W.L. and X.L.; investigation, Y.Z. (Yan Zhang), Y.Z. (Yashuang Zhang), W.L. and K.S.; methodology, W.L. and X.L.; software, Y.Z. (Yan Zhang), Y.Z. (Yashuang Zhang) and K.S.; validation, Y.Z. (Yan Zhang) and L.Z.; writing—original draft, Y.Z. (Yan Zhang); writing—review and editing, W.L. and X.L. All authors have read and agreed to the published version of the manuscript.

Funding

This work was co-supported by the National Natural Science Foundation of China (Grant Nos. 51875389 and 51975399) and the Central Government Guides Local Foundation for Science and Technology Development (Grant Nos. YDZJSX2022A020 and YDZJSX2022B004).

Institutional Review Board Statement

Not applicable.

Informed Consent Statement

Not applicable.

Data Availability Statement

Data will be made available on request.

Conflicts of Interest

Yashuang Zhang and Kun Shan are employed by the company AECC Shenyang Liming Aero-Engine Co., Ltd. The remaining authors declare that the research was conducted in the absence of any commercial or financial relationships that could be construed as a potential conflict of interest.

References

  1. Luo, S.; Liao, L.; Wang, Y. A Novel Process of Chemical-Mechanical Fluid-Solid Coupling Polishing with High-Quality and High-Efficiency for Turbine Blisk. J. Manuf. Process. 2024, 131, 494–506. [Google Scholar] [CrossRef]
  2. Uluğ, D.; Katmer, Ş.; Yavaş, Ç.; Şeker, U.; Kurt, M. Effects of Cutting Parameters in Fine Milling Processes of Blisk. Int. J. Precis. Eng. Manuf. 2024, 26, 905–918. [Google Scholar] [CrossRef]
  3. Ye, H.; Chen, Z.; Si, C.; Fang, Z. A Novel Shape-Curved Tool Design Aiming at High-Quality Blisk Root-Fillet Surface Polishing. J. Manuf. Process. 2024, 127, 304–313. [Google Scholar] [CrossRef]
  4. Gillespie, L.K. Mass Finishing Handbook, 1st ed.; Industrial Press: New York, NY, USA, 2007; ISBN 978-0-8311-3257-6. [Google Scholar]
  5. Da Silva Maciel, L.; Spelt, J.K. Measurements of Wall-Media Contact Forces and Work in a Vibratory Finisher. Powder Technol. 2020, 360, 911–920. [Google Scholar] [CrossRef]
  6. Wang, J.; Xu, Z.; Zhu, D. Improving Profile Accuracy and Surface Quality of Blisk by Electrochemical Machining with a Micro Inter-Electrode Gap. Chin. J. Aeronaut. 2023, 36, 523–537. [Google Scholar] [CrossRef]
  7. Kang, Y.S.; Hashimoto, F.; Johnson, S.P.; Rhodes, J.P. Discrete Element Modeling of 3D Media Motion in Vibratory Finishing Process. CIRP Ann. 2017, 66, 313–316. [Google Scholar] [CrossRef]
  8. Zhang, C.; Liu, W.; Wang, S.; Liu, Z.; Morgan, M.; Liu, X. Dynamic Modeling and Trajectory Measurement on Vibratory Finishing. Int. J. Adv. Manuf. Technol. 2020, 106, 253–263. [Google Scholar] [CrossRef]
  9. Yabuki, A.; Baghbanan, M.R.; Spelt, J.K. Contact Forces and Mechanisms in a Vibratory Finisher. Wear 2002, 252, 635–643. [Google Scholar] [CrossRef]
  10. Wang, J.; Li, X.; Li, W.; Yang, S. Research of Horizontal Vibratory Finishing for Aero-Engine Blades: Movement Characteristics and Action Behavior of Media. Int. J. Adv. Manuf. Technol. 2023, 126, 2065–2081. [Google Scholar] [CrossRef]
  11. Han, J.; Zhu, J.; Zheng, W.; Wang, G. Influence of Metal Forming Parameters on Surface Roughness and Establishment of Surface Roughness Prediction Model. Int. J. Mech. Sci. 2019, 163, 105093. [Google Scholar] [CrossRef]
  12. Otsuki, T.; Okita, K.; Sasahara, H. Evaluating Surface Quality by Luminance and Surface Roughness. Precis. Eng. 2022, 74, 147–162. [Google Scholar] [CrossRef]
  13. Xia, Z.; Wu, D.; Zhang, X.; Wang, J.; Han, E.-H. Rolling Contact Fatigue Failure Mechanism of Bearing Steel on Different Surface Roughness Levels under Heavy Load. Int. J. Fatigue 2024, 179, 108042. [Google Scholar] [CrossRef]
  14. Hao, Y.; Yang, S.; Chen, H.; Li, X. Evolution Mechanism of the Rough Surface in Vibratory Finishing within Restricted Space. Mater. Manuf. Process. 2024, 39, 825–833. [Google Scholar] [CrossRef]
  15. Deng, J.; Zhang, Q.; Lu, J.; Yan, Q.; Pan, J.; Chen, R. Prediction of the Surface Roughness and Material Removal Rate in Chemical Mechanical Polishing of Single-Crystal SiC via a Back-Propagation Neural Network. Precis. Eng. 2021, 72, 102–110. [Google Scholar] [CrossRef]
  16. Yang, K.; Huang, N.; Di, H.; Zhou, P. Modeling of Surface Microtopography Evolution in Chemical Mechanical Polishing Considering Chemical-Mechanical Synergy. Tribol. Int. 2025, 201, 110206. [Google Scholar] [CrossRef]
  17. Peng, W.; Jiang, L.; Huang, C.; Chen, Y.; Tian, Y.; Han, Y.; Zhang, S.; Qian, L. Surface Roughness Evolution Law in Full-Aperture Chemical Mechanical Polishing. Int. J. Mech. Sci. 2024, 277, 109387. [Google Scholar] [CrossRef]
  18. Liu, G.; Xu, W.; Zhou, Q. DEM Contact Model for Spherical and Polyhedral Particles Based on Energy Conservation. Comput. Geotech. 2023, 153, 105072. [Google Scholar] [CrossRef]
  19. Wang, J.; Li, X.; Li, W.; Cheng, S.; Li, H.; Yang, S. Convection and Motion Characteristics of Granular Media in Horizontal Vibratory Finishing. Granul. Matter 2023, 25, 76. [Google Scholar] [CrossRef]
  20. Li, X.; Li, Z.; He, D.; Ren, J.; Feng, Q.; Tang, K. Efficient Machining of a Complex Blisk Channel Using a Disc Cutter. Chin. J. Aeronaut. 2024, 37, 414–437. [Google Scholar] [CrossRef]
  21. Tu, M.; Yang, J.; Qi, Q.; Ding, H. Efficient Construction of an Interference-Free Region and Tool Orientation Planning for the Robotic Grinding of Blisks. J. Manuf. Process. 2024, 131, 356–368. [Google Scholar] [CrossRef]
  22. Hashinioto, F.; DeBra, D. Modelling and Optimization of Vibratory Finishing Process. Ann. ClRP 1996, 45, 303–306. [Google Scholar] [CrossRef]
  23. Archard, J. Contact and Rubbing of Flat Surfaces. J. Appl. Phys. 1953, 24, 981–988. [Google Scholar] [CrossRef]
  24. Misra, A.; Pandey, P.; Dixit, U. Modeling of Material Removal in Ultrasonic Assisted Magnetic Abrasive Finishing Process. Int. J. Mech. Sci. 2017, 131, 853–867. [Google Scholar] [CrossRef]
  25. Wan, S.; Liu, Y.; Woon, K.S.; Tnay, G.L. A Material Removal and Surface Roughness Evolution Model for Loose Abrasive Polishing of Free Form Surfaces. IJAT 2014, 6, 269. [Google Scholar] [CrossRef]
  26. Preston, F. The Theory and Design of Plate Galss Polishing Machines. J. Soc. Glass Technol. 1927, 11, 214–256. [Google Scholar]
  27. Hashimoto, F.; Johnson, S.P. Modeling of Vibratory Finishing Machines. CIRP Ann. 2015, 64, 345–348. [Google Scholar] [CrossRef]
Figure 1. Schematic of vertical vibratory finishing for blisk.
Coatings 15 00634 g001
Figure 2. ADAMS-EDEM coupled simulation flow.
Coatings 15 00634 g002
Figure 3. Blisk data block distribution.
Coatings 15 00634 g003
Figure 4. Experimental device of blisk vibratory finishing.
Coatings 15 00634 g004
Figure 5. Schematic diagram of surface material removal at different processing stages. (a) Early processing; (b) mid-processing; and (c) late processing.
Coatings 15 00634 g005
Figure 6. A simplified schematic of the 3D morphology and 2D surface profile of the blisk. (a) 3D morphology and (b) 2D surface profile.
Coatings 15 00634 g006
Figure 7. Changing law of surface roughness with depth of material removal in transient phase.
Coatings 15 00634 g007
Figure 8. A simplified schematic of the 3D morphology of the specimen after finishing and the 2D surface profile at time t of the specimen. (a) 3D morphology and (b) 2D surface profile.
Coatings 15 00634 g008
Figure 9. Changing patterns of surface roughness modeling.
Coatings 15 00634 g009
Figure 10. Surface morphology of leaf back III-3 at different times. (a) 0 min; (b) 150 min; and (c) 270 min
Coatings 15 00634 g010
Figure 11. Comparison between theoretical model and experimental results of surface roughness.
Coatings 15 00634 g011
Figure 12. The normal forces, relative tangential velocities, theoretical values of surface roughness, and experimental values of the surface roughness at different positions during the vertical vibratory finishing of the blisk. (a) Normal forces; (b) relative tangential velocities; (c) theoretical values of surface roughness; and (d) experimental values of surface roughness.
Coatings 15 00634 g012
Table 1. Parameters of the vertical vibratory finishing equipment.
ConditionsParameters
Motor rotational speed (r/min)1440
Vibratory body mass (kg)165
Spring horizontal stiffness coefficient (N/m)22,450
Spring vertical stiffness coefficient (N/m)44,630
Spring horizontal damping coefficient (Ns/m)34
Spring vertical damping coefficient (Ns/m)75
Eccentric block mass (kg)1.4
Eccentric block angle (°)90
Table 2. Material intrinsic parameters.
Material ParametersDensity
(kg·m⁻³)
Poisson’s RatioShear Modulus
(Pa)
Container26750.281.24 × 1011
Particles11500.213.2 × 109
Blisk45000.334.5 × 1010
Table 3. Contact parameter.
InteractionCoefficient of Restitution for CollisionCoefficient of Static FrictionCoefficient of Rolling Friction
Particle–particle0.750.30.03
Particle–container0.500.260.10
Particle–blisk0.750.300.05
Disclaimer/Publisher’s Note: The statements, opinions and data contained in all publications are solely those of the individual author(s) and contributor(s) and not of MDPI and/or the editor(s). MDPI and/or the editor(s) disclaim responsibility for any injury to people or property resulting from any ideas, methods, instructions or products referred to in the content.

