1. Introduction
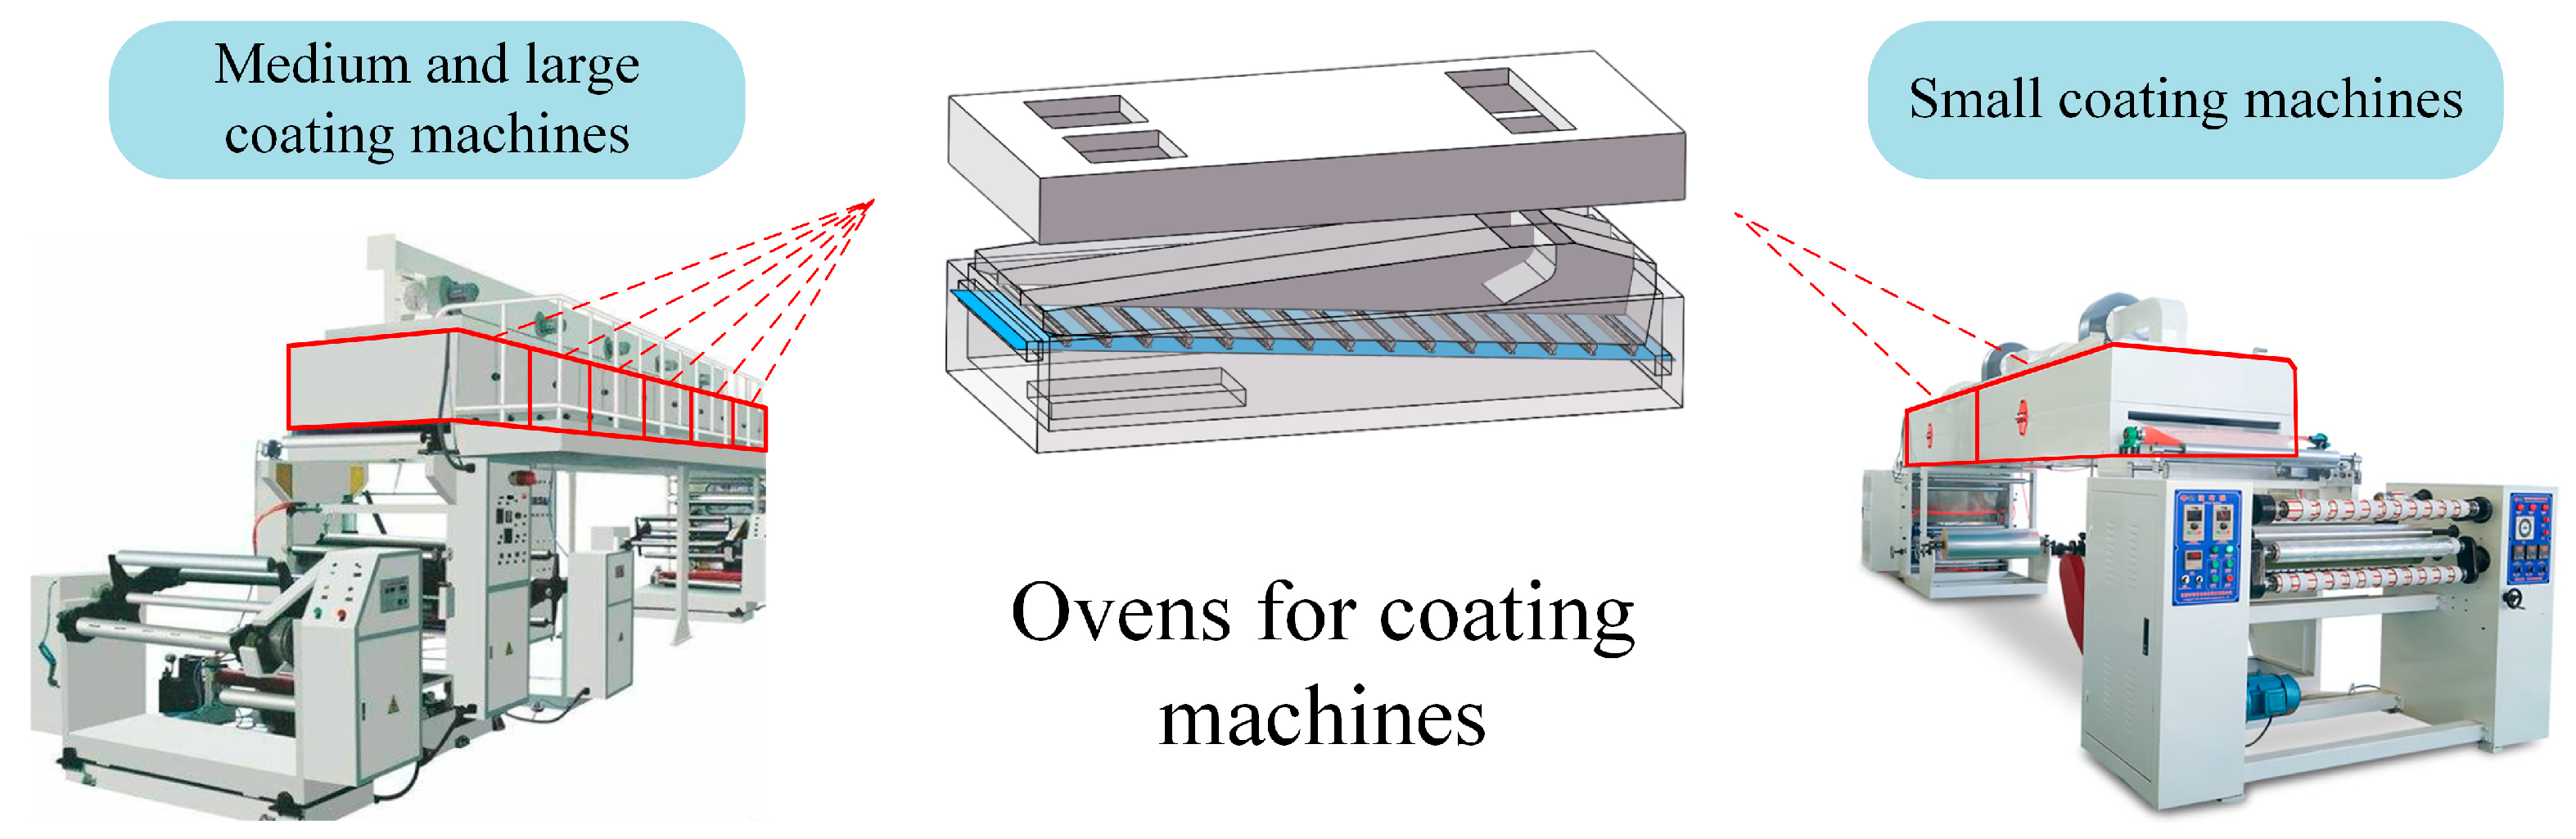
Coating machines are important pieces of equipment for packaging printing, new energy, and other industries; the overall coating machine market size in 2024 reached USD 10 billion, and the global market is predicted to reach USD 15 billion in 2025. The oven is a core component of the drying system of coating machines (shown in
Figure 1), the drying effect of which has a direct impact on the quality of the final printed product. However, the current production and assembly process of these ovens still has problems such as resources are overly dispersed, poor industrial synergy, and a low efficiency of manufacturing resource utilization. In order to solve this problem, new networked manufacturing modes based on the Internet, such as computer-integrated manufacturing, manufacturing grids, agile manufacturing, networked manufacturing, cloud manufacturing, etc., have been continuously proposed, adopting crowdsourcing and utilizing networked manufacturing service synergy platforms to achieve the optimal allocation of oven manufacturing services with the industrial agglomeration of coating equipment manufacturing, which greatly improves the efficiency of the synergies between industrial chains and shortens the oven processing production cycle.
In the crowdsourcing manufacturing environment, manufacturing service combinations are the main routes of oven manufacturing. Manufacturing service combination optimization is a nondeterministic polynomial problem, which needs to take into account the influence of both functional and nonfunctional factors. Guo et al. [
1] proposed a comprehensive composition optimization framework, which converts three interrelated optimization models into a Karush–Kuhn–Tucker condition-based mathematical planning problem with equilibrium constraints, which effectively optimizes the operation of networked IDC. Li et al. [
2] proposed a matching method based on Markov decision process and cross-entropy for the demand problem of complex machine tools in a single collaborative manufacturing task to achieve the matching of manufacturing tasks to manufacturing services. Xiao et al. [
3] proposed a decision-making method for accurately matching manufacturing resources based on multidimensional information fusion. Zeng et al. [
4] proposed an optimization algorithm named improved-TC to solve the problems of the slow convergence and instability of existing methods in large-scale environments. Liu et al. [
5] proposed an optimal selection method for manufacturing resources in roll-guided clouds based on a composite algorithm of scalable clustering and the fuzzy analytic hierarchy process (FAHP), which utilizes an improved extended clustering algorithm combined with the FAHP to achieve optimal co-manufacturing resource selection for optimal guide-roll production equipment. Tabalvandani et al. [
6] proposed two new reliability and cost models to formulate the web-service combination problem as a multi-objective optimization problem, proposing a multi-objective particle swarm optimization algorithm to solve the composition problem in a large search space in a multi-cloud environment (MCE). Shi et al. [
7] achieved the optimal selection of a set of manufacturing resources for sewing machine housings using an extended comprehensive evaluation method based on the ontological modeling of manufacturing resources. However, a composition optimization method for manufacturing services for coating machine ovens has not been proposed yet, and this paper addresses this, carrying out the relevant research.
In terms of the construction of a service composition optimization model, Jing et al. [
8] developed a QoS scheduling model incorporating cloud characteristics to ensure that failures can be tolerated during task execution. Li et al. [
9] proposed a topology-aware neural model for collaborative QoS prediction to make accurate QoS predictions. Zhang et al. [
10] introduced multi-stage multiscale feature fusion with individual evaluations to a deep learning model for accurate QoS prediction. Yu et al. [
11] developed a prediction model using the similarity property of temporal QoS values, which integrates the attributes of QoS and candidate services to make the prediction of QoS values more accurate. Shi et al. [
12] proposed a bi-layer planning-based service composition optimization method, which proposed a bi-objective model based on QoS and flexibility, and applied this model in the field of sewing-machine housing parts manufacturing. Zhao et al. [
13] used a collaborative filtering algorithm to compute the missing QoS values of candidate manufacturing services and used a composition optimization model with QoS constraints to generate optimal service combination recommendations. Song et al. [
14] proposed a parameter estimation method for manufacturing service uncertainty models based on Gaussian mixture regression at edge measurement, which can adaptively model service uncertainty. However, most current models for manufacturing service composition optimization problems only consider QoS indicators such as time, cost, and quality, and do not take into account the energy consumption attribute that is currently valued by most service demanders.
In the selection of manufacturing service composition-optimization decisions, meta-heuristic algorithms are widely used to solve manufacturing service composition optimization problems, typical algorithms are gray wolf optimization (GWO) [
15], dung beetle optimization (DBO) [
16], cuckoo search algorithm (CS) [
17], particle swarm optimization (PSO) [
18], balanced composite motion optimization (BCMO) [
19], and sparrow search algorithm (SSA) [
20], and in terms of the recent use of meta-heuristics, Kumar et al. [
21] applied the BCMO algorithm for day-ahead cost-based generation scheduling in a multi-power MG to enable microgrids to operate in a cost-effective manner. Li et al. [
22] proposed an enhanced dung beetle optimization for nonlinear optimization problems with multiple constraints in the manufacturing industry, and the experiments showed that the algorithm has strong optimization accuracy and optimization stability. Tuan et al. [
23] applied the BCMO algorithm to the prediction of landslides by proposing and evaluating a new method called BCMO-DeepNeuralNets, which leads to a more accurate understanding of the associated risks. These algorithms have their own advantages and disadvantages; taking BCMO algorithm as an example, it has the advantages of simple control parameters, strong adaptability, and the ability to simultaneously take into account the global search and local search, etc. However, it still has the problems of slow convergence speed, high computational complexity, and sensitivity to the initial population when dealing with complex problems and large-scale high-dimensional optimization problems. As for meta-heuristic algorithm improvement, Wang et al. [
24] proposed a hybrid algorithm named bee colony simplex for the CSCO problem, which applies global best bootstrap and chaotic search strategies to avoid local optimization. Mirjalili et al. [
25] proposed a multi-objective grey wolf optimization algorithm (MOGWO) for multi-objective problems and proved the superiority of the proposed algorithm, while Wang et al. [
26] proposed a multi-objective sparrow search algorithm (MOSSA) and proved that the MOSSA algorithm demonstrates a good performance in solving multi-objective problems. The SSA algorithm, with its unique search mechanism, has shown a good performance on classical test functions for low-dimensional optimization problems, which are widely used in intelligent path planning for shop floor drones [
27], optimal control of chilled water systems [
28], node localization problems for heterogeneous wireless sensor networks [
29], etc. The SSA algorithm provides new ideas for solving the service composition optimization problem of coating machine ovens, but it still faces dilemmas such as fast convergence and a tendency to fall into the local optimization.
Although there is a large amount of theoretical support for the construction of manufacturing service composition-optimization models and manufacturing service composition-preference decisions, there is still less research on manufacturing service composition optimization for coating machine ovens. In summary, the following deficiencies remain in the composition optimization of coating machine-oven parts manufacturing services:
Most manufacturing service composition-optimization methods only consider QoS indicators such as time, cost, and quality, and do not take into account the energy consumption attributes valued by service demanders.
Many meta-heuristic algorithms have insufficient optimization-seeking ability in solving the service composition-optimization problem and are prone to fall into local optimums, resulting in the less precise selection of the final service portfolio.
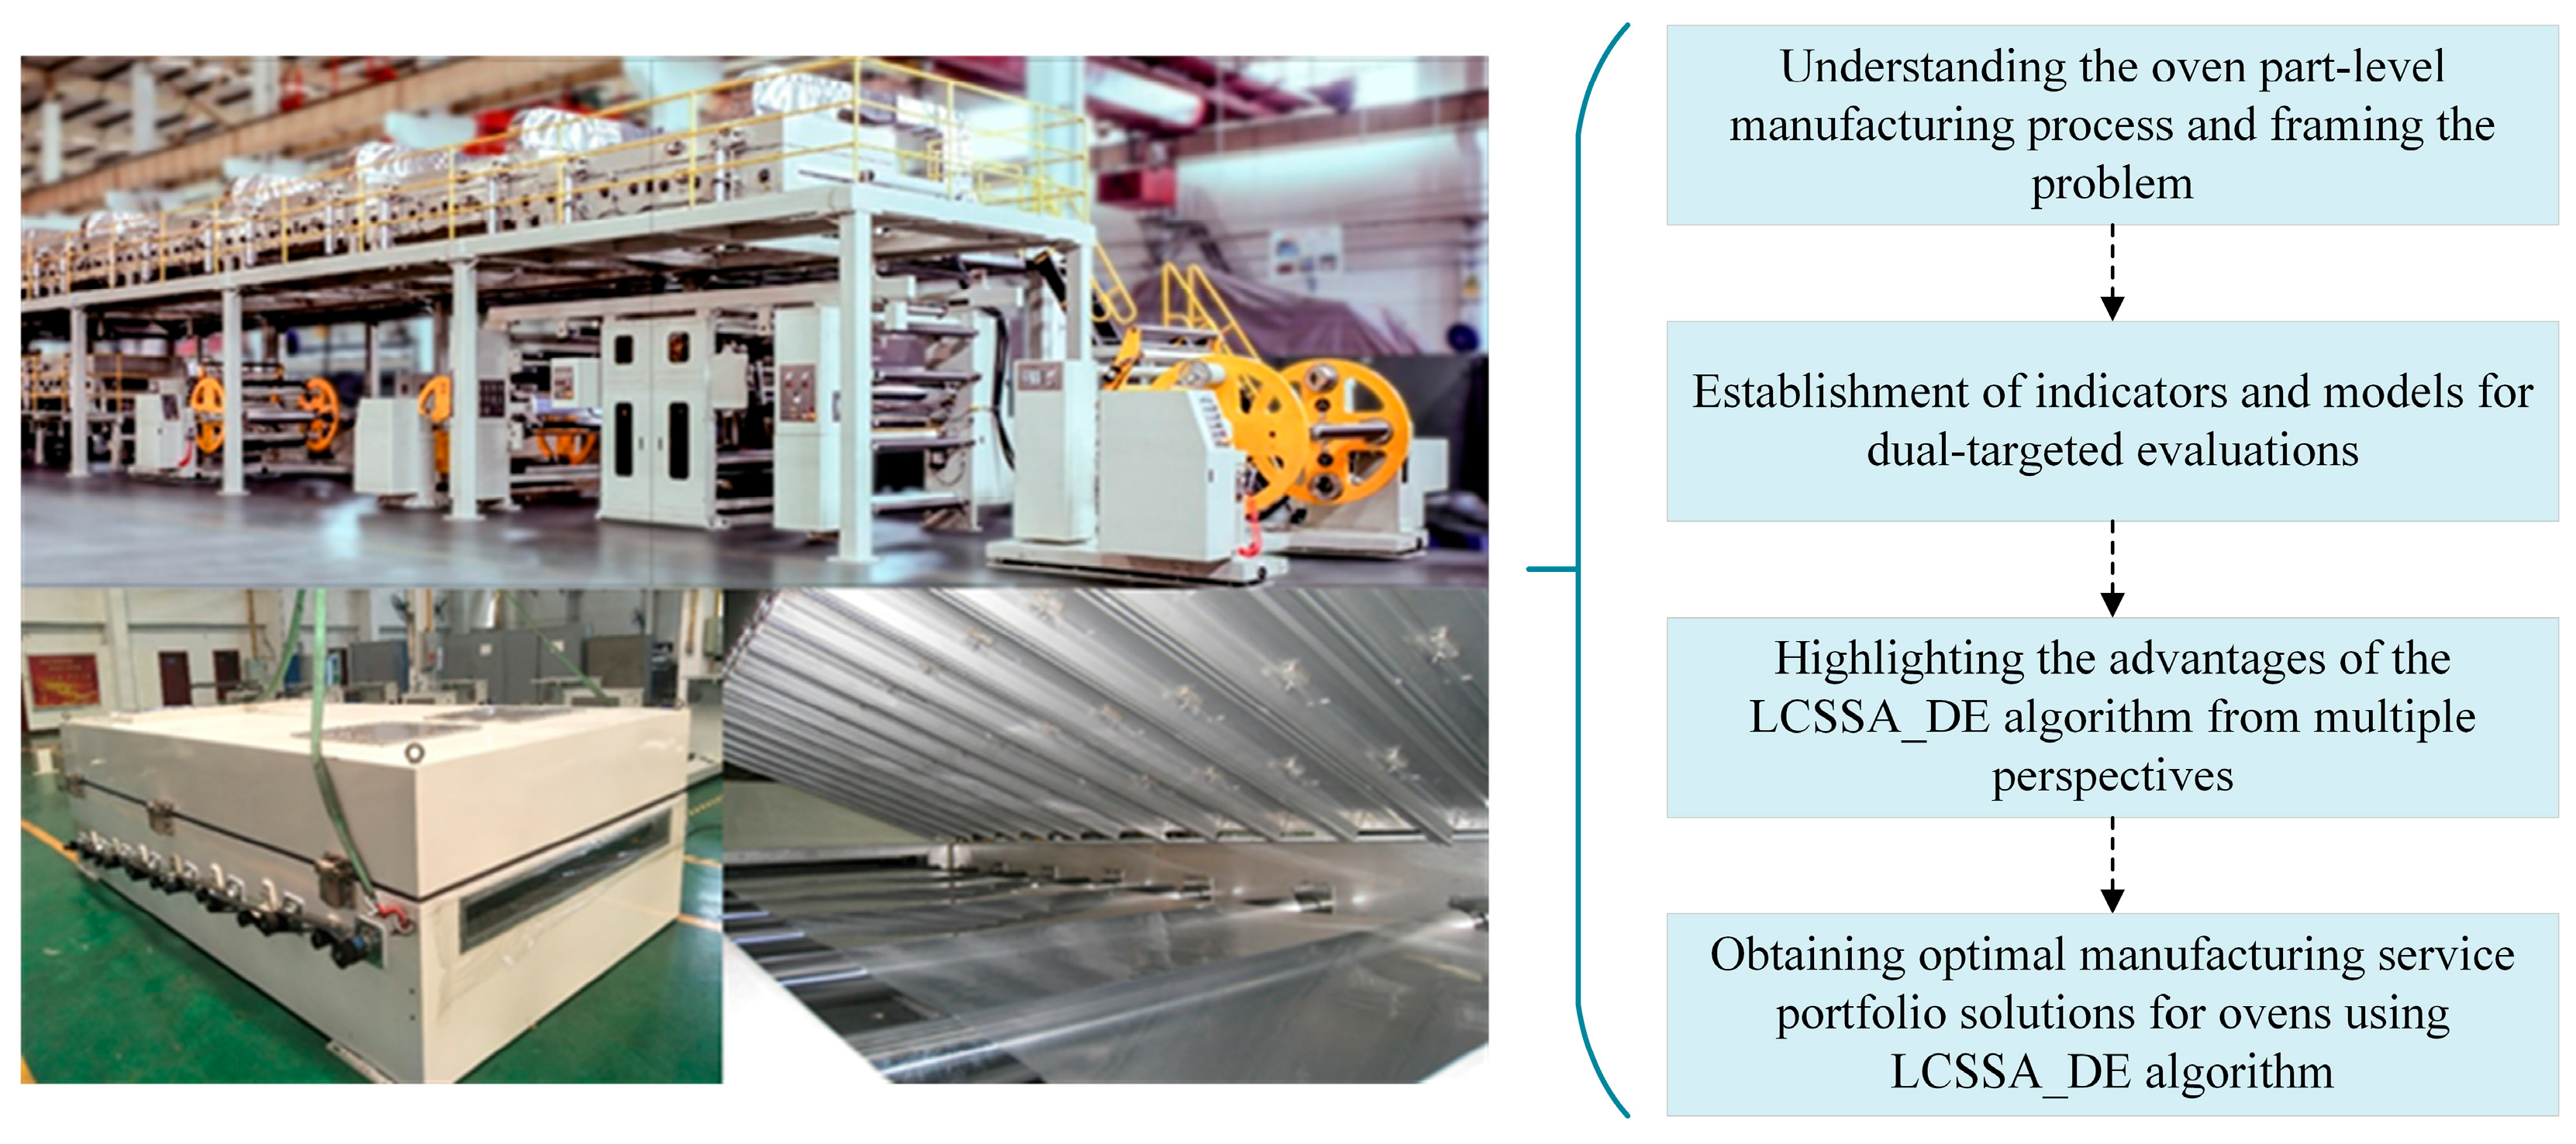
To this end, this paper proposes a composition optimization method for coating machine-oven manufacturing services based on the improved sparrow search algorithm, and the specific workflow is shown in
Figure 2.
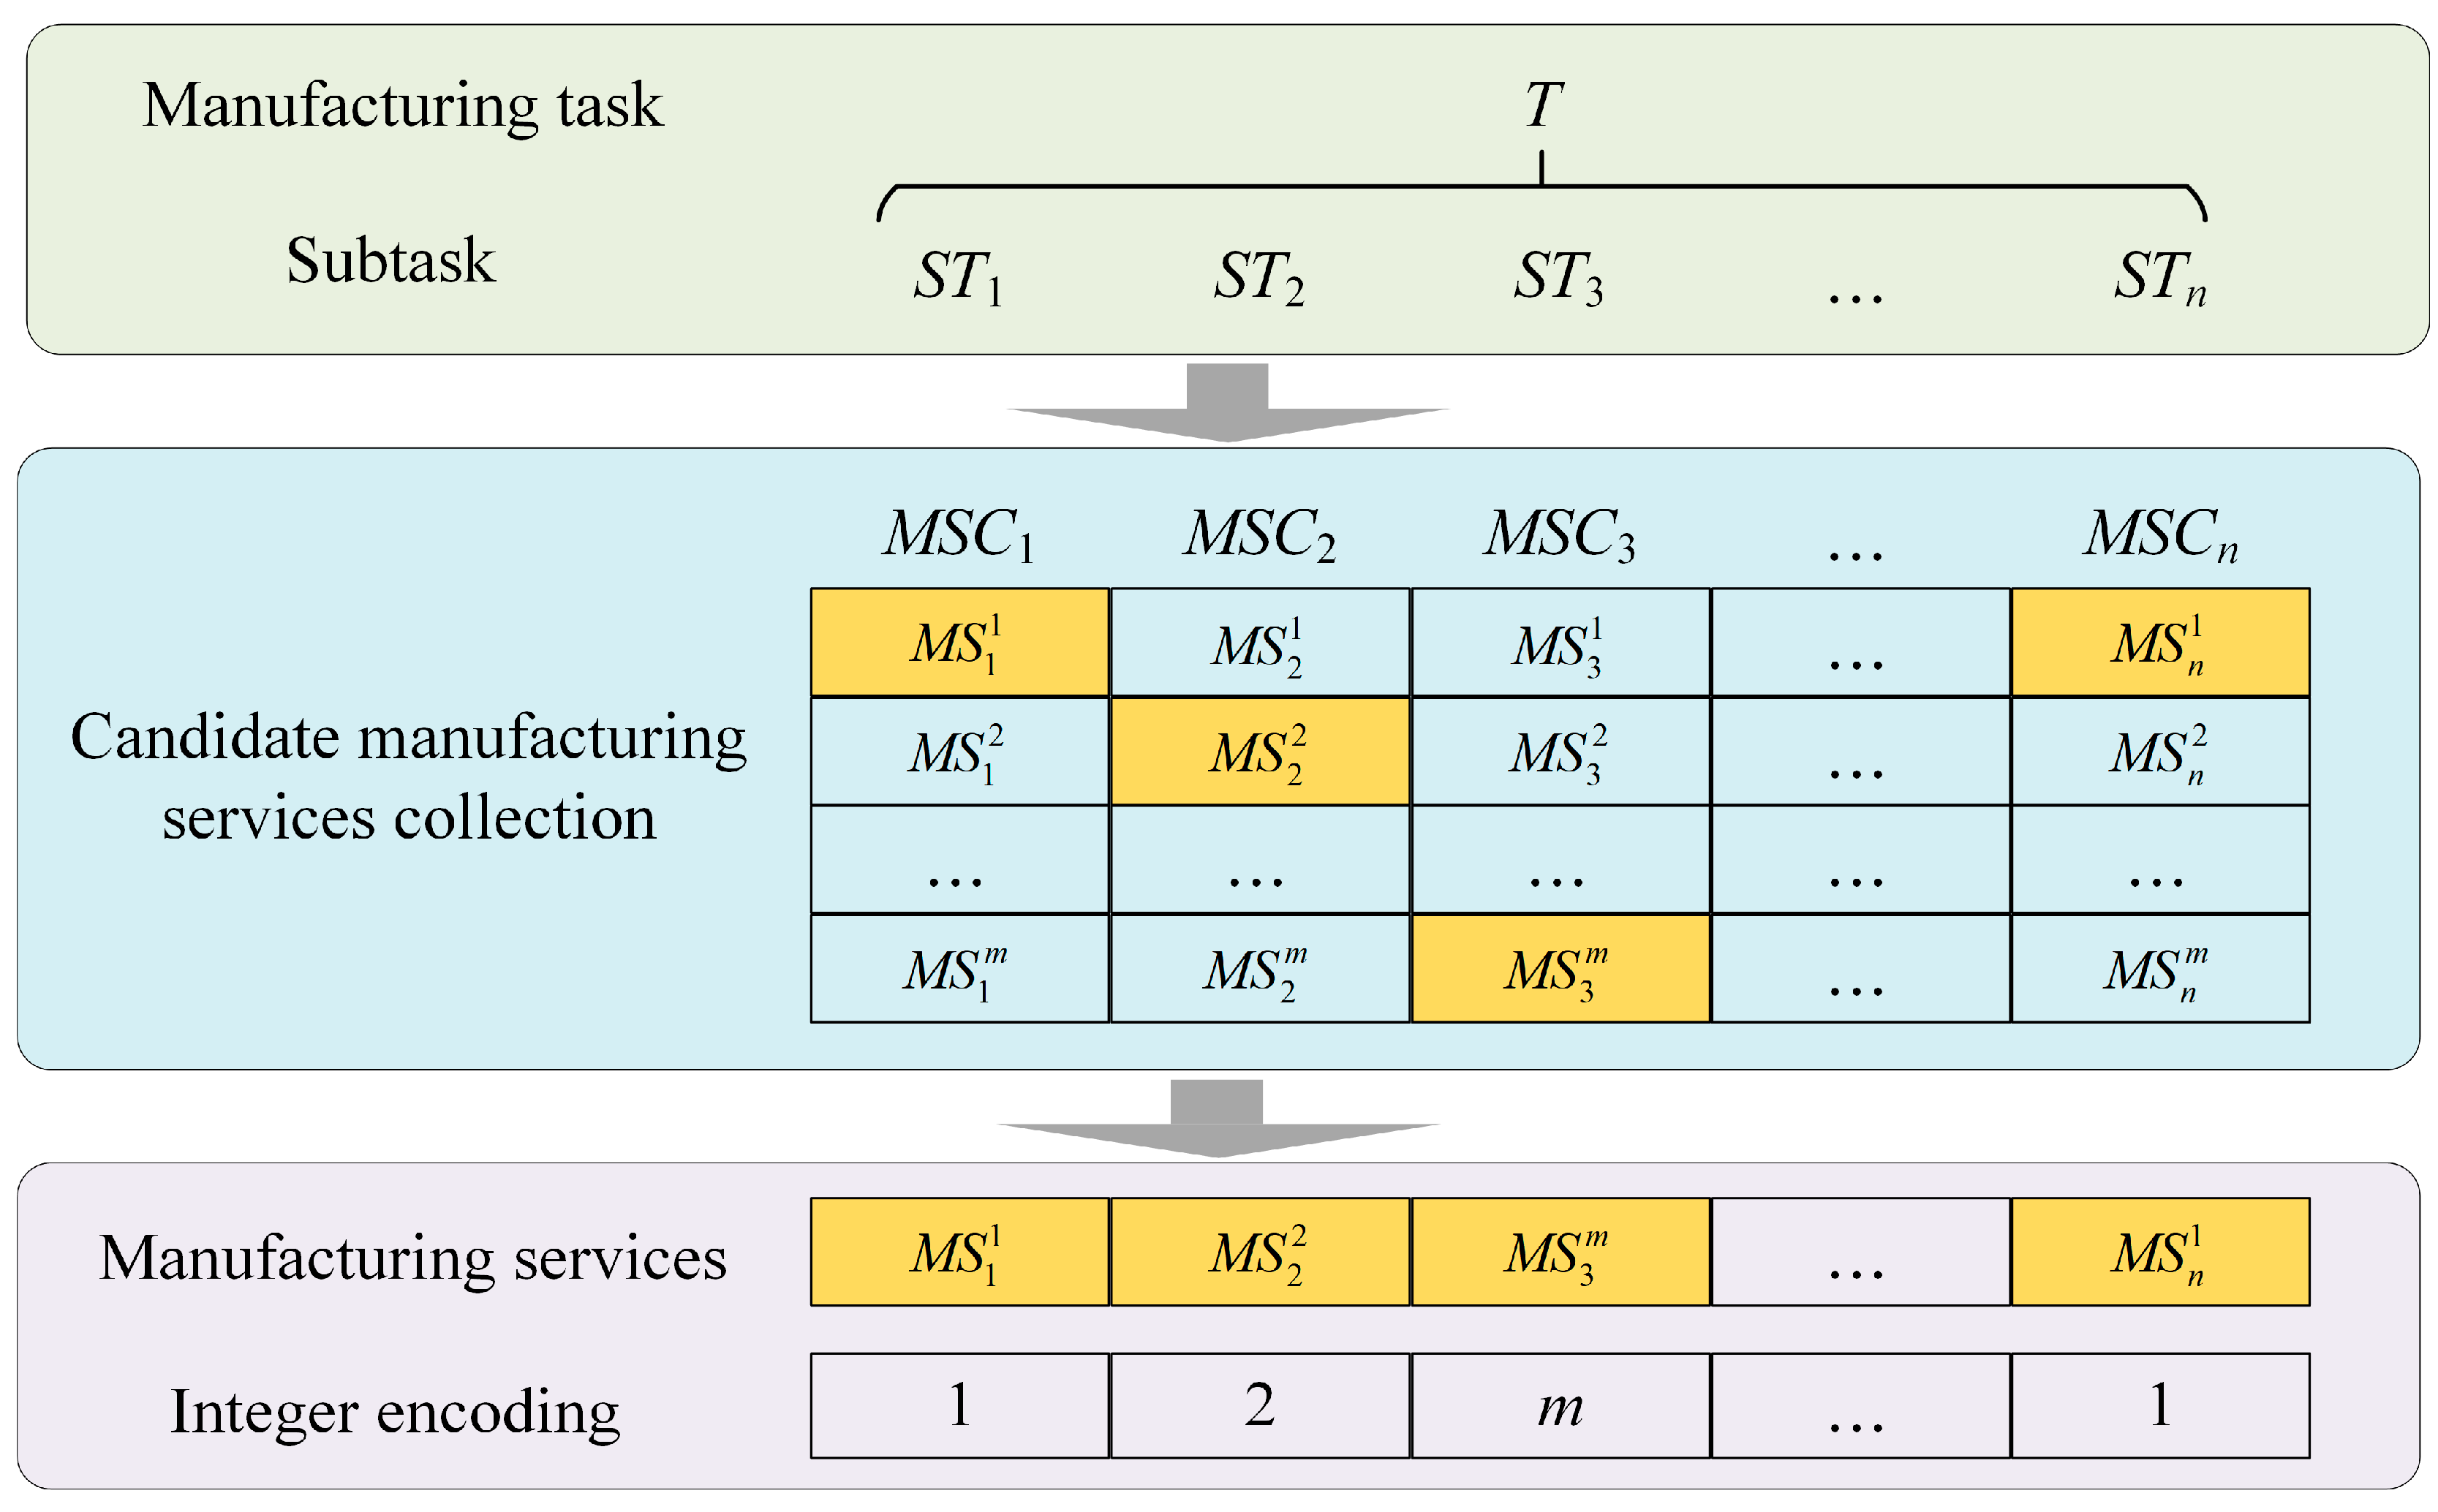
Based on the actual production research, the service-optimization problem framework in the oven-crowdsourcing manufacturing platform is identified to understand the subtasks of coating machine-oven parts manufacturing.
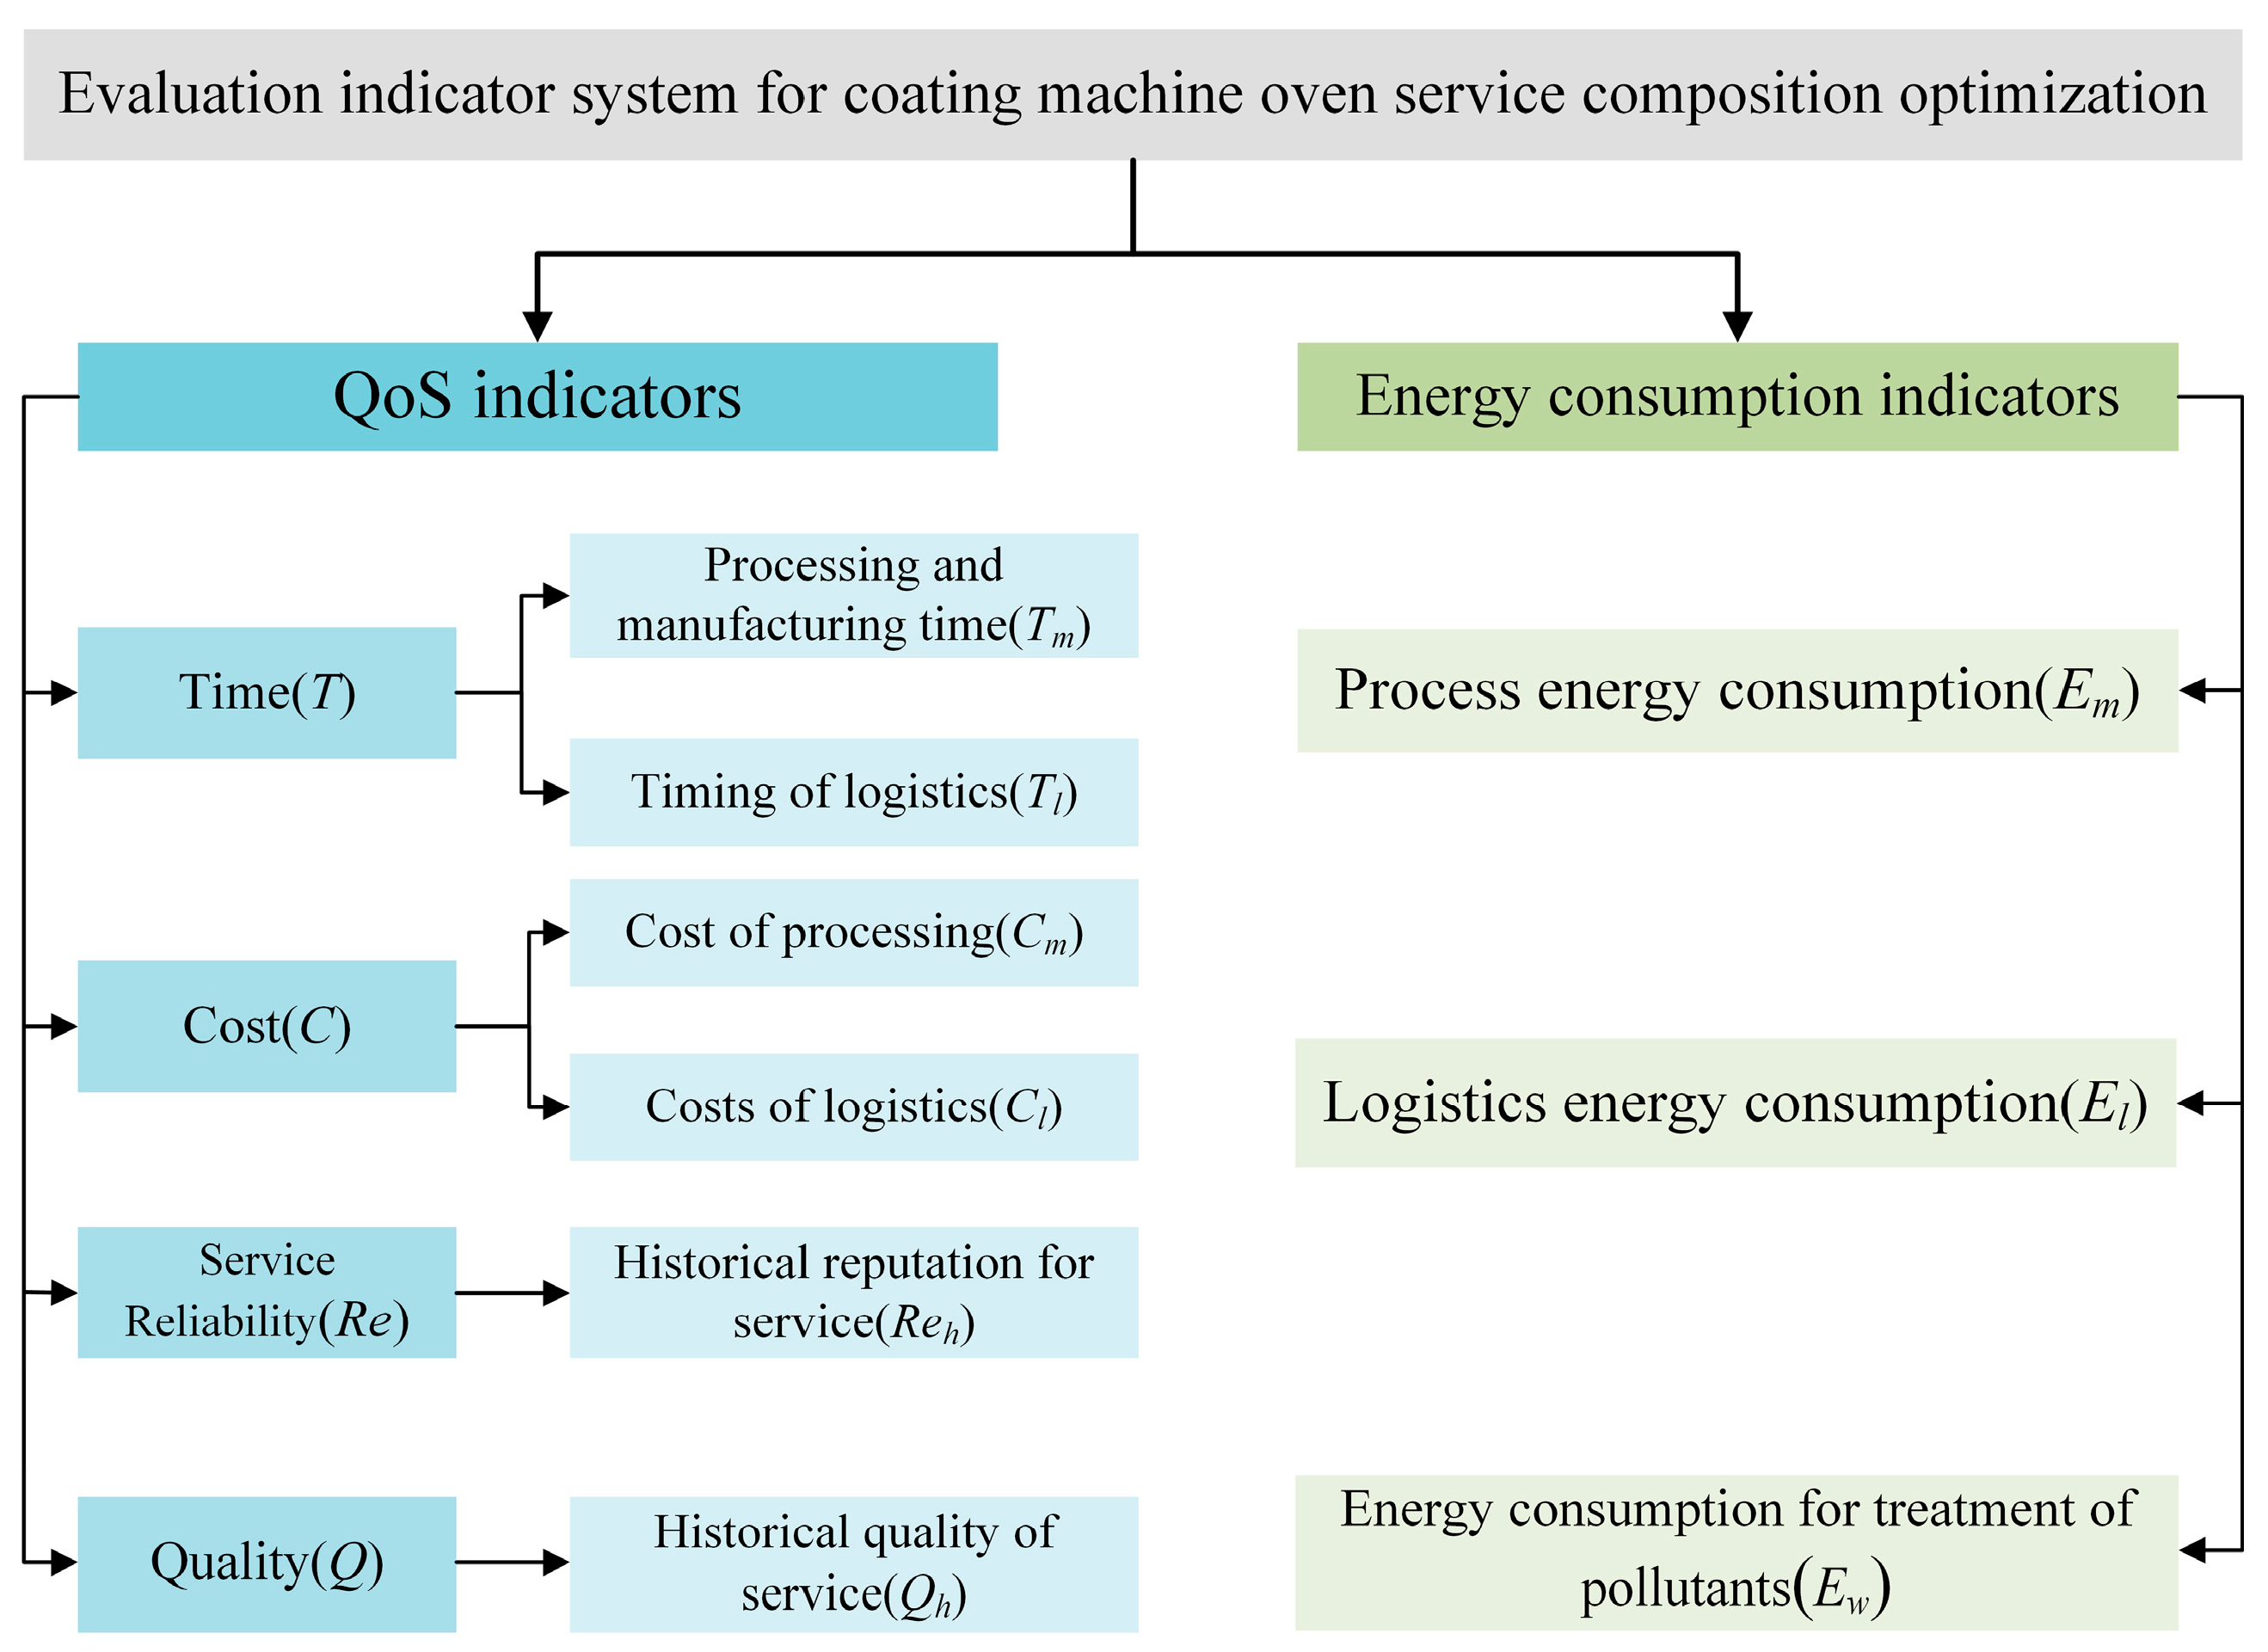
Evaluation of service quality indicators QoS and energy consumption indicators of manufacturing services is completed, and a mathematical model of dual-objective service composition optimization considering QoS and energy consumption indicators is established.
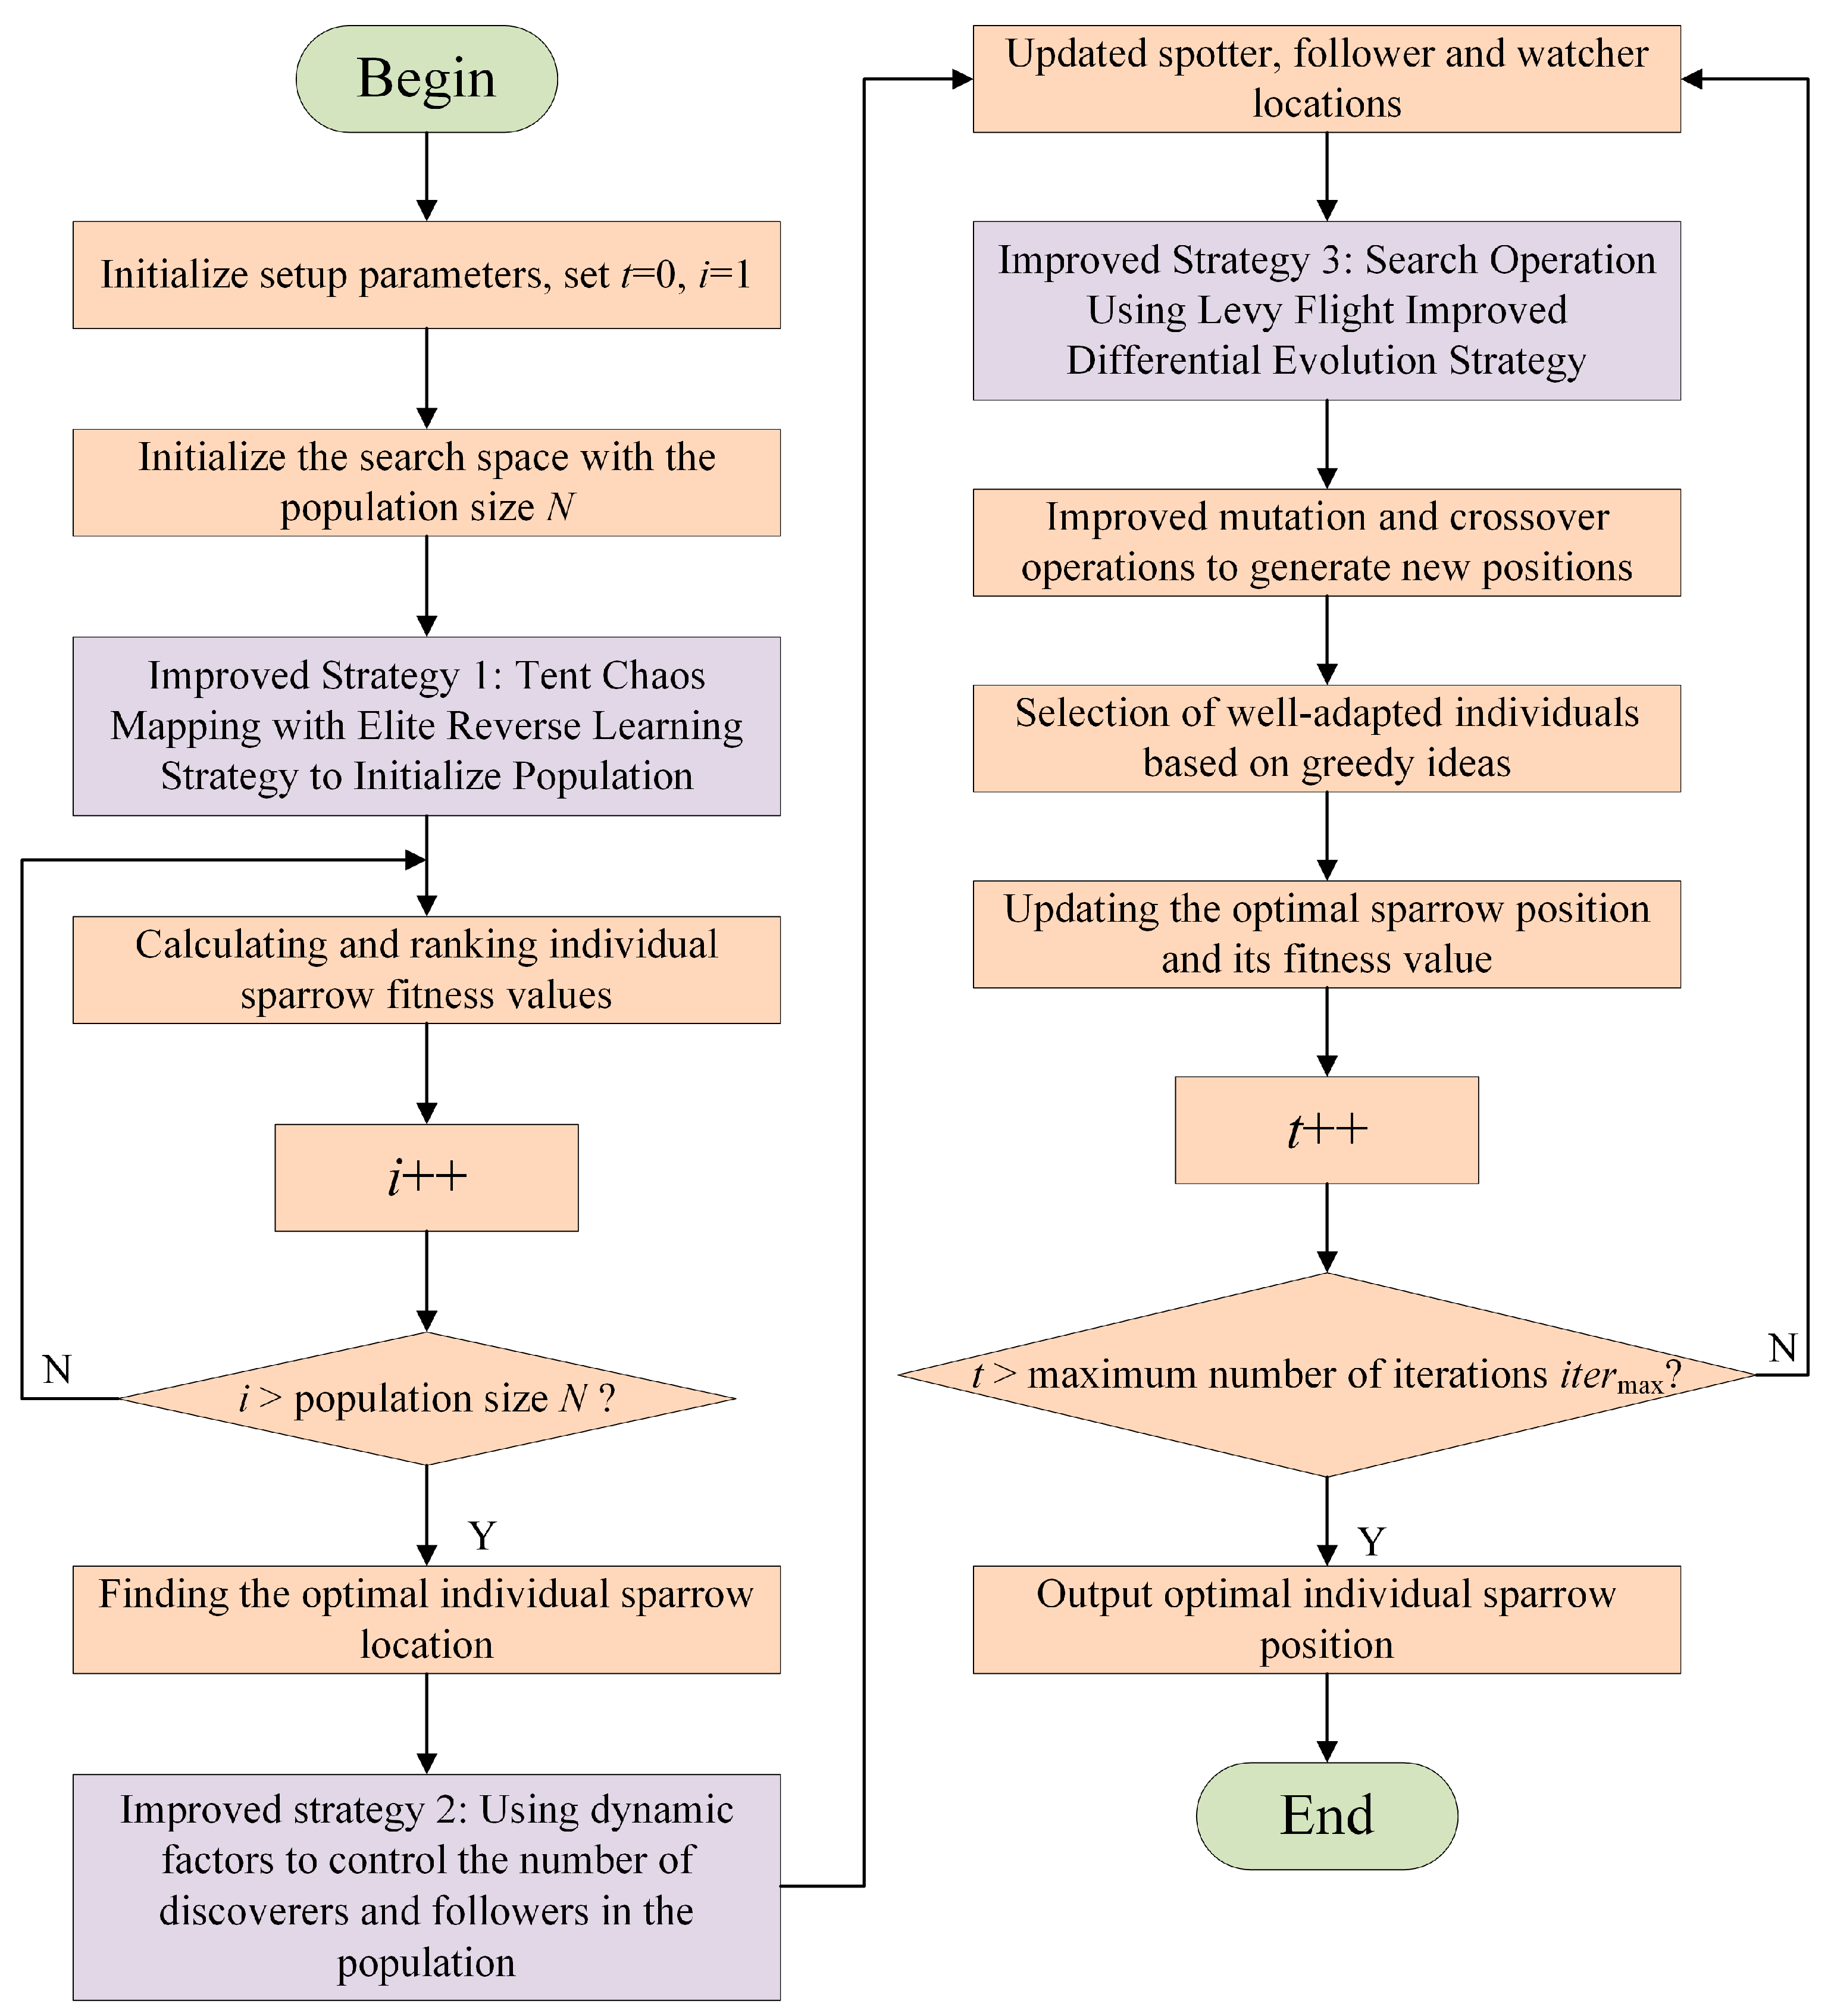
L in the LCSSA_DE algorithm denotes the Lévy flight strategy, C denotes the chaotic mapping strategy, and DE denotes the differential evolution strategy; the algorithm is used to solve the mathematical model of this service composition optimization problem and to obtain the optimal manufacturing service combination scheme.
The experimental results demonstrate that the LCSSA_DE algorithm has lower adaptation compared to the remaining three compared algorithms and the average convergence time at the test scale is improved by 7.26% compared to the suboptimal algorithm; meanwhile, the Pareto front of the LCSSA_DE algorithm is more in line with the preference criteria for modeling, demonstrates better stability across multiple test functions, and has advantages in the large-scale scaling problem.
4. Discussion
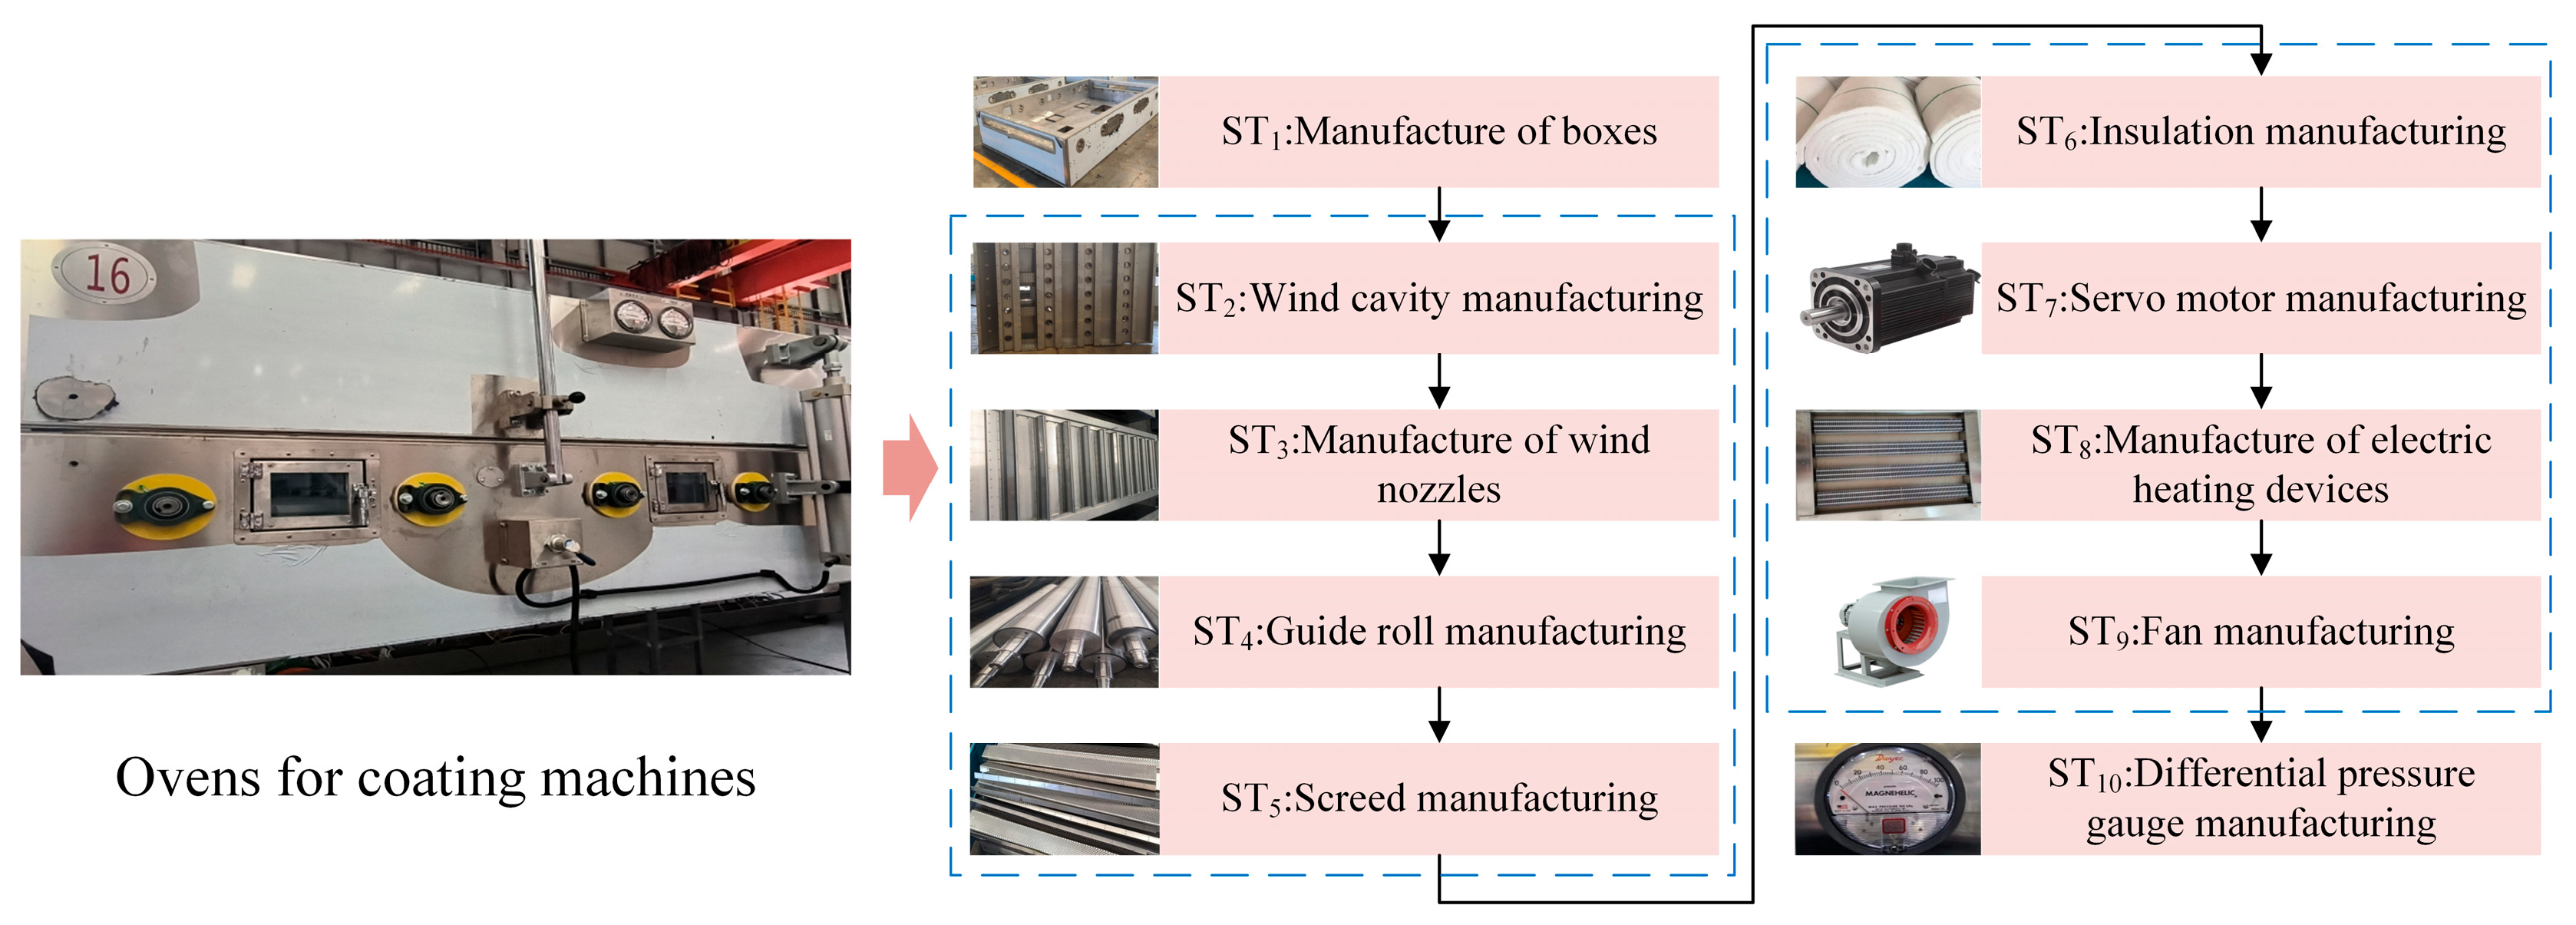
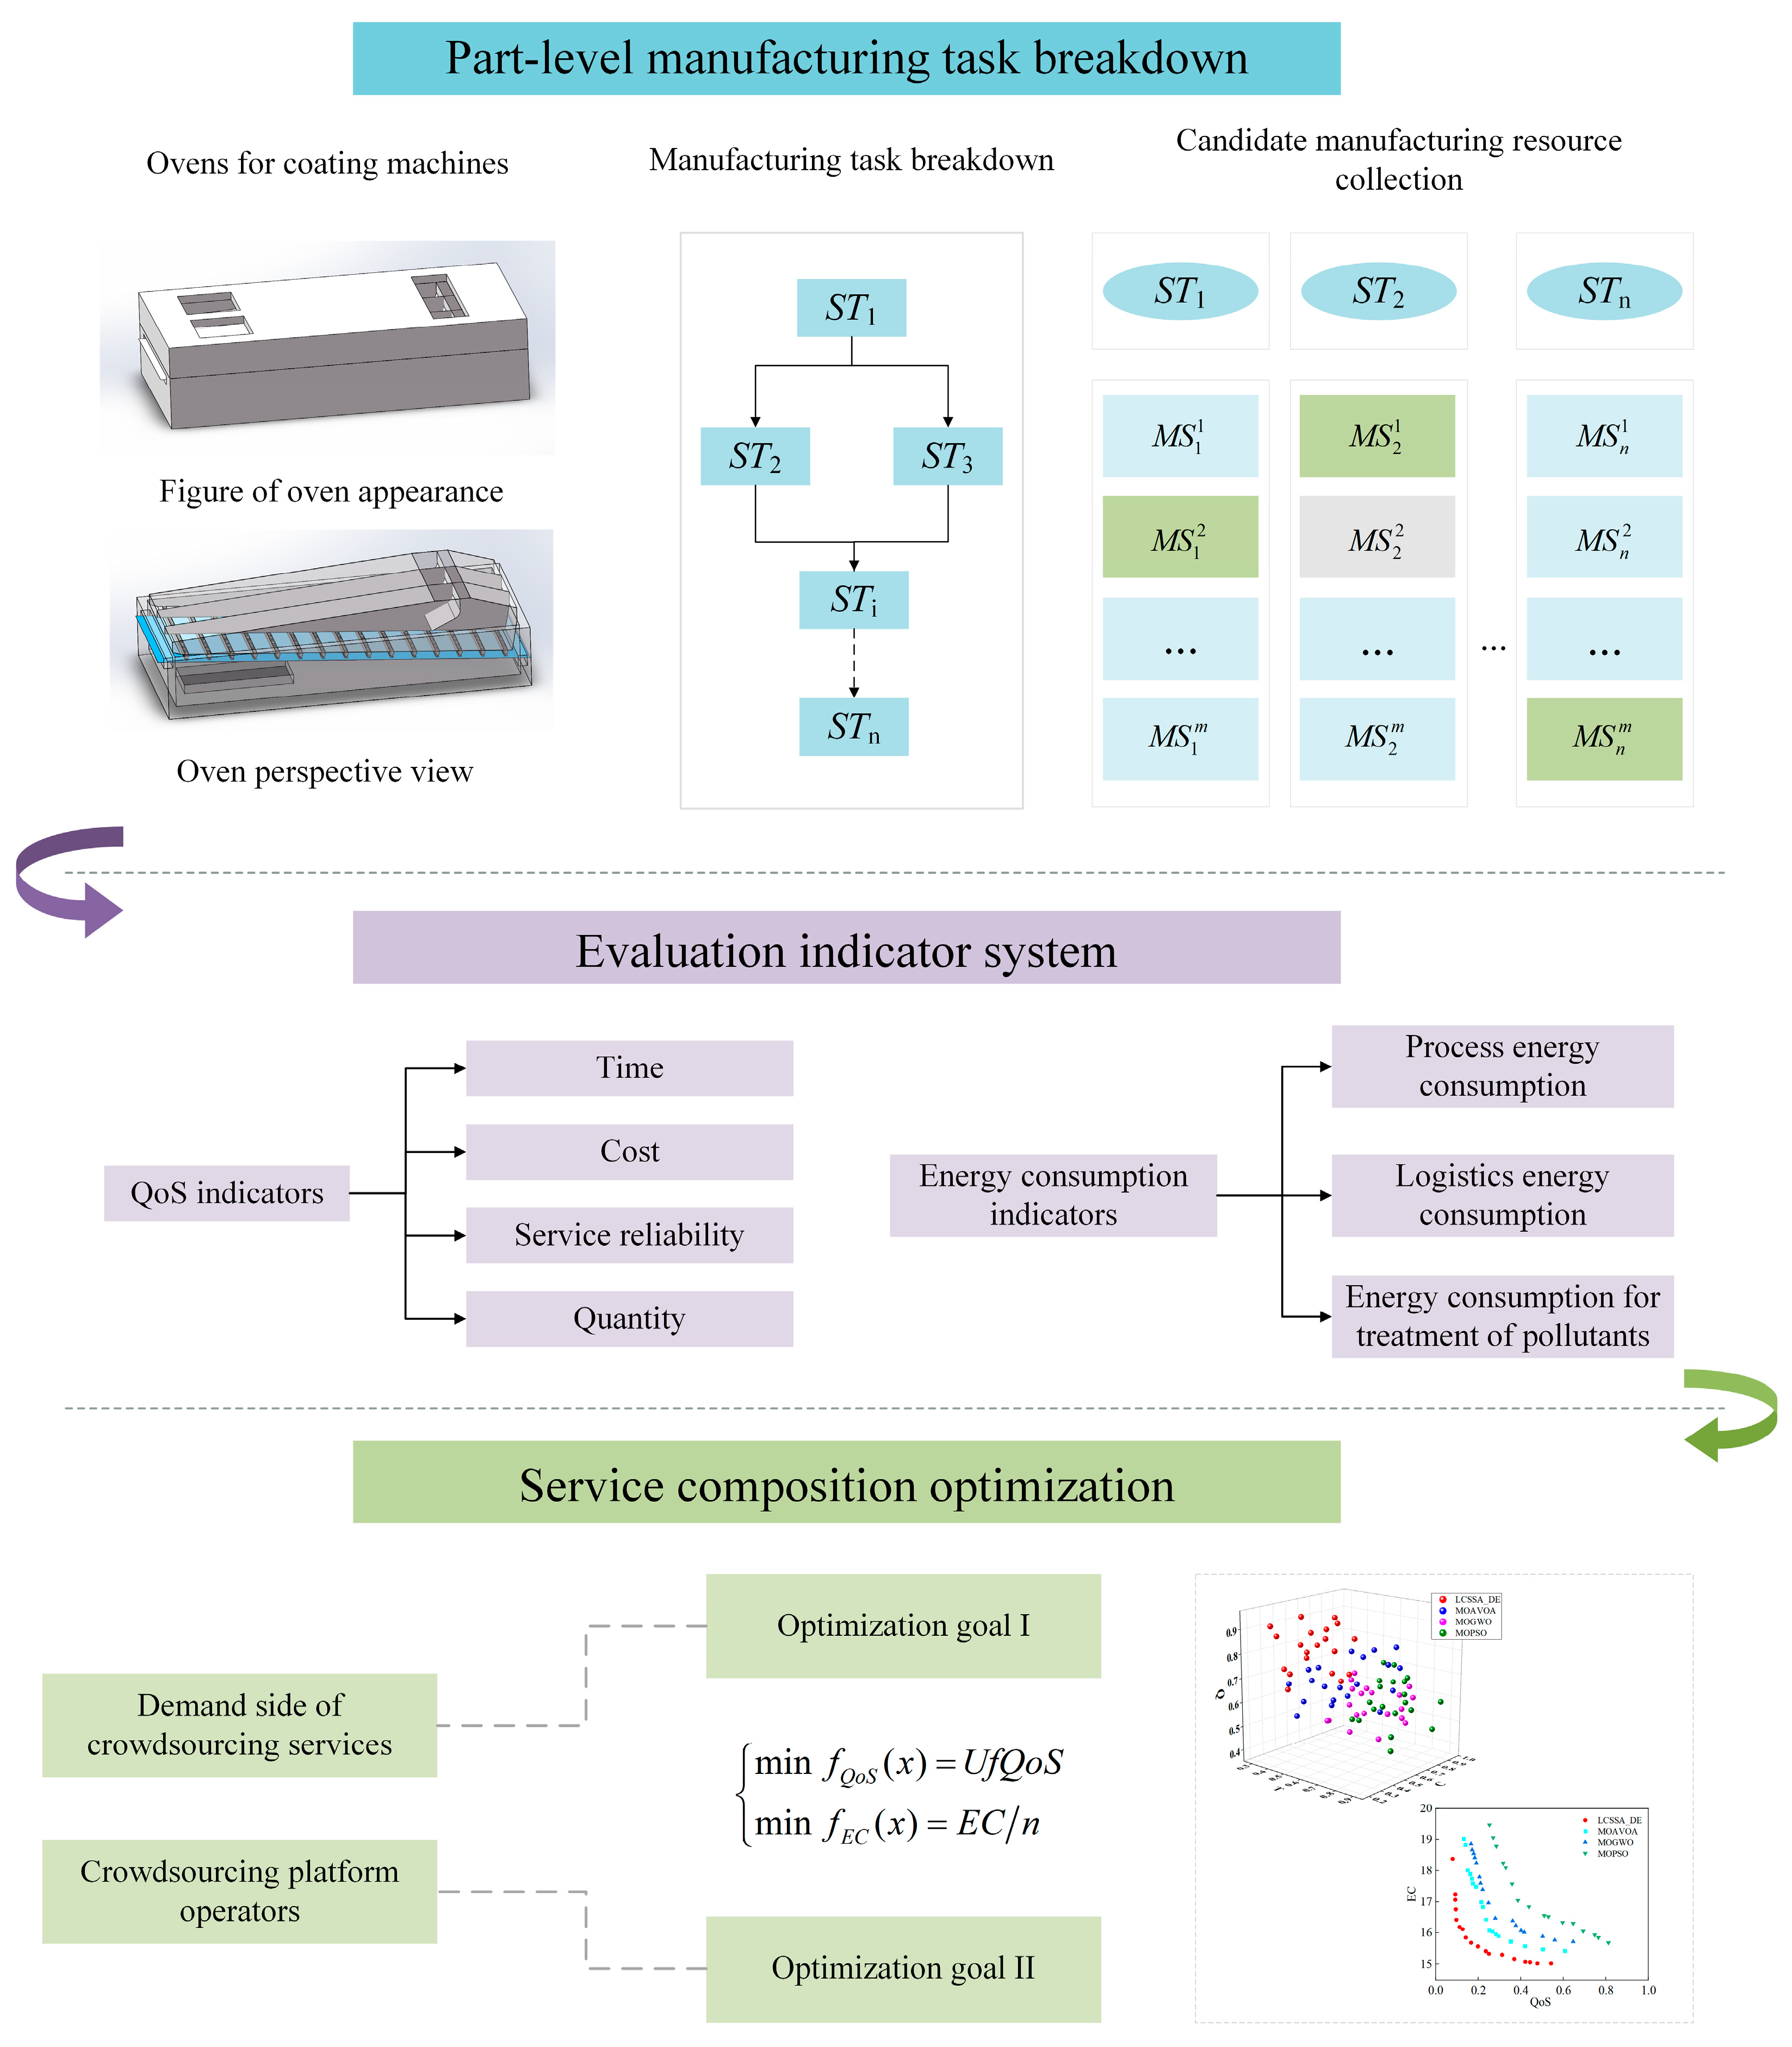
In
Section 2, the set of candidate manufacturing services corresponding to each part manufacturing process is obtained by analyzing the part-level manufacturing processes of the coating machine ovens, laying the foundation for the subsequent discussion on improving the manufacturing efficiency of the coating machine ovens. After that, considering the common interests of the demand-side of oven crowdsourcing service and the operator of the oven crowdsourcing platform, the evaluation indicator system of oven manufacturing service composition-optimization is proposed, and the dual-objective service composition-optimization model for ovens is established by combining the QoS indicator and the energy consumption indicator; in view of the problems of the SSA algorithm, such as the slower convergence and the ease of falling into the local optimum, the LCSSA_DE algorithm is used to solve this model, which is worthy of attention. It is worth noting that the proposed LCSSA_DE algorithm may not be the optimal solution. In this paper, through the three parts of algorithm performance comparison, arithmetic analysis and scale expansion examples were employed to verify the effectiveness of the proposed method in solving the optimal solution, and to obtain the optimal manufacturing service portfolio of the oven.
As can be seen from the results in
Figure 8,
Figure 9 and
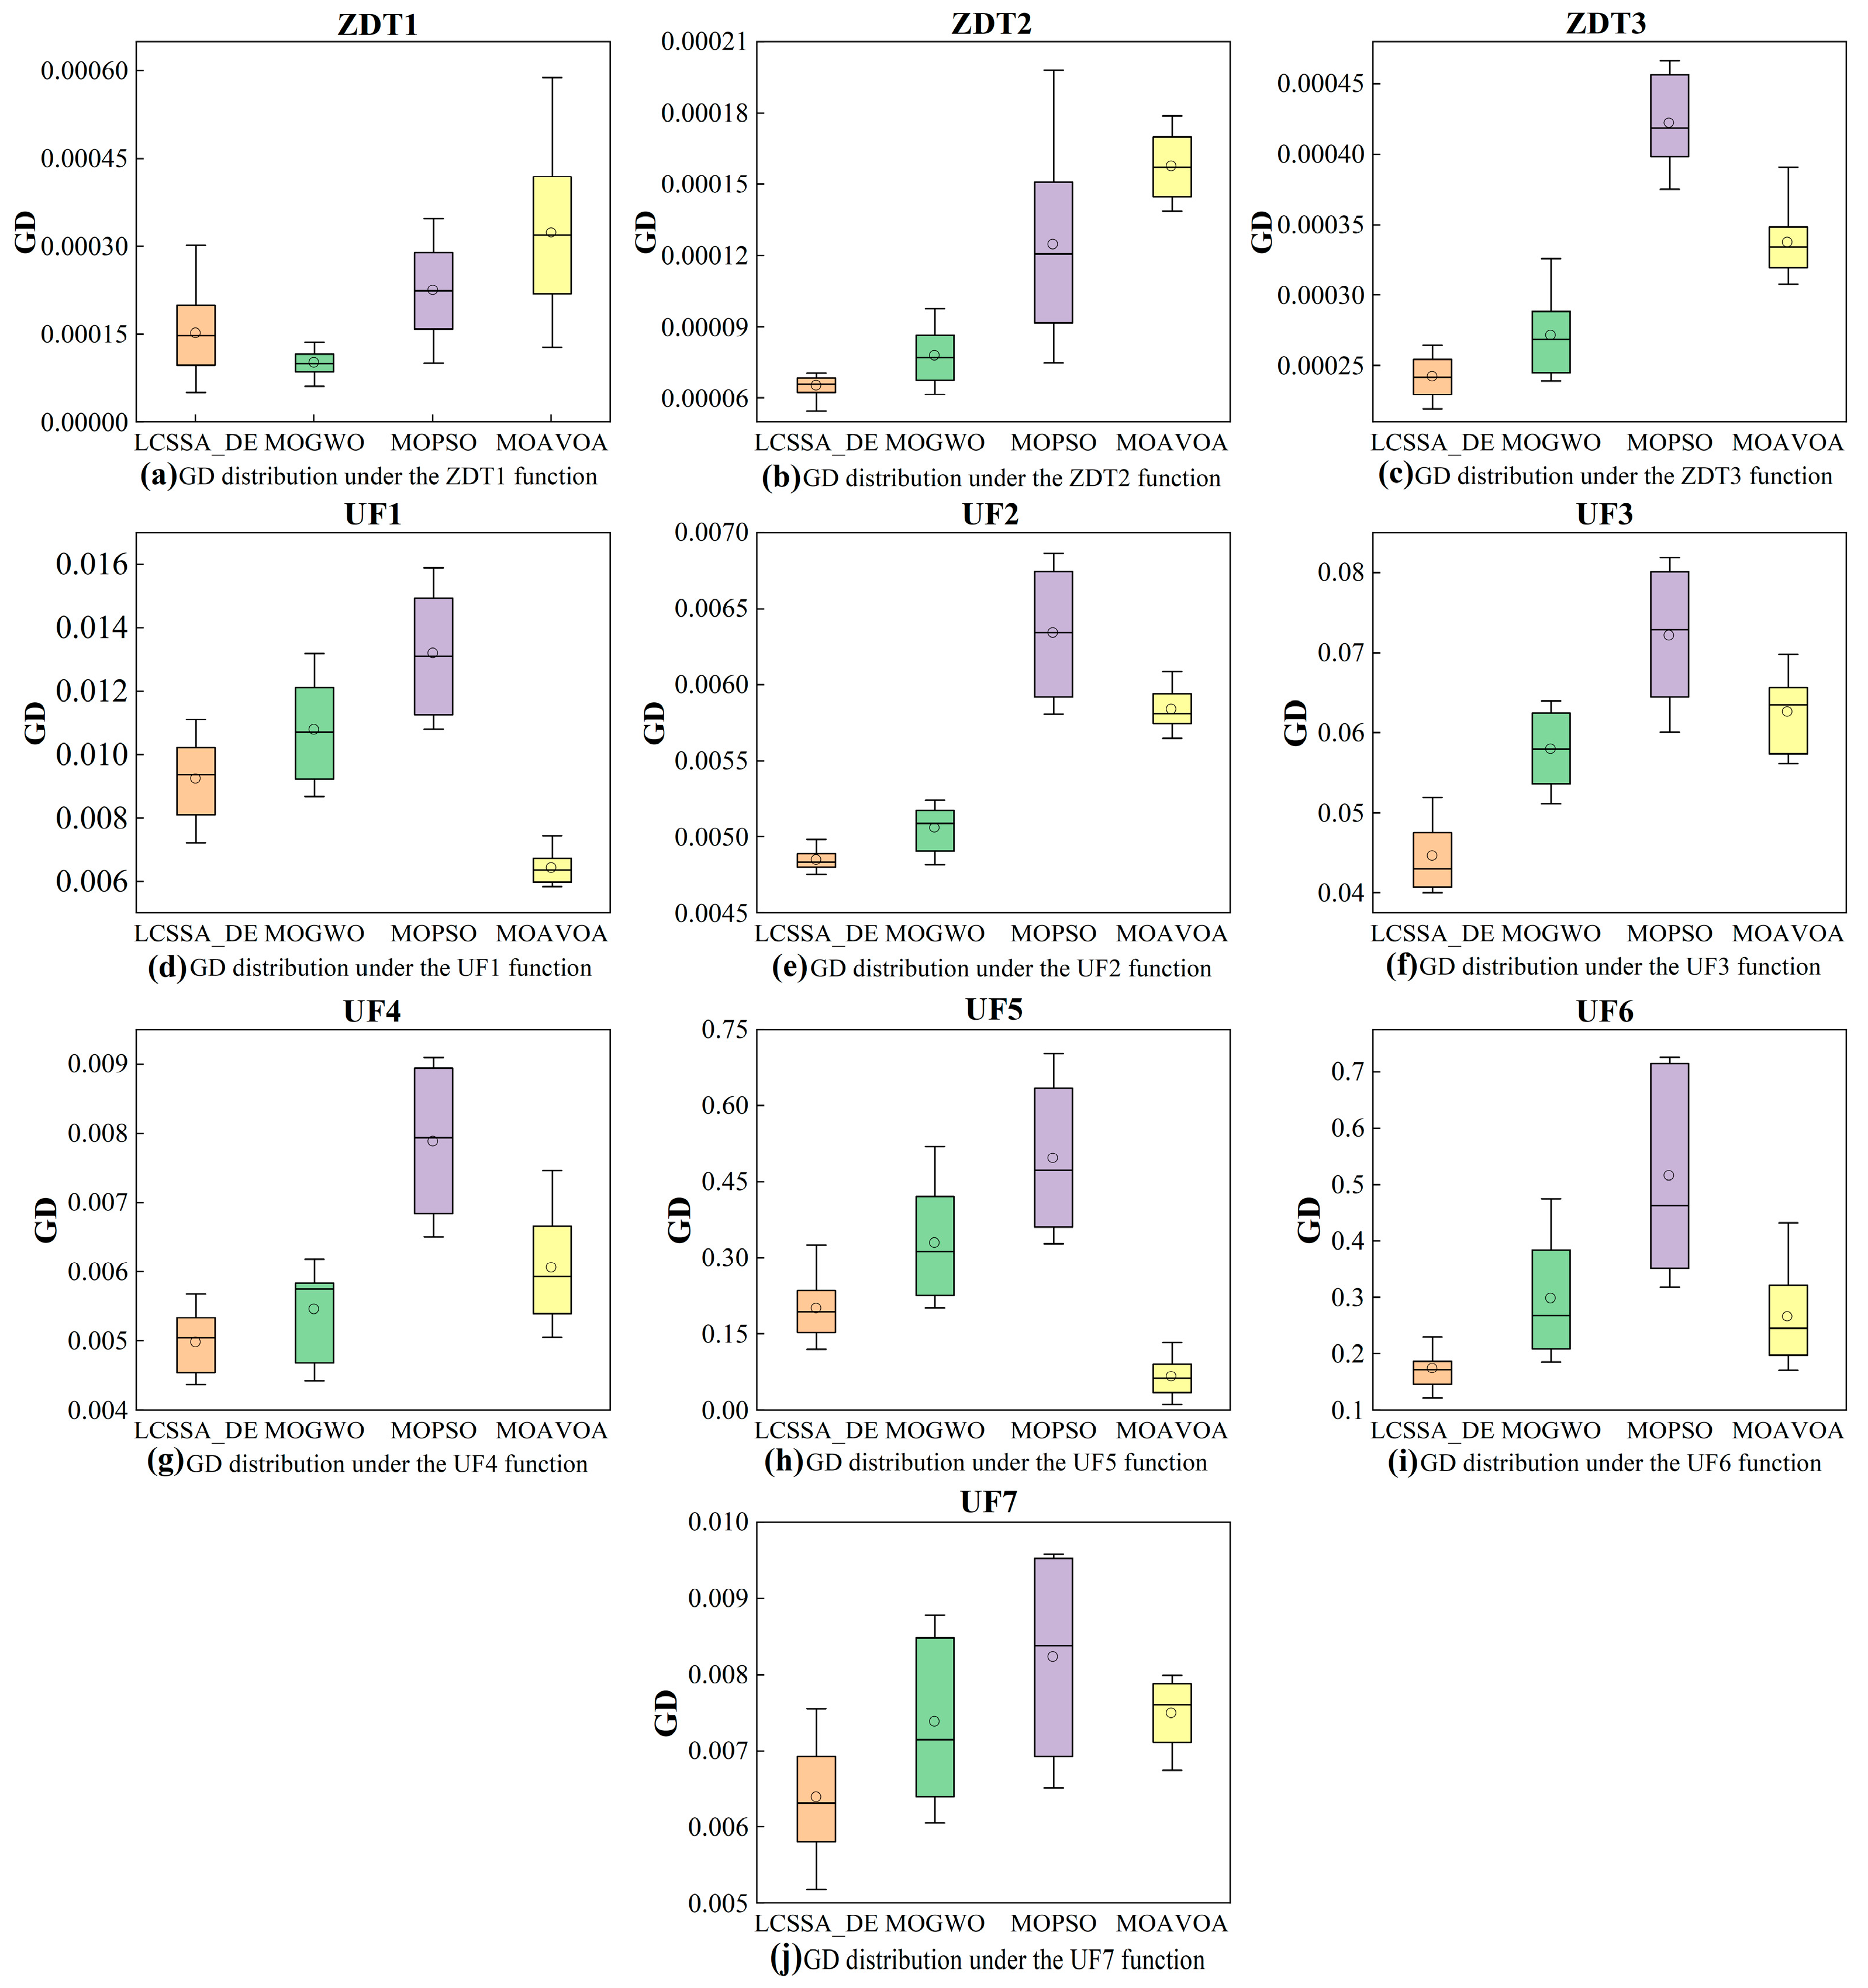
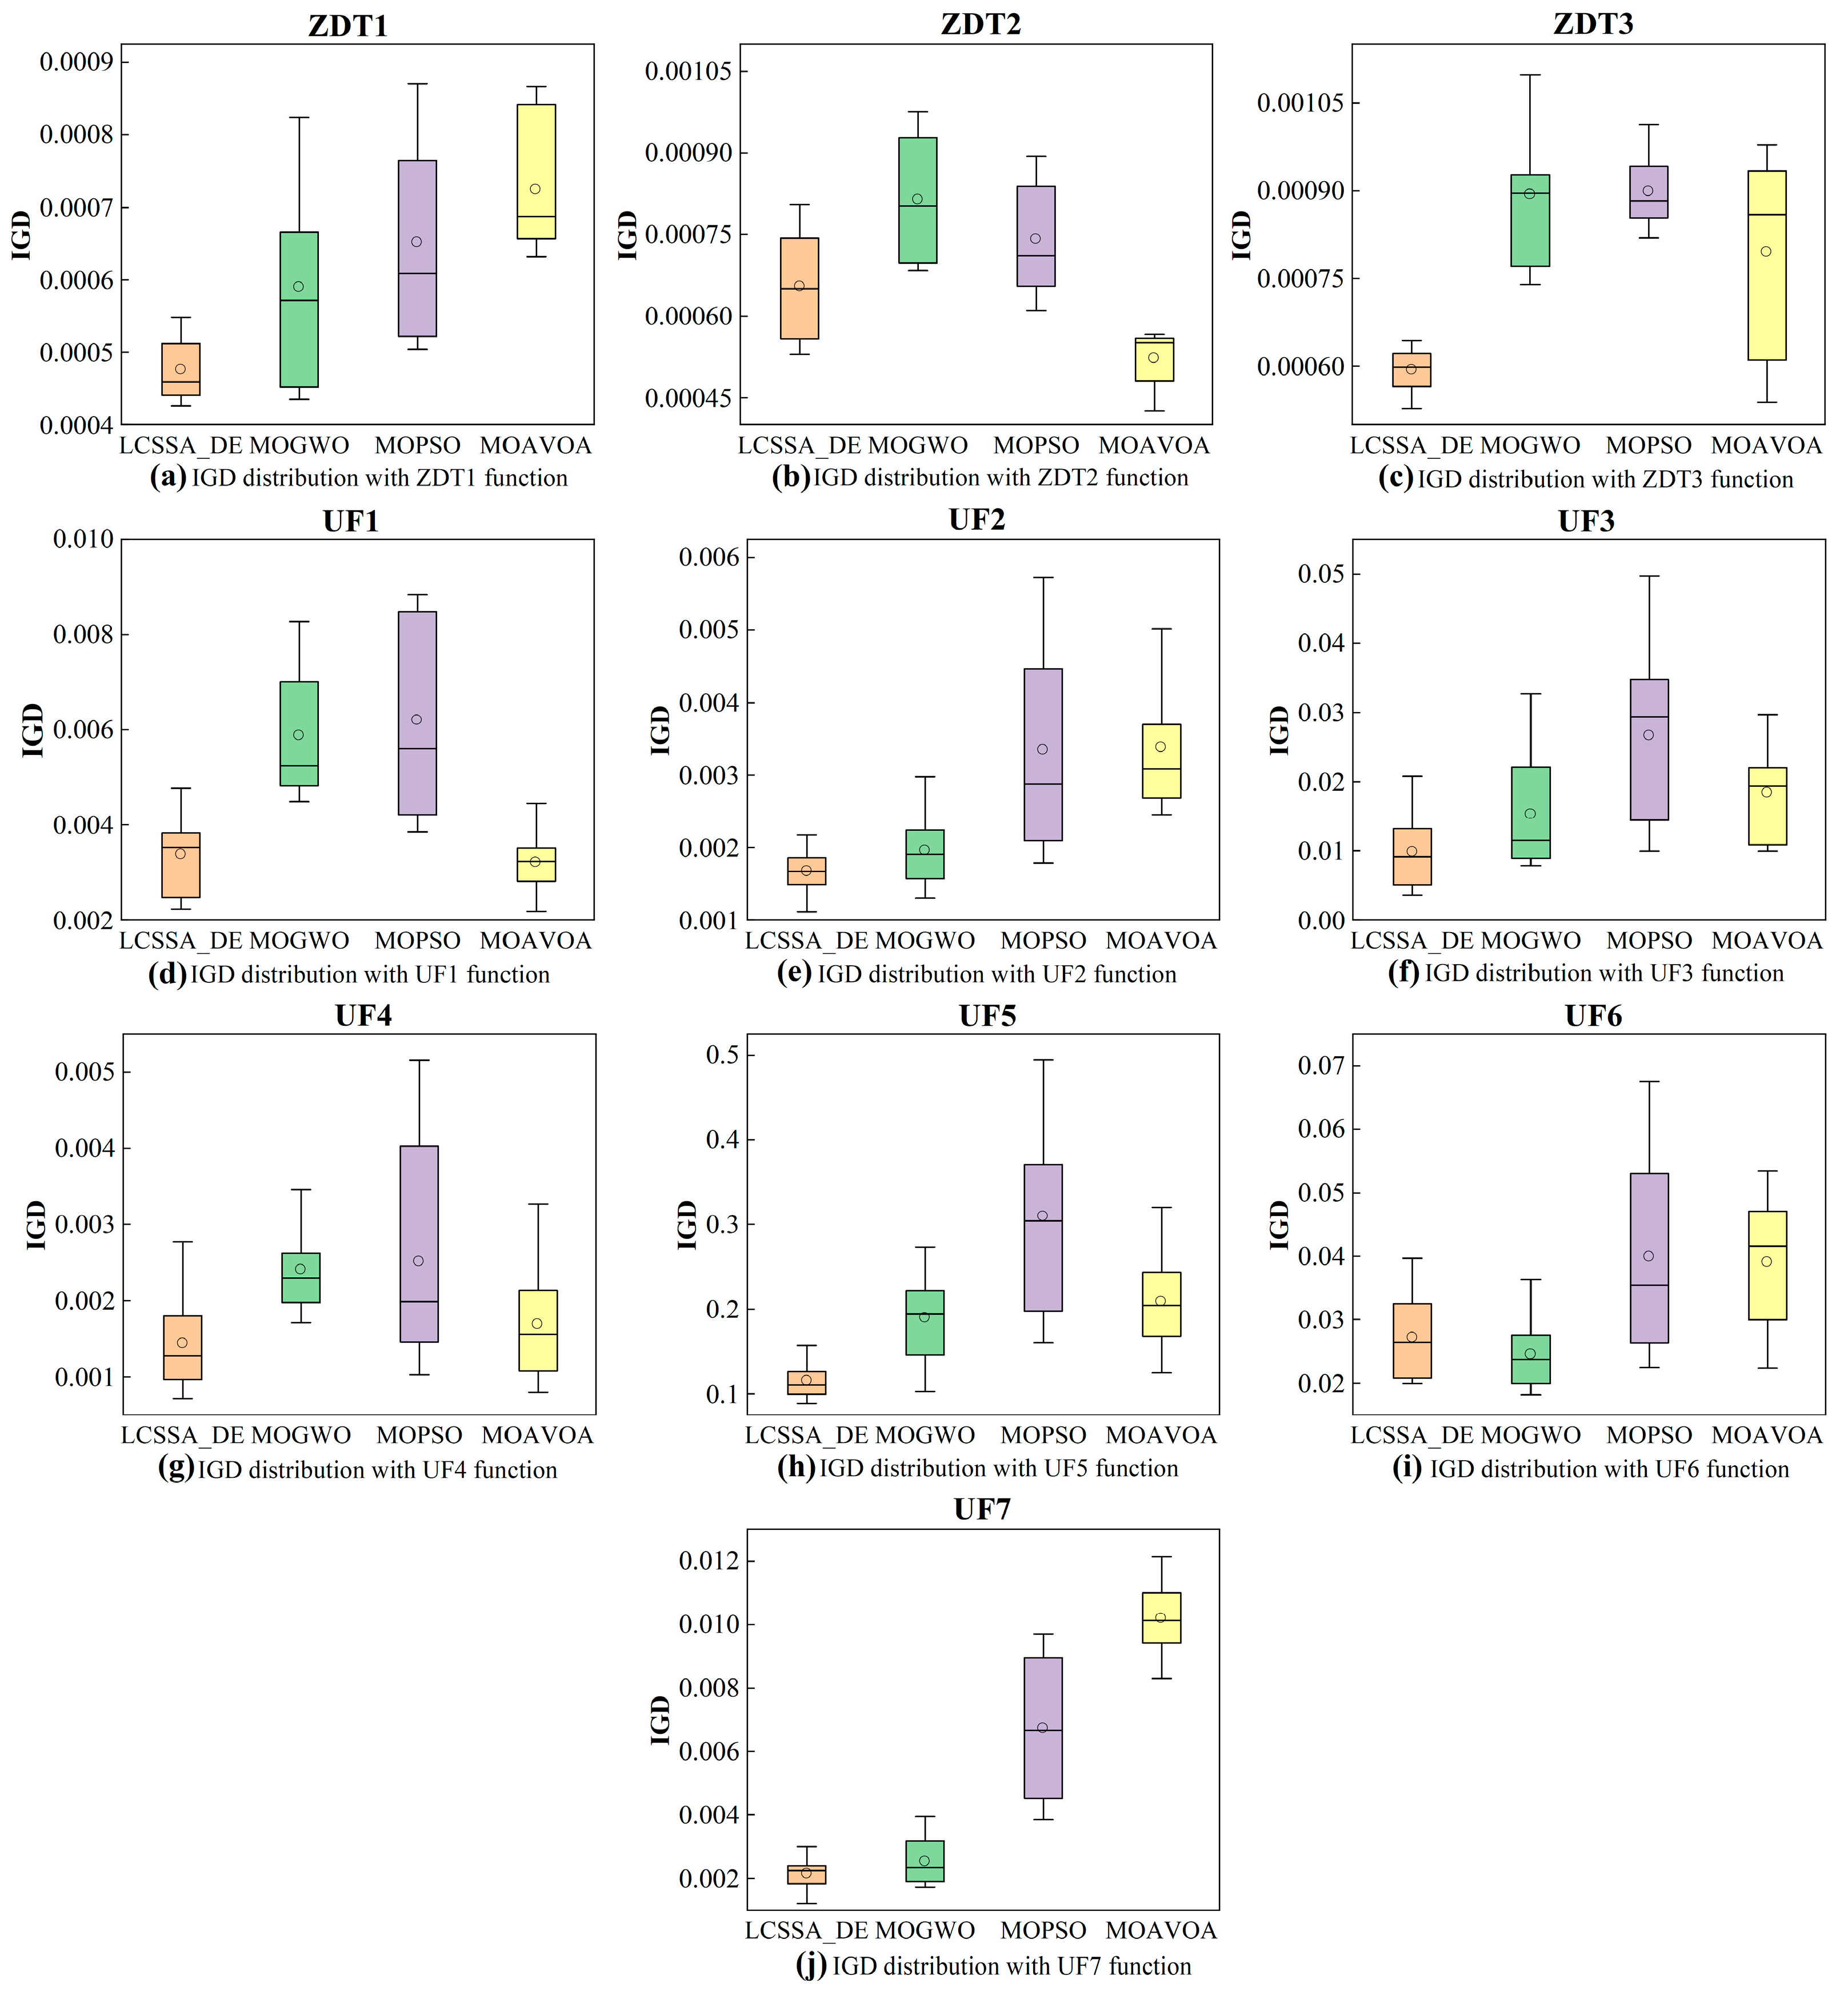
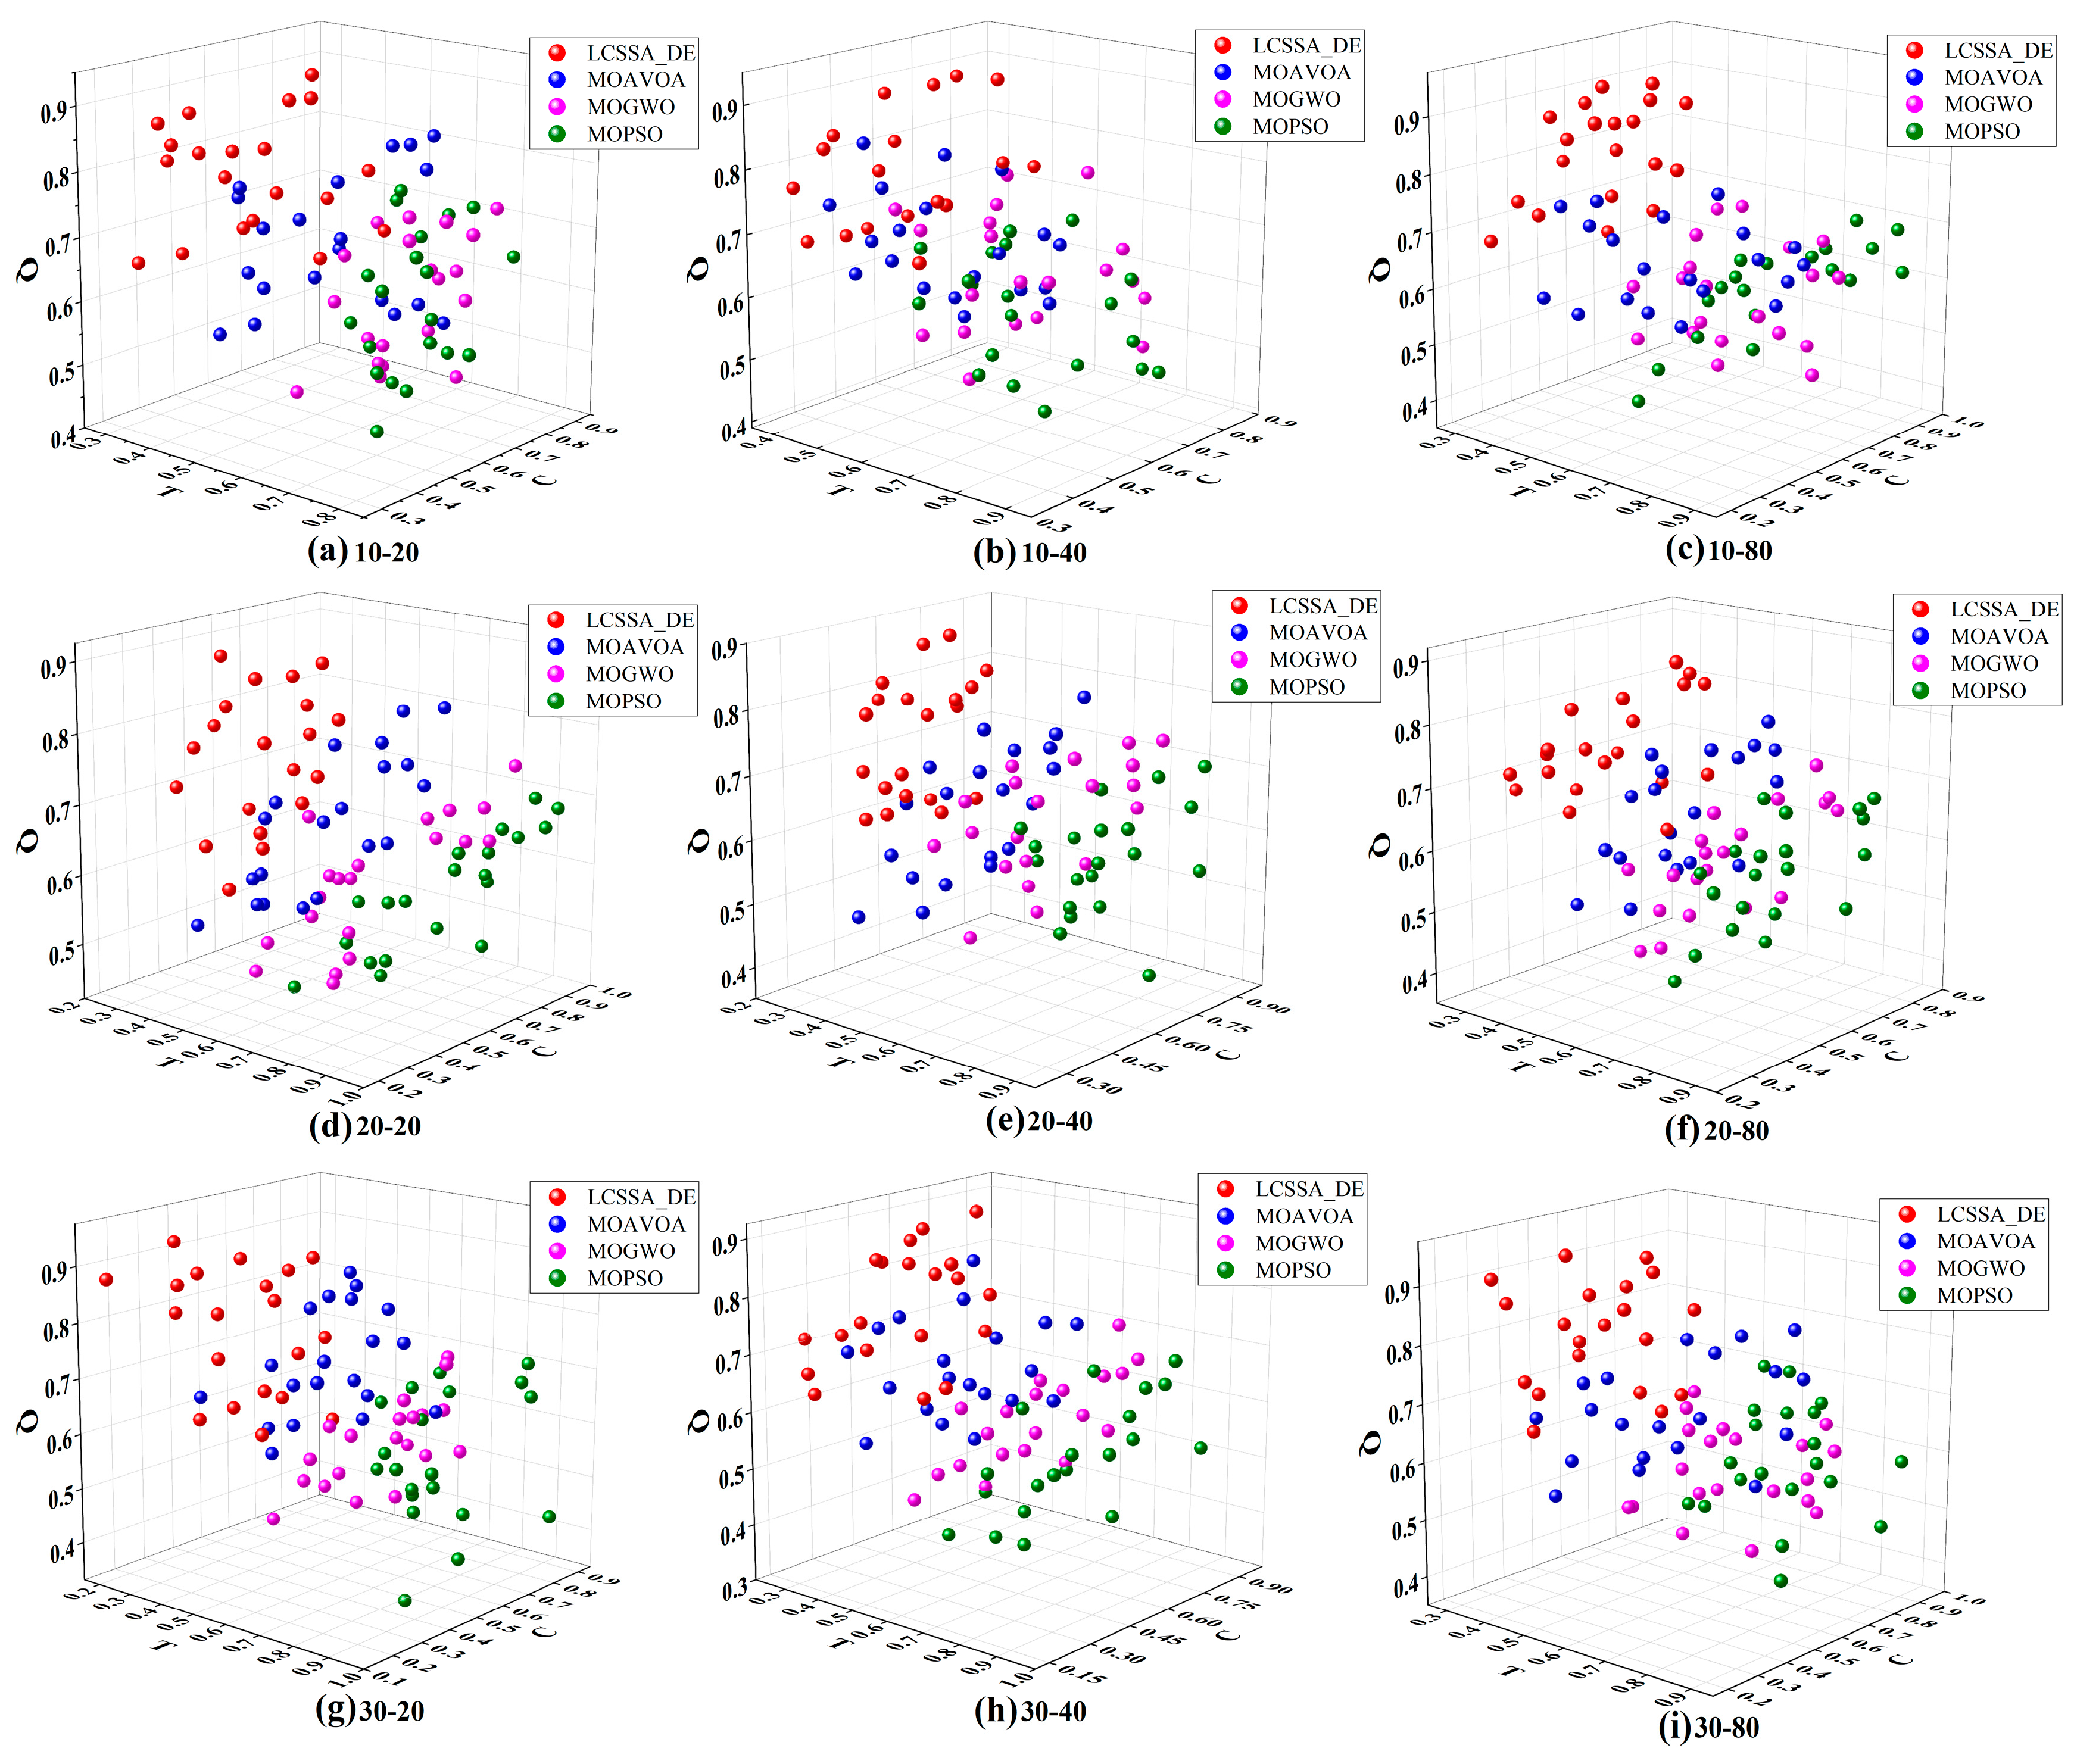
Figure 10, although the LCSSA_DE algorithm can effectively solve the problems of lower efficiency, slow convergence, and having fallen into local optimization when solving the model, there are 23%–31% of the points where the distribution of the Pareto front surface is still not optimal, 3/10 of the test functions have a GD indicator that is not optimal, and 2/10 of the test functions have IGD indicators that are not optimal. By analyzing
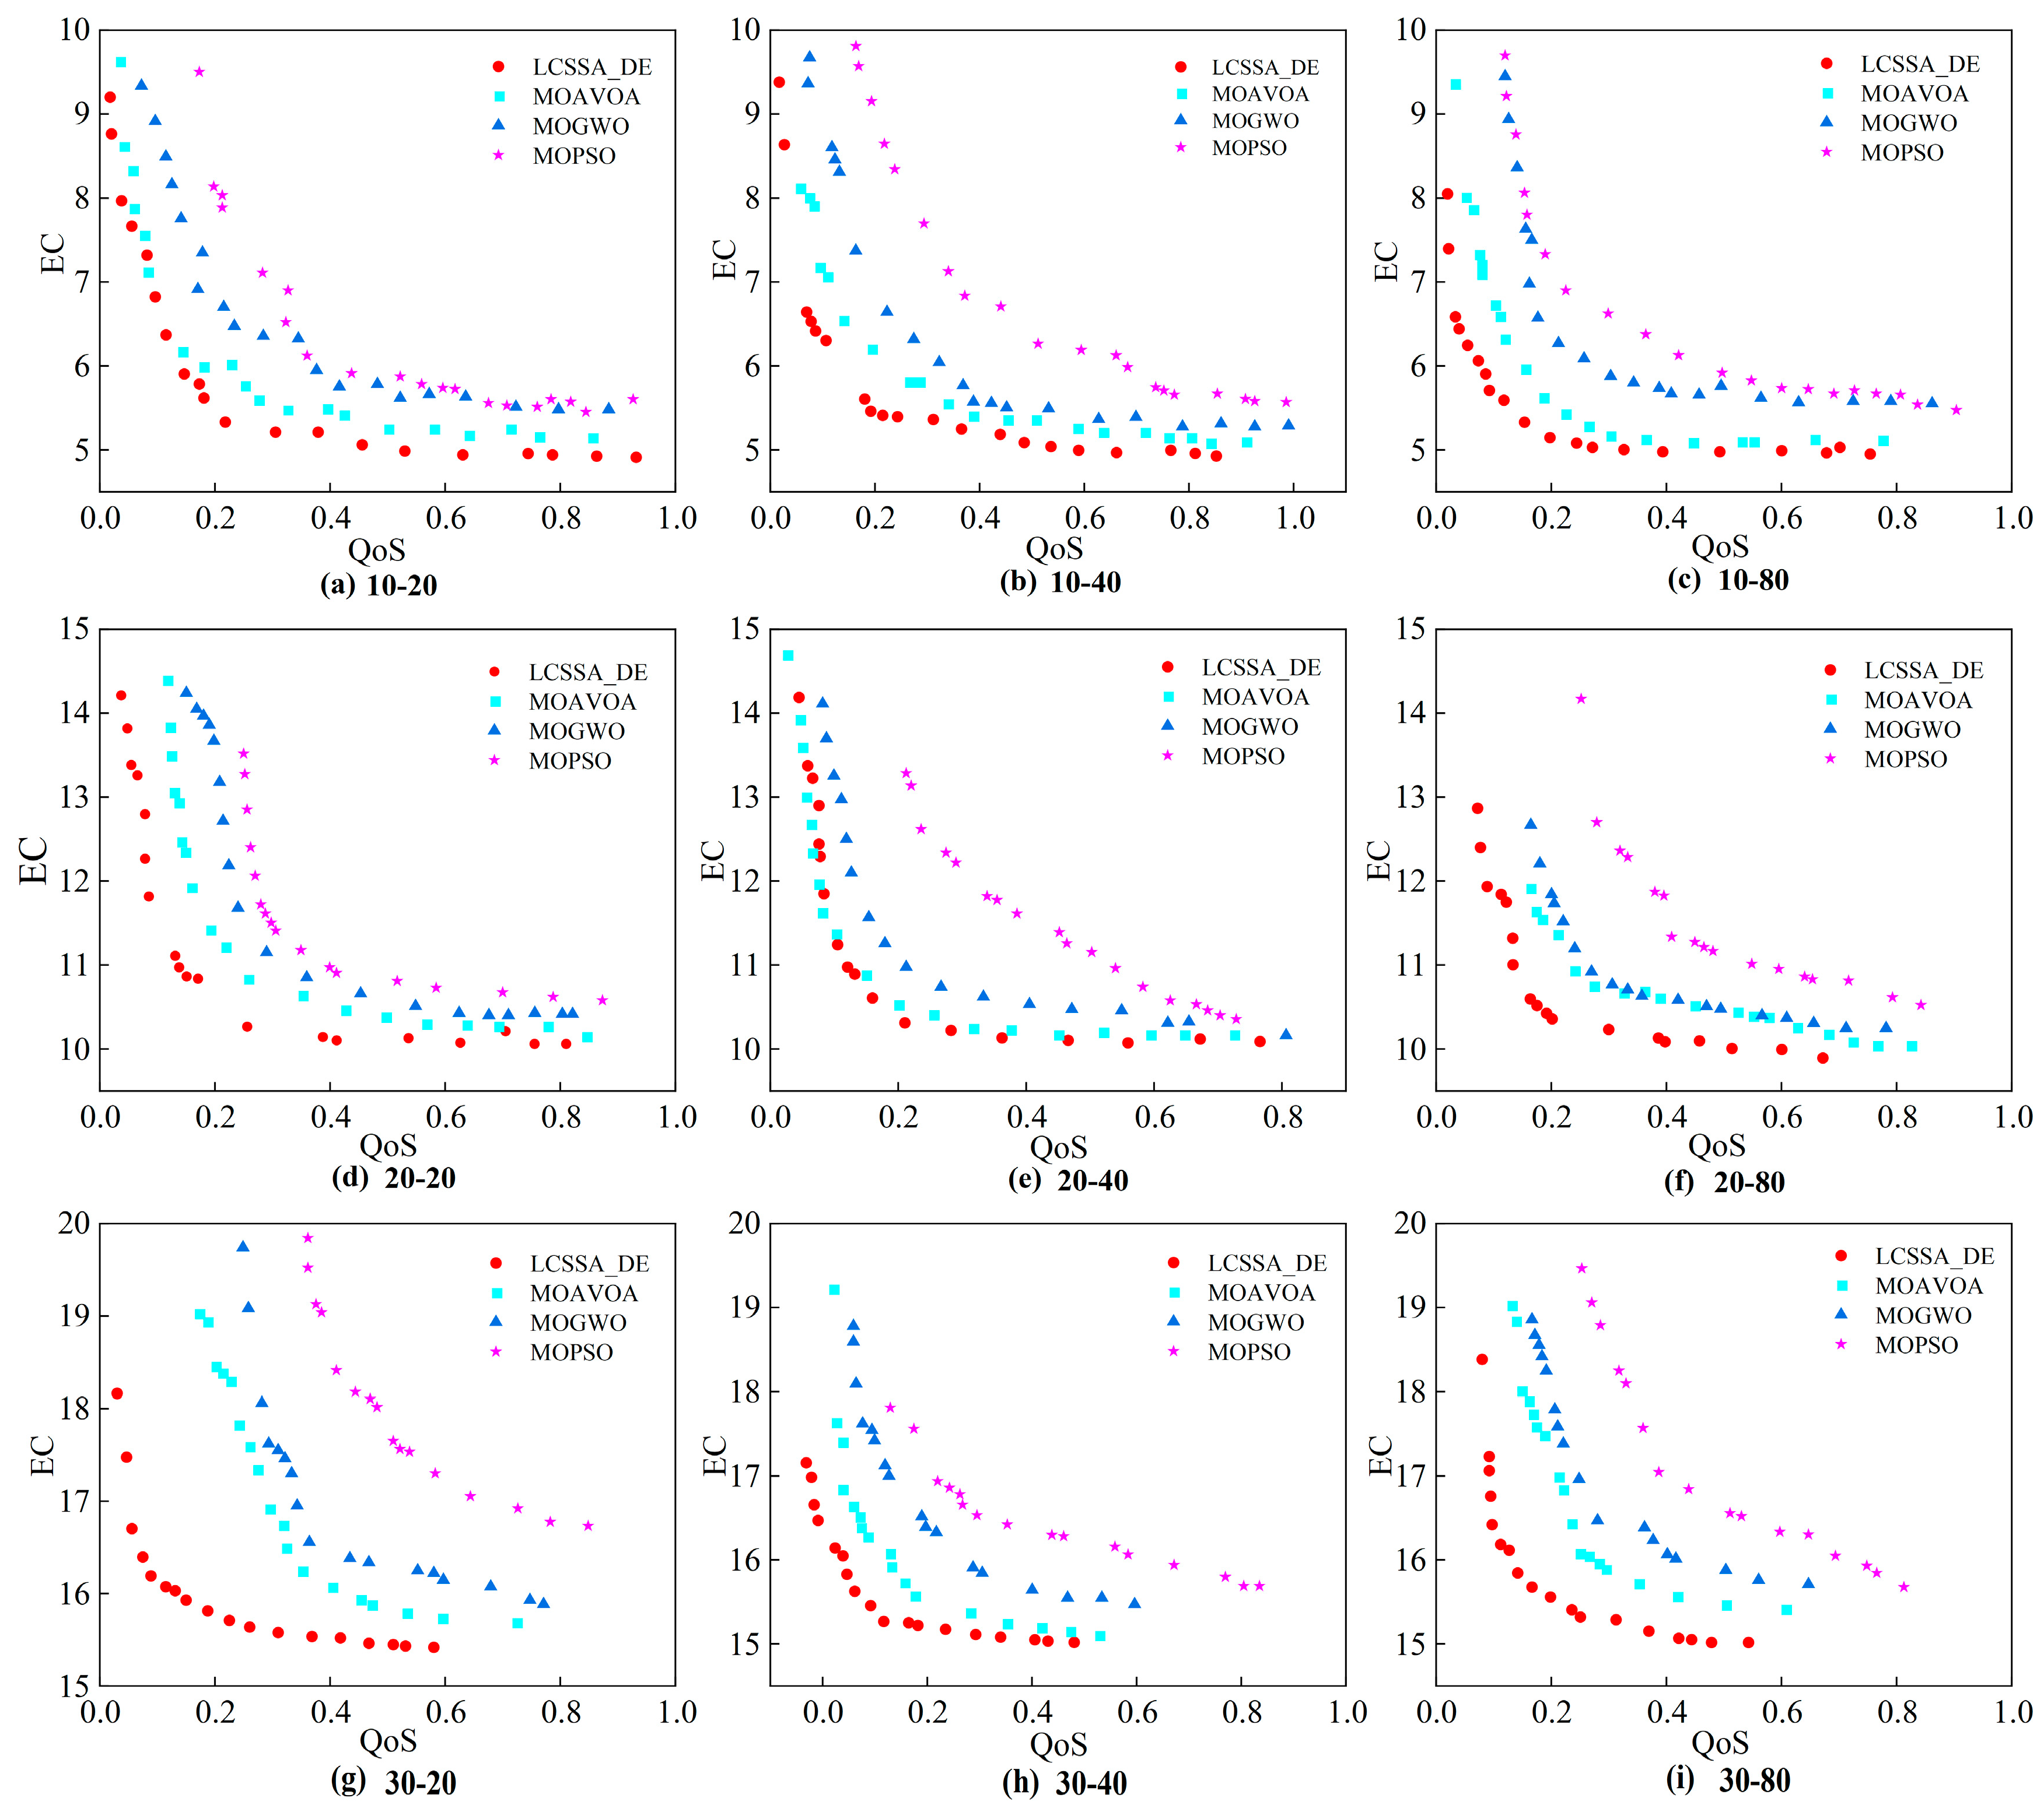
Figure 11 and
Figure 12, it can be seen that although the LCSSA_DE algorithm has advantages over the comparison algorithms for several datasets on the manufacturing scale-up problem, there are still some datasets with poor distributions; in addition, the current theoretical analysis only applies to the research of the self-built database, the conclusion is not necessarily applicable to the actual production site or other manufacturing parts, for the manufacturing process of more complex parts of the resource optimization model to solve the problem still need to be further explored. As shown in Equation (11), according to the modeling criteria, both QoS indicators and energy consumption indicators are consistent with the smaller the better under the constraints of meeting the secondary and tertiary indicators, and this objective function can be similarly applied to other manufacturing parts. At the same time, in the actual production, the establishment of the evaluation indicator system still has many uncertainties, service substitutability and other flexibility indicators also have a certain impact on the preferred combination of manufacturing services, and the more accurate establishment of energy consumption indicators will further affect the algorithm’s solution results. For example, direct and indirect energy consumption are considered in the establishment of energy consumption per unit of processing, and the integrated energy consumption of production equipment is also considered, which also points out the direction for subsequent research.
In addition, the application of machine learning in the service composition optimization problem is gradually maturing [
37], and it can be used for capacity optimization in combination with neural networks and other technologies; while the parameters of the quality indicators and the parameters of the energy consumption indicators depend on the quality of the raw materials and other factors of the complex production environment, the machine learning model can be dynamically adapted to the parameters of the optimization model based on these factors. At the same time, the machine’s operating status, historical production data, maintenance records, and other capacity-related characteristics affect the variation in the parameters in the model, and the introduction of machine learning allows for the better prediction of this set of variations in order to improve the productivity of coating machine ovens. In short, through the combination of machine learning and coating machine oven service composition-optimization, can significantly improve the optimization efficiency and adaptability. In the face of the actual production conditions of a dynamic and complex environment, this combination will have a wider range of applications.
5. Conclusions
This paper takes coating machine ovens as the research object, for the service composition optimization of the coating machine ovens, proposes an effective method to derive the composition optimization decision of the oven manufacturing services, which improves the production quality of the oven, shortens the production time, reduces the cost, and improves the production efficiency of the coating machines. At the same time, it considers the common interests of the demand-side of the crowdsourcing service and the operator of the crowdsourcing platform, and offers new ideas for the solution of this kind of part-level multi-objective optimization problems. However, there are still many uncertainties in the manufacturing production problems at different scales in this study, and the set of manufacturing resources corresponding to machining processes and parts in the actual production process is more complex; at the same time, the dual-objective indicators proposed for the oven are not comprehensive, and more QoS indicators and energy consumption indicators are often considered in the actual production. Therefore, in the subsequent research, the part-level splitting of the coating machine ovens can be more refined to collect and summarize a more comprehensive collection of manufacturing services for the coating machine ovens; additionally, the indicators in the modeling can be improved to make the experimental conclusions closer to the real production situation. In this paper, the following conclusions are obtained through field research, completing the part-level splitting of the manufacturing task of the coating machine oven, obtaining the candidate matching set of the oven, and then through the steps of establishing the evaluation system, modeling, solving, and validation:
Under the specific experimental scale, the LCSSA_DE algorithm has lower adaptation, with 69% to 77% points better than other algorithms, and has faster convergence speed, with 7.26% improvement in convergence speed compared to the suboptimal algorithm; in addition, analyzing the comparison of the GD indicator and the spread indicator under the two scales, the LCSSA_DE algorithm’s values are better than the other algorithms, and it exhibits a wide range of convergence and diversity, and the algorithm performs well.
Under the test function with the same number of iterations and population size, compared with the MOAVOA algorithm, the MOGWO algorithm and the MOPSO algorithm, the LCSSA_DE algorithm has a lower GD value under seven conditions, with a minimum value of 6.60 × 10⁻⁵ under the ZDT2 function; and a lower IGD value under eight conditions, with a minimum value of 5.06 × 10⁻⁴ under the ZDT1 function; it further illustrates the effectiveness of the LCSSA_DE algorithm in solving such problems.
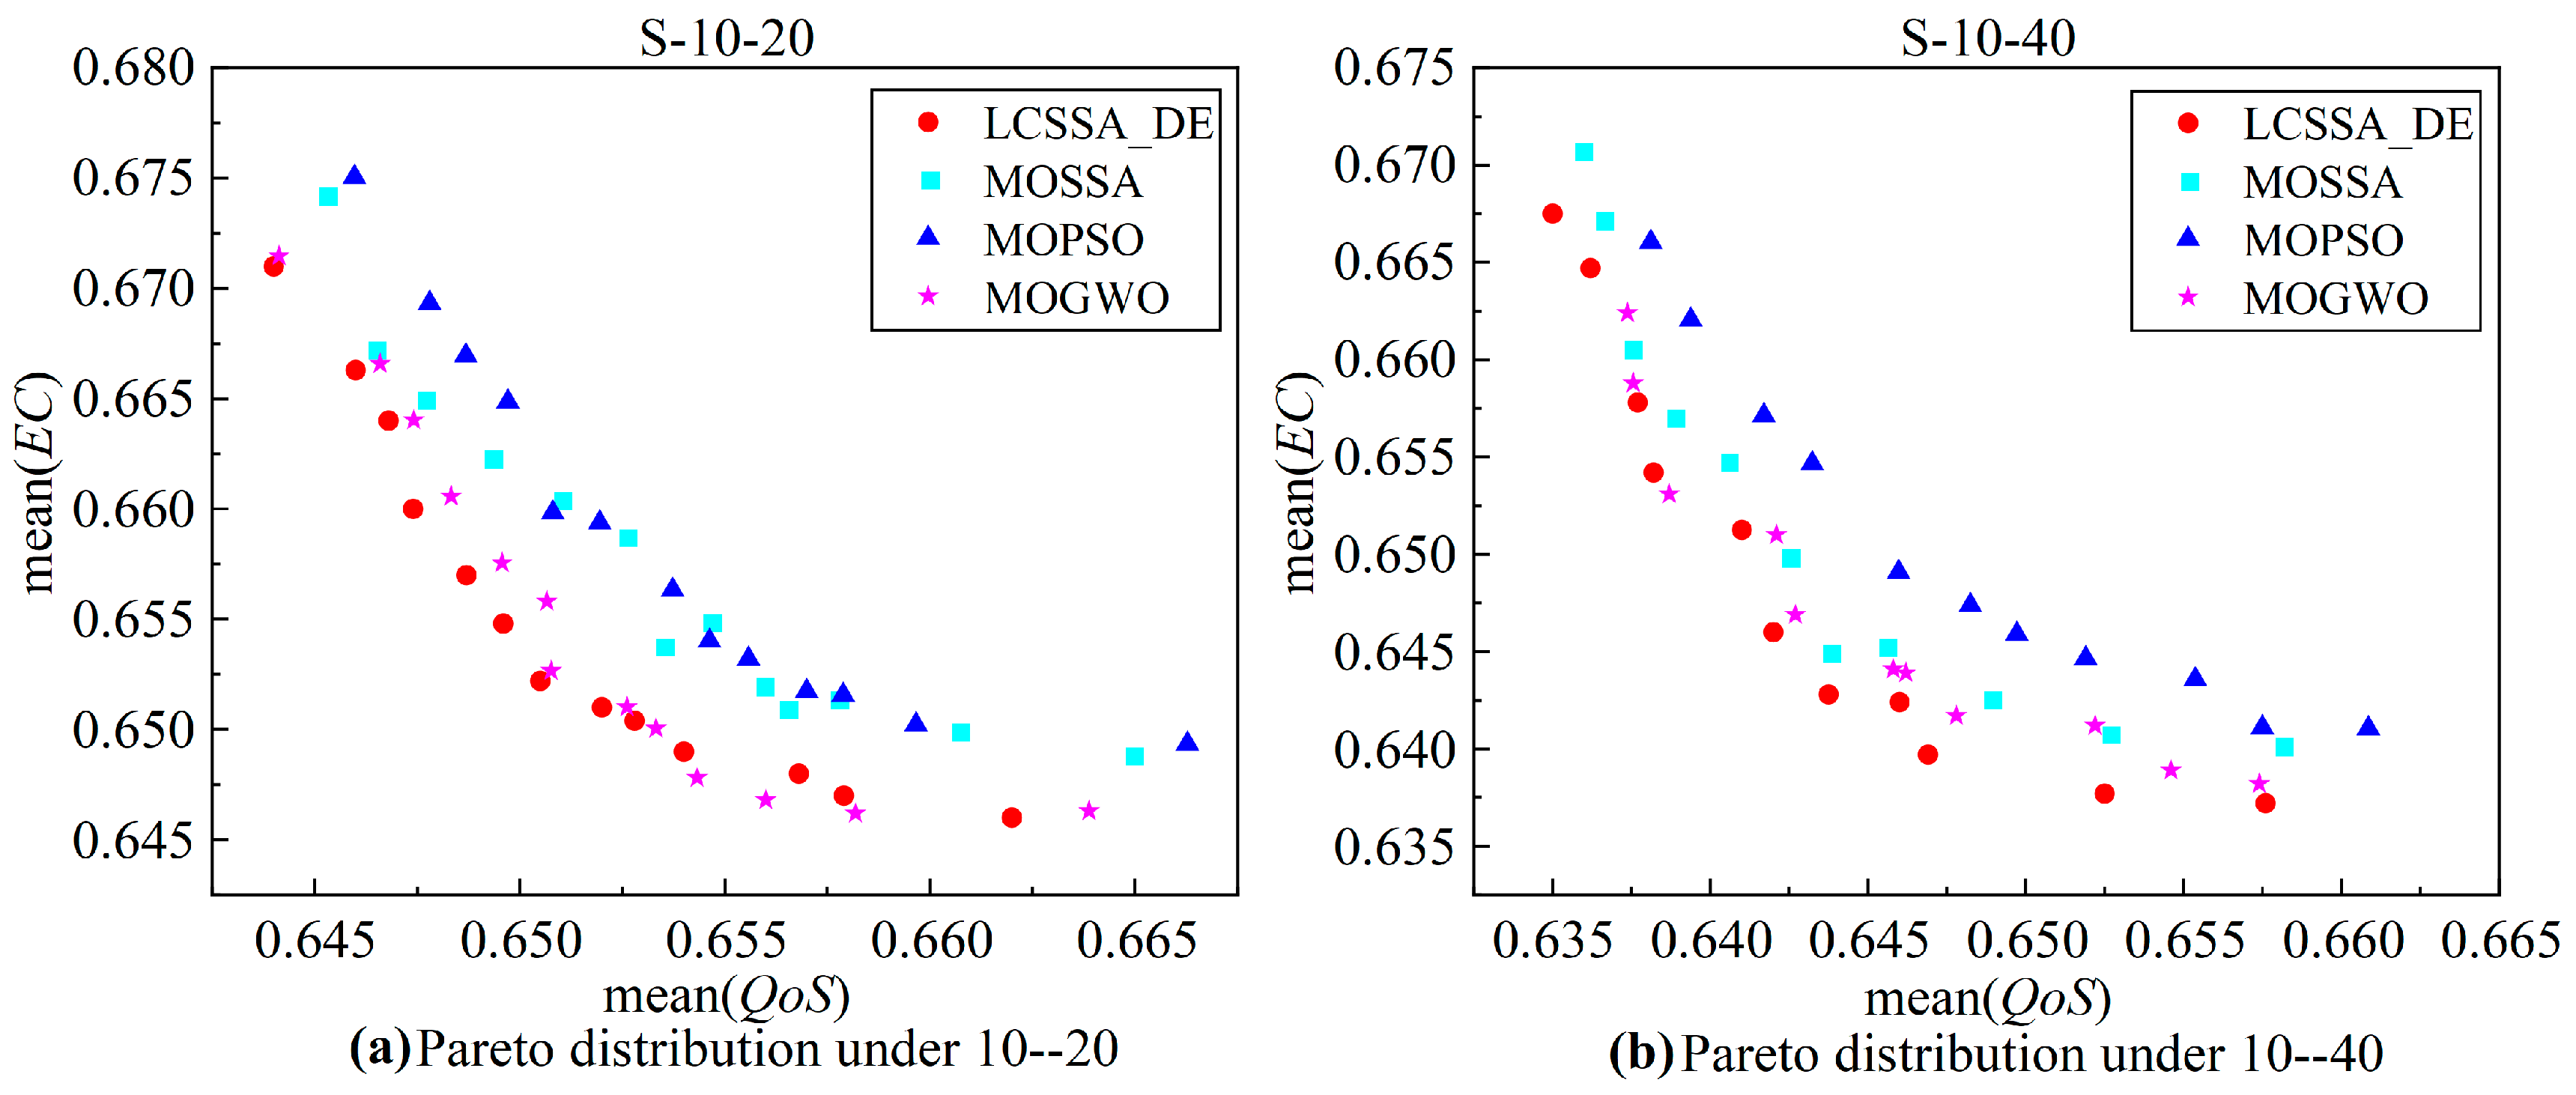
Expanding the problem to nine different sizes of manufacturing problems of coating machine ovens and comparing the four algorithms normalized to the QoS values of the problem, which can positively reflect the benefits of the demand-side of crowdsourcing services, on the basis of 10 processes, 20 processes, and 30 processes, the LCSSA_DE algorithms’ time indicators are all concentrated in (0.3–0.67), (0.29–0.7), and (0.28–0.68); cost indicators are all concentrated in (0.25–0.67), (0.22–0.7), and (0.22–0.68); quality indicators are all concentrated in (0.63–0.95), (0.6–0.92), (0.61–0.94). Meanwhile, by comparing the bi-objective manufacturing service portfolio optimization, the LCSSA_DE algorithm obtains a smaller value of the energy consumption indicator, which is increasing with the increase in the population size, and most of the solutions for the LCSSA_DE algorithm are concentrated in the lower-left optimal part.


