Article

Effects of Surface Finishing Procedures, Coffee Immersion, and Simulated Tooth-Brushing on the Surface Roughness, Surface Gloss, and Color Stability of a Resin Matrix Ceramic

by
Esra Kaynak Öztürk
1,
Ebru Binici Aygün
1,
Elif Su Çiçek
1,
Gaye Sağlam
2,
Bilge Turhan Bal
1,
Seçil Karakoca Nemli
1 and
Merve Bankoğlu Güngör
1,*
1
Department of Prosthodontics, Faculty of Dentistry, Gazi University, Ankara 06490, Türkiye
2
Department of Prosthodontics, Faculty of Dentistry, Zonguldak Bülent Ecevit University, Zonguldak 67600, Türkiye
*
Author to whom correspondence should be addressed.
Coatings 2025, 15(6), 627; https://doi.org/10.3390/coatings15060627
Submission received: 19 April 2025 / Revised: 13 May 2025 / Accepted: 19 May 2025 / Published: 23 May 2025
(This article belongs to the Special Issue Surface Properties of Dental Materials and Instruments, 3rd Edition)

Abstract

:
The color stability of dental ceramics in the oral cavity is influenced by multiple factors, including the patient’s dietary habits and oral hygiene practices, which can affect the optical and surface properties of resin-containing dental restorative materials. The purpose of this study was to evaluate the effects of surface finishing procedures and simulated tooth-brushing on the surface roughness, surface gloss, and color stability of resin matrix ceramics before and after coffee immersion. Forty specimens were prepared from a resin matrix ceramic and divided into four experimental groups according to surface finishing procedures, coffee immersion, and simulated tooth-brushing. The surface roughness, surface gloss, and color stability of the tested material were measured, and the data were statistically analyzed at a significance level of p < 0.05. The surface finishing procedures, measurement times, and application sequences affected surface roughness, surface gloss, and color stability. The most significant color differences occurred after coffee immersion; however, tooth-brushing had a more significant effect on the surface roughness and surface gloss. Coffee caused perceivable and clinically unacceptable color differences in the resin matrix ceramics. Tooth-brushing had a positive impact on the tested parameters. This study presents a novel approach by integrating both chemical (coffee immersion) and mechanical (tooth-brushing simulation) degradation processes to assess their combined and isolated effects on a resin matrix ceramic material. The findings provide clinically relevant insights into how finishing procedures and oral hygiene may influence the long-term esthetic performance of such restorative materials.

Graphical Abstract

1. Introduction

Restorative dentistry aims to meet the esthetic and functional demands of patients while reconstructing their natural tooth structures. Recently, chairside computer-aided design and computer-aided manufacturing (CAD-CAM) materials have become popular because of their easy and fast fabrication, reducing patient visits [1,2,3]. Resin-based ceramics are CAD-CAM materials that combine the advantages of composite and ceramic materials [1,4,5]. An increasing number of resin-based ceramics have been available in the dental market. GC Cerasmart 270 blocks (GC Dental Products Europe, Leuven, Belgium) are nanoceramic composite resin blocks composed of a polymer-based matrix reinforced with nanohybrid ceramic fillers that are produced by CAD-CAM for specific cases, completed in a short milling time, and have an elastic modulus close to dentin and absorb functional stresses [6,7]. These ceramics comprise 21% composite and 79% feldspathic ceramic nanoparticles [8]. A systematic review by Laborie et al. stated that Cerasmart demonstrated superior performance by exhibiting lower attrition wear while causing minimal wear on opposing enamel surfaces among the resin matrix ceramics evaluated [8]. This characteristic is particularly advantageous in restorative dentistry, where preserving the integrity of the restoration and the antagonist tooth structure is essential. The reduced enamel wear observed with Cerasmart can be attributed to its higher resin content and elastic modulus, which contribute to its ability to absorb occlusal forces more effectively than more brittle ceramic-based materials. When compared to other resin matrix ceramics, it was also stated that Cerasmart exhibited significantly better color stability [1,9]. The superior color stability of Cerasmart may be attributed to its Bis-GMA-free composition, as this monomer is known to increase water absorption, potentially leading to discoloration [10].
Color stability, surface roughness, and surface gloss are the key factors affecting the long-term clinical performance of tooth-colored ceramic restorations. The color stability of ceramic materials can be assessed accurately in both in vivo and in vitro settings using instruments like spectrophotometers and colorimeters [11]. Internationale de l’Eclairage (CIE) presented the color difference calculation methods to show the magnitude of changes in overall color and translucency in reflection [12]. Recently, two color difference formulas based on CIELab (DeltaE: ΔEab and CIEDE2000: ΔE00) were recommended to find the color differences in dentistry. The calculated color difference values are compared with the perceptibility and acceptability threshold values defined for the color difference [13]. The CIELab color system represents a uniform color space in which equal distances correspond to equal perceived color differences. There are three axes in this three-dimensional color space: L*, a*, and b*. The L* coordinate (lightness) indicates the brightness of the color and is on a scale from 0 (pure black) to 100 (pure white). The a* value measures redness (positive a*) or greenness (negative a*), while the b* value measures yellowness (positive b*) or blueness (negative b*). The advantage of the CIELab system is that color differences can be expressed in units of visual perception and clinical significance [14]. The ΔEab is commonly used in dental ceramics to assess color differences due to its simplicity and ease of implementation. It effectively evaluates perceptible and acceptable color differences, especially when comparing ceramic materials’ color stability and matching to natural teeth [15,16].
Color stability of dental ceramics in the oral environment is a multifactorial phenomenon. One of these factors is the patient’s dietary habits [17,18]. Nowadays, coffee is the most popular drink in the world. People drink over three cups of coffee daily, although it is thought to be the most staining solution. Some studies have shown that coffee causes discoloration in all-ceramic restorations [19,20,21]. Another factor is the patient’s adherence to oral hygiene procedures, such as tooth-brushing. Tooth-brushing is recommended daily by dentists for all patients; it maintains oral hygiene effectively, but brushing with toothpaste may adversely affect the surface properties of dental restorations. Different types of toothpaste are marketed to remove the stains and obtain perfect, whiter smiles. Some of them for smokers contain more significant amounts of detergents and abrasives than standard toothpaste to remove tough stains [22]. It can reduce the color change of the restorations [22], and toothbrush abrasion can cause a decrease in surface gloss and increase the surface roughness of resin-based ceramics [23]. Additionally, tooth-brushing followed by storage in a staining solution may also negatively alter the optical characteristics of resin-based ceramics, which influences the final esthetic of the restoration.
Dental ceramics’ color stability is associated with surface roughness and surface free energy [11]. Increased surface roughness provides more retention areas for pigments, while higher surface free energy promotes greater adsorption of staining agents, both of which may lead to decreased color stability [24]. Studies have shown that surface properties such as surface roughness and surface free energy significantly affect supragingival plaque formation and that restorative materials exhibit a certain predisposition for bacterial adhesion. High surface roughness values lead to biofilm formation and development, while high surface free energy supports the formation of dense plaque and allows selective accumulation of certain bacterial species. As the surface roughness and surface free energy of restorative materials increase, the risk of biofilm formation and, consequently, color change also significantly increases [25,26]. Surface roughness (Ra) values were measured to determine the surface roughness of the ceramic materials [27]. A critical threshold is a surface roughness value of approximately 0.2 µm in dental ceramics. The Ra value below 0.2 µm generally exhibits better color stability and improved resistance to plaque accumulation [28,29]. Various techniques have been employed to evaluate the surface roughness of ceramic materials, including quantitative analysis using a contact stylus profilometer, qualitative assessment through scanning electron microscopy (SEM), and both qualitative and quantitative evaluation with atomic force microscopy (AFM) [30,31]. Surface roughness is also associated with surface gloss. A smoother ceramic surface reflects light uniformly, producing higher gloss and a more natural, esthetic appearance. Therefore, minimizing surface roughness through proper finishing and polishing enhances dental restorations’ gloss and visual appeal [29,32]. It has been exhibited that when the restorations have rough surfaces, the light is reflected in several directions, compromising the esthetic outcomes [33]. Moreover, surface roughness is one of the reasons that can lead to the restoration’s discoloration over time. It also enables bacteria to bind to the restorations, which can cause secondary caries or gingival diseases. Topçu et al. highlighted that biofilm adhesion to restorative materials significantly contributes to the discoloration of dental materials [34]. Additionally, staining pigments and colorants are still problems in the discoloration of teeth and dental restorations. Kursoğlu et al. emphasized that surface stainability is closely linked to surface texture, noting that achieving a smooth surface, typically through polishing or reglazing, is crucial in preventing the staining of ceramic restorations [35]. Therefore, finishing and polishing techniques should produce a smooth, glossy surface that mimics the light-reflecting properties of natural teeth [36,37]. Various finishing surface treatments can maintain the surface quality and final appearance of ceramic restorations. Resin-based ceramics are glazed using manual polishing techniques or light-polymerized glaze material [38]. Glaze with firing cannot be recommended because of its resin matrix components [39,40,41]. However, the effectiveness of these conventional polishing systems is indefinite [40]. Furthermore, the studies investigating the effect of surface finishing on these ceramics’ color stability and surface roughness after tooth-brushing and coffee immersion were limited [40,42]. Therefore, this study aimed to evaluate the effects of surface finishing procedures and simulated tooth-brushing on the surface roughness, surface gloss, and color stability of a resin matrix ceramic before and after coffee immersion. The null hypothesis was that the surface finishing procedure (glazing and mechanical polishing) and tooth-brushing, before and after coffee immersion (application sequence and measurement time), would not affect the surface roughness, surface gloss, and color stability of the tested resin matrix ceramic.

2. Materials and Methods

To investigate the effects of material type, application sequence, and measurement times on the surface roughness and gloss values, a three-way repeated-measures ANOVA was decided to be used. Based on a medium effect size (f = 0.25), an alpha level of 0.05, a statistical power of 0.90, and a correlation of 0.70 between repeated measures, the minimum required sample size was calculated using the G*Power v.3.1.9.4 software. The analysis indicated that a minimum of 32 specimens (n = 8 for each group) would be sufficient. To examine the effects of material type and application sequence on the color difference values, a two-way repeated-measures ANOVA was decided to be used. Under the same assumptions (medium effect size f = 0.25, alpha = 0.05, power = 0.90, and correlation = 0.70 between repeated measures), the minimum required sample size was calculated as 10 per group, totaling 40 specimens, using the G*Power v.3.1.9.4 software. Therefore, in order to evaluate the effects of material type, application sequence, and measurement time on surface roughness, gloss, and color difference values, it was decided to include 40 specimens in the study, with 10 specimens in each group. The flowchart of the study is summarized in Figure 1.

2.1. Specimen Preparation

The effects of different surface finishing procedures and simulated tooth-brushing before and after coffee immersion on the surface roughness, surface gloss, and color stability of a hybrid nanoceramic were tested in the present study. For this purpose, 40 specimens (12 × 12 mm in dimensions and 1.5 mm in thickness) were prepared from A2 shade hybrid nanoceramic material (GC Cerasmart 270; GC Dental Products Europe, Leuven, Belgium). The specimens were sectioned using a precision cutting device (Micracut Precision Cutter, Metkon, Bursa, Türkiye). All specimens were wet-ground using silicon carbide papers with 400, 800, and 1200 grits. Wet grinding was performed using a rotary polishing device (Micracut Precision Cutter; Metkon, Bursa, Türkiye) at 300 rpm under continuous water cooling.

2.2. Experimental Procedure

Forty specimens were randomly divided into four subgroups (n = 10).
Group 1: Glazed and simulated tooth-brushing applied after coffee immersion;
Group 2: Glazed and simulated tooth-brushing applied before coffee immersion;
Group 3: Mechanically polished and simulated tooth-brushing applied after coffee immersion;
Group 4: Mechanically polished and simulated tooth-brushing applied before coffee immersion.
Baseline values recorded for each specimen before any intervention were used as internal controls. This approach allowed the effect of each procedure (coffee immersion and tooth-brushing) to be evaluated within the same specimen, minimizing inter-specimen variability.
The glazing and mechanical polishing procedures were performed once, following specimen preparation and before the aging sequences. No additional surface finishing was applied between the first and second stages of the aging protocols in any group.
The surface treatment of the ceramic specimens was completed by performing mechanical polishing at a speed of 10,000 rpm for 60 s. A special polishing kit (Optrafine; Ivoclar Vivadent, Schaan, Liechtenstein) designed specifically for polishing ceramics was used for this process. A new polishing kit was used for each ceramic group. Mechanical polishing was carried out using a micromotor at a constant speed and duration to ensure a uniform surface. First, the surface-correcting rubber, then the pre-polishing rubber, and, finally, the high-gloss rubber were each applied for 60 s. Light manual pressure was applied to the ceramic surface during polishing to avoid overheating, and no air or water cooling was used during this procedure. This procedure was applied only to one surface of the specimens, and after the process, thickness measurements were taken using a digital caliper. Specimens that did not meet the size requirements of the experimental protocol were excluded, and new specimens were prepared in their place. In the final step, the polishing paste was applied without pressure, using a constant speed and duration micromotor to complete the final polishing.
The glazing procedure was performed using resin-based OptiGlaze (GC Dental Products Europe, Leuven, Belgium) material following the manufacturer’s instructions. OptiGlaze was applied as a thin layer to the measurement surface of the ceramic specimens. Before application, the ceramic surfaces were cleaned with alcohol to remove contaminants, ensuring optimal adhesion. The glaze material was then evenly distributed on the surface using a brush. Polymerization was completed utilizing the polymerization device (Valo Cordless; Ultradent, South Jordan, UT, USA), which emits light in the 385–515 nm wavelength range, with an output power of approximately 1000 mW/cm2 in standard mode. The applied glaze material was cured for 20 s.
In this study, a light-polymerized, resin-based glaze (OptiGlaze; GC Dental Products Europe, Leuven, Belgium) was used instead of conventional high-temperature fired glaze, as the latter is not recommended for resin matrix ceramics due to their polymer-based structure. The resin matrix components in hybrid ceramics can be negatively affected by heat treatment, potentially leading to degradation of the material’s surface and discoloration over time. This limitation has also been noted in previous studies, which reported that resin-containing glaze materials are more prone to water sorption and pigment penetration, thereby compromising long-term color stability and surface integrity [43].
To simulate the coffee immersion, a coffee solution was prepared using 3.6 g of instant coffee (Nescafe Classic; Nestlé, Vevey, Switzerland) and 300 mL of boiling water [35]. The daily duration of coffee consumption was assumed to be approximately 1.5 min (300 mL~1.5 cups) [44]. The yearly approximate exposure to coffee was calculated to be 9 h. Thus, the specimens were immersed in the coffee solution for 9 h to simulate a year of coffee drinking. The specimens were stored in the coffee solution at 37 °C [19,44]. Although this duration was calculated to simulate one year of cumulative coffee exposure, it represents a continuous immersion model that does not fully reflect real-life oral conditions where coffee contact is intermittent and modified by salivary flow, swallowing, and the rinsing effects of other consumed beverages. The pH values of the coffee solution and the toothpaste slurry were measured using a calibrated digital pH meter (Inolab pH 7110; WTW, Weilheim, Germany). Measurements were conducted at room temperature. The coffee solution exhibited a pH of 5.3, confirming its mildly acidic nature, while the toothpaste slurry had a pH of 8.2.
Before simulating tooth-brushing, the specimens were rinsed with distilled water. Each specimen was placed into a multi-station brushing simulator (DentArGe TB-6.1 Brushing Simulator; Analitik Medikal, Ankara, Türkiye). The brushing process was conducted at 2 Hz, under a 200 g force, with a brushing speed of 40 mm/s. The simulator was set to a linear back-and-forth motion with a stroke length of 20 mm [45].
For the brushing simulation, medium-bristled toothbrushes were attached perpendicularly to the surface of the ceramic specimens on parallel arms of the brushing machine. Each compartment of the simulator was filled with a slurry made by suspending 250 g of low-abrasive toothpaste (Colgate Optic White for Coffee, Tea, and Tobacco; Colgate-Palmolive, New York, NY, USA) in 1 L of distilled water. The specimens underwent 10,000 brushing cycles, corresponding to approximately one year of brushing in an oral environment. Afterward, the specimens were rinsed with water [45]. The concentration of 250 g of toothpaste in 1 L of water was selected in accordance with ISO 14569-1, which is a standardized method used to simulate in vitro tooth-brushing abrasion [46]. Regarding the post-brushing cleaning procedure, all specimens were also cleaned in an ultrasonic bath to ensure thorough removal of any residual debris or slurry.

2.3. Measurement of Color Parameters

In this study, the term “baseline” refers to the initial measurements recorded after surface treatment (mechanical polishing and glazing), before any experimental intervention. The “first measurement” corresponds to the values obtained after the initial procedure (either coffee immersion or simulated tooth-brushing), while the “second measurement” represents the data collected after both procedures were completed in sequence.
The specimens were rinsed with distilled water for 5 s and then air-dried. Each specimen’s color parameters (L*, a*, and b*) were recorded using a spectrophotometer (Konica Minolta; Minolta Konica, Tokyo, Japan) under standard D65 illumination. The spectrophotometer was configured with the following settings: standard illuminant D65, d/8 illumination geometry, a 10° standard colorimetric observer, SCE (specular component excluded) mode, and an 8 mm diameter measurement area. All measurements were conducted within the same color measurement chamber with a neutral gray background. The device was calibrated with its reference calibration plate before measuring each experimental group. Thirty measurements were taken per group. Measurements were conducted before and after the experimental procedures, and color differences were determined using the following formula [16]:
∆Eab = [(∆L)2 + (∆a)2 + (∆b)2
The color difference values of the experimental groups were evaluated against the perceptibility threshold of 1.2 and the acceptability threshold of 2.7 [16].

2.4. Measurement of Surface Gloss (Gloss Unit: GU)

The gloss values of the specimens were measured at a 60° angle using a gloss meter (PCE-GM 60 Plus; PCE Deutschland GmbH, Meschede, Germany) following ISO 2813 standards [47]. Before the measurements, the gloss meter was calibrated with the calibration plate, and the specimens were positioned to take measurements from their centers. Three measurements were taken for each specimen, and the mean values of these measurements were recorded as the gloss value for each specimen [48].

2.5. Measurement of Surface Roughness

The average surface roughness (Ra) of the specimens was measured with a contact stylus profilometer (Marsurf M 300 C, MarSurf RD 18 C, stylus PHT 6–350/2 μm, Mahr GmbH; Göttingen, Germany) at a speed of 0.5 mm/s and with a movement distance of 1.75 mm. The device was equipped with a 2 µm radius diamond stylus, applying a constant force of approximately 0.7 mN, in accordance with the manufacturer’s specifications. The device was calibrated with its calibration plate (PRN-10; Mahr GmbH; Göttingen, Germany) before measuring each group. During the measurements, care was taken to ensure that the probe was parallel to the ground and that the measuring tip made contact with the surface at a right angle. After forming the experimental groups, three measurements were taken for each specimen, and the average of these measurements was calculated. As a result, the average surface roughness values were determined.

2.6. Surface Analysis Using Atomic Force Microscopy (AFM)

To assess the surface topography, glazed, mechanically polished, glazed and tooth-brushing-applied, and mechanically polished and tooth-brushing-applied specimens were examined using an atomic force microscope (Alpha 300S TS-150; WITec GmbH, Ulm, Germany) after 10,000 cycles of tooth-brushing. Each specimen was scanned over a 20 × 20 µm2 area at a scanning speed of 10 µm/s.

2.7. Statistical Analyses

The study’s data analysis was conducted using IBM SPSS version 23.0, JASP version 0.12 statistical software packages, and RStudio: Integrated Development Environment for R (version 2021.09.0). Descriptive statistics were presented as mean ± standard deviation (mean ± SD), median, quartile values (Q1 and Q3), minimum, and maximum values. The conformity of the data to a multivariate normal distribution was assessed using the “mvn” package in the R programming language. The effects of different material types and application sequences on surface roughness, gloss, and ΔEab color difference measurements at various time points were analyzed using three-way repeated-measures ANOVA. The assumption of multivariate normality, required for three-way repeated-measures ANOVA, was evaluated using the “mvn” package in RStudio. The assumption of sphericity was assessed using Mauchly’s sphericity test. If a significant difference was found in the ANOVA results, the Bonferroni multiple comparison test was applied to determine which groups contributed. A significance level of p < 0.05 was considered statistically significant.

3. Results

In this section, the term “baseline” refers to the initial surface roughness (Ra), surface gloss (GU), and color difference (ΔEab) values recorded after the application of surface finishing procedures (either mechanical polishing or glazing), and before any experimental intervention (coffee immersion or simulated tooth-brushing). The term “first measurement” indicates the values measured after the initial intervention, which could be either coffee immersion or tooth-brushing, depending on the experimental group. The “second measurement” represents the values obtained after the completion of both experimental interventions in sequence (e.g., brushing after coffee immersion, or coffee immersion after brushing).

3.1. Average Surface Roughness (Ra)
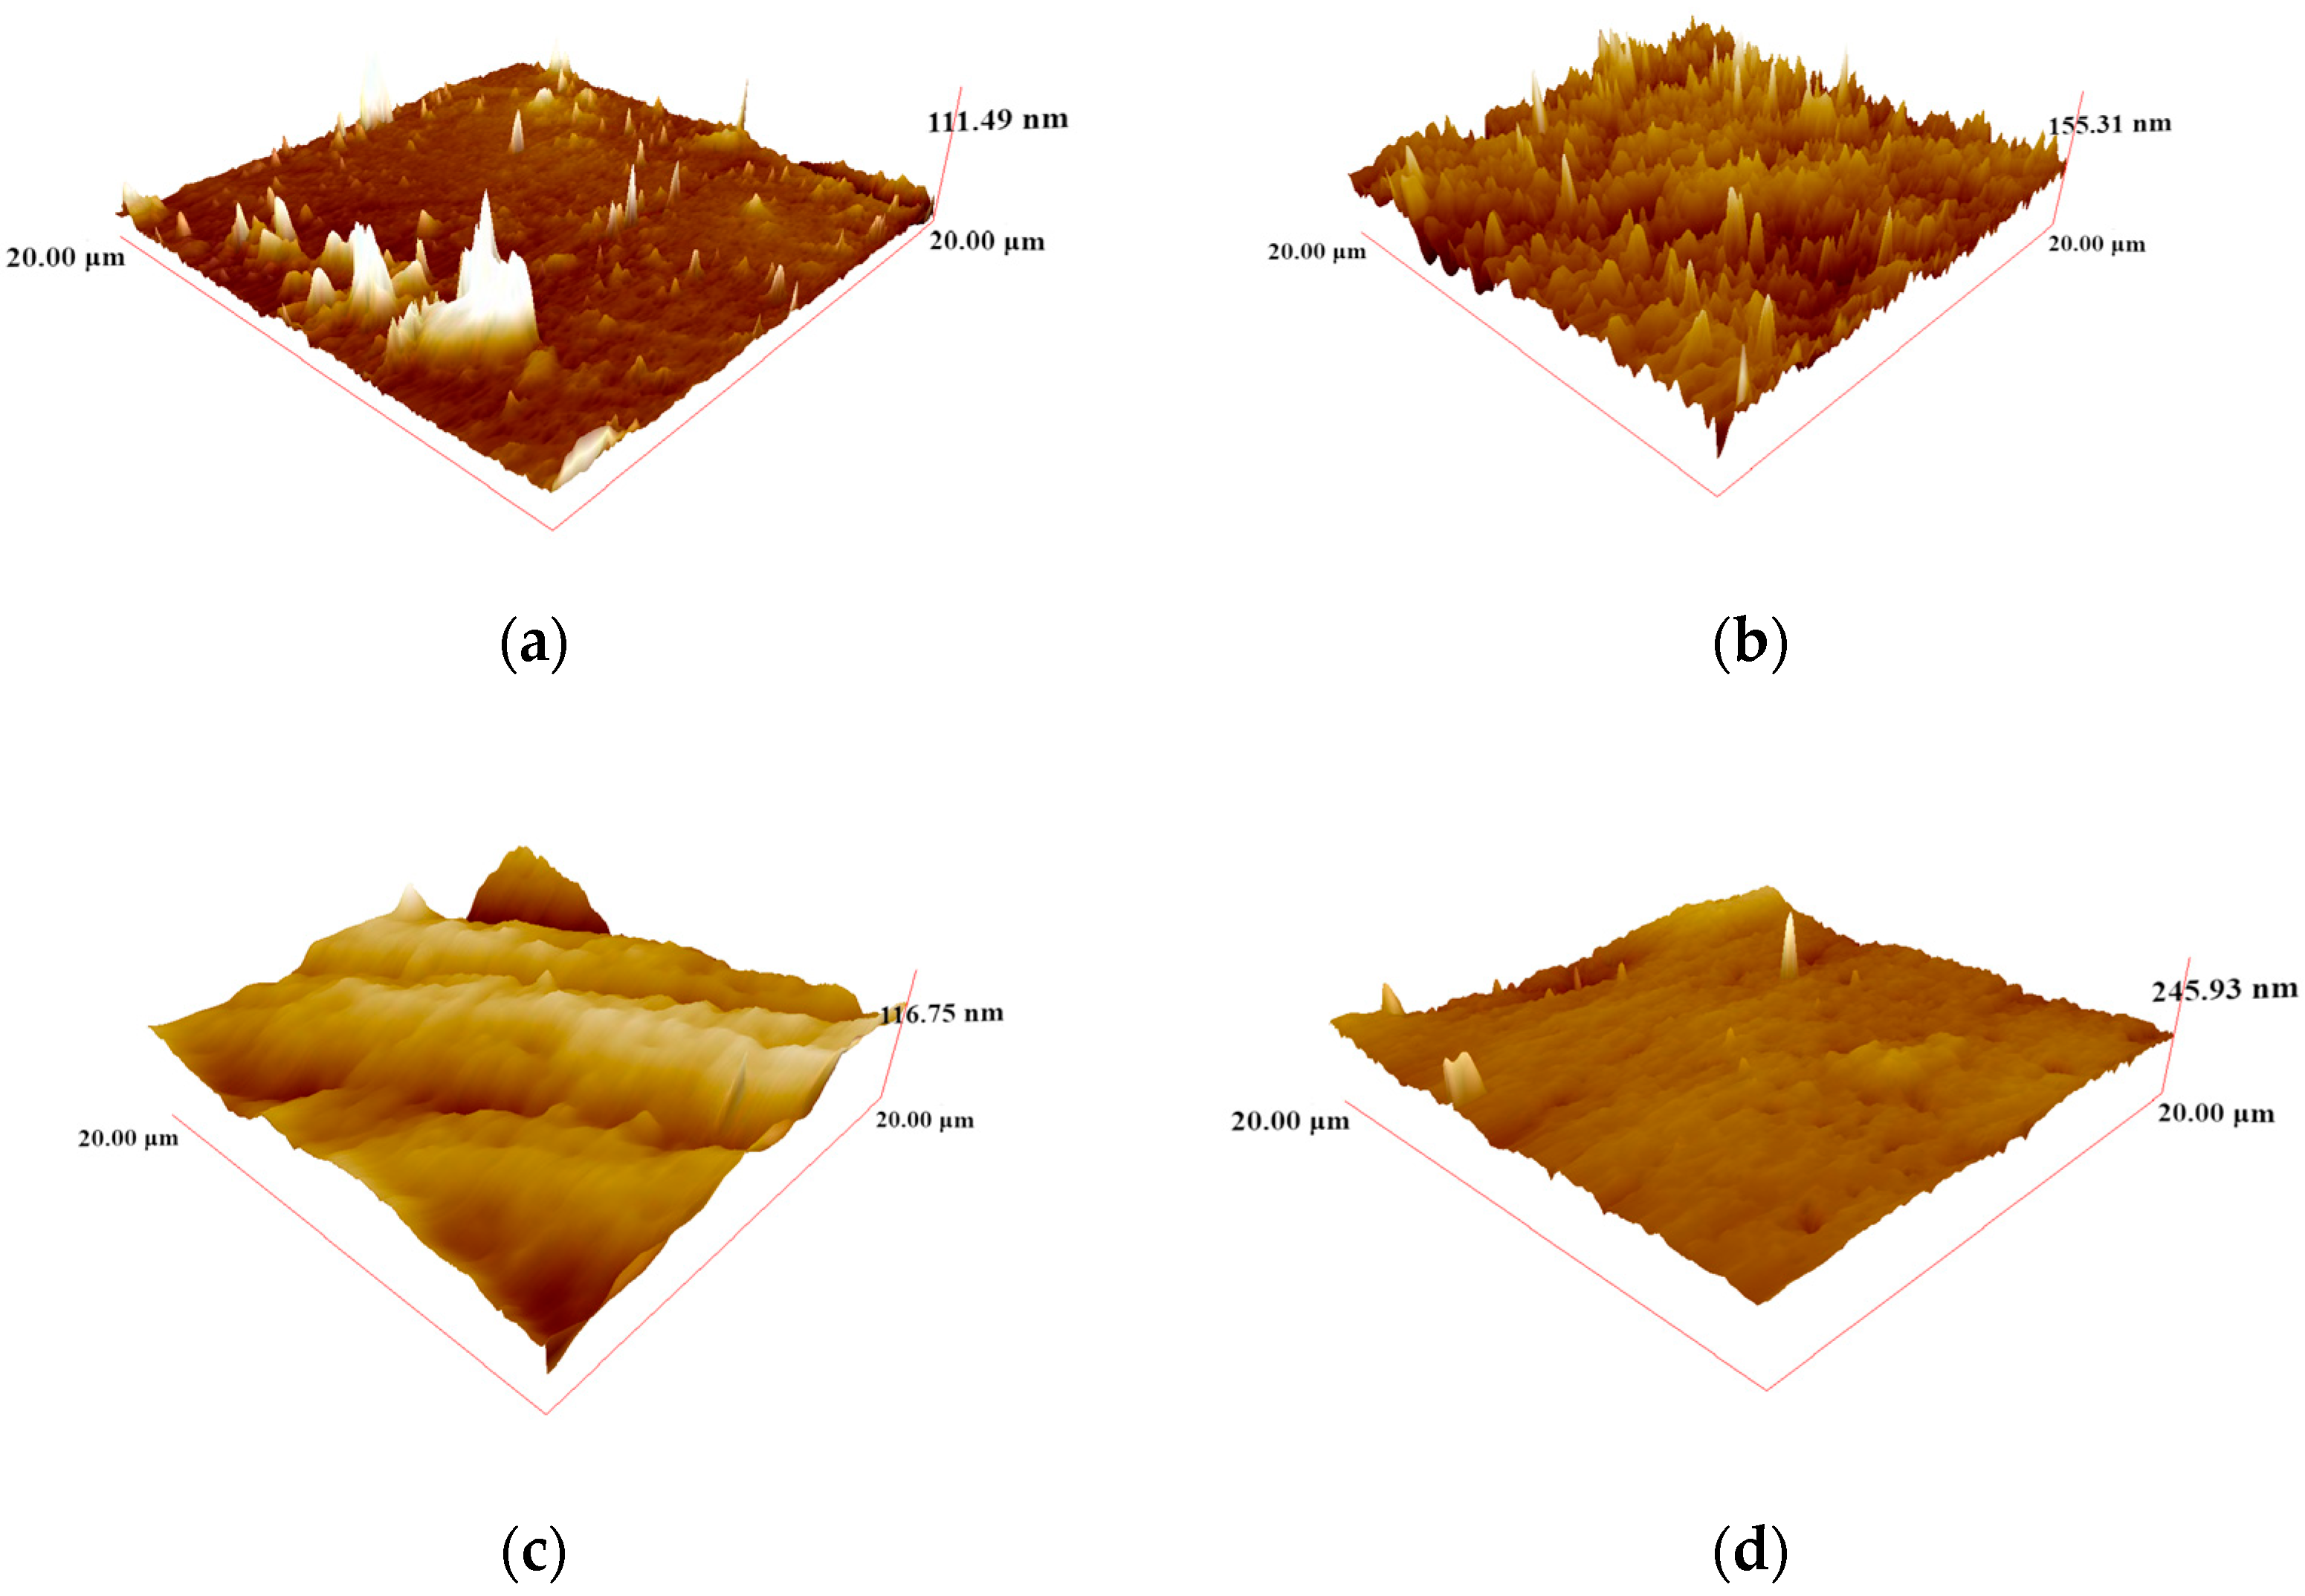
The descriptive analyses of the average surface roughness data of the experimental groups are presented in Table 1. All experimental groups showed higher average surface roughness values at baseline than coffee immersion and simulated tooth-brushing groups (first and second measurements). The results have shown that coffee immersion and simulated tooth-brushing generally reduced surface roughness; however, brushing reduced surface roughness to a greater extent. The larger differences observed in Ra values between glazed and mechanically polished specimens, especially when brushing followed by coffee immersion, may be due to the combined effect of surface softening from coffee acidity and mechanical wear, which was more pronounced on glazed surfaces.
The effects of surface finishing procedure, application sequences, and measurement time points on the average surface roughness values were analyzed using three-way repeated-measures ANOVA. The assumptions for this analysis include multivariate normality and the assumption of sphericity. The data conformity to a multivariate normal distribution was tested using the “mvn” package in RStudio. The Henze–Zirkler multivariate normality test results showed that surface roughness measurements followed a normal distribution (p > 0.05). The assumption of sphericity, another requirement for repeated-measures ANOVA, was evaluated using Mauchly’s sphericity test. The results showed that the assumption of sphericity was met (p > 0.05); the results of the three-way repeated-measures ANOVA are presented in Table 2. There was no interaction among the factors (different surface treatments, application sequence, and measurement times) on the average surface roughness values (F(2,72) = 2.4849, p = 0.905). The combined effect of different application sequences and measurement times on surface roughness values was found to be statistically significant (F(2,72) = 11.3124, p < 0.001).
Bonferroni multiple comparison test results for the interaction effect of application sequence and measurement time are presented in Table 3. The average surface roughness values of coffee immersion (0.26 ± 0.06) were higher than simulated tooth-brushing (0.17 ± 0.03); however, the average surface roughness values were not significantly different after the second measurements (p > 0.05). Different uppercase letters in Table 3 indicate statistically significant differences among the groups (p > 0.05). Values are expressed as mean ± standard deviation (SD).

3.2. AFM Images

AFM images of the glazed (Figure 2a), mechanically polished (Figure 2b), glazed and tooth-brushing-applied (Figure 2c), and mechanically polished and tooth-brushing-applied (Figure 2d) specimens supported the surface roughness data. Thus, smoother surfaces were observed after tooth-brushing. Figure 2 presents the three-dimensional surface topographies obtained by atomic force microscopy (AFM) for the four experimental conditions: (a) glazed, (b) mechanically polished, (c) glazed and tooth-brushing-applied, and (d) mechanically polished and tooth-brushing-applied specimens. The maximum height variations observed in each group were 111.49 nm for the glazed group, 155.31 nm for the mechanically polished group, 116.75 nm for the glazed and brushed group, and 245.93 nm for the mechanically polished and brushed group. These values reflect surface topographical differences that are consistent with the Ra measurements.

3.3. Surface Gloss (Gloss Unit: GU)

The descriptive analyses of the surface gloss of the experimental groups are presented in Table 4. Surface gloss values ranged between 54 and 60.1 at baseline measurements. It was observed that surface gloss values increased after simulated tooth-brushing. Mechanically polished groups showed higher surface gloss values after the second measurements.
The effect of surface finishing procedures, application sequences, and measurement times on surface gloss values was analyzed using a three-way repeated-measures ANOVA. The assumptions of this analysis include multivariate normality and sphericity. The multivariate normality of the data was assessed using the “mvn” package in RStudio. According to Henze–Zirkler’s multivariate normality test results, the surface gloss values were found to conform to a normal distribution (p > 0.05). The sphericity assumption, another requirement for repeated-measures ANOVA, was evaluated using Mauchly’s sphericity test. The results of Mauchly’s test indicated that the assumption of sphericity was met (p > 0.05). The results of the three-way repeated-measures ANOVA are presented in Table 5. The combined effect of different surface finishing procedures, application sequences, and measurement times on surface gloss measurement values was found to be statistically significant (F(2,72) = 8.1505, p < 0.001).
Bonferroni multiple comparison test results for the interaction effect of application sequence and measurement time are presented in Table 6. The surface gloss values increased after the second measurements of the glazed specimens; however, the difference was significant in the first coffee immersion and then in the simulated tooth-brushing group. The gloss values of the mechanically polished groups significantly increased after simulated tooth-brushing. The surface gloss values were not significantly different between the surface finishing procedures within the same application sequence and measurement time groups (p > 0.05).

3.4. Color Stability (DeltaE: ∆Eab)

The descriptive analyses of the color stability of the experimental groups are presented in Table 7. It was observed that glazed and mechanically polished specimens showed similar results in the same application sequence groups. Coffee immersion caused greater color differences for all experimental groups.
The effect of different surface finishing procedures, application sequences, and measurement times on DeltaEab values was analyzed using three-way repeated-measures ANOVA. The assumptions of this analysis include multivariate normal distribution and sphericity. The conformity of the data to a multivariate normal distribution was assessed using the “mvn” package in RStudio. According to the results of “Henze–Zirkler’s” multivariate normality test, the color difference values were found to conform to a normal distribution (p > 0.05). The assumption of sphericity, another requirement of repeated-measures ANOVA, could not be evaluated because the measurement time had only two levels. The results of the three-way repeated-measures ANOVA are presented in Table 8. The combined effect of application sequences and measurement times on DeltaEab values was found to be statistically significant (F(1,36) = 349.2876, p < 0.001). However, the combined effect of surface finishing procedures, application sequences, and measurement times on DeltaE measurement values was not statistically significant (F(1,36) = 3.8399, p = 0.0578).
Bonferroni multiple comparison test results for the interaction effect of application sequence and measurement time are presented in Table 9. The color difference was within acceptable limits for the DeltaE1 in the first simulated tooth-brushing and then the coffee immersion group (1.92 ± 0.57); however, the results were significantly different for the other experimental groups, which were clinically unacceptable.

4. Discussion

This study evaluated the effects of surface finishing procedures and tooth-brushing on the surface roughness, surface gloss, and color stability of resin matrix ceramics before and after coffee immersion. The null hypothesis was rejected as the surface finishing procedure (glazing and mechanical polishing) and tooth-brushing before and after coffee immersion (application sequence and measurement time) affected the surface roughness, surface gloss, and color stability of the tested resin matrix ceramic.
Resin matrix ceramics integrate the beneficial characteristics of ceramics, like durability and color stability, with those of composite resins, including enhanced flexural strength and reduced abrasiveness [49]. In addition, due to their easy machinability and repairability, they have become very popular in dentistry. Several hybrid blocks have been available in the dental market [49,50]. Among these materials, Cerasmart is a high-density composite resin that contains 71% filler particles by weight [5]. The high resin content of Cerasmart makes it more sensitive to mechanical and chemical effects in the mouth than other ceramics. Therefore, Cerasmart was the material of choice in the present study to test the impact of coffee immersion and tooth-brushing in different sequences on the restoration surface.
The milling of CAD-CAM restorations leaves a rough surface that predisposes bacterial retention and plaque accumulation [51]. Therefore, these restorations require finishing and polishing before intraoral application [52]. Finishing and polishing procedures are applied to obtain smooth and glossy restoration surfaces. These surfaces prevent bacterial plaque accumulation and discoloration of the restoration, thereby retaining periodontal health and esthetic properties. Finishing and polishing should also result in a smooth, glossy surface that mimics the light reflection properties of natural teeth. Mechanical polishers or light-cured, resin-based surface varnishes achieve surface smoothing and polishing for the resin matrix ceramics. Multistep rubber polishers are used for mechanical polishing, and they smooth the material surface by smoothing out macro- and microscopic surface irregularities. Surface varnishes function as surface glazes by filling the microporosities on the material’s surface [21]. Several studies have compared the effectiveness of the finishing procedures in different combinations [26,40,53,54]. Yet, no consensus has been reached in the literature on the best option for reducing the surface roughness of hybrid material. Özer and Oğuz [52] reported that mechanical polishing procedures were more effective in reducing the surface roughness of the hybrid CAD-CAM material than glaze applications. This could be due to the mechanical polishing process, which removes the superficial, matrix-rich composite resin layers in the resin-infiltrated ceramic. Cerasmart specimens yield a chemically and physically stable surface. For the polishing process, it is essential to consider that the surface topography of the specimens is influenced by factors such as the polishing system used, the rotation speed of the device, the duration and amount of applied pressure, the presence or absence of water during finishing, and the material being polished [55,56,57]. On the other hand, Çakmak et al. [40] reported similar Ra values for glazed specimens with two different sealant materials and polished specimens of two hybrid ceramics, Lava Ultimate (3M ESPE, St. Paul, MN, USA) and Cerasmart (GC Corporation, Tokyo, Japan), before aging. Therefore, in the present study, one widely used resin matrix ceramic was used to investigate the effect of mechanical polishing and glazing on two aging procedures with different sequences. The glaze material and technique that the manufacturer recommended were used. It has been reported that the durable adhesion of a material, a thin polymer film layer, depends on the composition and surface topography of the restorative material [58].
The surface topography of dental materials is generally evaluated by surface roughness and gloss, which contribute to color restoration in long-term clinical usage. The most common method for calculating the average roughness value of dental materials is measuring the roughness values of all surfaces and taking the average of these measurements. The resulting value is the average surface roughness (Ra) [59]. The current literature has specified Ra = 0.2 µm as the threshold value of surface roughness for dental restorations [28,29]. The roughness of a material also impacts its gloss, as surface asperities scatter light rather than reflecting it. Gloss indicates the degree of specular (mirror-like) reflection from a surface. A highly polished black reference glass is assigned a gloss value of 100 GU, while a completely non-reflective surface is assigned a value of 0 GU [39]. According to the American Dental Association (ADA) recommendations, a polished dental restoration should have a surface gloss of 40 to 60 GU [60]. The thresholds for changes in surface glossiness are reported [47]. The human eye can perceive changes exceeding approximately 6.4 GU in glossiness; a difference more significant than 35.7 gloss units is not clinically acceptable [61]. In the present study, both mechanically polished and glazed specimens represented clinically acceptable Ra and GU values, while slightly higher GU values for mechanically polished specimens were noted. De Andrade et al. [61] reported an initial Ra smaller than 0.1 Ra and gloss of 55–75 GU for chairside CAD-CAM materials, including resin matrix ceramics, where they applied standard mechanical polishing to all materials. The lower Ra and higher GU values for resin matrix ceramics compared with our study may have resulted from differences in the polishing procedures.
Dental restorations are subjected to various intraoral conditions during function, affecting their longevity and performance. These influencing factors include masticatory loads, temperature fluctuations, chemical challenges such as pH variations, moisture, saliva exposure, abrasion and wear, and bacterial activity. The effects produced by one or more of these factors can cause degradations of marginal integrity, fracture resistance, and esthetics of dental restorations. Depending on their quantity and frequency, beverages consumed in daily life produce chemical and thermal changes in the oral environment. As a result, restorative materials’ surface topography and esthetic properties can be affected. Coffee is one of the most popular drinks worldwide, and its staining effect on intraoral dental restorations and natural teeth is known [62,63]. The coffee’s high staining effect might result from the synergistic effects of its chromogenic pigment content and the acidic nature of caffeinated beverages [20,64]. Polymers take up water among restorative materials and may be more prone to absorbing the pigments of staining solutions [17]. The polymer matrix absorbs tannins in resin matrix ceramics, water, and chromogenic pigments. At the same time, the pH of the coffee solution between 4 and 6 makes the resin matrix more prone to contamination [19]. The pH values of the coffee solution and the toothpaste slurry were measured, and the coffee solution exhibited a pH of 5.3, confirming its mildly acidic nature, while the toothpaste slurry had a pH of 8.2. Coffee comprises roughly 22 different types of acids, mostly high-molecular weight acids like acetic, citric, and malic acid. Therefore, staining molecules with low polarity are attached to the polymer matrix [65]. Similarly, studies advised patients with hybrid ceramic restorations to limit the consumption of tea and coffee to maintain esthetic longevity [11,19,49,50]. They recommended regular cleaning and professional maintenance to mitigate staining for patients with staining beverage habits. The findings of Suzuki et al. [23] may support these recommendations as they compared Ra, GU, and color of direct composite resins, CAD-CAM resin matrix, and a CAD-CAM ceramic block after 80,000 tooth-brushing strokes. They stated that resin matrix ceramics represented more stable surface characteristics than direct restorative composites, as the Ra of the ceramic was not affected by 8 years of tooth-brushing simulation. They also reported a slight decrease in GU, which may be attributed to stains from evaporating water or dentifrice slurry, rather than scratches caused by toothbrush abrasion, as evidenced by scanning electron microscopy images of the material [23]. In the study by Papathanasiou et al. [66] the influence of coffee immersion (30 days, 37 °C), thermocycling (5000 cycles, 5–55 °C), and photo-aging (150,000 kJ/m2) on the optical and surface properties of CAD-CAM composite materials was assessed. The materials investigated comprised Brilliant CRIOS (Coltene/Whaledent AG, Altstätten, Switzerland), Cerasmart (GC Corporation, Tokyo, Japan), Lava Ultimate (3M ESPE, St. Paul, MN, USA), Tetric CAD (Ivoclar Vivadent AG, Schaan, Liechtenstein), Shofu Block HC (Shofu Inc., Kyoto, Japan), and Grandio Blocs (VOCO GmbH, Cuxhaven, Germany). Following aging, color change (ΔEab) values ranged from 3.03 to 4.13 after coffee immersion, 1.33 to 2.55 after thermocycling, and 1.02 to 2.75 after photo-aging. No statistically significant differences in ΔEab were observed among materials after coffee immersion and thermocycling (p > 0.05). Gloss reduction was noted across all aging methods, ranging from −5.7 to −1.6 GU (coffee immersion), −2.3 to 0.1 GU (thermocycling), and −4.4 to 0.5 GU (photo-aging). Among the materials, Tetric CAD exhibited significantly lower gloss values and increased surface roughness following polishing. The findings underscore that aging procedures can adversely affect the esthetic and surface integrity of CAD-CAM composite materials, which may influence the long-term clinical performance of restorations [66]. Aydın et al. [67] investigated the impact of various whitening toothpastes with different active ingredients on the discoloration of resin-based CAD-CAM blocks [Cerasmart (GC Corporation, Tokyo, Japan), Shofu Block (Shofu Inc., Kyoto, Japan), and Grandio Blocs (VOCO GmbH, Cuxhaven, Germany)] following coffee immersion. The specimens were immersed in coffee for 14 days to simulate staining, after which whitening toothpastes containing activated charcoal, hydrogen peroxide, blue covarine pigment, and microparticles were applied. In all specimens, the color change exceeded the perceptibility threshold (ΔE00 > 0.8). There was no significant difference between the whitening toothpastes containing activated charcoal, hydrogen peroxide, blue covarine pigment, and microparticles in color improvement on resin-based CAD-CAM blocks (p > 0.05) [67]. In the study by Arocha et al. [65], the color stability of CAD-CAM (Lava Ultimate and Paradigm MZ100; 3M ESPE, St. Paul, MN, USA) and two conventionally laboratory-processed composites [Adoro (Ivoclar Vivadent AG, Schaan, Liechtenstein) and Premise Indirect (Kerr Corporation, Orange, CA, USA)] was evaluated after immersion in staining solutions (coffee, black tea, and red wine). Significant color differences were observed in all materials, with the highest discoloration occurring in red wine and the least in black tea. Laboratory-processed composites demonstrated higher color stability compared to CAD-CAM composites [65]. In the study by Arif et al. [68], the effect of cyclic immersion in hot and cold coffee on the color stainability and translucency of six CAD-CAM restorative materials was evaluated. The materials tested included zirconia-reinforced lithium silicate ceramic (Celtra Duo; Dentsply Sirona, York, PA, USA), lithium disilicate glass–ceramic (IPS e.max CAD; Ivoclar Vivadent AG, Schaan, Liechtenstein), polymerized resin nanoceramic (Lava Ultimate; 3M ESPE, St. Paul, MN, USA), integrated ceramic and acrylate polymer network material (Vita Enamic; VITA Zahnfabrik, Bad Sackingen, Germany), zirconia-reinforced lithium silicate (Vita Suprinity; VITA Zahnfabrik, Bad Sackingen, Germany), and zirconia (Vita YZ HT; VITA Zahnfabrik, Bad Sackingen, Germany). Each material was tested in two thicknesses: 0.7 mm for laminate veneer and 1.3 mm to 1.5 mm for complete crown application. The study found that coffee immersion significantly affected both color and translucency, with notable material-specific variations based on composition and thickness [68].
Tooth-brushing with toothpaste prevents dental caries and periodontal diseases by removing dental plaque [69]. Unfortunately, abrasives are a key component of toothpaste, and the brushing strokes can alter the surface characteristics of restorations. The abrasive properties of toothpastes are categorized based on their relative dentin abrasivity (RDA) indices, which should not exceed 250 [70,71]. The abrasive effects of tooth-brushing also vary depending on the type of restorative material. In the present study, considering the lower abrasion resistance of the resin matrix ceramic material compared with glassy or polycrystalline dental ceramics, a medium-bristle toothbrush and a toothpaste with whitening properties and an RDA value below 250 were selected for the brushing simulation.
In addition to plaque removal, tooth-brushing has also been linked to preventing the retention of external pigments and removing stains [34]. In the literature, the stain removal of oral hygiene procedures after coffee immersion was limitedly reported; however, the effect of the combined application of coffee immersion after tooth-brushing with different sequences has not been reported. In the present study, coffee immersion did not significantly affect Ra, while brushing significantly decreased the Ra value regardless of whether the surfaces were polished or glazed. This may be attributed to the smoothing effect of the toothbrushes and toothpaste. The combined effect of chemical softening from acidic beverage exposure and mechanical abrasion from tooth-brushing can be seen as a synergistic degradation process. Acidic conditions, such as those from coffee immersion, may lead to increased water absorption and plasticization of the resin matrix, weakening the bond between the filler particles and the matrix. As a result, the surface becomes more vulnerable to wear during brushing, leading to greater material loss and altered surface characteristics. The observed differences in surface roughness (Ra), particularly pronounced in specimens subjected to brushing after coffee immersion, likely stem from this synergistic interaction between acid-induced softening and mechanical abrasion. Glazed specimens appear to be more affected, possibly due to their resin-rich surface layer [72].
The microscopical surface abrasion caused by the tooth-brushing procedure may also have a stain removal impact, as revealed by ΔEab data. The first coffee-immersed group showed a 4.85 ΔEab value, indicating a discoloration above the acceptability threshold for dental restoration; then, this color difference decreased to 2.71 after brushing. In the second group, a 1.92 ΔEab color change was observed after brushing simulation, while coffee immersion caused a significant (4.46 ΔEab) color difference. These findings may be interpreted as coffee causing significant and unacceptable color changes in the resin matrix ceramics. However, this discoloration may be overcome with tooth-brushing, which can remove the staining content of the coffee. In the present study, brushing also has some effects on the gloss of the material; either before or after coffee immersion, the gloss values of the mechanically polished groups significantly increased. This may be attributed to the continuing micro-abrasive effects of toothbrush and toothpaste on the surface, polished using abrasives from coarse to finer. However, changes in gloss values did not exceed the clinically acceptable threshold value of 35.7 GU [61].
This study has some limitations. Most limitations are associated with the in vitro design, which did not fully mimic clinical conditions. The specimens with flat surfaces were differently affected by brushing compared with rounded and asymmetrical dental restorations. Furthermore, intraoral conditions include several factors, such as saliva containing proteins and enzymes, thermal changes, additional erosive and abrasive effects, ultraviolet irradiation, etc. This study did not account for the influence of underlying structures or the shade of the luting agent on aesthetic outcomes. The current study simulated approximately one year of clinical exposure. Although this duration provided useful short-term insight, it does not fully reflect long-term intraoral conditions. Therefore, extended aging protocols are recommended for future research. Further research under different conditions is recommended to gain a deeper understanding of the material’s color and surface topography behavior. Additionally, this study was limited to evaluating only one type of resin matrix ceramic using one brand and type of toothbrush as well as one type and level of brushing force. This material was intentionally selected to ensure standardization and to minimize the influence of confounding variables. Including multiple materials could have increased the generalizability of the findings; however, it would also have introduced additional variability into the experimental design. In this study, color difference values were assessed using the CIELab formula to enable comparison and interpretation alongside findings from previous research. However, it is important to note that the CIEDE2000 formula is considered to offer more accurate and clinically relevant assessments of color differences in terms of human perceptibility and acceptability [73]. Further research is warranted to assess the color stability of resin ceramics following coffee immersion and brushing using the CIEDE2000 formula, which may provide more precise and clinically relevant insights into perceptible and acceptable color differences.

5. Conclusions

Within the limitations of this study, the following conclusions can be drawn:
At baseline measurement, Ra and GU values of mechanically polished and glazed specimens were not significantly different and were found within clinically acceptable thresholds.
The aging procedure, including first coffee immersion followed by simulated tooth-brushing, caused a significant color change after coffee immersion and a decreased ΔEab following tooth-brushing. Coffee immersion did not affect surface roughness and surface gloss, while changes were observed after tooth-brushing.
When first tooth-brushing simulation was applied, surface roughness decreased, gloss increased, and color difference was not observed. The coffee immersion procedure that followed caused unacceptable color difference, but did not affect surface roughness and surface gloss.
Coffee immersion caused perceivable and clinically unacceptable color differences, and tooth-brushing positively affected the surface roughness and surface gloss in resin matrix ceramics. Therefore, tooth-brushing may be recommended to patients after coffee intake. These findings were obtained under controlled in vitro conditions using a standardized tooth-brushing simulation. The procedure involved medium-bristled toothbrushes applied under a 200 g vertical load at a 2 Hz frequency, with a linear back-and-forth motion of 20 mm stroke length and a brushing speed of 40 mm/s. A total of 10,000 brushing cycles were performed to simulate approximately one year of clinical use. During brushing, a low-abrasive whitening toothpaste slurry was employed. These parameters reflect realistic oral hygiene conditions and provide context to understanding how routine brushing practices can influence the surface integrity and esthetic properties of resin matrix ceramics over time.

Author Contributions

Conceptualization, G.S., B.T.B., S.K.N. and M.B.G.; methodology, G.S., B.T.B., S.K.N. and M.B.G.; software, E.K.Ö., E.B.A. and E.S.Ç.; validation, E.K.Ö., E.B.A. and E.S.Ç.; formal analysis, E.K.Ö., E.B.A. and E.S.Ç.; investigation, all authors; resources, all authors; data curation, all authors; writing—original draft preparation, all authors; writing—review and editing, B.T.B., S.K.N. and M.B.G.; visualization, all authors; supervision, M.B.G.; all authors; funding acquisition, all authors. All authors have read and agreed to the published version of the manuscript.

Funding

This research received no external funding. The APC was funded by the authors.

Institutional Review Board Statement

Not applicable.

Informed Consent Statement

Not applicable.

Data Availability Statement

The datasets used and analyzed during the present study are available from the corresponding author upon reasonable request.

Conflicts of Interest

The authors declare no conflicts of interest.

Abbreviations

The following abbreviations are used in this manuscript:
AFMAtomic force microscopy
CAD-CAMComputer-aided design–computer-aided manufacturing
CIEInternationale de l’Eclairage
GUGloss unit

References

  1. Stamenković, D.D.; Tango, R.N.; Todorović, A.; Karasan, D.; Sailer, I.; Paravina, R.D. Staining and aging-dependent changes in color of CAD-CAM materials. J. Prosthet. Dent. 2021, 126, 672–678. [Google Scholar] [CrossRef] [PubMed]
  2. Joda, T.; Brägger, U. Digital vs. conventional implant prosthetic workflows: A cost/time analysis. Clin. Oral Implant. Res. 2015, 26, 1430–1435. [Google Scholar] [CrossRef]
  3. Joda, T.; Zarone, F.; Ferrari, M. The complete digital workflow in fixed prosthodontics: A systematic review. BMC Oral Health 2017, 17, 1–9. [Google Scholar] [CrossRef]
  4. Kilinc, H.; Turgut, S. Optical behaviors of esthetic CAD-CAM restorations after different surface finishing and polishing procedures and UV aging: An in vitro study. J. Prosthet. Dent. 2018, 120, 107–113. [Google Scholar] [CrossRef] [PubMed]
  5. Awada, A.; Nathanson, D. Mechanical properties of resin-ceramic CAD/CAM restorative materials. J. Prosthet. Dent. 2015, 114, 587–593. [Google Scholar] [CrossRef] [PubMed]
  6. Argyrou, R.; Thompson, G.A.; Cho, S.-H.; Berzins, D.W. Edge chipping resistance and flexural strength of polymer infiltrated ceramic network and resin nanoceramic restorative materials. J. Prosthet. Dent. 2016, 116, 397–403. [Google Scholar] [CrossRef] [PubMed]
  7. Goujat, A.; Abouelleil, H.; Colon, P.; Jeannin, C.; Pradelle, N.; Seux, D.; Grosgogeat, B. Mechanical properties and internal fit of 4 CAD-CAM block materials. J. Prosthet. Dent. 2018, 119, 384–389. [Google Scholar] [CrossRef]
  8. Laborie, M.; Naveau, A.; Menard, A. CAD-CAM resin-ceramic material wear: A systematic review. J. Prosthet. Dent. 2024, 131, 812–818. [Google Scholar] [CrossRef]
  9. Barutçugil, Ç.; Bilgili, D.; Barutcigil, K.; Dündar, A.; Büyükkaplan, U.Ş.; Yilmaz, B. Discoloration and translucency changes of CAD-CAM materials after exposure to beverages. J. Prosthet. Dent. 2019, 122, 325–331. [Google Scholar] [CrossRef]
  10. Paolone, G.; Mandurino, M.; De Palma, F.; Mazzitelli, C.; Scotti, N.; Breschi, L.; Gherlone, E.; Cantatore, G.; Vichi, A. Color stability of polymer-based composite CAD/CAM blocks: A systematic review. Polymers 2023, 15, 464. [Google Scholar] [CrossRef]
  11. Al Ahmari, N.M.; Alahmari, M.A.; Al Moaleem, M.M.; Alshahrani, R.S.A.; Alqahtani, F.F.; Mohammed, W.S.; Al-Makramani, B.M.A.; Mehta, V.; Meto, A.; Meto, A. Physical, optical, and mechanical properties of ceramic materials after coffee immersion and evaluation of cleaning impact with different oral hygiene tools. Int. J. Environ. Res. Public Health 2022, 19, 15047. [Google Scholar] [CrossRef]
  12. Commission Internationale de l’Eclairage (CIE) Colorimetry, 4th ed.; CIE Technical Report 015; CIE Central Bureau: Vienna, Austria, 2018.
  13. Tabatabaian, F. Color in zirconia-based restorations and related factors: A literature review. J. Prosthodont. 2018, 27, 201–211. [Google Scholar] [CrossRef]
  14. Vadher, R.; Parmar, G.; Kanodia, S.; Chaudhary, A.; Kaur, M.; Savadhariya, T. Basics of color in dentistry: A review. IOSR J. Dent. Med. Sci. 2014, 13, 78–85. [Google Scholar] [CrossRef]
  15. Sonza, Q.N.; Della Bona, A.; Pecho, O.E.; Borba, M. Effect of substrate and cement on the final color of zirconia-based all-ceramic crowns. J. Esthet. Restor. Dent. 2021, 33, 891–898. [Google Scholar] [CrossRef]
  16. Paravina, R.D.; Ghinea, R.; Herrera, L.J.; Bona, A.D.; Igiel, C.; Linninger, M.; Sakai, M.; Takahashi, H.; Tashkandi, E.; Perez, M.d.M. Color difference thresholds in dentistry. J. Esthet. Restor. Dent. 2015, 27, S1–S9. [Google Scholar] [CrossRef] [PubMed]
  17. Sayed, M.; Abdelhalim, E.; Rabeae, H. Effect of Beverage consumption on color stability of CAD/CAM ceramics. Egypt. Dent. J. 2023, 69, 1233–1240. [Google Scholar] [CrossRef]
  18. Yerliyurt, K.; Sarıkaya, I. Color stability of hybrid ceramics exposed to beverages in different combinations. BMC Oral Health 2022, 22, 180. [Google Scholar] [CrossRef]
  19. Abdelhafez, M.H.; Hassan, M.R. Effect of commonly consumed beverages on color stability of hybrid ceramics: An in vitro study. Egypt. Dent. J 2024, 70, 2451–2459. [Google Scholar] [CrossRef]
  20. Alghazali, N.; Hakami, A.A.; AlAjlan, G.A.; Alotaibi, R.M.; Alabdulwahab, F.N.; AlQuraishi, L.A.; Abdalkadeer, H.; Al Moaleem, M.M. Influence of the Arabic-coffee on the overall color of glazed or polished porcelain veneers–in vitro study. Open Dent. J. 2019, 13, 364–370. [Google Scholar] [CrossRef]
  21. Gupta, R.; Parkash, H.; Shah, N.; Jain, V. A spectrophotometric evaluation of color changes of various tooth colored veneering materials after exposure to commonly consumed beverages. J. Indian Prosthodont. Soc. 2005, 5, 72–78. [Google Scholar] [CrossRef]
  22. Carey, C.M. Tooth whitening: What we now know. J. Evid. Based Dent. Pract. 2014, 14, 70–76. [Google Scholar] [CrossRef] [PubMed]
  23. Suzuki, M.; Miyano, Y.; Sato, F.; Shinkai, K. Surface properties of resin composites and CAD/CAM blocks after simulated toothbrushing. Oper. Dent. 2023, 48, 575–587. [Google Scholar] [CrossRef]
  24. Karatas, O.; Gul, P.; Akgul, N.; Celik, N.; Gundogdu, M.; Duymus, Z.; Seven, N. Effect of staining and bleaching on the microhardness, surface roughness and color of different composite resins. Dent. Med. Probl. 2021, 58, 369–376. [Google Scholar] [CrossRef] [PubMed]
  25. Heimer, S.; Schmidlin, P.R.; Stawarczyk, B. Effect of different cleaning methods of polyetheretherketone on surface roughness and surface free energy properties. J. Appl. Biomater. Funct. Mater. 2016, 14, e248–e255. [Google Scholar] [CrossRef]
  26. Tekçe, N.; Fidan, S.; Tuncer, S.; Kara, D.; Demirci, M. The effect of glazing and aging on the surface properties of CAD/CAM resin blocks. J. Adv. Prosthodont. 2018, 10, 50–57. [Google Scholar] [CrossRef]
  27. Kozmacs, C.; Hollmann, B.; Arnold, W.H.; Naumova, E.; Piwowarczyk, A. Polishing of monolithic zirconia crowns—Results of different dental practitioner groups. Dent. J. 2017, 5, 30. [Google Scholar] [CrossRef]
  28. Porojan, L.; Vasiliu, R.-D.; Bîrdeanu, M.-I.; Porojan, S.-D. Surface characterization and optical properties of reinforced dental glass-ceramics related to artificial aging. Molecules 2020, 25, 3407. [Google Scholar] [CrossRef]
  29. Alhassan, M.; Maawadh, A.; Labban, N.; Alnafaiy, S.M.; Alotaibi, H.N.; BinMahfooz, A.M. Effect of different surface treatments on the surface roughness and gloss of resin-modified CAD/CAM ceramics. Appl. Sci. 2022, 12, 11972. [Google Scholar] [CrossRef]
  30. Tsenova-Ilieva, I.; Karova, E. Application of atomic force microscopy in dental investigations. Int. J. Sci. Res. 2020, 9, 1319–1326. [Google Scholar] [CrossRef]
  31. Tholt, B.; Miranda-Júnior, W.G.; Prioli, R.; Thompson, J.; Oda, M. Surface roughness in ceramics with different finishing techniques using atomic force microscope and profilometer. Oper. Dent. 2006, 31, 442–449. [Google Scholar] [CrossRef]
  32. Labban, N.; Al Amri, M.D.; Alnafaiy, S.M.; Alhijji, S.M.; Alenizy, M.A.; Iskandar, M.; Feitosa, S. Influence of toothbrush abrasion and surface treatments on roughness and gloss of polymer-infiltrated ceramics. Polymers 2021, 13, 3694. [Google Scholar] [CrossRef] [PubMed]
  33. Awad, D.; Stawarczyk, B.; Liebermann, A.; Ilie, N. Translucency of esthetic dental restorative CAD/CAM materials and composite resins with respect to thickness and surface roughness. J. Prosthet. Dent. 2015, 113, 534–540. [Google Scholar] [CrossRef] [PubMed]
  34. Topçu, S.; Tekçe, N.; Kopuz, D.; Özcelik, E.Y.; Kolaylı, F.; Tuncer, S.; Demirci, M. Effect of surface roughness and biofilm formation on the color properties of resin-infiltrated ceramic and lithium disilicate glass-ceramic CAD-CAM materials. J. Prosthet. Dent. 2024, 131, 935.e1–935.e8. [Google Scholar] [CrossRef]
  35. Kursoglu, P.; Motro, P.F.K.; Kazazoglu, E. Correlation of surface texture with the stainability of ceramics. J. Prosthet. Dent. 2014, 112, 306–313. [Google Scholar] [CrossRef]
  36. Dalkiz, M.; Sipahi, C.; Beydemir, B. Effects of six surface treatment methods on the surface roughness of a low-fusing and an ultra low-fusing feldspathic ceramic material. J. Prosthodont. 2009, 18, 217–222. [Google Scholar] [CrossRef]
  37. Jung, M. Finishing and polishing of a hybrid composite and a heat-pressed glass ceramic. Oper. Dent. 2002, 27, 175–183. [Google Scholar]
  38. Kara, D.; Tekçe, N.; Fidan, S.; Demirci, M.; Tuncer, S.; Balcı, S. The effects of various polishing procedures on surface topography of CAD/CAM resin restoratives. J. Prosthodont. 2021, 30, 481–489. [Google Scholar] [CrossRef]
  39. Lawson, N.C.; Burgess, J.O. Gloss and stain resistance of ceramic-polymer CAD/CAM restorative blocks. J. Esthet. Restor. Dent. 2016, 28, S40–S45. [Google Scholar] [CrossRef]
  40. Çakmak, G.; Subaşı, M.G.; Yilmaz, B. Effect of thermocycling on the surface properties of resin-matrix CAD-CAM ceramics after different surface treatments. J. Mech. Behav. Biomed. Mater. 2021, 117, 104401. [Google Scholar] [CrossRef]
  41. Tekce, N.; Pala, K.; Tuncer, S.; Demirci, M. The effect of surface sealant application and accelerated aging on posterior restorative surfaces: An SEM and AFM study. Dent. Mater. J. 2017, 36, 182–189. [Google Scholar] [CrossRef]
  42. Aldosari, L.I.; Alshadidi, A.A.; Porwal, A.; Al Ahmari, N.M.; Al Moaleem, M.M.; Suhluli, A.M.; Shariff, M.; Shami, A.O. Surface roughness and color measurements of glazed or polished hybrid, feldspathic, and Zirconia CAD/CAM restorative materials after hot and cold coffee immersion. BMC Oral Health 2021, 21, 422. [Google Scholar] [CrossRef] [PubMed]
  43. Gönülol, N.; Yılmaz, F. The effects of finishing and polishing techniques on surface roughness and color stability of nanocomposites. J. Dent. 2012, 40, e64–e70. [Google Scholar] [CrossRef]
  44. Anazi, A.A.; Sultan, S. The effect of brushing on coffee stainability of ceramic crowns constructed from repeatedly processed lithium disilicate ceramic ingots: An in vitro study. Appl. Sci. 2023, 13, 7398. [Google Scholar] [CrossRef]
  45. Prasad, M.; Rajula, P.B.; Pl, R.; Rao, S.; Gayathri, K.; Mounika, V.; Kodali, M.V.R.M.; Kalaivani, V.; Soloman, G.; Nisha, N. In vitro analysis of enamel abrasion using a novel manual nano-bristle toothbrush: An atomic force microscopy study. Cureus 2024, 16, e75243. [Google Scholar] [CrossRef] [PubMed]
  46. ISO T. 14569-1; Dental Materials-Guidance on Testing of Wear Resistance. Part 1: Wear by Tooth Brushing. International Organization for Standardization: Geneva, Switzerland, 2007.
  47. Rocha, R.; Fagundes, T.; Caneppele, T.; Bresciani, E. Perceptibility and acceptability of surface gloss variations in dentistry. Oper. Dent. 2020, 45, 134–142. [Google Scholar] [CrossRef] [PubMed]
  48. Öztürk, E.K.; Nemli, S.K.; Bal, B.T.; Güngör, M.B. Evaluation of the optical and surface properties of monolithic CAD-CAM ceramics after simulated tooth-brushing. J. Prosthet. Dent. 2024, 132, 1325.e1–1325.e8. [Google Scholar] [CrossRef]
  49. Gendia, S.M.; ElGuindy, J.F.; Taymour, M.A. Shade Changes of Cemented Cerasmart Laminate Veneers After Exposure to Commonly Consumed Beverages (An In Vitro Study). Al-Azhar J. Dent. Sci. 2017, 20, 195–200. [Google Scholar] [CrossRef]
  50. Al Amri, M.D.; Labban, N.; Alhijji, S.; Alamri, H.; Iskandar, M.; Platt, J.A. In vitro evaluation of translucency and color stability of CAD/CAM polymer-infiltrated ceramic materials after accelerated aging. J. Prosthodont. 2021, 30, 318–328. [Google Scholar] [CrossRef]
  51. Bozoğulları, H.N.; Temizci, T. Evaluation of the color stability, stainability, and surface roughness of permanent composite-based milled and 3D printed CAD/CAM restorative materials after thermocycling. Appl. Sci. 2023, 13, 11895. [Google Scholar] [CrossRef]
  52. Ozer, N.; Oguz, E. Influence of different finishing-polishing procedures and thermocycle aging on the surface roughness of nano-ceramic hybrid CAD/CAM material. Niger. J. Clin. Pract. 2023, 26, 604–611. [Google Scholar] [CrossRef]
  53. Siddanna, G.D.; Valcanaia, A.J.; Fierro, P.H.; Neiva, G.F.; Fasbinder, D.J. Surface evaluation of resilient CAD/CAM ceramics after contouring and polishing. J. Esthet. Restor. Dent. 2021, 33, 750–763. [Google Scholar] [CrossRef] [PubMed]
  54. Mota, E.G.; Smidt, L.N.; Fracasso, L.M.; Burnett Jr, L.H.; Spohr, A.M. The effect of milling and postmilling procedures on the surface roughness of CAD/CAM materials. J. Esthet. Restor. Dent. 2017, 29, 450–458. [Google Scholar] [CrossRef]
  55. de Oliveira, A.L.B.M.; Domingos, P.A.D.S.; Palma-Dibb, R.G.; Garcia, P.P.N.S. Chemical and morphological features of nanofilled composite resin: Influence of finishing and polishing procedures and fluoride solutions. Microsc. Res. Tech. 2012, 75, 212–219. [Google Scholar] [CrossRef] [PubMed]
  56. Incesu, E.; Yanikoglu, N. Evaluation of the effect of different polishing systems on the surface roughness of dental ceramics. J. Prosthet. Dent. 2020, 124, 100–109. [Google Scholar] [CrossRef]
  57. Yap, A.U.; Sau, C.W.; Lye, K.W. Effects of finishing/polishing time on surface characteristics of tooth-coloured restoratives. J. Oral Rehabil. 1998, 25, 456–461. [Google Scholar] [CrossRef] [PubMed]
  58. Marshall, S.J.; Bayne, S.C.; Baier, R.; Tomsia, A.P.; Marshall, G.W. A review of adhesion science. Dent. Mater. 2010, 26, e11–e16. [Google Scholar] [CrossRef]
  59. Akan, E.; Colgecen, O.; Meşe, I.T.; Bağiş, B. Effects of different finishing procedures on surface roughness of hybrid CAD/CAM materials. J. Dent. Indones. 2021, 28, 185–191. [Google Scholar] [CrossRef]
  60. Association, A.D. Product Review: Polishing Systems; American Dental Association: Chicago, IL, USA, 2010. [Google Scholar]
  61. de Andrade, G.S.; Augusto, M.G.; Simões, B.V.; Pagani, C.; Saavedra, G.S.F.A.; Bresciani, E. Impact of simulated toothbrushing on surface properties of chairside CAD-CAM materials: An in vitro study. J. Prosthet. Dent. 2021, 125, 469.e1–469.e6. [Google Scholar] [CrossRef]
  62. Bagheri, R.; Burrow, M.; Tyas, M. Influence of food-simulating solutions and surface finish on susceptibility to staining of aesthetic restorative materials. J. Dent. 2005, 33, 389–398. [Google Scholar] [CrossRef]
  63. Aydın, N.; Karaoğlanoğlu, S.; Oktay, E.A.; Kılıçarslan, M.A. Investigating the color changes on resin-based CAD/CAM blocks. J. Esthet. Restor. Dent. 2020, 32, 251–256. [Google Scholar] [CrossRef]
  64. Yannikakis, S.A.; Zissis, A.J.; Polyzois, G.L.; Caroni, C. Color stability of provisional resin restorative materials. J. Prosthet. Dent. 1998, 80, 533–539. [Google Scholar] [CrossRef] [PubMed]
  65. Arocha, M.A.; Basilio, J.; Llopis, J.; Di Bella, E.; Roig, M.; Ardu, S.; Mayoral, J.R. Colour stainability of indirect CAD–CAM processed composites vs. conventionally laboratory processed composites after immersion in staining solutions. J. Dent. 2014, 42, 831–838. [Google Scholar] [CrossRef] [PubMed]
  66. Papathanasiou, I.; Zinelis, S.; Papavasiliou, G.; Kamposiora, P. Effect of aging on color, gloss and surface roughness of CAD/CAM composite materials. J. Dent. 2023, 130, 104423. [Google Scholar] [CrossRef]
  67. Aydın, N.; Karaoglanoglu, S.; Oktay, E.A. Investigation the effects of whitening toothpastes on color change of resin-based CAD/CAM blocks. J. Esthet. Restor. Dent. 2021, 33, 884–890. [Google Scholar] [CrossRef]
  68. Arif, R.; Yilmaz, B.; Johnston, W.M. In vitro color stainability and relative translucency of CAD-CAM restorative materials used for laminate veneers and complete crowns. J. Prosthet. Dent. 2019, 122, 160–166. [Google Scholar] [CrossRef] [PubMed]
  69. Pouranfar, F.L.; Sheridan, R.; Salmon, C.; Vandewalle, K.S. Effect of toothbrushing on surface color of ceramic-polymer materials: An in vitro study. J. Contemp. Dent. Pract. 2020, 21, 1054–1058. [Google Scholar]
  70. Roselino, L.D.M.R.; Tirapelli, C.; Pires-de-Souza, F.D.C.P. Randomized clinical study of alterations in the color and surface roughness of dental enamel brushed with whitening toothpaste. J. Esthet. Restor. Dent. 2018, 30, 383–389. [Google Scholar] [CrossRef]
  71. O’Neill, C.; Kreplak, L.; Rueggeberg, F.A.; Labrie, D.; Shimokawa, C.A.K.; Price, R.B. Effect of tooth brushing on gloss retention and surface roughness of five bulk-fill resin composites. J. Esthet. Restor. Dent. 2018, 30, 59–69. [Google Scholar] [CrossRef]
  72. Wendler, M.; Stenger, A.; Ripper, J.; Priewich, E.; Belli, R.; Lohbauer, U. Mechanical degradation of contemporary CAD/CAM resin composite materials after water ageing. Dent. Mater. 2021, 37, 1156–1167. [Google Scholar] [CrossRef]
  73. Sharma, G.; Wu, W.; Dalal, E. The CIEDE2000 color-difference formula: Implementation notes, supplementary test data, and mathematical observations. Col. Res. Appl. 2005, 30, 21–30. [Google Scholar] [CrossRef]
Figure 1. Flowchart of the study.
Coatings 15 00627 g001
Figure 2. Surface roughness and AFM analysis. (a) glazed; (b) mechanically polished; (c) glazed and tooth-brushing-applied; (d) mechanically polished and tooth-brushing-applied.
Coatings 15 00627 g002
Table 1. Descriptive statistics of the average surface roughness of the experimental groups.
Surface Finishing ProcedureApplication Sequence Measurement Time
BaselineFirstSecond
GlazedFirst coffee immersion, then simulated tooth-brushingMean ± SD0.32 ± 0.080.27 ± 0.070.18 ± 0.04
Median
(Q1–Q3)
0.32
(0.29–0.36)
0.27
(0.25–0.34)
0.16
(0.15–0.2)
Min–Max0.16–0.450.13–0.340.13–0.26
First simulated tooth-brushing, then coffee immersionMean ± SD0.24 ± 0.030.18 ± 0.030.17 ± 0.03
Median
(Q1–Q3)
0.24
(0.21–0.27)
0.17
(0.16–0.2)
0.17
(0.15–0.19)
Min–Max0.18–0.270.14–0.240.13–0.22
Mechanically polishedFirst coffee immersion, then simulated tooth-brushingMean ± SD0.27 ± 0.050.25 ± 0.060.15 ± 0.03
Median
(Q1–Q3)
0.26
(0.24–0.29)
0.24
(0.2–0.3)
0.14
(0.13–0.16)
Min–Max0.17–0.370.14–0.340.11–0.22
First simulated tooth-brushing, then coffee immersionMean ± SD0.25 ± 0.040.15 ± 0.030.15 ± 0.05
Median
(Q1–Q3)
0.24
(0.24–0.27)
0.17
(0.13–0.17)
0.13
(0.12–0.14)
Min–Max0.19–0.310.11–0.180.11–0.28
SD: Standard deviation, Q1: first quartile, Q3: third quartile, Min: minimum value, Max: maximum value.
Table 2. Repeated measures of the three-way ANOVA results of the surface roughness data.
SourceAdjusted Sum of SquaresDegree of FreedomAdjusted Mean SquaresF-Valuep-Value
Surface finishing (SF)0.015810.01584.78270.0353
Application sequence (AS)0.067410.067420.3873<0.001
SF × AS0.002410.00240.72740.3994
Measurement time (MT)0.220720.110365.6467<0.001
SF × MT0.000320.00020.09040.9137
AS × MT0.038020.019011.3124<0.001
SF × AS × MT0.008420.00422.48490.0905
Between-subjects0.1189360.0033--
Error0.1210720.0017--
Total0.5929119---
S = 0.0412, R2 = 79.59%, Adj-R2 = 66.27%.
Table 3. Bonferroni multiple comparison test results of surface roughness data for the interaction effect of application sequence and measurement time.
Measurement TimeApplication Sequence
First Coffee Immersion, Then Simulated Tooth-BrushingFirst Simulated Tooth-Brushing, Then Coffee Immersion
BaselineMean ± SD0.29 ± 0.07 a,A0.24 ± 0.04 a,A
FirstMean ± SD0.26 ± 0.06 a,A0.17 ± 0.03 b,B
SecondMean ± SD0.16 ± 0.04 b,A0.16 ± 0.04 b,A
SD: Standard deviation. The same lowercase letters indicate that the average surface roughness values were not statistically significant among the measurement times within the same application sequence (p > 0.05). The same uppercase letters indicate that the average surface roughness values were not statistically significant between the application sequences within the same measurement time (p > 0.05).
Table 4. Descriptive statistics of the surface gloss data of the experimental groups.
Surface FinishingApplication Sequence Measurement Time
BaselineFirstSecond
GlazedFirst coffee immersion then simulated tooth-brushingMean ± SD54 ± 1064.3 ± 9.164.8 ± 10.0
Median (Q1–Q3)53.1
(44.6–57.5)
65.4
(56.3–72.1)
67.7
(55.1–73.9)
Min–Max43.9–71.646.9–75.548.8–75.7
First simulated tooth-brushing then coffee immersionMean ± SD57.7 ± 7.263.5 ± 9.766.4 ± 8.8
Median (Q1–Q3)57.5
(52.8–62.3)
63.7
(57.4–70.6)
67.3
(63.4–73.8)
Min–Max47.3–69.847.7–76.546.4–74.9
Mechanically polishedFirst coffee immersion then simulated tooth-brushingMean ± SD56.1 ± 10.259.0 ± 8.173.6 ± 7.0
Median (Q1–Q3)55.5
(47.8–62.3)
61.6
(51.2–64.4)
73.0
(70.1–80.4)
Min–Max41.6–71.946.9–70.858.8–81.9
First simulated tooth-brushing then coffee immersionMean ± SD60.1 ± 5.874.7 ± 6.171.2 ± 5.9
Median (Q1–Q3)59.8
(56.8–64.1)
75.9
(72.7–79.6)
71.7
(65–76.6)
Min–Max51.4–68.463.2–81.760.9–77.8
SD: Standard deviation, Q1: first quartile, Q3: third quartile, Min: minimum value, Max: maximum value.
Table 5. Repeated measures of the three-way ANOVA results of the surface gloss data.
SourceAdjusted Sum of SquaresDegree of FreedomAdjusted
Mean Squares
F-Valuep-Value
Surface finishing (SF)1483.2053483.20533.52250.0687
Application sequence (AS)1391.6853391.68532.85530.0997
SF × AS1136.1070136.10700.99220.3259
Measurement time (MT)23060.85651530.428342.923<0.001
SF × MT2120.860260.43011.69480.1909
S × MT2314.1002157.05014.40460.0157
SF × AS × MT2581.2205290.61028.1505<0.001
Between-subjects364938.3873137.1774--
Error722567.202735.6556--
Total11912,593.625---
S = 5.9712, R2 = 79.62%, Adj-R2 = 66.31%.
Table 6. Bonferroni multiple comparison test results of surface gloss data for the interaction effect of application sequence and measurement time.
Surface Finishing ProcedureApplication Sequence Measurement Time
BaselineFirstSecond
GlazedFirst coffee immersion, then simulated tooth-brushingMean ± SD54 ± 10 a,A,164.3 ± 9.1 ab,A,164.8 ± 10 b,A,1
First simulated tooth-brushing, then coffee immersionMean ± SD57.7 ± 7.2 a,A,163.5 ± 9.7 a,A,166.4 ± 8.8 a,A,1
Mechanically polishedFirst coffee immersion, then simulated tooth-brushingMean ± SD56.1 ± 10.2 a,A,159 ± 8.1 a,A,173.6 ± 7 b,A,1
First simulated tooth-brushing, then coffee immersionMean ± SD60.1 ± 5.8 a,A,174.7 ± 6.1 b,B,171.2 ± 5.9 b,A,1
SD: Standard deviation. The same lowercase letters indicate that the surface gloss values were not statistically significant among the measurement times within the same surface finishing procedure and application sequence groups (p > 0.05). The same uppercase letters indicate that the surface gloss values were not statistically significant between the application sequences within the same surface finishing procedure and measurement time groups (p > 0.05). The same numbers indicate that the surface gloss values were not statistically significant between the surface finishing procedures within the same application sequence and measurement time groups (p > 0.05).
Table 7. Descriptive statistics of the color difference data of the experimental groups.
Surface Finishing ProceduresApplication Sequence Measurement Time
DeltaE1
(Baseline-First Measurement)
DeltaE2
(Baseline-Second Measurement)
GlazedFirst coffee immersion, then simulated tooth-brushingMean ± SD4.75 ± 1.122.29 ± 0.67
Median (Q1–Q3)5.14
(4.71–5.34)
2.77
(2.49–3.16)
Min–Max1.91–5.642.02–4.41
First simulated tooth-brushing, then coffee immersionMean ± SD1.89 ± 0.694.26 ± 0.93
Median (Q1–Q3)1.93
(1.36–2.18)
4.38
(3.83–5.1)
Min–Max0.94–3.302.32–5.22
Mechanically polishedFirst coffee immersion, then simulated tooth-brushingMean ± SD4.94 ± 0.802.49 ± 0.54
Median (Q1–Q3)4.92
(4.23–5.78)
2.4
(2.27–2.94)
Min–Max3.8–6.191.61–3.35
First simulated tooth-brushing, then coffee immersionMean ± SD1.94 ± 0.474.66 ± 0.28
Median (Q1–Q3)1.87
(1.75–2.08)
4.66
(4.43–4.85)
Min–Max1.1–2.754.29–5.16
SD: Standard deviation, Q1: first quartile, Q3: third quartile, Min: minimum value, Max: maximum value.
Table 8. Repeated measures of the three-way ANOVA results of the color difference data.
SourceAdjusted Sum of SquaresDegree of FreedomAdjusted Mean SquaresF-Valuep-Value
Surface finishing (SF)0.045510.04550.06000.8079
Application sequence (AS)6.942416.94249.15440.0046
SF × AS0.620410.62040.81810.3718
Measurement time (MT)0.850410.85042.71130.1083
SF × MT0.092810.09280.29570.5899
AS × MT109.54681109.5468349.2876<0.001
SF × AS × MT1.204311.20433.83990.0578
Between-subjects27.3010360.7584--
Error11.2907360.3136--
Total157.894379---
S = 0.56, R2 = 92.85%, Adj-R2 = 84.31%.
Table 9. Bonferroni multiple comparison test results of color difference data for the interaction effect of application sequences and measurement times.
Measurement TimeApplication Sequence
First Coffee Immersion Then Simulated Tooth-BrushingFirst Simulated Tooth-Brushing Then Coffee Immersion
DeltaE1
(baseline–first measurement)
Mean ± SD4.85 ± 0.95 a,A1.92 ± 0.57 a,B
DeltaE2
(baseline–second measurement)
Mean ± SD2.71 ± 0.64 b,A4.46 ± 0.7 b,B
SD: Standard deviation. The same lowercase letters indicate that the color difference values were not statistically significant between the measurement times (DeltaE1 and DeltaE2) within the same application sequence (p > 0.05). The same uppercase letters indicate that the color difference values were not statistically significant between the application sequences within the same measurement time (p > 0.05).
Disclaimer/Publisher’s Note: The statements, opinions and data contained in all publications are solely those of the individual author(s) and contributor(s) and not of MDPI and/or the editor(s). MDPI and/or the editor(s) disclaim responsibility for any injury to people or property resulting from any ideas, methods, instructions or products referred to in the content.

