1. Introduction
The use of lasers as a tool for altering the physical properties of surfaces on various materials has proven to be highly convenient for numerous applications, particularly in fields related to surface functionality. This technology opens up entirely new possibilities in surface engineering [
1,
2,
3,
4,
5,
6,
7,
8,
9,
10], with a wide range of applications in photonics [
11], tribology [
12], wettability [
13], heat transfer [
14,
15], and biomedicine [
16,
17]. The extensive use of laser applications is largely due to the proliferation of advanced materials and components.
Characterizing surface roughness is a critical aspect in the industrial sector, as it directly impacts the quality and functionality of manufactured products. Surface roughness refers to the irregularities and variations present on a surface, which can affect properties such as friction, wear, adhesion, and esthetic appearance [
18].
Laser engraving is widely recognized as a surface modification technique, characterized by the localized removal or alteration of materials confined to the outermost layer of a substrate. Unlike laser cutting, which penetrates through the material, laser engraving modifies only the surface morphology and visual attributes without affecting the internal structure or mechanical integrity. This distinction is critical when selecting processing methods for applications where structural preservation is essential. The scientific literature supports this classification across various materials. For instance, ref. [
19] categorized laser engraving among surface modification methods aimed at enhancing surface properties such as roughness and wear resistance in metals. In the context of wood, ref. [
20] demonstrates that laser interaction primarily alters optical and surface characteristics without deep penetration, while [
21] explicitly defines laser engraving as a shallow material removal process. Furthermore, ref. [
22] confirms that laser engraving modifies the surface chemistry and morphology of wood without compromising its bulk structure. These findings collectively reinforce the understanding of laser engraving as a precise, non-invasive surface engineering method with broad applicability in modern material processing.
Surface roughness is a key factor influencing the performance of coatings, adhesion, and functional treatments applied to laser-engraved wood. During laser engraving, the beam modifies the wood’s surface via localized ablation, creating micro-scale textures that increase the effective surface area. This enhanced roughness promotes stronger mechanical interlocking and better adhesion of subsequent coatings, such as varnishes, paints, or hydrophobic layers. Moreover, the controlled alteration of surface morphology can be tailored to achieve specific functional outcomes, such as improved tactile properties, optical effects, or moisture resistance. In wood processing industries, monitoring and optimizing surface roughness after laser engraving are essential to ensure consistent quality and performance in downstream applications.
While this paper focuses broadly on materials, it includes insights applicable to wood and other organic substrates, particularly in the context of surface preparation and bonding [
23].
However, the electrical and mechanical properties of laser-engraved surfaces have been investigated using very few ISO roughness parameters [
24,
25,
26,
27,
28,
29,
30,
31,
32,
33,
34,
35,
36,
37,
38,
39], often resulting in poor comparisons. The ISO standardization is referenced because roughness-measuring instruments evaluate these parameters by default. Before developing a new algorithm for the measurement, this research investigated whether any of the ISO standard parameters were sufficiently suitable for characterizing bamboo engraving.
Most of the existing literature [
40,
41,
42,
43,
44] focuses on the 3D topography and S parameters, which are beyond the scope of this paper. For 2D roughness measurements, most existing work involves high-resolution systems (optical roughness meters, scanning electron microscopy, etc.) that are precise but not always recommended for wood or any other organic materials [
43,
44]. Additionally, optical systems must contend with changes in reflectivity on bamboo surfaces.
In this paper, we propose a 2D roughness parameter that is easy to measure and serves as a reliable indicator of the quality of engraved bamboo surfaces. We utilized all available parameters with calibrated equipment to compare the results and identify the most relevant one for characterizing the final texture with sufficient resolution for bamboo specimens. Unlike existing studies, which were limited by testing materials and laser conditions, we propose a measurement parameter that can be evaluated and compared across different materials and engraving lasers, not just under specific conditions. The selection of suitable parameters is discussed. This parameter can be used as an indicator to characterize the behavior of the sample for its intended application.
The main conclusion of this paper is the identification of a specific pair of R and P parameters that can be measured on the sample to determine if the engraved surface meets the intended quality with just a single measurement. We present a procedure for characterizing laser engraving from the perspective of the intended application, rather than focusing on the laser itself.
2. Materials and Methods
2.1. Equipments
A commercial pulsed laser engraver, depicted in
Figure 1, with a wavelength of 450 nm and a power of 5.5 W (Feungsake, Beijing, China) was used in this study. It features an LD diode (>3a) operating at 12 V DC, TTL with two frequency pins: 0 V on and 5 V off, and an optimal focal length of 2.5–5 cm.
The engraved material shown in
Figure 2 is made of bamboo, with dimensions of 34.0 × 23.7 cm and a thickness of 2.0 cm.
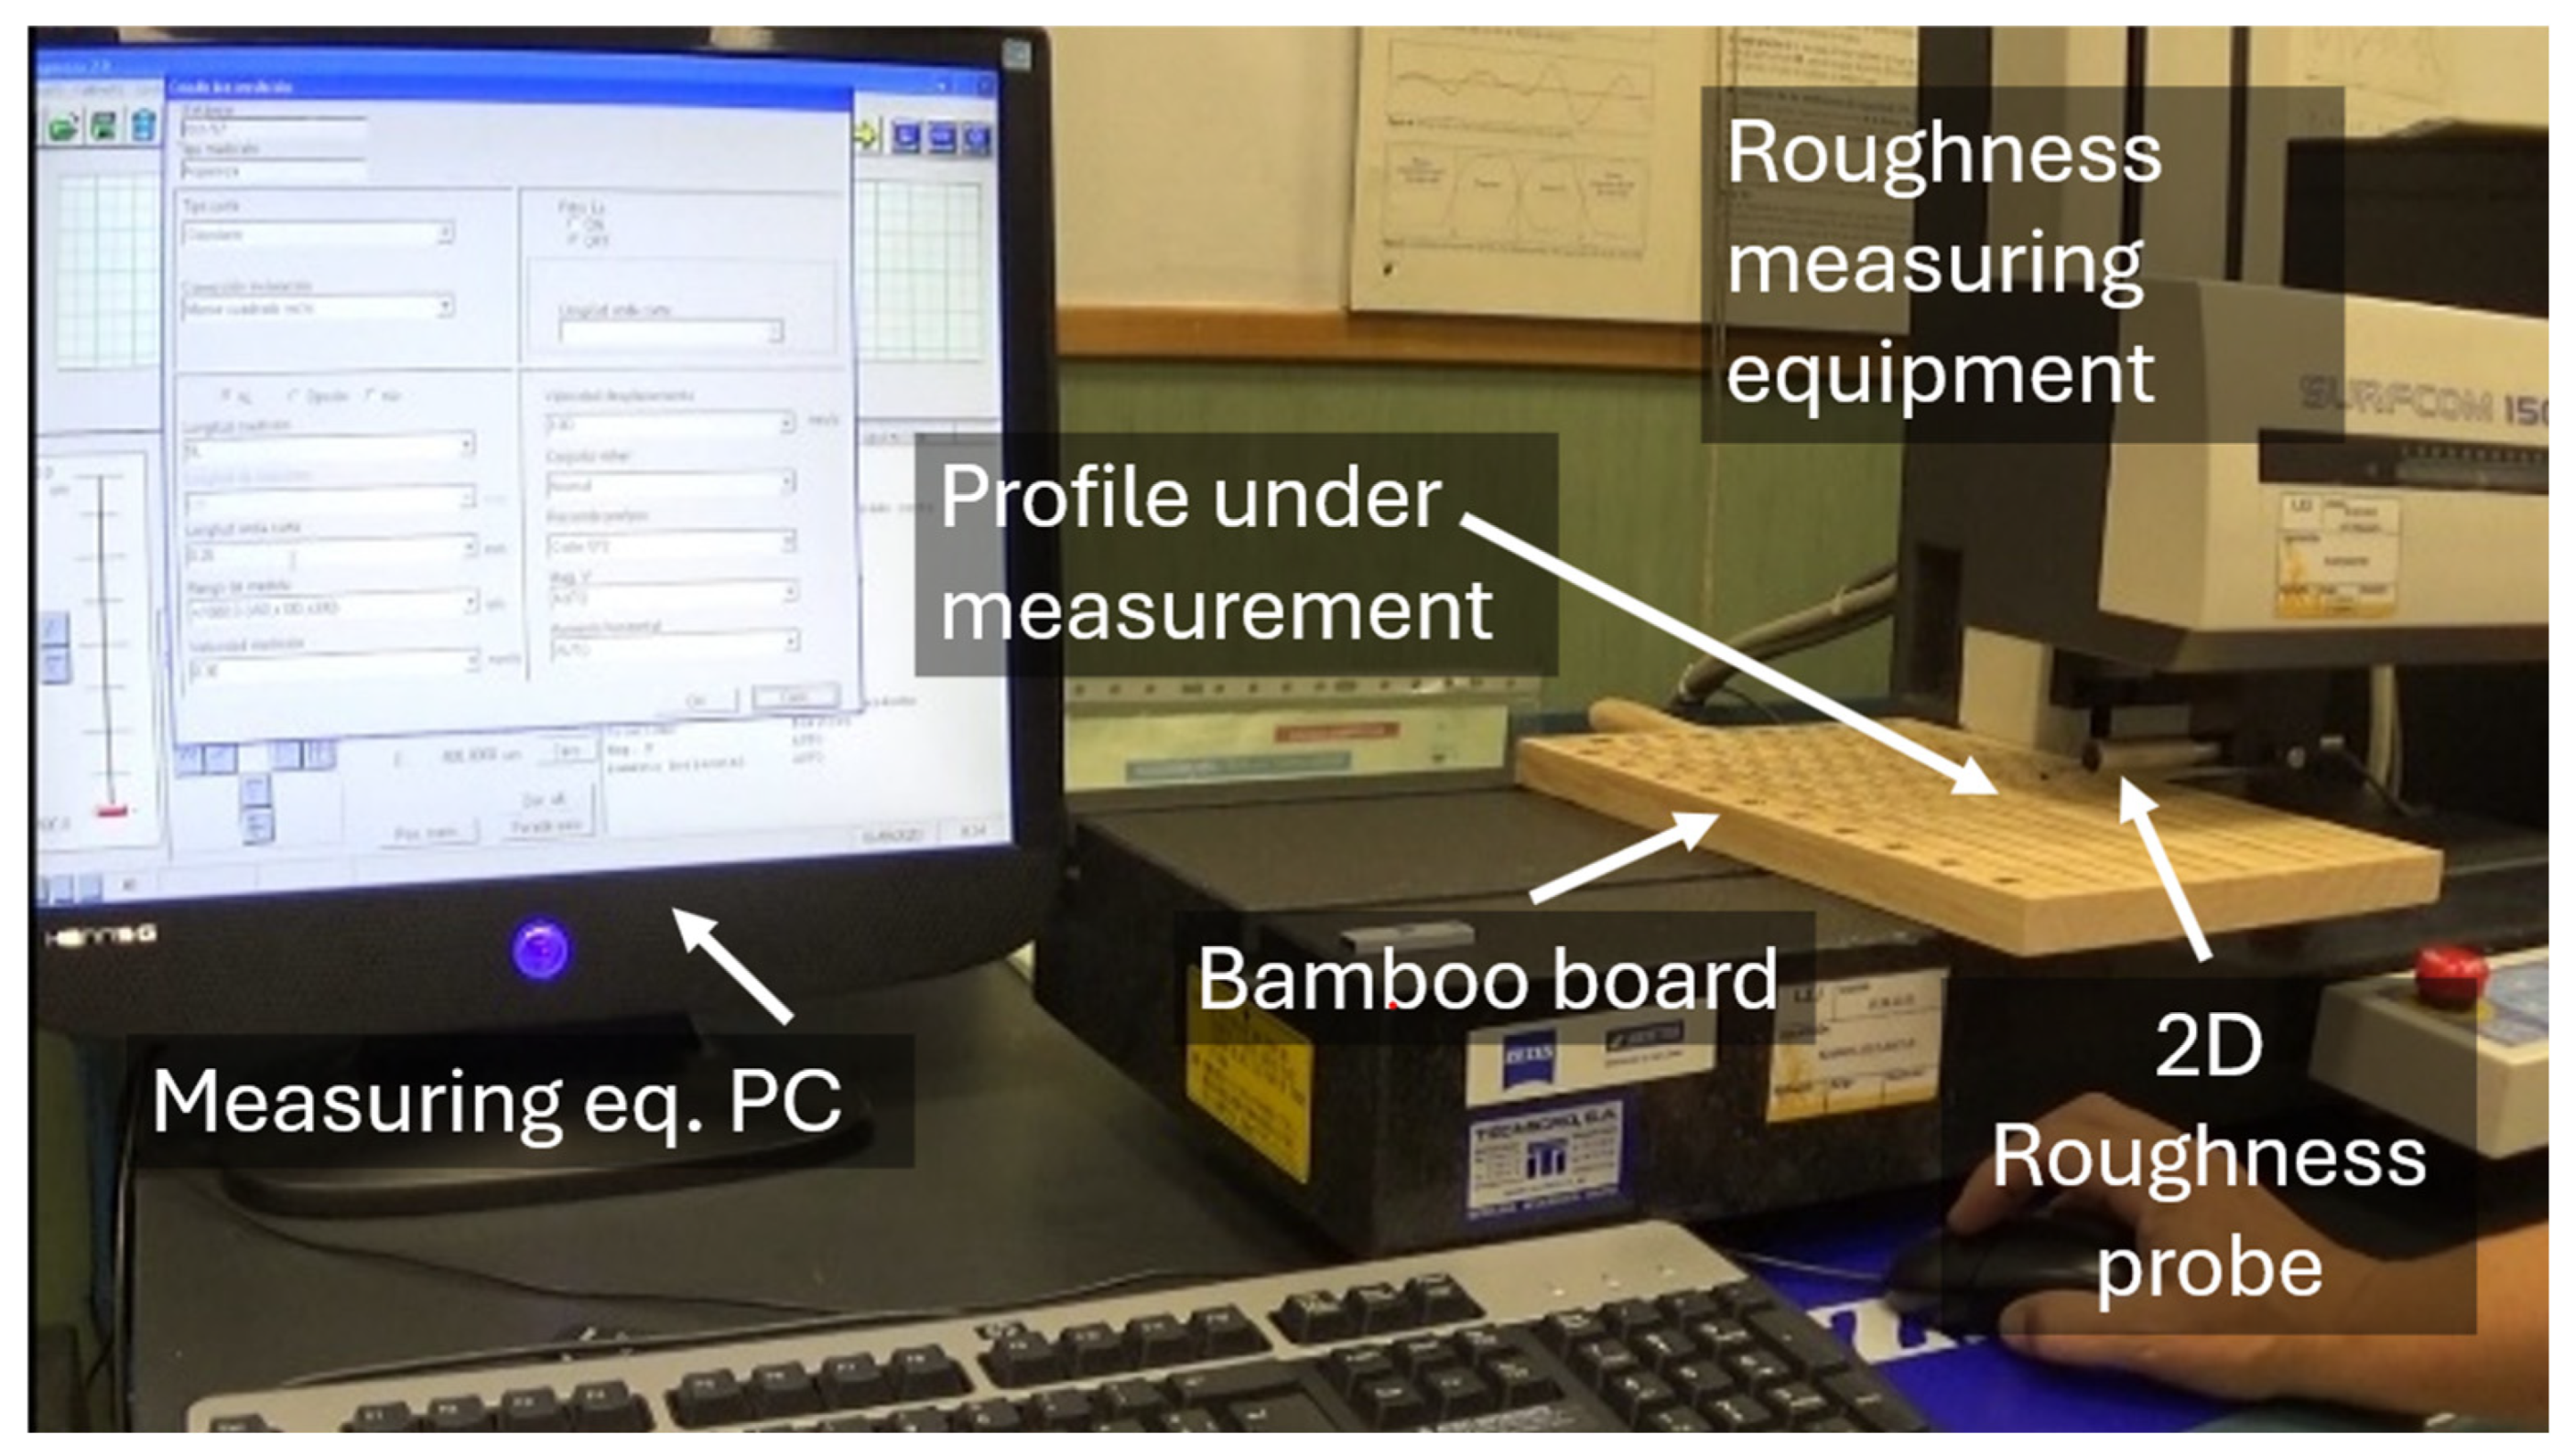
A Surfcom 1500 from Carl Zeiss IMT Iberia (Zeiss, Maple Grove, MN, USA) (
Figure 3), was used for surface roughness measurement, providing all ISO roughness parameters under dimensional metrology standardizations [
12,
15,
16,
17,
31]. It was calibrated and verified periodically following ISO recommendations [
32], although for this type of study, mandatory calibration may not be required as the instrument passed interim checks.
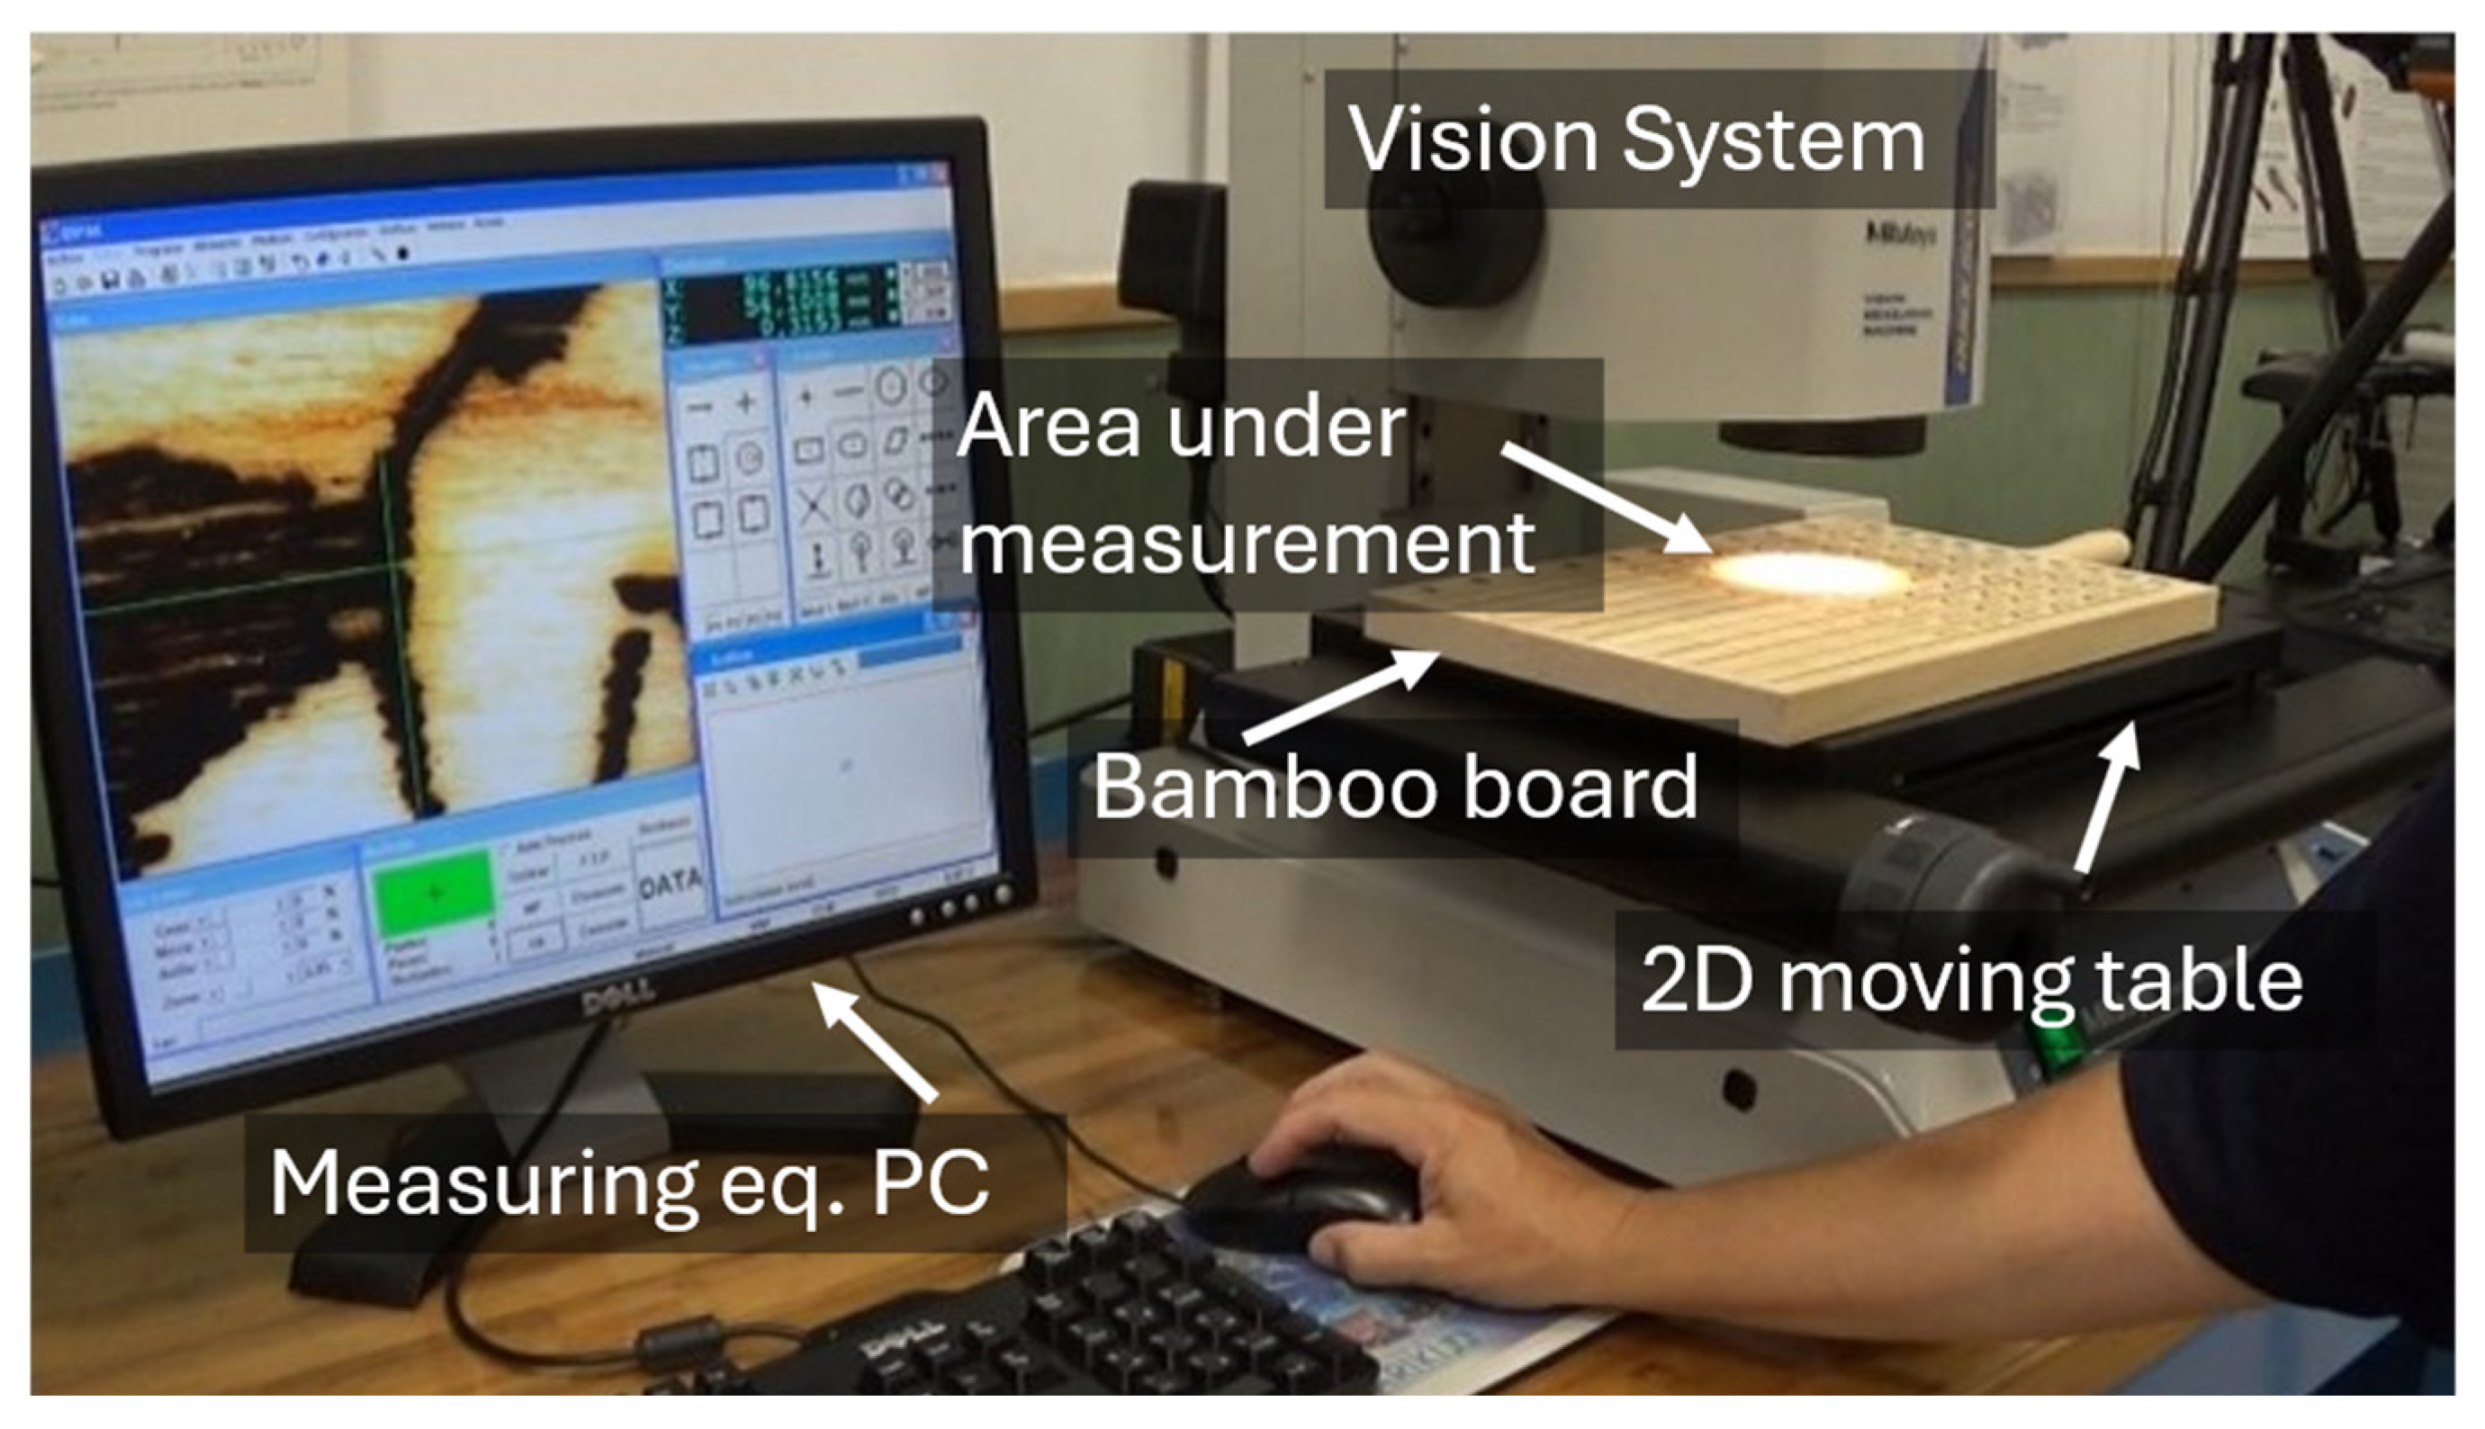
A contact system was selected to ensure the accurate measurement of the mechanical surface of the bamboo, thereby avoiding precision loss due to optical measurements on surfaces with varying colors. The vision machine (Mitutoyo Corporation, Metrología Sariki, Elgoibar, Guipúzcoa, Spain), shown in
Figure 4, was utilized to compare the visual aspects of the engraved patterns.
The calibrated vision machine, at the time of measurement, achieved an uncertainty of 5 nm (k = 1) with 500 degrees of freedom (as it will be calculated in section of results)
The vision machine was used solely for a qualitative assessment of the finish of the samples; neither R nor P parameters were measured, as it is not intended for such measurements. The vision machine (
Figure 4) provided the detailed photos shown in the following sections.
2.2. Preliminary Preparation
2.2.1. Engraving Laser Preparation
The laser head was adjusted to investigate all available parameters for the desired engraving operation. It also characterized the energy distribution on its spot for the selected engraving speeds. The result was a Gaussian spot, which is typically in the form of TEM00 and is stable over time. This ensured a homogeneous distribution of energy from the laser to engrave the bamboo surface. Therefore, any change in the pulse on the surface may be due to material reflectivity, roughness texture, dust, slope, or other factors.
It is recommended to recheck the energy distribution on the laser spot when working under low output power. If an energy-distribution-measuring camera is available, the test should be run periodically. If not, it is sufficient to engrave a test part using the same procedure periodically and compare the test marks.
The adjustable parameters in this research included the speed of the traveling head, which varied from 1000 mm/min to 1900 mm/min in increments of 100 mm/min, and the power, which ranged from 10% to 100% of 5.5 W in increments of 10% for the aforementioned speeds. The acceleration was kept constant at 500 mm/s2.
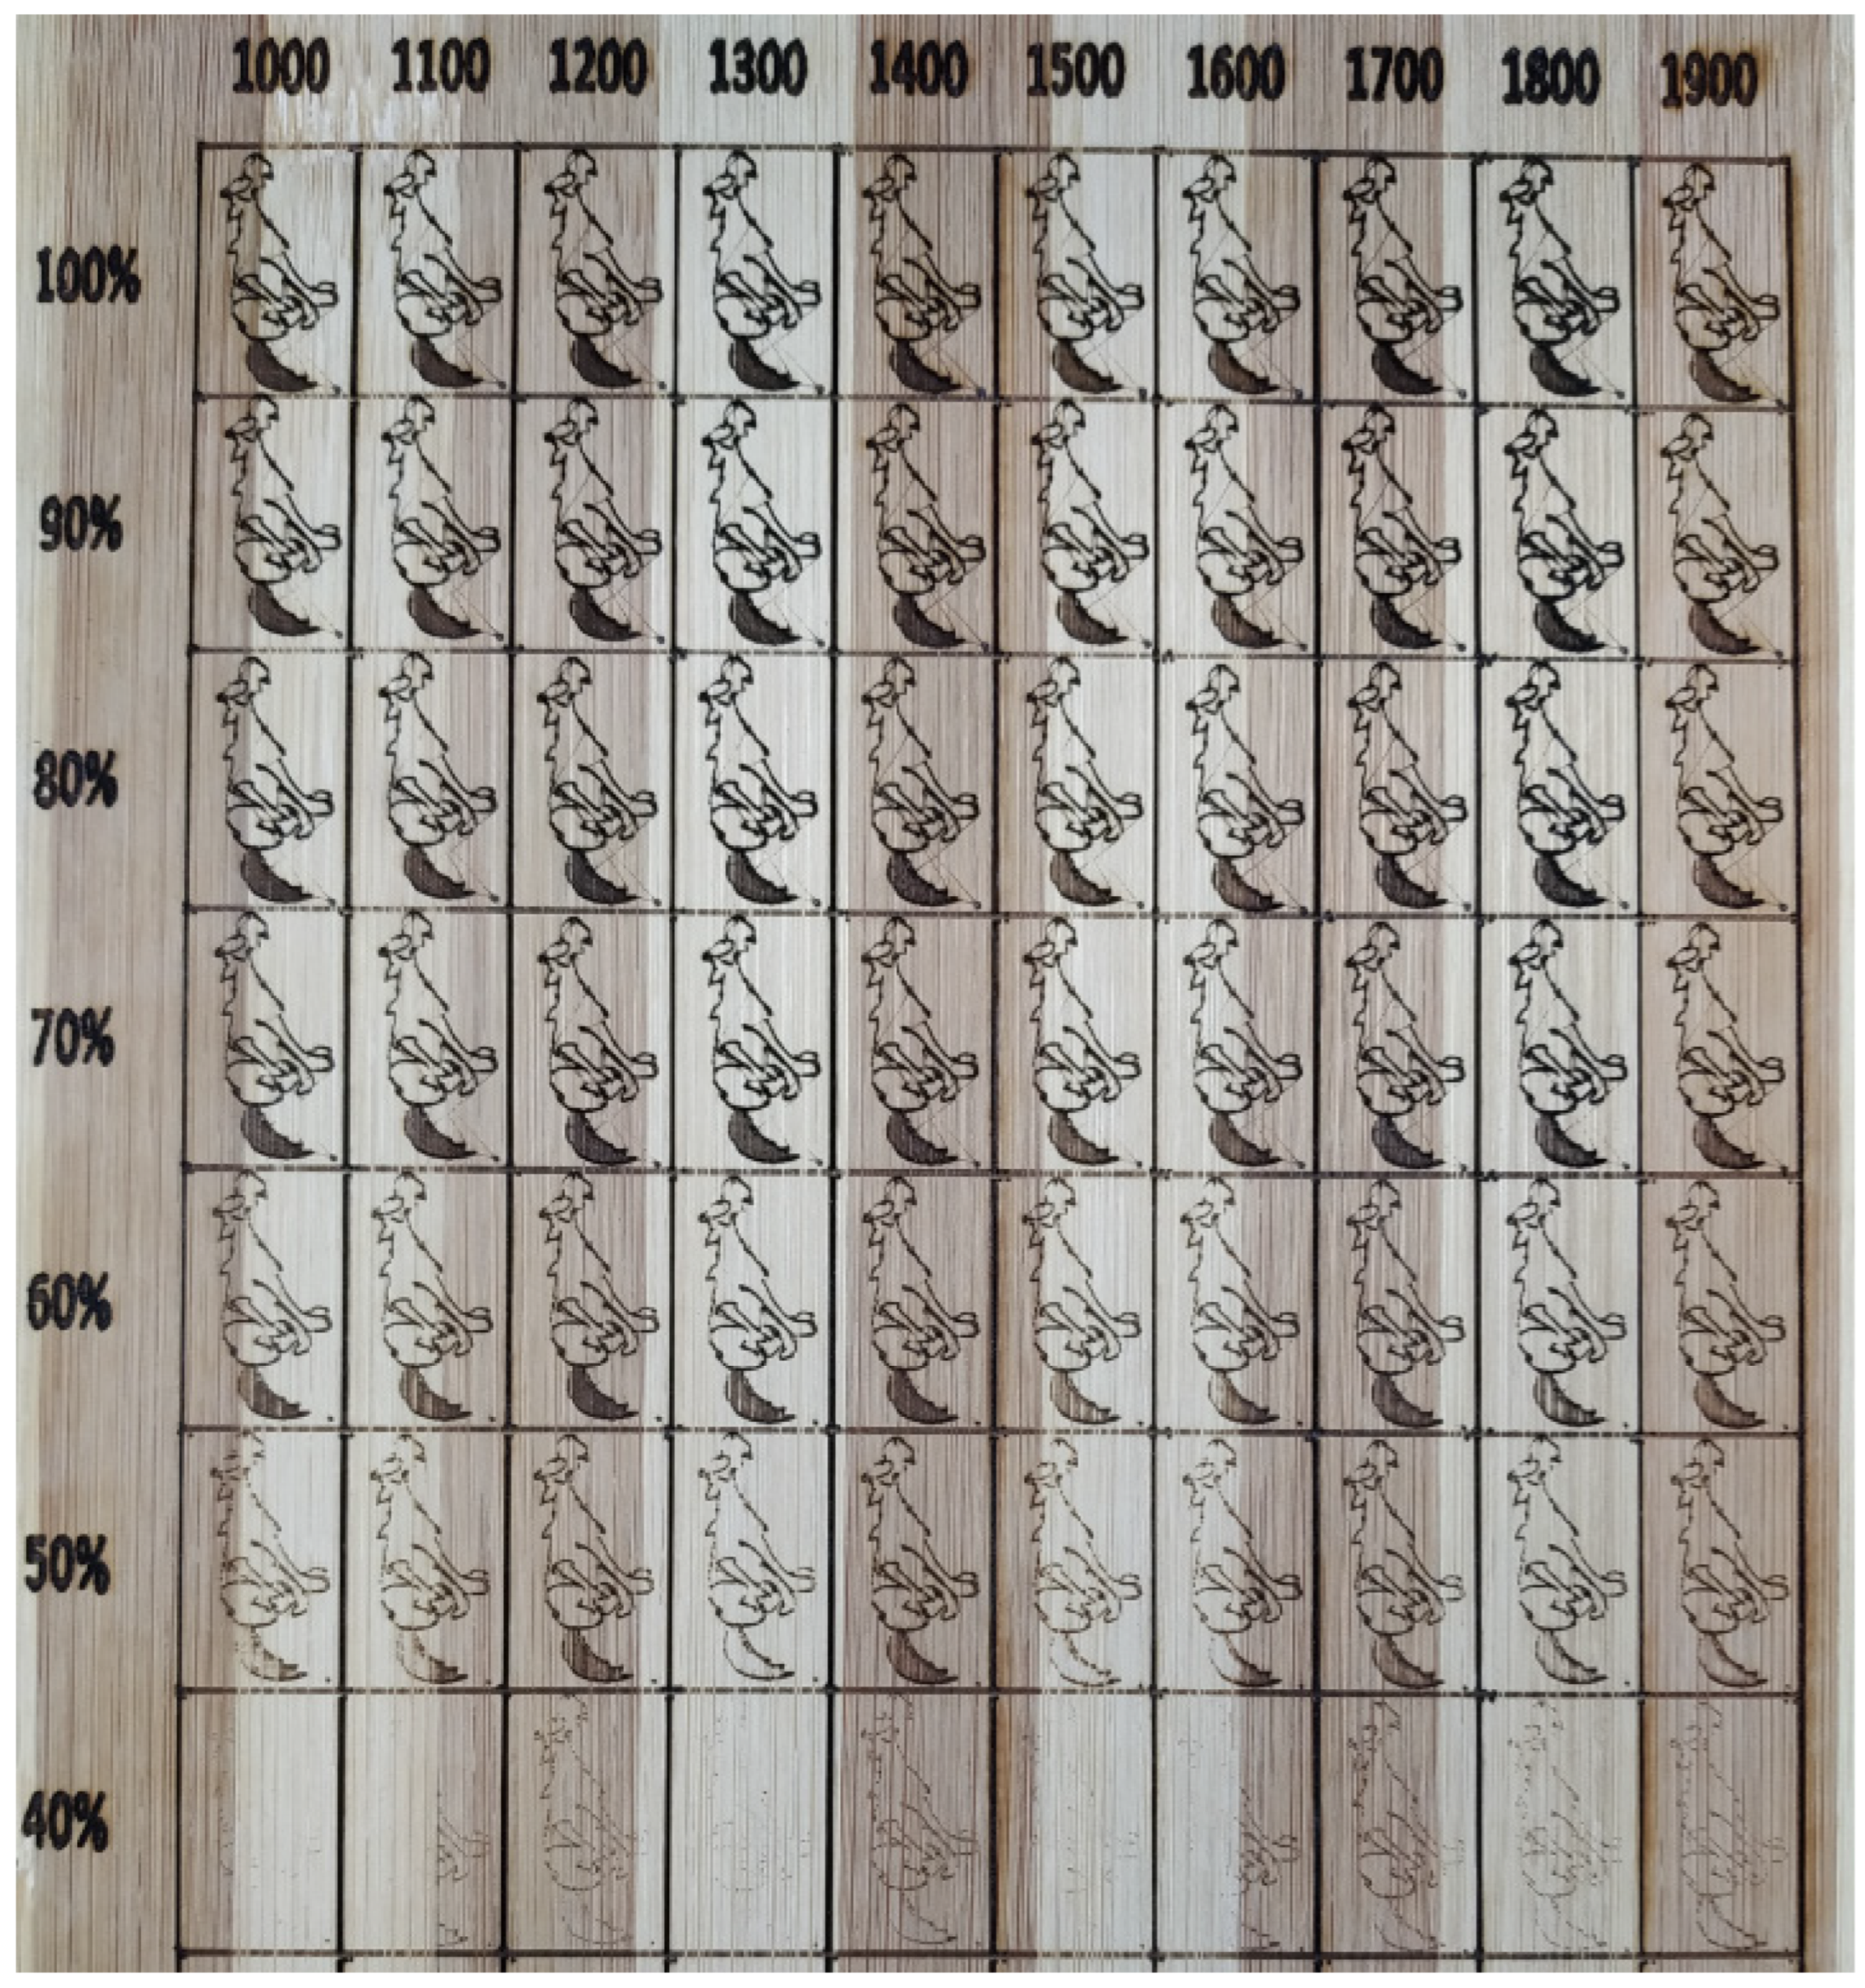
The combination of 10 speed settings and 10 power setups resulted in 100 different laser cut conditions on the bamboo specimen. Each of the 100 testing conditions was examined 10 times, making a total of 1000 laser cuts. However, as seen in
Figure 2, patterns cut with low power and high speed are faint and therefore not considered. This reduced the total number of laser cuts to 600. In
Figure 5 it is shown how the engraving procedure took place.
2.2.2. Sample Part Preparation: Bamboo Table
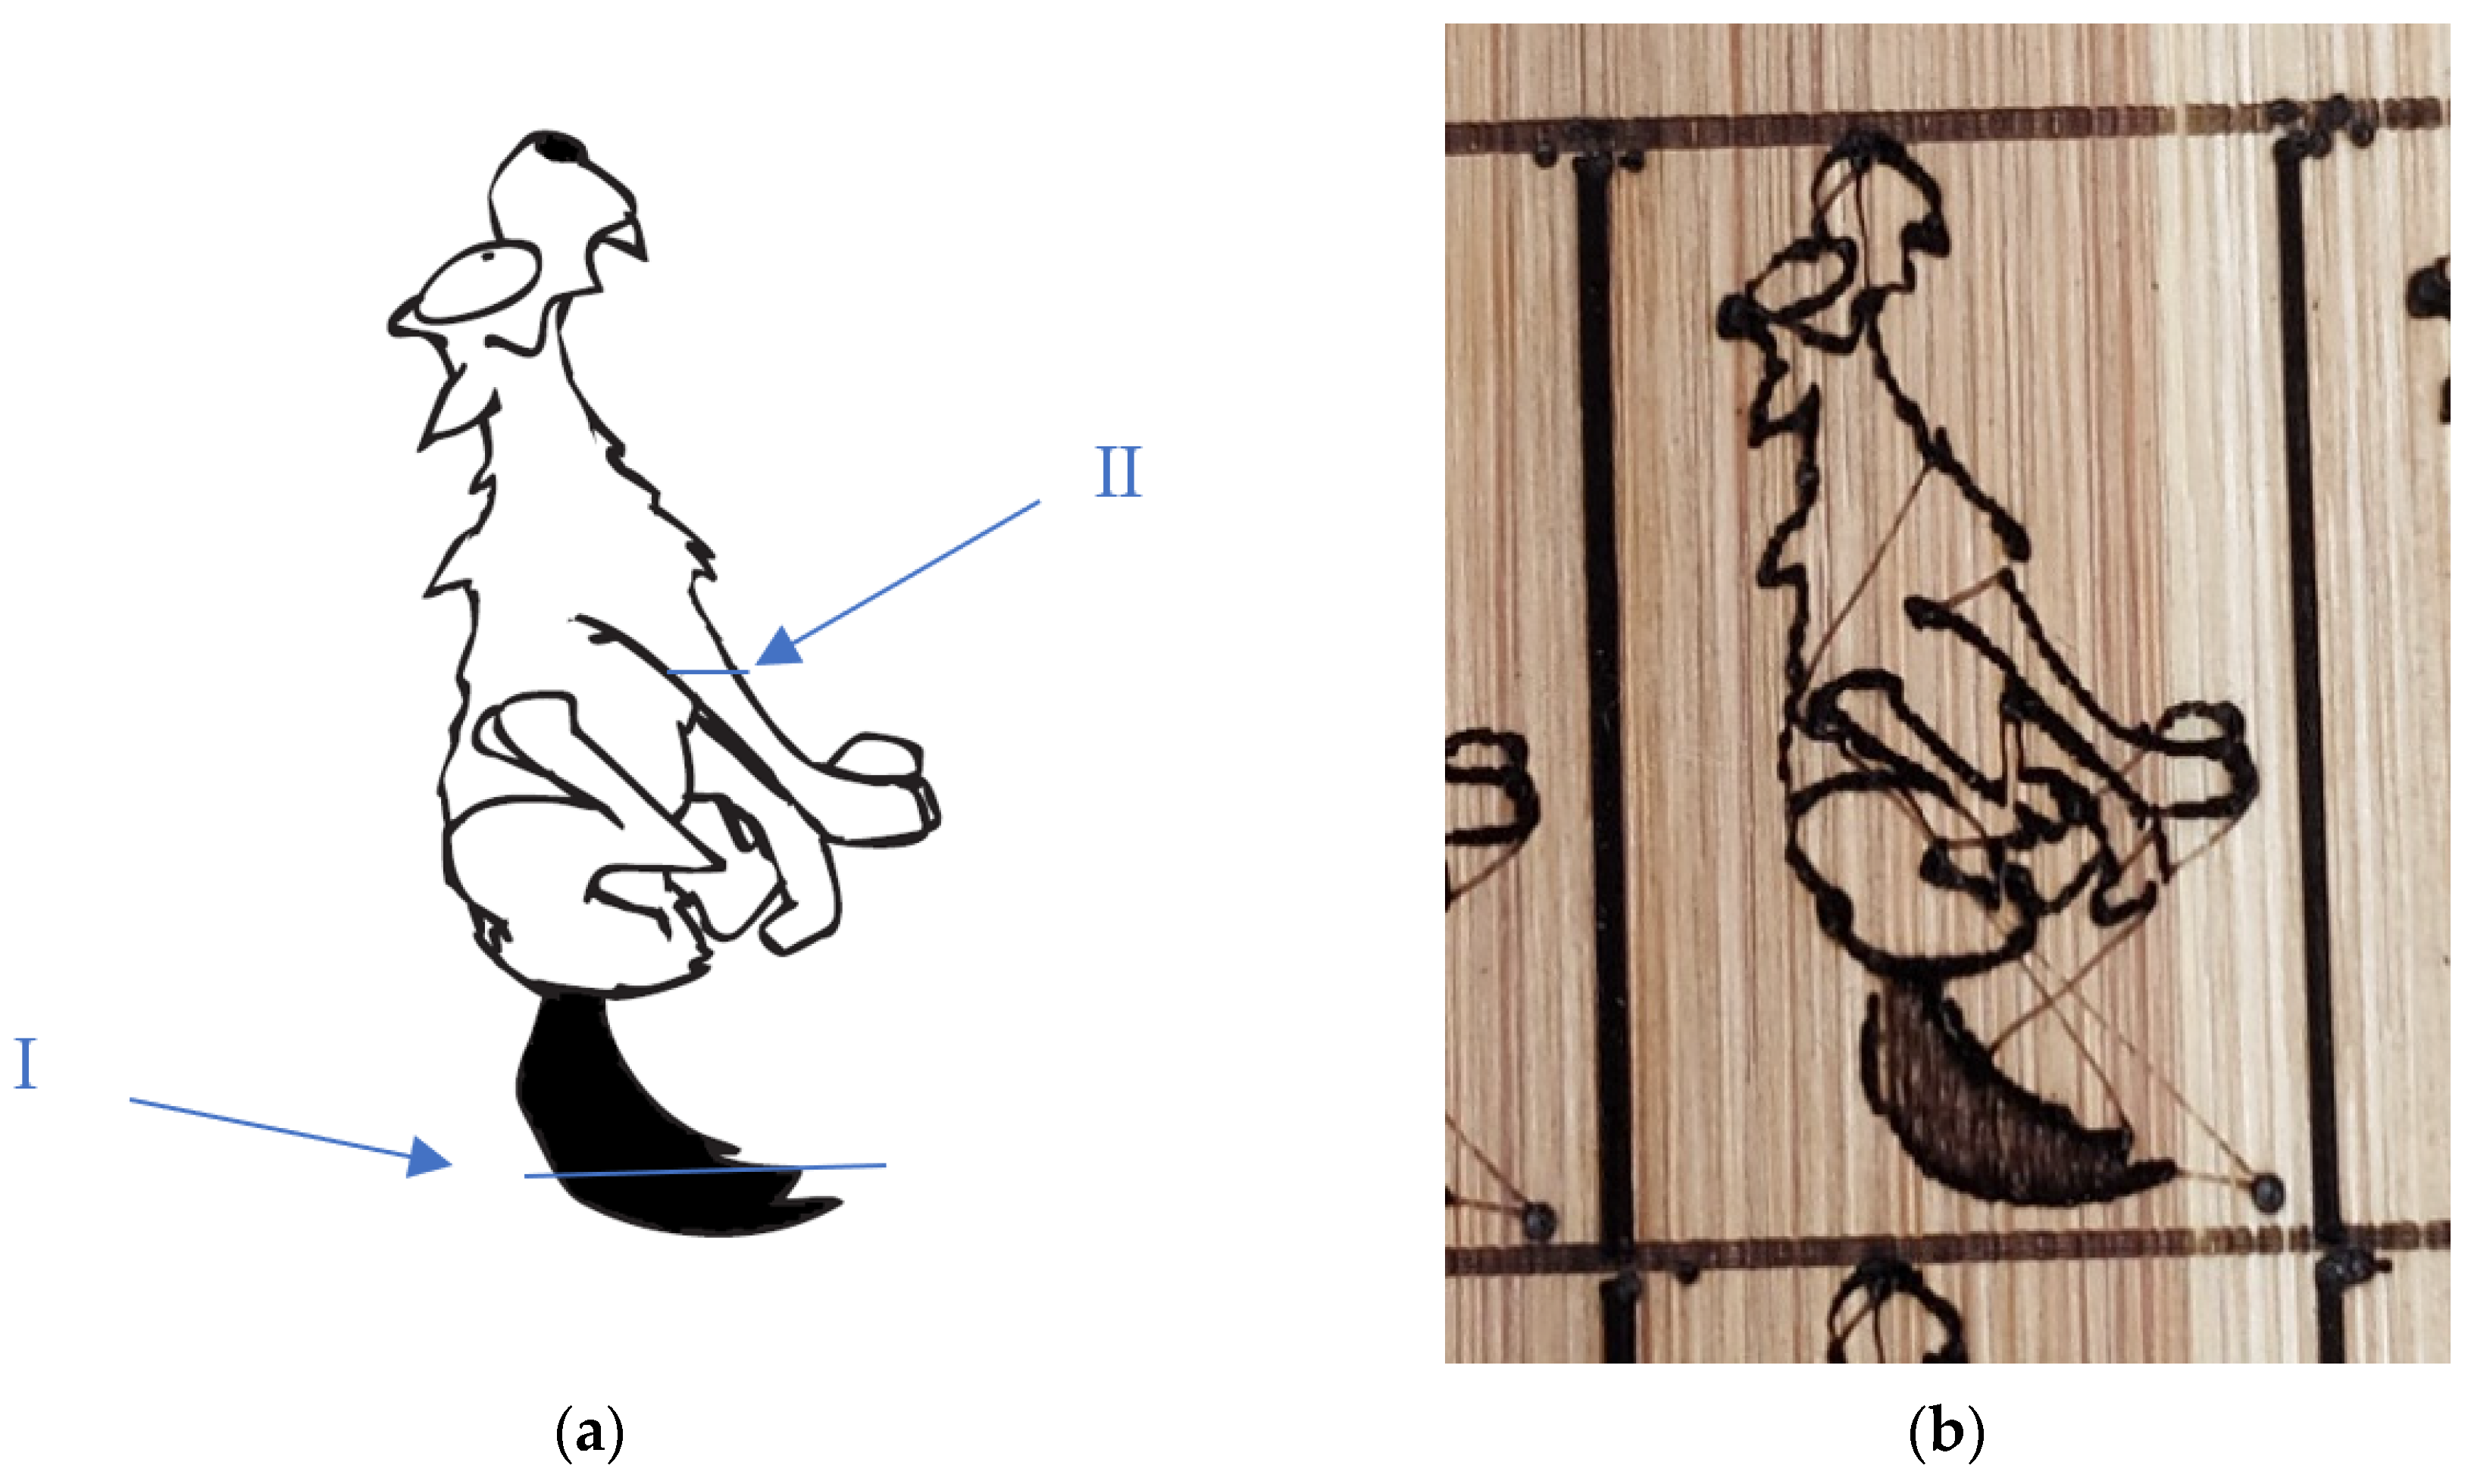
The bamboo sample was prepared with a smooth surface free of loose parts or any paint. The laser was positioned vertically, perpendicular to the surface to be engraved. The entire test was conducted after the laser was stabilized. The selected pattern, shown in
Figure 6, was a home design.
The main characteristics of this drawing include a black zone (I) for evaluating multiple engraved lines and a single line (II) to assess the behavior of a single pulse on the bamboo. The traveling path for the contacting stylus on the engraved slot was perpendicular to the lines engraved by the laser, as recommended by ISO standardization [
12] when no other indication is provided.
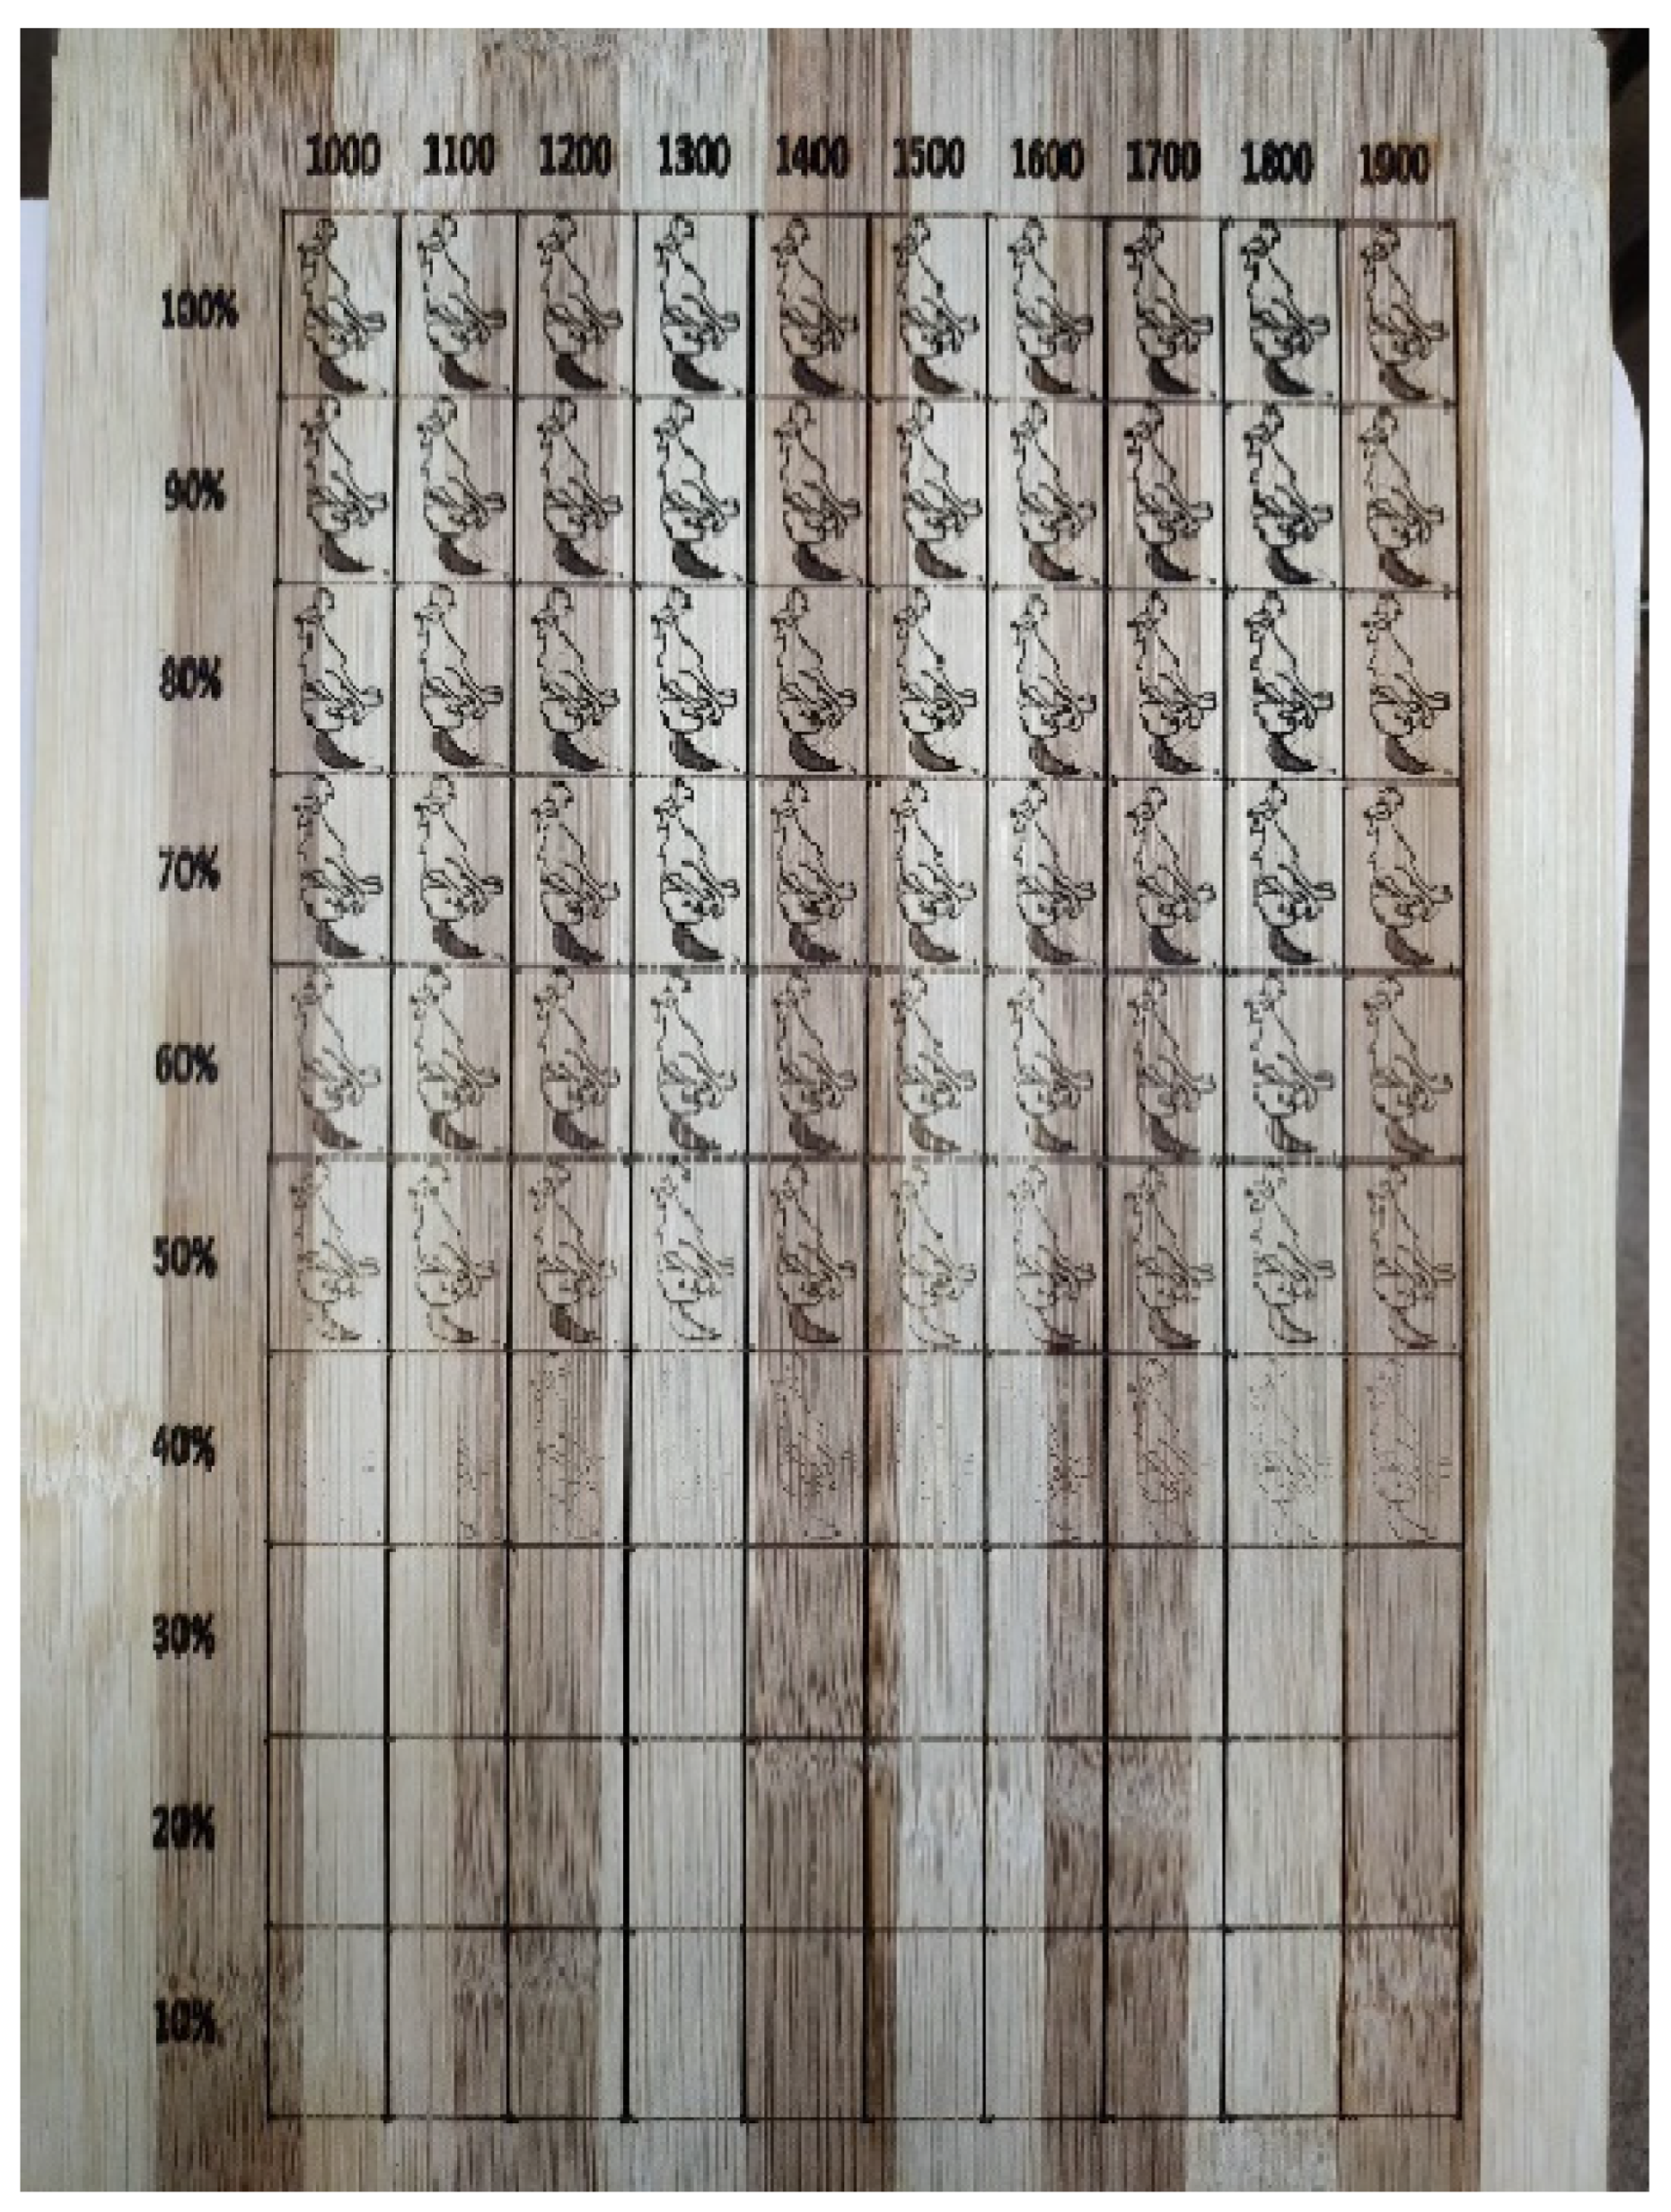
From this point forward, each engraved pattern will be referred to as a “sample”. A detailed photo of the entire table is provided in
Appendix B.
2.3. Laser Engraving Procedure
The software used to engrave the bamboo was Engraver Master GRBL, version 1.59.111.282, configured with the default drivers and appropriate settings for this laser engraver.
Figure 7 and
Figure 8 illustrate the parameters that could be modified in the laser and those that were used in this work.
The parameters used in the engraving procedure are described in
Table 1 and specifically recorded in the final compilation of the measurements developed for this research.
2.4. Roughness Measurements and Visual Inspection of Samples
2.4.1. Quantitative Measurement of the Surface Texture and Finish of the Engraving
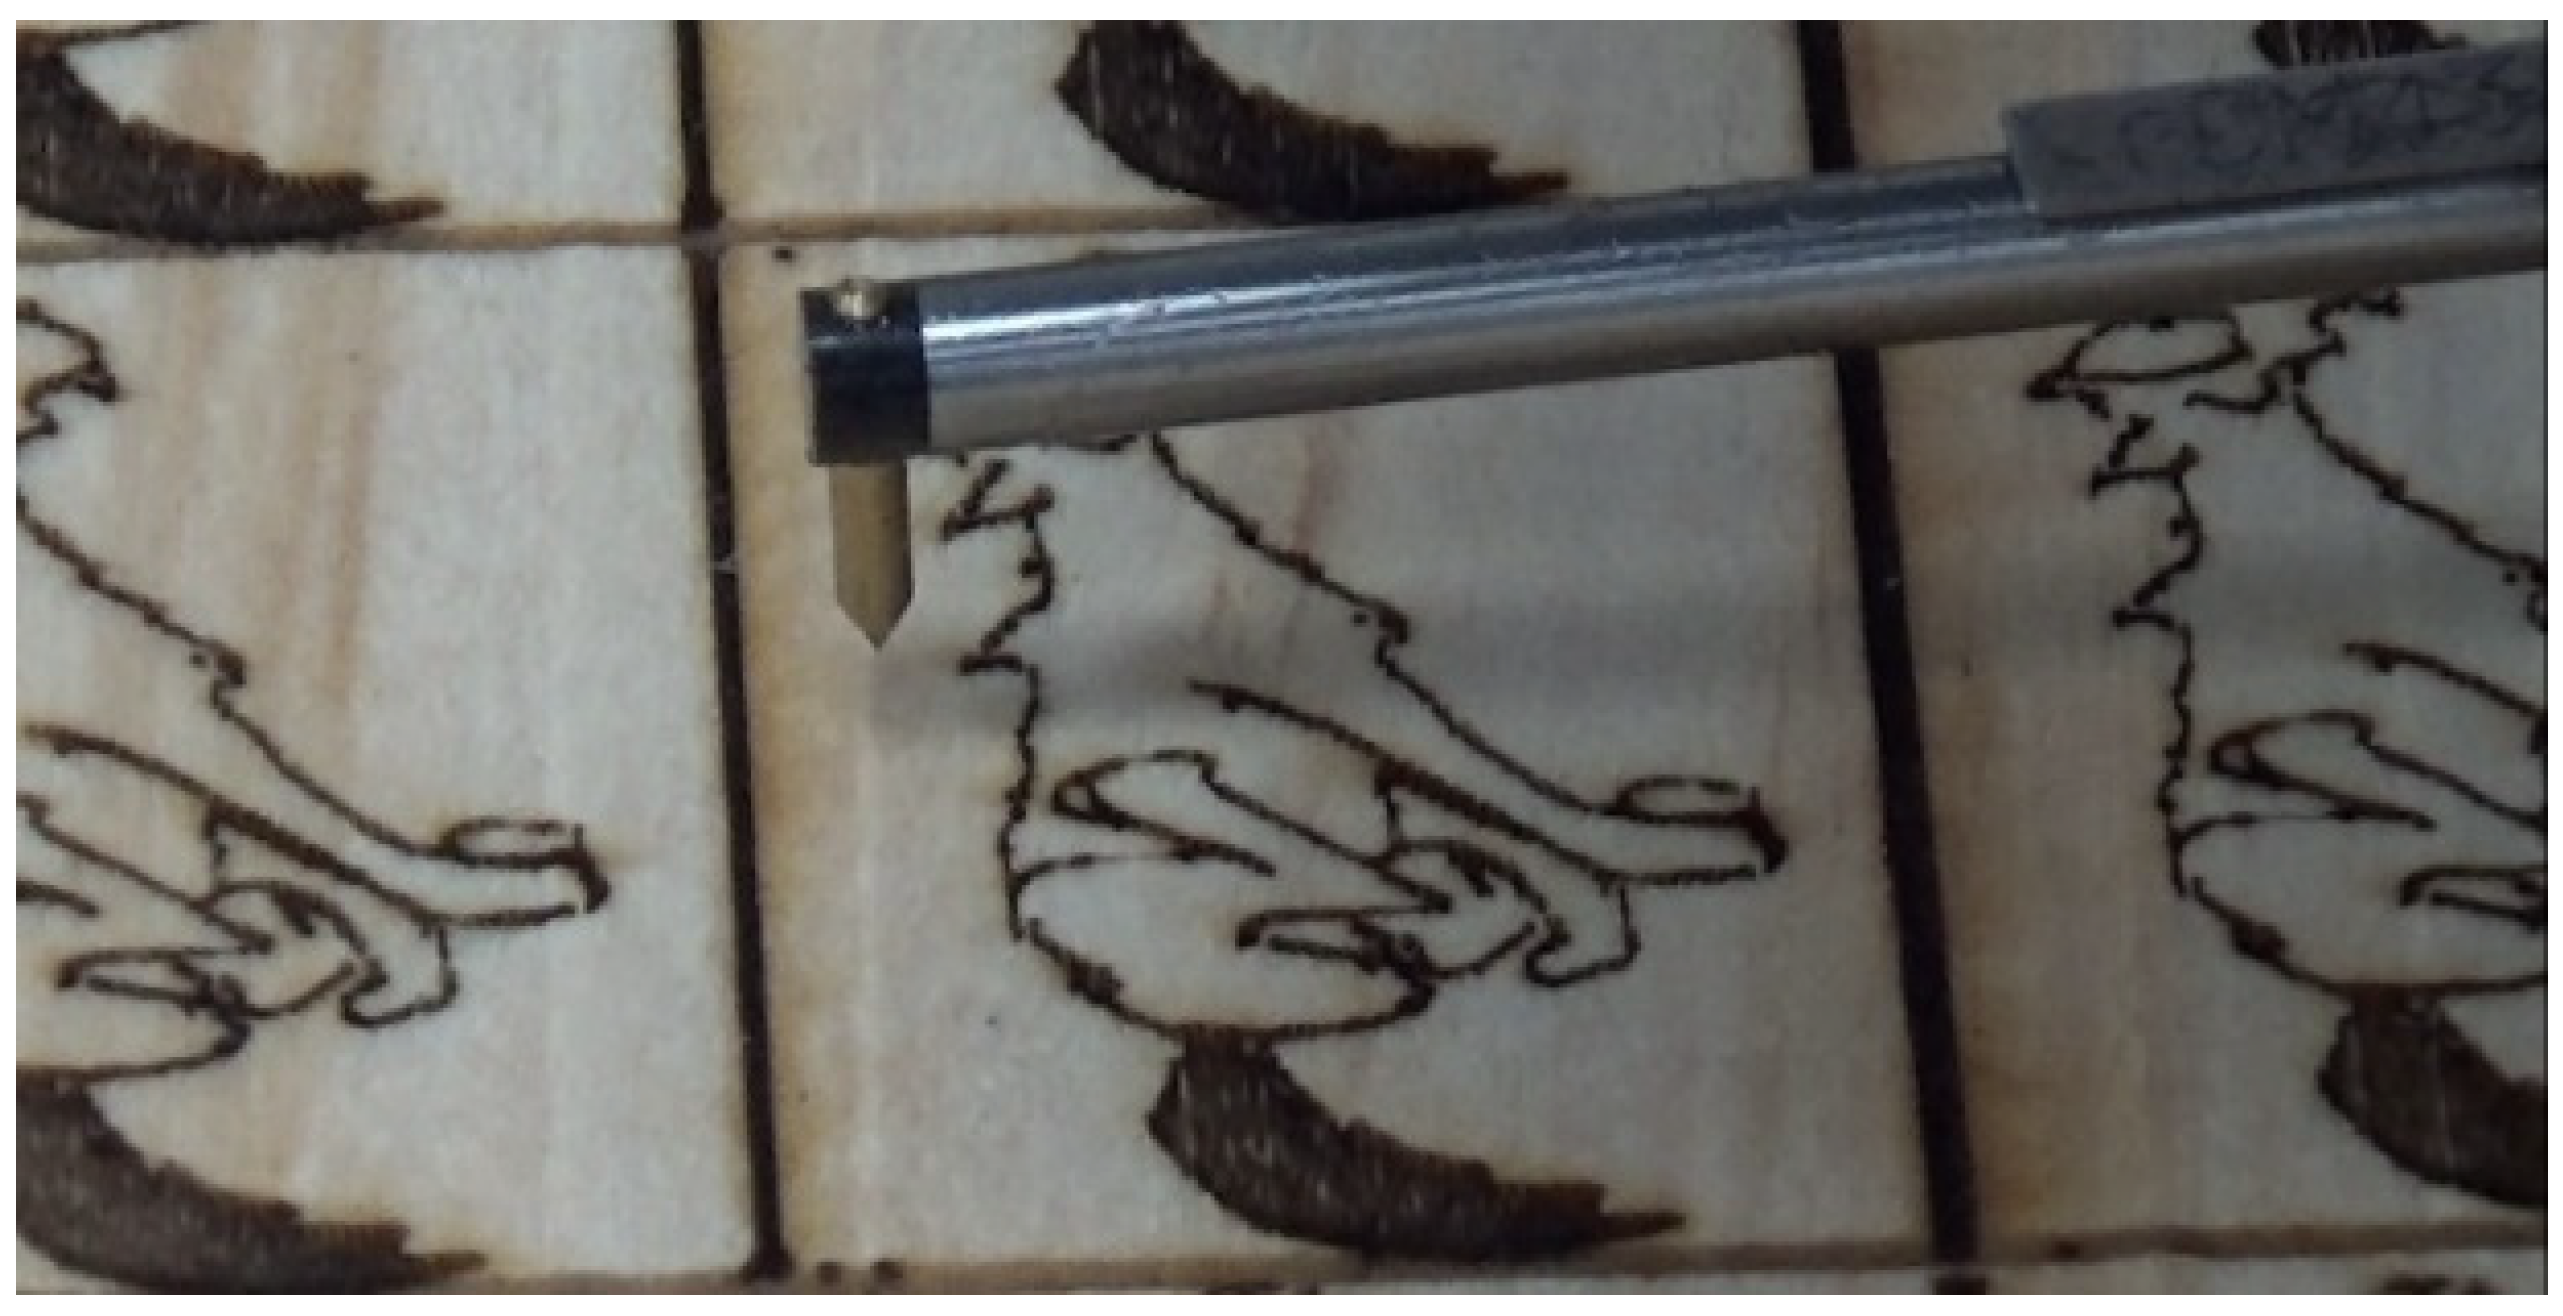
The Surfcom measuring system, shown in
Figure 3, features a probe with a conical tip, as depicted in
Figure 9. This setup adheres to ISO standards [
13,
14,
18,
24,
32], which recommend the main characteristics of stylus instruments for contact measurements.
The radius of the tip sphere was 2.50 µm, or a diameter of 5 µm, which is sufficient for the scope of this research. The contact force was below 0.01 N, ensuring suitability for the experiment without causing any scratching or damage to the surface, as verified beforehand. The measurement procedure was designed according to industry standards [
20,
21,
22,
23].
The temperature in the laboratory during the measurements was maintained at 20 °C ± 1 °C, with a relative humidity of 30 ± 40%, which is considered to be good environmental conditions under the ISO 1:2002 [
33] requirements.
For each sample, we used the following measuring conditions, adhering to the ISO standardization of ISO/TC 213 [
16,
17,
18,
24,
25,
26,
27,
28], as shown in
Table 2:
For the two main zones of samples (see
Figure 6), the one with a single line was measured 10 times over its length (see
Figure 10), while the other zone, referred to as the “tail of the dog” (see
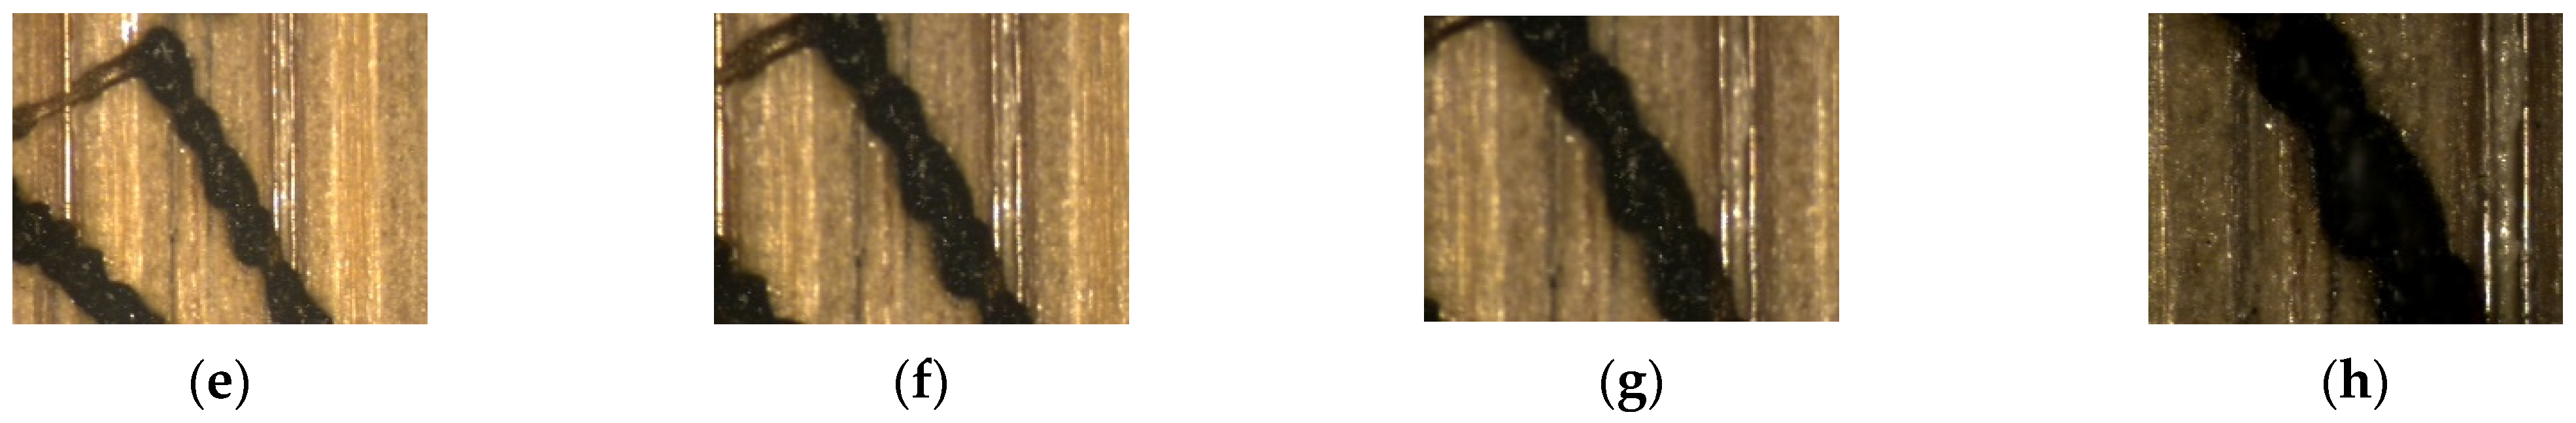
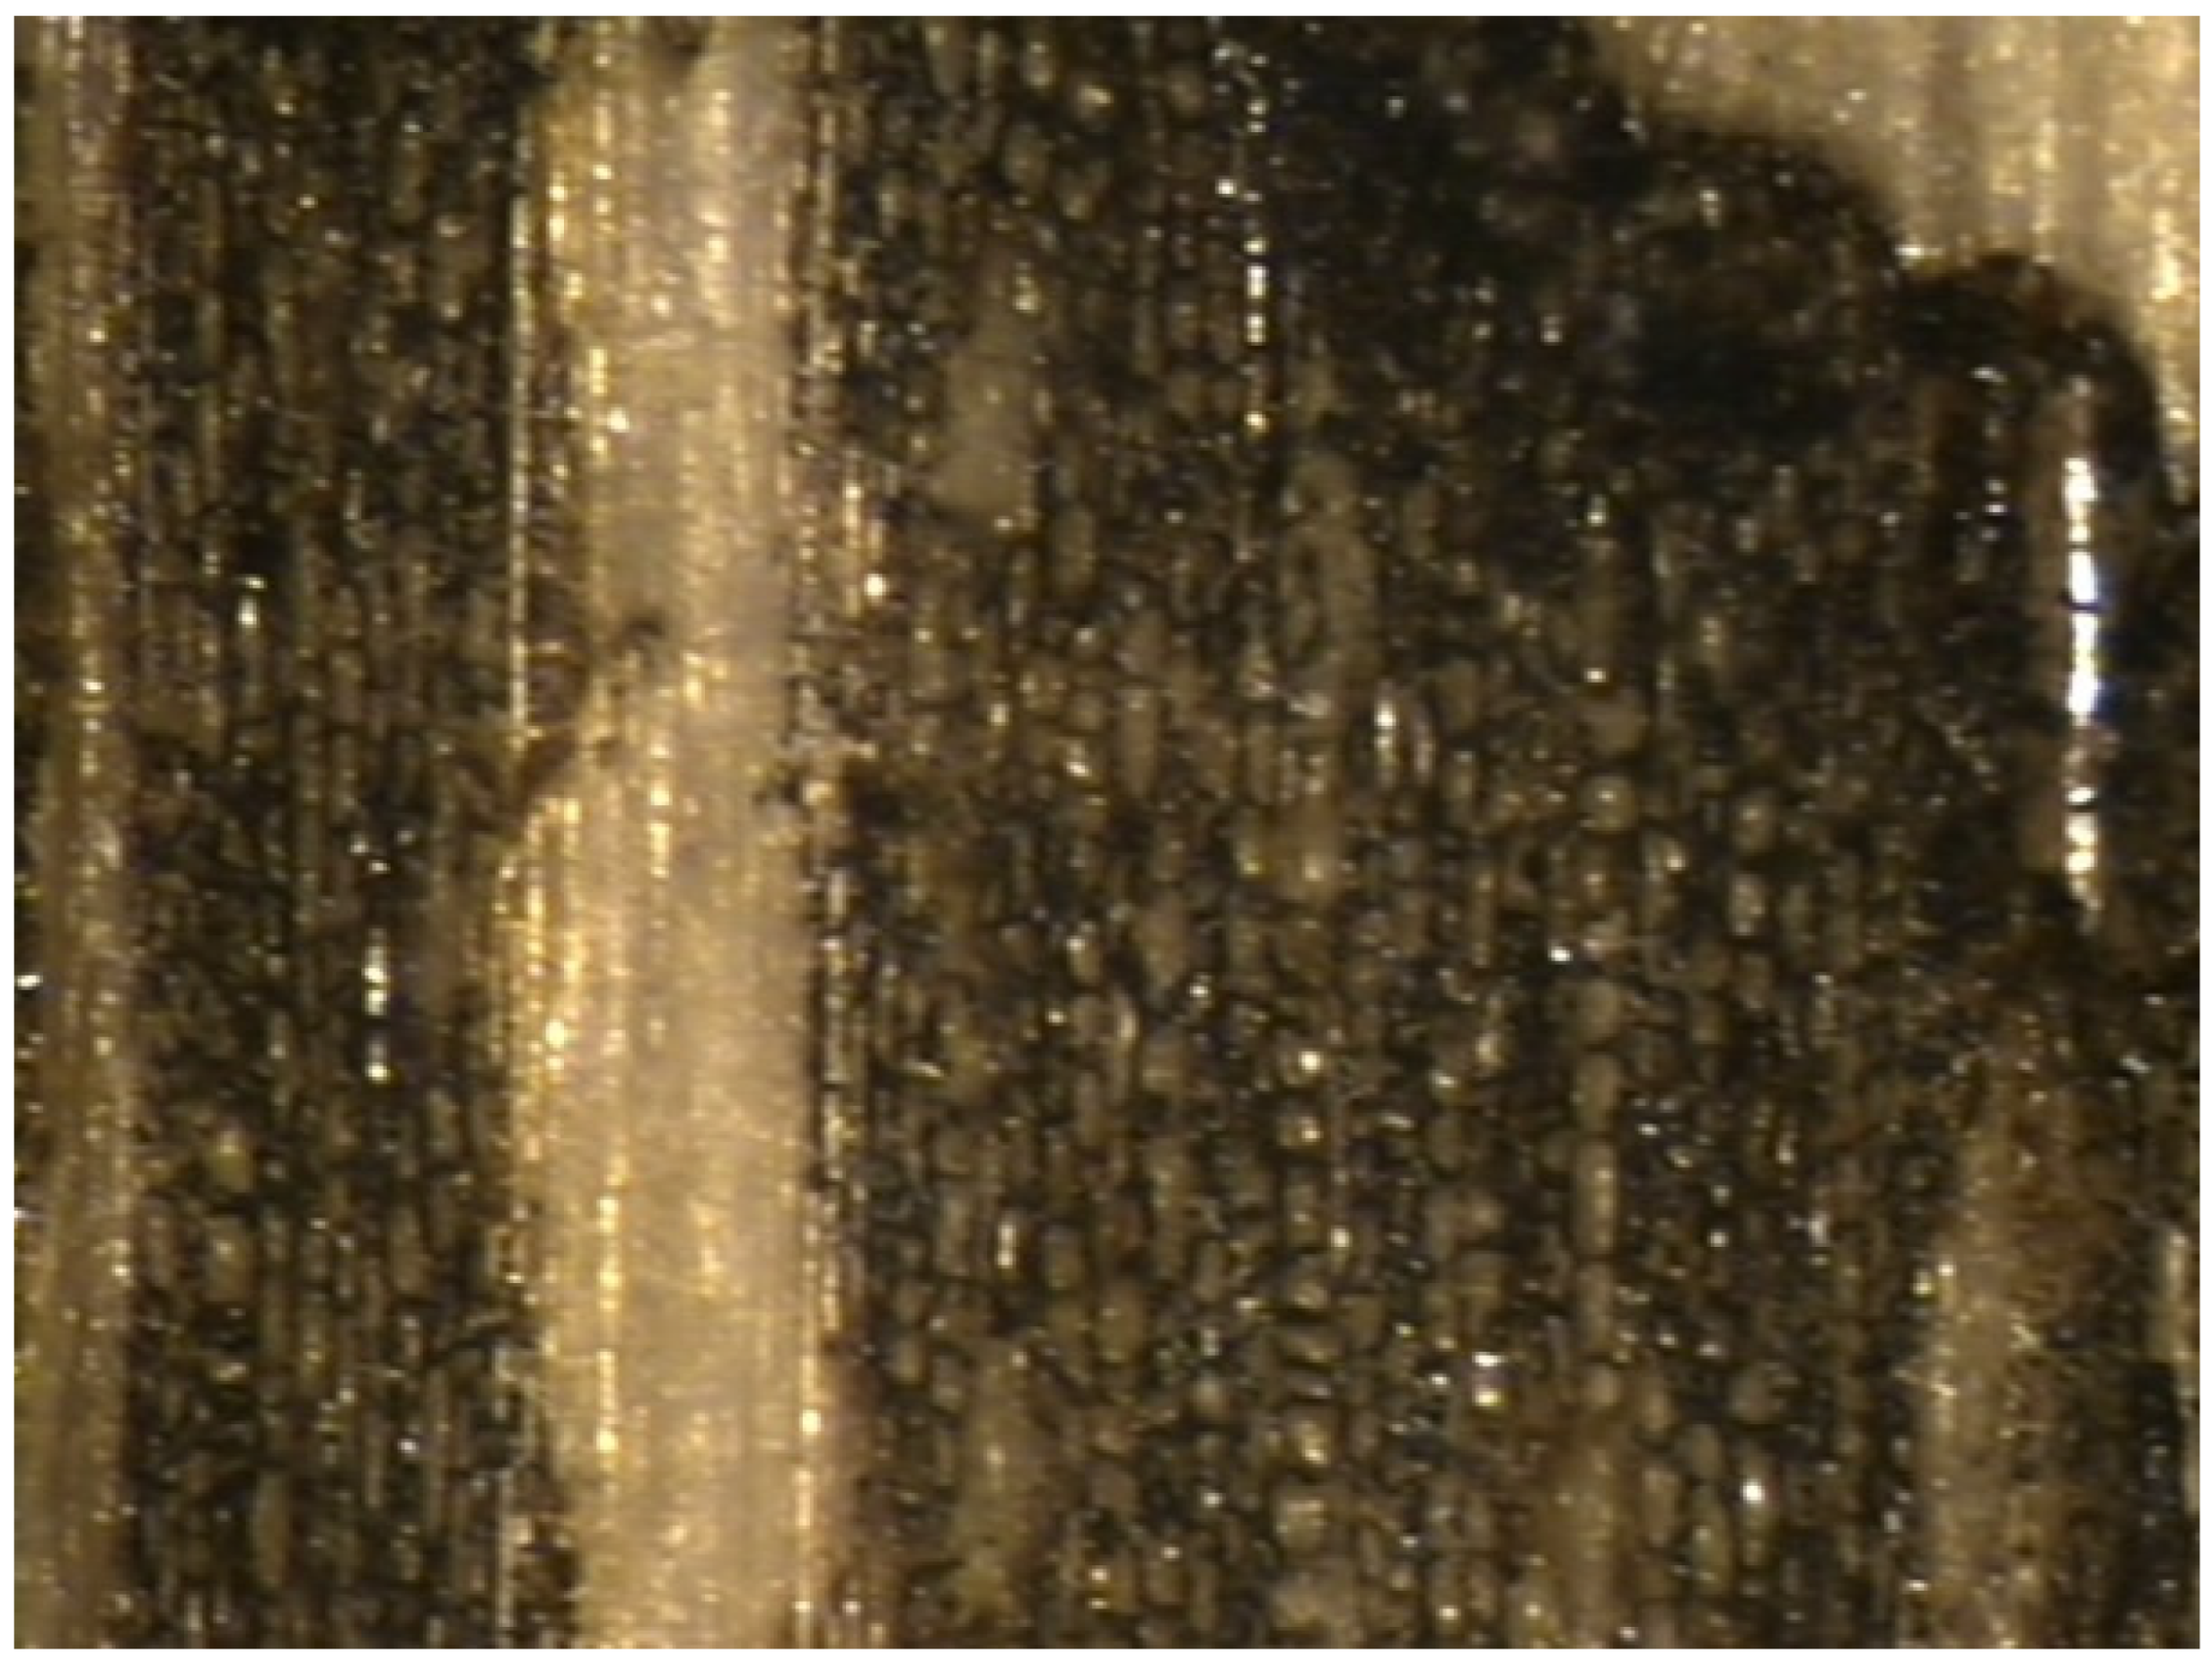
Figure 11) and called the black area, was also measured 10 times.
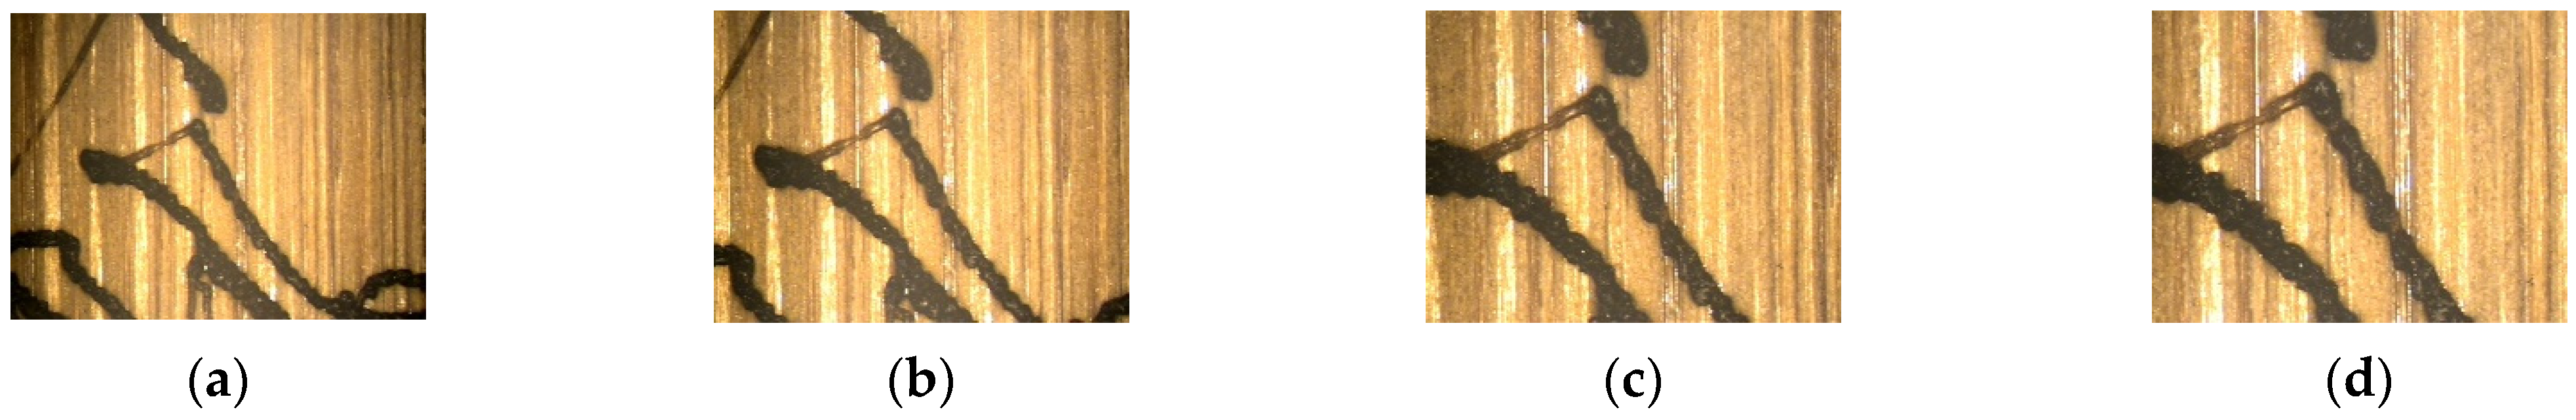
Figure 10 shows the effect of the pulse on the bamboo, which burned the area around the incident spot symmetrically, resulting in a less straight line on the contour of the profile. This effect is not relevant in
Figure 11, as the lines are close to each other. Typically, in laser metal engraving, the melted material around the slot is proportional to the depth of the slot. For bamboo, as demonstrated, engraving results in material removal due to burning (see
Figure 11a).
In the black area (see
Figure 6), due to the parallel incident laser pulses, some of the engravings may not belong to the same pulse. The bamboo may be burnt by both the intentional incident laser pulse and the nearby parallel pulse. Meanwhile, in single-line profile II, the effect of the laser on the bamboo along one path is clearly evaluated.
Therefore, when developing the manufacturing procedure for engraving a specific type of bamboo with a specific laser, it is highly recommended to engrave a single line (see Figure 13a) and a sufficiently large black area (see Figure 13b) on the bamboo sample. The single line will allow for the evaluation of the width and depth of the engraved slot relative to the laser spot diameter using the parameters defined in the ISO standard. Among the well-known industry parameters listed in ISO 1302 [
12] and defined in [
15,
16,
17], those related to large motifs in texture profiles, as qualitatively defined in [
24], were selected. The measurement should be taken perpendicular to the lay, unless otherwise specified.
Following the guidelines in [
16,
17,
18], we selected profiles P and R for roughness, excluding waviness.
The parameters measured for each of these profiles are listed in
Table 3:
Although new ISO roughness standards have been published since 1997 [
25,
26,
27,
28,
29,
30,
31,
32], they were not used for the 3D evaluation in this work for the following reasons: First, the measurement system does not calculate the Areal parameters, which are known as S parameters. However, we deemed it unnecessary to seek additional parameters, as the information obtained from the available parameters (listed in
Table 3) was sufficient to compare the quality of the finishing in each case. Second, the changes in roughness standardization primarily concern the new 3D parameters, which are known as S parameters [
26] and fall outside the scope of this study. While S parameters should be consistent with 2D parameters when reduced to such profiles, it would be interesting to repeat this study with a new system.
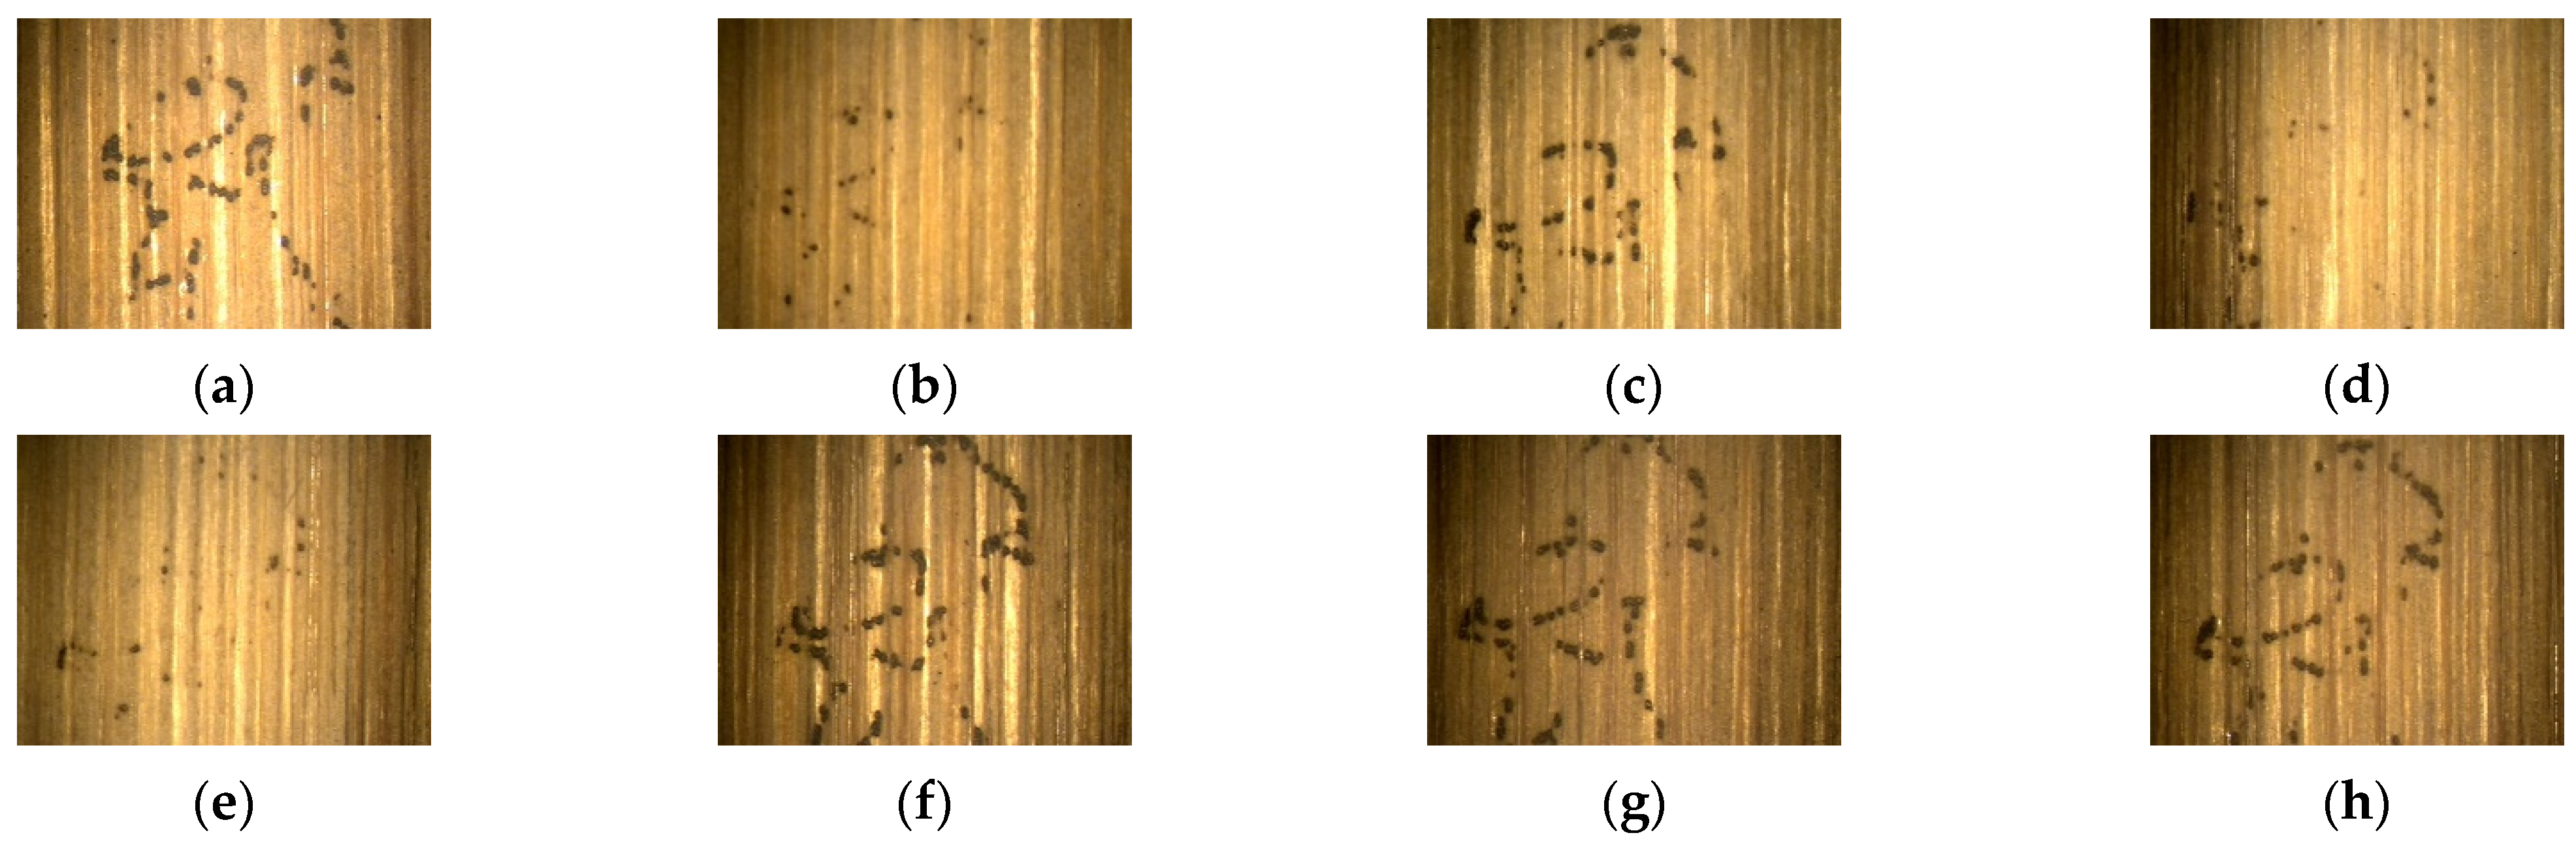
Upon inspecting the samples in
Figure 2 and
Appendix B, it is evident that the mark is almost invisible at power levels of 40% and below. Therefore, these samples were not taken into account.
Figure 12 shows some of the barely visible patterns under low-power conditions.
Taking into account that each table includes at least 60 different samples, which are measured 10 times in two areas, and for each area, 4 parameters for the whole profile and 5 parameters for the roughness profile are measured, the data to be handled amount to
A cycle of measurements for all the samples in one table is shown in
Appendix A.
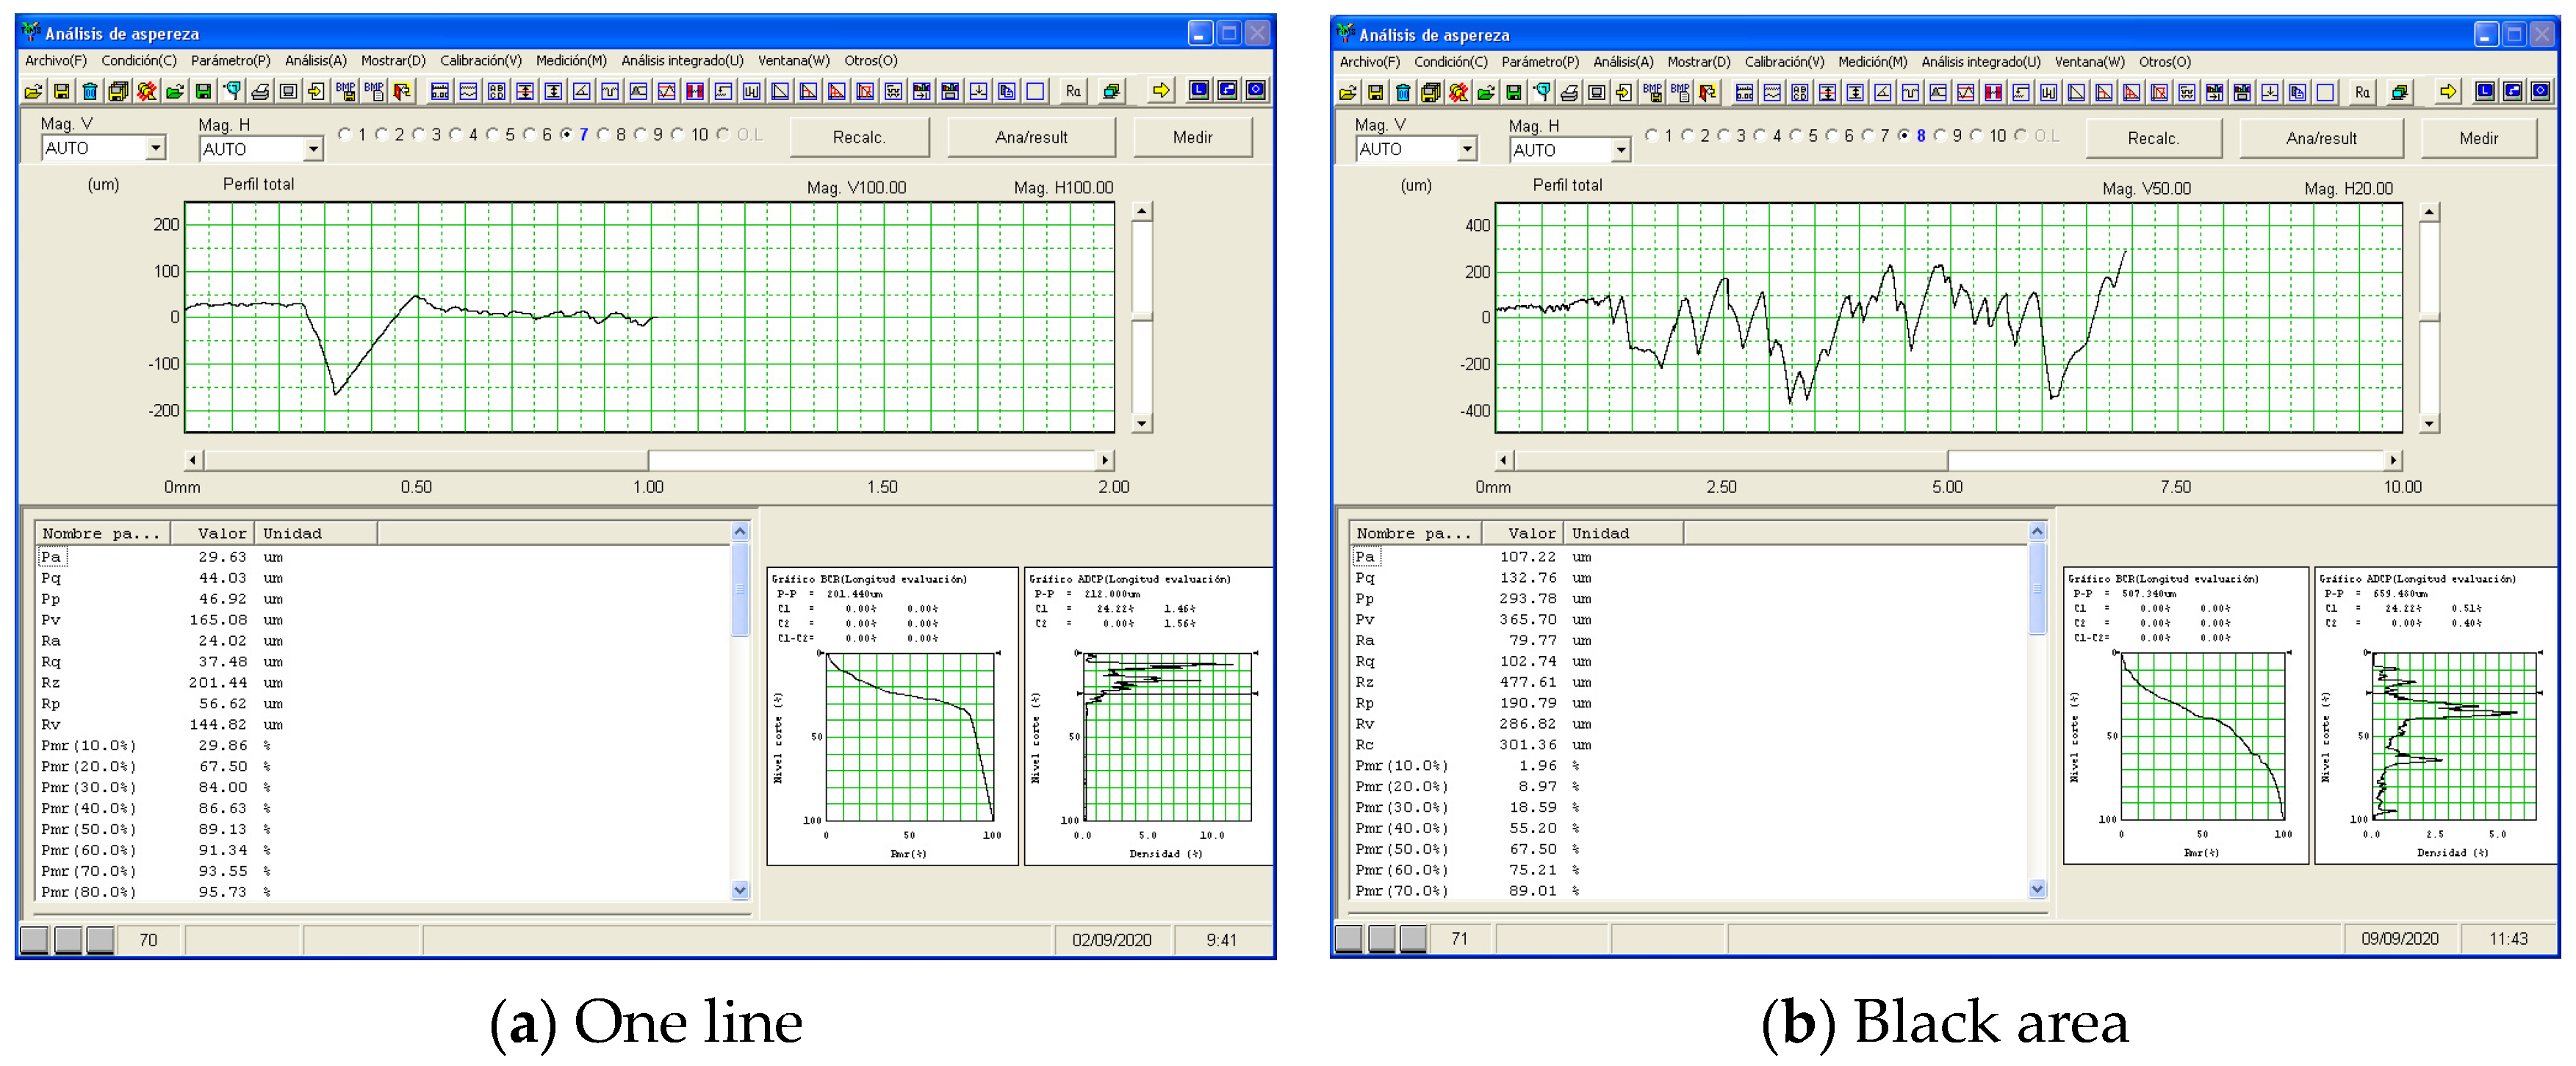
The typical plots obtained during each measurement on a sample are shown in
Figure 13a for a single line and
Figure 13b for a black area.
2.4.2. Qualitative Measurement of the Surface Texture and Finish of the Marking
We also conducted a visual inspection of the patterns using the vision machine shown in
Figure 4 (see
Figure 10 and
Figure 11). Occasionally, the area burnt by the laser was removed, revealing the clear underlying bamboo where it appeared that no engraving had occurred (see
Figure 14).
These kinds of side effects will not be accounted for if measured solely with tactile probes. Therefore, we utilized a vision machine to qualitatively compare the results obtained with both systems. We will present some of the results, but we considered this only a visual, not a quantitative, analysis. Thus, we will include only those images and figures relevant to the research.
3. Results
With the 10,800 available data points from a table containing 6 × 10 samples, we used the 10 repeated measurements to evaluate the measurement uncertainty of the obtained results.
3.1. Uncertainty Evaluation
Although an uncertainty budget would be premature in many aspects, we estimated the maximum uncertainty that we might encounter with our measurement procedure. There is still no international agreement on the instrument or measurement principle to be used, but such a standard will be required for future comparisons. Additionally, we need an order of magnitude of that uncertainty in comparison with the obtained results to validate the procedure.
Based on our evaluation using the ISO guide for the expression of uncertainty in measurement (GUM) [
35], we have considered the following contributions to the uncertainty of each parameter, as listed in
Table 4:
Repeatability for the 10 measurements and a normal distribution;
Temperature changes due to environmental uncertainty, considering a rectangular distribution;
The calibration uncertainty of the roughness meter for each parameter, which was calculated according to [
10];
The contribution due to contacting force was calculated by considering the change in the final parameter due to the variation in contacting force along one travel length relative to the total height traveled by the stylus. As the main scope of the research is to identify the R and P parameters to be used on a single material with a constant initial stylus force, we have overestimated this value to obtain a reliable result. When comparing results between different wood or organic materials, this aspect will be quite important to consider.
This resulted in an uncertainty of less than 100 nm for k = 2 or 50 nm for k = 1. Compared to the measured results, this uncertainty, along with the equipment calibration, ensures the accuracy and precision of the developed procedure. Even in an extreme case of measuring with different equipment with an uncertainty five times greater, the resulting 0.5 µm value would still be below a 3% relative uncertainty. This conservative scenario accounts for the stability of the laser and the variation in bamboo material layers on the surface.
Therefore, we used an expanded uncertainty in Equation (2)
After considering all conditions, the 10,800 data points were reduced to 1080, including their uncertainties, making it more effective to visualize and analyze the results.
3.2. Measurements
Based on our evaluation of uncertainty, considering it to be 0.5 µm as per Equation (2), the summary of the results obtained is provided in
Appendix A,
Appendix B and
Appendix C.
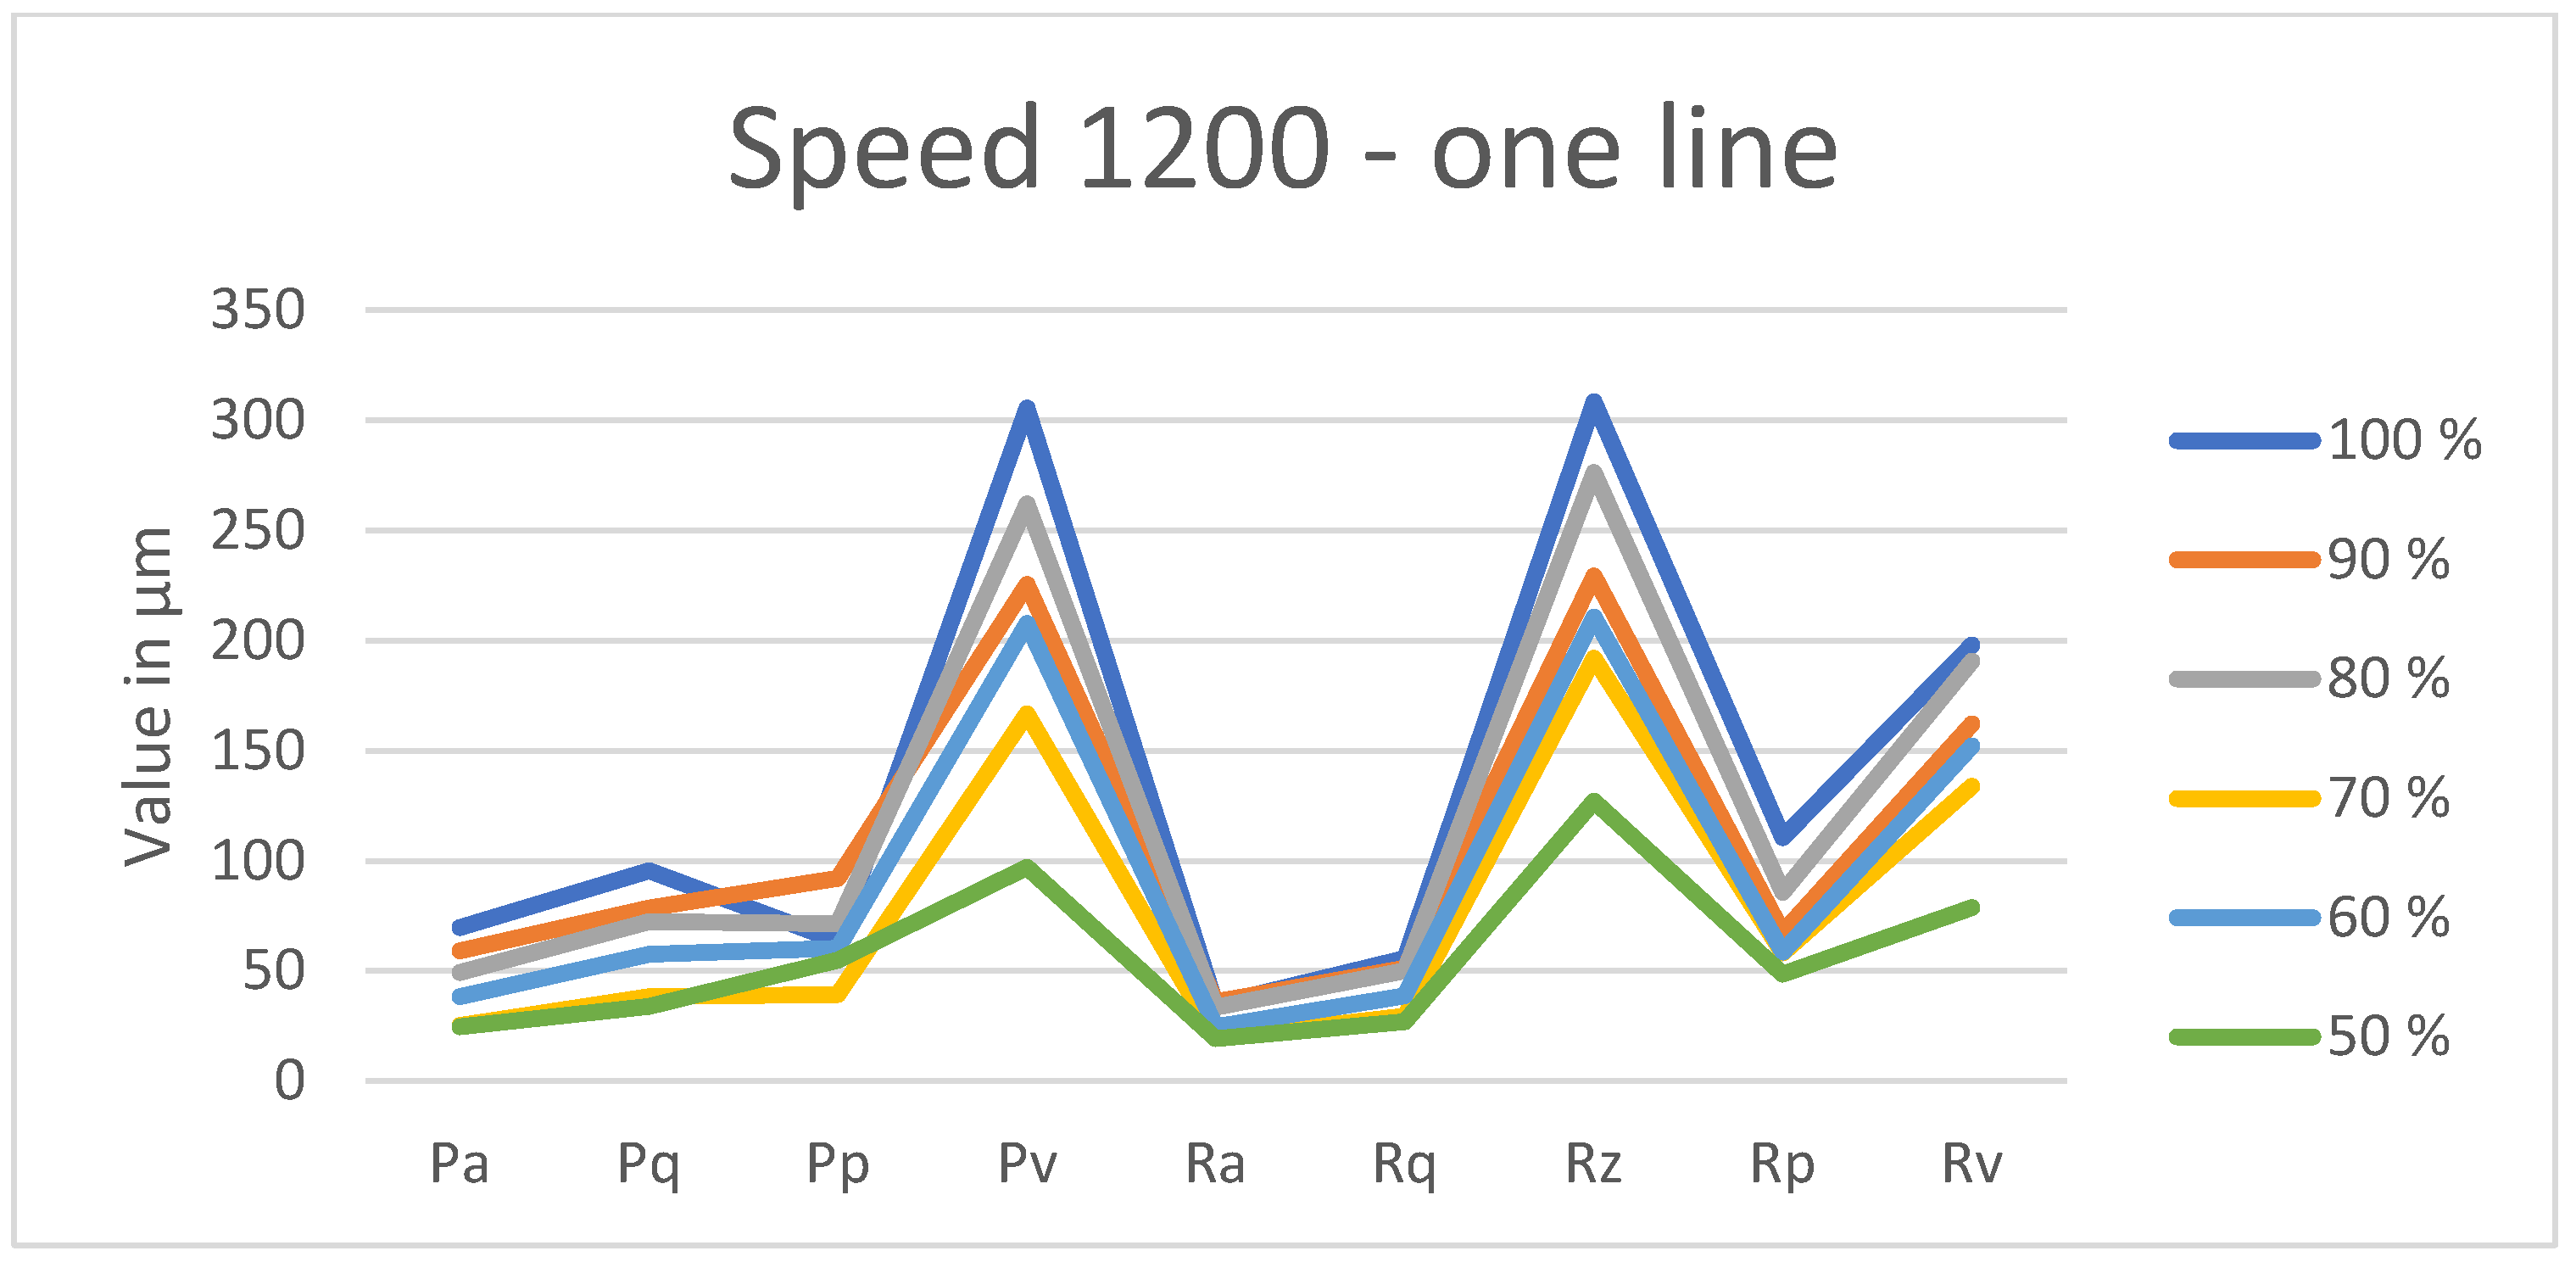
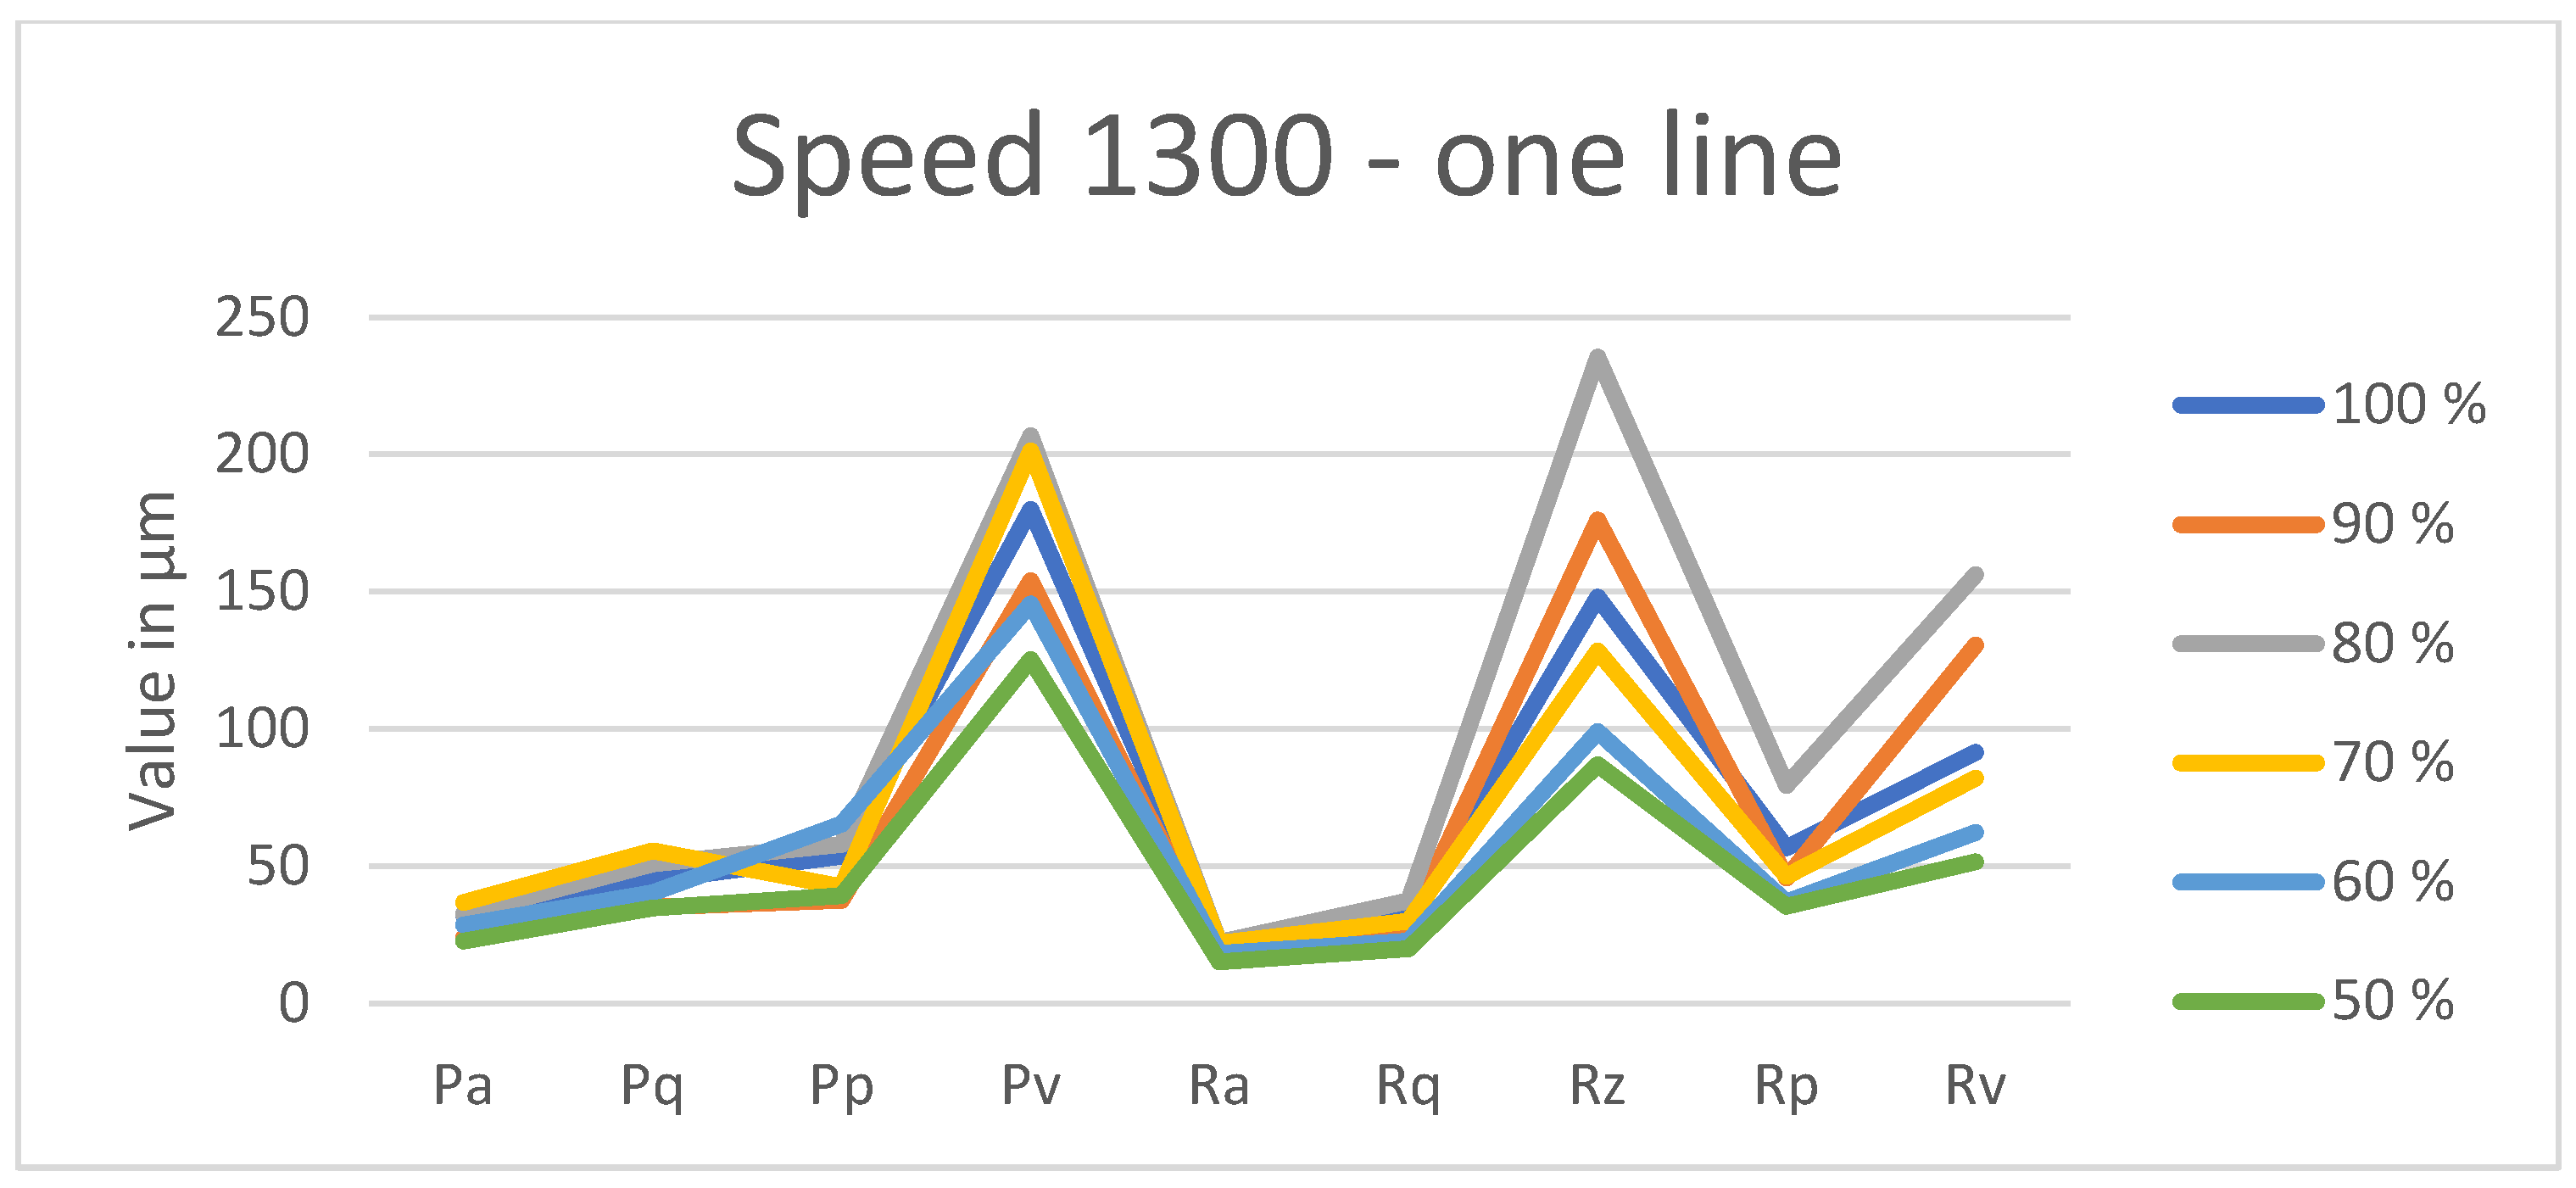
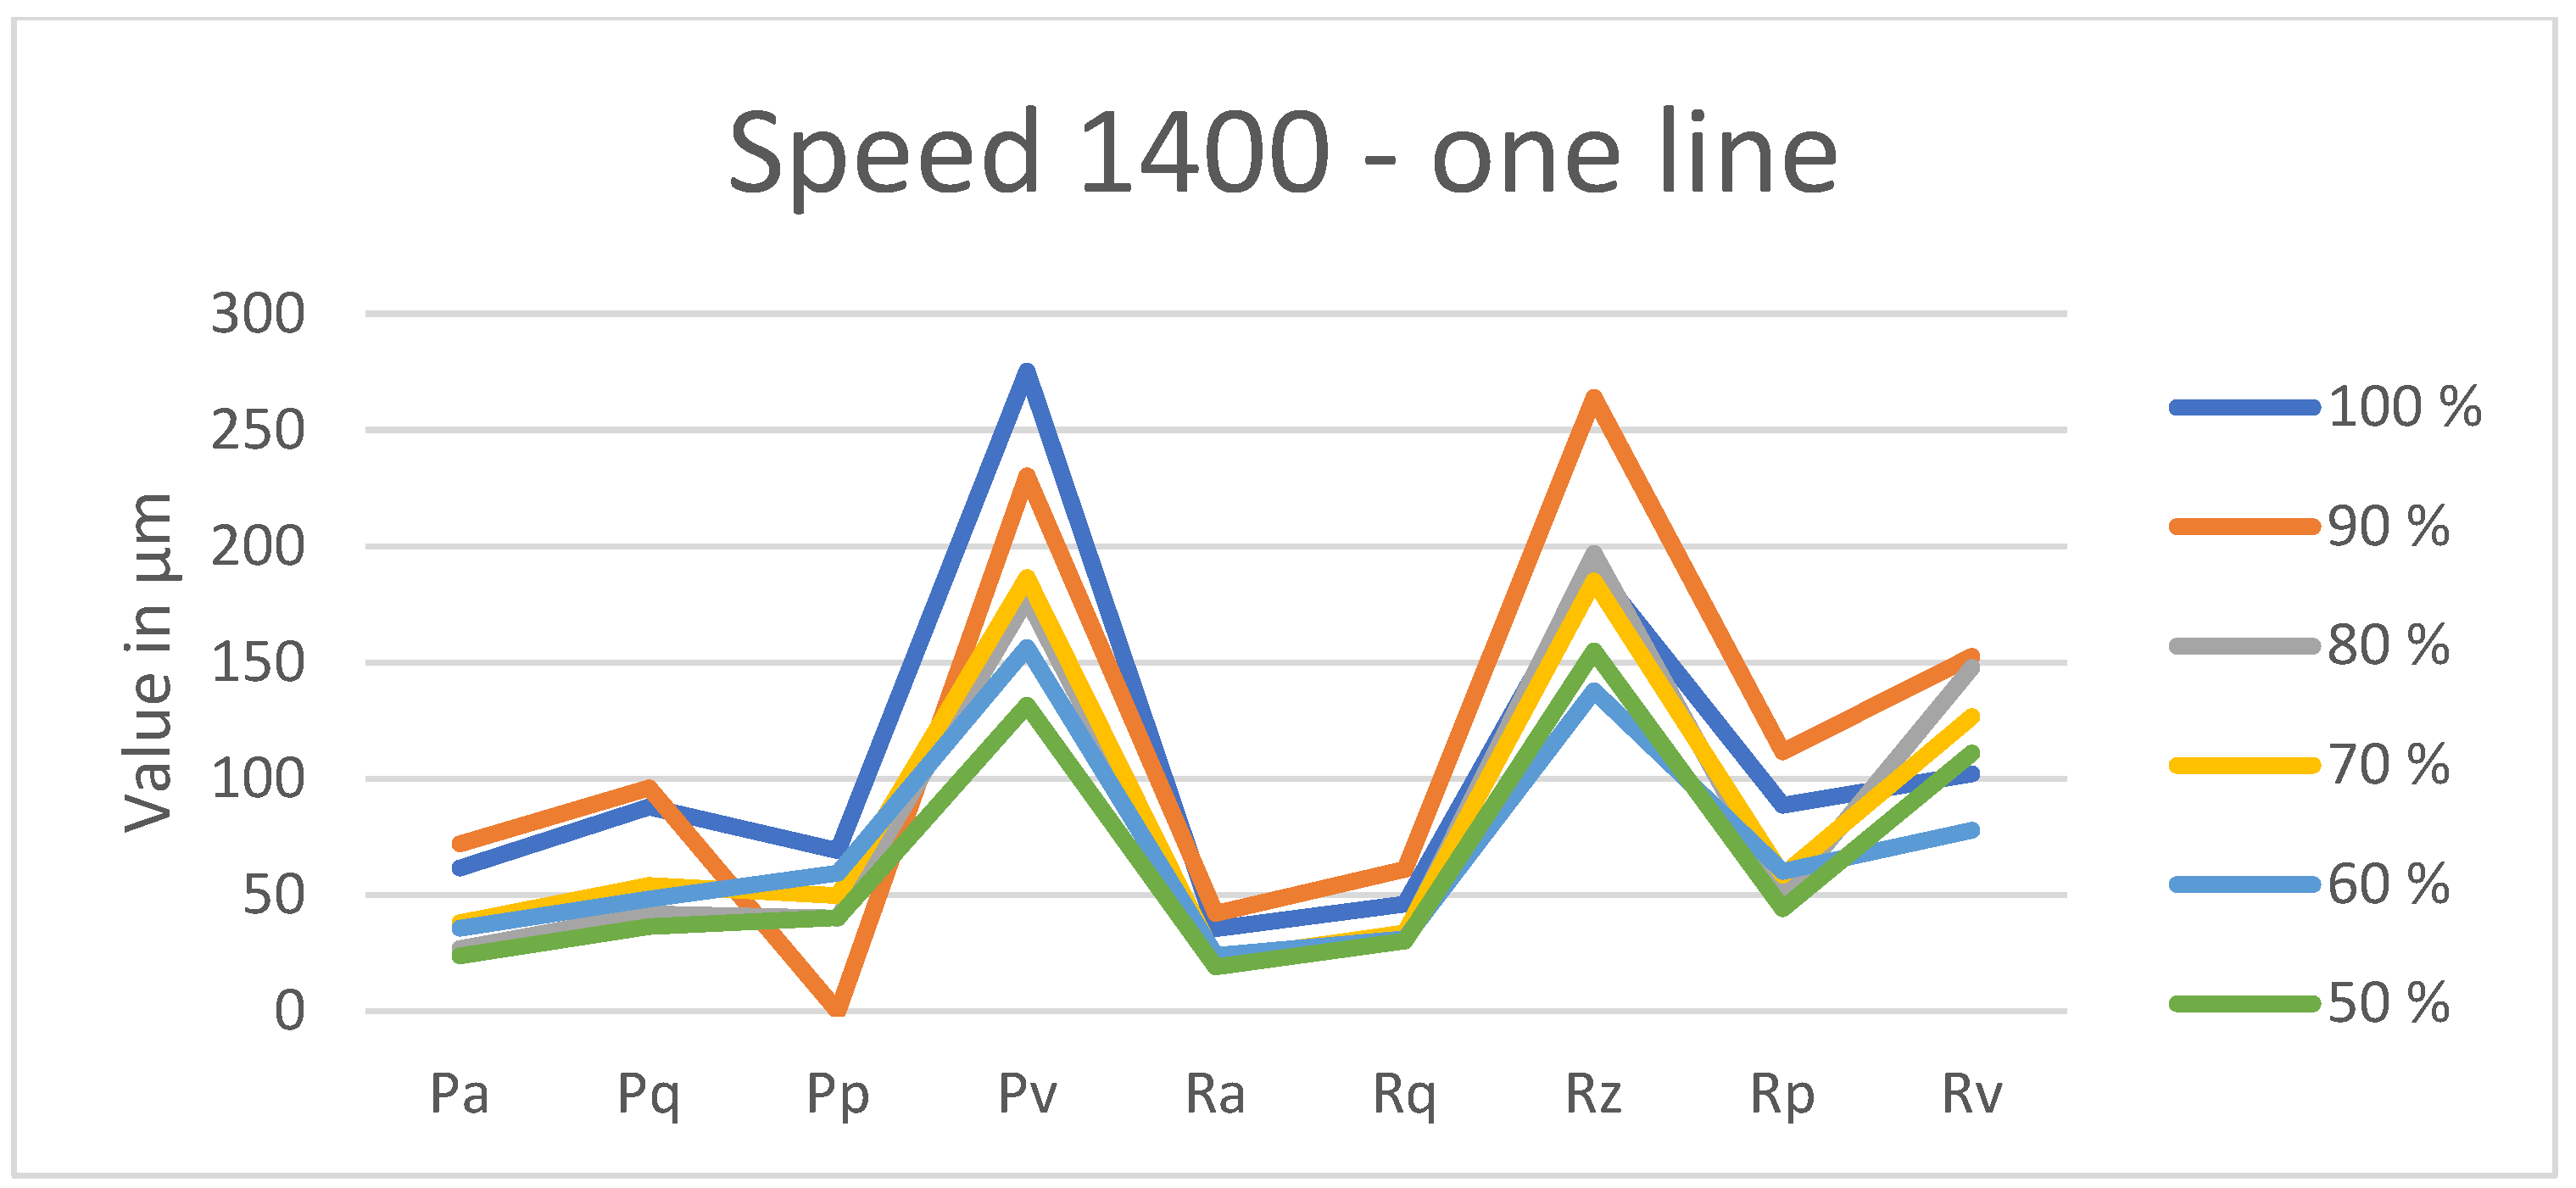
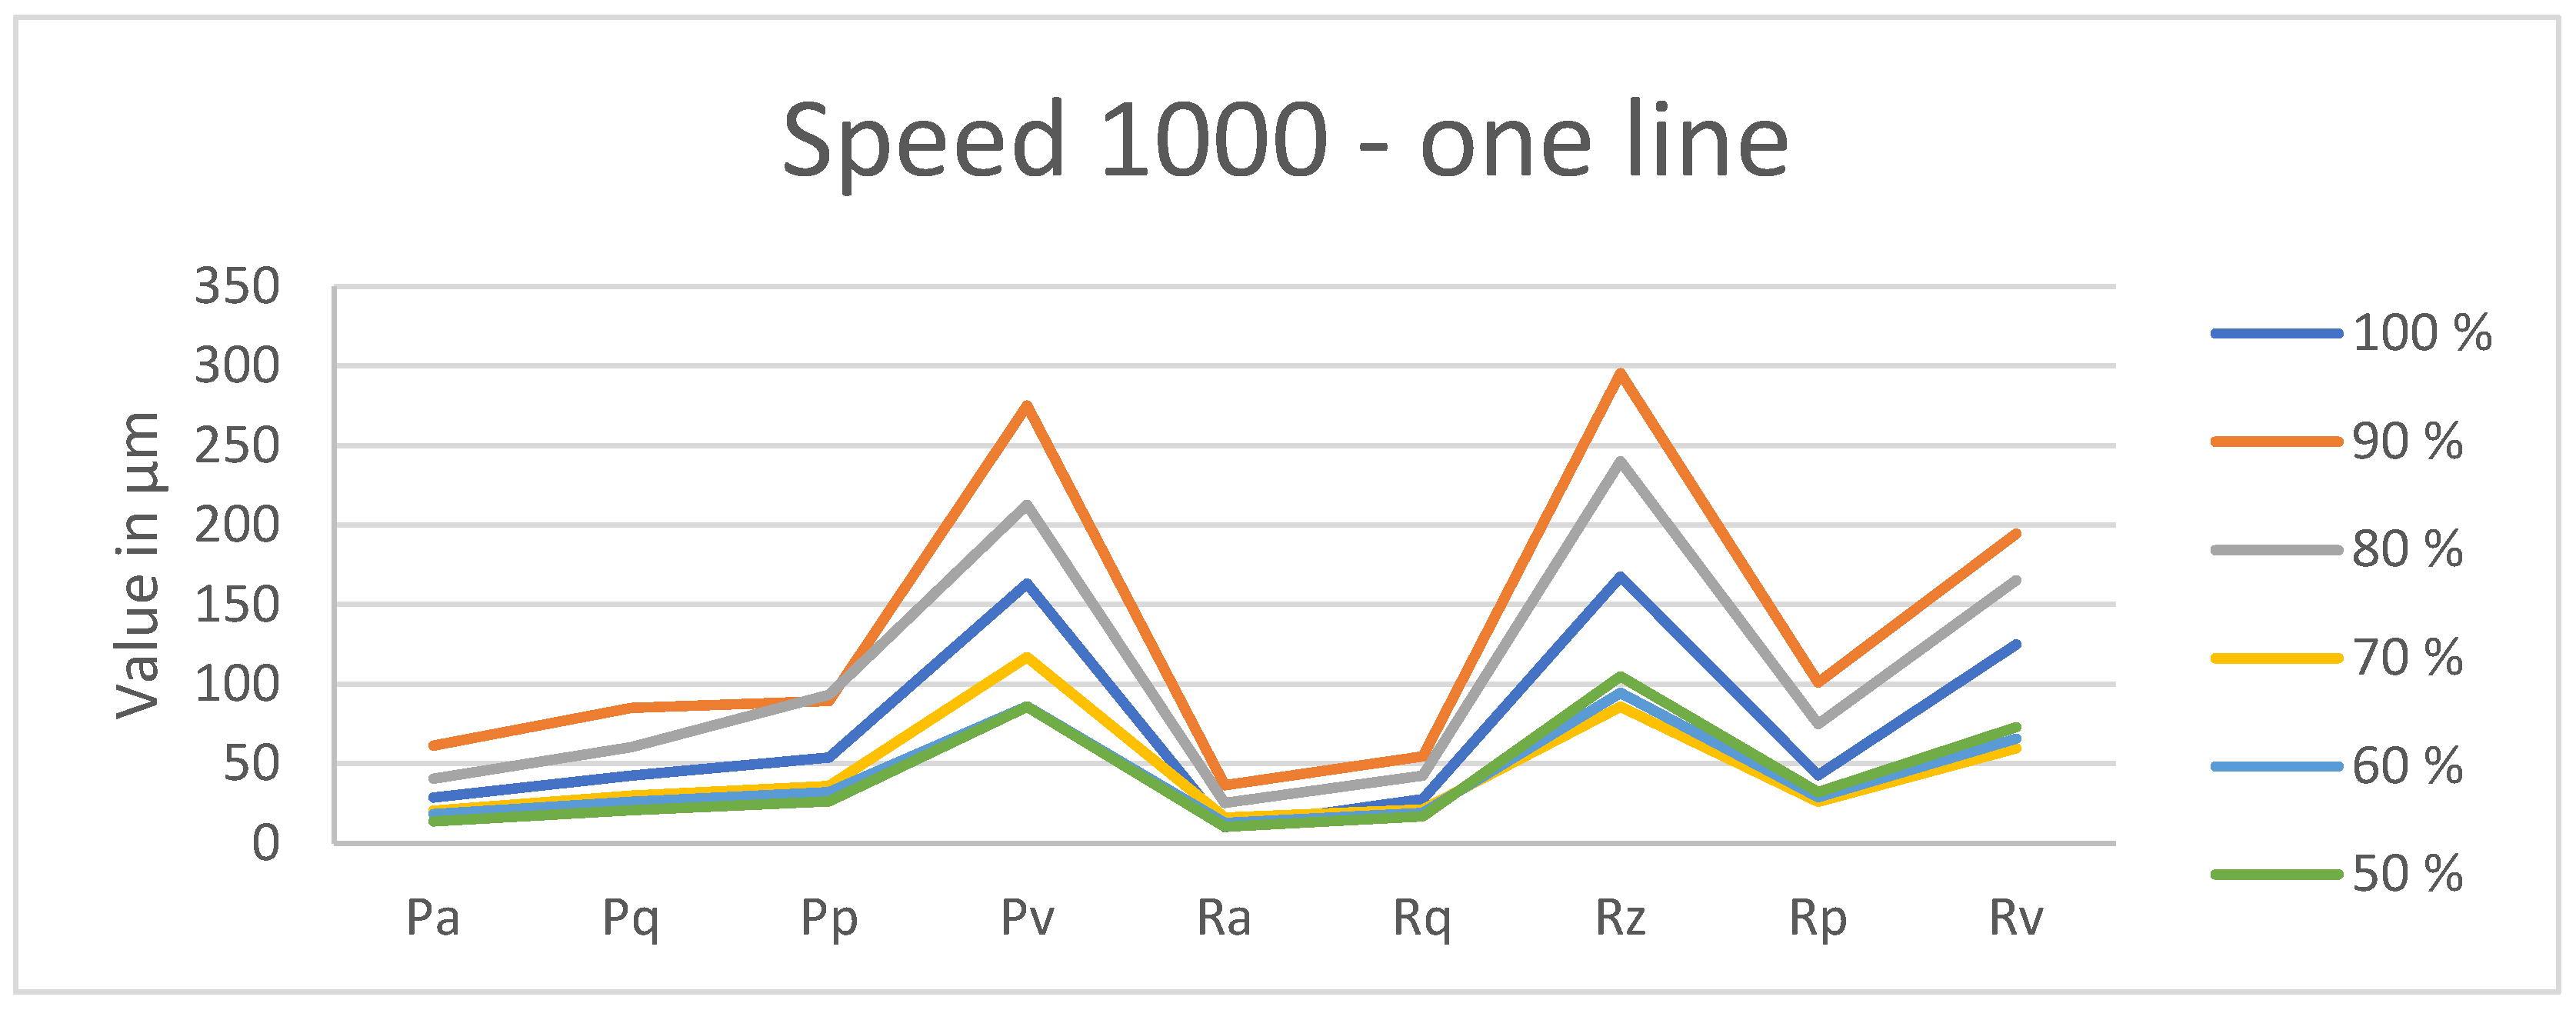
From these data, a notable trend in the parameters is observed. An example with a traveling speed of 1000 mm/min and different laser power levels is shown in
Table 5 and
Figure 15.
For the single-line profile, it is evident that the most sensitive parameter to changes in laser power is as follows:
For profile measurement,
Pv ishe most sensitive parameter to changes in laser power is the maximum height of the valley within a sampling length [
15,
16,
17];
For roughness measurement,
Rz on the same profile is the most sensitive parameter is the sum of the height of the largest profile peak and the depth of the largest profile valley within a sampling length [
15,
16,
17,
18].
It is common to relate Pv with Rv, as their meanings are similar. However, the relevance of the data provides experimental evidence that the Pv and Rz parameters are preferred for better characterization of the material behavior in response to changes in laser power (see
Figure 15).
Based on the plots in
Appendix C and
Appendix D, it is concluded that Rz appears to be a more appropriate parameter for characterizing the material’s response to laser engraving at different power settings.
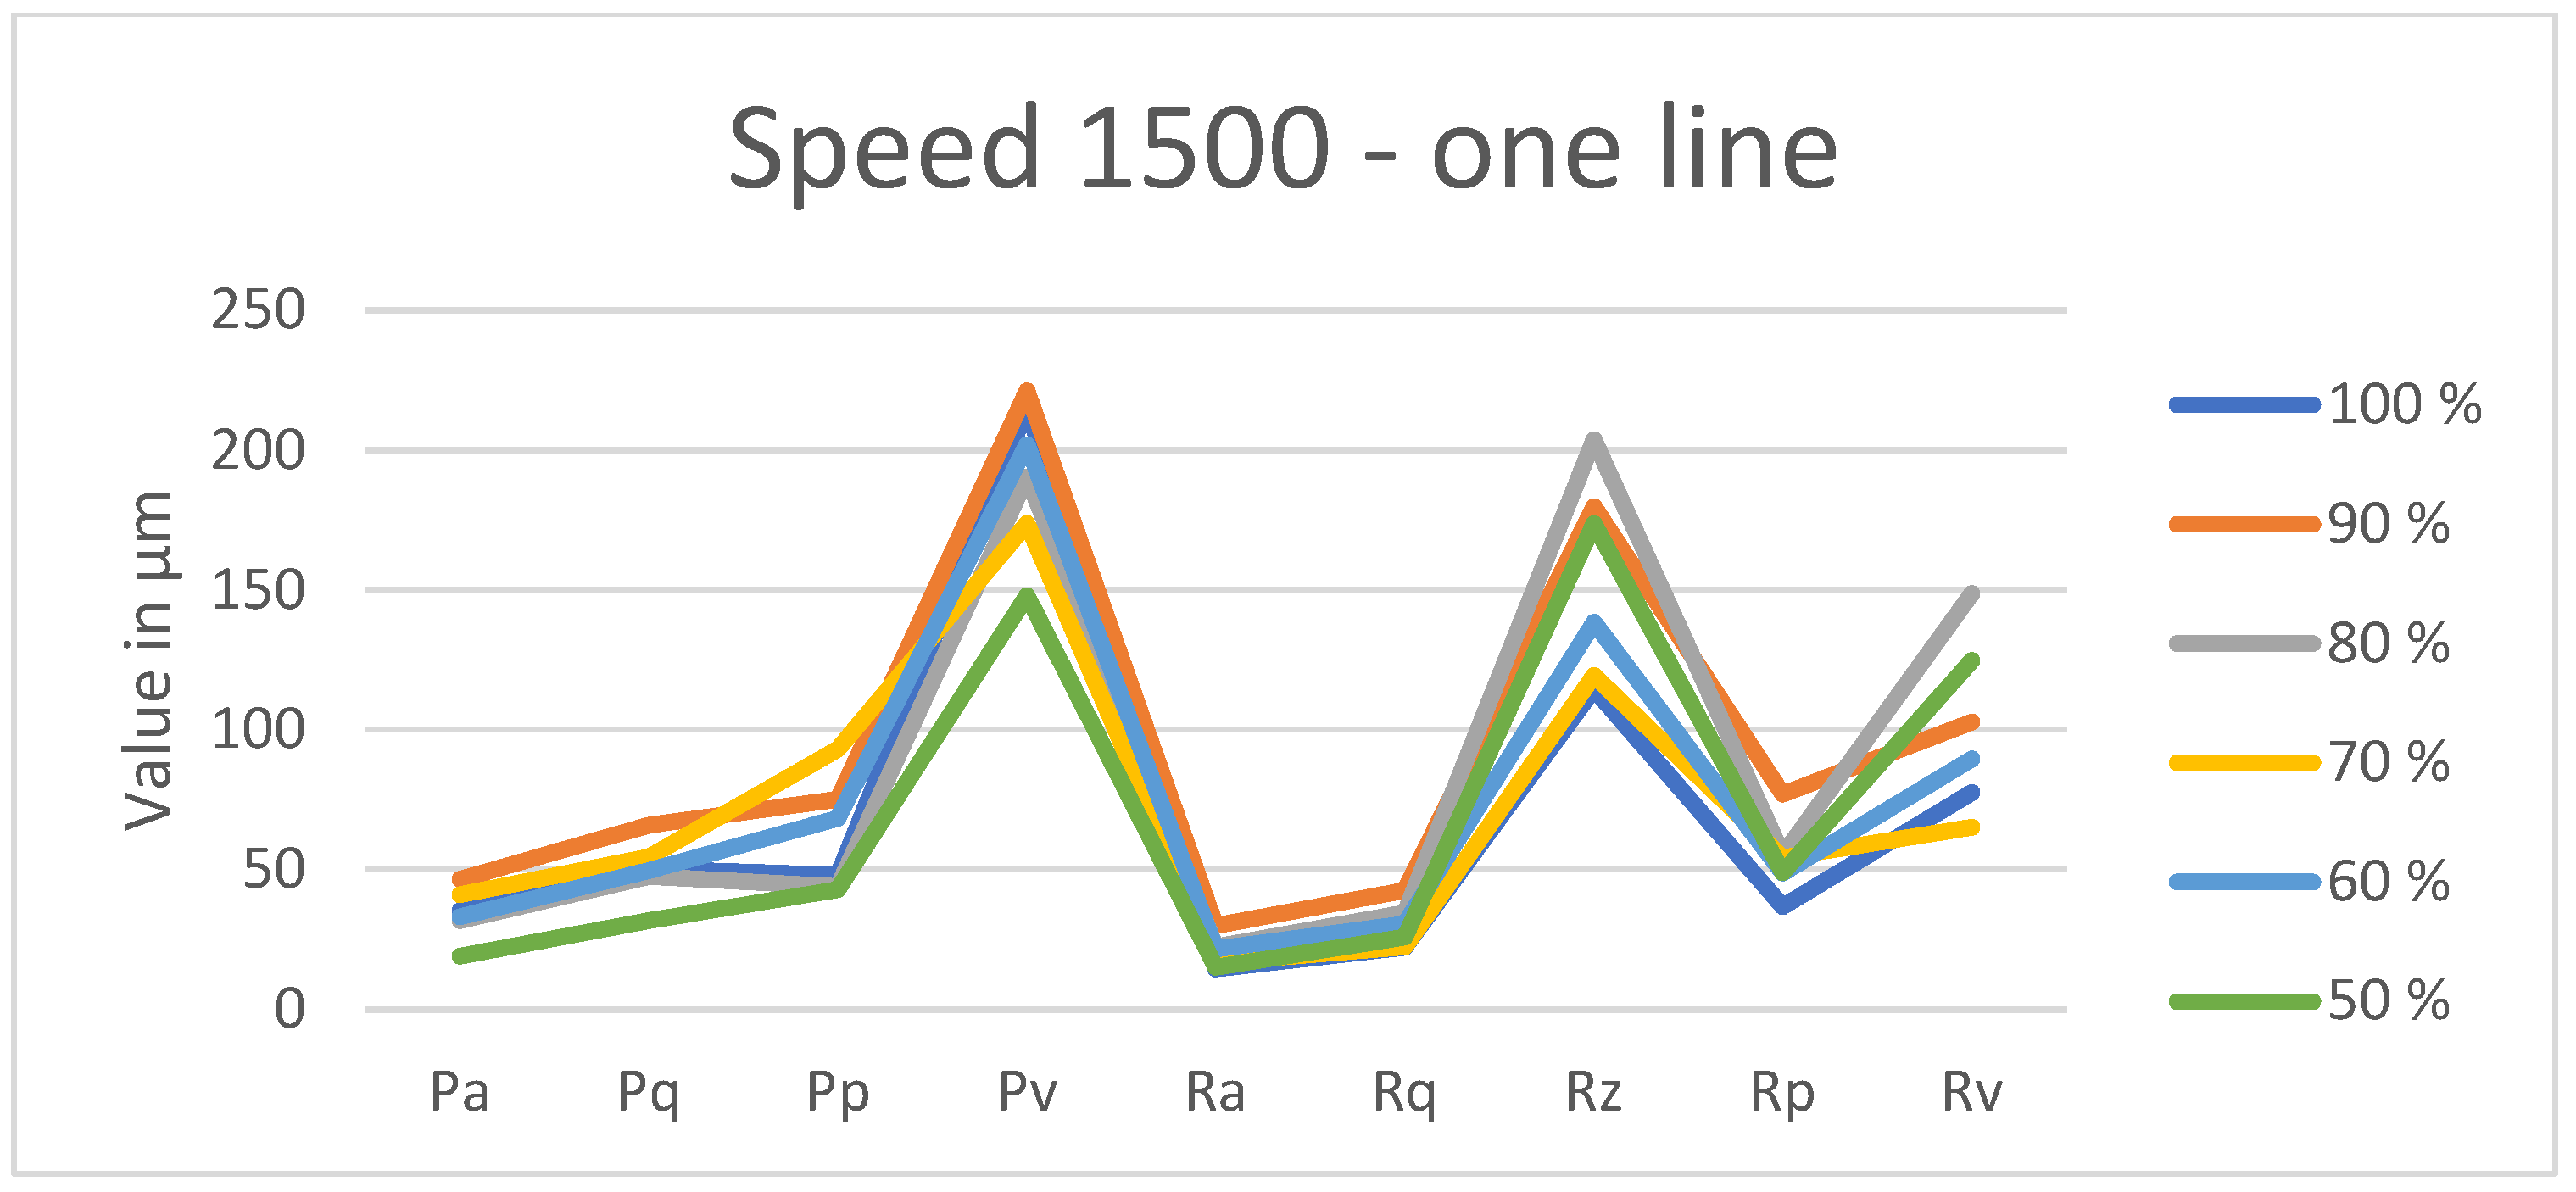
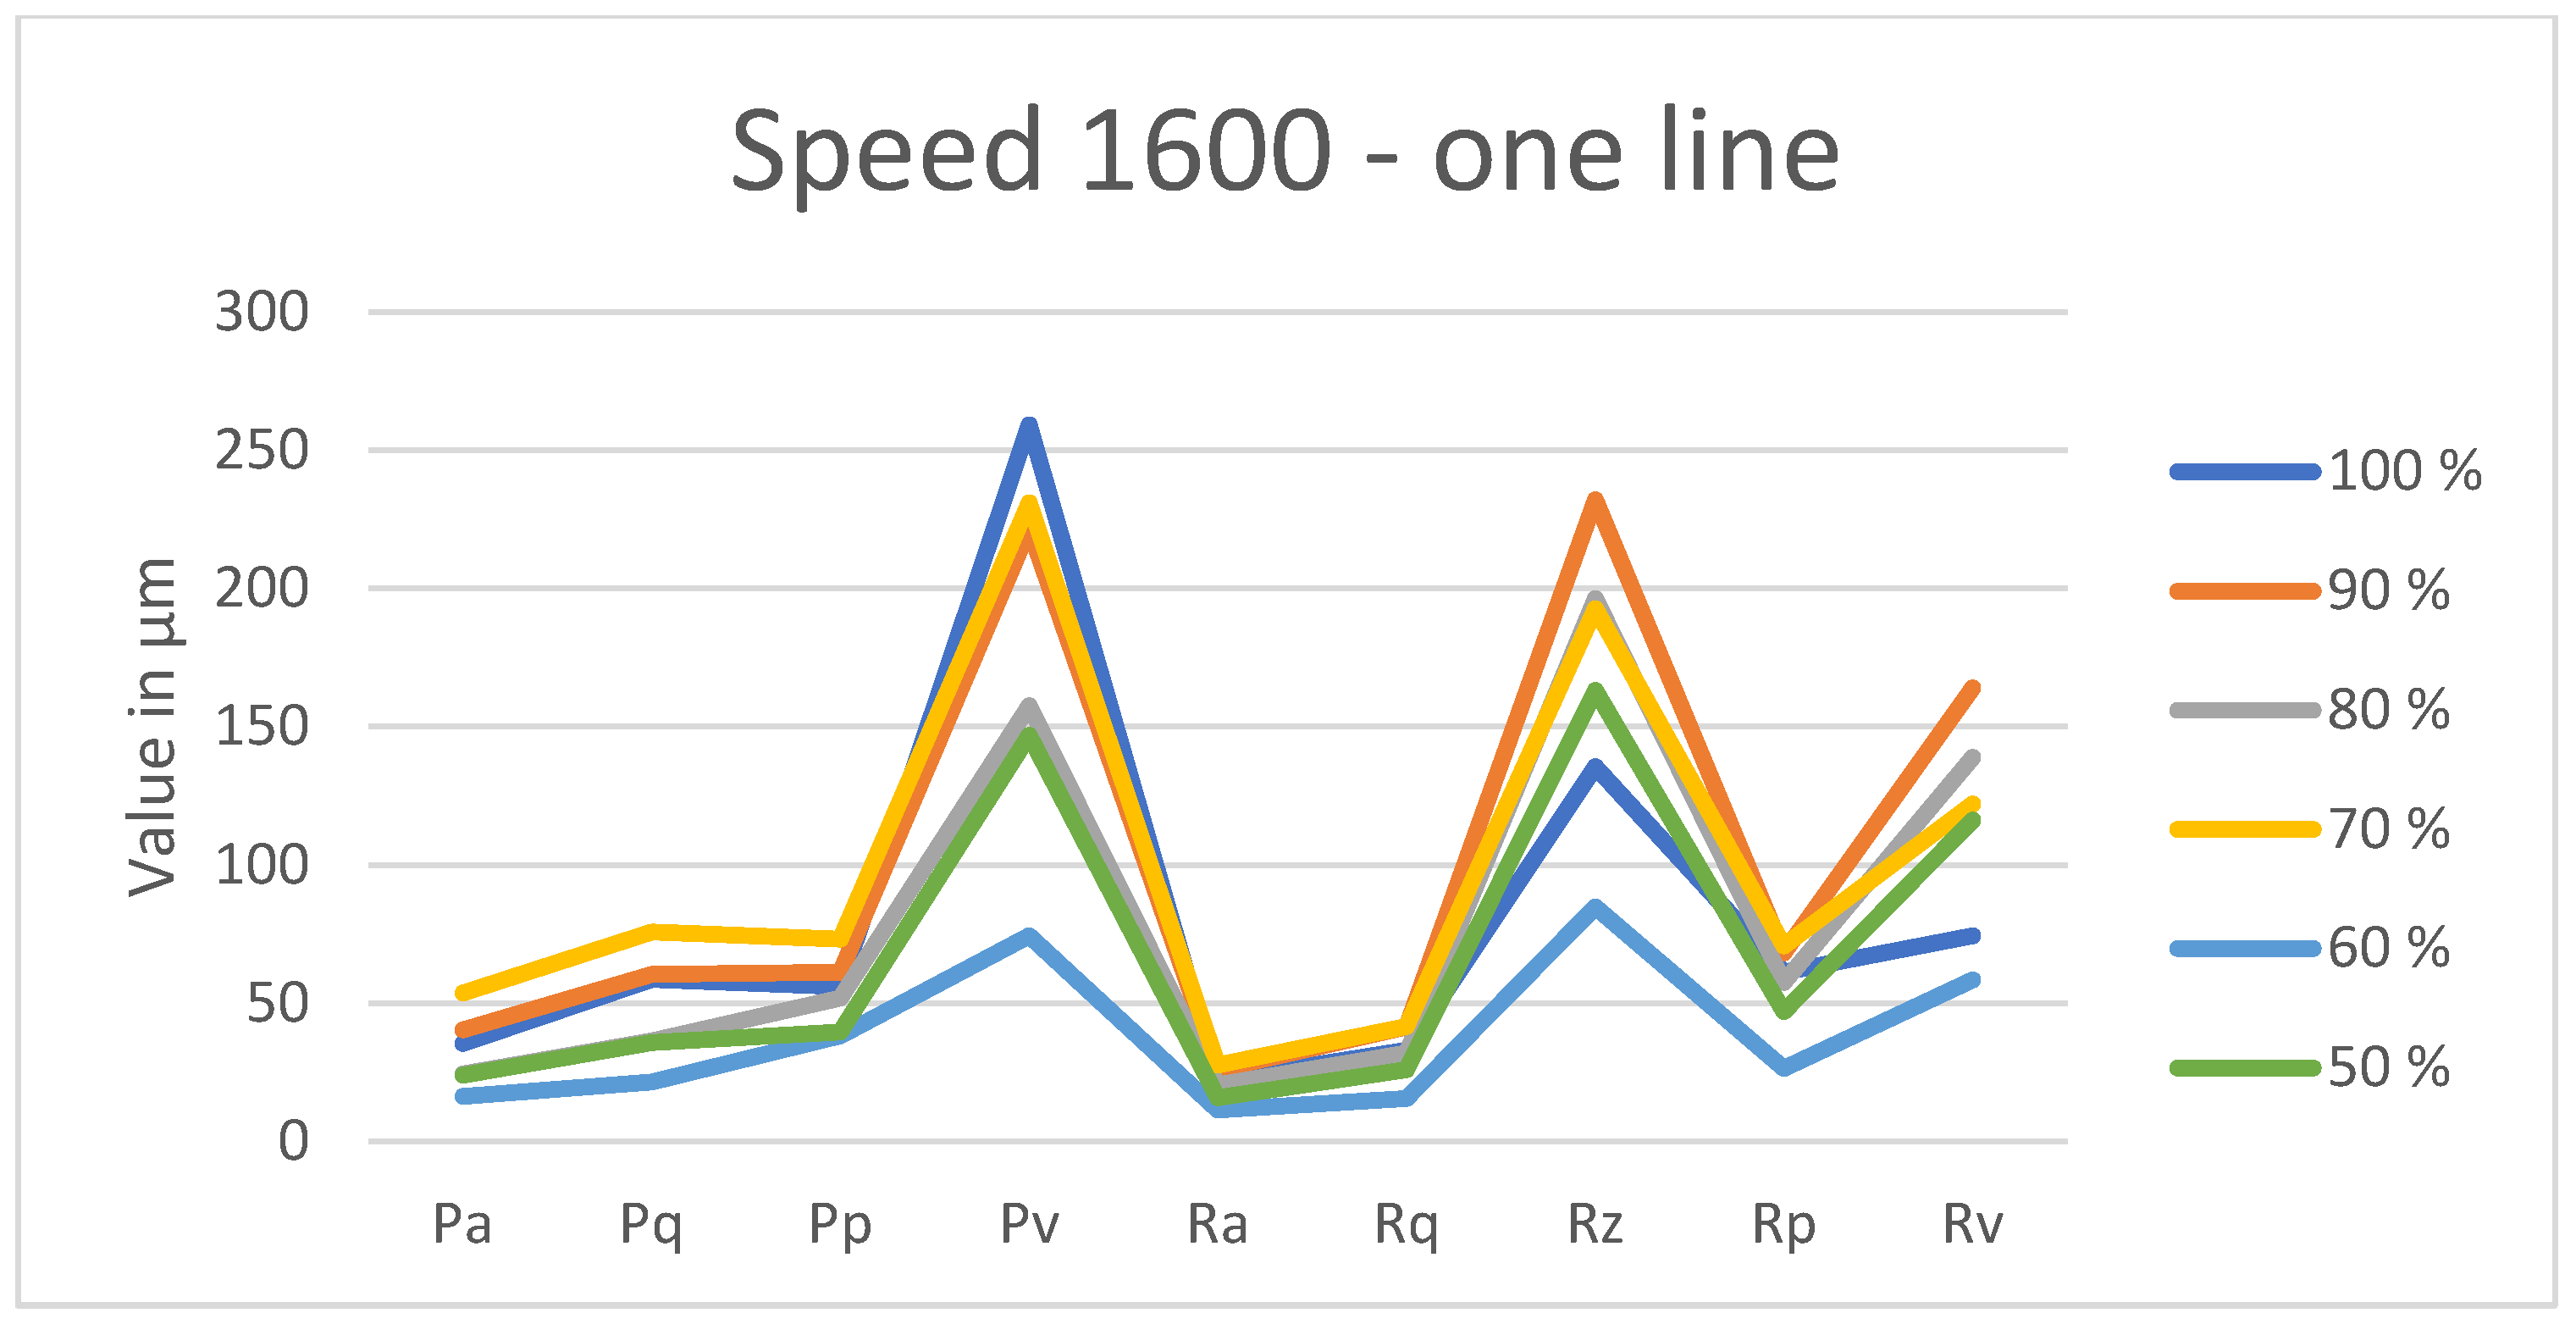
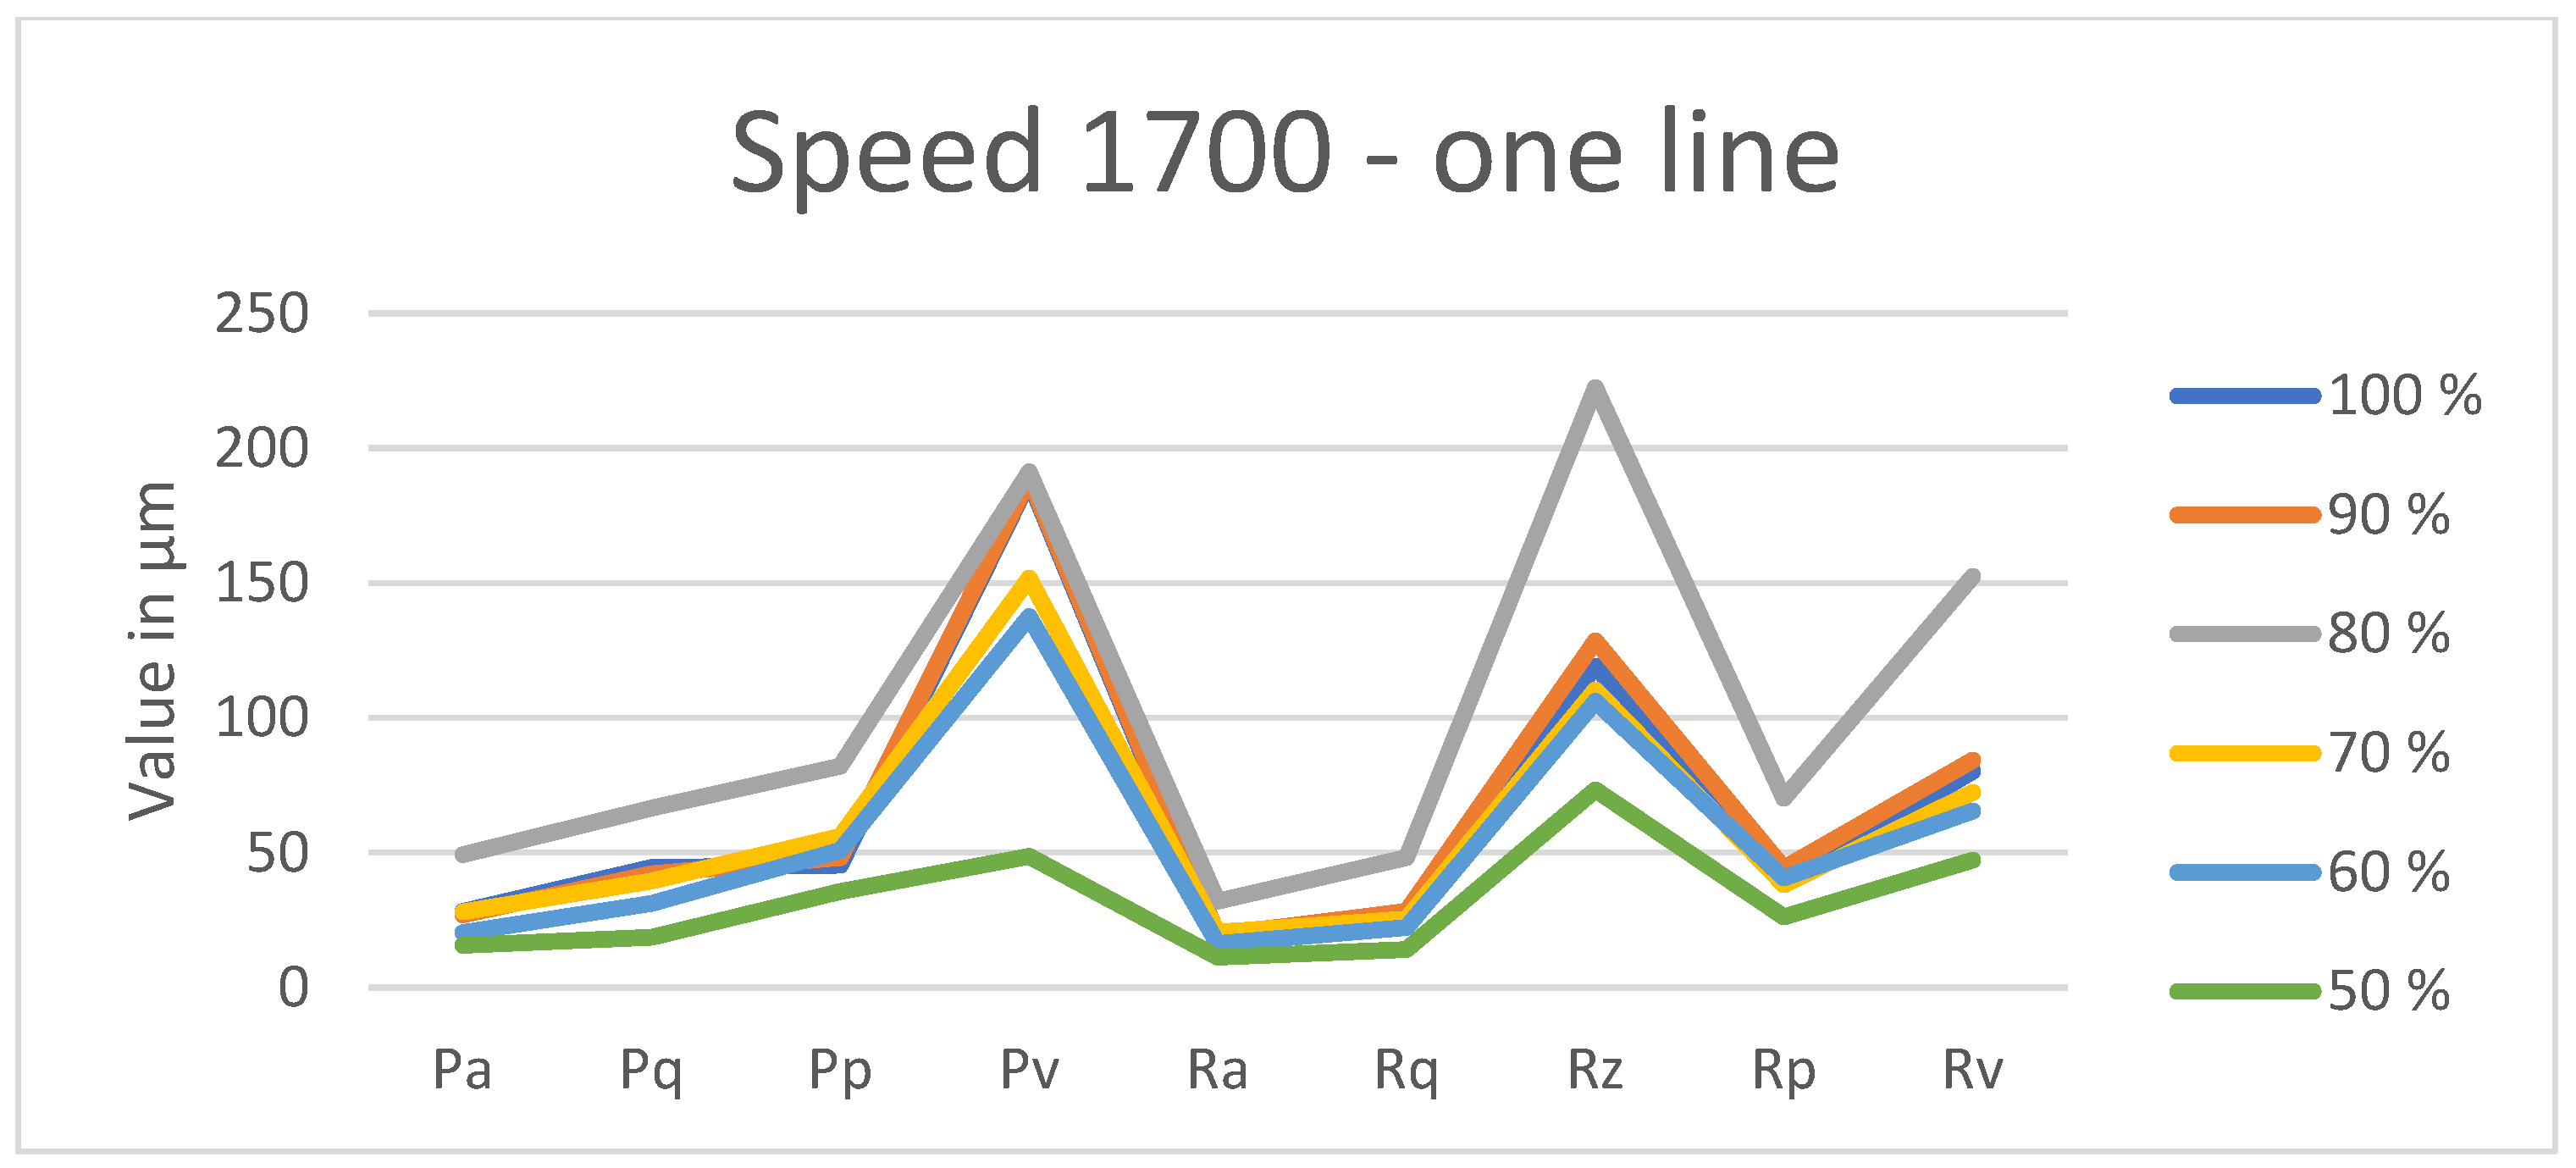
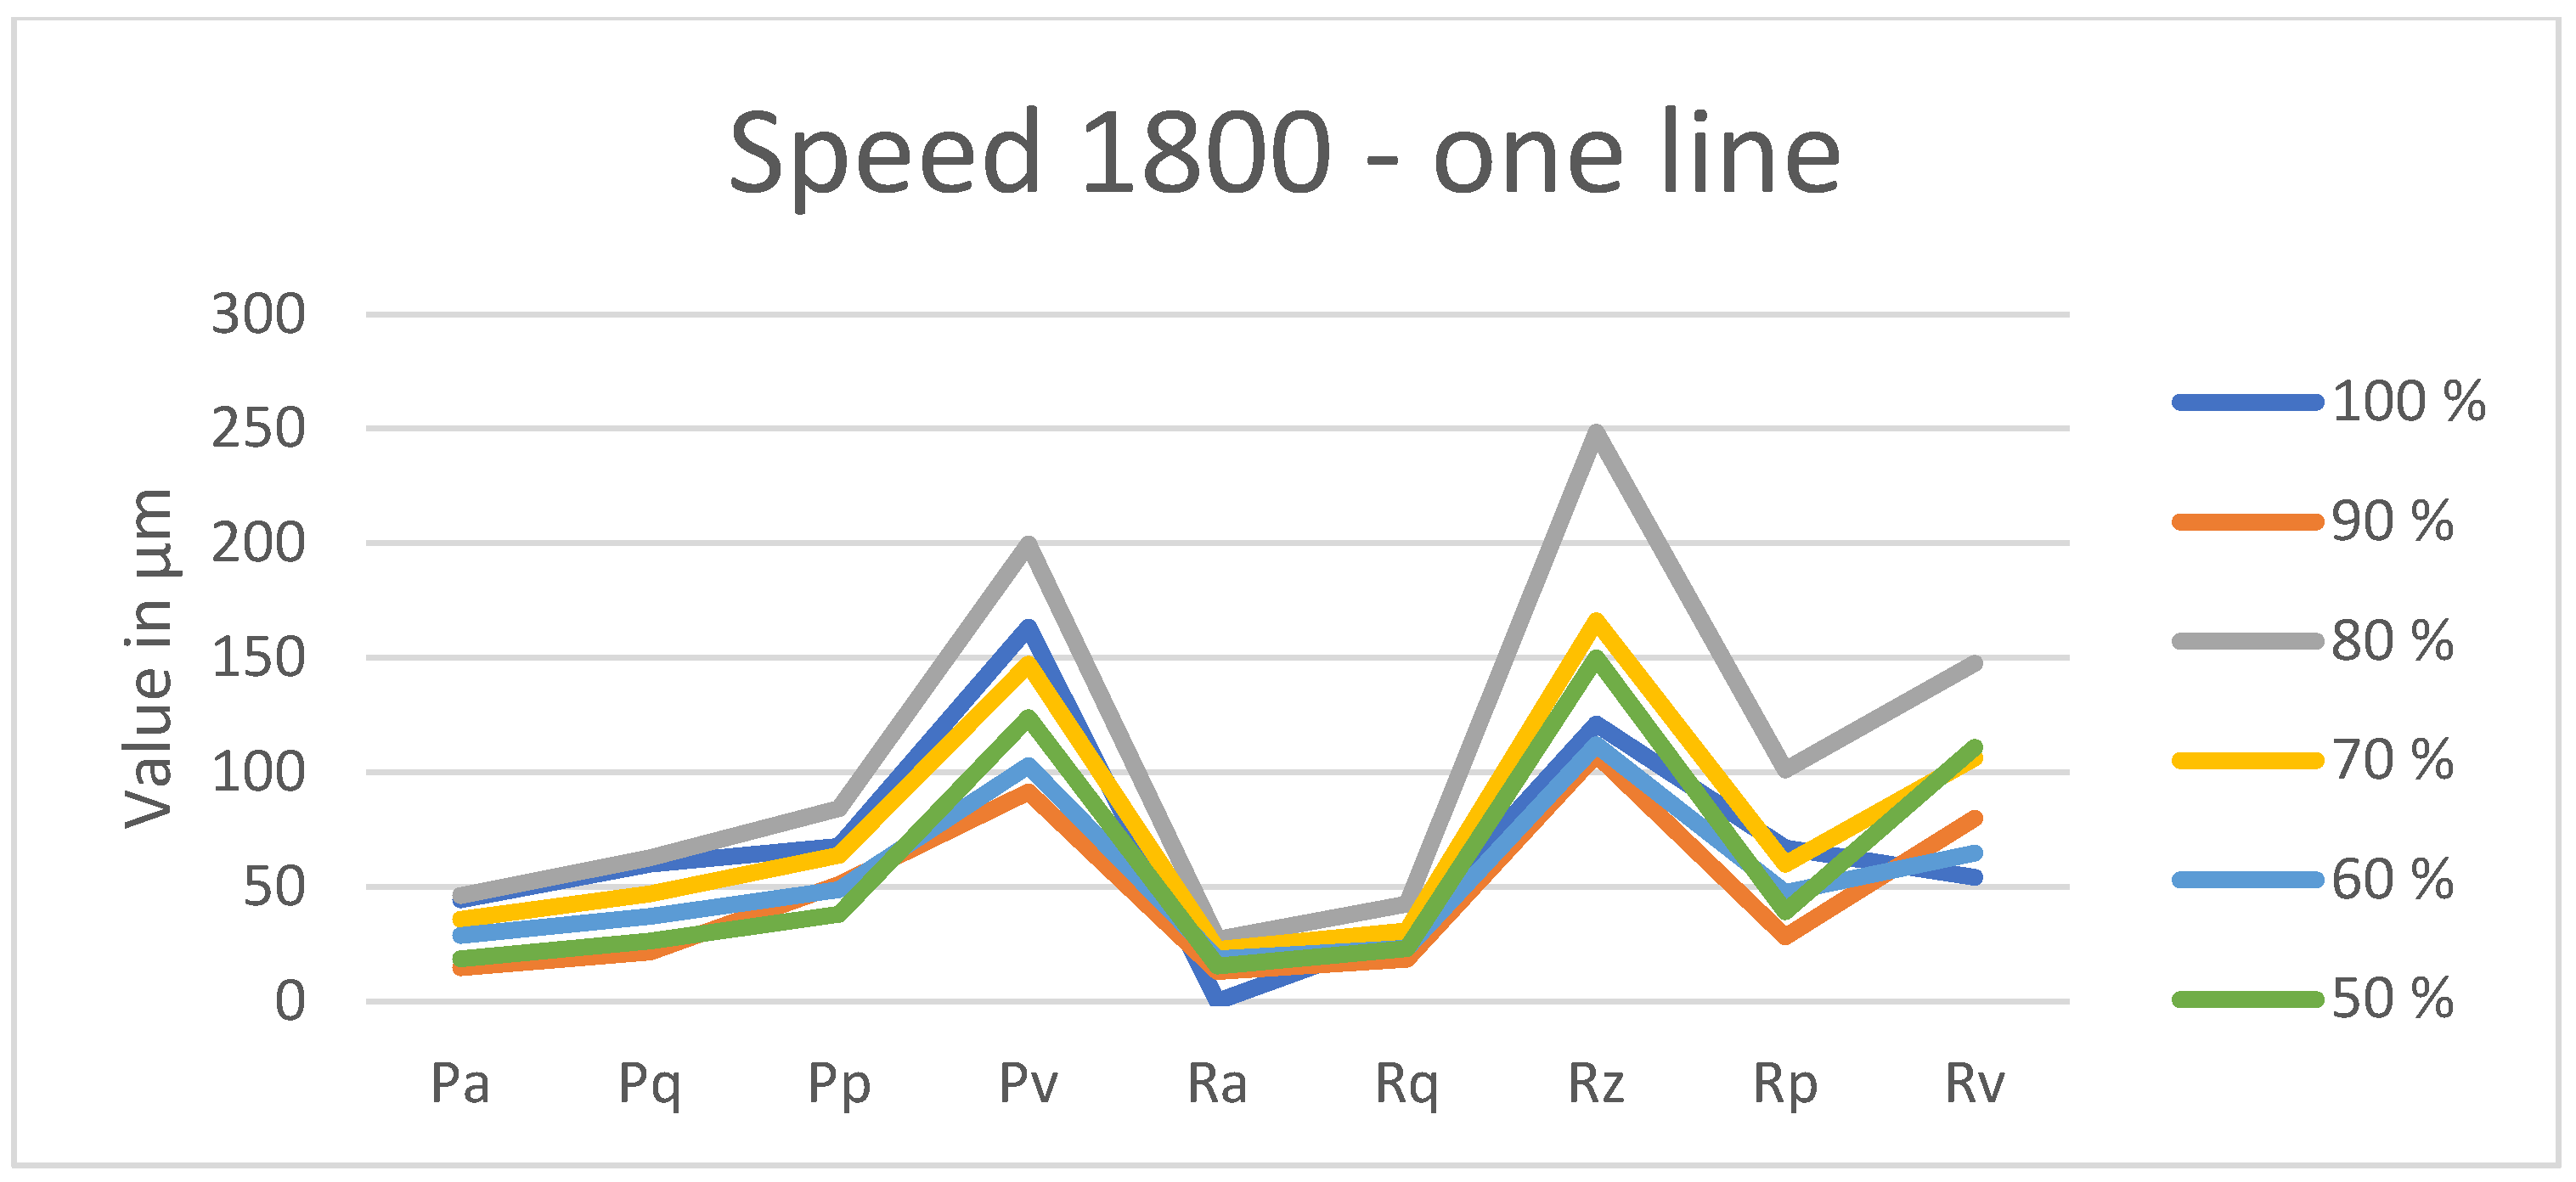
After selecting
Rz as the best representative parameter for quantitative characterization, it was important to study its behavior at a specific power but different speeds within the same plot. Relevant results are shown in
Figure 16 and
Figure 17.
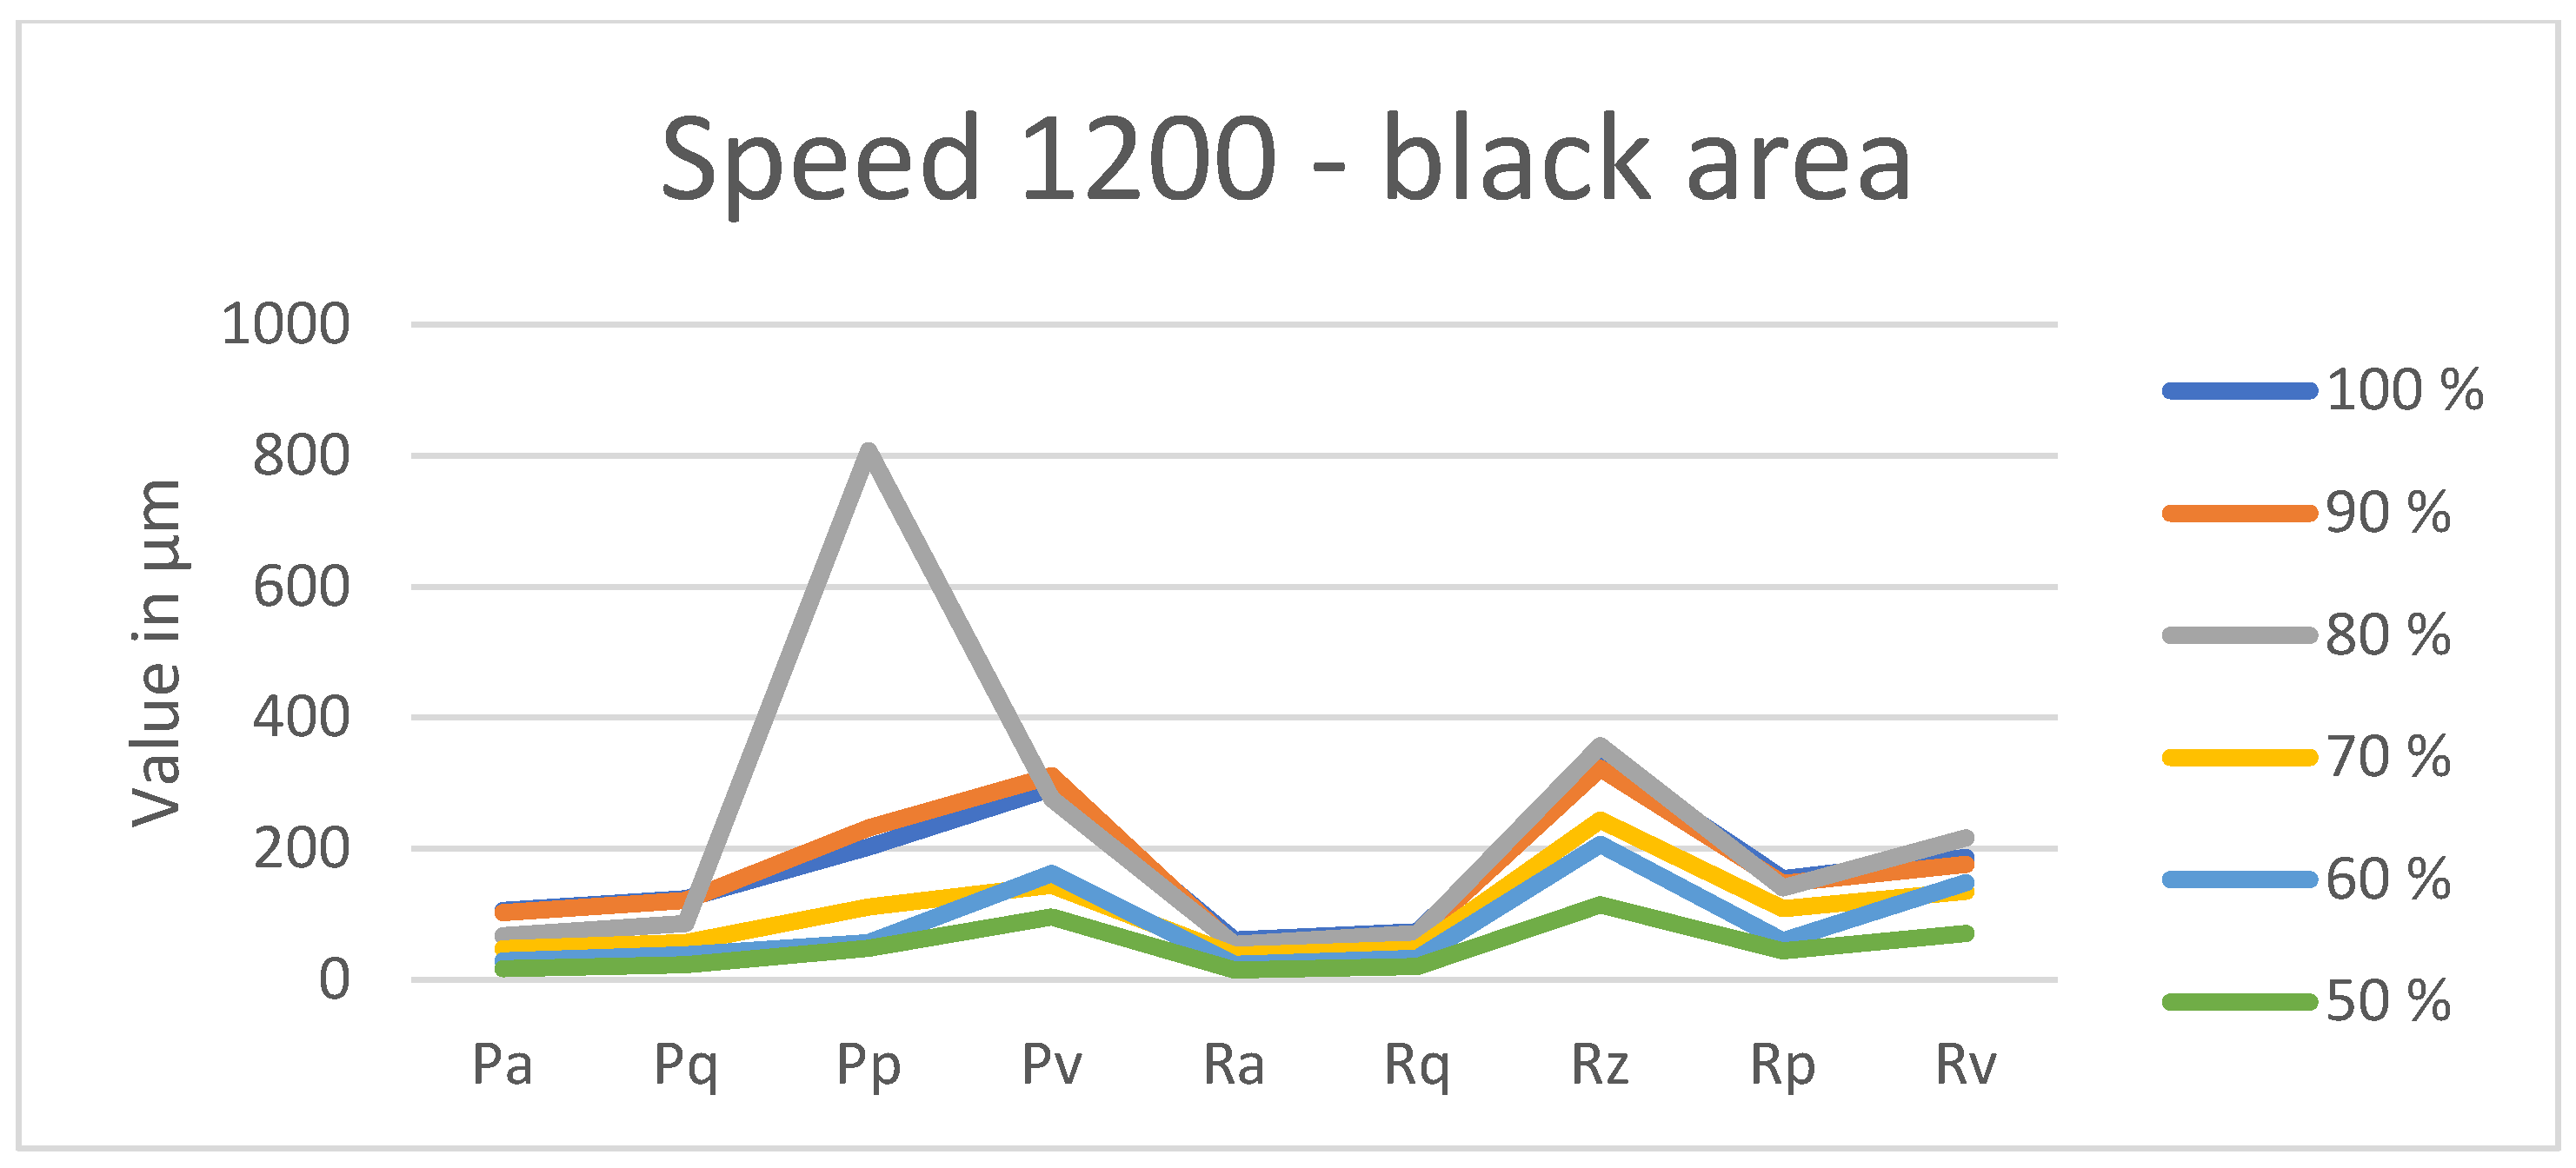
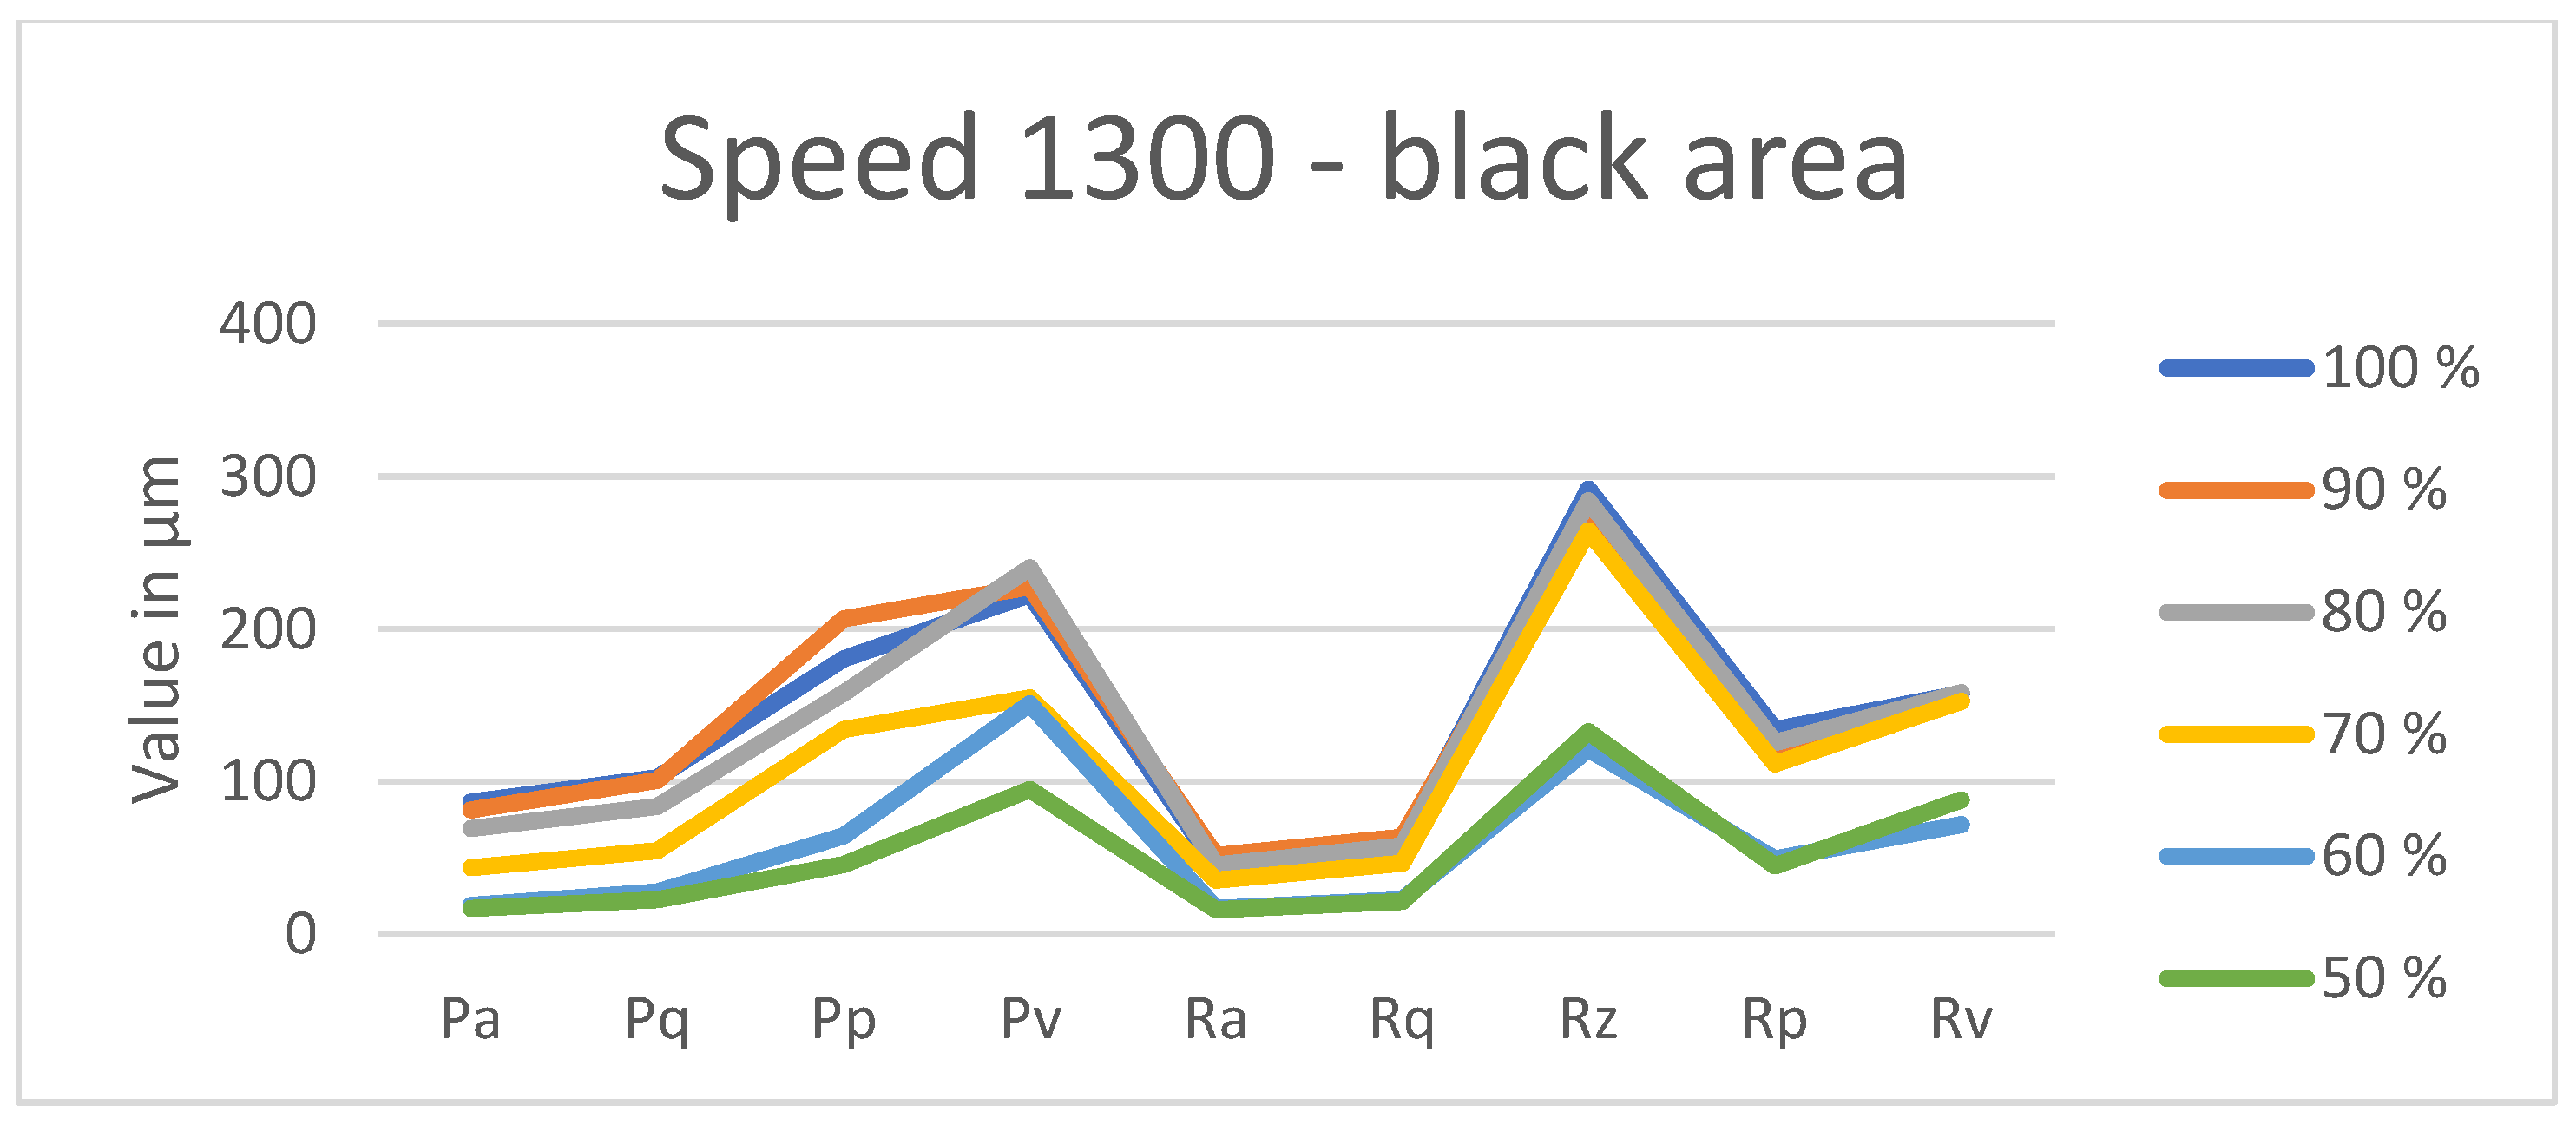
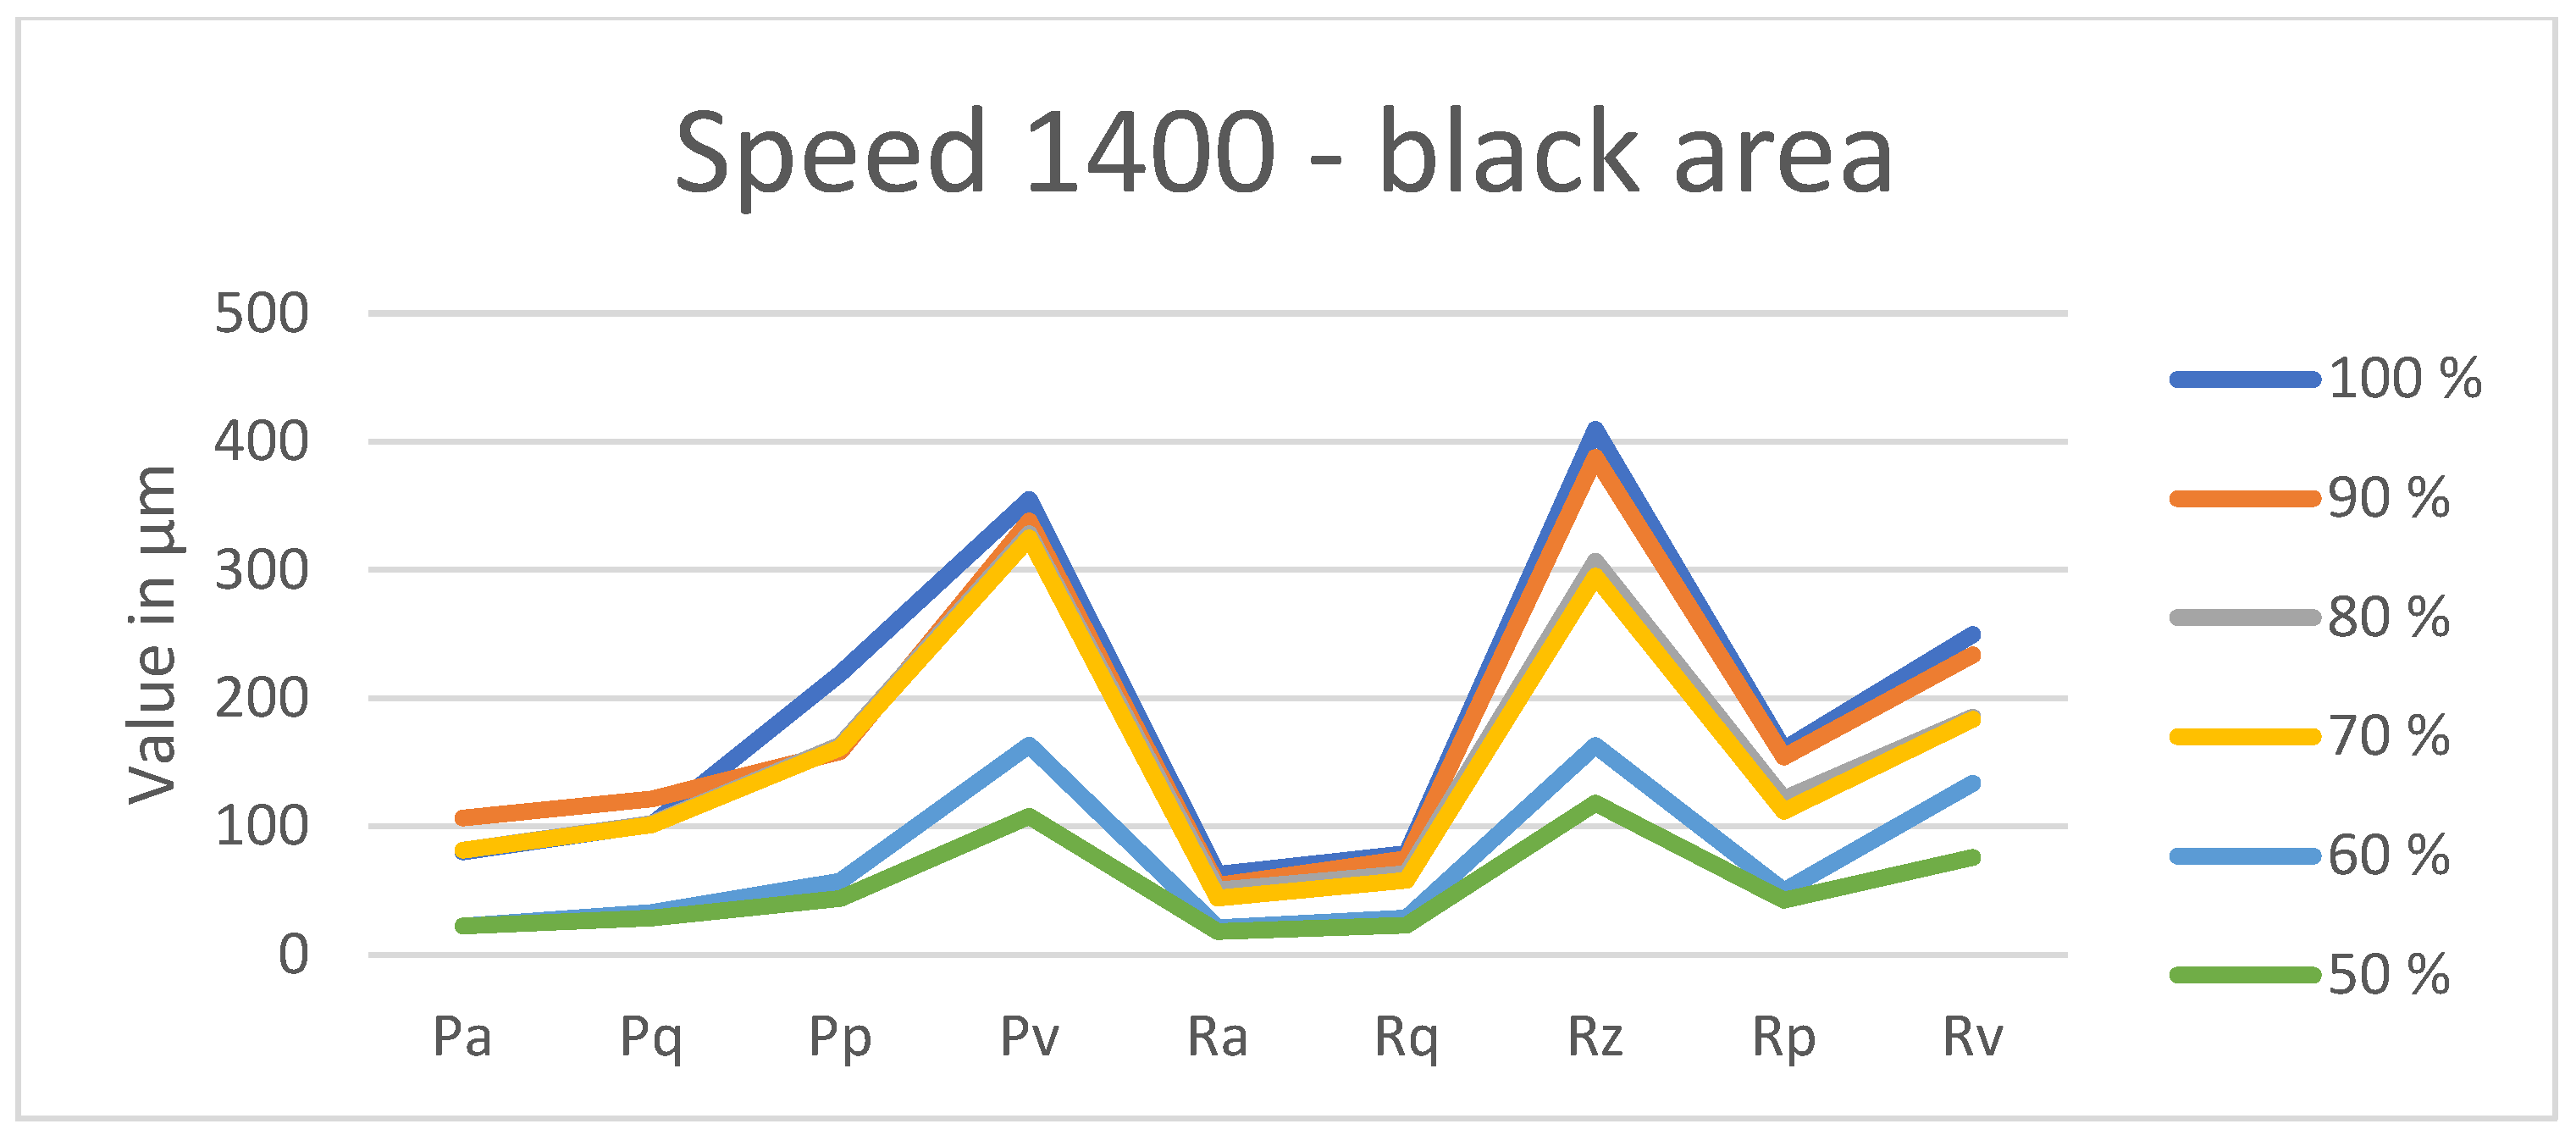
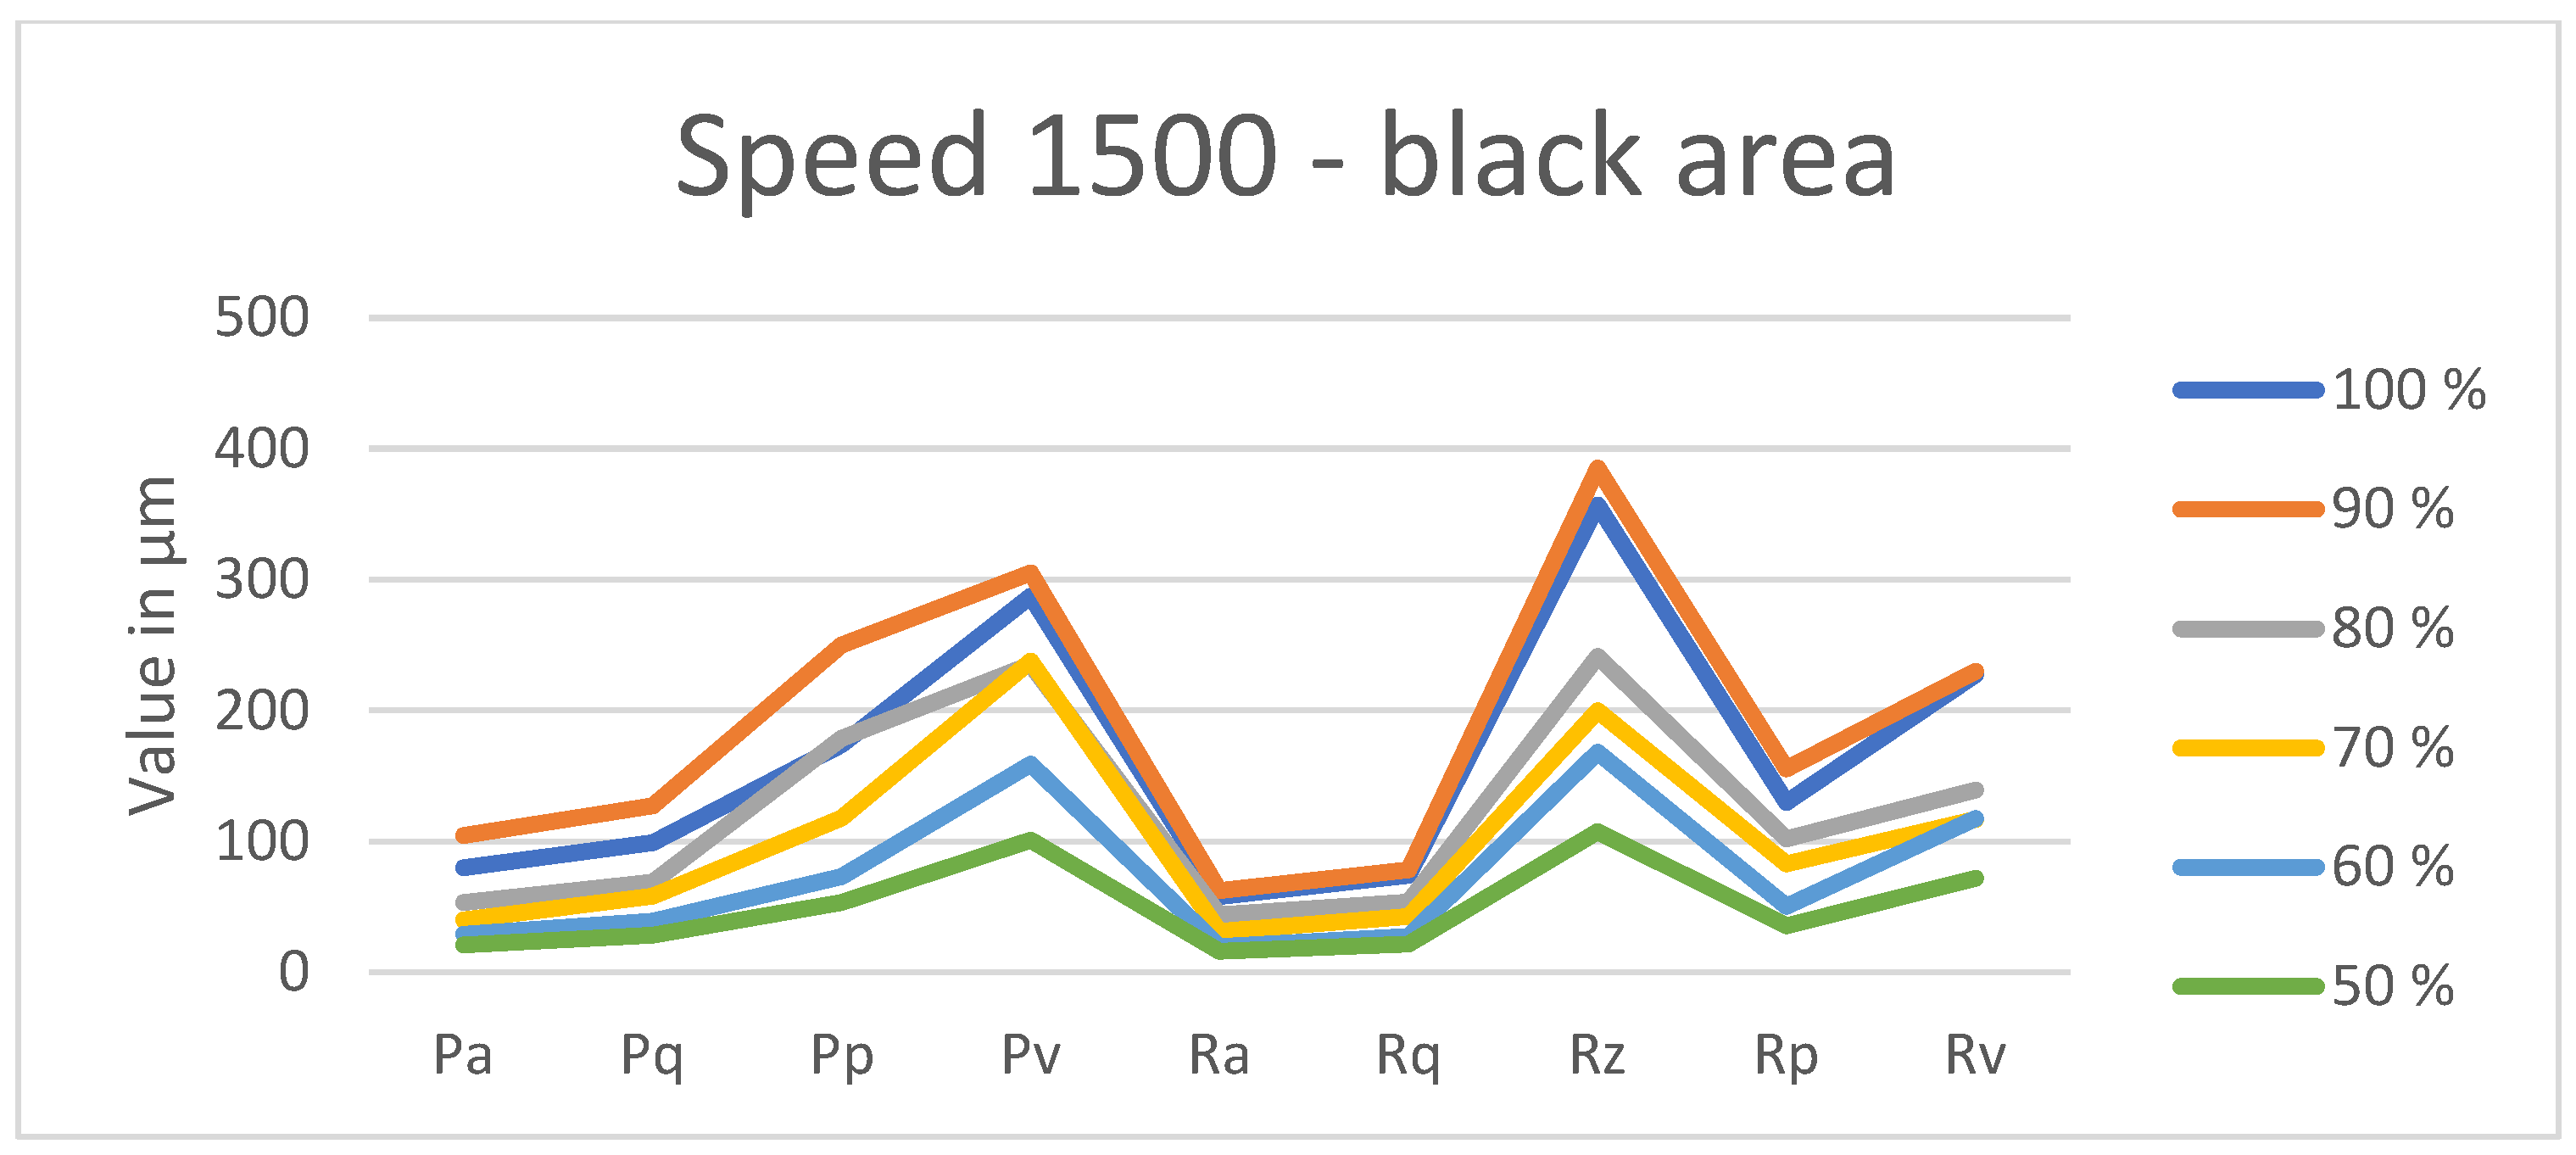
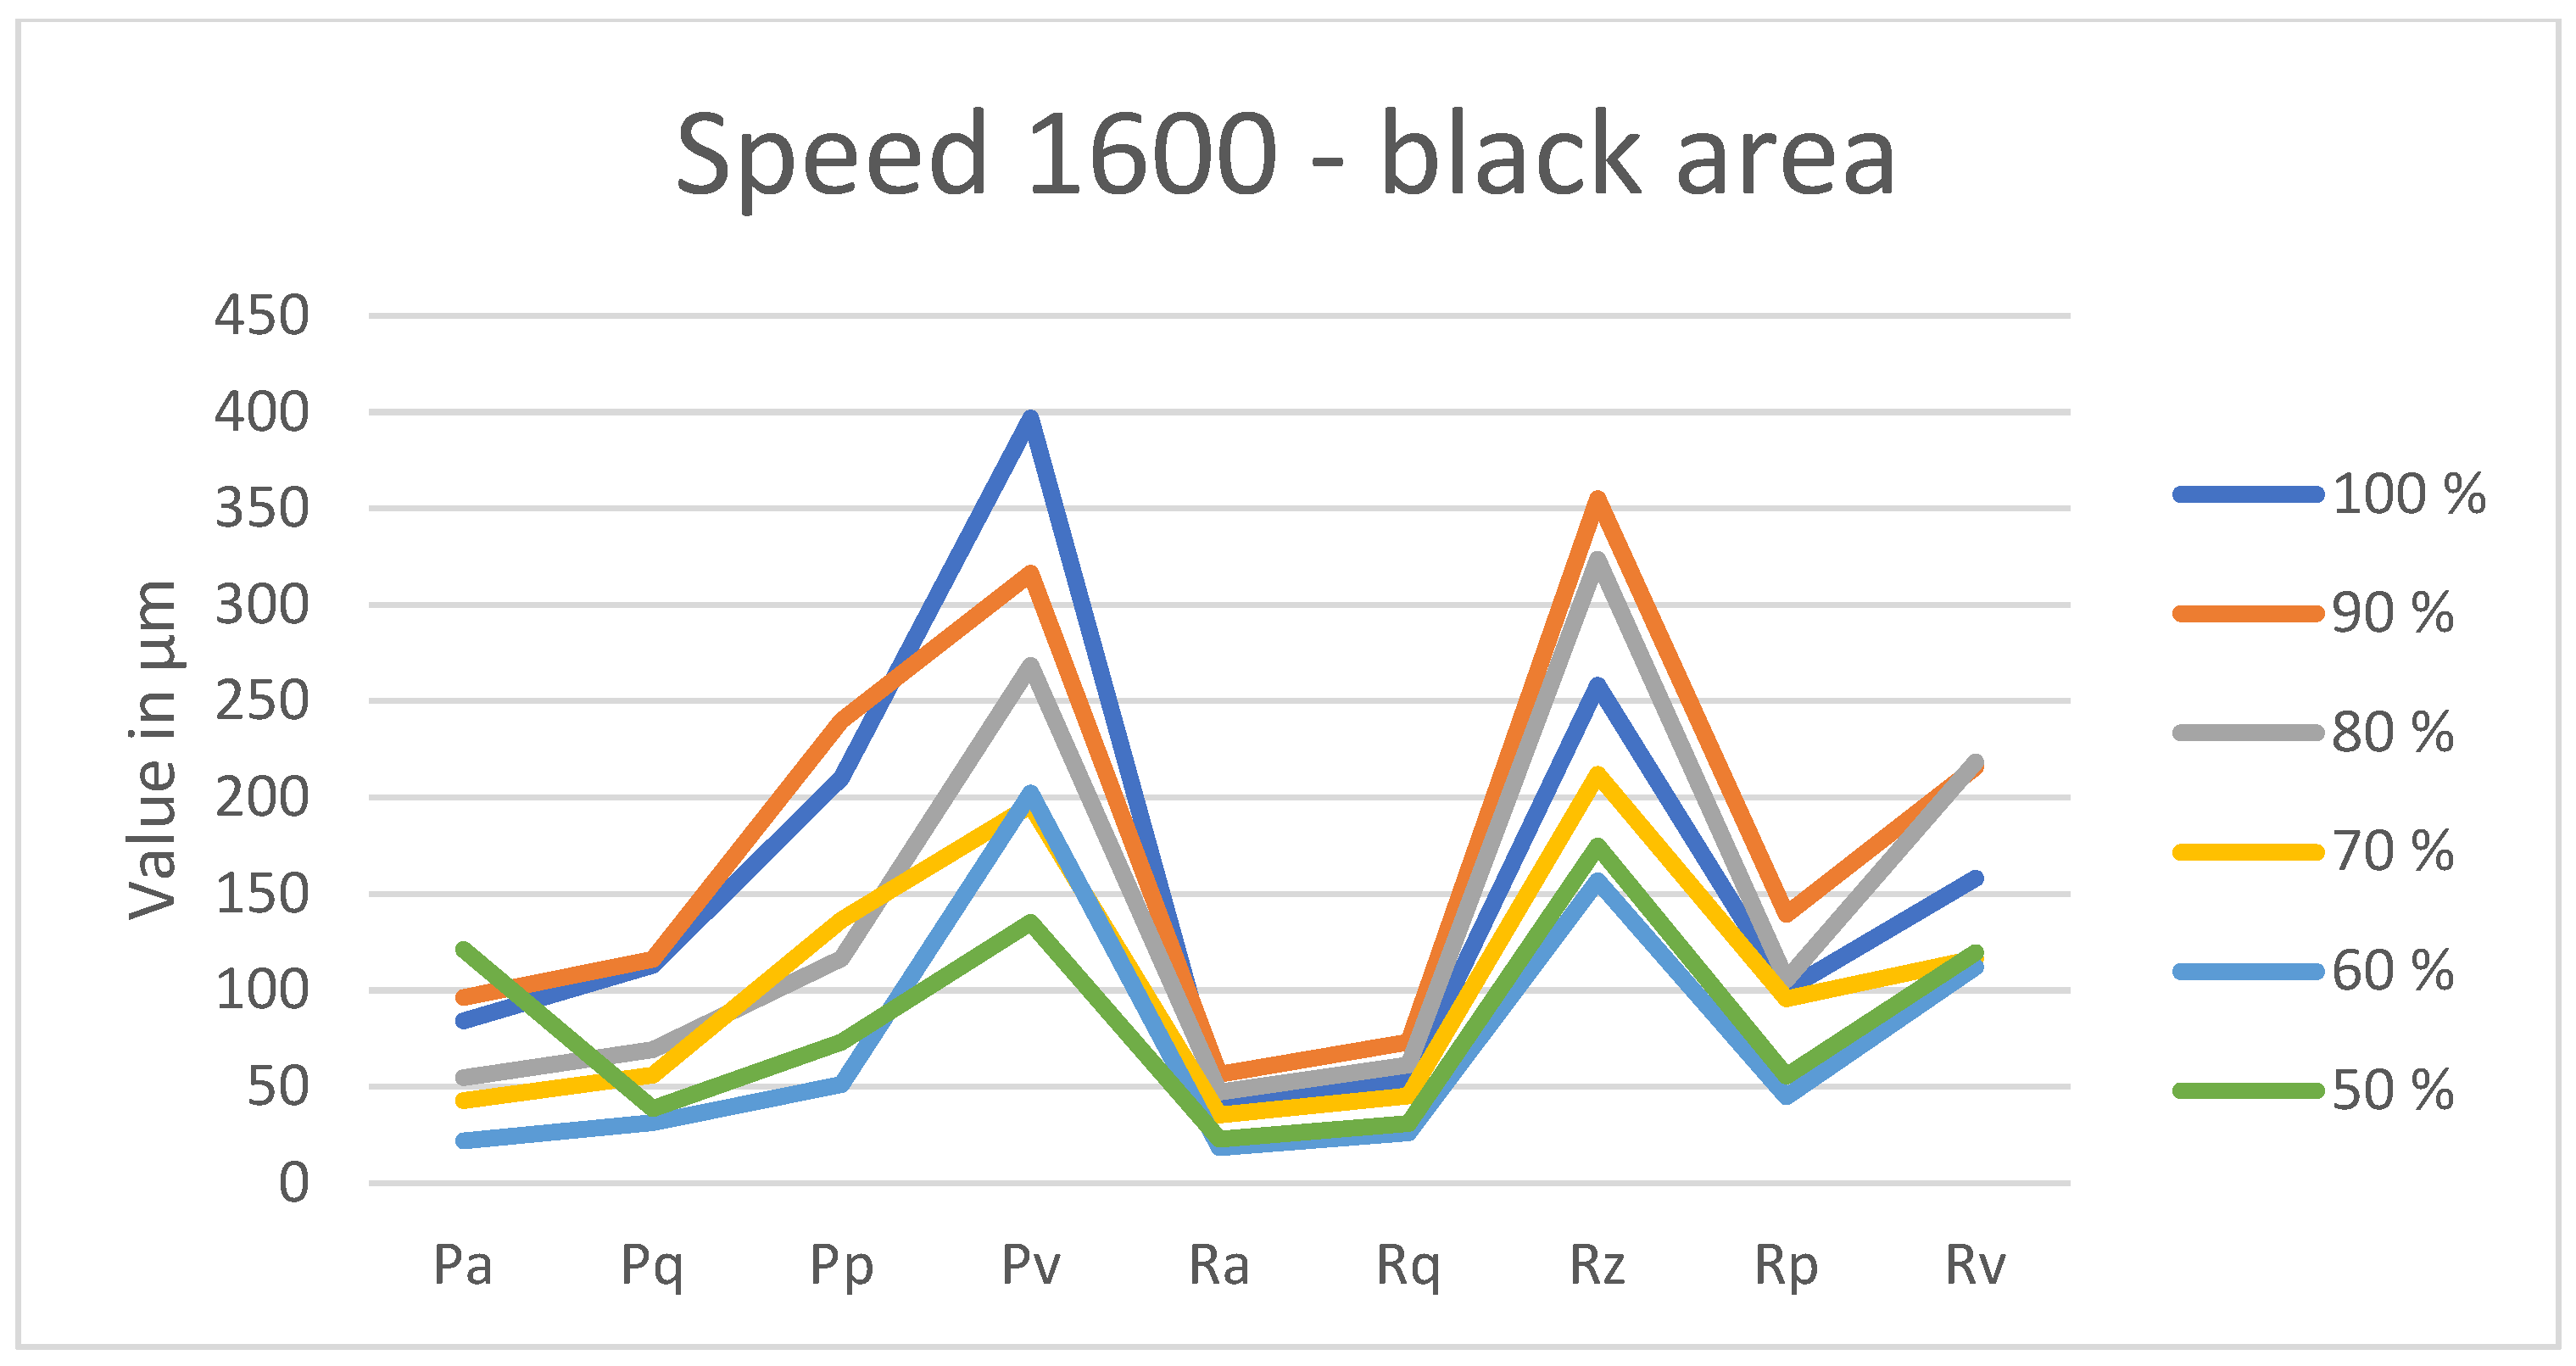
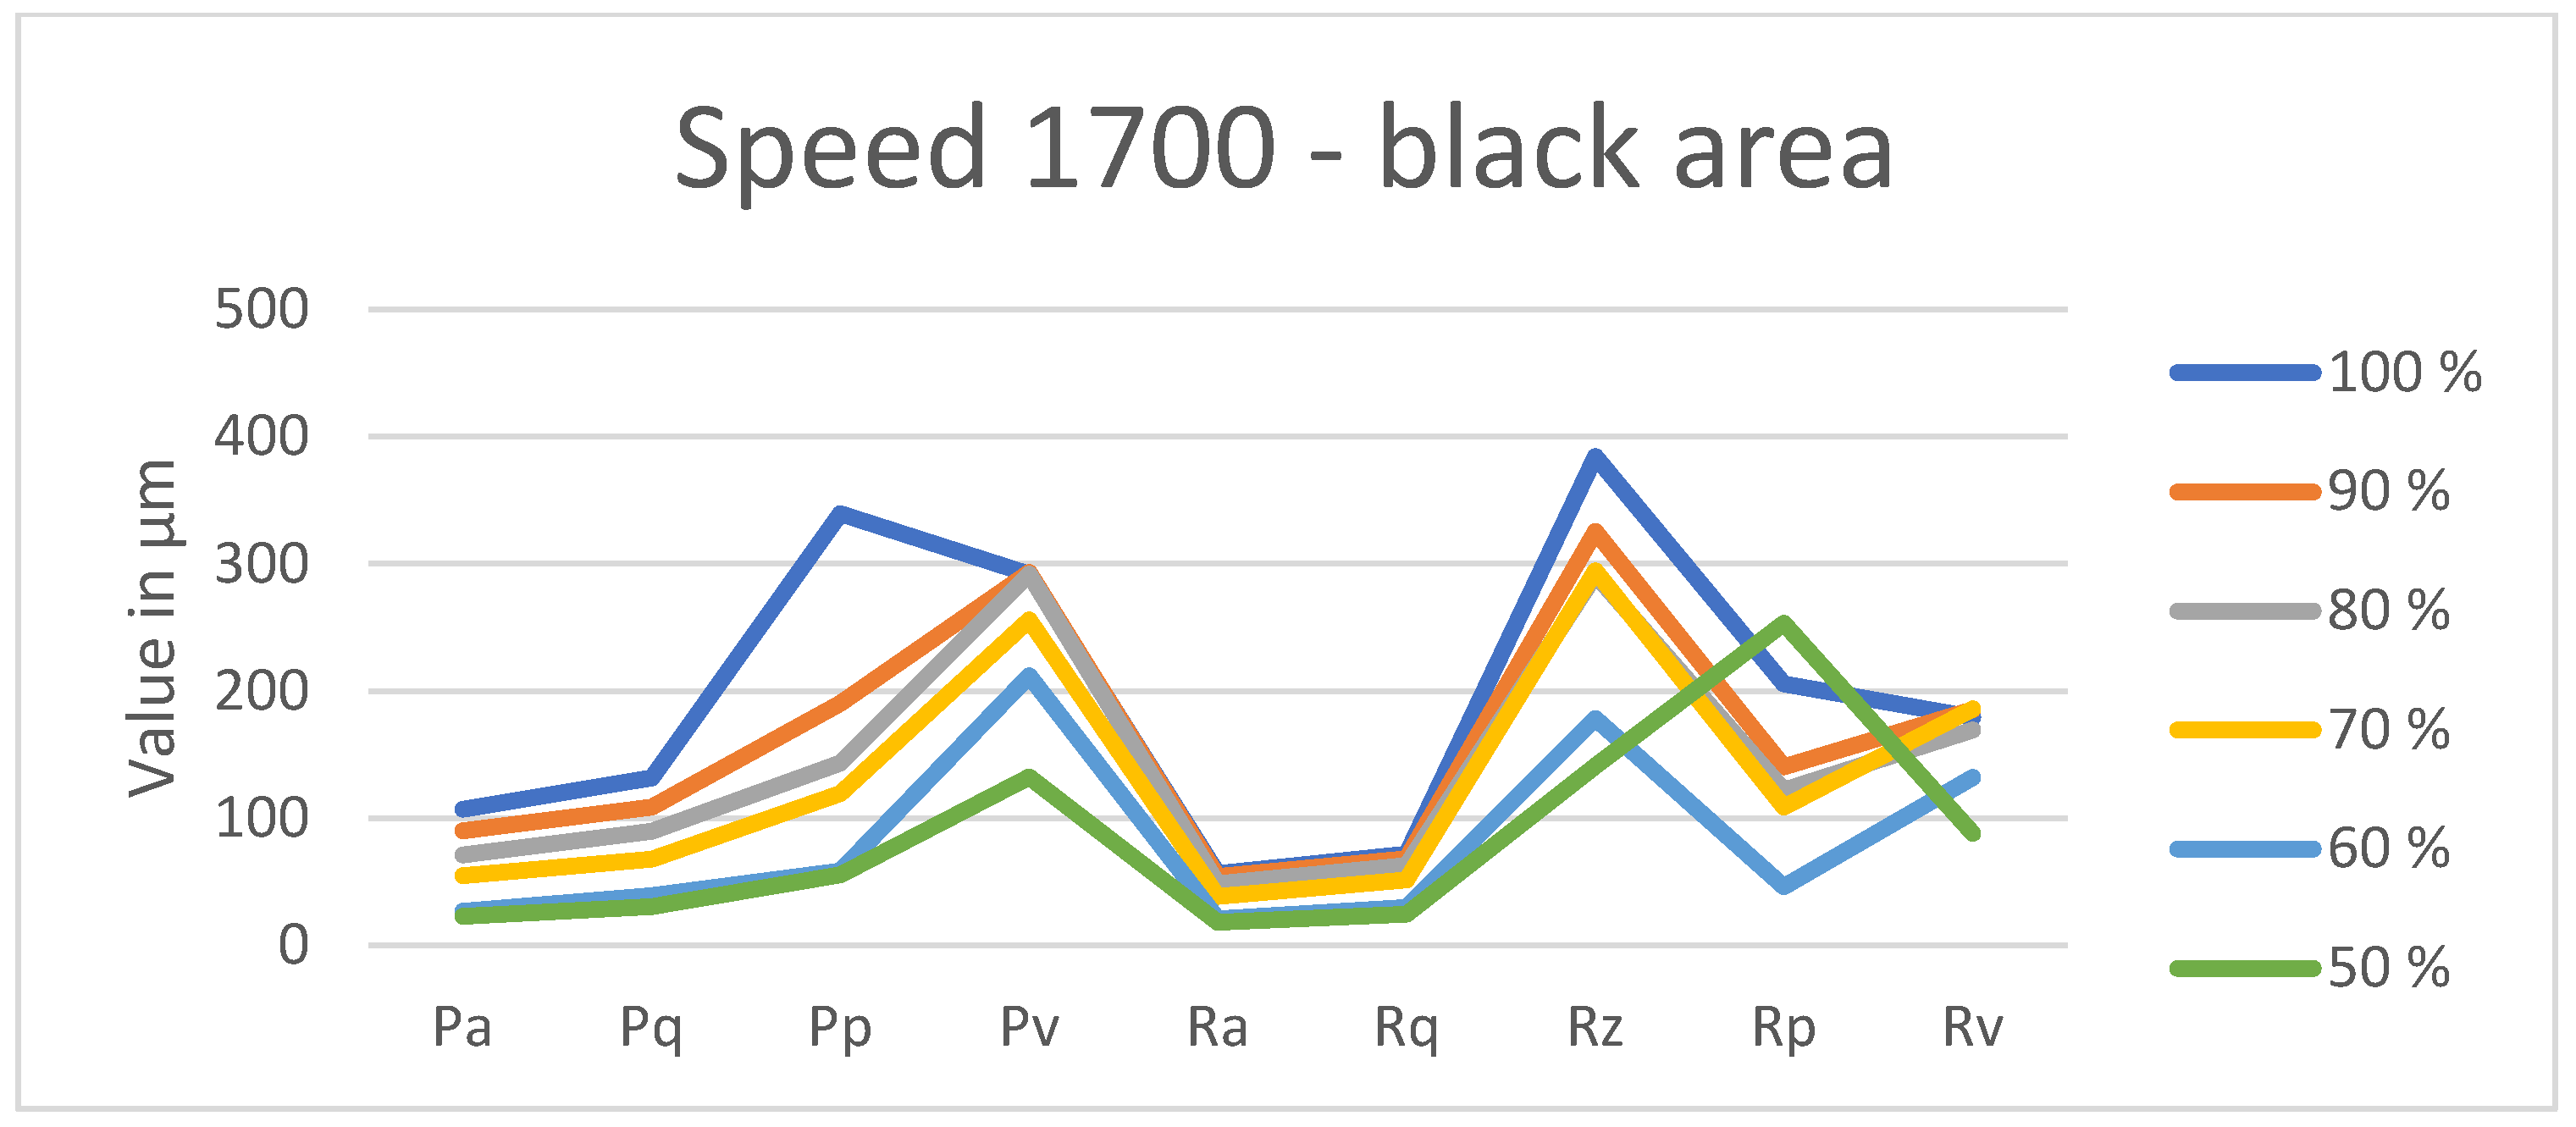
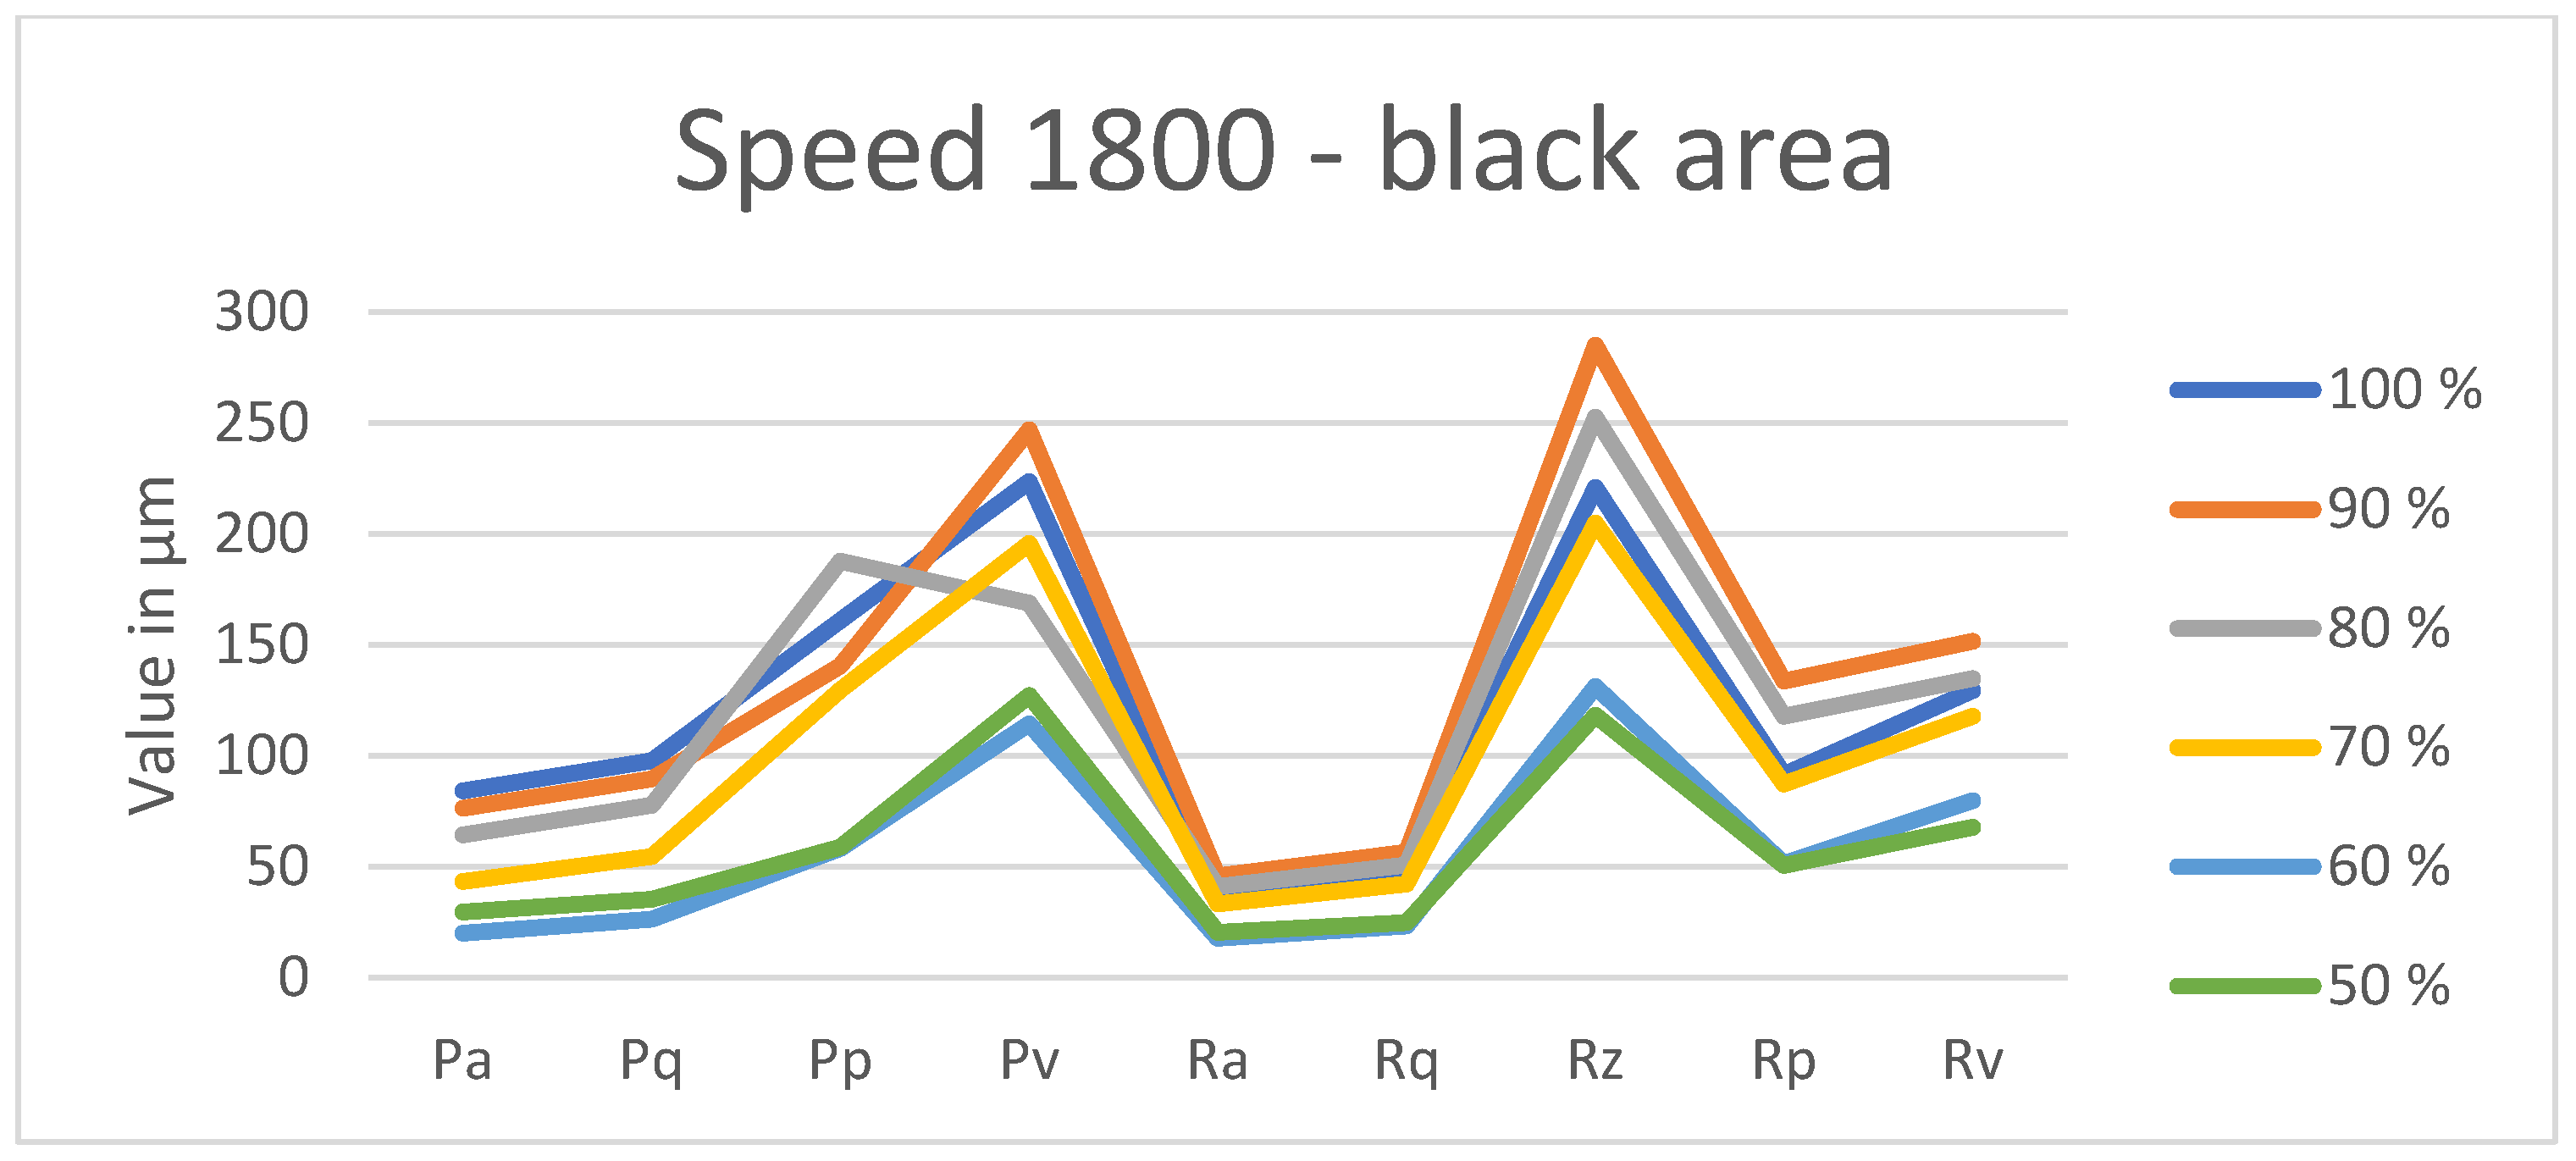
Disregarding the aberrant result at 1200 mm/min in
Figure 17,
Rz remains the most representative parameter, as it shows larger changes in value when the speed is varied. Additionally, it has a slightly higher value than
Pv, resulting in a smaller relative uncertainty.
4. Discussion
It is concluded that
Rz is a more convenient parameter for characterizing the material’s response to laser markings in relation to its power.
Figure 16 and
Figure 17 further demonstrate that
Rz is the optimal parameter for assessing surface texture and the quality of laser markings.
The identification of an ISO parameter that is sufficiently effective for the quantitative assessment of roughness facilitates the integration of this procedure into a quality control process using standard roughness-measuring equipment in the industry.
The results obtained are specific to a laser operating under particular conditions on bamboo. These results will vary with different wavelengths and types of wood, as the organic composition of the wood is intrinsically linked to its light absorption spectra. Consequently, the proposed procedure is being developed for various types of wood.
The relationship between final roughness and initial surface texture prior to marking has not been studied. However, it is an important parameter to consider, primarily due to the reflective effects at the beginning of engraving, which can change rapidly when burnt.
For the black area, it may be beneficial to evaluate other parameters, such as the material ratio curve. However, we advise against this unless there is a post-manufacturing procedure involved, as the part may be painted or undergo other processes.
Further studies are strongly recommended with various materials, including both organic substances and metals, to develop a comprehensive experimental method for verifying the quality of the manufacturing process, using Rz as an indicator. With this work, we propose a simple and efficient method for quantitatively comparing engraving results.
In previous works, the research typically focused on the engraving process itself, rather than identifying which parameter might be useful for qualifying future engravings. The main contribution of our work is the proposal of a universal parameter that is sensitive enough to improve the results for characterizing engraving across different materials.
5. Conclusions
The main conclusion is that ISO 2D roughness parameters, particularly Rz, are suitable for characterizing the surface texture of laser-engraved surfaces.
Rz is the optimal parameter for characterizing the response of a bamboo table to laser engraving when varying the power levels. It outperforms other roughness parameters and remains effective regardless of speed.
In this paper, we propose a procedure to characterize the engraving results on a bamboo sample and the associated uncertainty of the calculated parameters. If the sample’s material and composition are altered, the results will differ; however, the procedure can remain consistent. We suggest using Rz as the parameter to characterize the results.
We have focused solely on characterization using contacting metrology. Further research is encouraged to include and compare results with non-contacting metrology.
In this research, we investigated the optimal measuring parameters for future comparisons. We aim to develop a statistical approach that includes various factors such as laser wavelength, laser wavelength band, laser power, laser pulses per minute, laser speed, types of wood samples, and different finished wooden surfaces, among others.
It is advisable to recheck the energy distribution at the laser spot when operating at low output power. If an energy-measuring camera is available, periodic testing can be conducted. Otherwise, it is sufficient to periodically mark a test part using the same procedure and compare the test marks.
The stylus may leave scratches on the surface, but they will be negligible due to the contacting force being below 5 mN. However, the burning of bamboo results in varying shades of gray in the texture, as shown in
Figure 11, and this depends on the type of wood being studied.
Figure A11 in
Appendix B illustrates how the same black area consists of different depths, which are unrelated to laser parameters. Therefore, future work should include a comparison of optical and contacting stylus measurements on black areas by using the 2D parameters identified as useful in this research. To facilitate this, designing a wooden resolution chart for measuring both contact and non-contact methods to characterize the effect of the laser on wood or the organic material is recommended.
The scope of the paper is to propose a parameter for roughness evaluations in engraving. The dependence of the values on the engraving parameters will be of interest for achieving the desired engraving results. The variations in R and P values depending on power rates, among other factors, demonstrate that these parameters are effective variables for evaluating the results. In future works, engravers should determine the optimal laser engraving parameters for their specific material to achieve the expected R and P values. Therefore, it is proposed that a resolution chart be developed for characterizing any material with laser engraving before use, featuring a single line of varying widths.
The observed modifications in surface roughness resulting from laser engraving have significant implications for the development of both functional and decorative coatings on wood substrates. Increased surface roughness enhances mechanical interlocking, which can substantially improve the adhesion strength of applied coatings. This is particularly beneficial for protective finishes, hydrophobic treatments, or decorative layers that require long-term durability and visual consistency. Critically, the unique measurement of the specific surface parameter peak-to-valley height (Rz) may provide essential quantitative insights into how laser treatment influences adhesion performance, optimizing time manufacturing processes. These metrics enable the precise evaluation and optimization of surface conditions for targeted applications. Furthermore, the ability to tailor the surface morphology through controlled laser parameters opens new possibilities for engineering wood interfaces with specific optical, tactile, or tribological properties. These findings support the strategic use of laser treatment guided by surface characterization as a pre-conditioning step to optimize the performance and longevity of advanced coating systems in both industrial and artisanal applications.
Author Contributions
Conceptualization, M.A.S.-N., C.P. and E.M.R.; methodology, M.A.S.-N.; software, M.A.S.-N. and C.P.; validation, M.A.S.-N., C.P. and E.M.R.; formal analysis, M.A.S.-N., C.P. and E.M.R.; investigation, M.A.S.-N., C.P. and E.M.R.; resources, M.A.S.-N. and C.P.; data curation, M.A.S.-N.; writing—original draft preparation, M.A.S.-N.; writing—review and editing, M.A.S.-N., C.P. and E.M.R.; visualization, M.A.S.-N.; supervision, M.A.S.-N., C.P. and E.M.R.; project administration, M.A.S.-N. and C.P.; funding acquisition, M.A.S.-N. and C.P. All authors have read and agreed to the published version of the manuscript.
Funding
This research was funded by Pontifical Comillas University.
Institutional Review Board Statement
Not applicable.
Informed Consent Statement
Not applicable.
Data Availability Statement
The original contributions presented in this study are included in the article. Further inquiries can be directed to the corresponding author.
Acknowledgments
The authors want to thank the Industrial Production and Manufacturing Engineering (IPME) Research Group for the support given throughout the development of this work. The authors would like to thank Kiko Perez (
https://fperezpu.wixsite.com/kikoperez, accessed on 22 June 2018) for his wolf design, on which the drawing sed in this article has been inspired.
Conflicts of Interest
The authors declare no competing interests. The funders had no role in the design of the study; in the collection, analyses, or interpretation of data; in the writing of the manuscript, or in the decision to publish the results.
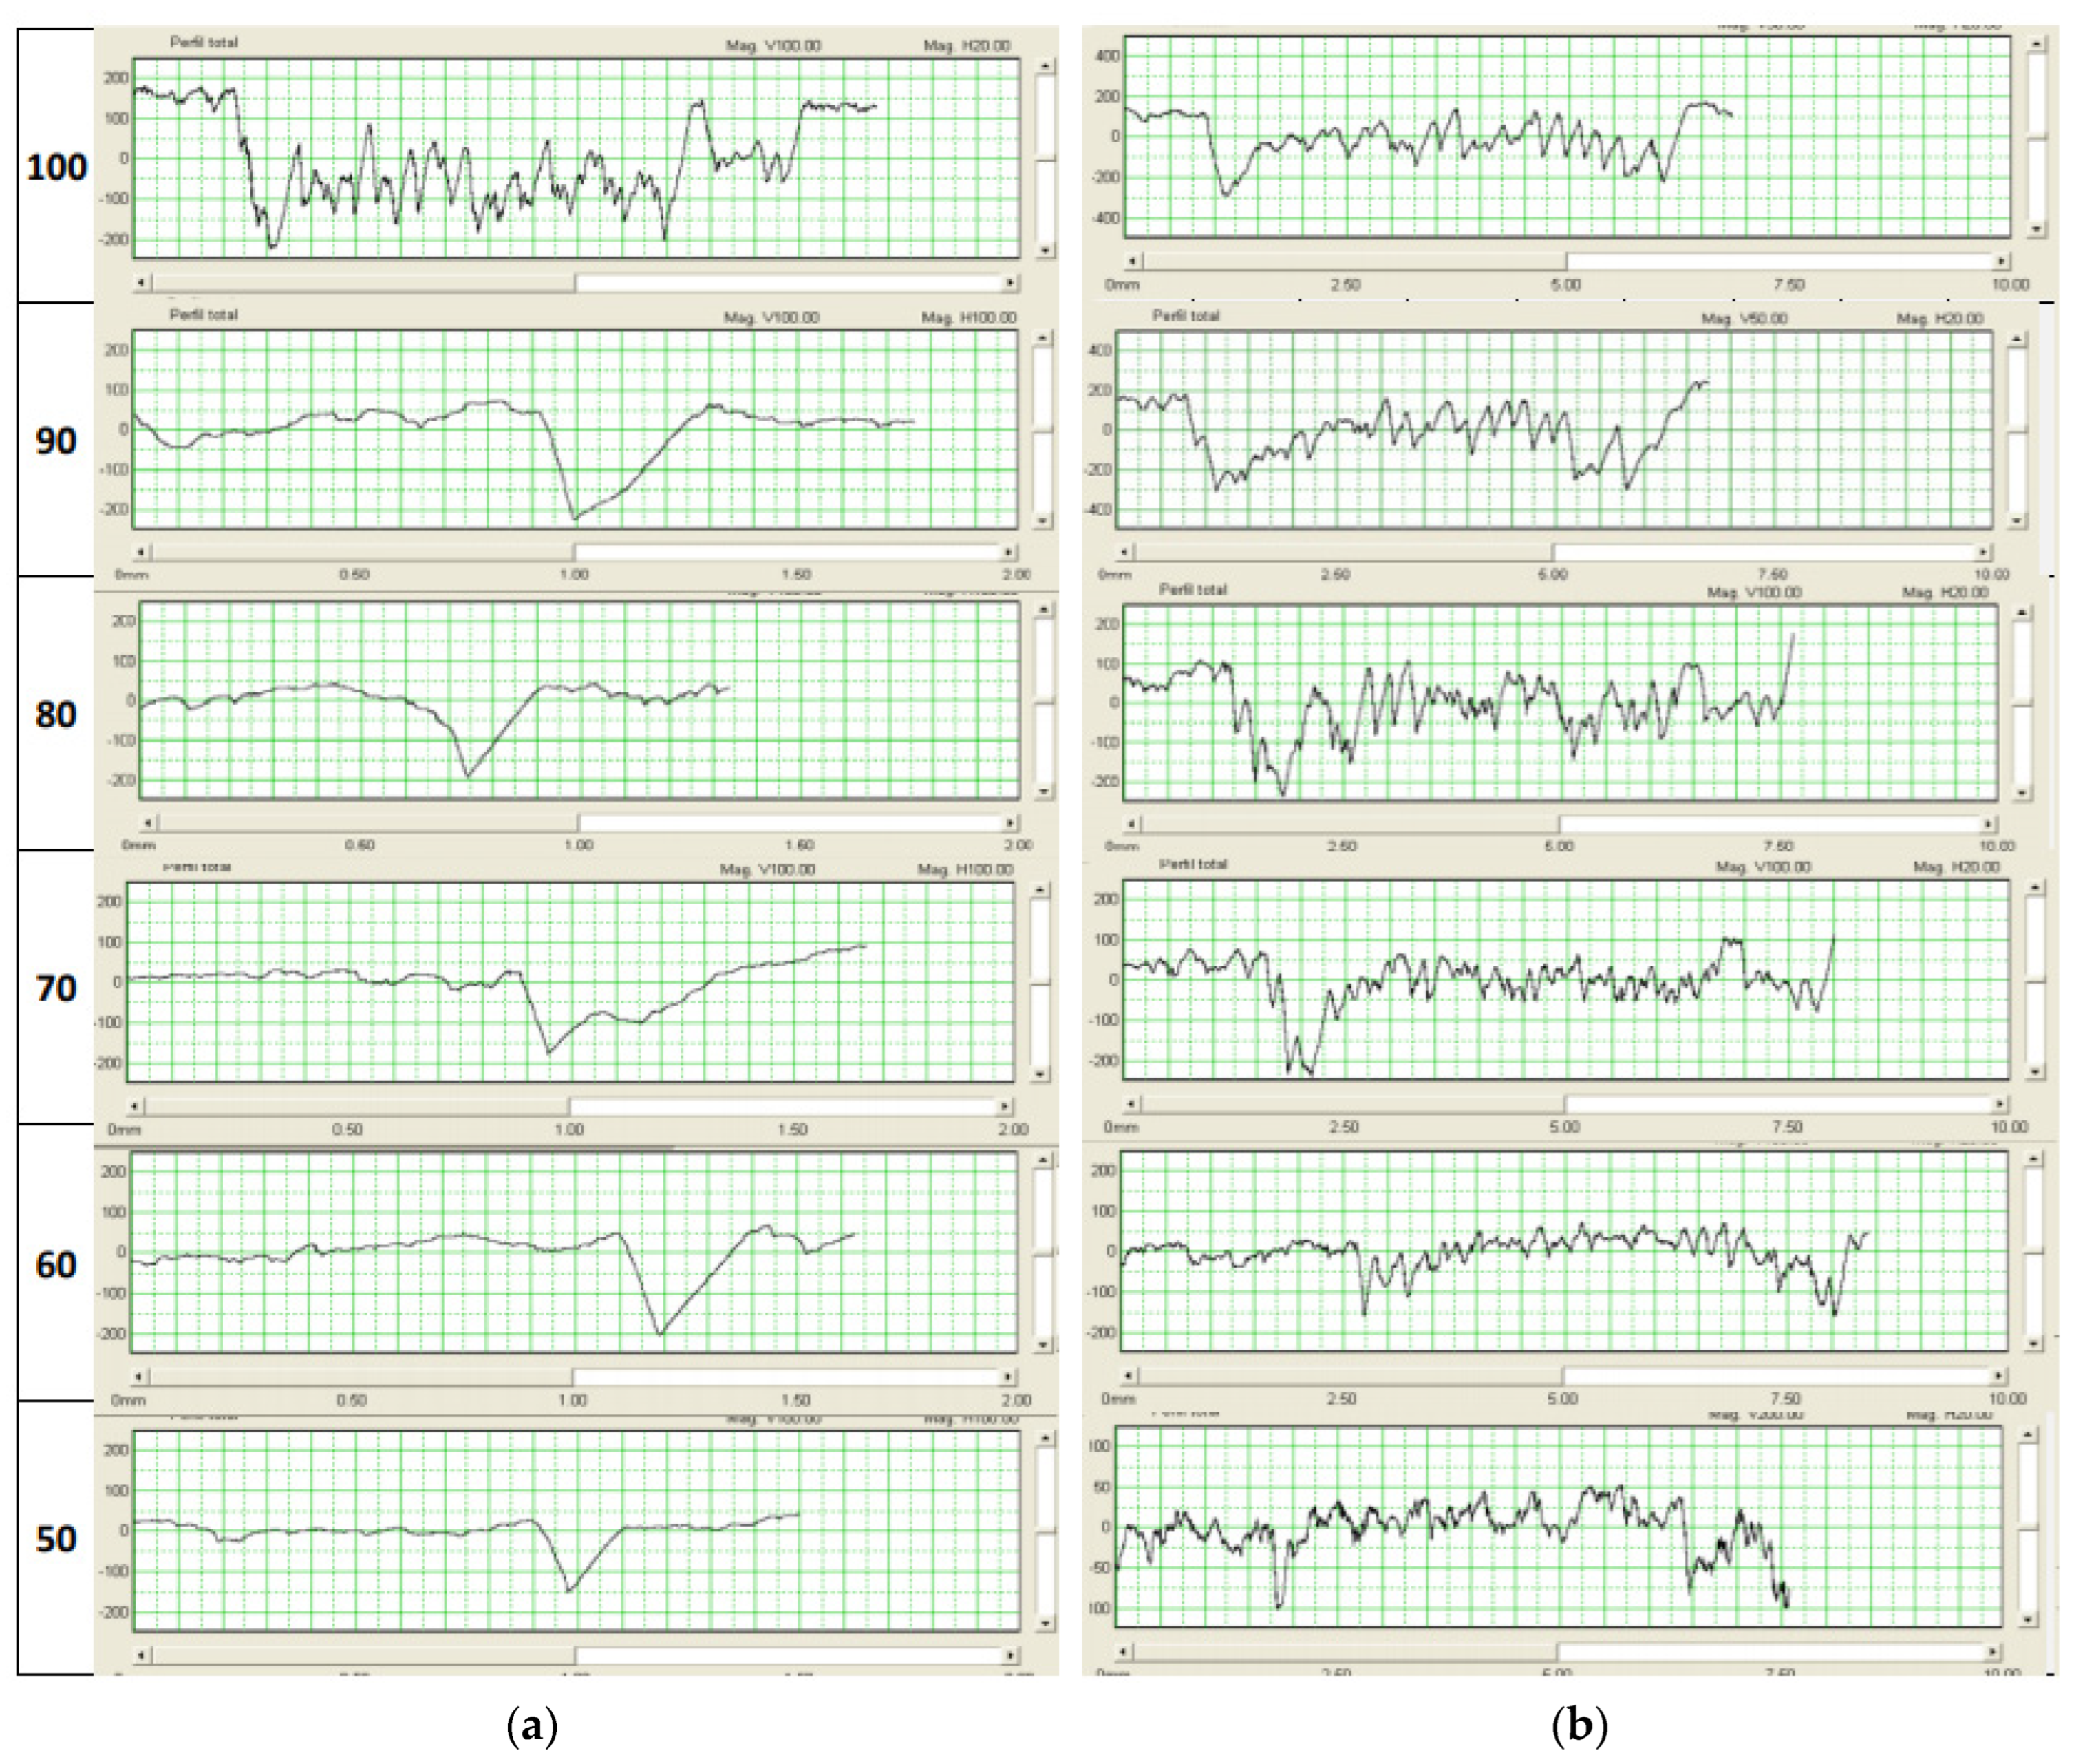
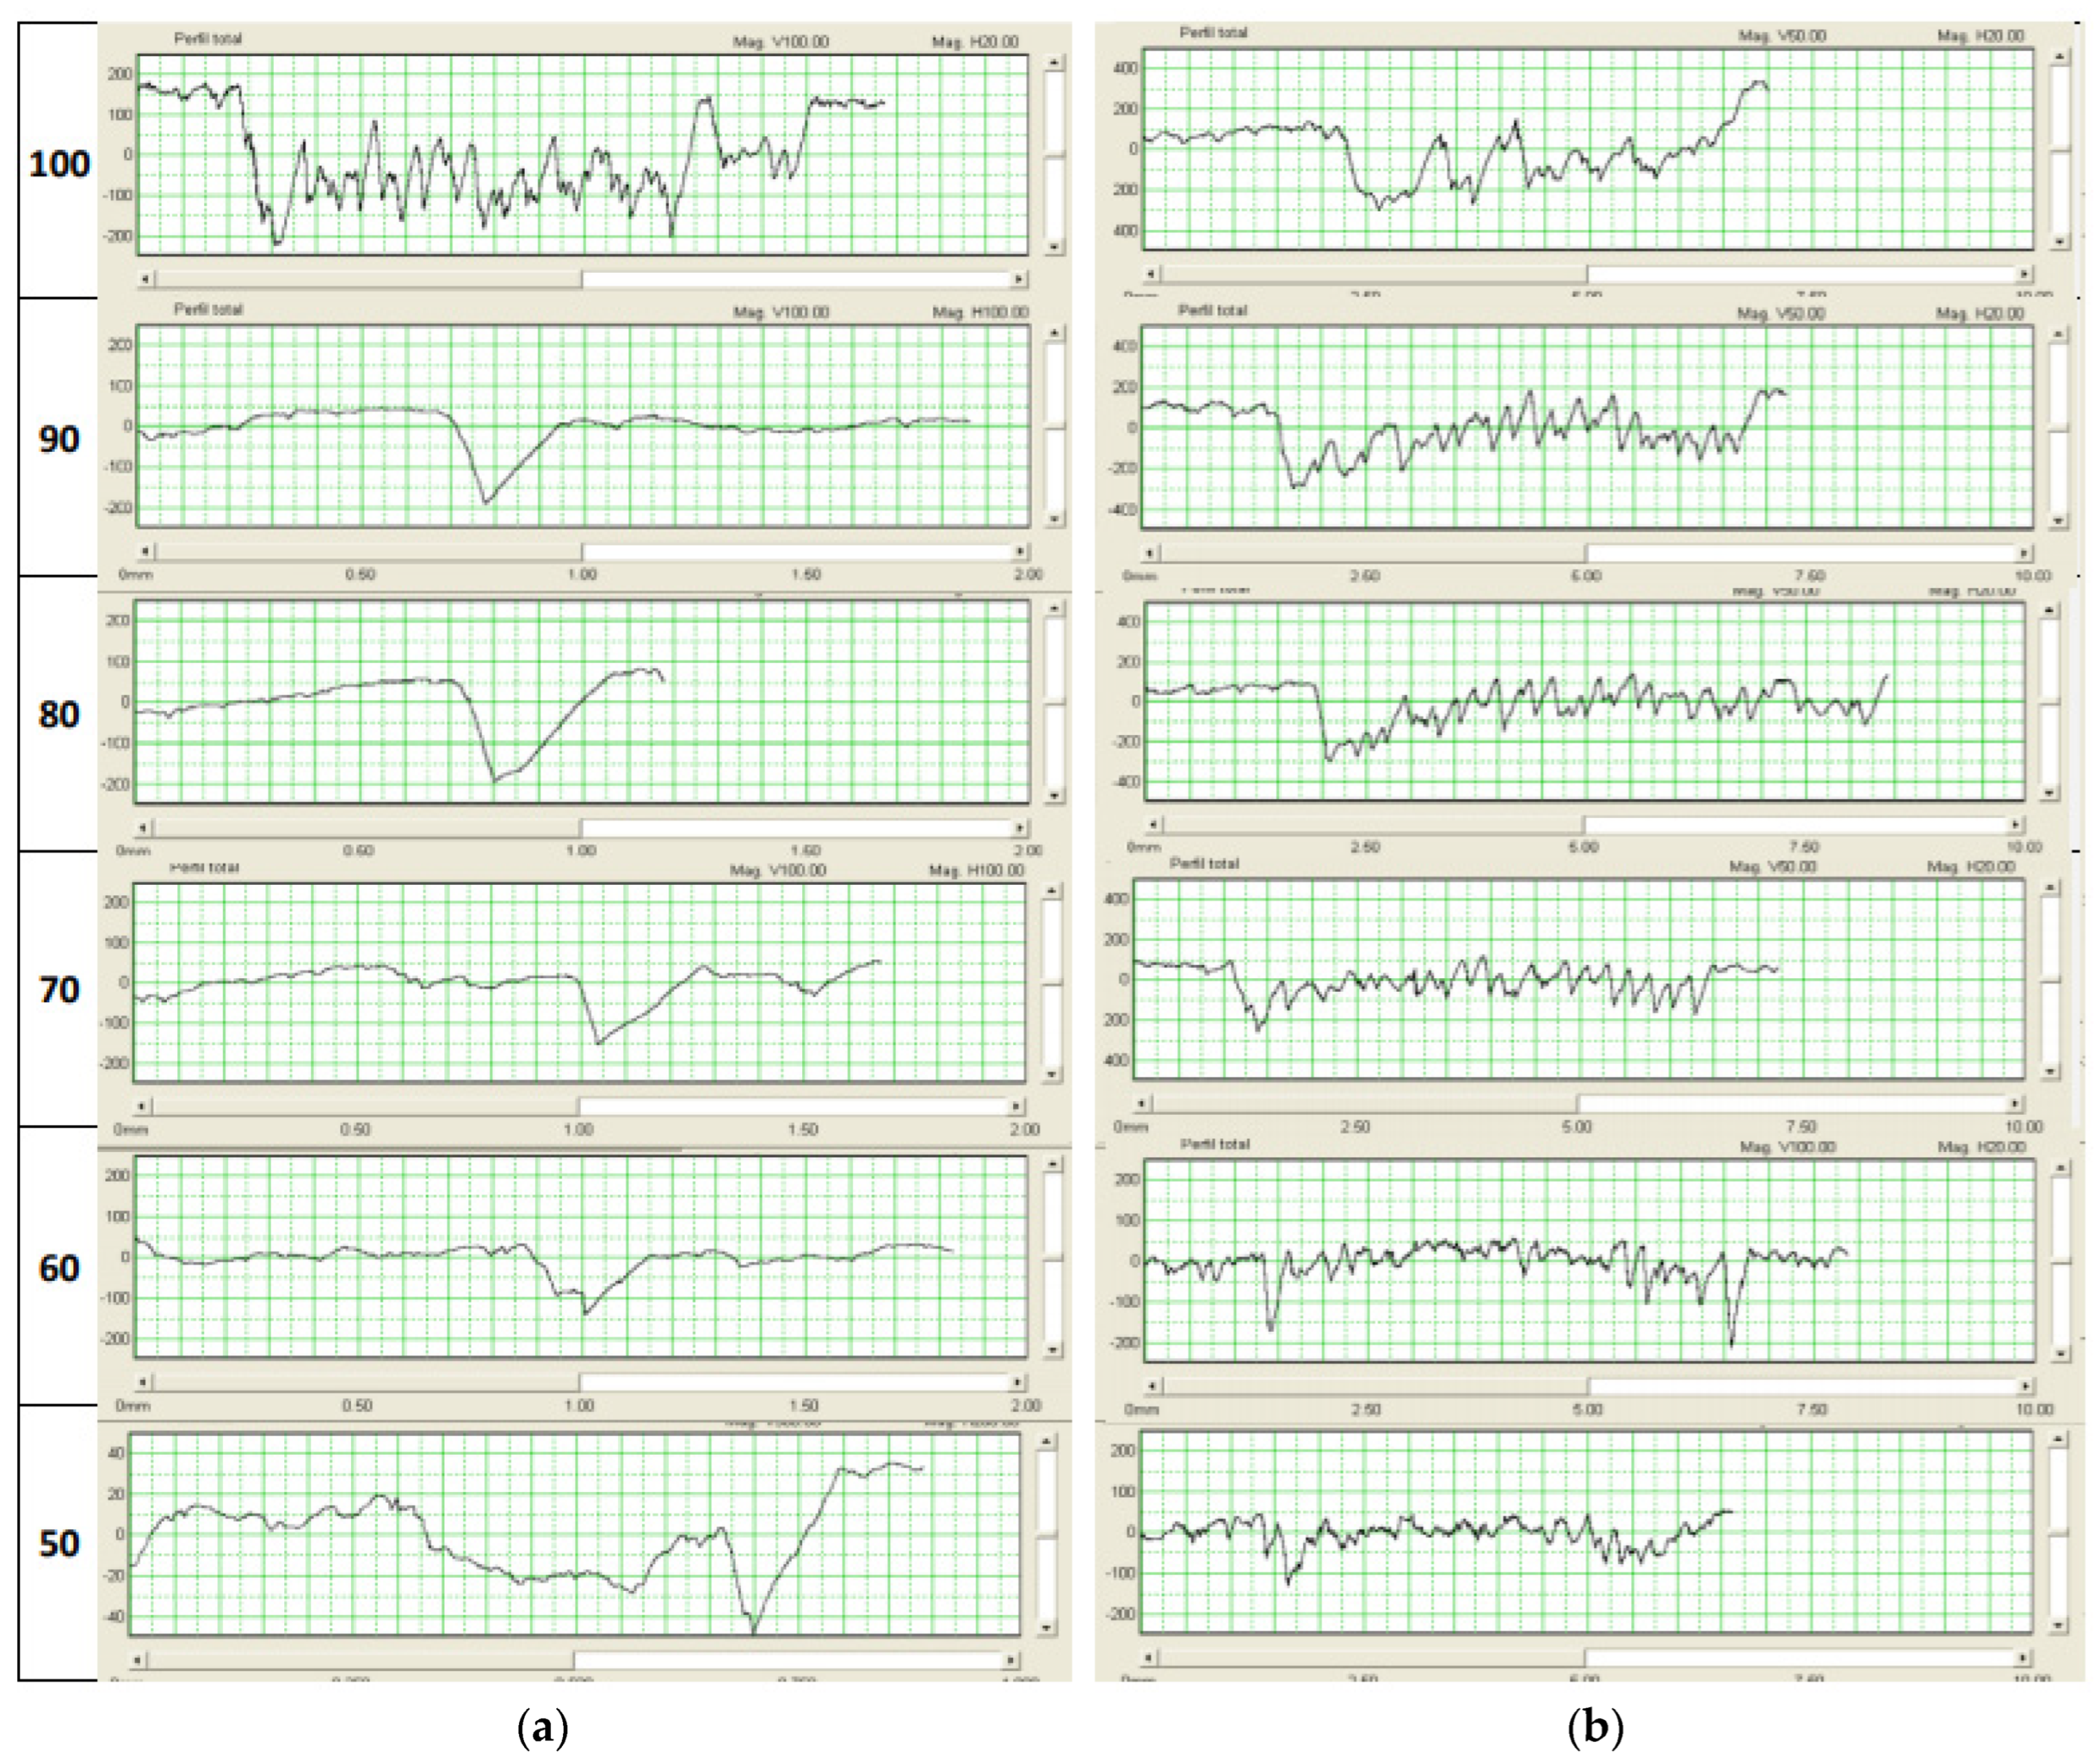
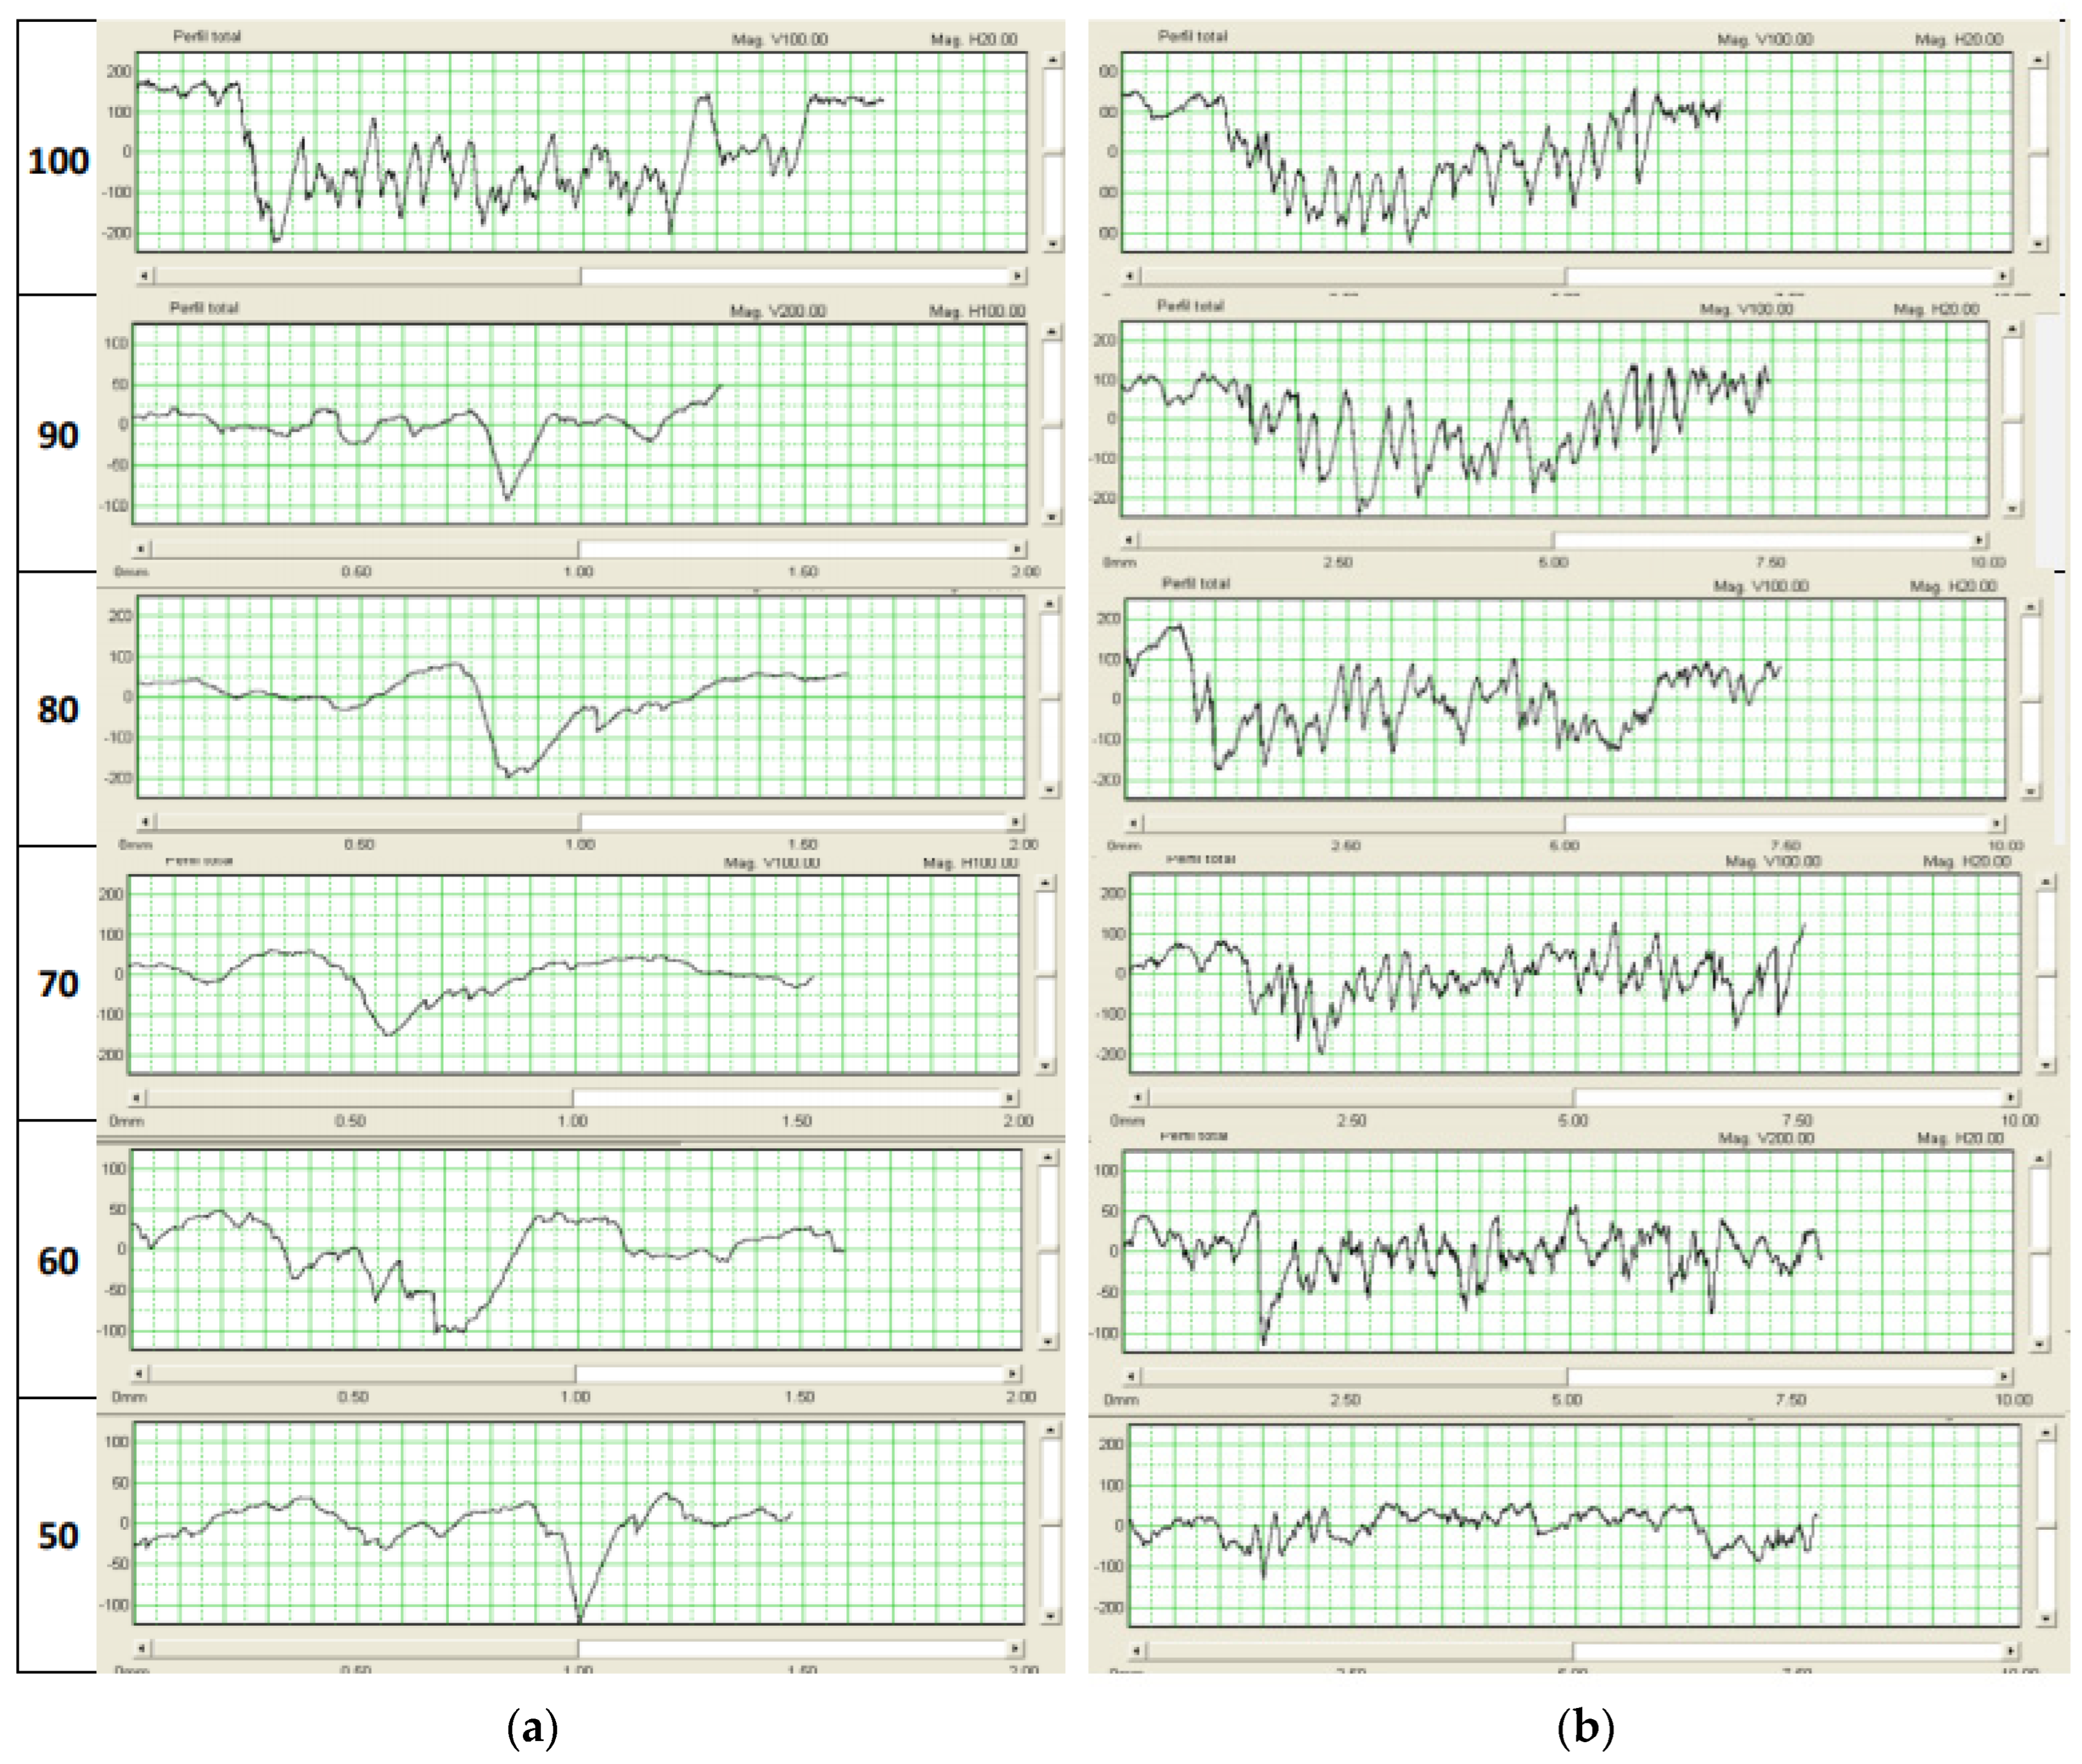
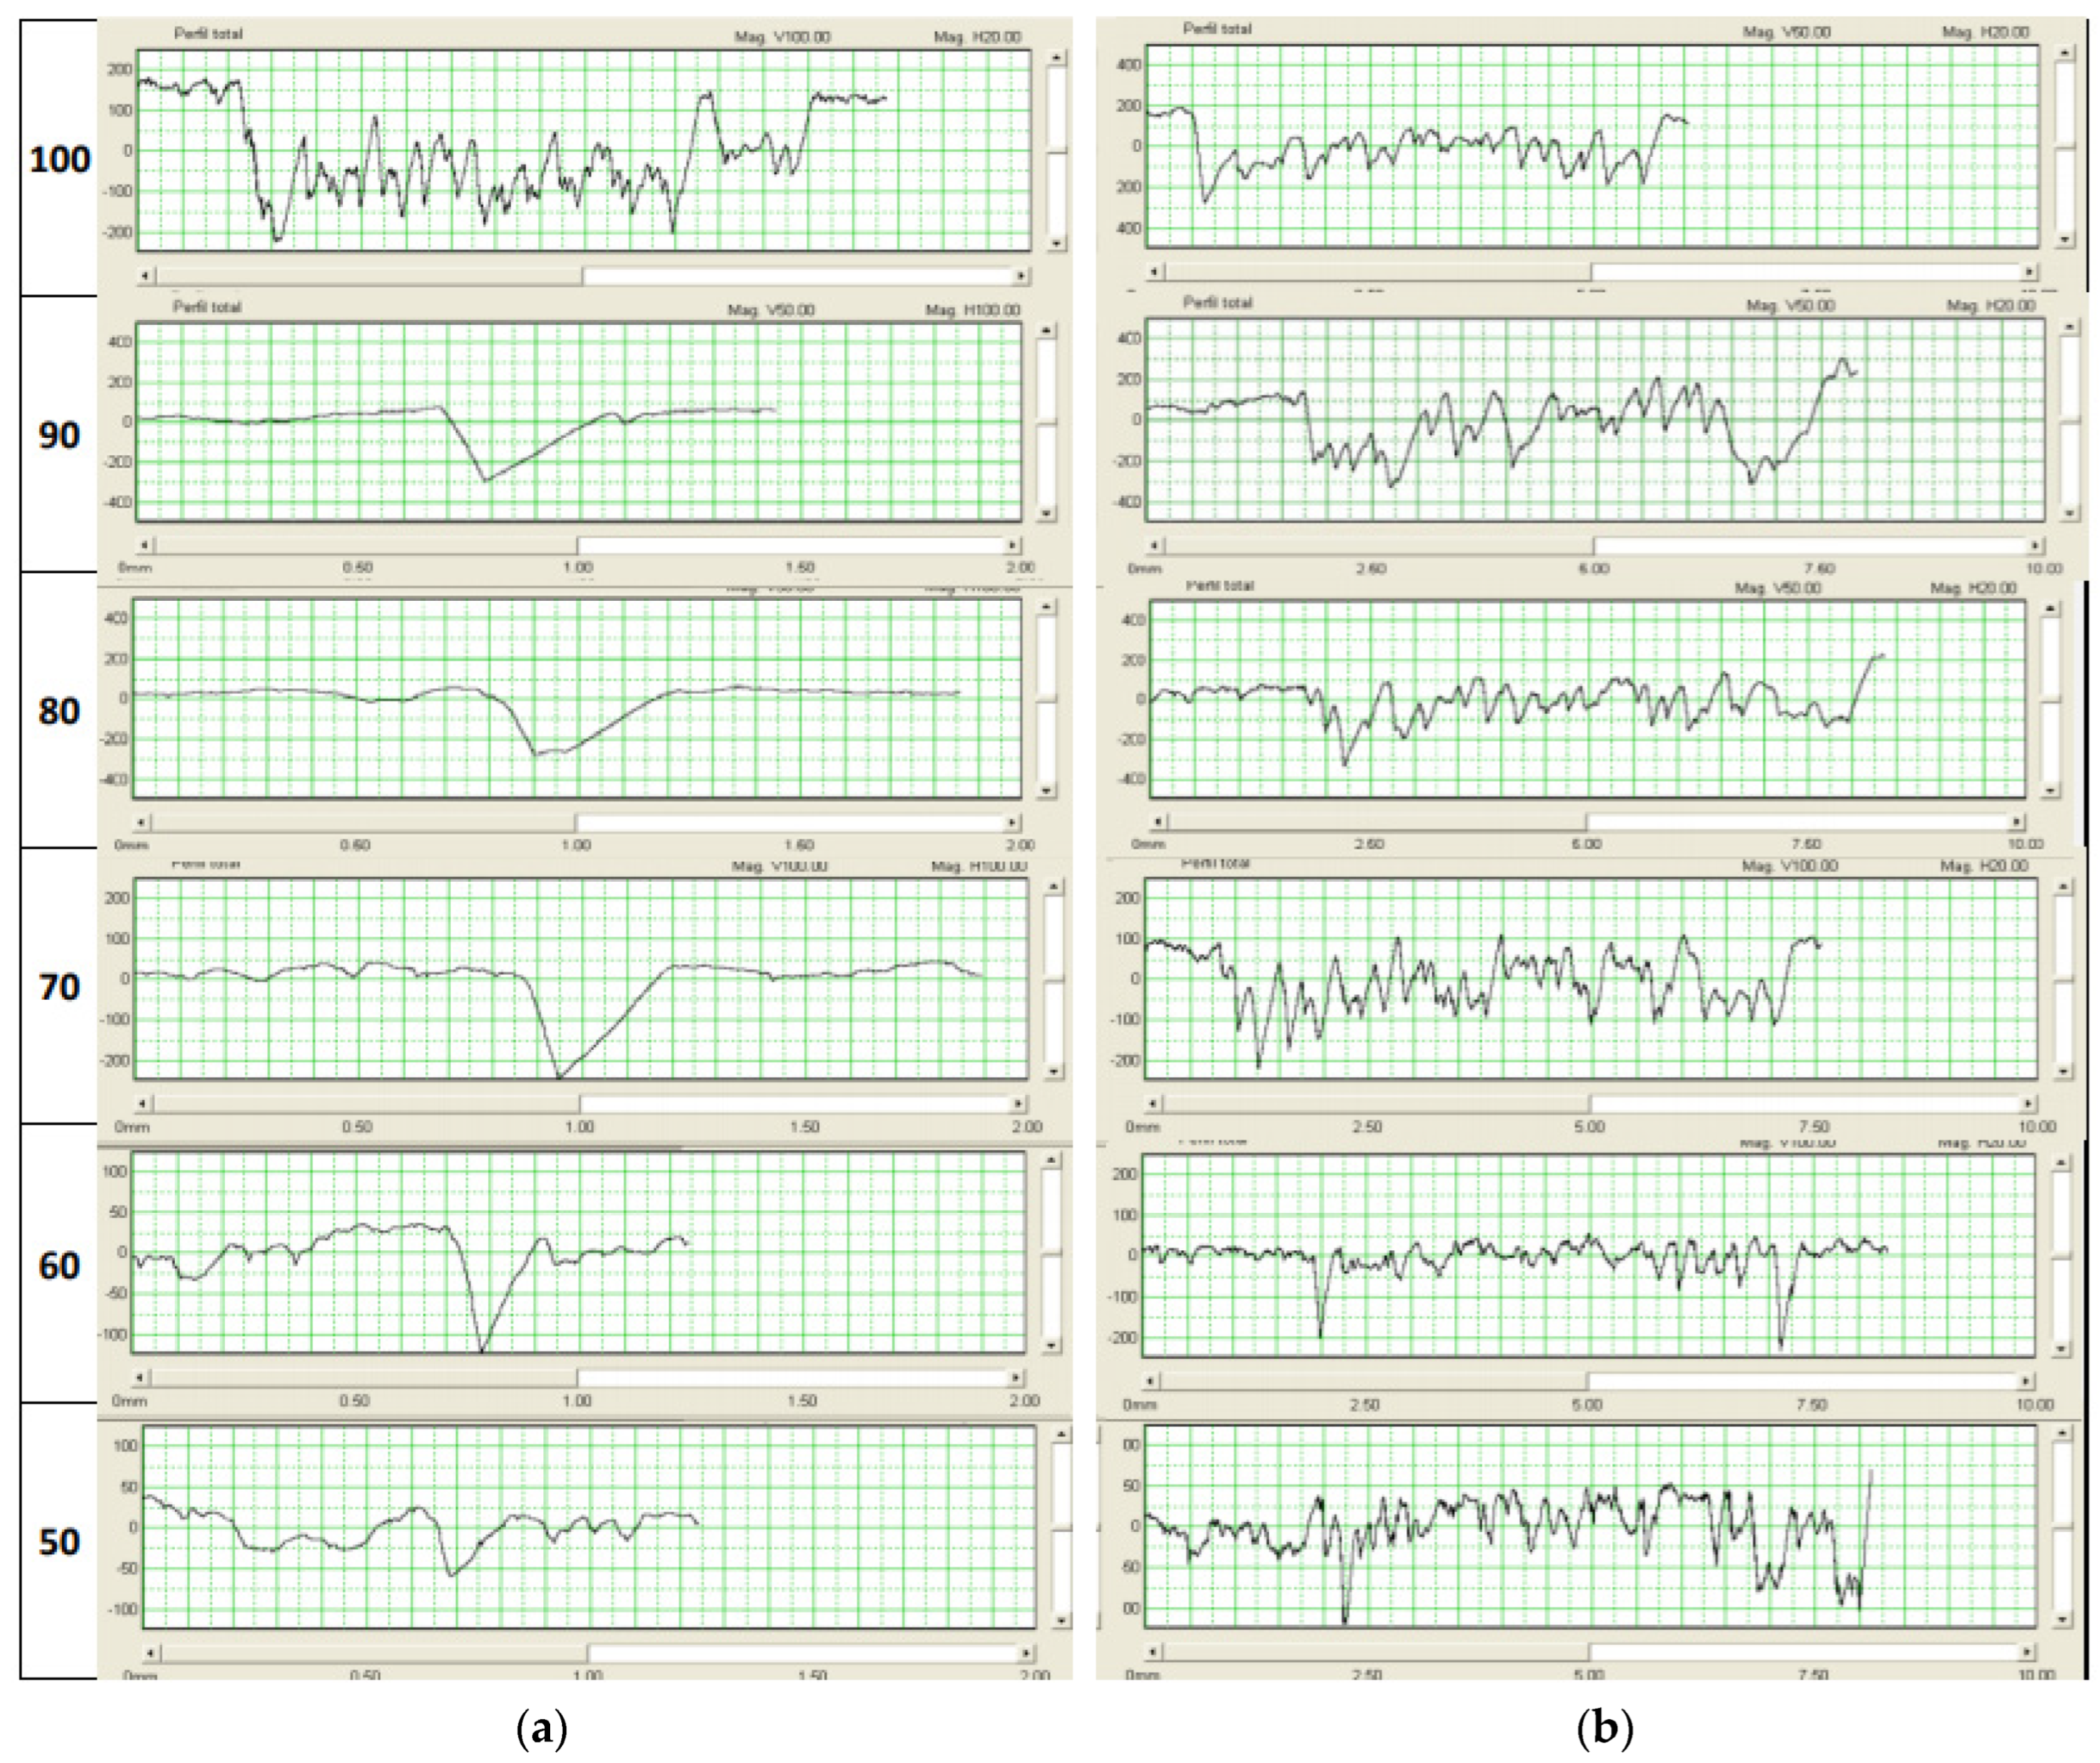
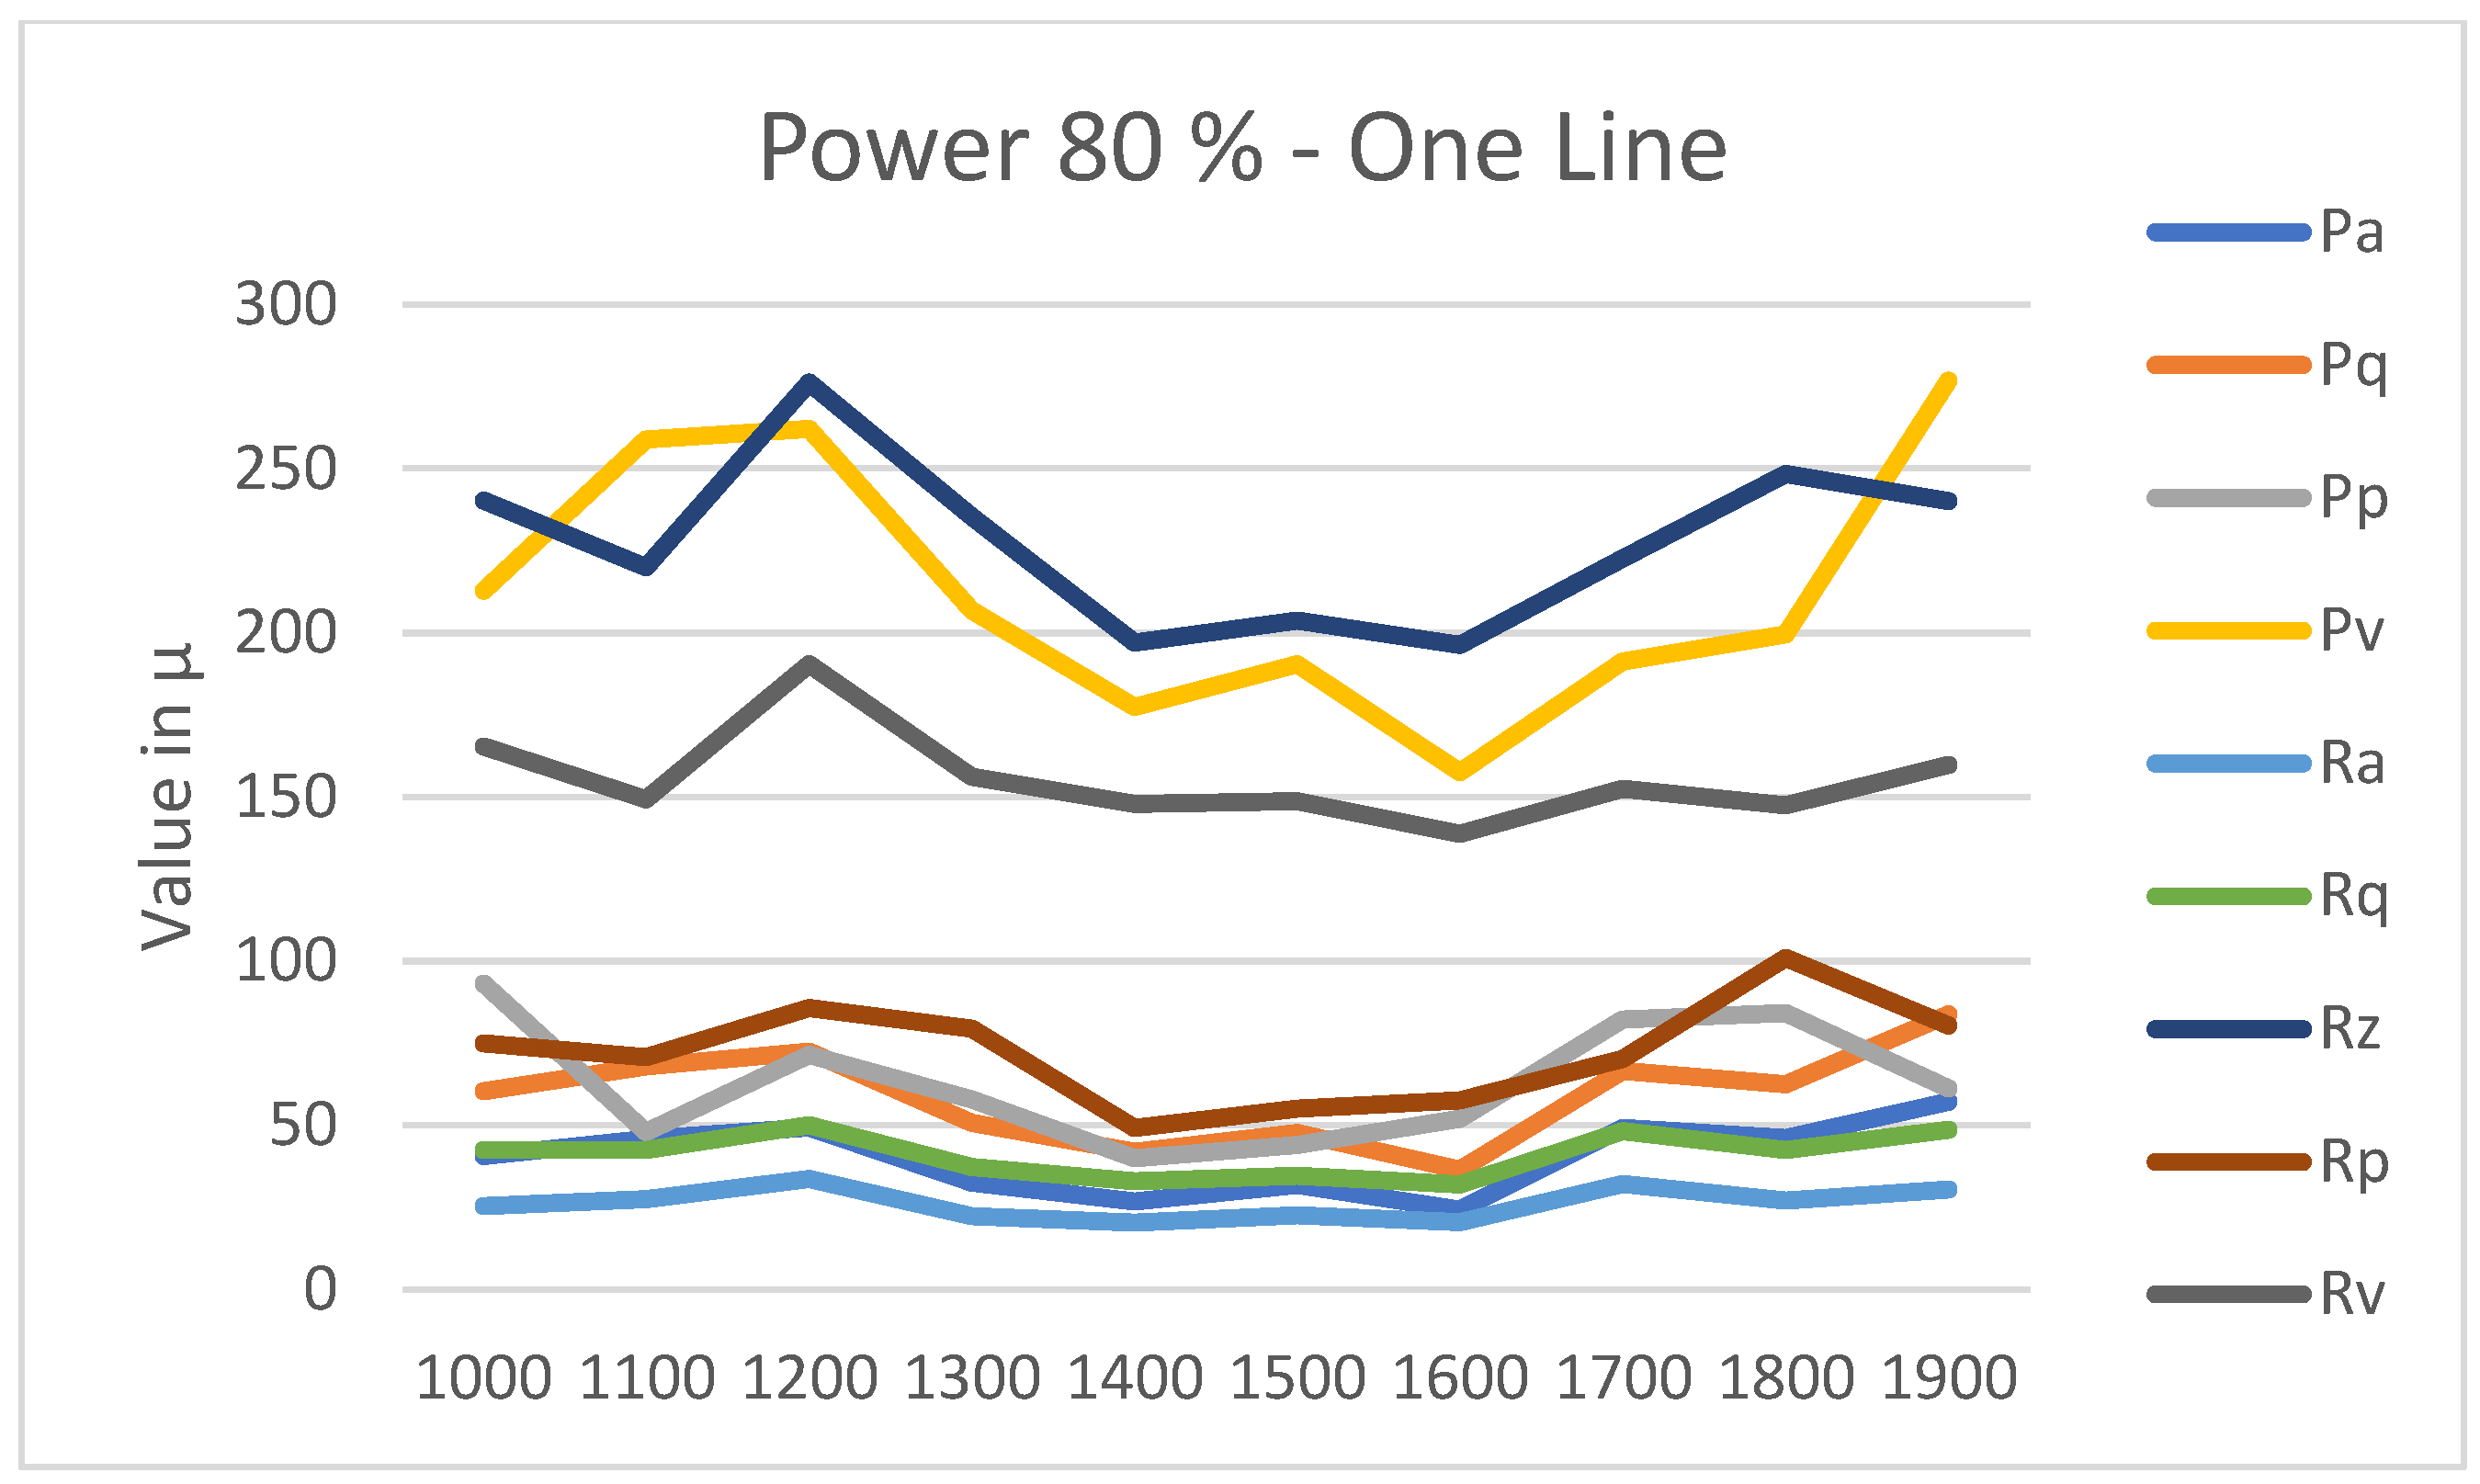
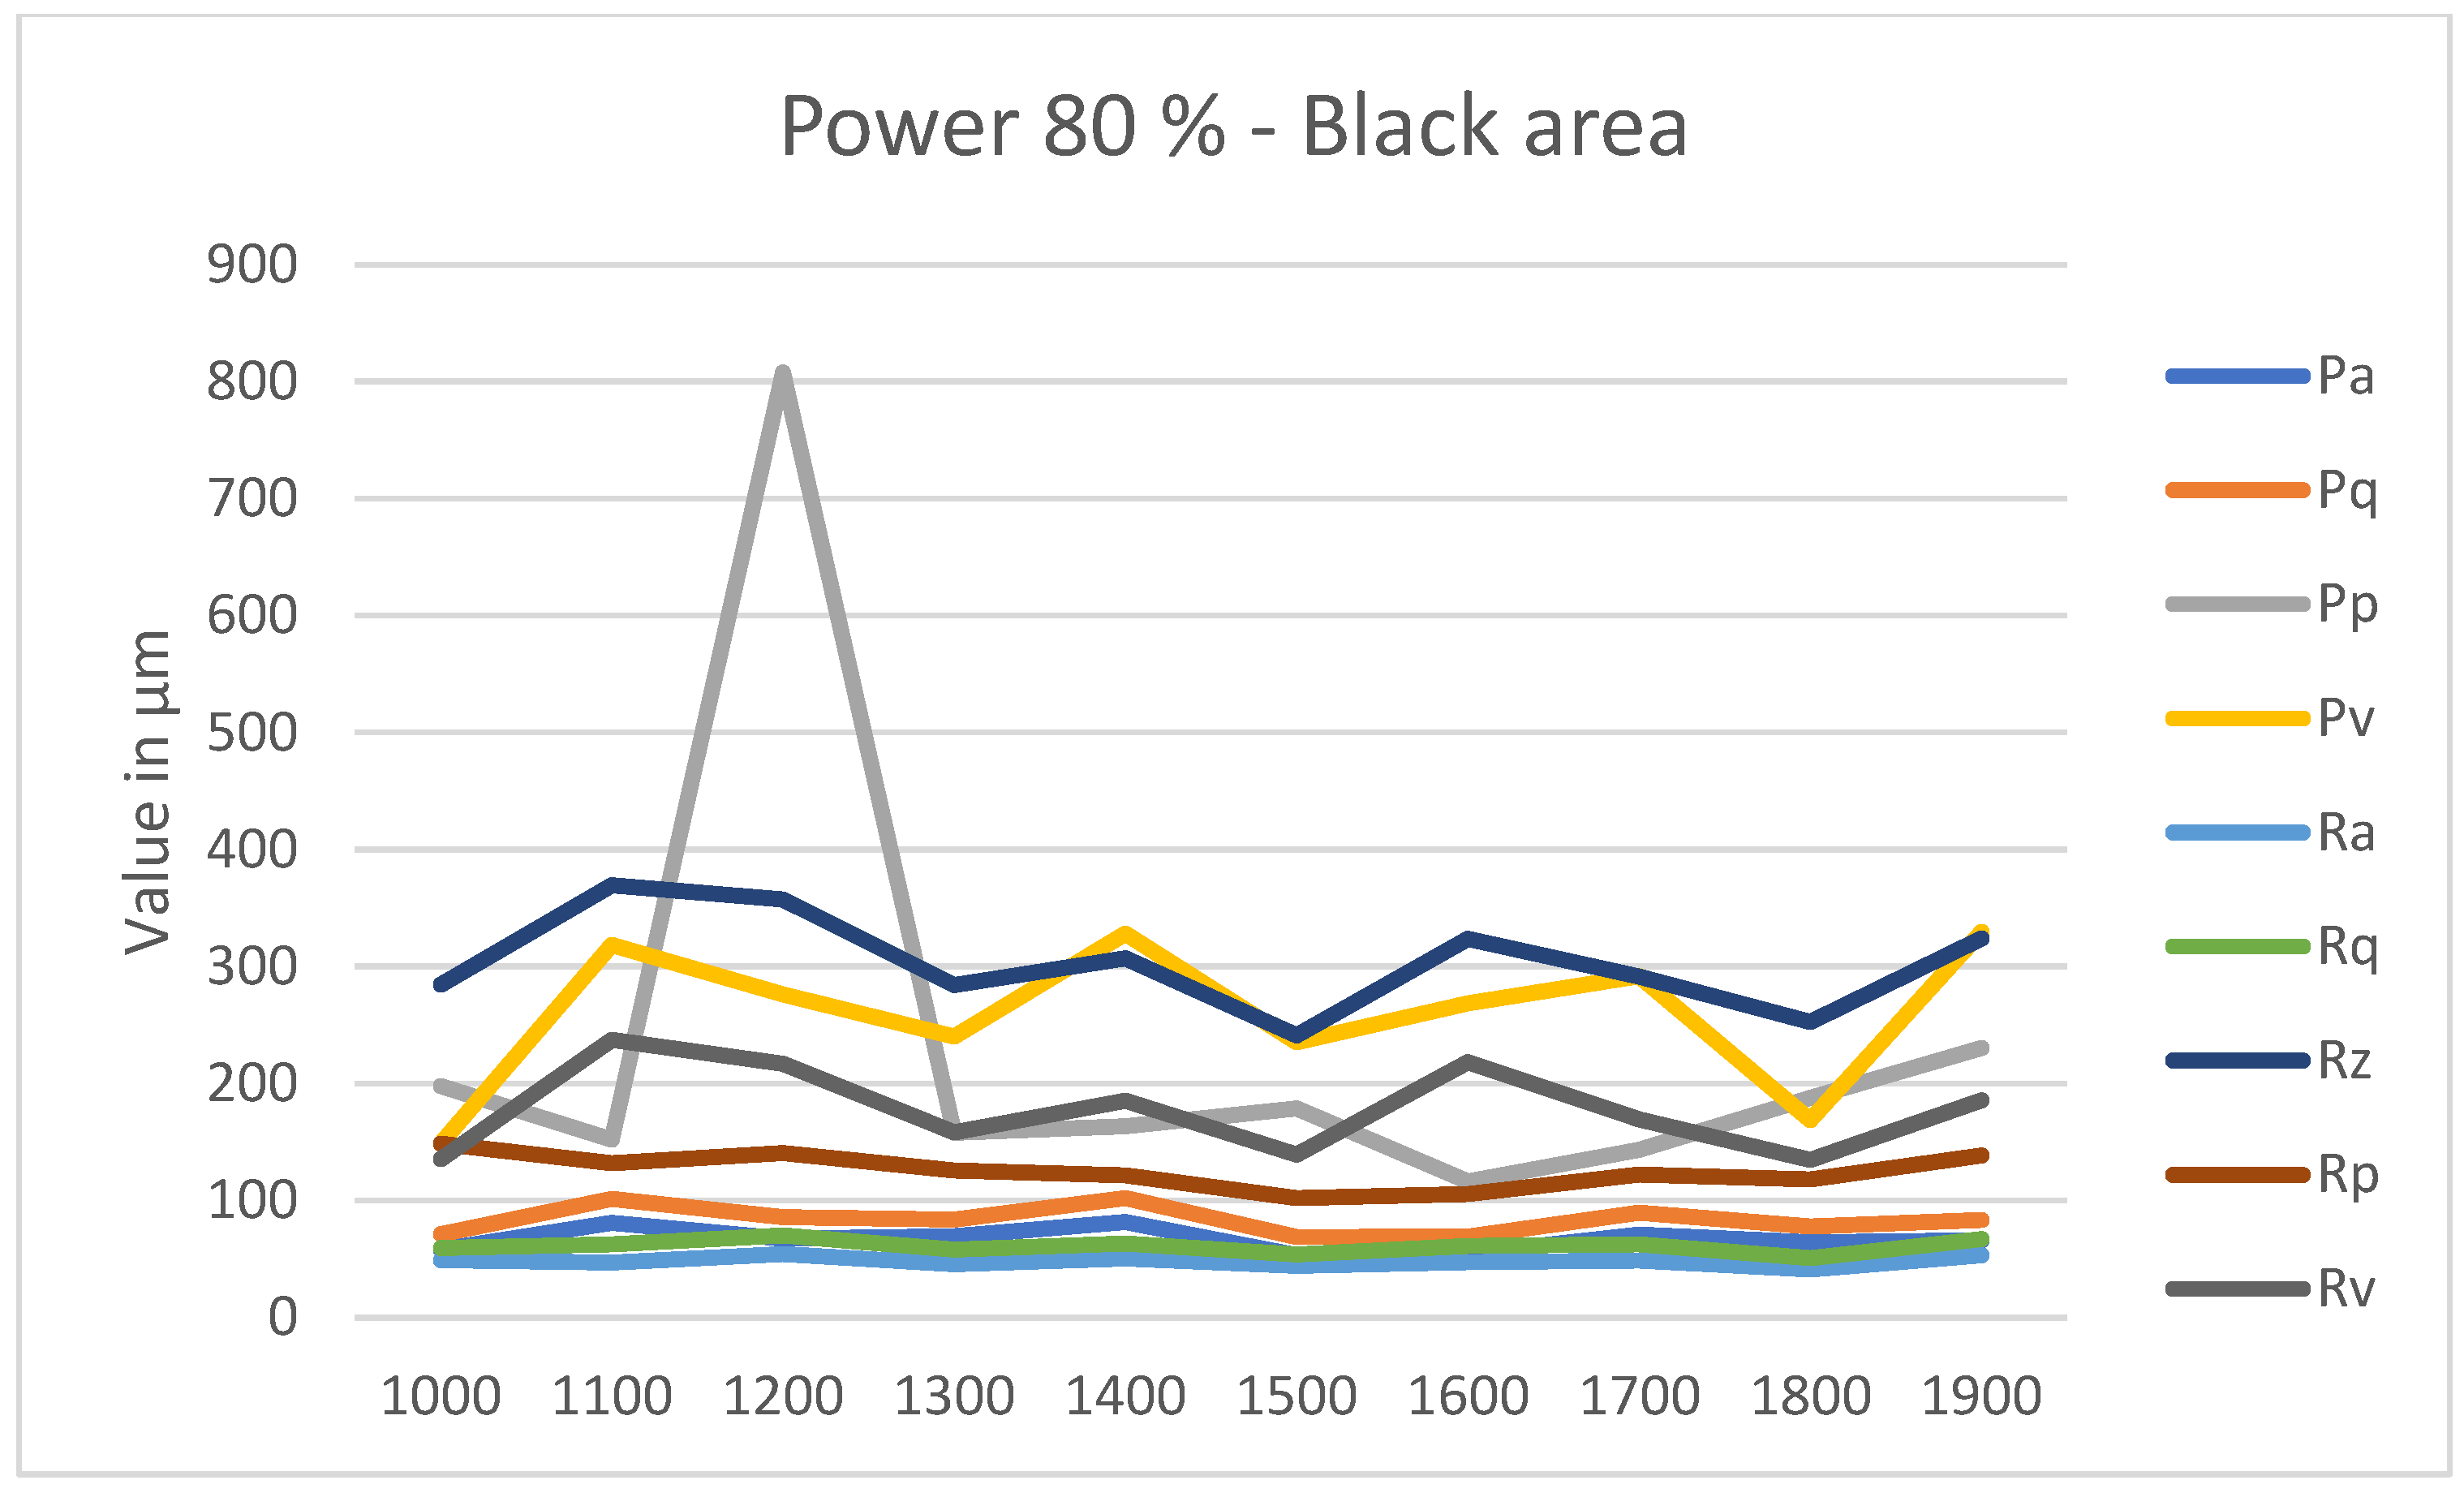
Appendix A
In this appendix, we present the table of mean measurements for one line and the black area on each sample of a table, as an example of data handling. It is quite interesting to observe the behavior of laser engraving depending on the laser parameters, as discussed in the text.
Table A1.
One measurement on one line and the black area for 1000 mm/min and different ranges of power from 50% to 100% of the laser [parameters in µm].
Table A1.
One measurement on one line and the black area for 1000 mm/min and different ranges of power from 50% to 100% of the laser [parameters in µm].
| One Line |
|---|
| % | Pa | Pq | Pp | Pv | Ra | Rq | Rz | Rp | Rv |
|---|
| 100 | 28.63 | 42.37 | 53.88 | 163.12 | 10.07 | 27.82 | 167.52 | 42.68 | 124.84 |
| 90 | 61.31 | 85.07 | 89.34 | 275.12 | 36.50 | 54.47 | 295.68 | 100.96 | 194.72 |
| 80 | 40.60 | 60.39 | 93.22 | 212.8 | 25.36 | 42.38 | 240.24 | 74.90 | 165.34 |
| 70 | 20.44 | 29.89 | 35.82 | 117.10 | 16.17 | 21.20 | 85.69 | 25.95 | 59.74 |
| 60 | 18.24 | 26.12 | 32.18 | 86.10 | 12.93 | 19.06 | 94.60 | 28.88 | 65.72 |
| 50 | 13.66 | 20.74 | 26.22 | 85.84 | 10.50 | 16.94 | 105.08 | 32.14 | 72.94 |
| Black Area |
| % | Pa | Pq | Pp | Pv | Ra | Rq | Rz | Rp | Rv |
| 100 | 95.61 | 117.96 | 284.94 | 232.64 | 59.67 | 72.52 | 327.96 | 160.28 | 167.68 |
| 90 | 102.42 | 127.17 | 300.12 | 312.42 | 60.11 | 74.60 | 336.78 | 147.49 | 189.29 |
| 80 | 58.03 | 71.31 | 197.92 | 149.04 | 48.92 | 59.48 | 284.34 | 148.84 | 135.50 |
| 70 | 44.45 | 54.98 | 147.98 | 131.32 | 37.45 | 46.86 | 230.43 | 104.65 | 125.78 |
| 60 | 28.61 | 37.84 | 74.70 | 149.12 | 23.93 | 31.19 | 176.73 | 62.34 | 114.39 |
| 50 | 16.84 | 21.48 | 39.66 | 84.48 | 15.52 | 19.57 | 114.42 | 40.96 | 73.46 |
Figure A1.
(a) One measurement on one line and (b) the black area for 1000 mm/min and different ranges of power from 50% to 100% of the laser.
Figure A1.
(a) One measurement on one line and (b) the black area for 1000 mm/min and different ranges of power from 50% to 100% of the laser.
Table A2.
One measurement on one line and the black area for 1100 mm/min and different ranges of power from 50% to 100% of the laser [parameters in µm].
Table A2.
One measurement on one line and the black area for 1100 mm/min and different ranges of power from 50% to 100% of the laser [parameters in µm].
| One Line |
|---|
| % | Pa | Pq | Pp | Pv | Ra | Rq | Rz | Rp | Rv |
|---|
| 100 | 54.16 | 77.14 | 56.64 | 264.3 | 31.14 | 48.25 | 254.14 | 75.56 | 178.48 |
| 90 | 65.22 | 85.52 | 119.24 | 227.54 | 50.01 | 66.74 | 282.38 | 115.16 | 167.22 |
| 80 | 45.81 | 67.86 | 47.86 | 258.96 | 27.46 | 42.40 | 220.03 | 70.72 | 149.31 |
| 70 | 24.80 | 38.45 | 47.16 | 156.38 | 16.59 | 28.02 | 162.70 | 33.42 | 129.28 |
| 60 | 26.70 | 38.92 | 57.98 | 133.52 | 19.65 | 25.09 | 98.14 | 35.86 | 62.28 |
| 50 | 10.97 | 14.30 | 26.32 | 52.86 | 8.19 | 11.16 | 72.76 | 28.42 | 44.34 |
| Black Area |
| % | Pa | Pq | Pp | Pv | Ra | Rq | Rz | Rp | Rv |
| 100 | 102.00 | 121.56 | | | 56.64 | 69.86 | 341.27 | 157.33 | 183.94 |
| 90 | 73.71 | 95.86 | 256.02 | 236.60 | 52.95 | 65.00 | 292.27 | 119.42 | 172.85 |
| 80 | 80.80 | 101.31 | 151.92 | 318.54 | 46.85 | 62.61 | 369.51 | 131.93 | 237.58 |
| 70 | 46.47 | 61.17 | 116.2 | 255.70 | 34.20 | 45.55 | 262.63 | 90.42 | 172.21 |
| 60 | 25.82 | 35.52 | 64.02 | 203.70 | 22.99 | 30.49 | 195.18 | 60.70 | 134.48 |
| 50 | 17.24 | 26.61 | 40.30 | 183.46 | 16.69 | 24.28 | 175.49 | 42.62 | 132.87 |
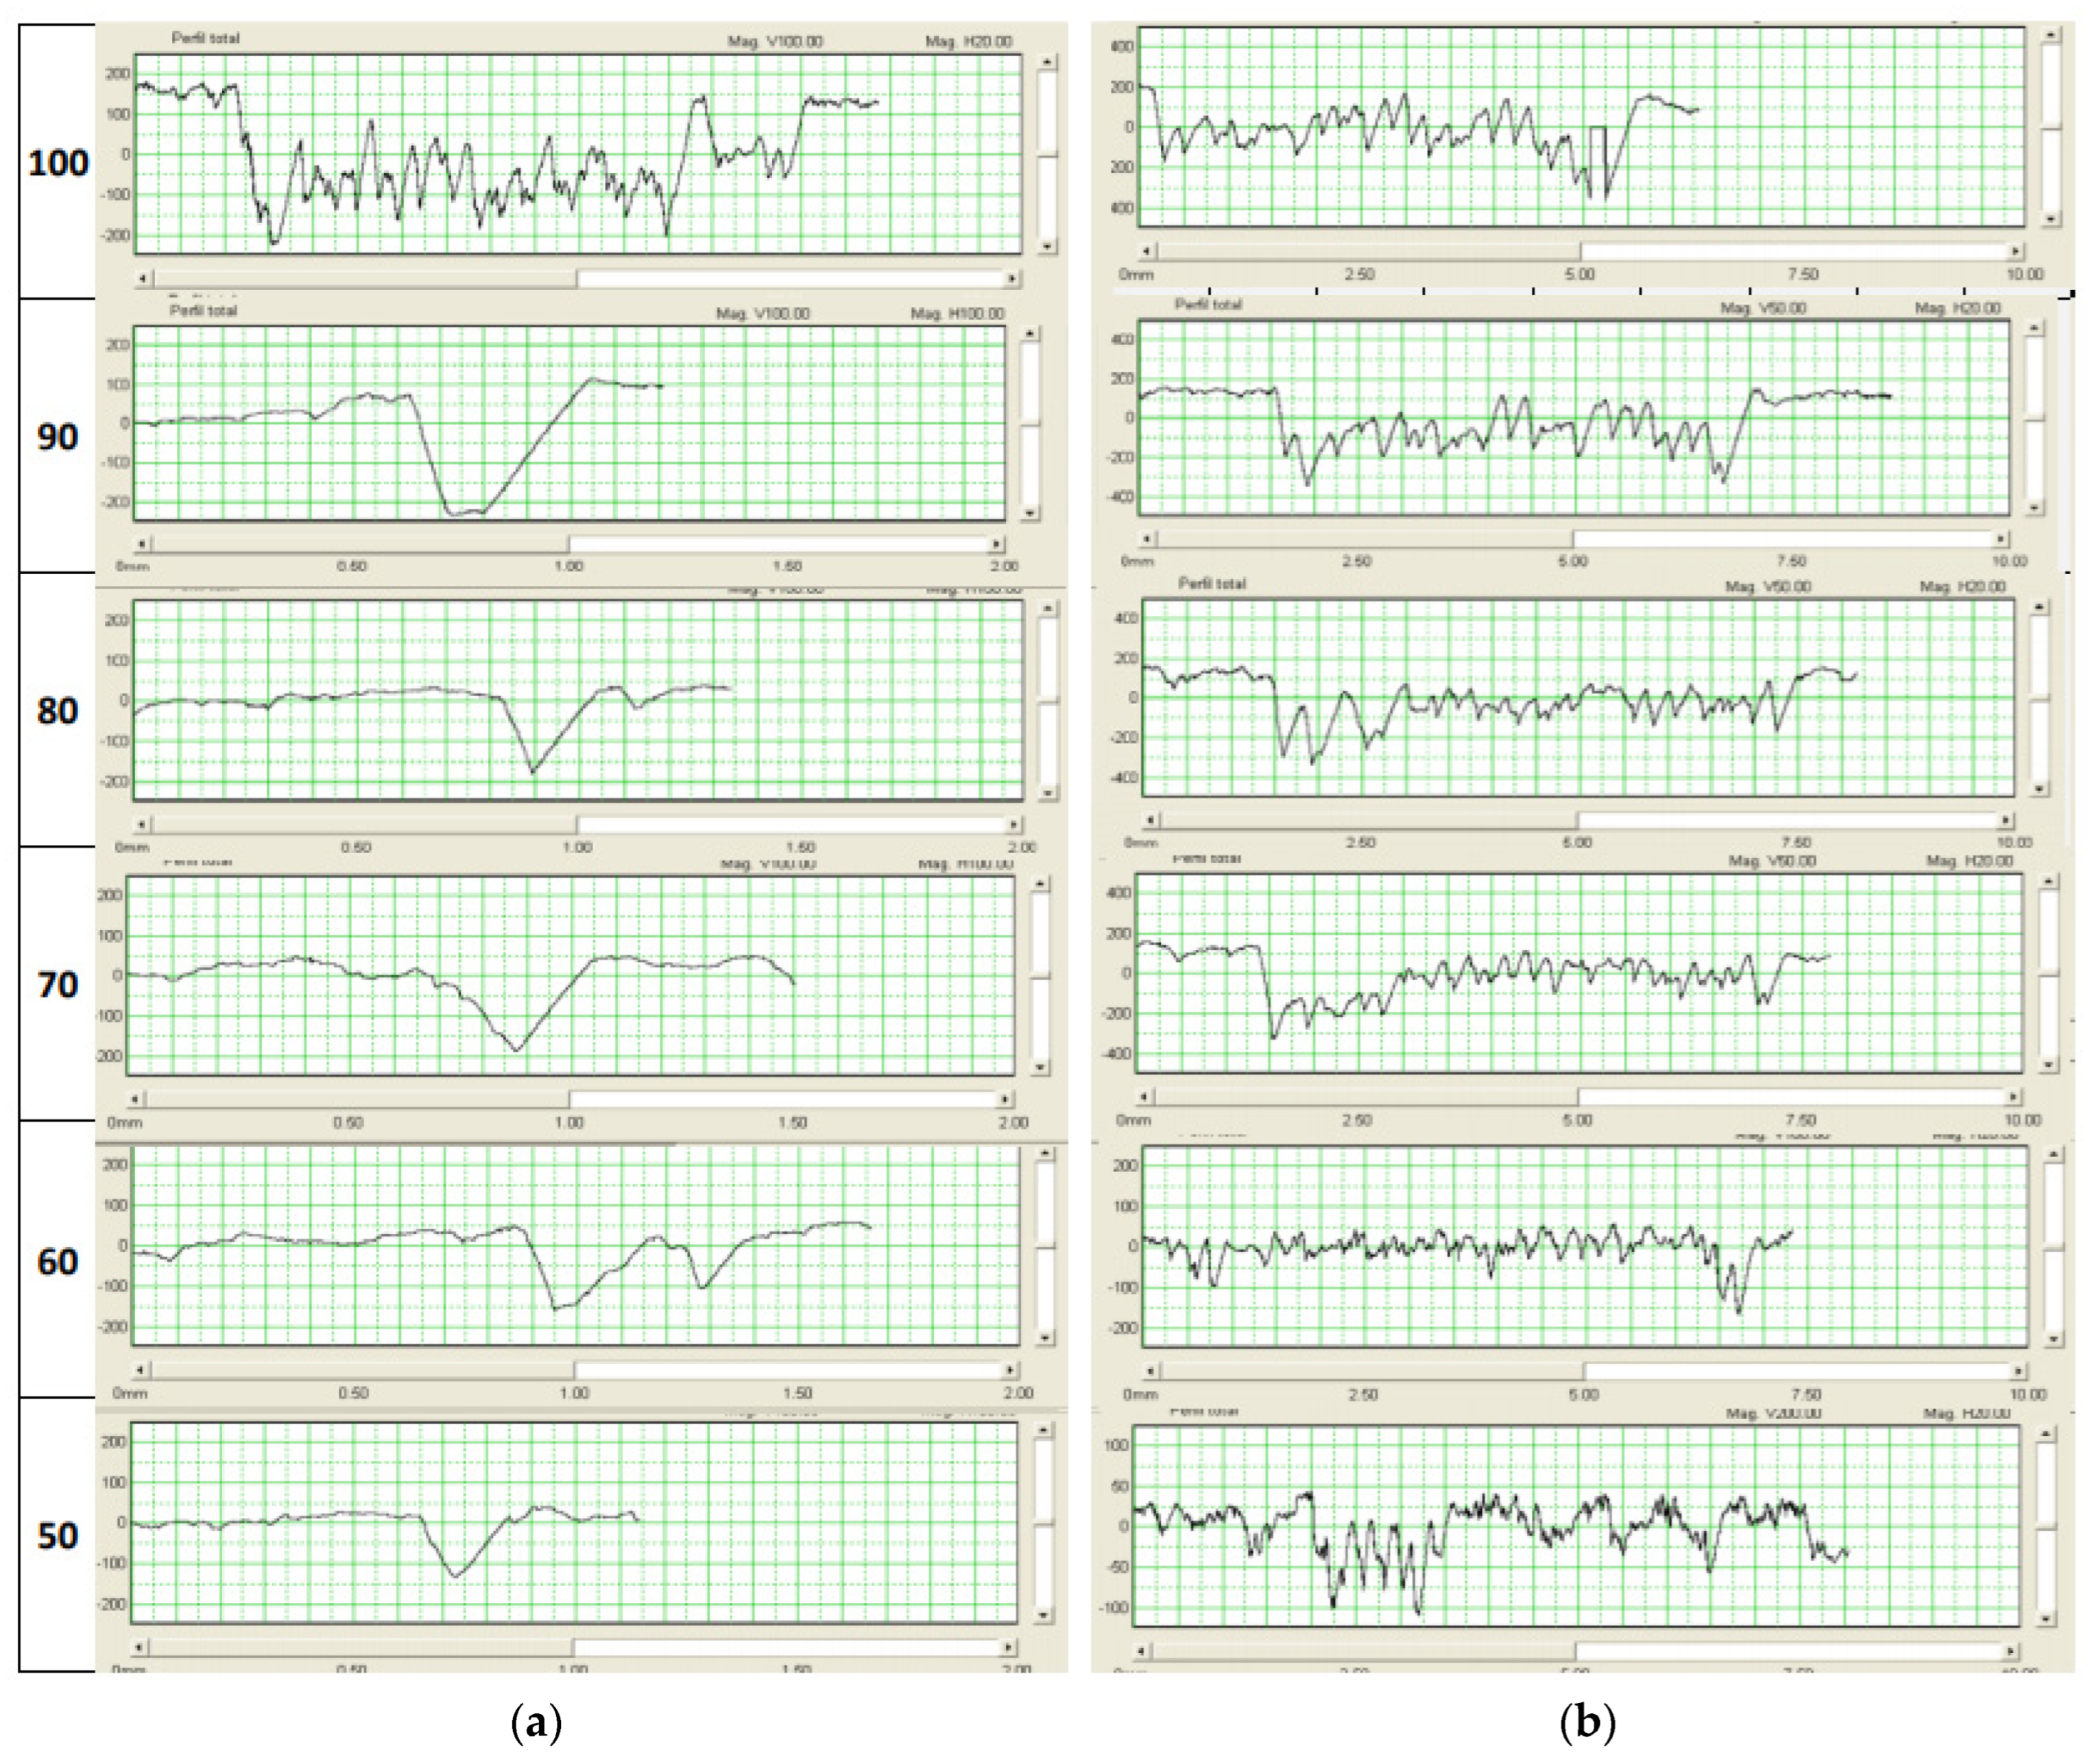
Figure A2.
(a) One measurement on one line and (b) the black area for 1100 mm/min and different ranges of power from 50% to 100% of the laser.
Figure A2.
(a) One measurement on one line and (b) the black area for 1100 mm/min and different ranges of power from 50% to 100% of the laser.
Table A3.
One measurement on one line and the black area for 1200 mm/min and different ranges of power from 50% to 100% of the laser [parameters in µm].
Table A3.
One measurement on one line and the black area for 1200 mm/min and different ranges of power from 50% to 100% of the laser [parameters in µm].
| One Line |
|---|
| % | Pa | Pq | Pp | Pv | Ra | Rq | Rz | Rp | Rv |
|---|
| 100 | 69.62 | 95.46 | 63.58 | 305.46 | 34.86 | 55.53 | 308.44 | 110.48 | 197.96 |
| 90 | 59.03 | 78.59 | 92.10 | 225.44 | 36.17 | 51.13 | 229.30 | 67.30 | 1620 |
| 80 | 49.30 | 72.43 | 71.46 | 262.1 | 33.62 | 50.10 | 276.26 | 85.72 | 190.54 |
| 70 | 25.11 | 38.34 | 39.20 | 166.76 | 19.63 | 29.49 | 192.06 | 58.22 | 133.84 |
| 60 | 38.27 | 57.59 | 60.32 | 207.78 | 24.78 | 38.63 | 210.70 | 58.54 | 152.16 |
| 50 | 24.72 | 33.84 | 54.94 | 970 | 19.23 | 26.85 | 127.18 | 48.48 | 78.70 |
| Black Area |
| % | Pa | Pq | Pp | Pv | Ra | Rq | Rz | Rp | Rv |
| 100 | 105.65 | 123.65 | 202.60 | 292.36 | 60.71 | 73.01 | 340.47 | 153.88 | 186.59 |
| 90 | 102.28 | 121.22 | 232.00 | 310.98 | 51.45 | 65.76 | 322.88 | 146.76 | 176.12 |
| 80 | 67.51 | 85.63 | 807.90 | 276.10 | 54.48 | 70.28 | 357.20 | 140.53 | 216.67 |
| 70 | 47.29 | 56.67 | 111.28 | 144.10 | 37.54 | 46.51 | 243.81 | 108.66 | 135.15 |
| 60 | 28.73 | 38.33 | 56.94 | 162.38 | 23.93 | 32.9 | 207.11 | 59.12 | 147.99 |
| 50 | 16.96 | 22.75 | 47.78 | 95.70 | 14.92 | 20.12 | 114.71 | 44.06 | 70.65 |
Figure A3.
(a) One measurement on one line and (b) the black area for 1200 mm/min and different ranges of power from 50% to 100% of the laser.
Figure A3.
(a) One measurement on one line and (b) the black area for 1200 mm/min and different ranges of power from 50% to 100% of the laser.
Table A4.
One measurement on one line and the black area for 1300 mm/min and different ranges of power from 50% to 100% of the laser [parameters in µm].
Table A4.
One measurement on one line and the black area for 1300 mm/min and different ranges of power from 50% to 100% of the laser [parameters in µm].
| One Line |
|---|
| % | Pa | Pq | Pp | Pv | Ra | Rq | Rz | Rp | Rv |
|---|
| 100 | 32.09 | 44.72 | 53.54 | 179.92 | 22.31 | 30.99 | 147.97 | 56.55 | 91.42 |
| 90 | 23.87 | 35.00 | 37.44 | 154.00 | 16.83 | 27.44 | 176.14 | 45.68 | 130.46 |
| 80 | 32.50 | 50.72 | 57.88 | 206.78 | 22.26 | 37.25 | 235.42 | 79.36 | 156.06 |
| 70 | 36.71 | 55.48 | 42.38 | 201.30 | 21.95 | 29.85 | 128.28 | 46.25 | 82.03 |
| 60 | 28.42 | 40.21 | 65.22 | 145.46 | 18.17 | 22.66 | 98.99 | 36.80 | 62.19 |
| 50 | 22.65 | 34.69 | 39.22 | 125.34 | 15.15 | 19.90 | 86.85 | 35.27 | 51.58 |
| Black Area |
| % | Pa | Pq | Pp | Pv | Ra | Rq | Rz | Rp | Rv |
| 100 | 86.66 | 102.61 | 180.52 | 222.46 | 45.06 | 59.12 | 291.83 | 134.17 | 157.66 |
| 90 | 81.44 | 100.86 | 206.76 | 227.74 | 51.82 | 63.54 | 274.98 | 121.64 | 153.34 |
| 80 | 69.41 | 83.70 | 157.92 | 240.22 | 45.61 | 57.92 | 283.98 | 125.73 | 158.25 |
| 70 | 43.68 | 54.88 | 134.04 | 154.96 | 35.55 | 46.61 | 264.35 | 111.63 | 152.72 |
| 60 | 19.14 | 27.81 | 64.48 | 151.12 | 17.12 | 22.71 | 121.27 | 49.40 | 71.87 |
| 50 | 17.05 | 22.8 | 45.64 | 95.02 | 16.30 | 21.47 | 132.99 | 45.00 | 87.99 |
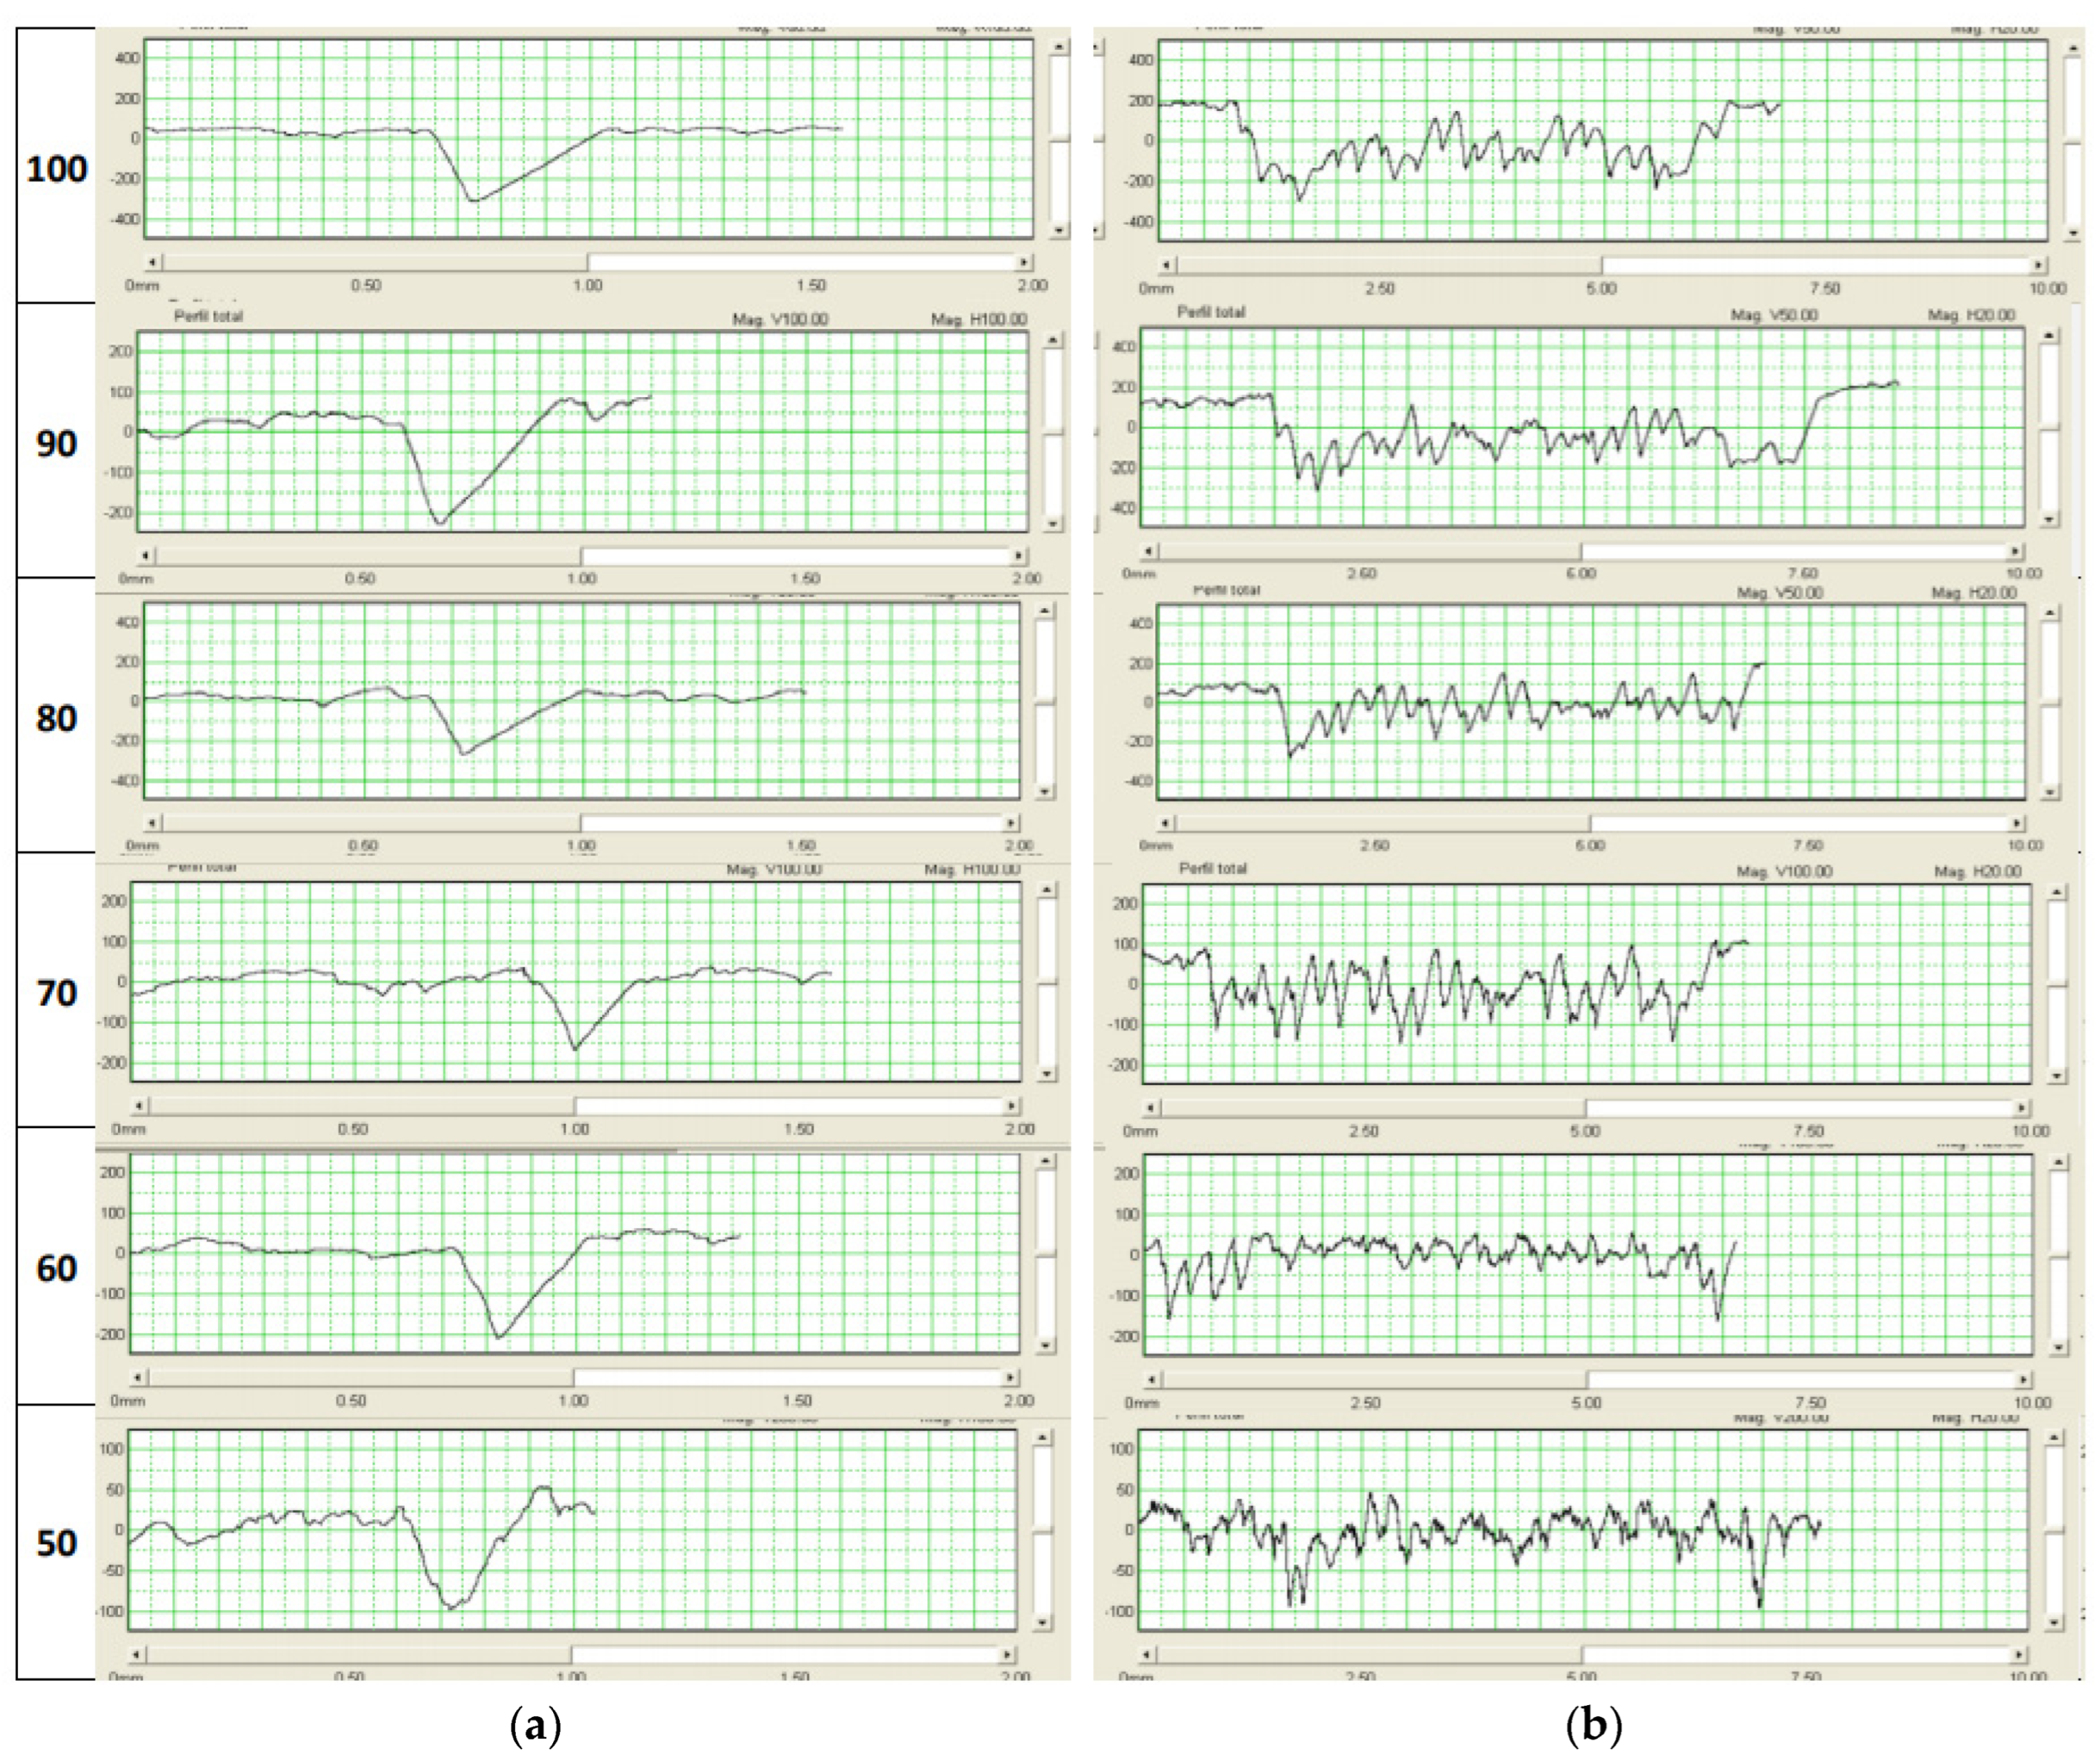
Figure A4.
(a) One measurement on one line and (b) the black area for 1300 mm/min and different ranges of power from 50% to 100% of the laser.
Figure A4.
(a) One measurement on one line and (b) the black area for 1300 mm/min and different ranges of power from 50% to 100% of the laser.
Table A5.
One measurement on one line and the black area for 1400 mm/min and different ranges of power from 50% to 100% of the laser [parameters in µm].
Table A5.
One measurement on one line and the black area for 1400 mm/min and different ranges of power from 50% to 100% of the laser [parameters in µm].
| One Line |
|---|
| % | Pa | Pq | Pp | Pv | Ra | Rq | Rz | Rp | Rv |
|---|
| 100 | 61.61 | 87.88 | 69.01 | 275.42 | 35.56 | 45.97 | 190.66 | 88.56 | 102.10 |
| 90 | 71.86 | 95.96 | 115.08 | 230.28 | 41.96 | 61.04 | 264.18 | 111.62 | 152.56 |
| 80 | 26.80 | 41.83 | 39.96 | 177.44 | 20.37 | 32.93 | 197.06 | 49.20 | 147.86 |
| 70 | 37.97 | 53.99 | 49.72 | 186.50 | 22.32 | 33.56 | 185.12 | 58.46 | 126.66 |
| 60 | 35.71 | 48.30 | 59.36 | 156.46 | 23.98 | 31.06 | 137.78 | 60.01 | 77.77 |
| 50 | 23.81 | 36.35 | 40.28 | 131.64 | 19.12 | 30.12 | 155.04 | 44.06 | 110.98 |
| Black Area |
| % | Pa | Pq | Pp | Pv | Ra | Rq | Rz | Rp | Rv |
| 100 | 80.10 | 101.66 | 219.06 | 354.88 | 62.87 | 78.72 | 409.69 | 160.08 | 249.61 |
| 90 | 106.51 | 121.26 | 158.44 | 338.20 | 54.17 | 74.73 | 387.87 | 154.05 | 233.82 |
| 80 | 81.60 | 102.34 | 163.38 | 328.20 | 50.53 | 63.30 | 306.87 | 121.55 | 185.32 |
| 70 | 81.52 | 101.13 | 161.36 | 324.88 | 44.18 | 58.05 | 295.13 | 111.69 | 183.44 |
| 60 | 22.40 | 33.00 | 57.48 | 163.64 | 21.10 | 28.76 | 163.11 | 49.62 | 133.49 |
| 50 | 22.46 | 28.46 | 43.72 | 107.88 | 18.06 | 23.05 | 118.29 | 42.40 | 75.89 |
Figure A5.
(a) One measurement on one line and the (b) black area for 1400 mm/min and different ranges of power from 50% to 100% of the laser.
Figure A5.
(a) One measurement on one line and the (b) black area for 1400 mm/min and different ranges of power from 50% to 100% of the laser.
Table A6.
One measurement on one line and the black area for 1500 mm/min and different ranges of power from 50% to 100% of the laser [parameters in µm].
Table A6.
One measurement on one line and the black area for 1500 mm/min and different ranges of power from 50% to 100% of the laser [parameters in µm].
| One Line |
|---|
| % | Pa | Pq | Pp | Pv | Ra | Rq | Rz | Rp | Rv |
|---|
| 100 | 35.25 | 50.37 | 47.98 | 215.04 | 14.63 | 22.19 | 114.55 | 36.88 | 77.67 |
| 90 | 46.46 | 65.89 | 75.16 | 221.22 | 30.01 | 42.63 | 179.75 | 76.96 | 102.79 |
| 80 | 31.79 | 47.62 | 44.00 | 190.48 | 22.53 | 34.56 | 203.78 | 55.08 | 148.70 |
| 70 | 41.09 | 54.54 | 93.02 | 173.76 | 16.82 | 22.43 | 119.42 | 54.25 | 65.17 |
| 60 | 33.17 | 49.72 | 68.40 | 202.00 | 21.78 | 30.61 | 138.47 | 48.83 | 89.64 |
| 50 | 19.11 | 31.86 | 42.8 | 147.88 | 15.22 | 25.87 | 173.78 | 48.98 | 124.80 |
| Black Area |
| % | Pa | Pq | Pp | Pv | Ra | Rq | Rz | Rp | Rv |
| 100 | 79.84 | 99.00 | 173.88 | 287.14 | 57.98 | 74.06 | 357.01 | 129.73 | 227.28 |
| 90 | 104.55 | 127.30 | 249.86 | 305.12 | 62.58 | 78.48 | 385.33 | 155.45 | 229.88 |
| 80 | 53.35 | 68.83 | 178.80 | 235.16 | 44.18 | 53.68 | 241.31 | 102.09 | 139.22 |
| 70 | 40.13 | 58.19 | 117.94 | 237.74 | 31.66 | 42.67 | 199.74 | 82.88 | 116.86 |
| 60 | 29.01 | 39.15 | 73.02 | 159.10 | 19.86 | 27.66 | 168.13 | 50.53 | 117.61 |
| 50 | 21.06 | 28.40 | 53.42 | 101.12 | 16.36 | 21.54 | 107.69 | 35.67 | 72.02 |
Figure A6.
(a) One measurement on one line and (b) the black area for 1500 mm/min and different ranges of power from 50% to 100% of the laser.
Figure A6.
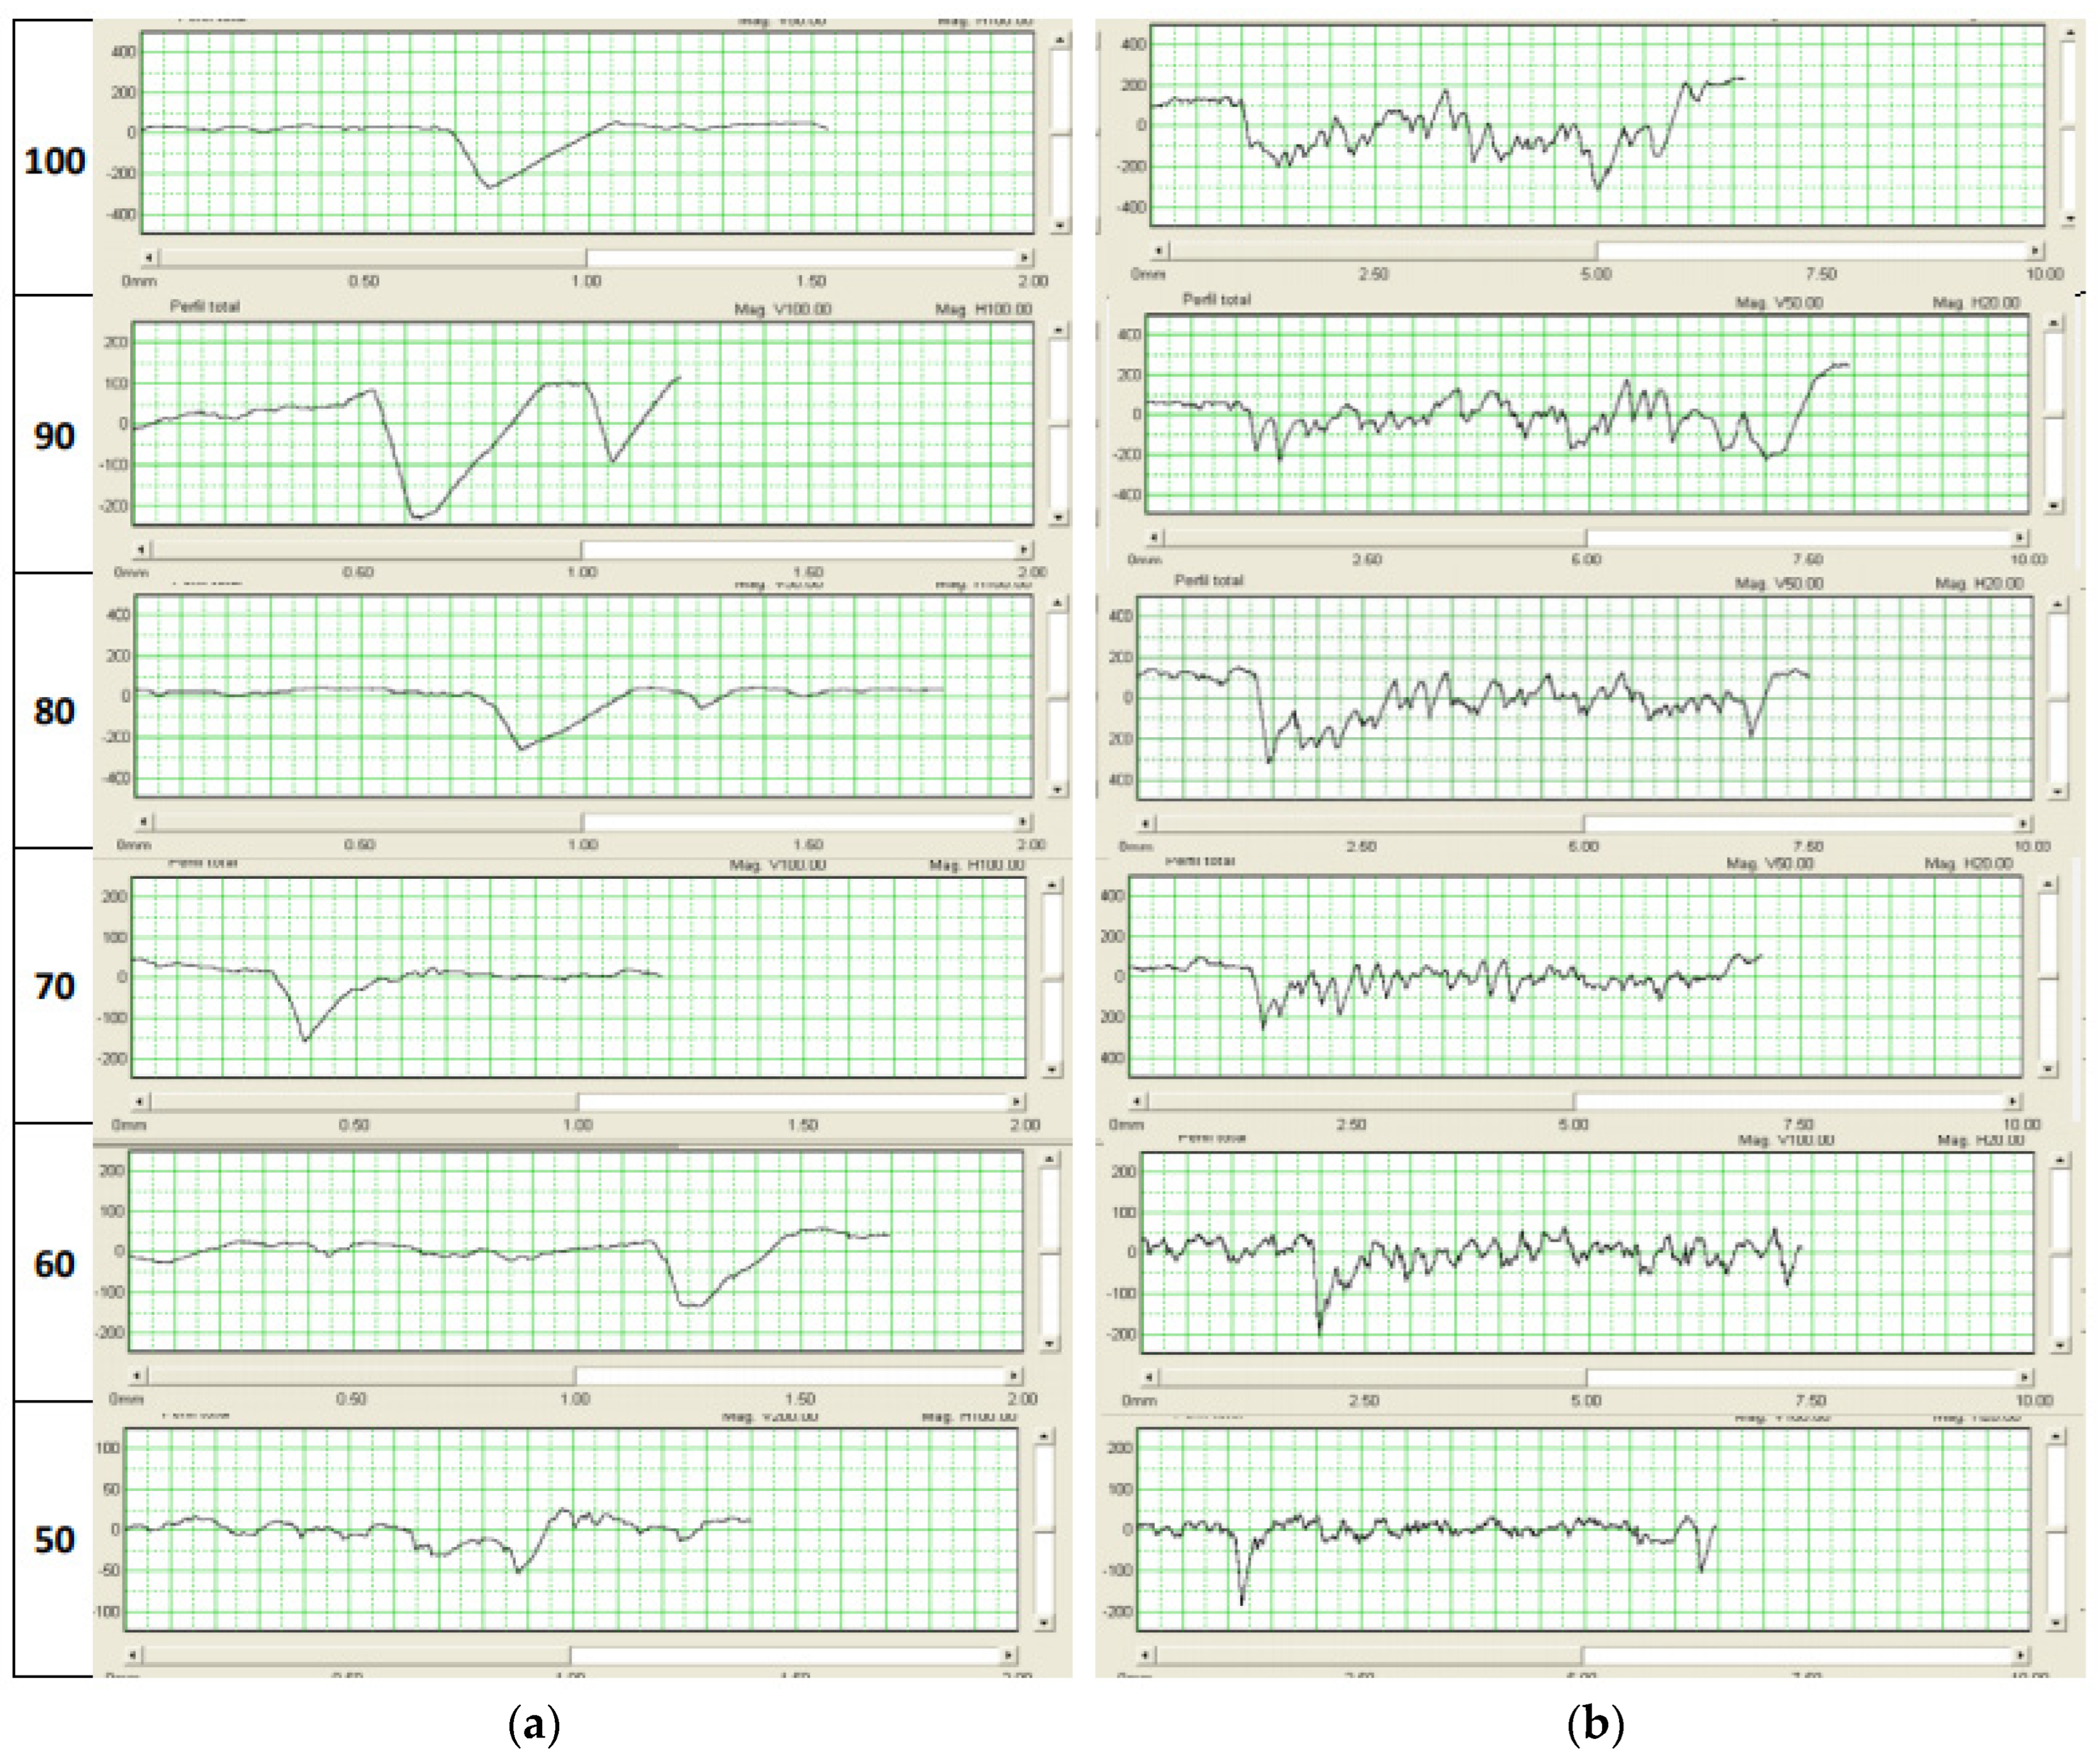
(a) One measurement on one line and (b) the black area for 1500 mm/min and different ranges of power from 50% to 100% of the laser.
Table A7.
One measurement on one line and the black area for 1600 mm/min and different ranges of power from 50% to 100% of the laser [parameters in µm].
Table A7.
One measurement on one line and the black area for 1600 mm/min and different ranges of power from 50% to 100% of the laser [parameters in µm].
| One Line |
|---|
| % | Pa | Pq | Pp | Pv | Ra | Rq | Rz | Rp | Rv |
|---|
| 100 | 35.46 | 58.52 | 56.02 | 259.26 | 22.14 | 33.00 | 135.42 | 61.10 | 74.32 |
| 90 | 40.27 | 60.37 | 61.10 | 221.66 | 26.08 | 41.42 | 232.16 | 68.22 | 163.94 |
| 80 | 24.36 | 36.41 | 51.90 | 157.56 | 20.45 | 31.95 | 196.38 | 57.50 | 138.88 |
| 70 | 53.61 | 75.72 | 73.20 | 230.96 | 27.66 | 41.53 | 192.66 | 70.65 | 122.01 |
| 60 | 16.30 | 21.44 | 38.12 | 74.34 | 11.38 | 15.46 | 84.82 | 26.36 | 58.46 |
| 50 | 23.98 | 35.67 | 39.64 | 146.88 | 15.88 | 25.88 | 163.12 | 46.98 | 116.14 |
| Black Area |
| % | Pa | Pq | Pp | Pv | Ra | Rq | Rz | Rp | Rv |
| 100 | 84.07 | 112.97 | 210.22 | 396.98 | 42.33 | 52.73 | 258.16 | 100.21 | 157.95 |
| 90 | 96.25 | 116.04 | 239.86 | 316.26 | 56.45 | 73.07 | 355.03 | 139.35 | 215.68 |
| 80 | 54.65 | 69.10 | 116.40 | 268.50 | 47.21 | 61.17 | 323.62 | 105.35 | 218.27 |
| 70 | 42.76 | 55.83 | 136.42 | 195.86 | 35.44 | 45.04 | 212.07 | 95.54 | 116.53 |
| 60 | 21.81 | 31.37 | 51.04 | 202.32 | 18.46 | 26.00 | 156.65 | 44.60 | 112.05 |
| 50 | 121.13 | 38.49 | 73.08 | 135.06 | 22.71 | 30.93 | 174.97 | 55.42 | 119.55 |
Figure A7.
(a) One measurement on one line and (b) the black area for 1600 mm/min and different ranges of power from 50% to 100% of the laser.
Figure A7.
(a) One measurement on one line and (b) the black area for 1600 mm/min and different ranges of power from 50% to 100% of the laser.
Table A8.
One measurement on one line and the black area for 1700 mm/min and different ranges of power from 50% to 100% of the laser [parameters in µm].
Table A8.
One measurement on one line and the black area for 1700 mm/min and different ranges of power from 50% to 100% of the laser [parameters in µm].
| One Line |
|---|
| % | Pa | Pq | Pp | Pv | Ra | Rq | Rz | Rp | Rv |
|---|
| 100 | 28.18 | 44.61 | 45.36 | 188.04 | 18.41 | 28.20 | 119.15 | 38.85 | 80.30 |
| 90 | 27.01 | 42.28 | 48.12 | 188.92 | 19.67 | 28.30 | 128.55 | 44.32 | 84.23 |
| 80 | 49.22 | 66.58 | 82.16 | 191.28 | 32.11 | 48.16 | 222.60 | 70.18 | 152.42 |
| 70 | 28.10 | 39.54 | 56.12 | 151.90 | 20.69 | 25.42 | 110.45 | 38.14 | 72.31 |
| 60 | 20.38 | 31.20 | 50.88 | 137.64 | 16.33 | 22.27 | 106.20 | 40.68 | 65.52 |
| 50 | 15.68 | 18.60 | 35.66 | 48.68 | 11.32 | 14.13 | 73.44 | 26.24 | 47.20 |
| Black Area |
| % | Pa | Pq | Pp | Pv | Ra | Rq | Rz | Rp | Rv |
| 100 | 106.89 | 131.42 | 339.42 | 291.70 | 56.58 | 71.69 | 384.59 | 205.42 | 179.17 |
| 90 | 89.93 | 108.58 | 190.04 | 293.04 | 53.99 | 67.93 | 325.47 | 140.18 | 185.29 |
| 80 | 70.98 | 89.48 | 143.26 | 291.90 | 48.58 | 62.61 | 291.41 | 122.06 | 169.35 |
| 70 | 54.72 | 67.69 | 119.32 | 255.72 | 38.35 | 51.25 | 294.54 | 108.61 | 185.93 |
| 60 | 26.72 | 38.95 | 58.32 | 211.92 | 20.83 | 29.70 | 178.09 | 46.11 | 131.98 |
| 50 | 22.84 | 30.40 | 55.16 | 132.30 | 18.01 | 24.20 | 141.05 | 253.21 | 87.84 |
Figure A8.
(a) One measurement on one line and (b) the black area for 1700 mm/min and different ranges of power from 50% to 100% of the laser.
Figure A8.
(a) One measurement on one line and (b) the black area for 1700 mm/min and different ranges of power from 50% to 100% of the laser.
Table A9.
One measurement on one line and the black area for 1800 mm/min and different ranges of power from 50% to 100% of the laser [parameters in µm].
Table A9.
One measurement on one line and the black area for 1800 mm/min and different ranges of power from 50% to 100% of the laser [parameters in µm].
| One Line |
|---|
| % | Pa | Pq | Pp | Pv | Ra | Rq | Rz | Rp | Rv |
|---|
| 100 | 44.14 | 59.71 | 67.54 | 163.26 | 21.50 | 29.92 | 120.89 | 66.77 | 54.12 |
| 90 | 14.54 | 21.33 | 50.88 | 91.32 | 13.01 | 18.27 | 107.76 | 28.00 | 79.76 |
| 80 | 46.09 | 62.52 | 84.10 | 199.56 | 27.02 | 42.43 | 248.38 | 100.96 | 147.42 |
| 70 | 35.67 | 46.71 | 63.76 | 147.12 | 22.57 | 30.69 | 166.06 | 59.84 | 106.22 |
| 60 | 28.65 | 36.99 | 48.7 | 102.84 | 18.57 | 23.15 | 111.96 | 47.32 | 64.64 |
| 50 | 18.37 | 26.13 | 37.94 | 123.68 | 15.32 | 22.82 | 149.92 | 39.10 | 110.82 |
| Black Area |
| % | Pa | Pq | Pp | Pv | Ra | Rq | Rz | Rp | Rv |
| 100 | 84.14 | 97.74 | 160.94 | 223.64 | 37.25 | 45.82 | 220.91 | 91.53 | 129.38 |
| 90 | 76.37 | 89.48 | 140.58 | 246.78 | 45.92 | 56.55 | 285.07 | 133.57 | 151.50 |
| 80 | 64.33 | 77.61 | 187.66 | 168.80 | 41.07 | 50.85 | 252.71 | 117.85 | 134.86 |
| 70 | 43.31 | 54.63 | 129.70 | 195.72 | 33.33 | 42.15 | 205.03 | 87.19 | 117.84 |
| 60 | 19.94 | 26.32 | 58.20 | 114.28 | 17.89 | 23.25 | 131.23 | 51.35 | 79.87 |
| 50 | 29.63 | 35.29 | 58.74 | 127.26 | 20.51 | 24.87 | 118.25 | 50.51 | 67.73 |
Figure A9.
(a) One measurement on one line and (b) the black area for 1800 mm/min and different ranges of power from 50% to 100% of the laser.
Figure A9.
(a) One measurement on one line and (b) the black area for 1800 mm/min and different ranges of power from 50% to 100% of the laser.
Table A10.
One measurement on one line and the black area for 1900 mm/min and different ranges of power from 50% to 100% of the laser [parameters in µm].
Table A10.
One measurement on one line and the black area for 1900 mm/min and different ranges of power from 50% to 100% of the laser [parameters in µm].
| One Line |
|---|
| % | Pa | Pq | Pp | Pv | Ra | Rq | Rz | Rp | Rv |
|---|
| 100 | 30.79 | 45.3 | 49.00 | 187.82 | 19.66 | 32.81 | 219.18 | 68.46 | 150.72 |
| 90 | 61.41 | 86.91 | 78.92 | 288.42 | 35.99 | 56.14 | 323.48 | 117.28 | 206.20 |
| 80 | 57.25 | 83.77 | 61.22 | 276.94 | 30.44 | 48.56 | 240.10 | 80.35 | 159.75 |
| 70 | 37.99 | 60.40 | 46.04 | 241.56 | 23.93 | 38.11 | 266.94 | 61.45 | 165.49 |
| 60 | 20.11 | 29.49 | 36.44 | 120.88 | 15.21 | 24.41 | 145.26 | 34.90 | 110.36 |
| 50 | 16.79 | 20.07 | 39.24 | 58.82 | 13.27 | 16.53 | 86.26 | 33.88 | 52.38 |
| Black Area |
| % | Pa | Pq | Pp | Pv | Ra | Rq | Rz | Rp | Rv |
| 100 | 76.47 | 94.34 | 192.40 | 274.04 | 56.83 | 72.02 | 356.22 | 121.58 | 234.64 |
| 90 | 111.87 | 132.90 | 300.90 | 329.98 | 70.39 | 85.51 | 374.41 | 167.78 | 206.63 |
| 80 | 65.92 | 83.44 | 230.52 | 329.80 | 53.10 | 67.13 | 323.87 | 138.34 | 185.53 |
| 70 | 54.26 | 64.14 | 110.50 | 217.18 | 41.08 | 50.40 | 253.57 | 110.77 | 142.81 |
| 60 | 23.55 | 36.09 | 54.40 | 228.90 | 20.58 | 30.91 | 197.89 | 50.41 | 147.49 |
| 50 | 24.10 | 31.55 | 71.16 | 119.36 | 20.45 | 25.75 | 134.50 | 50.14 | 84.36 |
Figure A10.
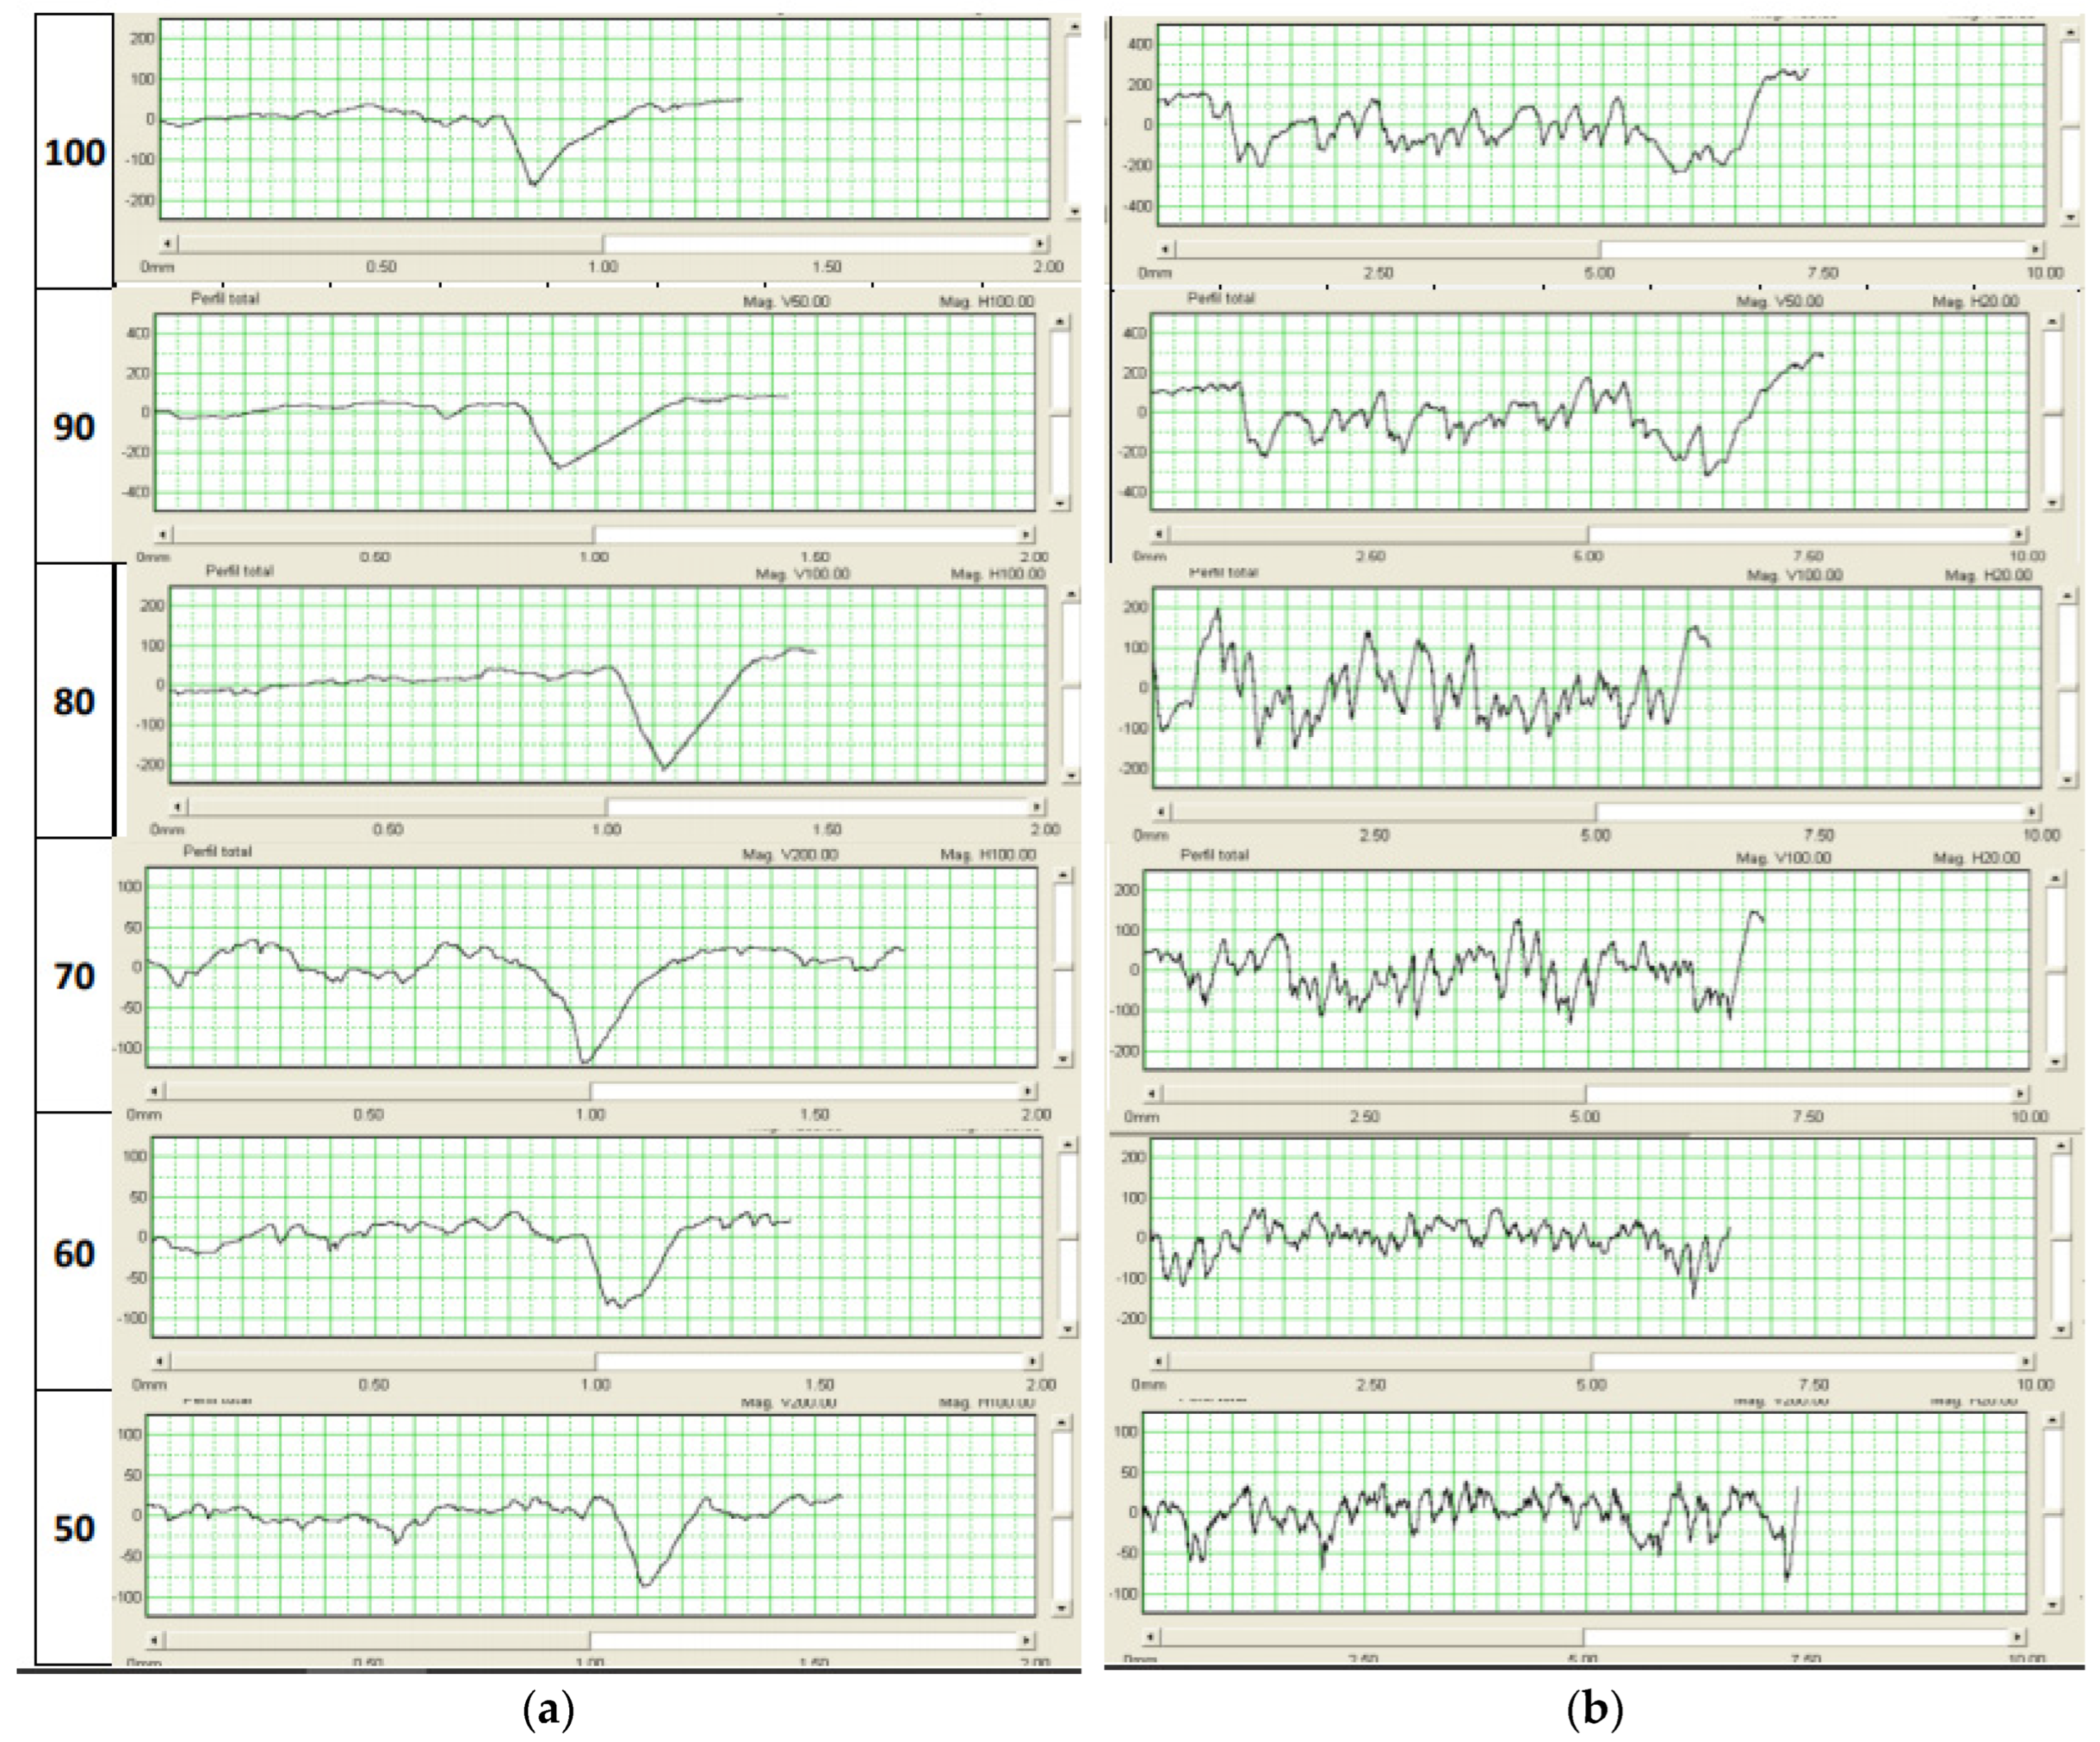
(a) One measurement on one line and (b) the black area for 1900 mm/min and different ranges of power from 50% to 100% of the laser.
Figure A10.
(a) One measurement on one line and (b) the black area for 1900 mm/min and different ranges of power from 50% to 100% of the laser.
Appendix B
Detailed photo of the whole table worked on.
Figure A11.
Samples on the bamboo table.
Figure A11.
Samples on the bamboo table.
Appendix C
Plots for all the velocities and power levels of the parameters in the one-line profile.
Figure A12.
A speed of 1000 mm/min—one line.
Figure A12.
A speed of 1000 mm/min—one line.
Figure A13.
A speed of 1100 mm/min—one line.
Figure A13.
A speed of 1100 mm/min—one line.
Figure A14.
A speed of 1200 mm/min—one line.
Figure A14.
A speed of 1200 mm/min—one line.
Figure A15.
A speed of 1300 mm/min—one line.
Figure A15.
A speed of 1300 mm/min—one line.
Figure A16.
A speed of 1400 mm/min—one line.
Figure A16.
A speed of 1400 mm/min—one line.
Figure A17.
A speed of 1500 mm/min—one line.
Figure A17.
A speed of 1500 mm/min—one line.
Figure A18.
A speed of 1600 mm/min—one line.
Figure A18.
A speed of 1600 mm/min—one line.
Figure A19.
A speed of 1700 mm/min—one line.
Figure A19.
A speed of 1700 mm/min—one line.
Figure A20.
A speed of 1800 mm/min—one line.
Figure A20.
A speed of 1800 mm/min—one line.
Figure A21.
A speed of 1900 mm/min—one line.
Figure A21.
A speed of 1900 mm/min—one line.
Appendix D
Plots for all the velocities and power levels of the parameters in the black area’s profile.
Figure A22.
A speed of 1000 mm/min—black area.
Figure A22.
A speed of 1000 mm/min—black area.
Figure A23.
A speed of 1100 mm/min—black area.
Figure A23.
A speed of 1100 mm/min—black area.
Figure A24.
A speed of 1200 mm/min—black area.
Figure A24.
A speed of 1200 mm/min—black area.
Figure A25.
A speed of 1300 mm/min—black area.
Figure A25.
A speed of 1300 mm/min—black area.
Figure A26.
A speed of 1400 mm/min—black area.
Figure A26.
A speed of 1400 mm/min—black area.
Figure A27.
A speed of 1500 mm/min—black area.
Figure A27.
A speed of 1500 mm/min—black area.
Figure A28.
A speed of 1600 mm/min—black area.
Figure A28.
A speed of 1600 mm/min—black area.
Figure A29.
A speed of 1700 mm/min—black area.
Figure A29.
A speed of 1700 mm/min—black area.
Figure A30.
A speed of 1800 mm/min—black area.
Figure A30.
A speed of 1800 mm/min—black area.
Figure A31.
A speed of 1900 mm/min—black area.
Figure A31.
A speed of 1900 mm/min—black area.
References
- Boyd, I.W. Electronic Materials: Laser processing and diagnostics. Phys. Bull. 1984, 35, 419–420. [Google Scholar] [CrossRef]
- Zhang, G.S. Modern Laser Manufacturing Technology; Chemical Industry Press: Beijing, China, 2006. [Google Scholar]
- Zhang, Y.K.; Zhou, J.Z.; Ye, Y.X. Laser Processing Technology; Chemical Industry Press: Beijing, China, 2004. [Google Scholar]
- Yao, Z.Q.; Lawrence, Y.Y.; Wang, F.; Liu, G. Progress in advanced laser assisted manufacturing technology. Chin. J. Mech. Eng. 2003, 39, 57–61. [Google Scholar] [CrossRef]
- Li, Y.H. Theory and Technology of Laser Shock Processing; Science Press: Beijing, China, 2013. [Google Scholar]
- Babu, P.D.; Balasubramanian, K.; Buvanashekaran, G. Laser surface hardening: A review. Int. J. Surf. Sci. Eng. 2011, 5, 131. [Google Scholar] [CrossRef]
- Bonse, J.; Kirner, S.; Griepentrog, M.; Spaltmann, D.; Krüger, J. Femtosecond Laser Texturing of Surfaces for Tribological Applications. Materials 2018, 11, 801. [Google Scholar] [CrossRef] [PubMed]
- Ta, V.D.; Dunn, A.; Wasley, T.J.; Li, J.; Kay, R.W.; Stringer, J.; Smith, P.J.; Esenturk, E.; Connaughton, C.; Shephard, J.D. Laser textured surface gradients. Appl. Surf. Sci. 2016, 371, 583–589. [Google Scholar] [CrossRef]
- Lawrence, J.; Waugh, D.G. Laser Surface Engineering; Elsevier: Oxford, UK, 2015. [Google Scholar]
- Jonathan, R.; Lawrence Waugh, D. (Eds.) Laser Surface Engineering: Processes and Applications; Elsevier: Amsterdam, The Netherlands, 2014. [Google Scholar]
- Corrielli, G.; Crespi, A.; Osellame, R. Femtosecond laser micromachining for integrated quantum photonics. Nanophotonics 2021, 10, 3789–3812. [Google Scholar] [CrossRef]
- Ji, X.; Sun, Y. Special issue on laser surface engineering for tribology. Lubricants 2024, 12, 98. [Google Scholar] [CrossRef]
- Peethan, A.; Unnikrishnan, V.K.; Chidangil, S.; George, S.D. Laser-Assisted Tailoring of Surface Wettability-Fundamentals and Applications: A Critical Review. Prog. Adhes. Adhes. 2020, 5, 331–365. [Google Scholar]
- Zupančič, M; Gregorčič, P. Laser surface engineering for boiling heat transfer applications. In Materials with Extreme Wetting Properties: Methods and Emerging Industrial Applications; Springer International Publishing: Cham, Switzerland, 2021; pp. 245–303. [Google Scholar]
- Manvatkar, V.; De, A.; DebRoy, T. Heat transfer and material flow during laser assisted multi-layer additive manufacturing. J. Appl. Phys. 2014, 116. [Google Scholar] [CrossRef]
- Conradi, M.; Drnovšek, A.; Gregorčič, P. Wettability and friction control of a stainless steel surface by combining nanosecond laser texturing and adsorption of superhydrophobic nanosilica particles. Sci. Rep. 2018, 8, 7457. [Google Scholar] [CrossRef] [PubMed]
- Sedlaček, M.; Gregorčič, P.; Podgornik, B. Use of the Roughness Parameters Ssk and Sku to Control Friction—A Method for Designing Surface Texturing. Tribol. Trans. 2016, 60, 260–266. [Google Scholar] [CrossRef]
- Mendieta-Echevarría, L.; Sáenz-Nuño, M.A.; Rubio, E.M. Comparing the Effectiveness of R and S Roughness Parameters on Surfaces Lubricated with Standardized Nominal Particle Size Lubricants. Lubricants 2025, 13, 148. [Google Scholar] [CrossRef]
- Adamiak, M.; Appiah, A.N.S.; Woźniak, A.; Bialas, O. Surface Modification of Metallic Materials Using Laser and Plasma Technologies. In Critical Infrastructure Protection in the Light of the Armed Conflicts; Kovács, T.A., Nyikes, Z., Berek, T., Daruka, N., Tóth, L., Eds.; Springer: Cham, Switzerland, 2024. [Google Scholar] [CrossRef]
- Tan, C.O.; Ogata, S.; Yap, H.J.; Soo, J.X.; Usop, Z.; Fauthan, M.; Liew, S.J.; Ng, S.-C. ‘Tracheid effect’ light scattering response of common commercial species of Malaysia using red laser (650 nm) for grain angle detection, and machine learning based performance prediction. Wood Sci. Technol. 2025, 59, 56. [Google Scholar] [CrossRef]
- Mishra, U.; Gupta, T.; Chhimwal, M.; Rana, R. Design and Development of Arduino Based CNC Laser Engraver. In Advances in Industrial and Production Engineering; Phanden, R.K., Kumar, R., Pandey, P.M., Chakraborty, A., Eds.; Springer: Singapore, 2023. [Google Scholar] [CrossRef]
- Leiter, L.; Wimmer, R. The effect of modification technologies on the triboelectric activation of wood surfaces. Wood Sci. Technol. 2025, 59, 57. [Google Scholar] [CrossRef]
- Guo, S.; Lei, L.; Ao, C.; Yan, M.; Shi, Y. A review of the application of laser processing for materials sheet joining. Int. J. Adv. Manuf. Technol. 2025, 138, 1713–1737. [Google Scholar] [CrossRef]
- ISO 1302:2002; Geometrical Product Specifications (GPS)—Indication of Surface Texture in Technical Product Documentation. ISO: Geneva, Switzerland, 2002.
- ISO 3274:1996; Geometrical Product Specifications (GPS)—Surface Texture: Profile Method—Nominal Characteristics of Contact (Stylus) Instruments. ISO: Geneva, Switzerland, 1996.
- ISO 3274:1996/COR 1:1998; Geometrical Product Specifications (GPS)—Surface Texture: Profile Method—Nominal Characteristics of Contact (Stylus) Instruments—Technical Corrigendum 1. ISO: Geneva, Switzerland, 1998.
- ISO 4287:1997; Geometrical Product Specifications (GPS)—Surface Texture: Profile Method—Terms. Definitions and Surface Texture Parameters. ISO: Geneva, Switzerland, 1997.
- ISO 4287:1997/COR 1:1998; Geometrical Product Specifications (GPS)—Surface Texture: Profile method—Terms. Definitions and Surface Texture Parameters—Technical Corrigendum 1. ISO: Geneva, Switzerland, 1997.
- ISO 4287:1997/COR 2:2005; Geometrical Product Specifications (GPS)—Surface Texture: Profile Method—Terms. Definitions and Surface Texture Parameters—Technical Corrigendum 2. ISO: Geneva, Switzerland, 1997.
- ISO 4288:1996; Geometrical Product Specifications (GPS)—Surface Texture: Profile Method—Rules and Procedures for the Assessment of Surface Texture. ISO: Geneva, Switzerland, 1996.
- ISO 4288:1996/COR 1:1998; Geometrical Product Specifications (GPS)—Surface Texture: Profile Method—Rules and Procedures for the Assessment of Surface Texture—Technical Corrigendum 1. ISO: Geneva, Switzerland, 1996.
- ISO 25178-1:2016; Geometrical Product Specifications (GPS)—Surface Texture: Areal—Part 1: Indication of Surface Texture. ISO: Geneva, Switzerland, 2016.
- ISO 25178-2:2012; Geometrical Product Specifications (GPS)—Surface Texture: Areal—Part 2: Terms. Definitions and Surface Texture Parameters. ISO: Geneva, Switzerland, 2012.
- ISO 25178-3:2012; Geometrical Product Specifications (GPS)—Surface Texture: Areal—Part 3: Specification Operators. ISO: Geneva, Switzerland, 2012.
- ISO 25178-6:2010; Geometrical Product Specifications (GPS)—Surface Texture: Areal—Part 6: Classification of Methods for Measuring Surface Texture. ISO: Geneva, Switzerland, 2010.
- ISO 25178-73:2019; Geometrical Product Specifications (GPS)—Surface Texture: Areal—Part 73: Terms and Definitions for Surface Defects on Material Measures. ISO: Geneva, Switzerland, 2019.
- ISO 25178-600:2019; Geometrical Product Specifications (GPS)—Surface Texture: Areal—Part 600: Metrological Characteristics for Areal Topography Measuring Methods. ISO: Geneva, Switzerland, 2019.
- ISO 25178-601:2010; Geometrical Product Specifications (GPS)—Surface Texture: Areal—Part 601: Nominal Characteristics of Contact (Stylus) Instruments. ISO: Geneva, Switzerland, 2010.
- ISO 25178-701:2010; Geometrical Product Specifications (GPS)—Surface Texture: Areal—Part 701: Calibration and Measurement Standards for Contact (Stylus) Instruments. ISO: Geneva, Switzerland, 2010.
- ISO 1:2002; Geometrical Product Specifications (GPS)—Standard Reference Temperature for Geometrical Product Specification and Verification. ISO: Geneva, Switzerland, 2002.
- Królczyk, G.; Kacalak, W.; Wieczorowski, M. 3D Parametric and Nonparametric Description of Surface Topography in Manufacturing Processes. Materials 2021, 14, 1987. [Google Scholar] [CrossRef] [PubMed]
- Thompson, A.; Senin, N.; Giusca, C.; Leach, R. Topography of selectively laser melted surfaces: A comparison of different measurement methods. CIRP Annals 2017, 66, 543–546. [Google Scholar] [CrossRef]
- Tonietto, L.; Gonzaga Jr, L.; Veronez, M.R.; Kazmierczak, C.D.S.; Arnold, D.C.M.; Costa, C.A.D. New method for evaluating surface roughness parameters acquired by laser scanning. Sci. Rep. 2019, 9, 15038. [Google Scholar] [CrossRef] [PubMed]
- Magsipoc, E.; Zhao, Q.; Grasselli, G. 2D and 3D roughness characterization. Rock Mech. Rock Eng. 2020, 53, 1495–1519. [Google Scholar] [CrossRef]
- BIPM. GUM: Guide to the Expression of Uncertainty in Measurement; BIPM: Sevres, France, 2008. [Google Scholar]
Figure 1.
Feungsake laser engraver used in the study.
Figure 1.
Feungsake laser engraver used in the study.
Figure 2.
Engraved bamboo table. (A detailed picture of these patterns is shown in
Appendix B.)
Figure 2.
Engraved bamboo table. (A detailed picture of these patterns is shown in
Appendix B.)
Figure 3.
Roughness measuring system, Surfcom 1500 from Carl Zeiss IMT Iberia, with a tactile probe.
Figure 3.
Roughness measuring system, Surfcom 1500 from Carl Zeiss IMT Iberia, with a tactile probe.
Figure 4.
Vision machine for 2D measurements in dimensional metrology, with QuickVision from Mitutoyo and labels explaining the setup of the measuring procedure.
Figure 4.
Vision machine for 2D measurements in dimensional metrology, with QuickVision from Mitutoyo and labels explaining the setup of the measuring procedure.
Figure 5.
Laser engraver working on the bamboo table.
Figure 5.
Laser engraver working on the bamboo table.
Figure 6.
Own drawing: (a) original design with the trajectory for the measured profile in the black area (I) and single line (II); (b) engraved sample.
Figure 6.
Own drawing: (a) original design with the trajectory for the measured profile in the black area (I) and single line (II); (b) engraved sample.
Figure 7.
NC sender tag to change the speed (mm/min), pixel size, and figure dimensions.
Figure 7.
NC sender tag to change the speed (mm/min), pixel size, and figure dimensions.
Figure 8.
Laser device settings and parameters to be set up.
Figure 8.
Laser device settings and parameters to be set up.
Figure 9.
Detail of the measurement on a sample.
Figure 9.
Detail of the measurement on a sample.
Figure 10.
Details of one line with zoom (80% and 1200 mm/min): (a) a zoom of 0.5; (b) a zoom of 0.65; (c) a zoom of 0.85; (d) a zoom of 1; (e) a zoom of 1.5; (f) a zoom of 2; (g) a zoom of 2.5; (h) a zoom of 3.5.
Figure 10.
Details of one line with zoom (80% and 1200 mm/min): (a) a zoom of 0.5; (b) a zoom of 0.65; (c) a zoom of 0.85; (d) a zoom of 1; (e) a zoom of 1.5; (f) a zoom of 2; (g) a zoom of 2.5; (h) a zoom of 3.5.
Figure 11.
Details of the black area with zoom (80% and 1200 mm/min): (a) a zoom of 0.5; (b) a zoom of 0.65; (c) a zoom of 0.85; (d) a zoom of 1; (e) a zoom of 1.5; (f) a zoom of 2; (g) a zoom of 2.5; (h) a zoom of 3.5.
Figure 11.
Details of the black area with zoom (80% and 1200 mm/min): (a) a zoom of 0.5; (b) a zoom of 0.65; (c) a zoom of 0.85; (d) a zoom of 1; (e) a zoom of 1.5; (f) a zoom of 2; (g) a zoom of 2.5; (h) a zoom of 3.5.
Figure 12.
Failed engraving for 40% of power, a zoom of 0.5, and different speeds. (a) A speed of 1200 mm/min; (b) a speed of 1300 mm/min; (c) a speed of 1400 mm/min; (d) a speed of 1500 mm/min; (e) a speed of 1600 mm/min; (f) a speed of 1700 mm/min; (g) a speed of 1800 mm/min; (h) a speed of 1900 mm/min.
Figure 13.
One-line measurement results.
Figure 13.
One-line measurement results.
Figure 14.
Unintended motifs of the engraved black area.
Figure 14.
Unintended motifs of the engraved black area.
Figure 15.
Value of measured parameters for a speed of 1000 mm/min and different laser power levels (see
Appendix C). U (k = 2) ≤ 0.5 µm. The P and R values are separate variables, and it is not necessary to connect the points.
Figure 15.
Value of measured parameters for a speed of 1000 mm/min and different laser power levels (see
Appendix C). U (k = 2) ≤ 0.5 µm. The P and R values are separate variables, and it is not necessary to connect the points.
Figure 16.
Results of measured Pa, Pq, Pp, Pv, Ra, Rq, Rz, Rp, and Rv for different speeds [mm/min] but the same laser power in the one-line profile. U (k = 2) ≤ 0.5 µm.
Figure 16.
Results of measured Pa, Pq, Pp, Pv, Ra, Rq, Rz, Rp, and Rv for different speeds [mm/min] but the same laser power in the one-line profile. U (k = 2) ≤ 0.5 µm.
Figure 17.
Results of measured Pa, Pq, Pp, Pv, Ra, Rq, Rz, Rp, and Rv for different speeds [mm/min] but the same laser power in the black area. U (k = 2) ≤ 0.5 µm.
Figure 17.
Results of measured Pa, Pq, Pp, Pv, Ra, Rq, Rz, Rp, and Rv for different speeds [mm/min] but the same laser power in the black area. U (k = 2) ≤ 0.5 µm.
Table 1.
Laser parameters to set up.
Table 1.
Laser parameters to set up.
| Power [W] | Speed [mm/min] | Acceleration
[mm/s2] | Number of Measured Profiles |
|---|
| 10% of 5.5 | From 1000 up to 1900 | | |
20% of 5.5
…
90% of 5.5
100% of 5.5 | 500 | 10 |
Table 2.
Measurement conditions.
Table 2.
Measurement conditions.
| | One Line | Black Area |
|---|
| Type of measurement | Roughness + profile measurement |
| Waviness slope | Least square |
| Evaluation length | 4 mm | 12.5 mm |
| Traveling length | 5.6 mm | 17.5 mm |
| Cutoff wavelength | 0.8 mm | 2.5 mm |
| Range of measurement | +/− 500 µm |
| Measurement speed | 0.3 mm/s |
| Positioning speed | 3.0 mm/s |
| Pre/post-traveling | Cutoff wavelength |
| Radius of the tip | 2.50 µm |
| Contacting force | <10 mN |
Table 3.
Parameters evaluated on each of the profiles.
Table 3.
Parameters evaluated on each of the profiles.
| | Parameter | Nomination According to ISO 97 |
|---|
Complete Profile
(P profile [16,17,18]) | Pa | Average profile roughness |
| Pq | Geometric average roughness |
| Pp | Maximum profile peak height |
| Pv | Maximum profile valley depth |
Roughness Profile
(R profile [16,17,18]) | Ra | Average roughness |
| Rq | Geometric average roughness |
| Rz | Maximum height of roughness |
| Rp | Maximum roughness peak height |
| Rv | Maximum roughness valley depth |
Table 4.
Uncertainty estimation based on GUM [
45].
Table 4.
Uncertainty estimation based on GUM [
45].
| | Statistical Distribution | Contribution | Degrees of Freedom |
|---|
| Repeatability | | <10 nm | 9 |
| Temperature change | * | <10 nm | 100 |
| Calibration | 5 nm | <10 nm | 500 |
| Contacting force | 5 nm | <10 nm | 100 |
Table 5.
Mean values for the R and P parameters with 1000 mm/min, where U (k = 2) ≤ 0.5 µm.
Table 5.
Mean values for the R and P parameters with 1000 mm/min, where U (k = 2) ≤ 0.5 µm.
| [µm] | 100% | 90% | 80% | 70% | 60% | 50% |
|---|
| Pa | 28.63 | 61.31 | 40.6 | 20.44 | 18.24 | 13.66 |
| Pq | 42.37 | 85.07 | 60.39 | 29.89 | 26.12 | 20.74 |
| Pp | 53.88 | 89.34 | 93.22 | 35.82 | 32.18 | 26.22 |
| Pv | 163.12 | 275.12 | 212.8 | 117.1 | 86.1 | 85.84 |
| Ra | 10.07 | 36.5 | 25.36 | 16.17 | 12.93 | 10.5 |
| Rq | 27.82 | 54.47 | 42.38 | 21.2 | 19.06 | 16.94 |
| Rz | 167.52 | 295.68 | 240.24 | 85.69 | 94.6 | 105.08 |
| Rp | 42.68 | 100.96 | 74.9 | 25.95 | 28.88 | 32.14 |
| Disclaimer/Publisher’s Note: The statements, opinions and data contained in all publications are solely those of the individual author(s) and contributor(s) and not of MDPI and/or the editor(s). MDPI and/or the editor(s) disclaim responsibility for any injury to people or property resulting from any ideas, methods, instructions or products referred to in the content. |
© 2025 by the authors. Licensee MDPI, Basel, Switzerland. This article is an open access article distributed under the terms and conditions of the Creative Commons Attribution (CC BY) license (https://creativecommons.org/licenses/by/4.0/).


