Article

Enhanced Erosion Resistance of Cr3C2-TiC-NiCrCoMo Coatings: Experimental and Numerical Investigation of Erosion Mechanisms

1
School of Mechanical and Electrical Engineering, Shandong Jianzhu University, Fengming Road, Jinan 250101, China
2
Inspur Genersoft Co., Ltd., Jinan 250101, China
3
Key Laboratory of High Efficiency and Clean Mechanical Manufacture, Ministry of Education, School of Mechanical Engineering, Shandong University, National Demonstration Center for Experimental Mechanical Engineering Education (Shandong University), Jinan 250061, China
4
College of Engineering Machinery, Shandong Jiaotong University, Jinan 250357, China
5
College of Mechanical and Electronic Engineering, Shandong Agriculture and Engineering University, Jinan 250100, China
*
Author to whom correspondence should be addressed.
Coatings 2025, 15(3), 294; https://doi.org/10.3390/coatings15030294
Submission received: 15 January 2025 / Revised: 15 February 2025 / Accepted: 20 February 2025 / Published: 3 March 2025
(This article belongs to the Special Issue Laser Technology of Thin Film and Coatings)

Abstract

:
To enhance the erosion resistance of typical Cr3C2-NiCr coatings, the Cr3C2-TiC-NiCrCoMo (NCT) coating was developed and deposited by high-velocity oxygen fuel spray (HVOF). The erosion resistance and mechanisms of the coating were investigated using numerical simulations and experimental methods. A comprehensive calculation model for the coating erosion rate was developed, incorporating factors such as the properties of the eroded particles, the characteristics of the coating, and the conditions of erosion. The erosion rate of the NCT coating was calculated and predicted by the model, and the accuracy of these predictions was validated through experiments. The NCT1 (87.3 wt.% Cr3C2-NiCrCoMo/3 wt.% TiC)coating demonstrated exceptional erosion resistance compared to the original Cr3C2-NiCrCoMo (NCC) coatings with reduced erosion rates of 23.64%, 20.45%, and 16.22% at impact angles of 30°, 60°, and 90°, respectively. The addition of nano-TiC particles into the NCT1 coating enhances the yield strength, impeding the intrusion of erosive particles at low angles and supporting the metal binder phase, eventually reducing fatigue fracture under repeated erosion. However, excessive nano-TiC content degrades the erosion resistance due to the increase in pores and cracks within the coating.

1. Introduction

Erosion wear is prevalent in fields such as machinery, metallurgy, energy, building materials, transportation, aerospace, and military industries. It is one of the significant causes of equipment failure and material degradation. For instance, the lifespan of aircraft engines operating in dusty environments can be reduced by up to 90%, and more than 30% of boiler tube accidents are attributed to erosive wear. Consider the large centrifugal compressor impeller, which operates in compressed gas containing small solid particles (inherent particles in the transport medium, oxides in the flow channel, metal particles, and other dislodged material). This often results in erosion wear damage. Erosion wear can lead to the thinning of compressor blades, causing rotor imbalance and potentially resulting in blade breakage, fractures, and other severe accidents. Therefore, the protective coating on the surface of the impeller blade must be characterized by high erosion resistance.
Traditional Cr3C2-NiCr (NC) coating is characterized by its compatible wear resistance, corrosion resistance, hardness, oxidation resistance, and high thermal stability. Therefore, it is also suitable for normal-temperature and high-temperature erosion environments [1,2,3,4,5]. In centrifugal compressors, turbines, and various mechanical systems, high-velocity solid particles within the gas can impinge upon surfaces such as impellers and fan blades. This interaction significantly affects the structural integrity of chromium carbide ceramic coatings, leading to erosion and wear [6,7,8,9]. Consequently, it is essential to examine the erosion resistance of these coatings to ensure their durability and performance in such demanding environments.
The erosion wear of chromium carbide cermet coatings is influenced by the properties of the eroding particles, target material, service environment, and working conditions. One of the critical factors affecting erosion wear is the impact angle between the impact particles and the target surface. Researchers have conducted experiments and computational analyses on the erosion resistance and mechanisms of typical Cr3C2-NiCr coatings [10,11,12,13]. Ji et al. [14] observed that the erosion of the Cr3C2-NiCr coating mainly resulted from splats detaching at the lamellar interfaces caused by cracks propagating along the boundaries between the surface-exposed lamellae and the underlying coating. Additionally, the particle size and carbide content in the coating had a significant impact on its erosion performance. Kevin et al. [15] observed that Cr3C2-NiCr coatings offered a reasonable improvement in erosion resistance, with an enhancement of 6.57 times and 3.79 times compared to bare stainless steel samples at 3000 rpm and 6000 rpm, respectively.
In addition to the above experimental methods, mathematical modeling and numerical simulations are essential for evaluating and predicting the erosion resistance of the Cr3C2-NiCr coatings. Li et al. [16] studied the stress peaks of four coatings (Fe2B, CrN, Cr3C2-NiCr, and Al2O3-13%TiO2) by using the finite element method. The results showed that the Fe2B coating exhibited the highest erosion resistance under identical impact conditions, followed by Cr3C2-NiCr and CrN. In contrast, the Al2O3-13% TiO2 coating demonstrated the lowest erosion resistance. Arunkumar et al. [17] conducted experiments and developed regression models to study the erosion behavior of AISI 304 and Cr3C2-NiCr coated specimens. The results showed that the impact angle was the most significant factor affecting erosion rate, followed by water jet velocity, distance, and erosion flux.
The Cr3C2 hard-phase particles in chromium carbide cermet coatings provide the impact resistance to erosion particles, while the binding phase anchors them. The phase composition significantly affects the coating’s erosion resistance. Researchers have explored the enhancement of erosion resistance in coatings through modifications to their phase composition. Li et al. [18] demonstrated that NiCr-Cr3C2 coatings with elevated ceramic content exhibited improved erosion resistance at low impact angles, attributed to micro-cutting failure mechanisms. In contrast, at medium and high impact angles, a higher metal content was found to enhance erosion resistance, as the coatings predominantly failed via fatigue spalling and brittle fracture. Wei et al. [19] modified the binding phases in Cr3C2-NiCr coatings and developed TiNi-(Cr3C2-NiCr) composite coatings, which showed significantly improved cavitation erosion resistance due to a dense, low-porosity microstructure achieved by adding Cr3C2-NiCr appropriately. Daniel et al. [20] found that the Cr3C2-50%NiCrMoNb coating deposited by HVOF had a longer impact lifetime than the Cr3C2-25%NiCr coating due to its different microstructure and higher tough matrix content, particularly noticeable under high impact loads.
Researchers have investigated the modification of typical Cr3C2–NiCr coatings by adding second-phase particles such as WC, SiC, and TiC to improve their erosion resistance [21,22,23,24]. They have studied the effects of the composition of the hard phases and the particle size on erosion resistance. Many studies have enhanced chromium carbide coatings with WC and compared the performance and erosion mechanisms of WC-Cr3C2-Ni coatings with Cr3C2-NiCr [25,26,27,28,29]. Compared to WC, TiC is characterized by a higher melting point, hardness, and oxidation resistance, which enhances the erosion resistance of the coating [30]. Barragan et al. [31] reported that the SiC-NiCrAlY/Cr3C2-NiCr coating demonstrated superior erosion resistance compared to the conventional Cr3C2-NiCr at both room temperature and 900 °C. This enhancement was attributed to the reduced K-IC caused by SiC hard particles and the increased propagation of inter-splat and trans-splat cracks in the SiC-NiCrAlY/Cr3C2-NiCr coating. Matikainen et al. [32] found that Cr3C2-50NiCrMoNb coatings exhibited greater plastic deformation and increased material loss during abrasion and dry particle erosion, attributed to a higher content of the Ni-based metal matrix compared to Cr3C2-25NiCr coatings. Dzhurinskiy et al. [33] incorporated B4C and Cr3C2 (5% and 10% by weight) into Cr3C2-NiCr coatings to enhance wear and erosion resistance. The Cr3C2-NiCr coating with 10% Cr3C2 demonstrated a wear rate approximately 3.12 times lower and an erosion resistance 1.15 times higher than the standard Cr3C2-NiCr coating, attributed to the improved hardness and fracture toughness from the hard secondary phases. Manjunatha et al. [34] indicated that NiCr-Cr3C2 composite coatings with the highest carbon nanotubes (CNT) content (7%) exhibited high erosion resistance at 600 °C with impact angles of 30°, 45°, 60°, and 90°. The addition of CNT in NiCr-Cr3C2 coatings reduced weight loss and erosion rate at different impingement angles under high temperatures. Wang et al. [35] reported that Cr3C2/TiC-NiCrMo coatings exhibited superior erosion resistance at various angles, with thickness loss due to erosion being 2 to 3 times lower than that observed in Cr3C2-NiCr coatings. In summary, it is feasible to enhance the erosion resistance of coatings by modifying the composition of the binding and hard phases synergistically, but it is relatively scarce in current research. There is a lack of calculation and modeling for the erosion rate of the modified Cr3C2 cermet coatings, resulting in a primary reliance on costly and inefficient experiments. The calculation models would be valuable for predicting erosion rates, assisting in simulation analysis, and investigating erosion mechanisms.
Therefore, based on the Cr3C2-TiC-NiCrCoMo (NCT) composite coating with the synergistic modification of the multi-alloyed binding and ceramic phases developed in a previous study [36], the erosion rate of the modified coating was mathematically modeled. The accuracy of the model was experimentally verified, and the erosion behavior and mechanism were investigated. The main contributions of the paper are as follows.
(1)
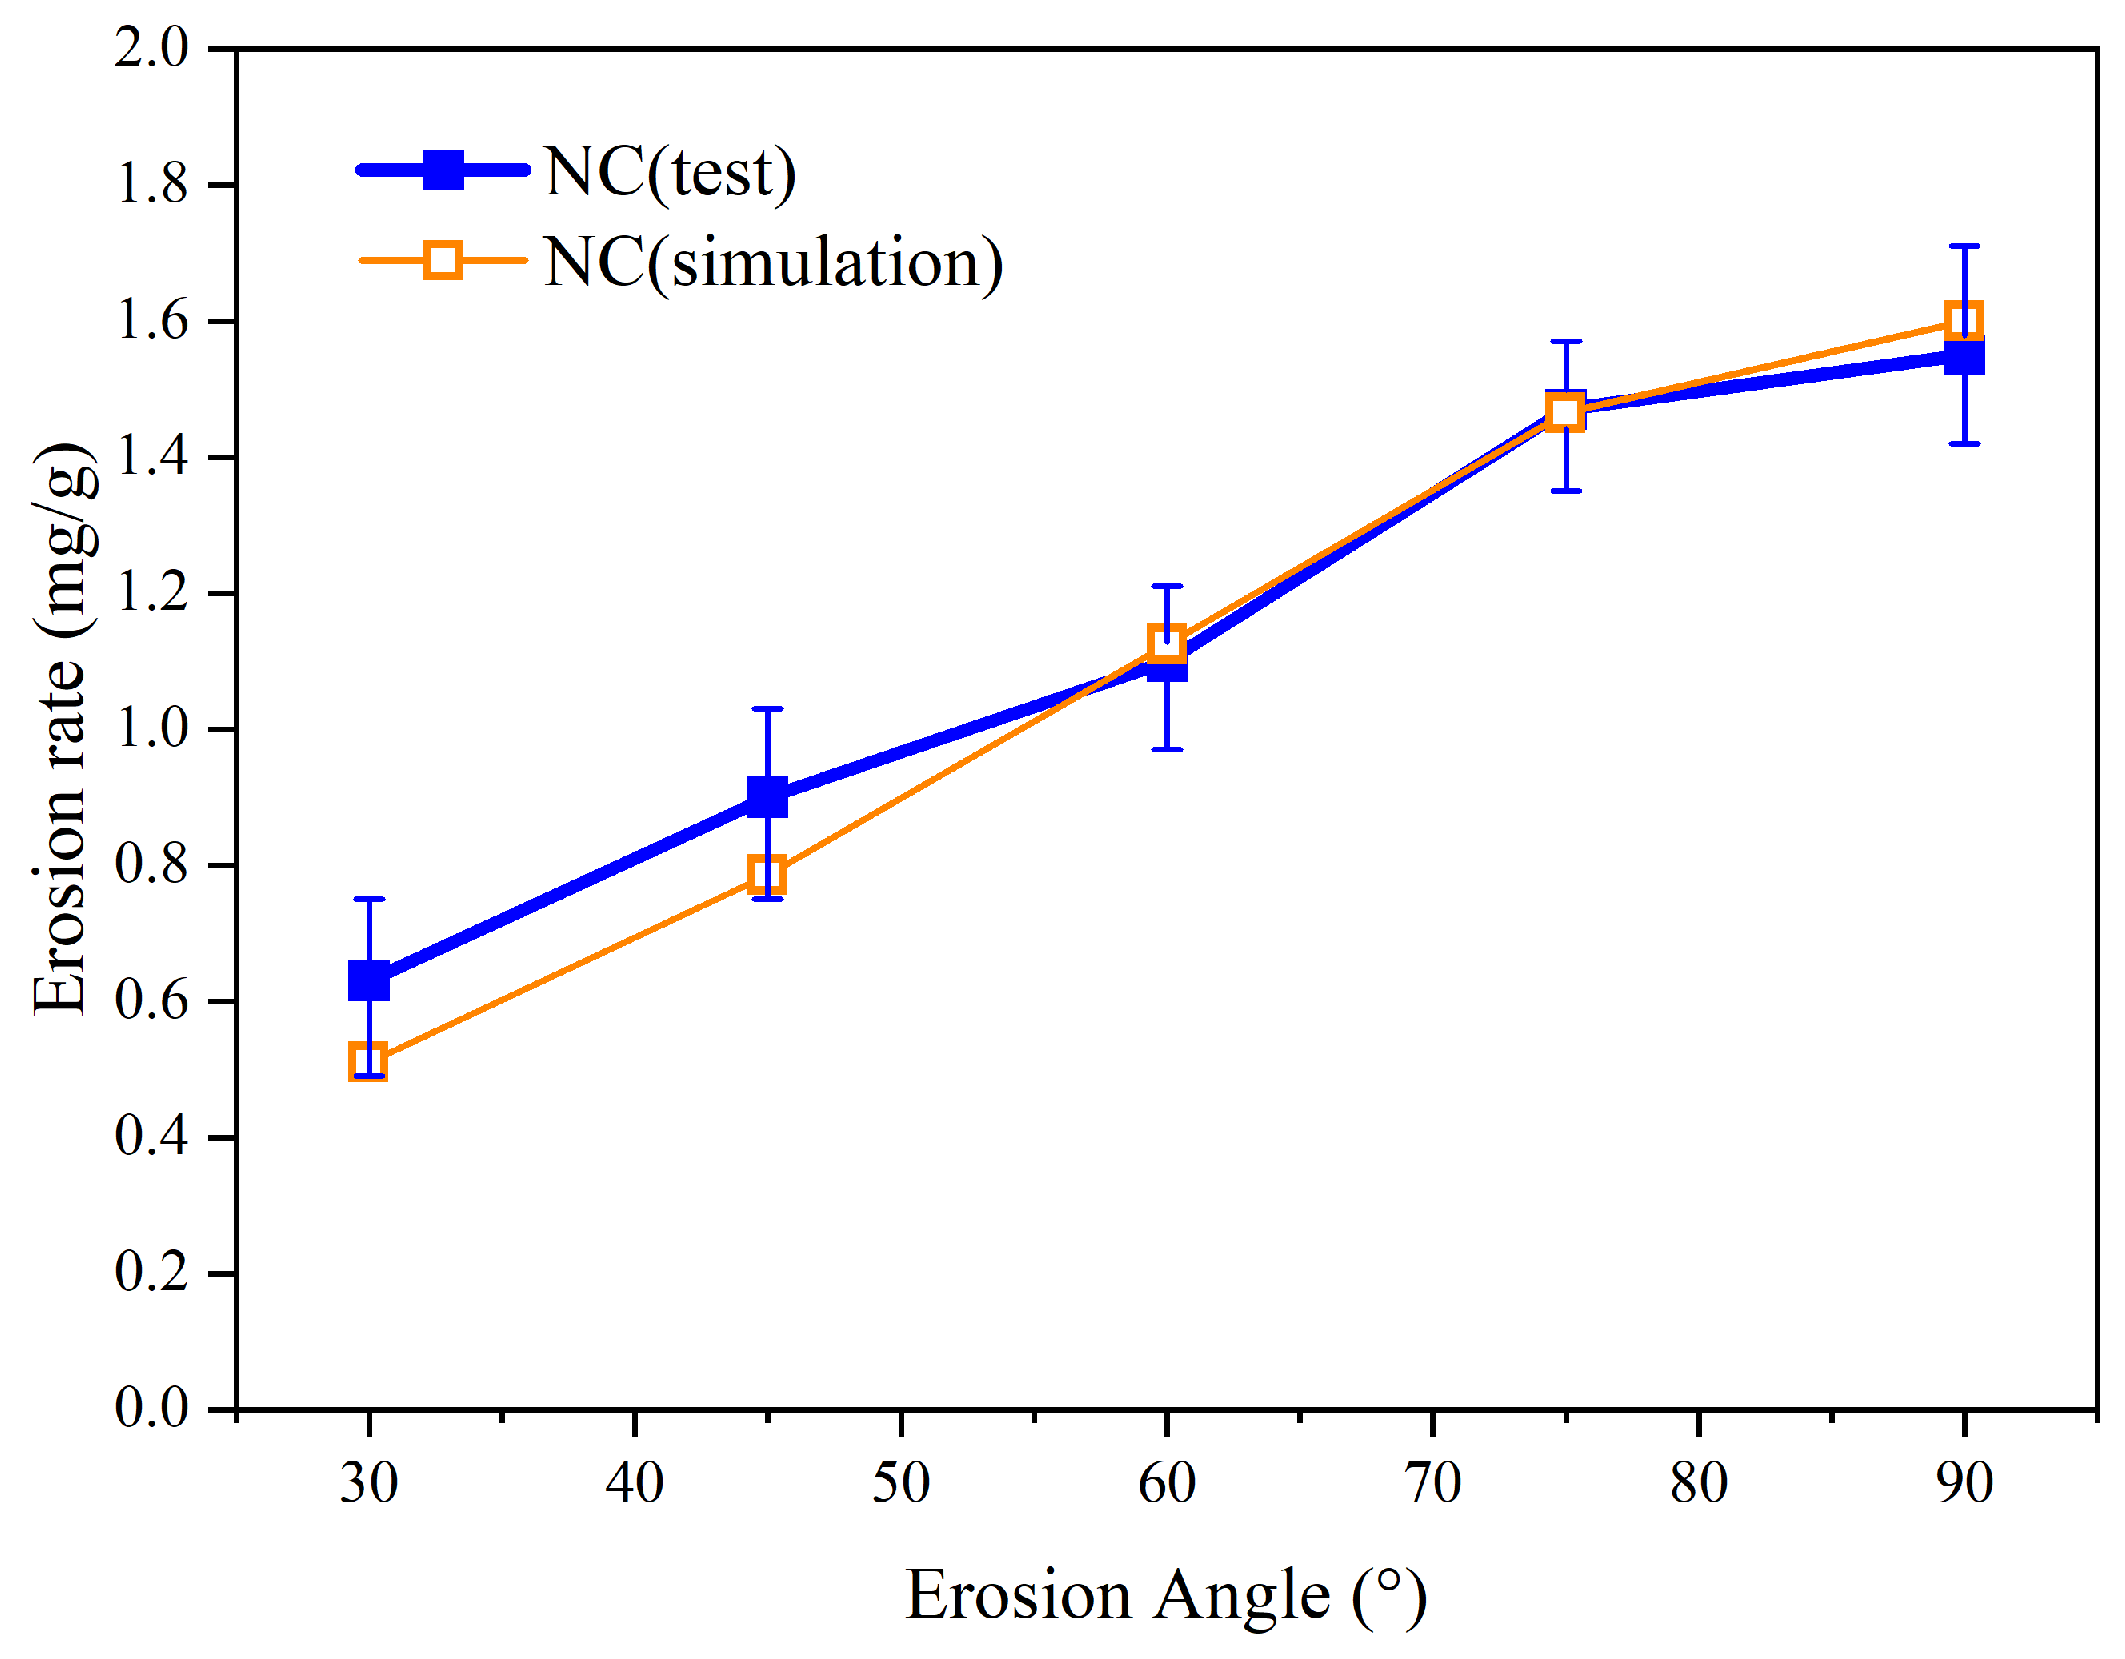
A mathematical model for calculating the erosion rate of particle-eroded coating surfaces was established to describe the changing rule of the erosion characteristics of coatings with the erosion angle and coating properties.
(2)
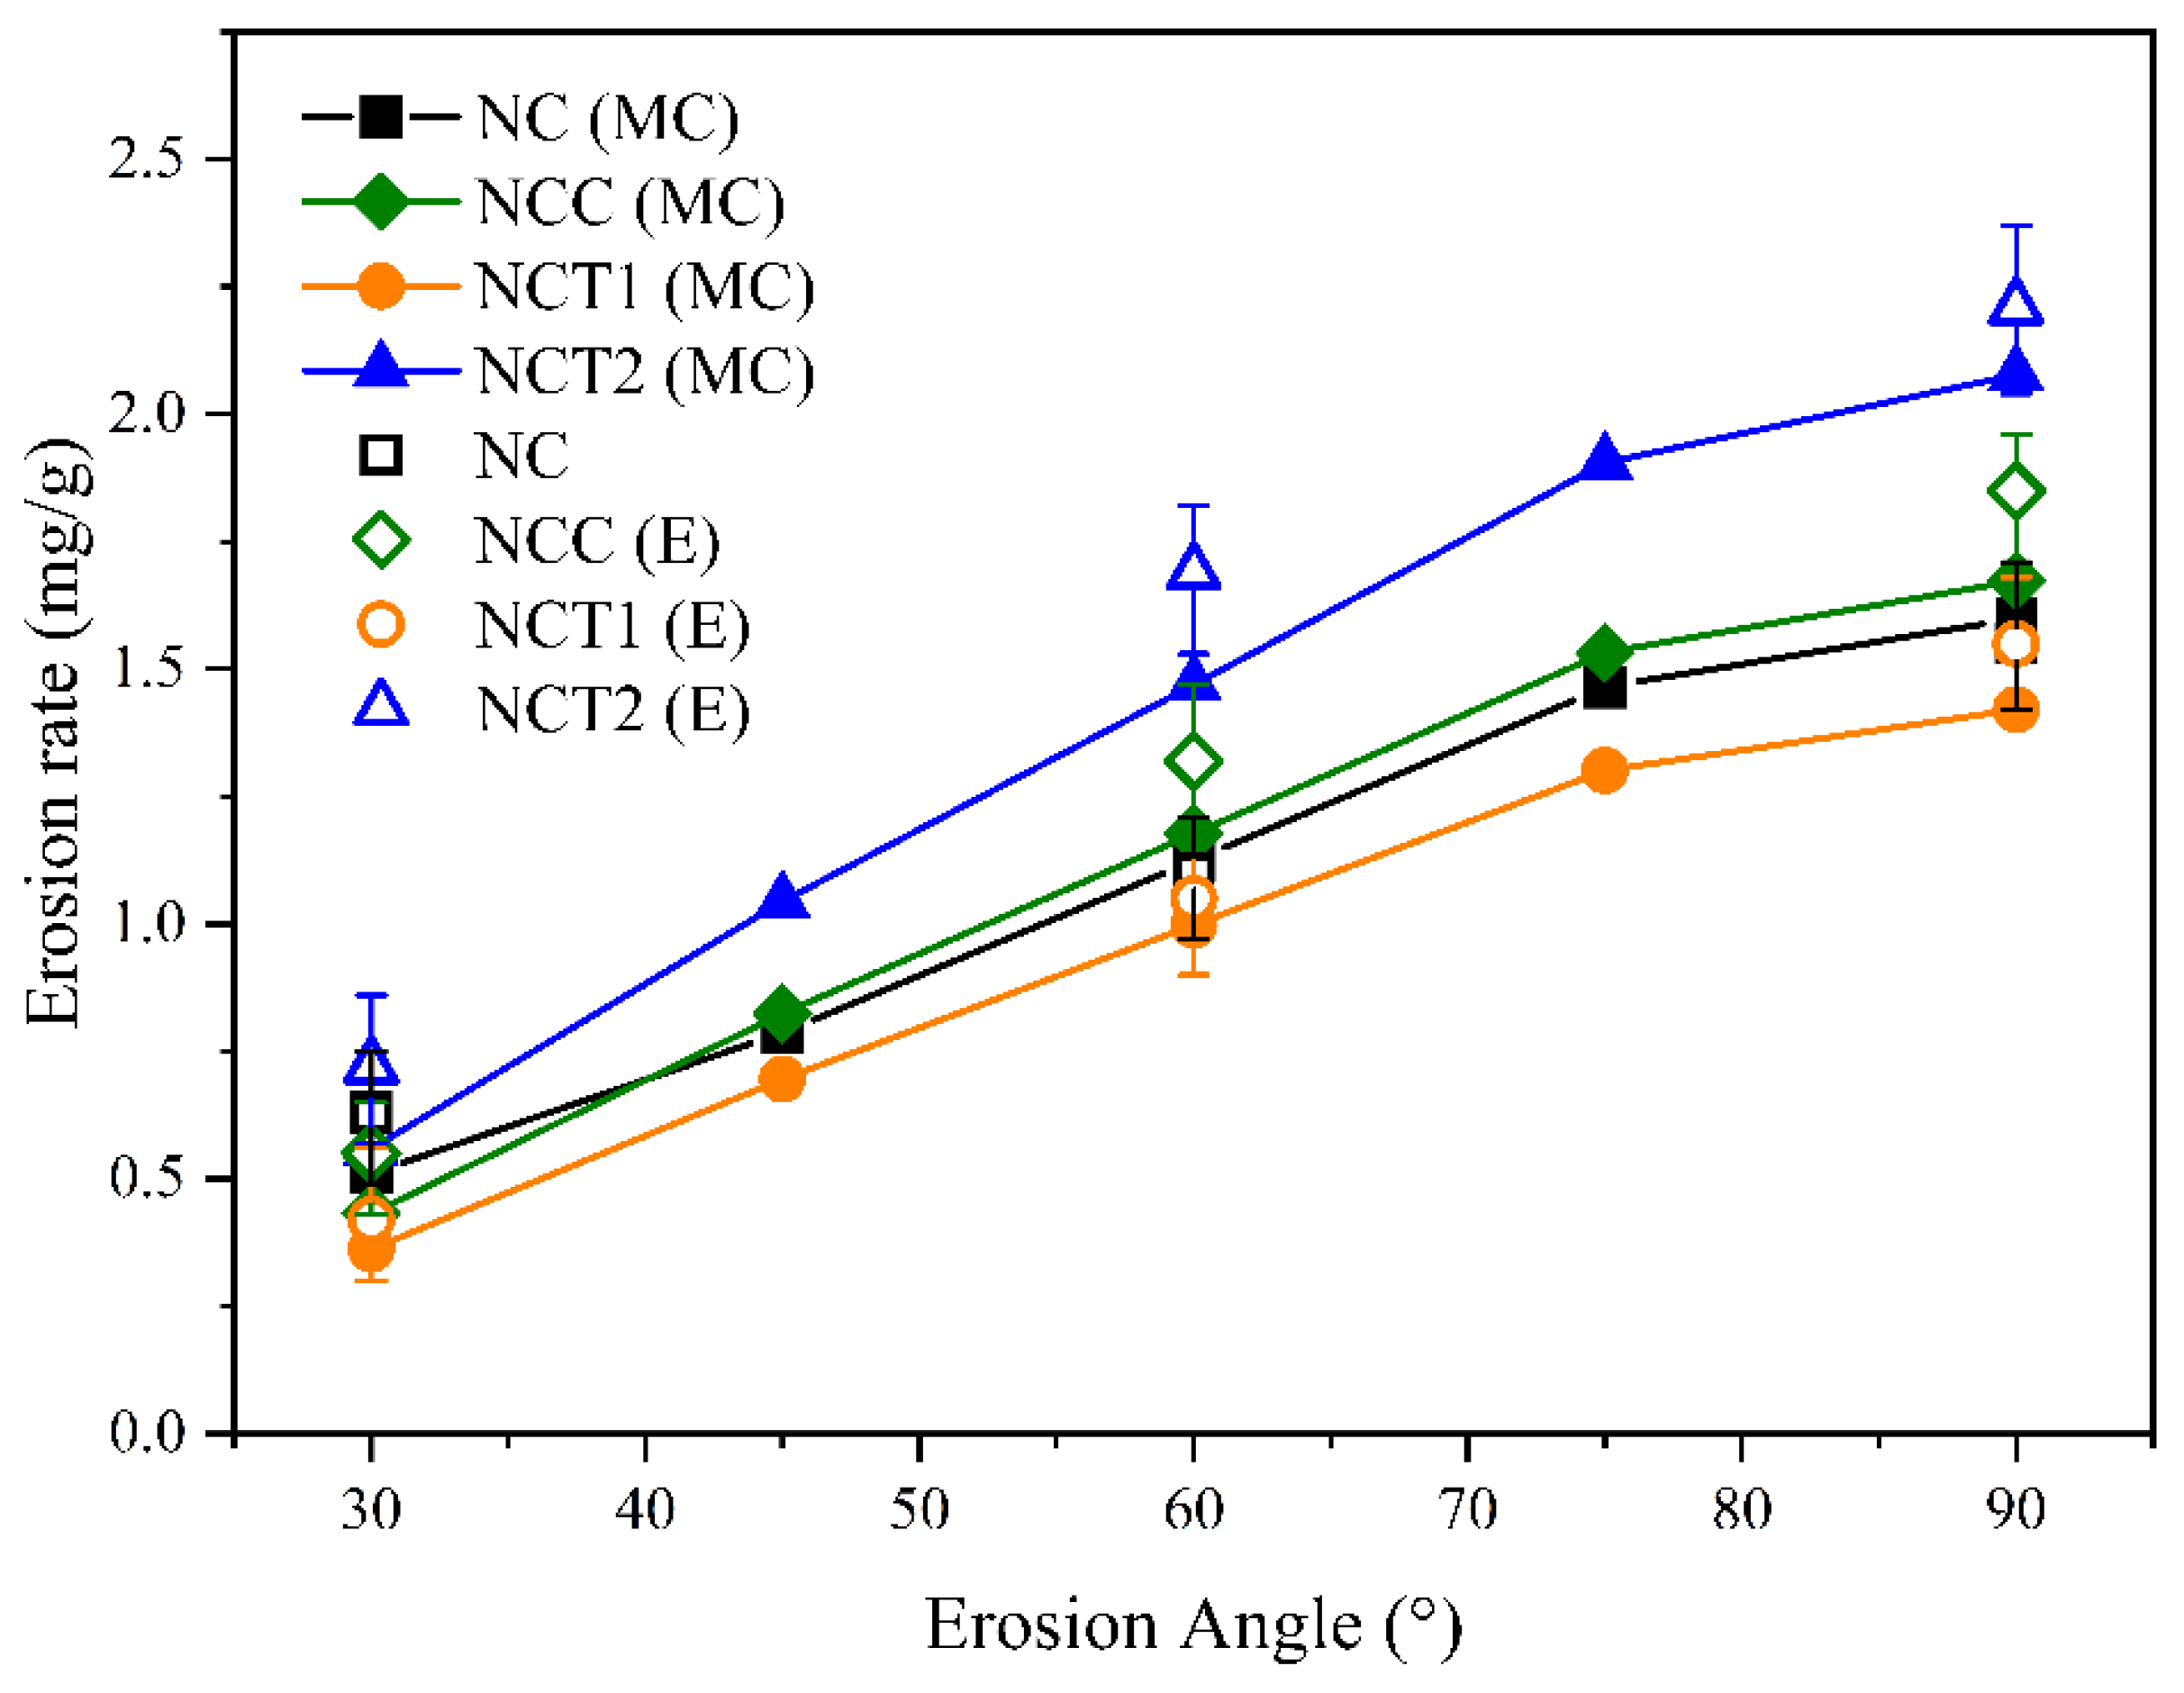
Erosion experiments were conducted to evaluate the erosion rates of the coatings at various impact angles, investigating the effect of nano-TiC addition on erosion behavior, which validated the accuracy of the mathematical model.
(3)
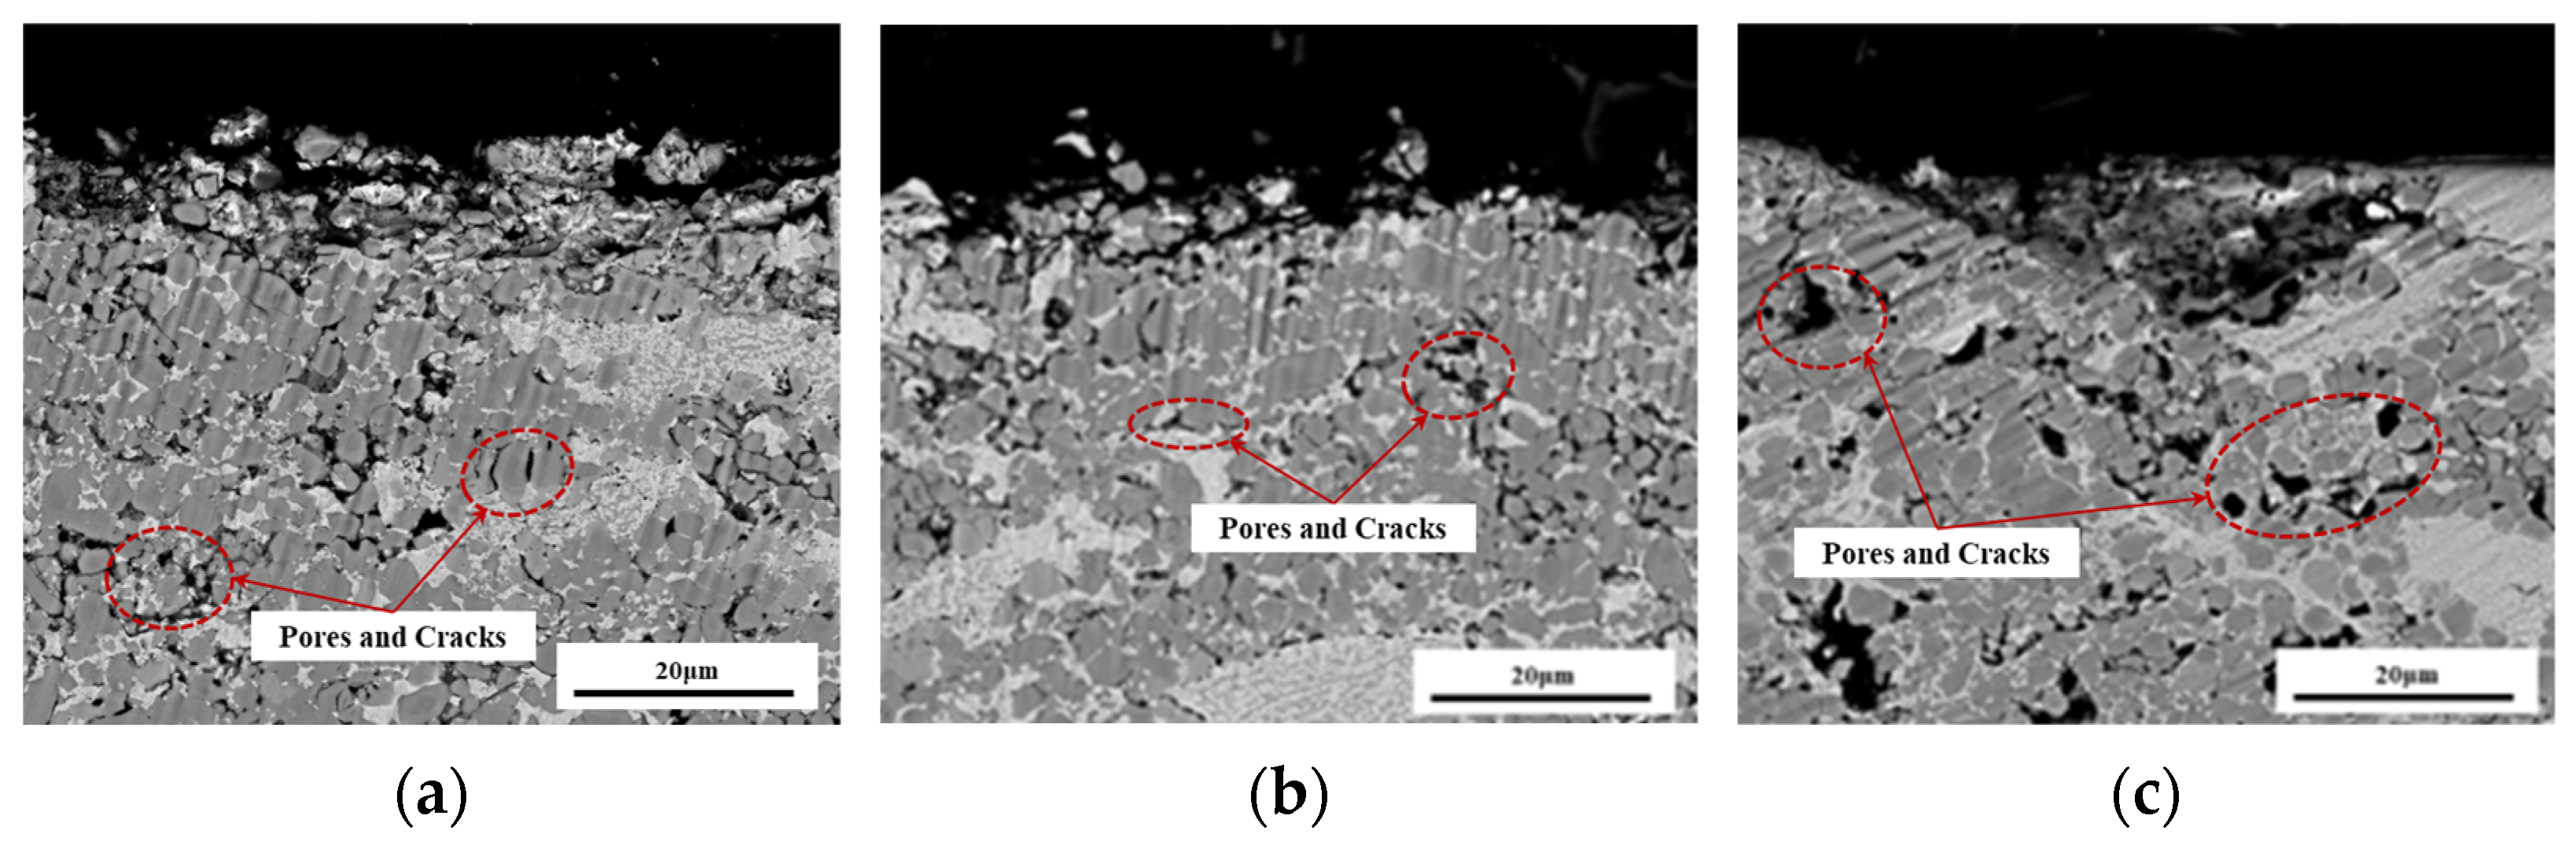
The erosion surface morphology and microstructure of the coating were analyzed. The influence of nano-TiC on the erosion resistance, inter-phase fracture, and erosion mechanisms of the coatings.

2. Materials and Methods

2.1. Powder and Coating Preparation

To enhance the erosion resistance of these coatings, TiC was selected as the secondary hard-phase particle due to its high hardness, high melting point, and excellent high-temperature stability. The micro/nano-particle composite-modified Cr3C2-TiC-NiCrCoMo (NCT) powder formulation was prepared by using three commercially available powders including Cr3C2-NiCr (Jinlu (Luoyang) Co., Ltd., Luoyang, China, 15–45 μm), CoCrMo (AVIC Maite Additive Technology (Beijing) Co., Ltd., Beijing, China, 15–45 μm) and nano-TiC (Gangtian (Shanghai) Co., Ltd., Shanghai, China, 50 nm) [36]. In the preparation process, nano-TiC was ultrasonically dispersed in anhydrous ethanol, then transferred to ball milling along with an appropriate amount of milling balls at a ball-to-material ratio of 2:1. The ball milling was conducted for 20 min and dried in a vacuum oven. Two levels of nano-TiC addition, specifically 3 wt.% and 6 wt.%, were selected for preparing the NCT powder formulations, as detailed in Table 1. Coatings were subsequently deposited on 310S (0.08 wt.% C, 0.15 wt.% Si, 0.2 wt.% Mn, 0.045 wt.% P, 0.03 wt.% S, 26 wt.% Cr, 22 wt.% Ni, 48.345 wt.% Fe) substrates using a HVOF spray system. The substrate surface is sandblasted before spraying.

2.2. Microstructure and Phase Composition

The microstructure and elemental composition of the coating were examined with a QUANTA FEG 250 (FEI Co, Thermo Fisher Scientific Co. Waltham, MA, USA) scanning electron microscope (SEM) and INCA Energy X-MAX-50 (Bruker AXS Co, Frankfurter, Germany) energy dispersive spectrometer (EDS). The phase composition of the coating surface was examined by a Rigaku DMAX-2500PC (Rigaku Corporation Co, Tokyo, Japan) X-ray diffractometer (20–90°). The Cu-Kα radiation source with a 45 kV voltage and a 40 mA current was used.

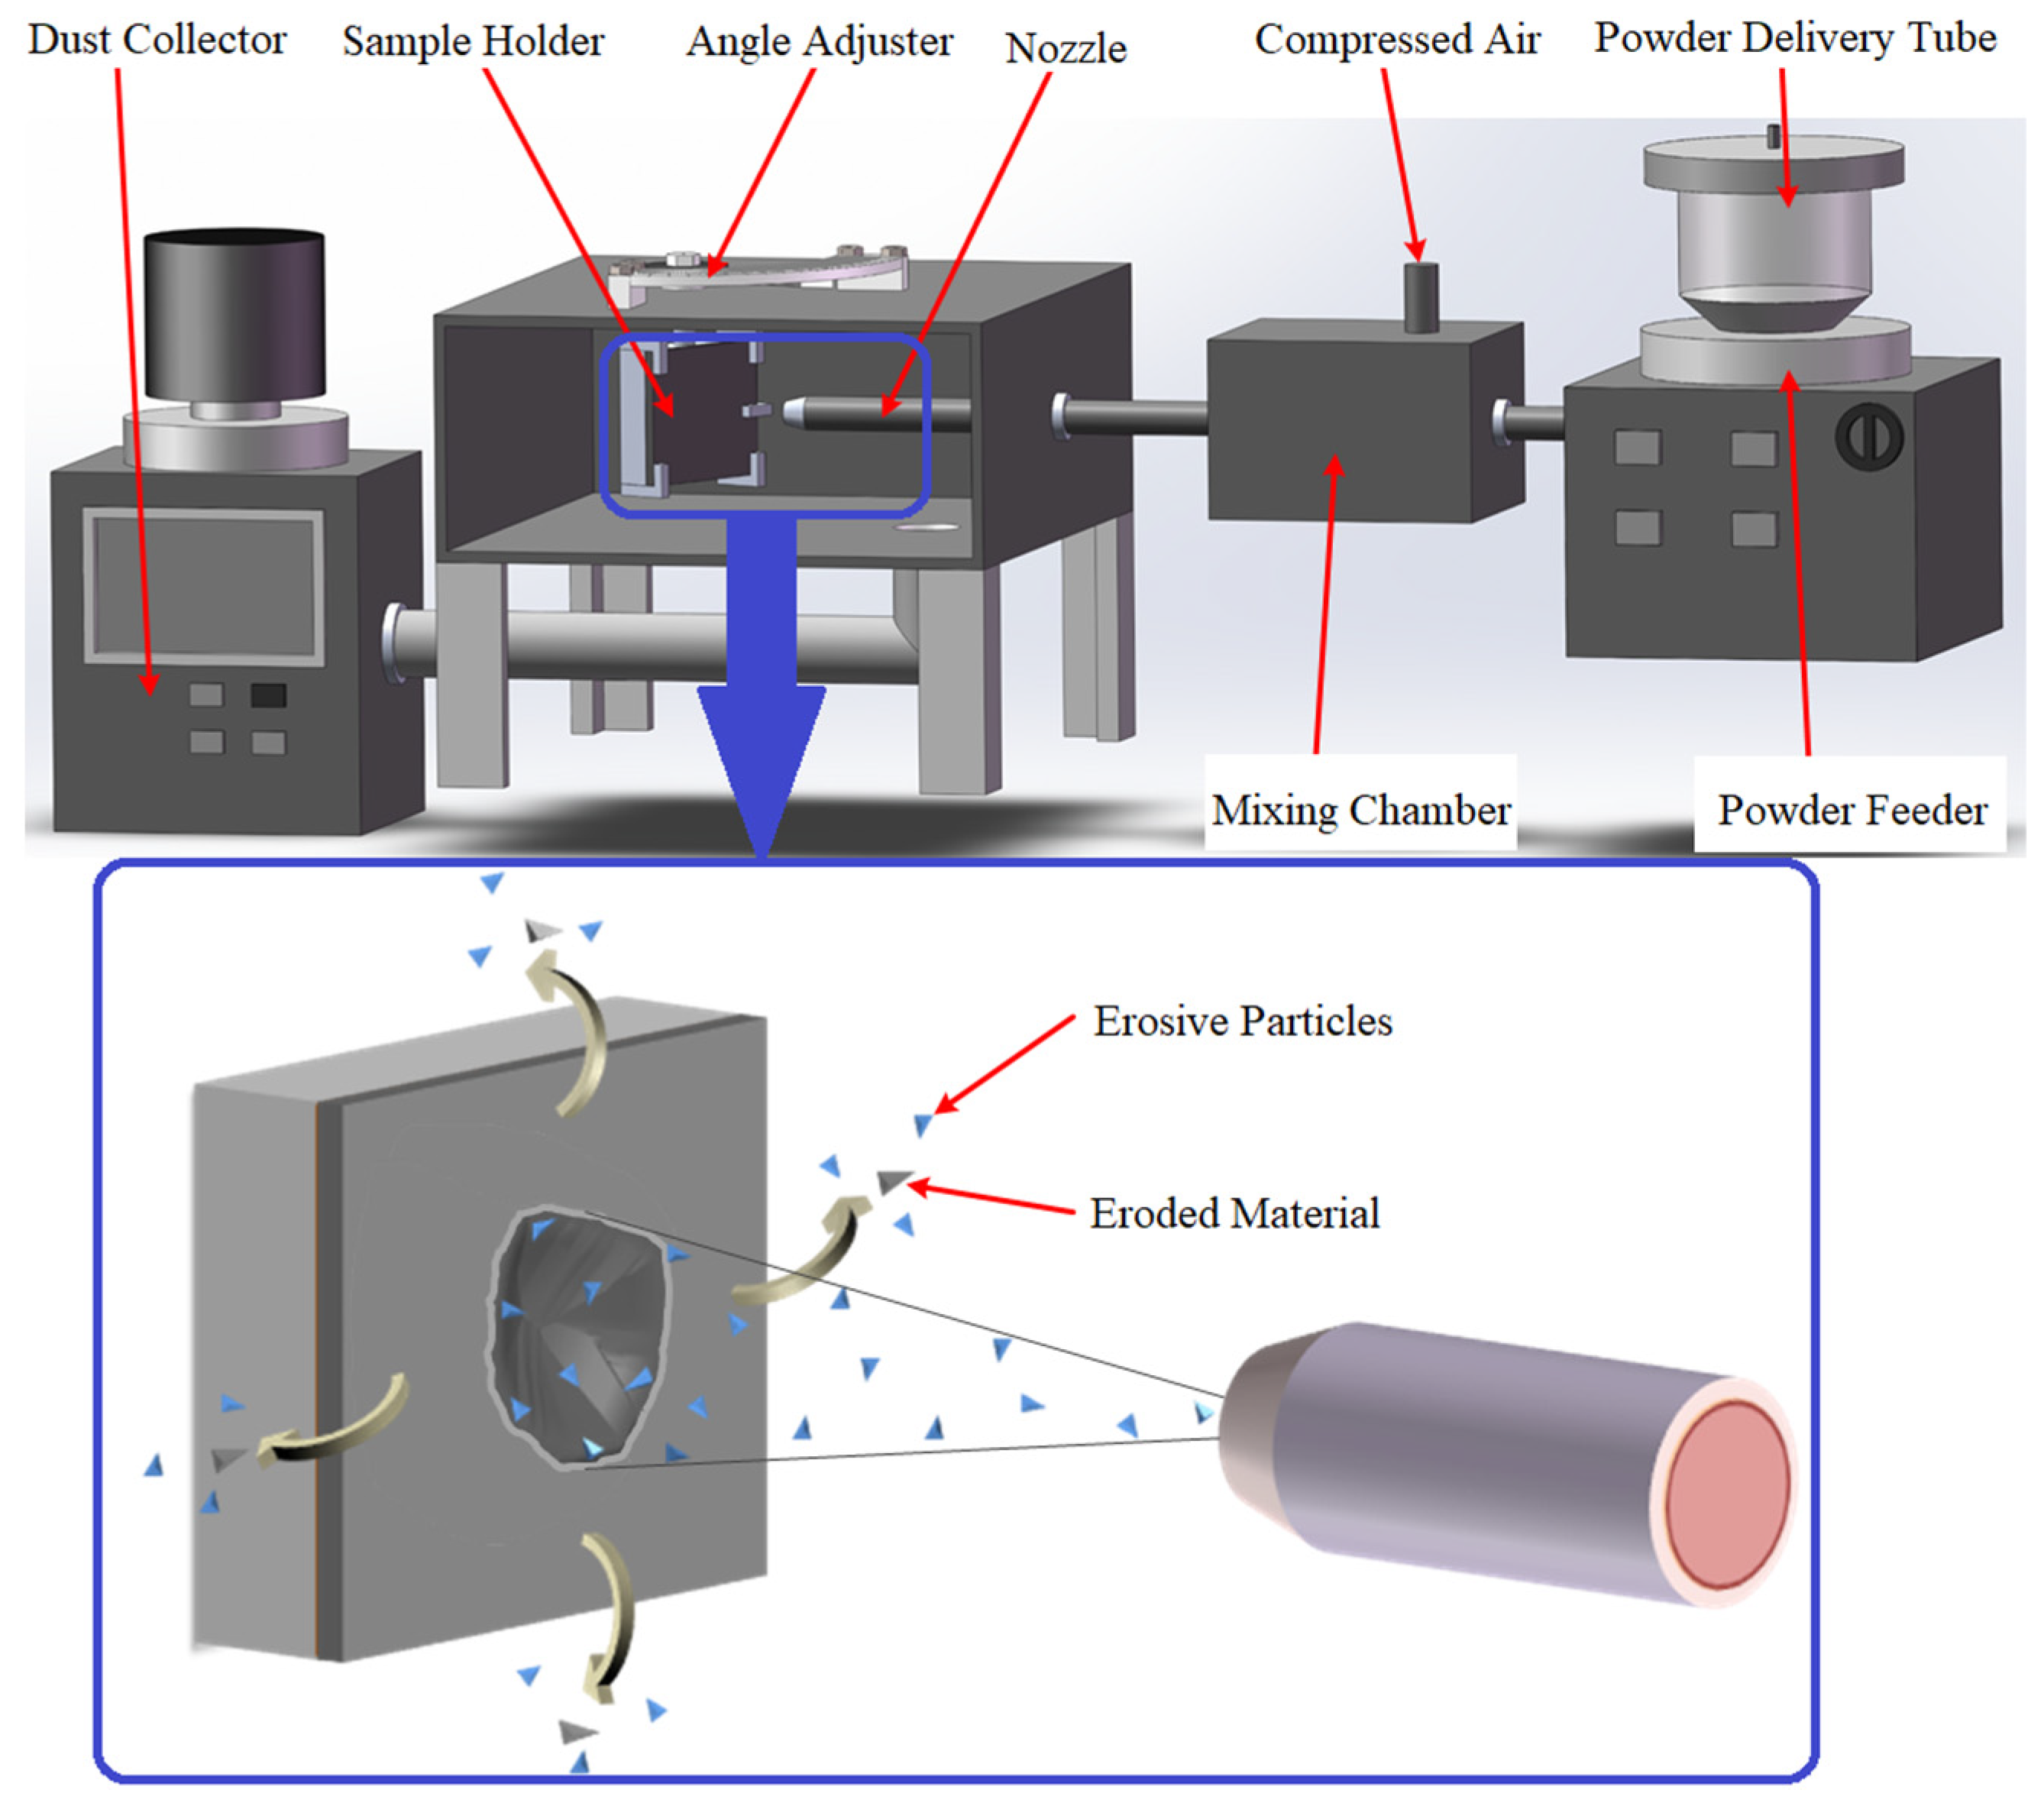
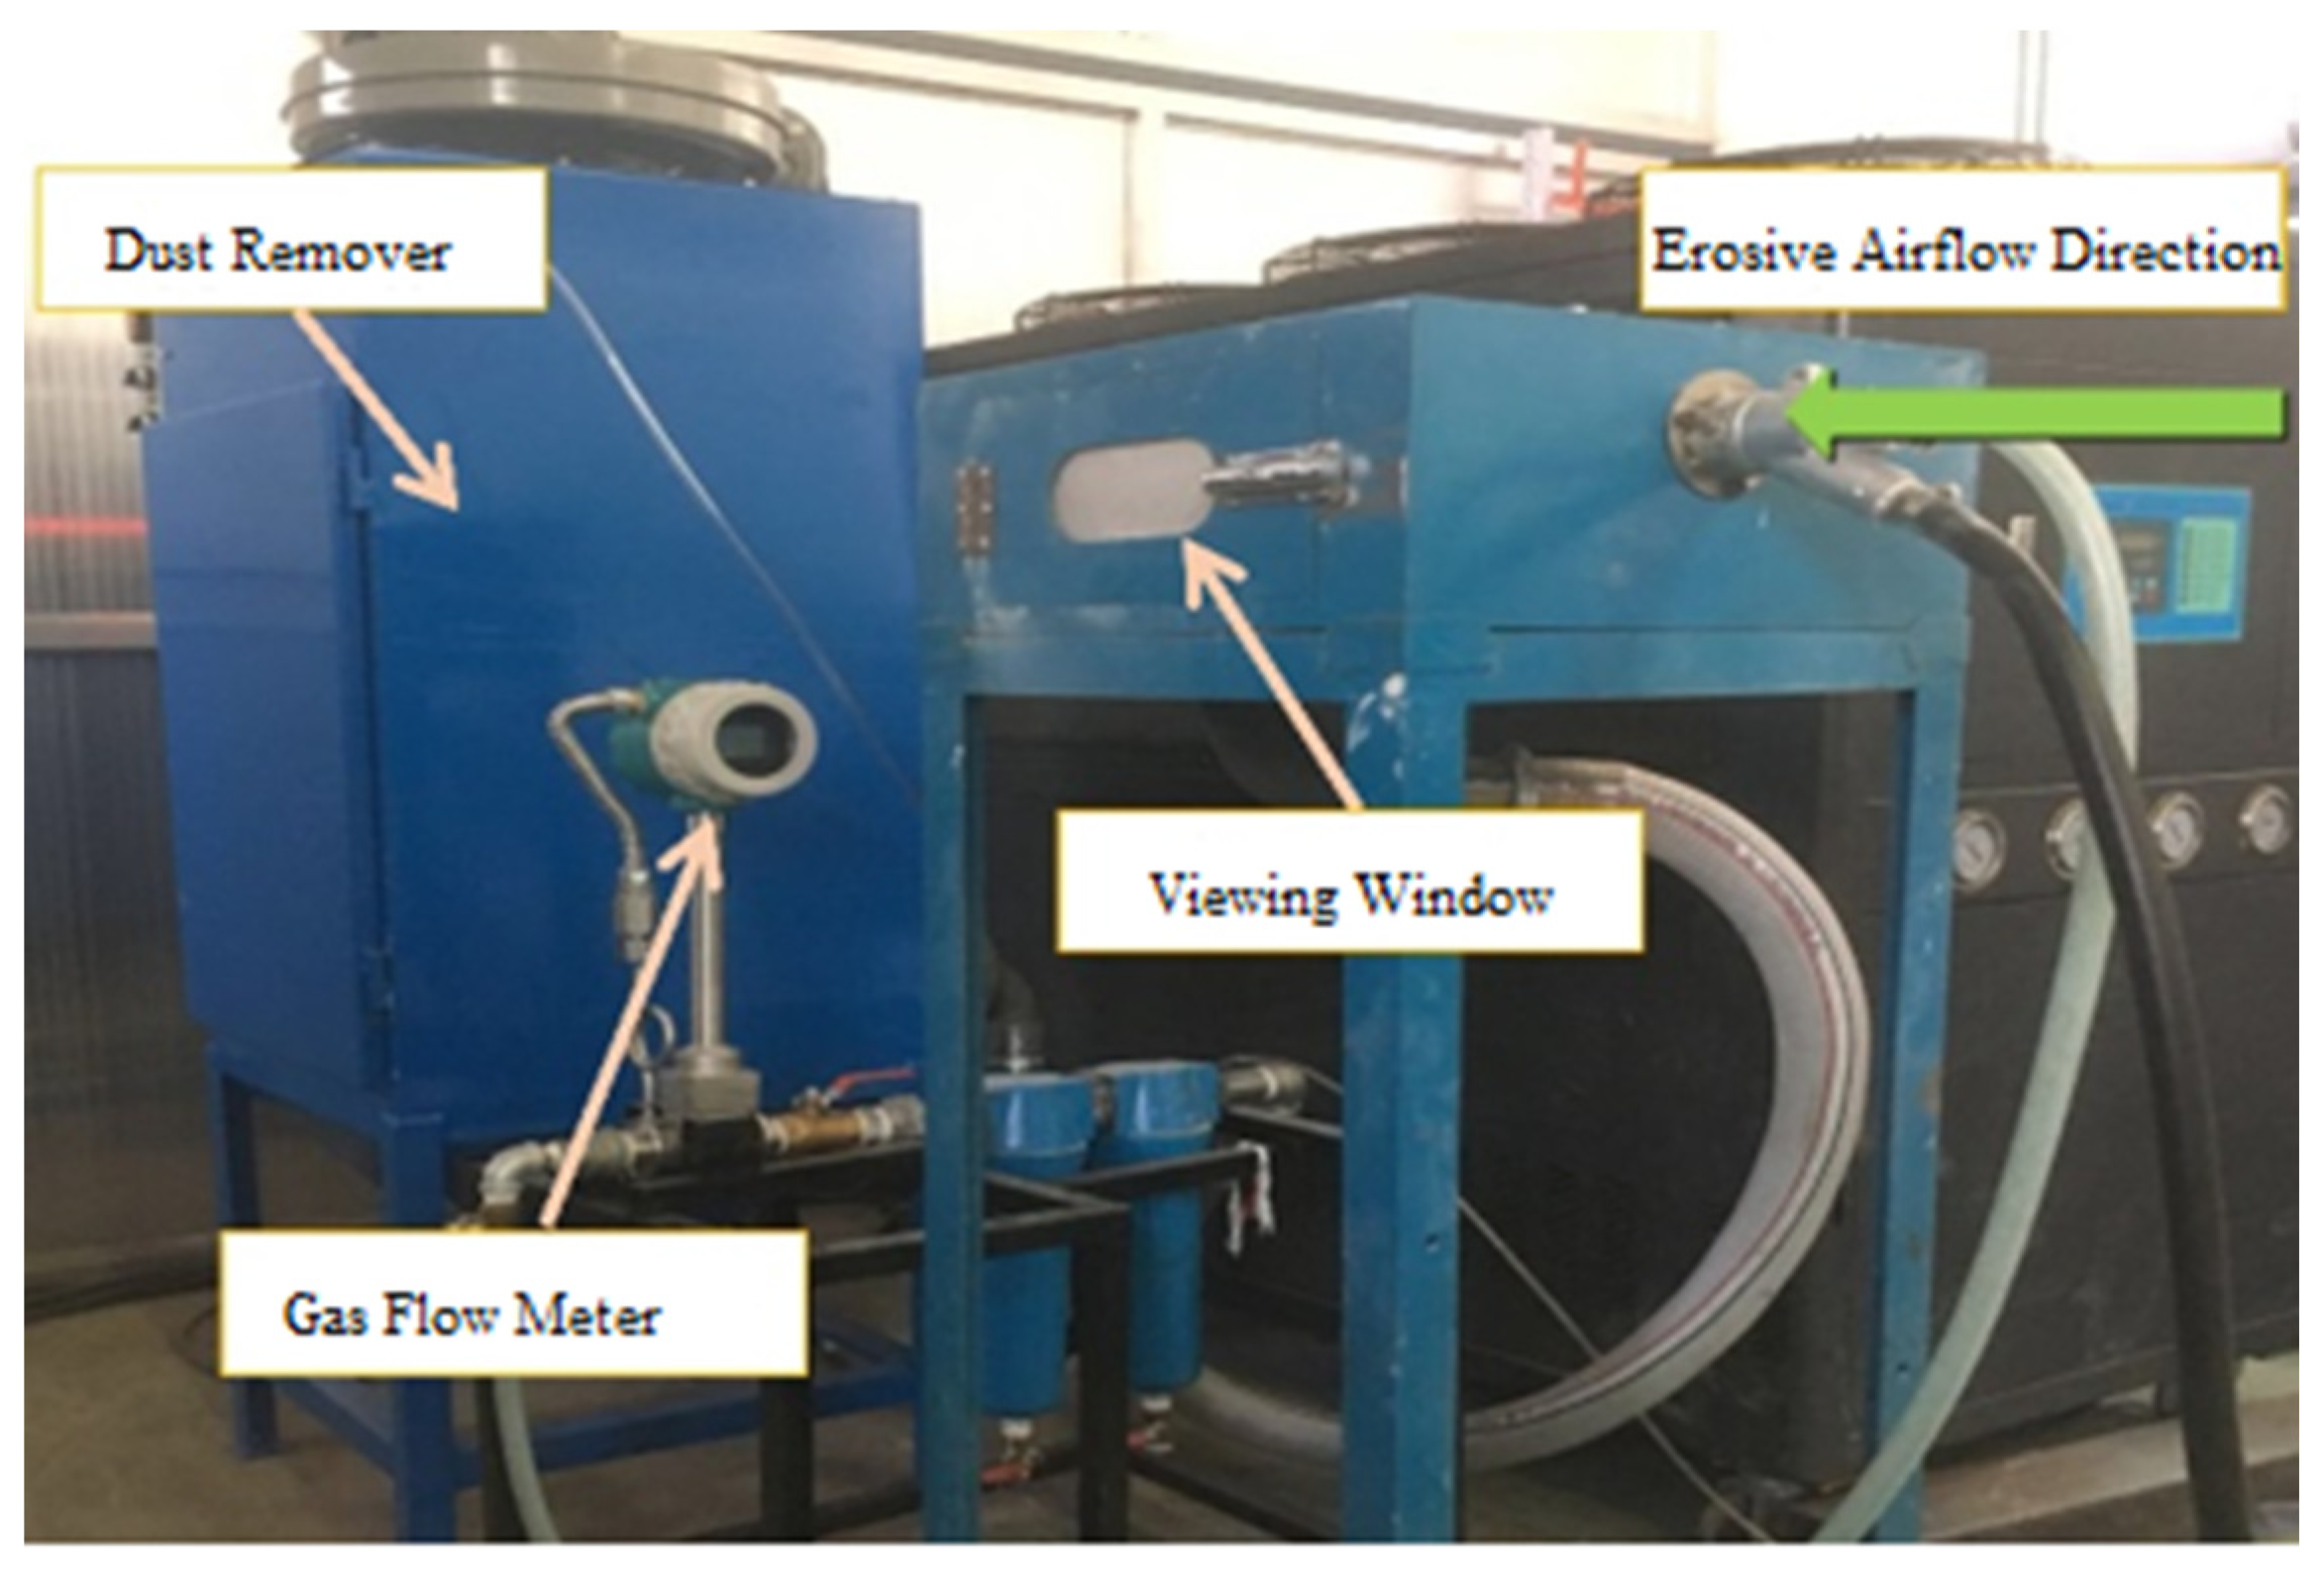
2.3. High-Velocity Erosion Systems and Calculation of Erosion Rates

The normal temperature erosion process was conducted using the high-speed airflow sandblasting erosion wear tester (CN201811044800.8) developed by our group, as shown in Figure 1 and Figure 2. This erosion and wear testing machine primarily consists of a feeding and erosion test unit, with the feeding unit connected to the erosion test unit via a feeding pipe. In this experiment, the coating specimens were subjected to erosion at angles of 30°, 60° and 90°. To simulate the erosion damage of turbine through-flow components under service conditions, Al2O3 solid particles with a particle size of 10 μm were selected with an actual feeding rate of approximately 24.8 g/min. The erosion gas flow rate was adjusted via the inlet valve of the erosion test chamber. Based on previous experiments, the velocity of the erosion particles at a gas flow rate of 49 m3/h is approximately 240 m/s.
The erosion resistance of the coating is evaluated by the mass erosion rate, defined as follows:
ε = Δ m t m p = 1000 ( m t 1 m t 2 ) m p
In the formula, ε represents the mass erosion rate in mg/g. m t is the difference in the mass of the coating before and after erosion (in g). m p is the mass of the particles consumed during the erosion process. m t 1 and m t 2 are the masses of the coating before and after erosion, respectively. The masses of the coating before and after erosion were determined using a high-precision electronic balance (Shanghai Joyce, Shanghai, China, BSM-220.4 type).

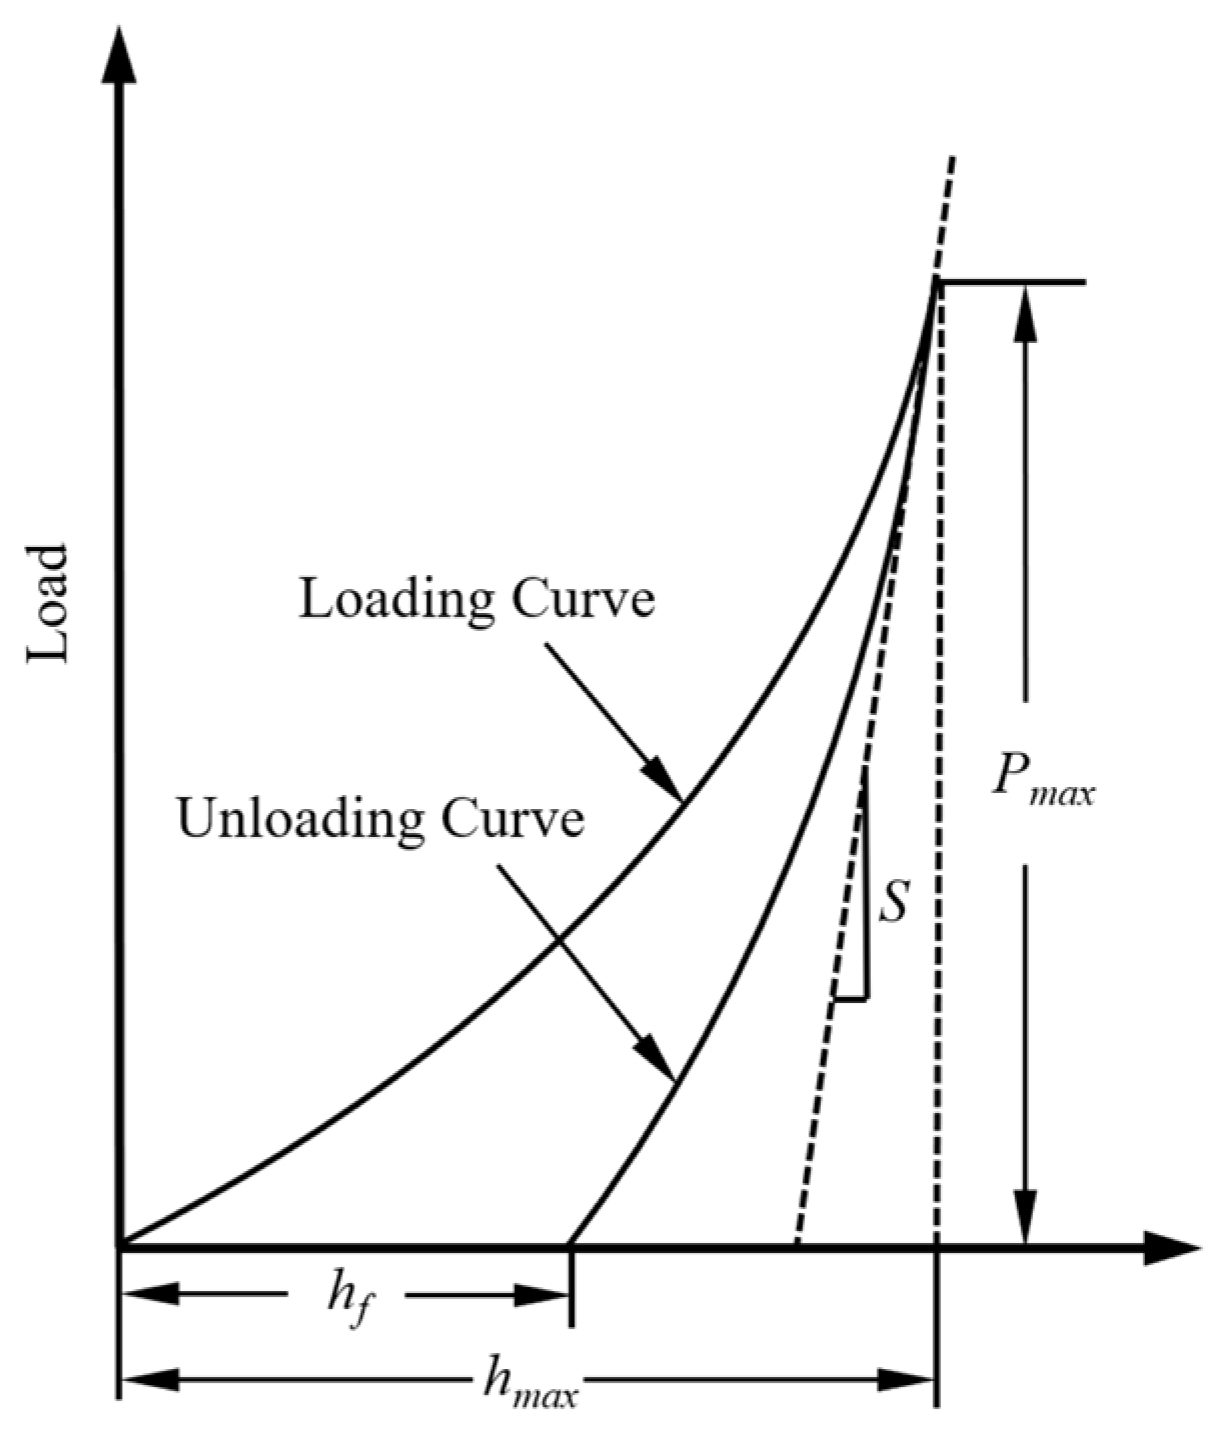
2.4. Coating Modulus of Elasticity and Yield Strength

Indentation experiments are controlled by a computer to continuously adjust the load and monitor the indentation depth in real time. A complete indentation test includes both the loading and unloading phases. During loading, an external force presses the indenter into the sample’s surface, causing the indentation depth to increase with the load. Once the maximum load is reached, it is removed, leaving a residual indentation on the coating’s surface. A typical load–displacement curve is illustrated in Figure 3.
As the experimental load increases, the displacement also increases. When the load reaches its maximum h m a x , the displacement reaches its maximum as well, which corresponds to the maximum indentation depth. Upon unloading, the displacement eventually returns to a fixed value, at which point the depth is the residual indentation depth h f , representing the plastic deformation left by the indenter on the coating.
The contact stiffness is calculated from the unloading curve and is expressed as follows:
S = d P d h
where P is the load and h is the displacement.
Contact depth h c can be expressed as follows:
h c = h max ε P max S
where h m a x is the maximum displacement and P m a x is the maximum load. For a spherical indenter, ε = 0.75 .
The contact area A depends on the geometry of the indenter and contact depth. The projection of the contact area of a spherical indenter with the coating surface can be expressed as follows:
A = 2 π R h c π h c 2
Thus, the equivalent modulus of elasticity E r can be expressed as [37]:
E r = π S 2 β A
where β is a constant related to the shape of the indenter (spherical indenter, taken β = 1 ).
Considering that the indenter is not completely rigid, the elastic modulus of the coating can satisfy the following equation:
1 E r = 1 v 2 E + 1 v i 2 E i
where E i and v i represent the modulus of elasticity of the indenter (1140 GPa) and Poisson’s ratio (0.07), E and v are the modulus of elasticity and Poisson’s ratio of the measured material, respectively.

2.5. Modeling of Coating Erosion Rate

To describe the variation in erosion characteristics of chromium carbide coatings with erosion angle and coating properties, a mathematical model was developed based on Bitter’s deformation wear theory [16] and a previously established theoretical erosion model [38]. The erosion rate calculation model was derived by analyzing the erosion process of coatings by single particles using the theory of spherical-planar elastic-plastic contact. Energy conservation principles were applied to analyze the vertical and horizontal motions of single particles during the erosion process. This model incorporates several improvements over existing reference erosion theory models.
In the revised erosion model, the total elastic contact force in the elastic zone was adjusted to remain constant. The elastic contact force, which varies with indentation depth, was recalculated based on the changes in the elastic contact area during particle erosion. The work done by the elastic force was then determined through integration. The original erosion model’s assumption of a uniform point contact force distribution in the plastic deformation zone has been revised. Instead, the single-point contact force in the particle’s plastic deformation zone, which varies with indentation depth, is calculated using the constitutive equations and deformation properties of the chromium carbide coating. The adhesive friction and furrow effect of the erosion particles in the horizontal cutting process are considered comprehensively to describe the resistance of the erosion particles in the horizontal cutting process more accurately. In the horizontal cutting process of particles, the original model that used a spherical projection as the cutting surface was modified. Instead, the cutting volume of the eroding particles in the horizontal direction was calculated using the surface of the particle’s hemispherical cap as the cutting surface.

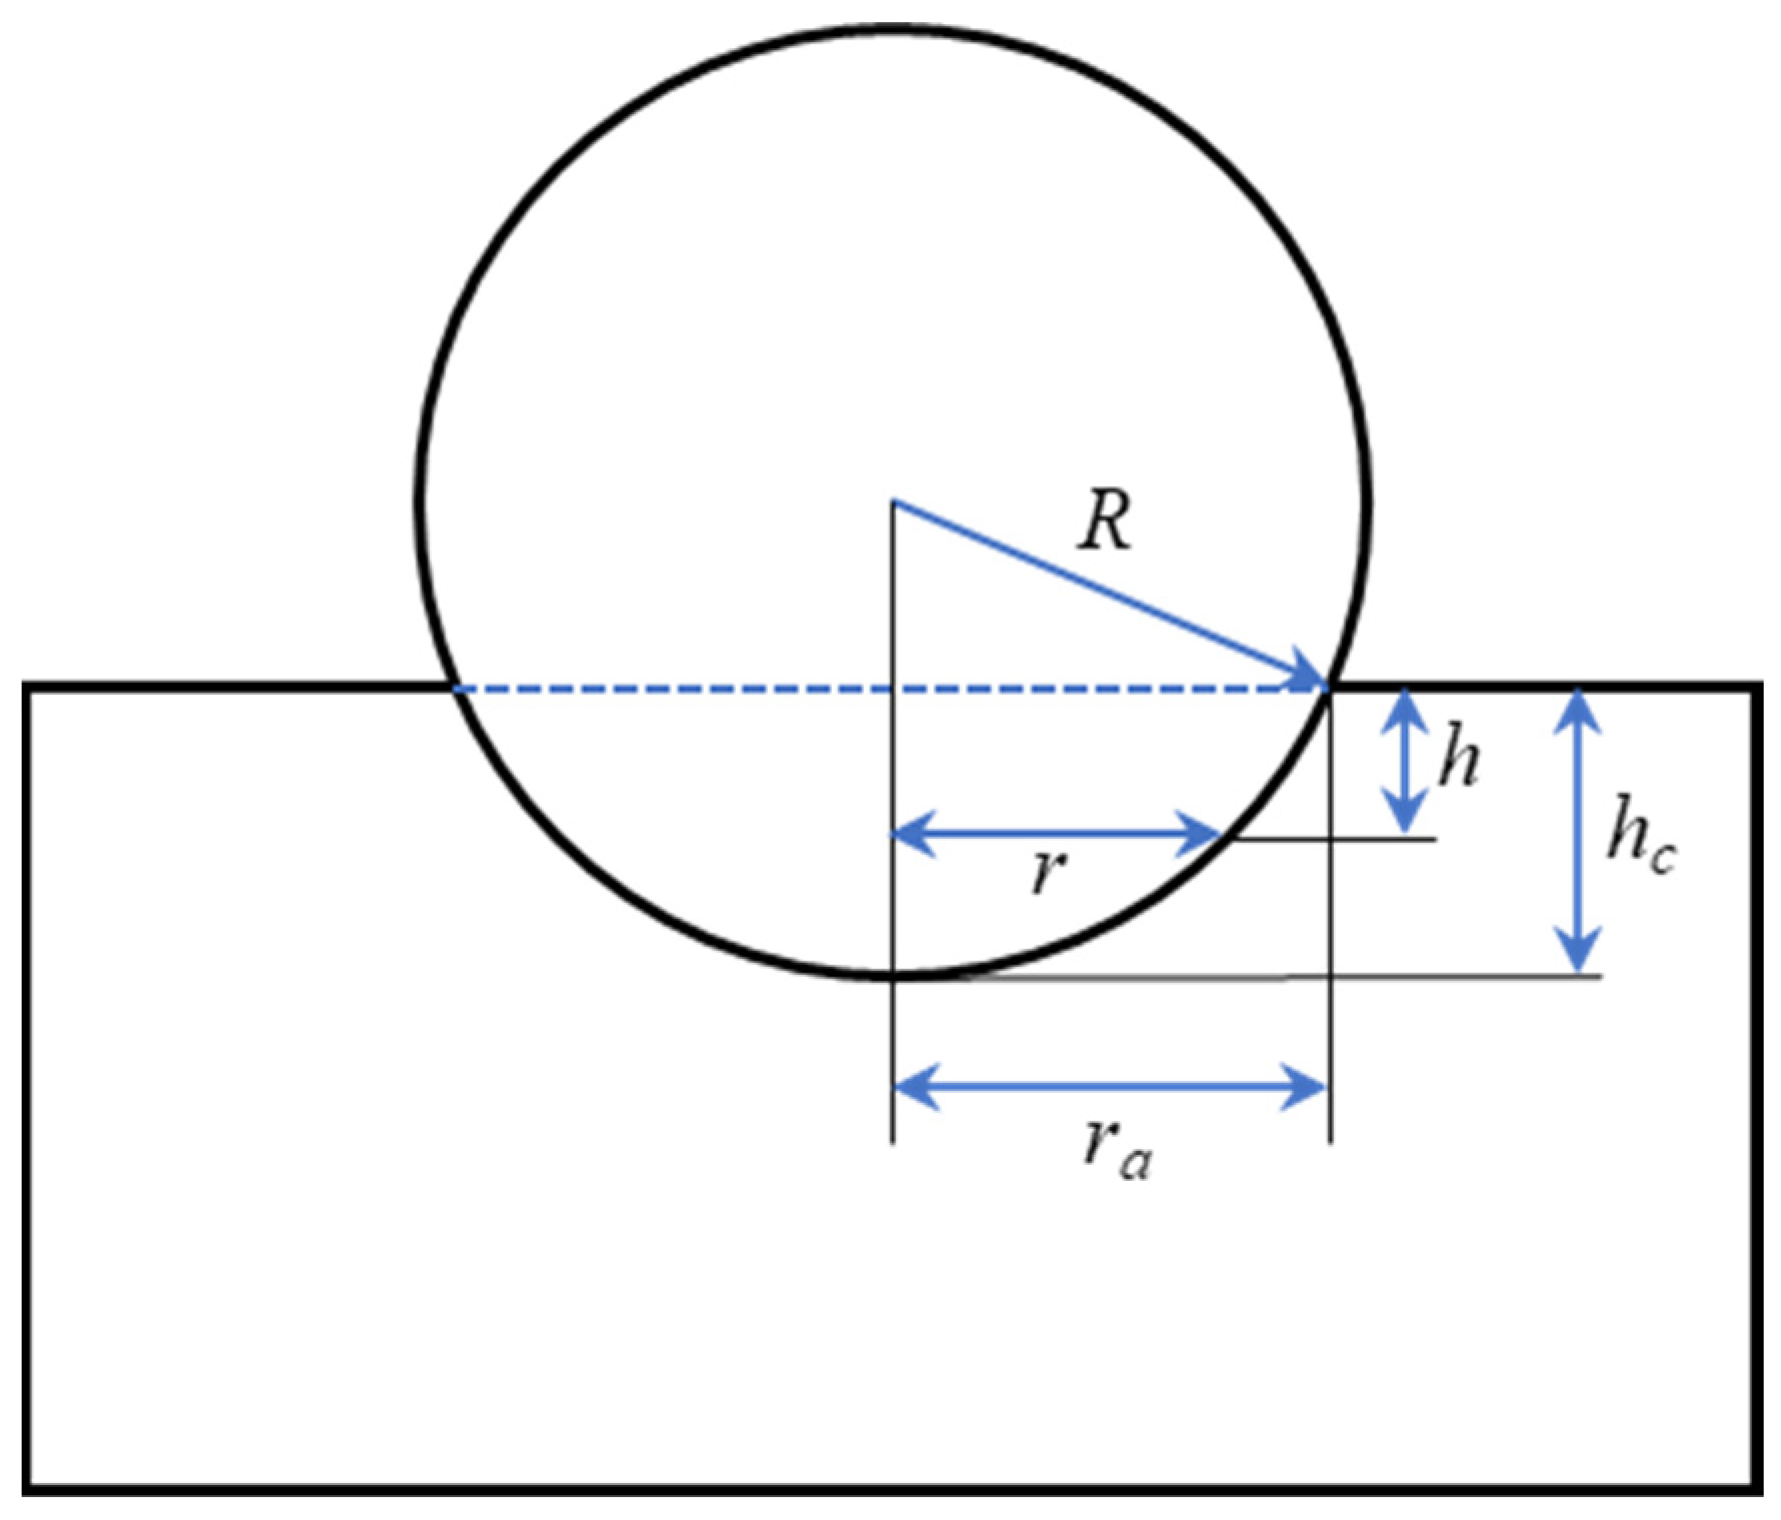
2.5.1. Elastic Compression Stage

The elastic modulus of the coating and the erosion particles are E1 and E2, the yield strengths are σ 1 y and σ 2 y , and the Poisson’s ratios are μ1 and μ2, respectively. According to Hertz’s contact theory, when the particles with radius ra are in elastic contact with the coating, the relationship between the contact force and the relative deformation of the particles is as follows [39]:
F = 4 R h 3 / 2 3 ( k 1 + k 2 )
where k 1 = 1 μ 1 2 E 1 , and k 2 = 1 μ 2 2 E 2 .
In the formula, F represents the contact force of the particle impacting the coating (N). h denotes the relative deformation between the contact particle and the coating (mm).
The motion of impact particles in the vertical direction can be calculated using the principle of conservation of energy.
1 2 m V 2 s i n 2 α V 2 = F   d h
where m is the mass of the eroded particle, V is the velocity of the impacted particle. α is the impact angle and V is the velocity in the perpendicular direction during the elastic deformation of the particle and the coating, thus:
V = V 2 s i n 2 α 16 R h 5 2 15 m k 1 + k 2
In the elastic deformation stage of the particle’s horizontal motion, considering the presence of frictional force between the particle and the coating with a friction coefficient f (taken as 0.2), the adhesive friction coefficient in the elastic contact zone can be expressed using Hertzian theory as follows:
f = 1 2 μ 1 2
Therefore, the velocity of the particle in the horizontal direction is as follows:
V | | = V 2 cos 2 α 16 f R h 5 2 15 m ( k 1 + k 2 )
The maximum compressive stress distribution q0 in the contact zone between the particles and the coating surface is derived from the Hertz contact equation:
q 0 = 2 R 1 2 h 1 2 π ( k 1 + k 2 ) = 2 r a π R ( k 1 + k 2 )
As shown in Figure 4, the relationship between r and the depth of indentation h can be expressed as follows:
r a 2 = R h c
In the elastic compression phase, it is assumed that the compressive stress at the center of the contact area is consistently higher than that at other points in the contact zone. Therefore, when the elastic compression phase concludes, and the compressive deformation reaches the limit of elastic deformation, hc, the compressive stress at the center of the contact area reaches the yield strength of the coating. Thus:
q 0 = σ 1 y
Therefore, the contact surface radius ra and the relative deformation hc (indentation depth) can be solved by Equations (5)–(12) and (5)–(14) when the elastic deformation limit is reached:
r a = π ( k 1 + k 2 ) σ 1 y R 2
h c = π 2 ( k 1 + k 2 ) 2 σ 1 y 2 R 4
Substituting the results for hc into V , the velocity threshold of the eroded particles can be solved when only elastic deformation occurs ( V = 0 ):
V T = 16 R h c 5 2 15 m ( k 1 + k 2 ) sin 2 α

2.5.2. Plastic Compression Stage

As shown in Figure 5, according to Hertz’s theory, the compressive stress on the hemispherical surface can be expressed as follows:
q ( r ) = 2 r 2 r a 2 π R ( k 1 + k 2 )
When the erosion particles impact the surface of the coating and plastically deform the surface of the coating, according to the formula for the distribution of the compressive stress in the contact zone, the compressive stress in the circle with a depth of h ( h c > h > 0 ) is 4 r r 2 r a 2 R ( k 1 + k 2 ) , then the total contact force in the elastic ring is as follows [40]:
F e = r a r 4 r r 2 r a 2 R ( k 1 + k 2 ) d h r
When the erosion particles are in contact with the coating, a plastic indentation process occurs ( h c < h ), thus:
r 2 = R h
The intrinsic equation of the coating material is applied to calculate the compressive stress at the center point and, therefore, on the plastic contact surface:
σ p = σ 1 y + E t ( h r 2 R h c )
Thus, the total contact force in the plastic crown region is as follows:
F p = A P d = π R h ( σ 1 y + E t h E t h c ) π E t R h c 2 2
In summary, the total contact force during the elasto-plastic compression phase is as follows:
F = F e + F p
The coating satisfies the following relationship when transitioning from maximum elastic deformation ( h c ) to plastic deformation (H):
1 2 m ( V ( h c ) 2 V ( H ) 2 ) = h c H F d h
When the coating reaches the maximum plastic deformation H, there is V ( H ) = 0 . V ( h ) can be solved by substituting Equation (15) into Equation (9). Substituting V ( H ) and V ( h ) into Equation (24) yields the following:
1 2 m V ( h c ) 2 = h c H F d h
When the particle impact coating undergoes plastic deformation, the erosion particles also simultaneously perform a similar cutting action on the coating surface. According to Chen Dainian’s model [41], the relationship between the flow pressure of the coating material and the yield strength of the coating during horizontal cutting of the coating by the erosion particles can be expressed as follows:
P m = K σ 1 y
where K is taken to the value of 2.8–3.0.
In the process of horizontal cutting, the contact surface of the particles with the coating is the surface of the hemispherical crown. The area of the contact surface and the horizontal velocity of the particles with a deformation of h can be expressed as follows:
A = π R h
Considering the adhesive friction in the plastic deformation zone during the plastic deformation of the coating, the coefficient of adhesive friction in the plastic deformation zone can be calculated by applying the Tabor criterion as follows [42]:
f p = k T p m 2 ζ k T 2
ζ is a parameter in the Tabor criterion (ranging from 3 to 25). According to the Tresca yield condition, k T = 0.5 σ 1 y . Thus:
V ( h ) = V ( h c ) 2 2 m [ h c h ( f e F e + A P m + f p F p ) d h ]
V ( h ) = V ( h c ) 2 2 m h c H F d h
The H solved above is brought into Equation (29) to solve for judgment:
V ( H ) = V ( h c ) 2 2 m [ h c H ( f e F e + A P m + f p F p ) d h ]
If V ( H ) is an imaginary number, this indicates that the particle has reached its maximum depth in the vertical direction. At this point, the horizontal velocity V has decelerated to zero. S P needs to be calculated in terms of the time when the horizontal velocity decelerates to zero (assuming that the vertical depth of the indentation is H , and so there is V ( H ) = 0 ), H is solved according to the above equation, so the amount of erosion can be expressed as follows:
S p = h c H A V d t = h c H A V V d h
The total amount of erosion of the coating by the particles is as follows:
S = S p
If V ( H ) is a real number, it means that the cutting process of the particle in the horizontal direction is not completed when the particle reaches the maximum depth in the vertical direction (there is still a residual horizontal velocity V ( H ) > 0 ). Therefore, the volume loss in the process is as follows:
S p = h c H A V d t = h c H A V V d h

2.5.3. Resilient Recovery Phase

At the end of the plastic deformation phase, the erosion particles are ejected upward in the vertical direction by the restoring force from the elastic deformation of the coating. Meanwhile, the horizontal velocity of the particles enables them to continue cutting into the coating. During the rebound phase, as illustrated in Figure 4, the contact surface exerts a rebound force on the particles as follows:
F c = 0 h c 4 ( h h r ) R ( h c + h r ) k 1 + k 2 d h r ( H h c < h < H )
The perpendicular velocity of the particles for the rebound process is as follows:
V ( h ) = 2 m h H 0 h c 4 ( h h r ) R ( h c + h r ) k 1 + k 2 d h r d h
Among them:
V ( H h c ) = 2 m H h c H 0 h c 4 ( h h r ) R ( h c + h r ) k 1 + k 2 d h r d h
At a deformation of h ( H h c < h < H ) , the area of the contact surface and the horizontal velocity of the particles can be expressed as follows:
A = π R h
V ( h ) = V ( H ) 2 2 m h H ( f e F e + A P m + f p F p ) d h
If V ( H h c ) turns out to be an imaginary number, it means that the rebound has decelerated to 0 when it has not yet reached H h c from H. Therefore, the vertical depth in this phase when V = 0 is located in this phase has already reached H ( V ( H ) = 0 ) from H. Therefore, according to the conservation of energy, there is the following:
1 2 m ( V ( H ) 2 V ( H ) 2 ) = H H ( f e F e + A P m + f p F p ) d h
Based on the above equation, H can be solved and brought into the following equation. The erosion volume for the rebound process can be solved as follows:
S r = H H A V d t = H H A V V d h
In this case, the total erosion of the coating by the particles is as follows:
S = S p + S r
If V ( H h c ) turns out to be a real number, it means that the horizontal velocity V of the particles has not decelerated to zero during the rebound from H to H h c . Therefore, the volume loss of the particles in the rebound phase of the cutting action on the coating is as follows:
S r = H H h c A V d t = H H h c A V V d h
At the end of the action of the rebound force, the velocity of the particles in the vertical direction remains constant as V s = V ( H h ) , at this time, the particles are still cutting the coating in the horizontal direction, so when h < H h c , according to the law of conservation of energy, there is a rebound after the end of the horizontal velocity of the particles as follows:
V ( h ) = V ( H h c ) 2 2 m h H h c ( f e F e + A P m + f p F p ) d h
Among them:
V ( H h c ) = V ( H ) 2 2 m H h c H ( f e F e + A P m + f p F p ) d h
If V ( 0 ) turns out to be imaginary, then it means that V has decelerated to 0 when h has not yet rebounded from H h c to 0, so the vertical depth at V = 0 in this phase has reached H (i.e., V ( H ) ) from H h c . Thus:
V ( 0 ) = V ( H h c ) 2 2 m 0 H h c ( f e F e + A P m + f p F p ) d h
S s = H h c H A V d t = H h c H A V V s d h
In this case, the total erosion of the coating by the particles is as follows:
S = S r + S p + S s
If V ( 0 ) turns out to be a real number, it means that V has decelerated to 0 before the rebound from Hhc has reached 0. Therefore, the volume loss due to the cutting action of the particles on the coating after the rebound is as follows:
S s = H h c 0 A V d t = H h c 0 A V V s d h
In summary, the total volume loss to the coating caused by the particles in the process of eroding the coating is as follows:
S = S r + S p + S s

2.5.4. Calculation of Total Erosion Rate and Parameter Correction

In summary, the wear rate for individual particle erosion is as follows:
ε = S ρ 1 m
when multiple particles impact the target material simultaneously, a portion of these particles perform micro-cutting on the coating [39,43]. The percentage be denoted as α, thus:
ε = α S ρ 1 m
Considering the complexity of the relationship between the micro-cutting rate α, the erosion system, particle morphology, and airflow, this parameter must be calculated and adjusted for specific coatings. In this experiment, the micro-cutting rate α in the model was fitted and corrected using previous erosion test data for Cr3C2-NiCr coatings prepared by HVOF spraying at various angles. To facilitate the quick calculation of the erosion rate, MATLAB software (R2022a) was employed to program and compute the model. Figure 6 shows a comparison between the actual erosion rate NC (test) and the simulated erosion rate NC (simulation) for the Cr3C2-NiCr coating at different angles. The erosion rates of the NC coating at impact angles of 30°, 45°, 60°, 75°, and 90° were measured as 0.63, 0.90, 1.10, 1.47, and 1.55, respectively. The erosion rates predicted by the model were calculated as 0.51, 0.79, 1.12, 1.47, and 1.60. As the impact angle increases, the erosion rate of the coating rises. The comparison reveals that the model’s calculation results closely match the actual erosion rates, with the largest discrepancy being 18.9%.

3. Results

3.1. Characterization of Coating Morphology and Phase Composition

The microscopic morphology of the coatings was examined using SEM, as depicted in Figure 7. Porosity was assessed through image analysis, revealing porosities of 3.82% in the NCC coating, 3.60% in the NCT1 coating, and 6.91% in the NCT2 coating. The components within the coatings were well-integrated, showing no significant cracks or pores (black areas in the coating). In contrast, the NCT2 coatings displayed a noticeable increase in cracks and pores, leading to higher porosity. The above elevated porosity negatively impacted the densification of the coatings and compromised their internal bonding and overall service performance.
The physical phase compositions of the prepared NCC and NCT coatings were analyzed using X-ray diffraction (XRD), and the X-ray diffraction spectra are shown in Figure 8. In the NCT coating prepared by the supersonic flame spraying system, the main phase compositions included Cr3C2 (PDF#71-2287), TiC (PDF#32-1383), Cr1.12Ni2.88, Co (Co-FCC (γ) and Co-HCP (ε)), Cr7C3, and spinel phases (NiCr2O4, CoCr2O4). The peaks at 39.0° and 40.2° were also higher compared to the NCC coatings, indicating that the added TiC did not significantly affect the spraying process. TiC did not undergo significant decomposition or oxidation during spraying. However, slight oxidation of the coatings during preparation led to the presence of spinel phases (NiCr2O4, CoCr2O4), which mainly resulted from reactions with the oxides of Ni, Cr, and Co.

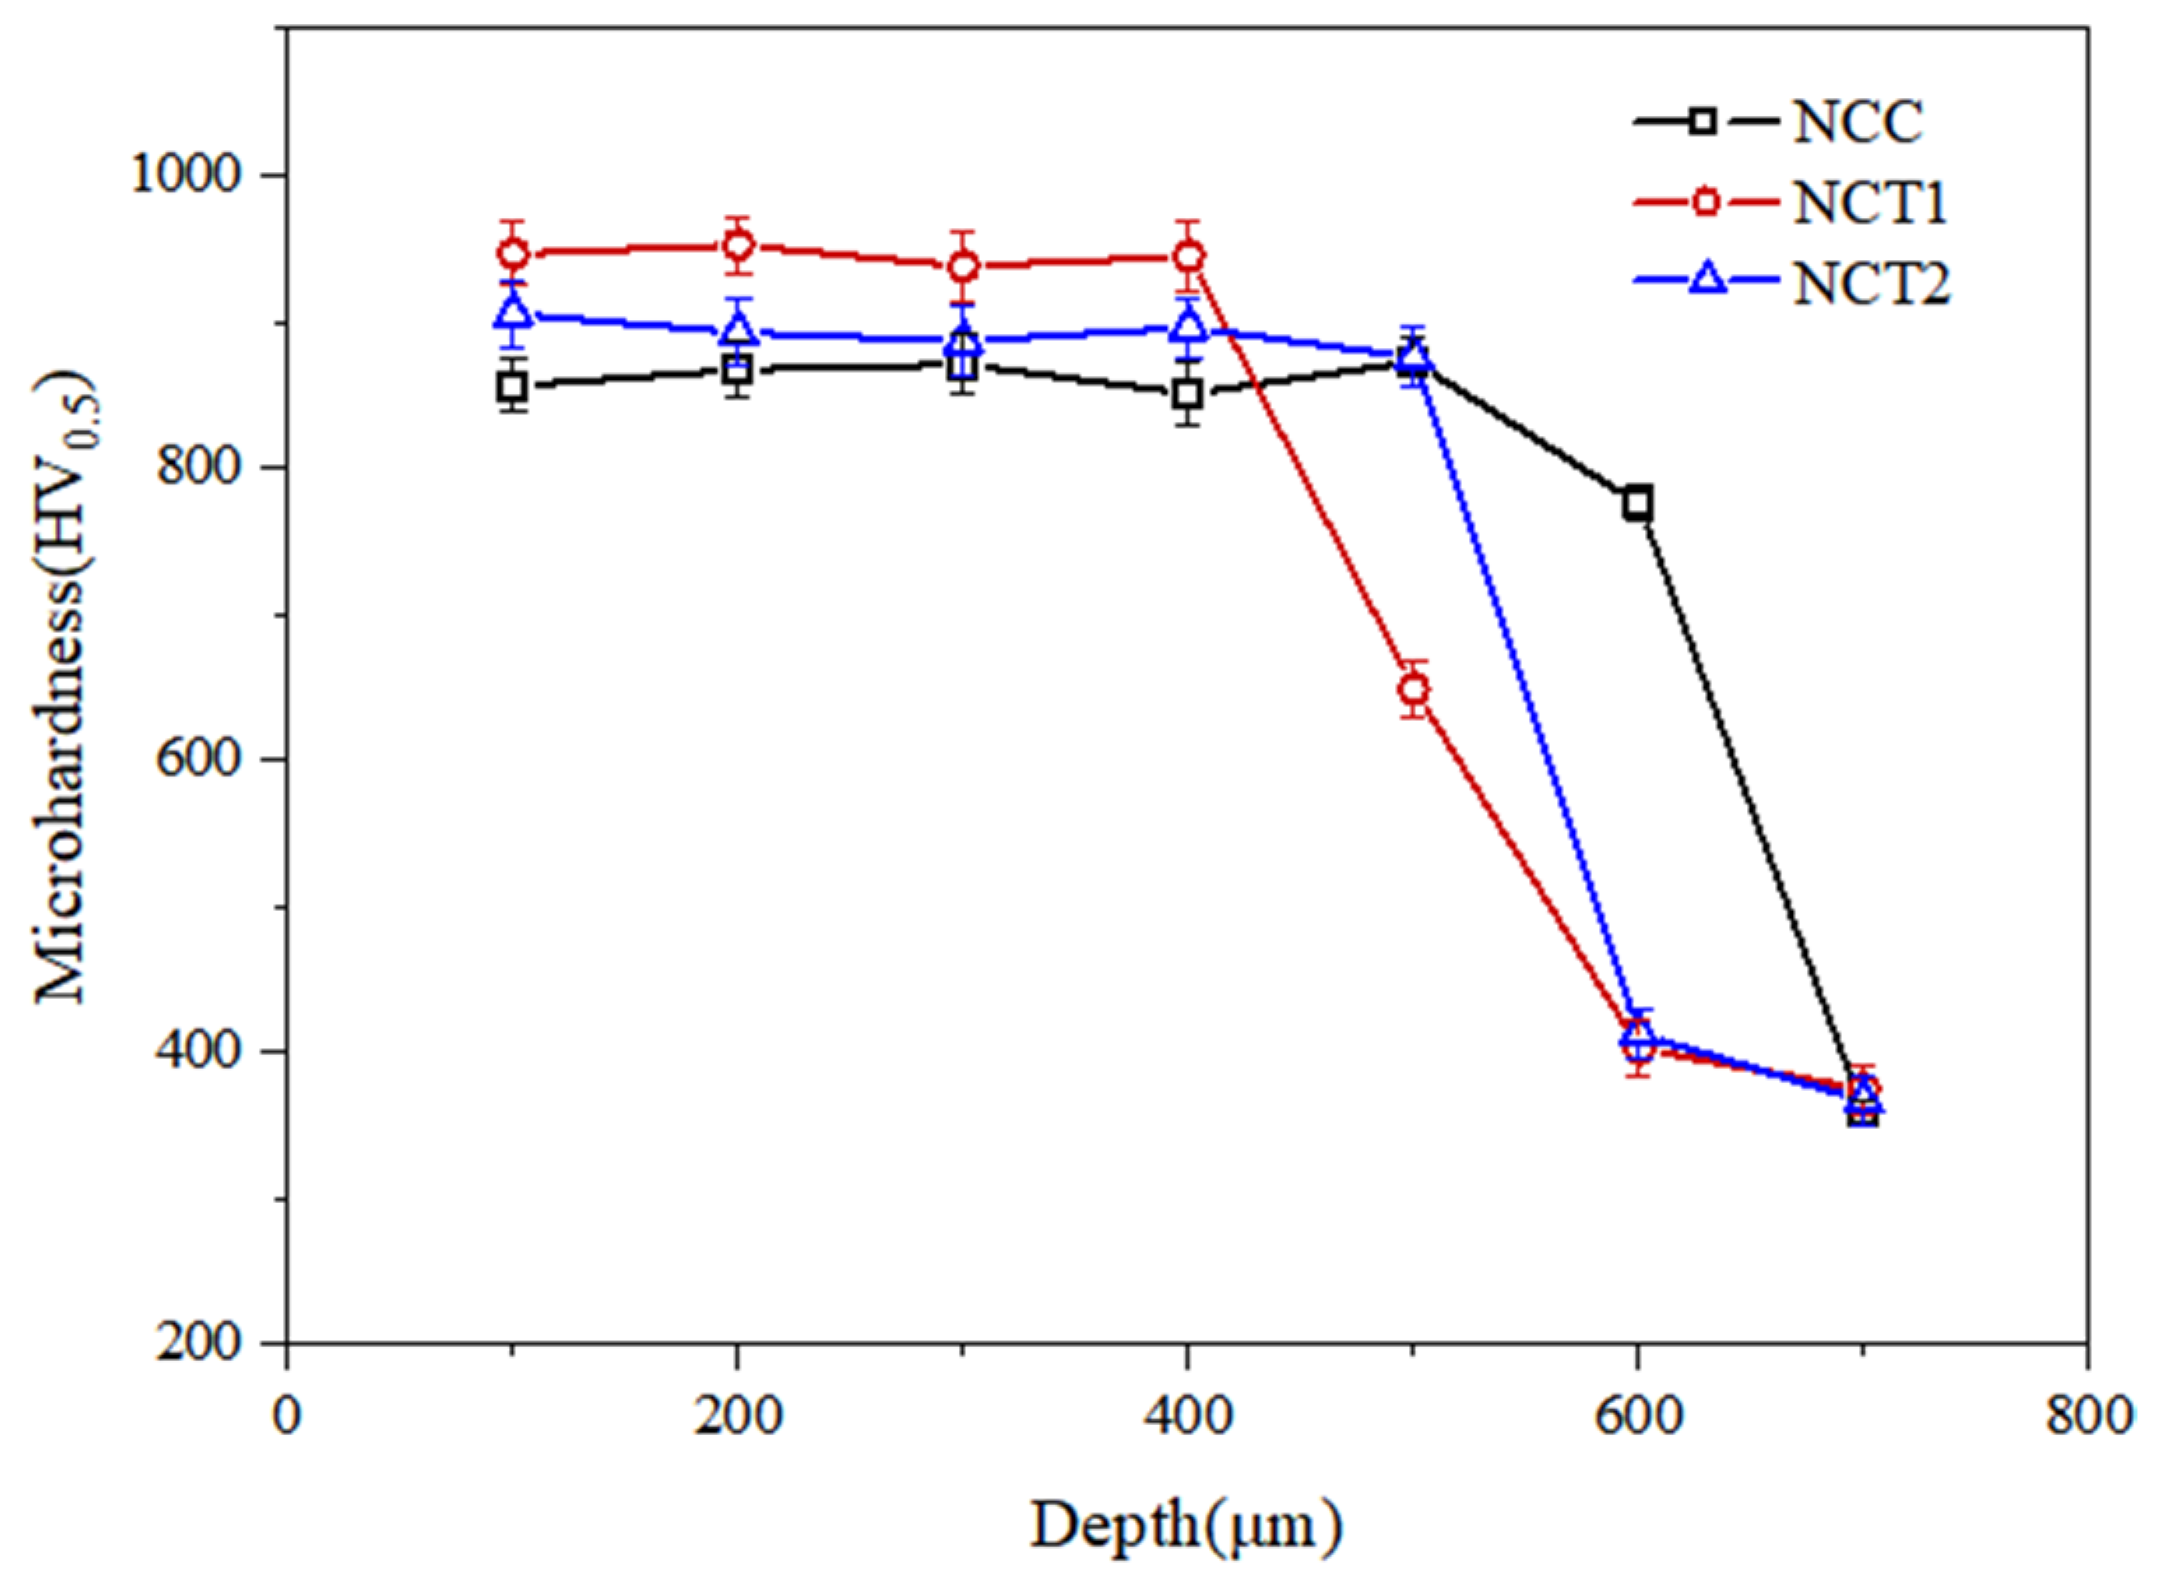
3.2. Microhardness and Tensile Bond Strength

The hardness of the coating at different depths was tested by Vickers hardness tester (HVT-1). The microhardness of the coatings is illustrated in Figure 9, with average Vickers hardness values of 863.3 HV0.5 for the NCC coating, 945.3 HV0.5 for the NCT1 coating, and 911.1 HV0.5 for the NCT2 coating. The NCT1 coating exhibited a higher hardness compared to the NCC coating. The increase in coating hardness is due to the higher content of hard ceramic phases resulting from the addition of nano-TiC. These TiC phases, distributed within the metal-bonded matrix, provided additional resistance to indentation, enhancing the overall hardness of the coating. In contrast, the NCT2 coating, with 6 wt.% nano-TiC, showed a lower hardness than the NCT1 coating. The reduced hardness in the NCT2 coating is primarily due to the excessive amount of nano-TiC, which hindered the flow of the metal-bonded phase during the deposition process. This disruption prevented the formation of a solid and cohesive matrix, leading to reduced densification and increased porosity in the coating. The increased porosity compromised the coating’s ability to resist indentation, ultimately resulting in a decrease in hardness.
The tensile bond strengths of the coatings were assessed using the glued tensile experimental method, which is presented in Figure 10. The average bond strengths measured were 53.2 MPa for the NCC coating, 54.5 MPa for the NCT1 coating, and 47.8 MPa for the NCT2 coating. The fracture during the stretching process mainly occurs at the interface between the coating and the substrate, which is caused by the radial crack propagation during the stretching process. The bonding strength of the NCT1 coating was comparable to that of the NCC coating and to typical Cr3C2-NiCr coatings reported in the literature for HVOF processes. However, the bonding strength of the NCT2 coating, which had a higher concentration of 6 wt.% nano-TiC, showed a slight decrease. This reduction in bonding strength is attributed to the excess amount of nano-TiC, which interfered with the flow and filling of the metal bonding phase at the substrate-coating interface during deposition. As a result, the bonding between the coating and the substrate was adversely affected, leading to lower bonding strength in the NCT2 coating.

3.3. Erosion Rate of Coating

The load–displacement curves for the NCC and NCT coatings were obtained by using a stress–strain probe (SSM) system with continuous indentation loading. The calculated elastic modulus and yield strength for each coating are detailed in Table 2. The NCC coating has an elastic modulus of 162.38 GPa and a yield strength of 869.8 MPa. In comparison, the NCT1 coating displays a higher elastic modulus of 175.09 GPa and a yield strength of 981.6 MPa, indicating superior rigidity and strength. Conversely, the NCT2 coating exhibits the lowest values, with an elastic modulus of 148.03 GPa and a yield strength of 632.3 MPa, reflecting its lower mechanical robustness compared to the other two coatings.
The erosion testing system was employed to assess the erosion rates of NCC, NCT1, and NCT2 coatings at impact angles of 30°, 60°, and 90°, as illustrated in Figure 11. At an impact angle of 30°, the erosion rates for the coatings are 0.55 mg/g, 0.42 mg/g, and 0.72 mg/g, respectively. At 60°, the erosion rates are 1.32 mg/g, 1.05 mg/g, and 1.69 mg/g, respectively. At 90°, the erosion rates are 1.85 mg/g, 1.55 mg/g, and 2.21 mg/g, respectively. The NCT1 coating exhibited enhanced erosion resistance compared to the original NC and NCC coatings. Specifically, the erosion rates for NCT1 decreased by 33.33%, 4.55%, and 0.01% at impact angles of 30°, 60°, and 90°, respectively, when compared to the NC coating. Compared to the NCC coating, the erosion rates of NCT1 were reduced by 23.64%, 20.45%, and 16.22% at these angles. Conversely, with an increased TiC content, the erosion resistance of the NCT2 coating was significantly decreased, resulting in notably higher erosion rates across all impact angles compared to the other coatings. The results suggest that a moderate addition of nano-TiC can enhance the erosion resistance of chromium carbide coatings. However, excessive amounts of nano-TiC result in reduced erosion resistance.
The measured elastic modulus and yield strength of the coatings were incorporated into the established erosion theoretical model to calculate the erosion rates of NCC and NCT coatings under impact angles ranging from 30° to 90°. It is evident that the model predictions closely match the actual experimental results by comparing the erosion rate results from model calculations with those obtained from experimental measurements, which demonstrates the accuracy of the model.

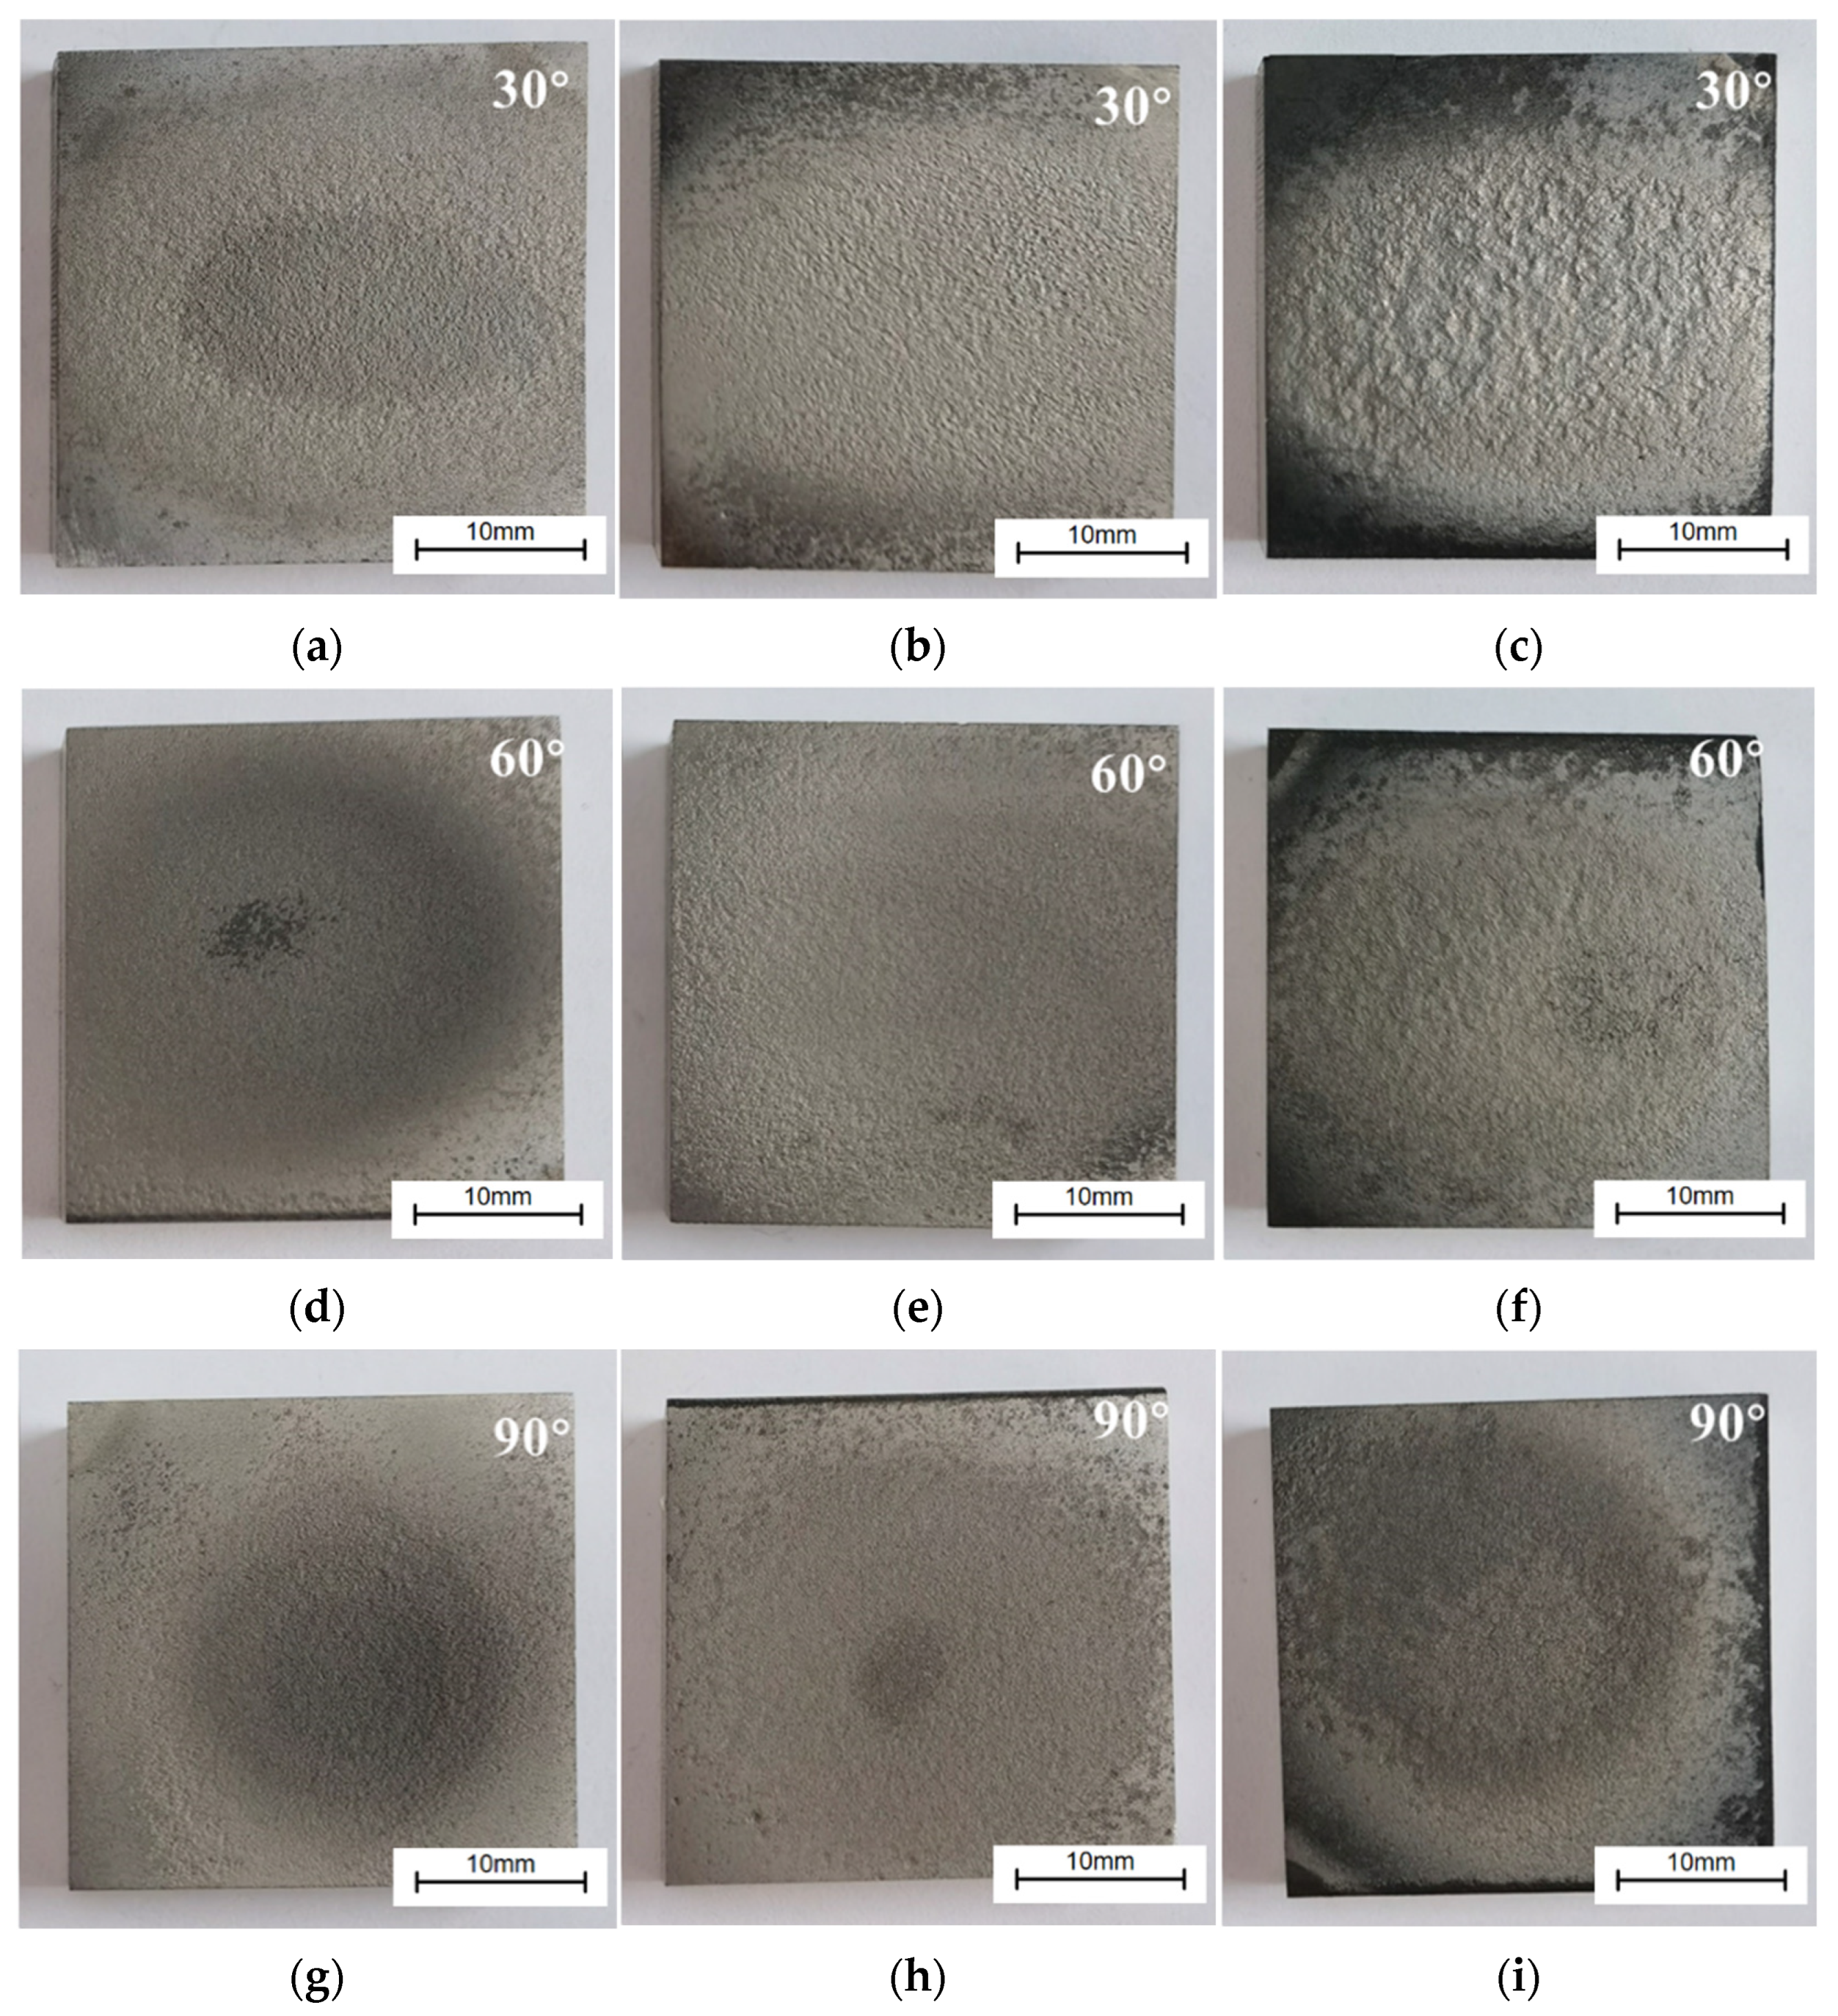
3.4. Coating Surface Erosion Morphology

The surface morphology of NCC and NCT coatings after erosion by 100 g of Al2O3 particles at impact angles of 30°, 60°, and 90° was analyzed. Optical profilometry was used to observe the eroded areas on the coating surfaces, as shown in Figure 12. Scanning Electron Microscopy (SEM) was employed to examine the microstructural morphology of the erosion pits on the coating surfaces, as depicted in Figure 13. At lower impact angles, the erosion pits were elliptical in shape. As the impact angle increased, the major axis of the elliptical erosion pits gradually diminished, eventually becoming circular at a 90° impact angle. At higher impact angles, the depth of the erosion pits increased. Compared to the NCC coating, the NCT1 coating exhibited shallower erosion pits and smaller cross-sectional areas at 30°, 60°, and 90° impact angles, consistent with the erosion rate results (Figure 11). In contrast, the NCT2 coating showed more severe erosion at all three impact angles, with noticeable erosion pits and a rougher surface morphology compared to both the NCC and NCT1 coatings.
From Figure 13a–c, it can be observed that the erosion regions on the surfaces of NCC and NCT coatings exhibit noticeable cutting marks at an impact angle of 30°. Additionally, prominent lips are present on both sides of these marks. This phenomenon occurs because, at low impact angles, the horizontal force of the eroding particles enables them to perform micro-cutting of the coating surface, removing material and leaving scratches along with debris. In comparison to the NCC coating, the NCT1 coating shows fewer cutting marks and reduced lips on either side of these marks in the erosion regions. This suggests that, during the erosion process, the depth of penetration of the eroding particles into the NCT1 coating is relatively shallow. As a result, the formation of lips is minimized, and the reduced depth of penetration leads to decreased material loss from the NCT1 coating surface, thereby decreasing its erosion rate (as shown in Figure 11). In contrast to the NCT1 coatings, the NCT2 coating surface displays not only cutting marks but also areas of partial delamination, resulting in a fragmented microstructure.
As shown in Figure 13d–f, at an impact angle of 60°, the erosion regions on the surfaces of the NCC and NCT coatings exhibit noticeable cutting marks. Lips are observed on both sides and at the ends of these cutting marks. At moderate impact angles, the horizontal force exerted by the erosion particles on the NCC coating surface is insufficient to complete the horizontal cutting process, leading to the formation of lips at the margins and termini of the marks. In comparison to the NCC coating, the NCT1 coating surface demonstrates relatively well-preserved lips near the cutting marks and exhibits less erosion-induced material removal. Conversely, the NCT2 coating surface shows a significant increase in erosion-induced material loss in the erosion regions.
In Figure 13g–i, it is evident that at a 90° impact angle, the erosion region on the NCT1 coating surface exhibits only a few cuts, while the NCC and NCT2 coatings show virtually no cuts in their erosion regions. Additionally, the NCT1 coating has fewer erosion craters and areas of spalling compared to the NCC and NCT2 coatings. These observations suggest that the NCT1 coating experiences less fatigue fracture and spalling, indicating superior erosion resistance at a 90° impact angle. Furthermore, the NCT1 coating’s better resistance to material loss and damage under these conditions highlights its potential for enhanced durability and longer service life, making it a more reliable option in environments subjected to high-velocity impacts. The NCT1 coating’s enhanced performance can be attributed to its improved microstructural properties, which contribute to a more robust defense against erosive forces.
As depicted in Figure 14a–c, under a 30° impact angle erosion, the surfaces of NCC, NCT1, and NCT2 coatings exhibit distinct pit structures. The binding phase of the NCC coating experiences degradation during erosion, leading to the exposure of Cr3C2 particles, which become more vulnerable to removal. In contrast, the NCT1 coating maintains a relatively intact configuration of Cr3C2 particles and binding phases. However, the NCT2 coating displays a more fragmented and loose structure on the surface, indicating that erosion causes inter-phase bonding fracture within the NCT2 coating, ultimately resulting in an increased erosion rate.
Under a 60° impact angle, as illustrated in Figure 14d–f, the coatings exhibit cracks that extend inward from the surface, primarily propagating along the interfaces between the hard phases and the binding phases. This phenomenon leads to fatigue fractures in the top layer of the coatings. Notably, the NCT1 coating demonstrates fewer cracks and shallower propagation depths compared to the NCC and NCT2 coatings. This observation suggests that the higher elastic modulus and yield strength of the NCT1 coating mitigate inter-phase brittle fractures during erosion, thereby reducing the erosion rate. In contrast, the NCT2 coating shows a greater number of cracks, with crack propagation resulting in surface fragmentation and delamination. This effect is attributed to an excessive addition of TiC, which decreases the elastic modulus and yield strength of the NCT2 coating, facilitating crack propagation between phases and exacerbating fatigue fractures, consequently increasing the erosion rate.
As shown in Figure 14g–i, at a 90° impact angle, both the NCC and NCT2 coatings exhibit significant surface fatigue fractures, leading to surface cracking and delamination of the top layer, along with the presence of some internal cracks. Conversely, the NCT1 coating displays relatively fewer fatigue fractures, maintaining a more intact surface structure and showing no significant internal cracks, a result attributable to its high elastic modulus and yield strength.

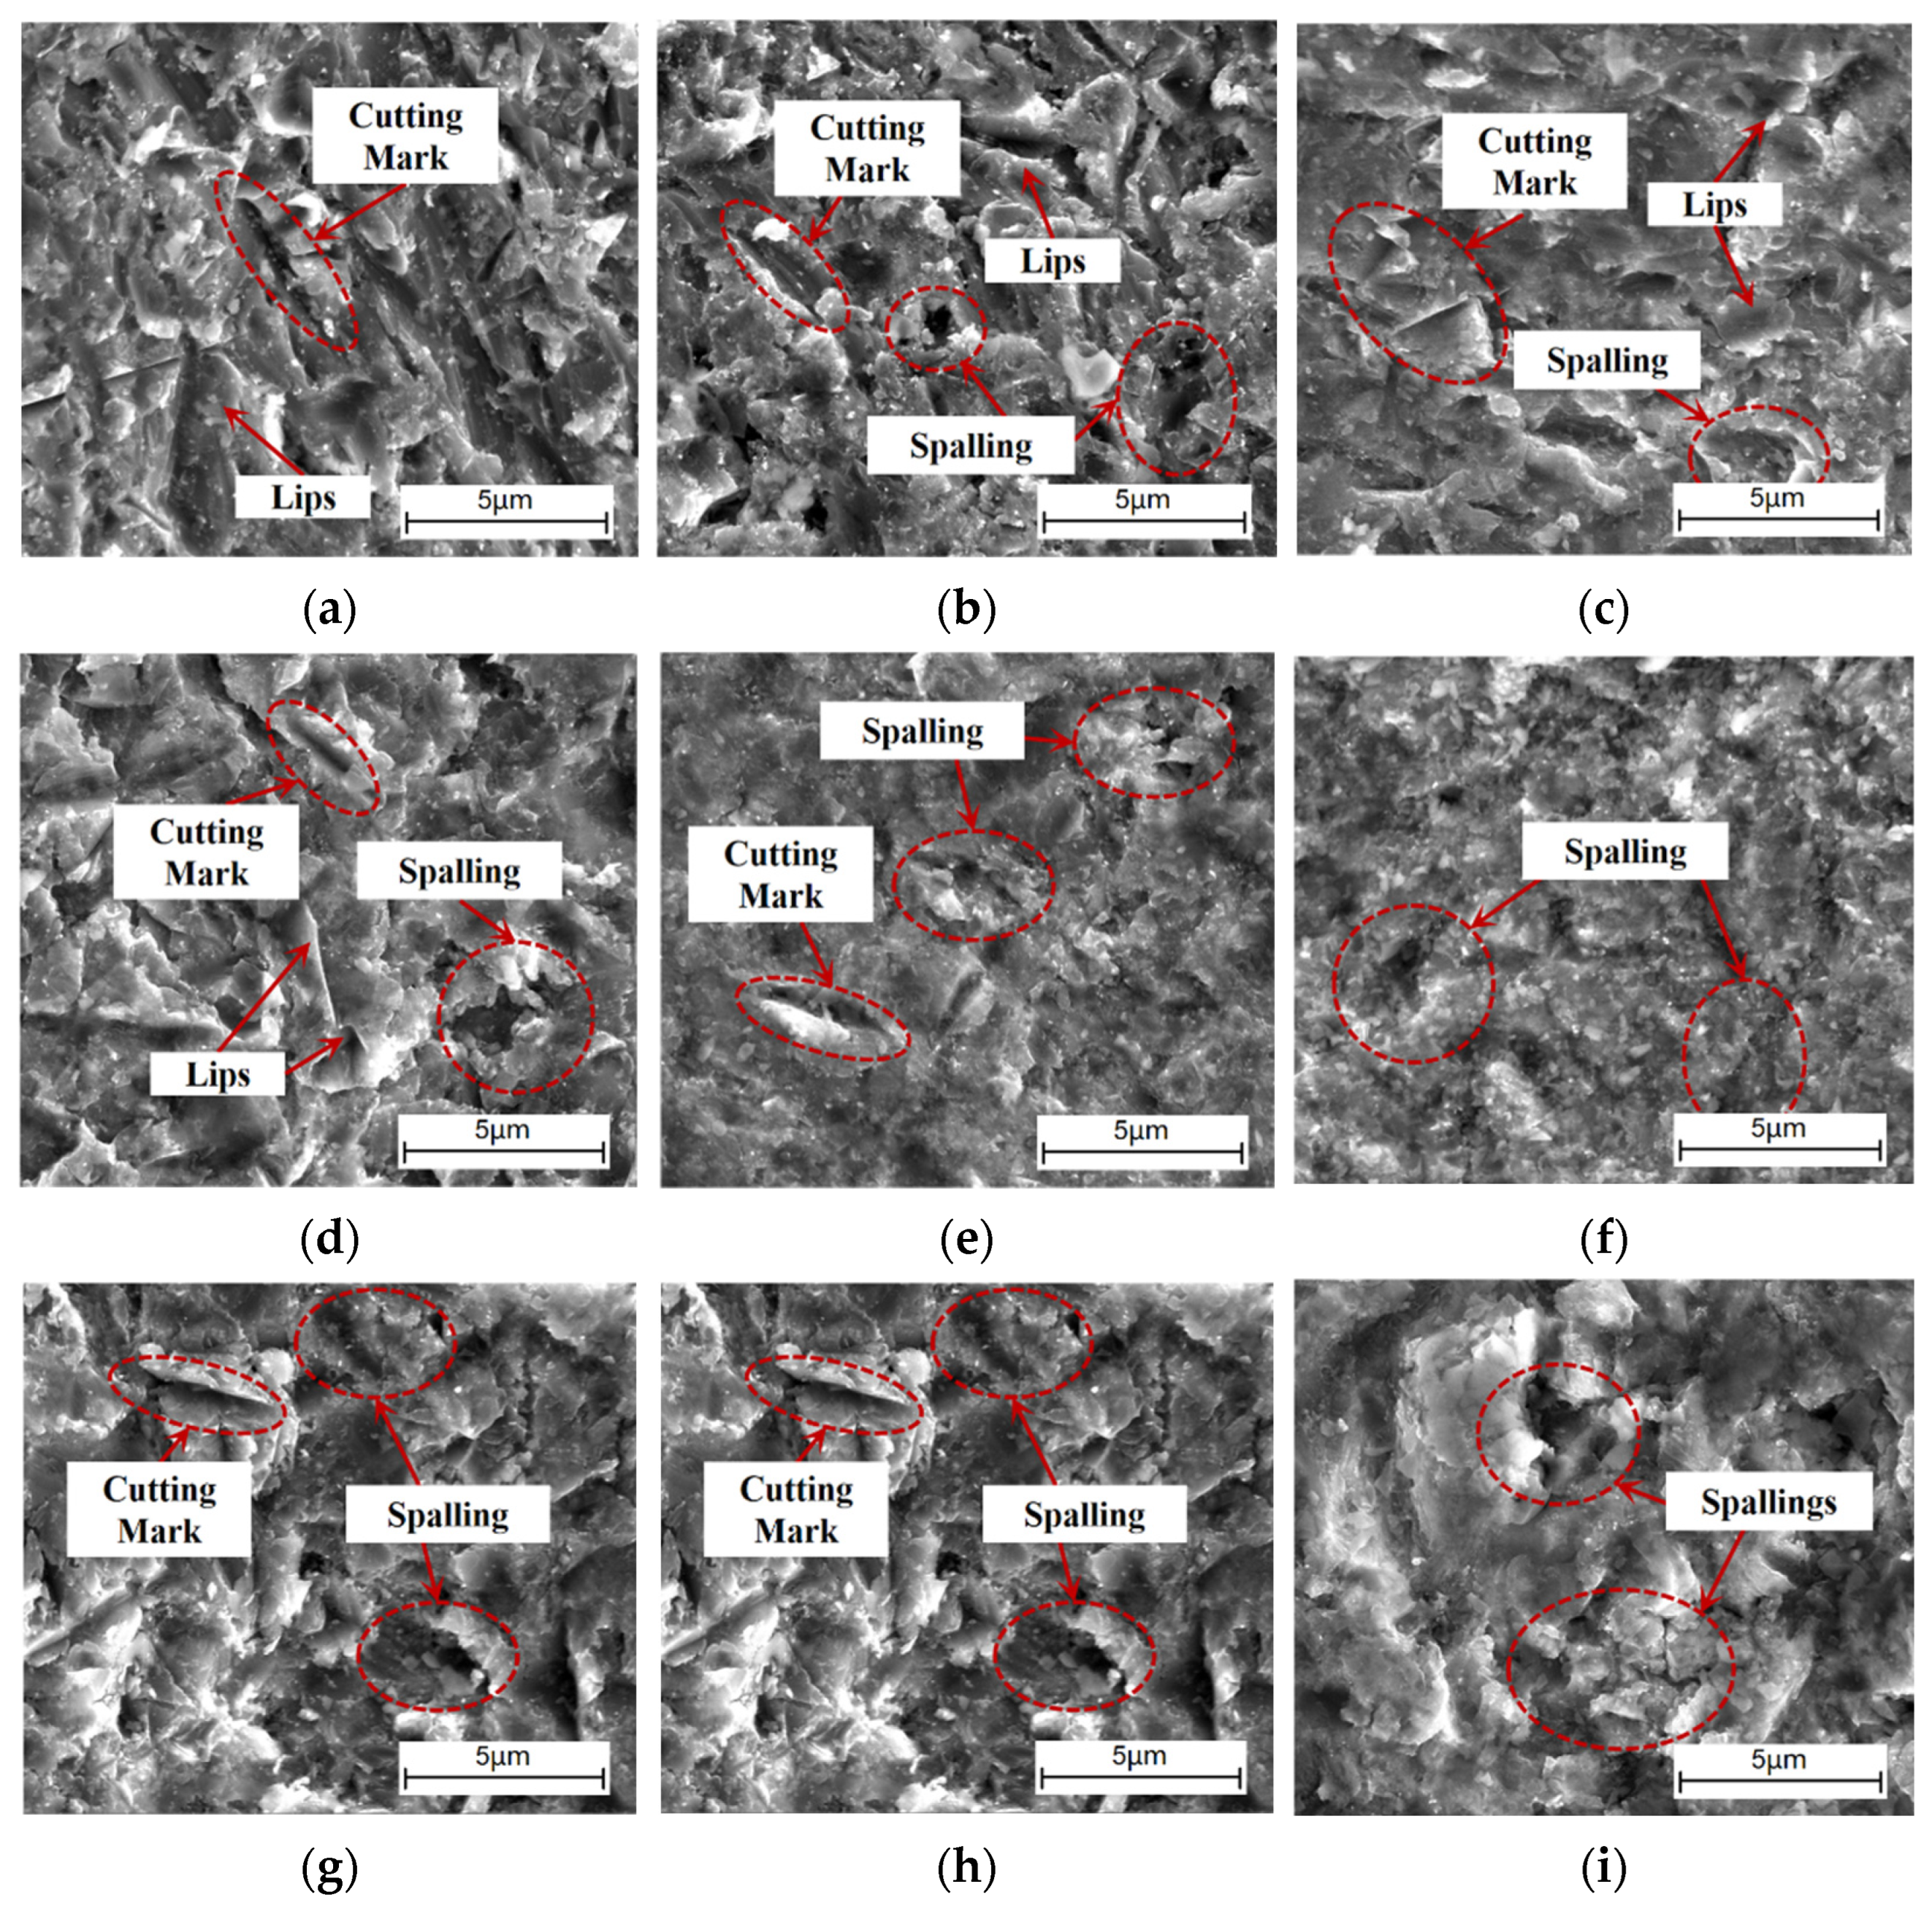
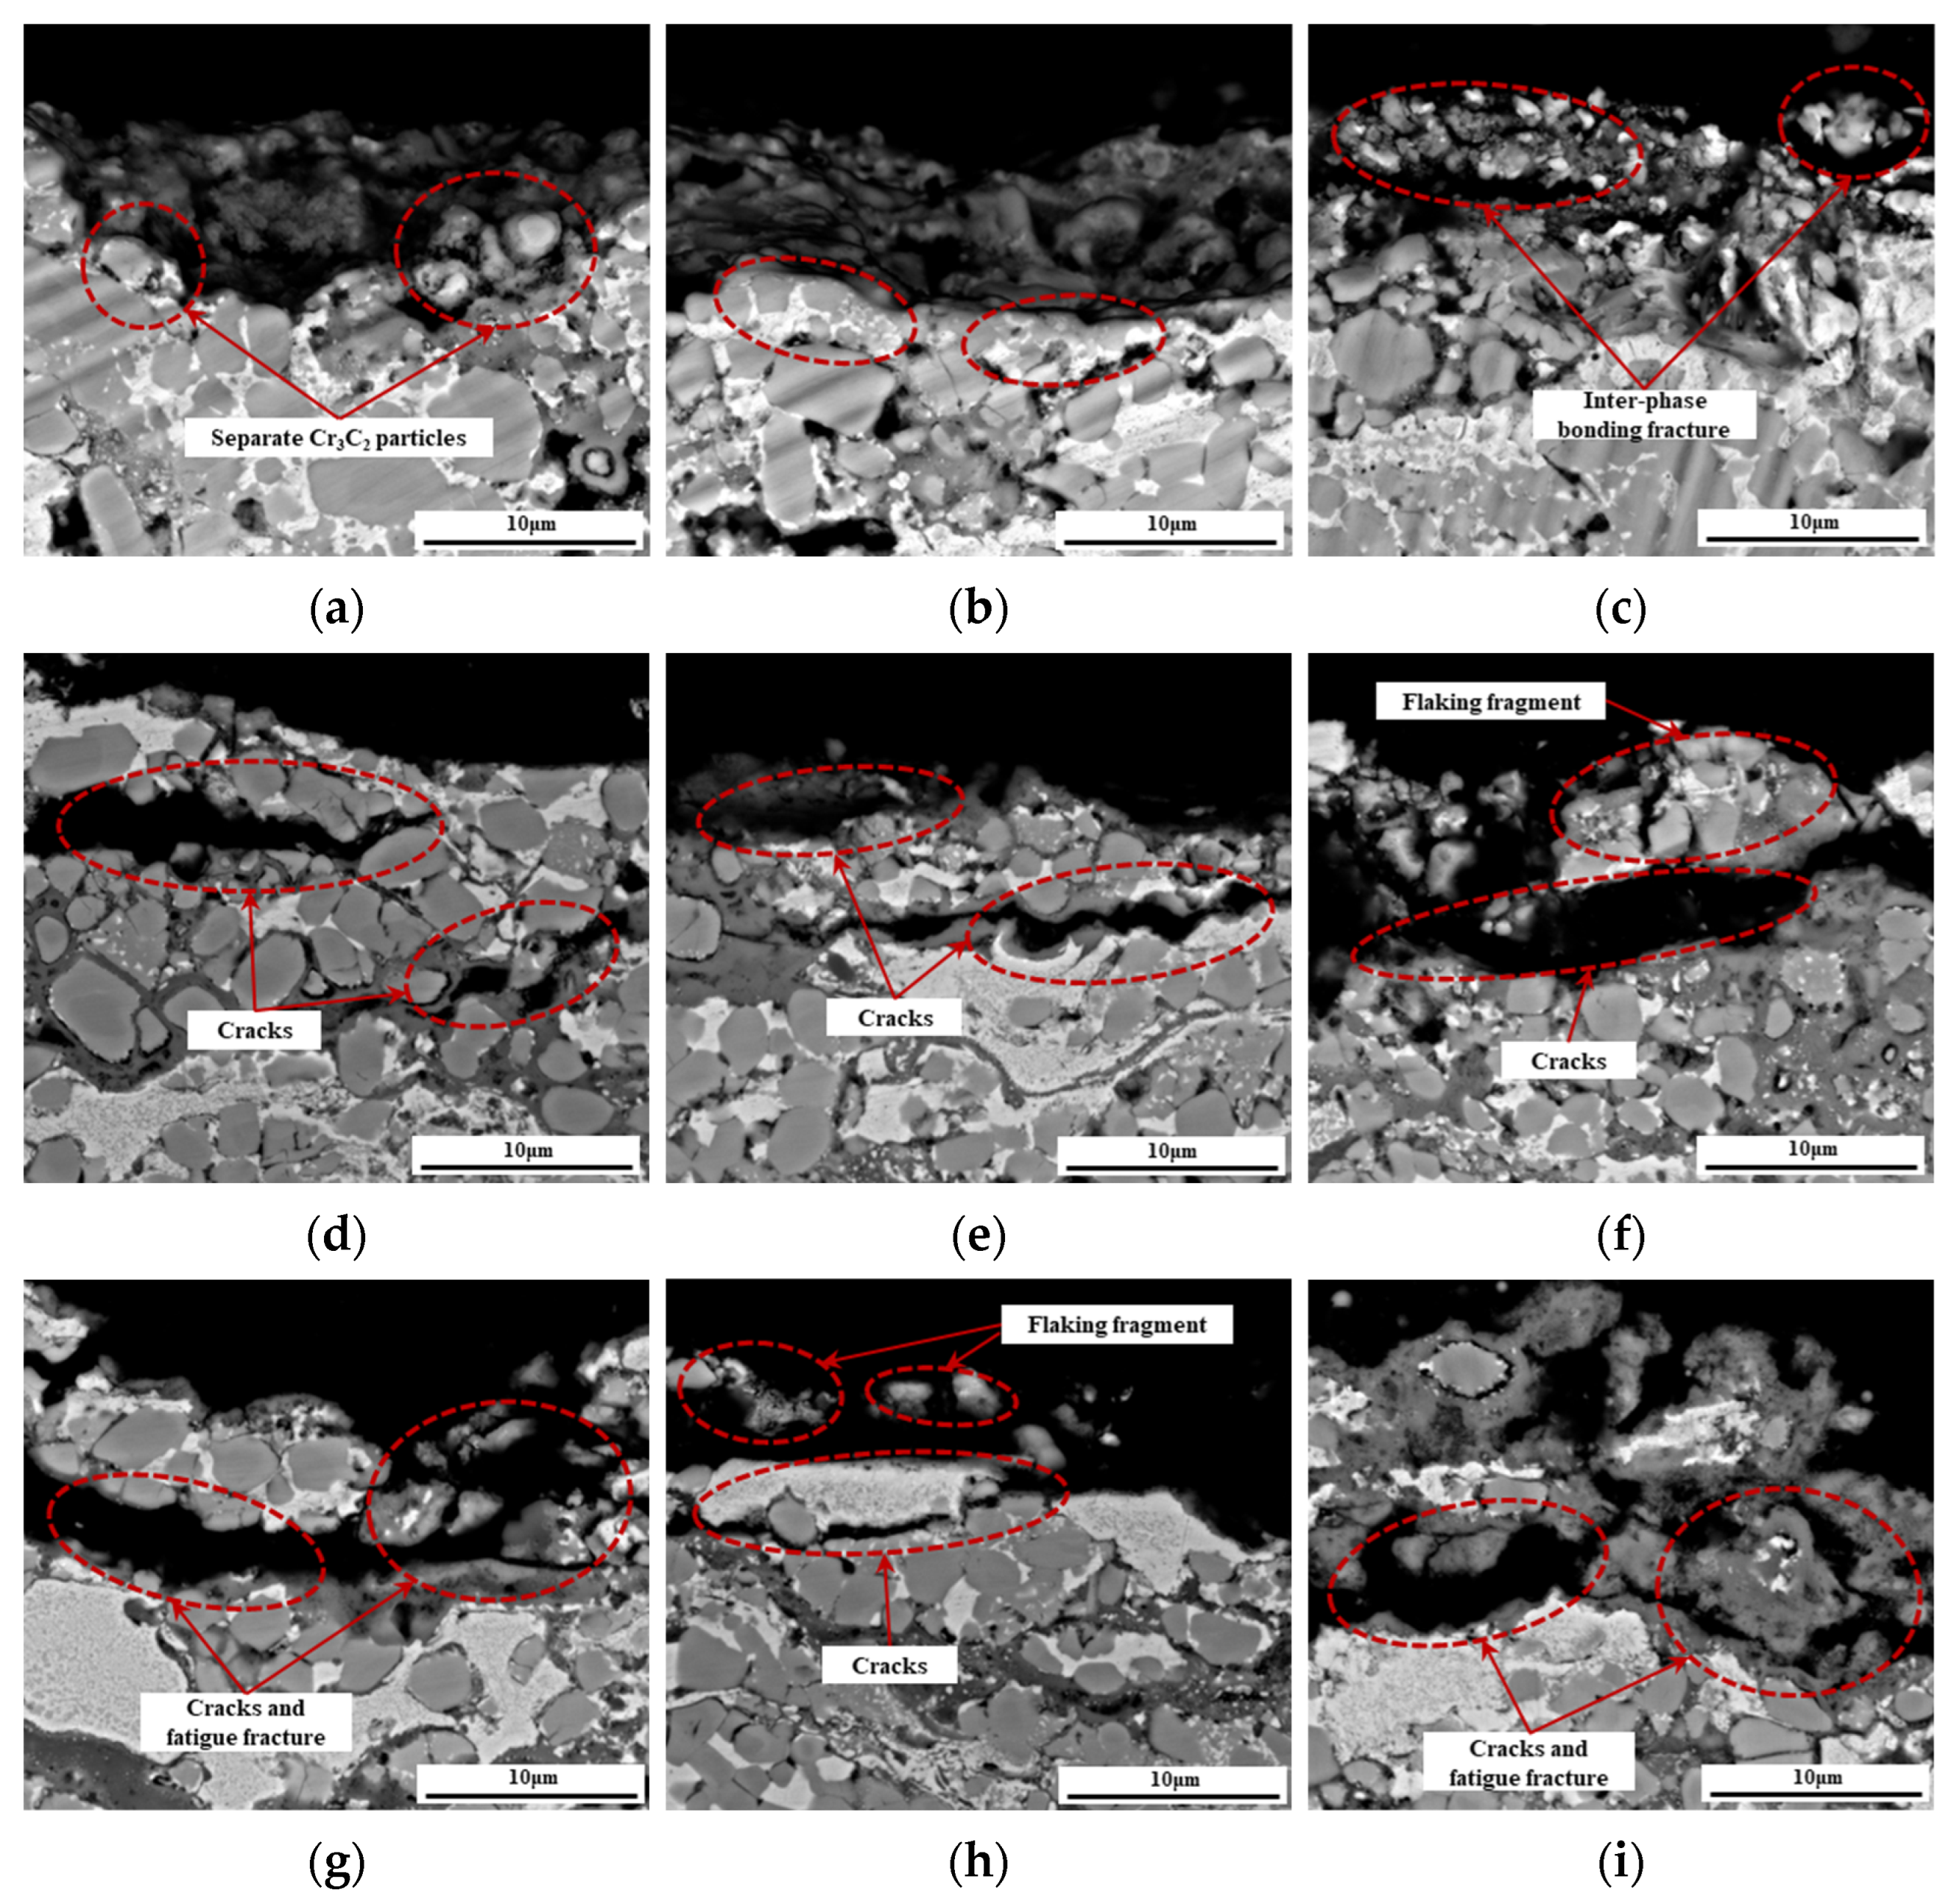
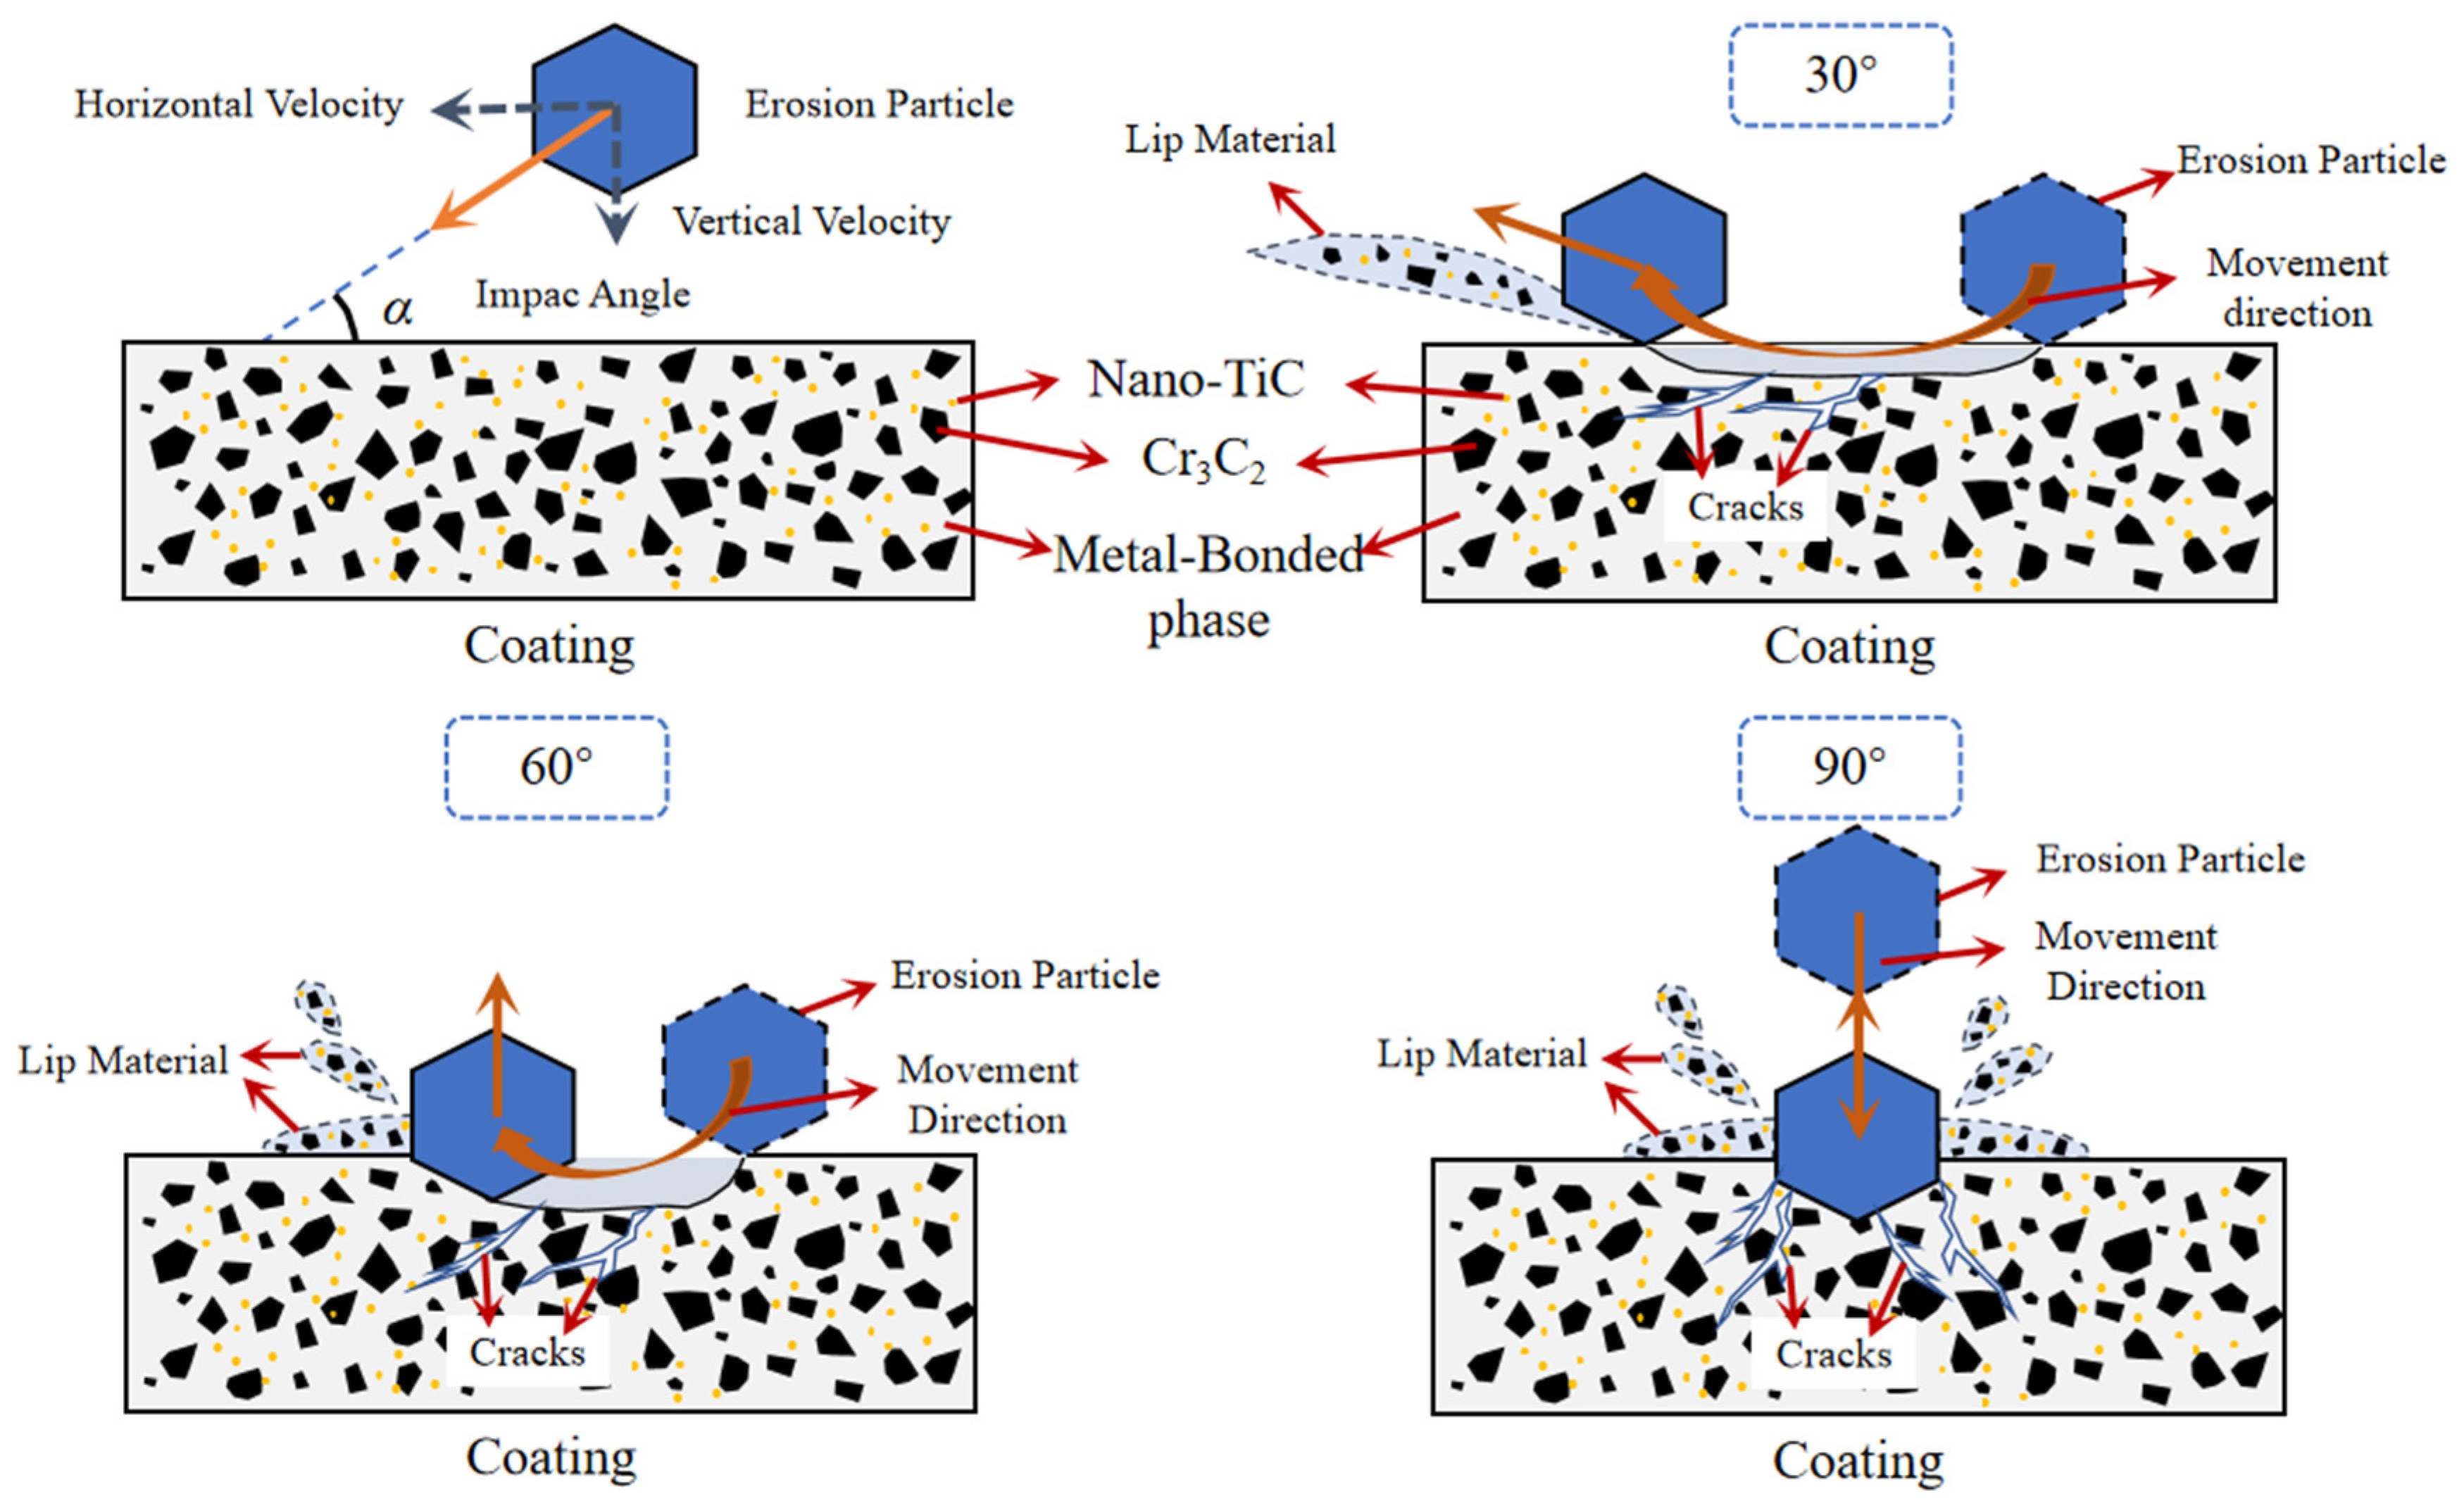
3.5. Erosion Mechanism

Figure 15 illustrates the erosion patterns of the coatings at room temperature. At a 30° impact angle, the horizontal force of the erosion particles induces micro-cutting on the surface of the NCC and NCT coatings, with erosion predominantly characterized by micro-cutting. Compared to the NCC coating, the NCT1 coating experiences less erosion damage from micro-cutting. This improvement is attributed to the addition of nano-TiC, which enhances the yield strength of the NCT1 coating (Table 2) and reinforces the metal-bonded phase. Consequently, erosion particles are more effectively resisted in the vertical direction, reducing their depth of penetration and minimizing material loss on the coating surface, which leads to a lower erosion rate.
At an impact angle of 30°, the NCT2 coating surface not only displays cutting marks but also shows significant spalling, which reveals a fragmented structure. This indicates that, under the impact angle, the NCT2 coating undergoes partial brittle fracture and spalling, which is attributed to the excessive incorporation of nano-TiC particles, disrupting the flow of the metal-bonded phase during the coating deposition process. This disruption impedes the ability of the metal-bonded phase to fully envelop and bond with the hard-phase particles, thereby increasing the likelihood of hard-phase particles being dislodged during erosion. Additionally, the disparity in thermal expansion coefficients between the hard phase and the metal-bonded phase exacerbates thermal mismatch stress during deposition, leading to the initiation and propagation of cracks within the coating. These two factors collectively render the NCT2 coating more prone to material flaking and loss during the erosion process, consequently resulting in a higher erosion rate.
At an impact angle of 60°, the micro-morphology of the eroded areas on the surfaces of NCC and NCT coatings reveals that the damage is characterized not only by the micro-cutting effects of the eroded particles but also by exfoliation damage caused by the impact of these particles on the coating surfaces. In the NCT1 coating, the incorporation of nano-TiC helps to reinforce and stabilize the metal-bonded phase, improving the resistance to fatigue fracture during repeated erosion. This reinforcement reduces the lip material loss and surface flaking, thereby decreasing the erosion rate and improving the overall erosion resistance of the coating. In contrast, excessive nano-TiC in the NCT2 coating increases the number of pores and cracks, weakening the bond between coating layers. As a result, the erosion rate rises, and the coating’s erosion resistance deteriorates.
Under erosion at an impact angle of 90°, the NCT1 coating demonstrated less fatigue cracking and spallation in the eroded areas compared to the NCC coating, indicating superior erosion resistance. The enhanced performance can be attributed to the incorporation of nano-TiC, which not only supports the coating during particle impact but also stabilizes the metal bonding phase, reducing its susceptibility to plastic deformation during the impact process. In the erosion areas of the NCC coating, spallation led to the formation of fine, particulate-like structures. In contrast, the erosion areas of the NCT2 coating exhibited large, irregular pits resulting from spallation. This observation suggests that at a 90° impact angle, the erosion damage on the NCC coating primarily involves the fracture and detachment of the hard phases and the bonding phase within the coating. Conversely, the erosion damage on the NCT2 coating is predominantly due to the fracturing along existing cracks and voids within the coating.

4. Conclusions

To address the service requirements of chromium carbide coatings in high-temperature erosion environments, a micro/nano-particle composite-modified Cr3C2-NiCrCoMo/nano-TiC coating was developed and prepared. The erosion resistance of the coating was then investigated, with the following results:
(1)
Based on the collision elasticity–plasticity theory and the energy dissipation equation for the collision process, a detailed analysis was conducted on the elastic compression, plastic deformation, and elastic recovery of individual particles impacting the eroded coating. A comprehensive calculation model for the erosion rate was developed, incorporating factors such as the properties of the eroded particles, the characteristics of the coating, and the conditions of erosion. Predictions of the erosion rate for NCT coatings using this model showed a high degree of concordance with experimental results.
(2)
The NCT1 coating exhibited superior erosion resistance compared to the original NC and NCC coatings. At impact angles of 30°, 60°, and 90°, the erosion rates of NCT1 were reduced by 23.64%, 20.45%, and 16.22%, respectively, relative to the NCC coating. These results indicate that a moderate addition of nano-TiC enhances the erosion resistance of chromium carbide coatings. However, excessive nano-TiC content degrades the erosion resistance.
(3)
The erosion mechanisms of the three coatings predominantly involve micro-cutting at low impact angles, while fatigue fracture and spallation dominate at high impact angles. Compared to the NCC coating, the incorporation of nano-TiC in the NCT1 coating enhances the yield strength, impeding the intrusion of erosive particles at low angles and supporting the metal binder phase, eventually reducing fatigue fracture under repeated erosion. However, excessive nano-TiC increases coating porosity and crack formation in the NCT2 coating, leading to the removal of chromium carbide particles and metal binder phase during erosion and consequently deteriorating erosion performance.

Author Contributions

J.W.: conceptualization, methodology, investigation, writing. L.W.: methodology, supervision. H.L.: methodology, investigation. J.D.: investigation, writing—review and editing, supervision. X.Q.: investigation, review and editing. L.L.: investigation. Y.Z.: investigation. Z.L.: investigation. W.M.: investigation. All authors have read and agreed to the published version of the manuscript.

Funding

This work was funded by the National Natural Science Foundation of China (Grant No. 52305542) and the Natural Science Foundation of Shandong Province (Grant Nos. ZR2023QE320, ZR2023ME153, ZR2021ME157).

Institutional Review Board Statement

Not applicable.

Informed Consent Statement

Not applicable.

Data Availability Statement

Data are contained within the article.

Conflicts of Interest

Author Haiyang Lu was employed by the company Inspur Genersoft Co., Ltd. The remaining authors declare that the research was conducted in the absence of any commercial or financial relationships that could be construed as a potential conflict of interest.

References

  1. Roy, M.; Pauschitz, A.; Polak, R.; Franek, F. Comparative evaluation of ambient temperature friction behaviour of thermal sprayed Cr3C2-25(Ni20Cr) coatings with conventional and nano-crystalline grains. Tribol. Int. 2006, 39, 29–38. [Google Scholar] [CrossRef]
  2. Poirier, D.; Legoux, J.G.; Lima, R.S. Engineering HVOF-sprayed Cr3C2-NiCr coatings: The effect of particle morphology and spraying parameters on the microstructure, properties, and high temperature wear performance. J. Therm. Spray Technol. 2013, 22, 280–289. [Google Scholar] [CrossRef]
  3. Chong, K.; Zou, Y.; Wu, D.; Tang, Y.; Zhang, Y. Pulsed laser remelting supersonic plasma sprayed Cr3C2-NiCr coatings for regulating microstructure, hardness and corrosion properties. Surf. Coat. Technol. 2021, 418, 127258. [Google Scholar] [CrossRef]
  4. Bobzin, K.; Zhao, L.; Öte, M.; Königstein, T.; Steeger, M. Impact wear of an HVOF-sprayed Cr3C2-NiCr coating. Int. J. Refract. Met. Hard Mater. 2018, 70, 191–196. [Google Scholar] [CrossRef]
  5. Zhang, Y.; Chong, K.; Liu, Q.; Bai, Y.; Zhang, Z.; Wu, D.; Zou, Y. High-temperature tribological behavior of thermally-treated supersonic plasma sprayed Cr3C2-NiCr coatings. Int. J. Refract. Met. Hard Mater. 2021, 95, 105456. [Google Scholar] [CrossRef]
  6. Matthews, S.; Hyland, M.; James, B. Microhardness variation in relation to carbide development in heat treated Cr3C2-NiCr thermal spray coatings. Acta Mater. 2003, 51, 4267–4277. [Google Scholar] [CrossRef]
  7. Hong, S.; Lin, J.; Wu, Y.; Wu, J.; Zheng, Y.; Zhang, Y.; Cheng, J.; Sun, W. Cavitation erosion characteristics at various flow velocities in NaCl medium of carbide-based cermet coatings prepared by HVOF spraying. Ceram. Int. 2021, 47, 1929–1939. [Google Scholar] [CrossRef]
  8. Kaur, M.; Singh, H.; Prakash, S. Surface engineering analysis of detonation-gun sprayed Cr3C2-NiCr coating under high-temperature oxidation and oxidation-erosion environments. Surf. Coat. Technol. 2011, 206, 530–541. [Google Scholar] [CrossRef]
  9. Fantozzi, D.; Matikainen, V.; Uusitalo, M.; Koivuluoto, H.; Vuoristo, P. Effect of Carbide Dissolution on Chlorine Induced High Temperature Corrosion of HVOF and HVAF Sprayed Cr3C2-NiCrMoNb Coatings. J. Therm. Spray Technol. 2018, 27, 220–231. [Google Scholar] [CrossRef]
  10. Alroy, R.J.; Kamaraj, M.; Lakshmi, D.V.; Praveen, K.; Babu, P.S.; Sivakumar, G. Tailoring microstructural features of Cr3C2-25NiCr coatings through diverse spray variants and understanding the high-temperature erosion behavior. Tribol. Int. 2023, 188, 108810. [Google Scholar] [CrossRef]
  11. Zhang, H.; Dong, X.; Chen, S. Solid particle erosion-wear behaviour of Cr3C2-NiCr coating on Ni-based superalloy. Adv. Mech. Eng. 2017, 9, 1687814017694580. [Google Scholar] [CrossRef]
  12. Alroy, R.J.; Kamaraj, M.; Sivakumar, G. HVAF vs oxygenated HVAF spraying: Fundamental understanding to optimize Cr3C2-NiCr coatings for elevated temperature erosion resistant applications. J. Mater. Process. Technol. 2022, 309, 117735. [Google Scholar] [CrossRef]
  13. Shibe, V.; Chawla, V. Erosion Studies of D-Gun-Sprayed WC-12%Co, Cr3C2-25%NiCr and Al2O3-13%TiO2 Coatings on ASTM A36 Steel. J. Therm. Spray Technol. 2019, 28, 2015–2028. [Google Scholar] [CrossRef]
  14. Ji, G.C.; Li, C.J.; Wang, Y.Y.; Li, W.Y. Erosion Performance of HVOF-Sprayed Cr3C2-NiCr Coatings. J. Therm. Spray Technol. 2007, 16, 557–565. [Google Scholar] [CrossRef]
  15. Kevin, P.S.; Tiwari, A.; Seman, S.; Mohamed, S.A.B.; Jayaganthan, R. Erosion-corrosion protection due to Cr3C2-nicr cermet coating on stainless steel. Coatings 2020, 10, 1042. [Google Scholar] [CrossRef]
  16. Li, F.; Cai, L.; Wang, S.; Feng, Z. Multiparameter Optimization to Improve the Erosion Resistance of Coating by Finite Element Simulation. J. Eng. Gas Turbines Power 2022, 144, 051013. [Google Scholar] [CrossRef]
  17. Arunkumar, K.; Thirumalaikumarasamy, D.; Thirumal, P. Experimental investigation on effect of water jet erosion parameters on HVOF sprayed Cr3C2-NiCr coatings on stainless steel: A mathematical approach. Phys. Scr. 2022, 97, 055704. [Google Scholar] [CrossRef]
  18. Li, Z.; Li, Y.; Li, J.; Li, F.; Lu, H.; Du, J.; Ran, X.; Zhang, X. Effect of NiCr content on the solid particle erosion behavior of NiCr-Cr3C2 coatings deposited by atmospheric plasma spraying. Surf. Coat. Technol. 2020, 381, 125144. [Google Scholar] [CrossRef]
  19. Wei, X.; Ban, A.; Zhu, W.; Zhu, D.; Xu, J.; Zhang, C. Cavitation Erosion Resistance of TiNi-Based Composite Coating Deposited by APS. J. Therm. Spray Technol. 2021, 30, 937–945. [Google Scholar] [CrossRef]
  20. Daniel, J.; Grossman, J.; Šárka Houdková, Š.; Bystrianský, M. Impact wear of the protective Cr3C2-based HVOF-sprayed coatings. Materials 2020, 13, 2132. [Google Scholar] [CrossRef] [PubMed]
  21. Zhou, W.; Zhou, K.; Li, Y.; Deng, C.; Zeng, K. High temperature wear performance of HVOF-sprayed Cr3C2-WC-NiCoCrMo and Cr3C2-NiCr hardmetal coatings. Appl. Surf. Sci. 2017, 416, 33–44. [Google Scholar] [CrossRef]
  22. Mayrhofer, E.; Janka, L.; Mayr, W.P.; Norpoth, J.; Rodriguez Ripoll, M.; Gröschl, M. Cracking resistance of Cr3C2-NiCr and WC-Cr3C2-Ni thermally sprayed coatings under tensile bending stress. Surf. Coat. Technol. 2015, 281, 169–175. [Google Scholar] [CrossRef]
  23. Zhou, W.; Zhou, K.; Deng, C.; Zeng, K.; Li, Y. Hot corrosion behavior of HVOF-sprayed Cr3C2-WC-NiCoCrMo coating. Ceram. Int. 2017, 43, 9390–9400. [Google Scholar] [CrossRef]
  24. Rao, K.V.S.; Girisha, K.G.; Jamuna, K.; Tejaswini, G.C. Erosion Behaviour of HVOF Sprayed SiC-WC-Cr3C2 Multilayer Coating on 304 Stainless Steel. Mater. Today Proc. 2018, 5, 24685–24690. [Google Scholar] [CrossRef]
  25. Hong, S.; Qin, J.; Lin, J.; Wu, Y.; Li, J.; Zheng, Y. Influences of sand concentration and flow velocity on hydro-abrasive erosion behaviors of HVOF sprayed Cr3C2-NiCr and WC-Cr3C2-Ni coatings. J. Mater. Res. Technol. 2022, 21, 1507–1518. [Google Scholar] [CrossRef]
  26. Janka, L.; Berger, L.M.; Norpoth, J.; Trache, R.; Thiele, S.; Tomastik, C.; Matikainen, V.; Vuoristo, P. Improving the high temperature abrasion resistance of thermally sprayed Cr3C2-NiCr coatings by WC addition. Surf. Coat. Technol. 2018, 337, 296–305. [Google Scholar] [CrossRef]
  27. Bhosale, D.G.; Prabhu, T.R.; Rathod, W.S. Sliding and erosion wear behaviour of thermal sprayed WC-Cr3C2-Ni coatings. Surf. Coat. Technol. 2020, 400, 126192. [Google Scholar] [CrossRef]
  28. Hong, S.; Wu, Y.; Wu, J.; Zheng, Y.; Zhang, Y.; Cheng, J.; Li, J.; Lin, J. Effect of flow velocity on cavitation erosion behavior of HVOF sprayed WC-10Ni and WC-20Cr3C2–7Ni coatings. Int. J. Refract. Met. Hard Mater. 2020, 92, 105330. [Google Scholar] [CrossRef]
  29. Wang, Q.; Luo, S.; Wang, S.; Wang, H.; Ramachandran, C.S. Wear, erosion and corrosion resistance of HVOF-sprayed WC and Cr3C2 based coatings for electrolytic hard chrome replacement. Int. J. Refract. Met. Hard Mater. 2019, 81, 242–252. [Google Scholar] [CrossRef]
  30. Wang, W.; Zhang, C.; Zhang, Z.; Tan, S.; Pan, B. Effects of carbides on abrasion-corrosion performance of carbide reinforced composites in saline silica slurries. Wear 2023, 526–527, 204949. [Google Scholar] [CrossRef]
  31. Velez Barragan, E.E.; González Albarrán, M.A.; Rodríguez de Anda, E.; Vásquez Guillen, G.I.; de Jesús Ibarra Montalvo, J.; Díaz Guillén, J.C.; Chávez Aguilar, J.M. High-Temperature Erosion of SiC-NiCrAlY/Cr3C2-NiCr Coating. Coatings 2023, 13, 720. [Google Scholar] [CrossRef]
  32. Matikainen, V.; Koivuluoto, H.; Vuoristo, P. A study of Cr3C2-based HVOF- and HVAF-sprayed coatings: Abrasion, dry particle erosion and cavitation erosion resistance. Wear 2020, 446–447, 203188. [Google Scholar] [CrossRef]
  33. Dzhurinskiy, D.; Babu, A.; Pathak, P.; Elkin, A.; Dautov, S.; Shornikov, P. Microstructure and wear properties of atmospheric plasma-sprayed Cr3C2-NiCr composite coatings. Surf. Coat. Technol. 2021, 428, 127904. [Google Scholar] [CrossRef]
  34. Manjunatha, K.; Giridhara, G.; Shivalingappa, D. High temperature erosion behaviour of high-velocity oxy-fuel sprayed CNT/NiCr-Cr3C2 composite coatings. Surf. Coat. Technol. 2022, 448, 128900. [Google Scholar] [CrossRef]
  35. Wang, B.Q.; Verstak, A. Elevated temperature erosion of HVOF Cr3C2/TiC-NiCrMo cermet coating. Wear 1999, 233–235, 342–351. [Google Scholar] [CrossRef]
  36. Du, J.Y.; Li, Y.L.; Li, F.Y.; Ran, X.J.; Zhang, X.Y.; Qi, X.X. Research on the high temperature oxidation mechanism of Cr3C2-NiCrCoMo coating for surface remanufacturing. J. Mater. Res. Technol. 2021, 10, 565–579. [Google Scholar] [CrossRef]
  37. Cui, Y.; Zhang, Q.; Shao, Y.; Yang, Y.; Ma, Y.; Sun, W.; Wang, Y.; Wang, X.; Dong, Y. Microstructure and properties of in-situ ZrB2-ZrC composite coatings by plasma spraying. Surf. Coat. Technol. 2021, 409, 126846. [Google Scholar] [CrossRef]
  38. Liu, Z.W.; Li, J.F.; Jia, X.J.; Wang, G.C.; Xu, W.H. Establishment and analysis of erosion depth model for impeller material FV520B. Int. J. Precis. Eng. Manuf.—Green Technol. 2016, 3, 27–34. [Google Scholar] [CrossRef]
  39. Roychowdhury, S.; Karlsson, H.; Henriksson, B.; Carlson, P.O. Mechanical Testing of Additively Manufactured Superalloy Lugs. J. Eng. Gas Turbines Power 2022, 144, 031018. [Google Scholar] [CrossRef]
  40. Marri, G.K.; Srikanth, R.; Balaji, C. Multiple Phase Change Material-Based Heat Sink for Cooling of Electronics: A Combined Experimental and Numerical Study. ASME J. Heat Mass Transf. 2023, 145, 043001. [Google Scholar] [CrossRef]
  41. Chen, D.N.; Al-Hassani, S.T.S.; Chen, J.P.; Yu, Y.Y.; Yin, Z.H. Effective friction coefficient during particle impact on metal. Gongcheng Lixue/Eng. Mech. 2004, 21, 172–177. [Google Scholar]
  42. He, T. Cell-Based Smoothed Finite-Element Framework for Strongly Coupled Non-Newtonian Fluid–Structure Interaction. J. Eng. Mech. 2021, 147, 04021062. [Google Scholar] [CrossRef]
  43. Finnie, I. Some reflections on the past and future of erosion. Wear 1995, 186–187, 1–10. [Google Scholar] [CrossRef]
Figure 1. Structure diagram of high-speed airflow sandblasting erosion wear tester.
Coatings 15 00294 g001
Figure 2. High-speed airflow sandblasting erosion wear tester.
Coatings 15 00294 g002
Figure 3. Typical load–displacement curve.
Coatings 15 00294 g003
Figure 4. Schematic diagram of particle impact in normal direction.
Coatings 15 00294 g004
Figure 5. Schematic diagram of contact stress between particle and coating.
Coatings 15 00294 g005
Figure 6. Comparison between actual and simulated erosion rate of Cr3C2-NiCr coating.
Coatings 15 00294 g006
Figure 7. Microstructure of NCC and NCT coating, (a) NCC, (b) NCT1, (c) NCT2.
Coatings 15 00294 g007
Figure 8. XRD pattern of NCC and NCT coating.
Coatings 15 00294 g008
Figure 9. Microhardness of NCC and NCT coating.
Coatings 15 00294 g009
Figure 10. Tensile bonding strength of NCC and NCT coating.
Coatings 15 00294 g010
Figure 11. Erosion rates of the coating at different impact angles at normal temperature.
Coatings 15 00294 g011
Figure 12. Surface erosion profile on the coating surface at different impact angles at normal temperature, (a) NCC-30°, (b) NCT1-30°, (c) NCT2-30°, (d) NCC-60°, (e) NCT1-60°, (f) NCT2-60°, (g) NCC-90°, (h) NCT1-90°, (i) NCT2-90°.
Coatings 15 00294 g012
Figure 13. Microstructure of the erosion area on the coating surface at norma, (a) NCC-30°, (b) NCT1-30°, (c) NCT2-30°, (d) NCC-60°, (e) NCT1-60°, (f) NCT2-60°, (g) NCC-90°, (h) NCT1-90°, (i) NCT2-90°.
Coatings 15 00294 g013
Figure 14. Microstructure of the NCC and NCT2 coatings at a 90° impact angle, (a) NCC-30°, (b) NCT1-30°, (c) NCT2-30°, (d) NCC-60°, (e) NCT1-60°, (f) NCT2-60°, (g) NCC-90°, (h) NCT1-90°, (i) NCT2-90°.
Coatings 15 00294 g014
Figure 15. Schematic diagram of coating erosion at normal temperature.
Coatings 15 00294 g015
Table 1. Modified powder formulas.
Powder FormulationsParticle SizeProportion
NCT115–45 μm87.3 wt.% Cr3C2-NiCr, 9.7 wt.% CoCrMo,
3 wt.% TiC
NCT215–45 μm84.6 wt.% Cr3C2-NiCr, 9.4 wt.% CoCrMo,
6 wt.% TiC
Table 2. Elastic modulus and yield strength of coating.
CoatingModulus of Elasticity
/GPa
Yield Strength
/MPa
NCC162.38869.8
NCT1175.09981.6
NCT2148.03632.3
Disclaimer/Publisher’s Note: The statements, opinions and data contained in all publications are solely those of the individual author(s) and contributor(s) and not of MDPI and/or the editor(s). MDPI and/or the editor(s) disclaim responsibility for any injury to people or property resulting from any ideas, methods, instructions or products referred to in the content.

