Article

Investigation on the Viscosity–Temperature Properties for Various EPDM Solutions Based on Three-Dimensional Solubility Parameters and Flory–Huggins Interaction Parameters

1
Wuxi Institute of Technology, Wuxi 214121, China
2
Key Laboratory of Rubber-Plastics, Ministry of Education, Qingdao University of Science & Technology, Qingdao 266042, China
*
Author to whom correspondence should be addressed.
Coatings 2025, 15(5), 582; https://doi.org/10.3390/coatings15050582
Submission received: 10 April 2025 / Revised: 9 May 2025 / Accepted: 13 May 2025 / Published: 14 May 2025
(This article belongs to the Section Thin Films)

Abstract

:
Three organic solvents, cyclohexane, n-hexane and n-heptane were selected to dissolve the Ethylene-Propylene-Diene Monomer (EPDM) to keep the mass fractions of EPDM solution at 5 wt% and 10 wt%, respectively. The viscosities of three EPDM solutions at different temperatures were measured by a rotary viscometer. The experimental results show that the concentration and temperature exert significant influences on the viscosities of the EPDM solutions, compared with the rotor type and rotational speed having no obvious effect on the viscosities. An EPDM solution with higher concentration shows remarkable higher viscosity. The viscosities show almost linear decline with increasing temperature within the experimental temperature range, which is also called a viscosity–temperature curve. However, the temperature dependences of viscosity are varied for the three different EPDM solutions. The compatibility between EPDM and solvents could be characterized by the energy difference (Ra) and Flory–Huggins interaction parameter (χ), which has also been attempted to be correlated with the viscosity–temperature curve and solvent molar volume. It is found that the smaller Ra value relates to better compatibility of the EPDM solution and greater slope of the viscosity–temperature curve. Furthermore, the viscosity of EPDM solution and the slope of the viscosity–temperature curve are affected more significantly by the molar volume of solvent when the Ra value is similar. A formula for predicting the viscosity of EPDM solution has been established by using a new Flory–Huggins interaction parameter (χHSP), which can also be used to calculate the viscosity at the extreme temperature that is difficult to be measured. Finally, for the three EPDM solutions, the different dissolution temperatures corresponding to the same viscosity can be obtained by formula calculations with the achieved prediction formulas.

1. Introduction

EPDM is a rapidly developing synthetic rubber which is polymerized by ethylene, propylene and small amount of non-conjugated diene providing the vulcanization points [1,2,3]. The non-polar saturated molecular chain makes EPDM have excellent aging resistance, thermal oxygen, ozone aging resistance, low-temperature flexibility and good electrical insulation [4,5]. It can thus be widely used as automotive sealing systems, coolant hoses and cable insulation and others [6,7].
Polymers are characterized by high molecular weight, entanglement of molecular chains and large interaction forces between molecular chains [8]. Meanwhile, the size of the molecular chains is quite different from that of small molecules of solvent, which leads to the slow dissolution process. The dissolution process can be divided into two stages, swelling and dissolution [9], as shown in the Figure 1.
There exists a swelling process in the dissolution of high molecular polymers, which is significantly different from that of low molecular weight substances. Swelling refers to the diffusion of solvent molecules into the intertwined gaps of molecular chains, weakening the interaction and increasing the volume of molecular chains by multiple or even ten times. The increase in free volume between molecular chains results in enough space for the chain segments and molecular chains to move readily. Then, the molecular chains become loose and untangled, and the dissolution is completed subsequently [10,11,12]. The dissolution processes are different for crystalline and amorphous polymers, polar and non-polar polymers. In amorphous polymers, because of the weak intermolecular interaction, the solvent can easily enter the molecular chain, making it easily dissolvable in good solvents. For crystalline and semi-crystalline polymers, however, the polymer chains are folded into regular and thermodynamically stable arrangements, and the molecular chains are tightly packed and not easy to dissolve [13]. Polar polymers are more accessible to dissolve than non-polar polymers, and heating favors the unentangling of molecular chains, accelerating the rate of dissolution. EPDM is a non-polar and non-crystalline polymer that can be dissolved in a solvent with similar solubility parameters according to the principle of similar polarity.
Polymers dissolved in different solvents show different viscosities due to the difference in dissolving capacity for each solvent. For a given polymer, there are “good solvents” that dissolve the polymer well and “nonsolvents” that do not dissolve the polymer [14]. The polymer solution can be concentrated up to 100% in good solvents and remain transparent and homogeneous after dissolution. Solvents with intermediate properties can dissolve polymers to a certain extent. The interaction between polymer and solvent is stronger for a good solvent system, and thus, small molecule solvent is more likely to penetrate and diffuse into the polymer, allowing the molecular chains to develop from a state of mutual entanglement to a state of stretching. The free energy, behaving like low-molecular-weight solutes, is reduced by the solvation effect during the dissolving process of rubber in solvents [15].
Polymer solutions can be categorized into three primary forms according to concentration and molecular chain morphology: dilute, semi-dilute and concentrated regime [16], as shown in Figure 2. In dilute solutions [17], the molecular chains are separated and independent of each other, and the polymer chains behave as isolated hard spheres. The polymer chains interact primarily with solvent molecules, and the solution approaches an ideal solution. In the semi-dilute state, molecular chains will contact, overlap, penetrate and entangle together, and the free volume and movement of the molecular chains are reduced comparing with those in the dilute solutions [18]. The semi-dilute region can be subdivided into untangled semi-dilute and entangled semi-dilute regimes. In the unentangled semi-dilute regime, the polymer chains are more closely aligned and in contact with each other than in the dilute state, but there is no visible entanglement of the polymer chains [19]. The entangled semi-dilute regime is characterized by the presence of entangled polymer chains, which significantly increases the viscosity of the polymer solution. The number of entanglement points between the molecular chains increases with the continuous increasing concentration, and the concentrated regimes are formed due to the dense entanglement and overlap of molecular chains [20]. As a result, the ability of the molecular chain to move is drastically reduced. In this work, EPDM solutions with a mass fraction of 10% have been prepared, which can be considered as concentrated solutions. Normally, it has strong affinity between polymer and small molecules to form a hydration film around the molecule, which is the main reason for the stability of the polymer solution [21,22]. Hence, the polymer solution should be a stable system.
Hildebrand and Scott [23] first introduced the concept of solubility parameter (δ) to characterize the thermodynamic behavior of non-electrolytes in binary systems, which can be used to predict the polarity, solvent resistance and polymer–polymer compatibility of substances:
δ = E c o h V m o l 1 / 2
where δ is the solubility parameter with the unit of MPa1/2, Ecoh is the cohesive energy of a substance, representing the amount of energy required to hold one mole molecules together and Vmol is the molar volume.
This formula has limitations for the applicable when there are polar interactions in the solution or when the dissolution situation becomes more complex (even the solvation process occurs when the solubility parameters of the solvent and polymer are quite different) [24,25,26]. Based on Hildebrand’s regular solution theory, Hansen extended the solubility parameter to polar and conjugated systems, and established a three-dimensional solubility parameter system, abbreviated as HSP [27]. It provides an easy method for predicting the compatibility of blends, selecting solvents and predicting polymer–solvent interactions, which has been widely used in the science and practical theory of polymer solutions [28,29,30,31,32].
δ d = E d V 1 2 , δ p = E p V 1 2 , δ h = E h V 1 2
δ t = δ d 2 + δ p 2 + δ h 2
The concept of HSP can be more intuitively reflected in a three-dimensional spatial graph: δd, δp and δh are the three coordinate axes with the polymer as the spheric center. The interaction strength between polymer and solvent is taken as the radius (R0) to obtain a sphere named as the solubility sphere of polymer. The interaction between polymer and solvent can be expressed in terms of their spatial distance Ra (energy difference). The solvent can dissolve or swell the polymer quickly when it is inside the solubility sphere (Ra < R0):
R a = a δ d P δ d S 2 + δ p P δ p S 2 + δ h P δ h S 2 1 / 2
where δi (i = d, p and h) for each of the three components of the HSP values, and the superscripts P and S represent polymer and solvent, respectively.
The viscosity of polymer solution is attributed to the viscous resistance of the long-chain molecules to the steady and continuous flow of the medium [33,34]. Higher viscosity indicates higher internal friction, and the viscosity increases with the increase of molecular weight and hydrocarbon bounds [35]. The viscosity is obviously affected by the type of polymer solution system and temperature [36], which can be expressed in many ways.
Absolute viscosity is one of the viscosities that can be directly measured experimentally, such as dynamic viscosity and kinematic viscosity, which can be interconverted as follows:
η = v ρ
where η is the dynamic viscosity with the unit of mPa·s; v is the kinematic viscosity with the unit of mm2/s; ρ is the density of the specimen at the measuring temperature with the unit of g/cm3.
In addition, the viscosity measured under certain conditions in comparison with the liquid of known viscosity is called relative viscosity, Ensign viscosity, for example.
In such case that the concentration c (unit: g/L) is sufficiently low and the viscosity (η) of the rubber solution is not much different from the viscosity (ηs) of the pure solvent, the relative viscosity (ηr) can be expressed as the ratio of η to ηs.
η r = η η s = 1 + η C + K V C 2 +
This equation illustrates the variation of ηr with c. The linear coefficient ([η]) is called the intrinsic viscosity which is obtained from the slope of the curve of ηr as a function of c at the ultimate low concentration.
η lim c 0 η r 1 C = lim c 0 η η r C η s
Sometimes, the specific viscosity (ηsp) is defined as follows:
η s p η r 1
η s p η r 1 = η η s η s = η C + K V C 2 +
Then, the reduced viscosity (ηred) refers to the ratio of ηsp to c:
η r e d η s p c = η η s η s C = η + K V C +   r e d u c e d   v i s c o s i t y
The reciprocal of the intrinsic viscosity is often used to represent the overlap concentration of a given polymer:
C * = 1 [ η ]
It means that we can expect the polymer solution at c* to be about twice as viscous as the pure solvent.
Viscosity serves as a fundamental physical parameter characterizing fluid flow behavior, playing a pivotal role across diverse technological domains. Agasty et al. [37] established a multiscale (nano-to-macro) viscosity characterization framework by integrating macroscopic viscometry with polydispersity-averaged molecular weight function analysis. This model systematically elucidates nanoscale probe diffusion behaviors and macroscopic rheological properties of polymer solutions across extended molecular weight (24–300 kg/mol), temperature (283–303 K) and concentration (0.005–1.000 g/cm3) ranges. Yan’s et al. [38] developed a three-factor physical model incorporating dosage, temperature and shear rate parameters through synergistic application of Einstein’s equation, Arrhenius equation and power–law relations. This framework enables accurate viscosity prediction over extended ranges with limited experimental data, overcoming constraints inherent to conventional methodologies. Rita’s team [39] leveraged the Eyring-NRTL/mNRF framework coupled with multivariate data analytics to conduct systematic investigations into polystyrene solution viscosity dependencies on concentration, thermal profiles and solvent selection. Their findings demonstrate predominant Newtonian behavior within 5–39 wt% solutions, while developing a predictive formalism for viscosity evolution under multifactorial conditions, thereby establishing an accelerated protocol for green solvent data acquisition.
Viscometers are instruments used to measure the viscosity of fluids (liquids and gases). There are three main types of viscometers: capillary viscometer, rotational viscometer and falling ball viscometer, among which rotational viscometer has the advantages of simple operation, high testing accuracy and good stability [40].
In this work, a rotational viscometer was employed to determine the dynamic viscosity of EPDM/cyclohexane, EPDM/n-hexane and EPDM/n-heptane solutions. The effects of rotor type, rotational speed, temperature and compatibility on the viscosities of EPDM solutions were investigated to construct a prediction formula for predicting the viscosities of EPDM solutions at different temperatures. It can be expected that the problem of determining the viscosity of EPDM solution under extreme conditions could be solved.

2. Experimental Section

2.1. Materials

The EPDM with the Mooney Viscosity ML(1+4) 125 °C of 65, ethylene content of 44 wt% and ENB content of 9 wt% was supplied by ARLANXEO High Performance Elastomers (Changzhou) Co., Ltd. (Changzhou, China). Organic solvents (analytical reagent) used for the dissolutions, including cyclohexane (boiling point: 80.7 °C, density: 0.79 g/cm3, molar volume: 108.7 cm3/mol), n-hexane (boiling point: 69 °C, density: 0.659 g/cm3, molar volume: 131.4 cm3/mol) and n-heptane (boiling point: 98 °C, density: 0.683 g/cm3, molar volume: 147 cm3/mol) were purchased from Shanghai Macklin Biochemical Co., Ltd. (Shanghai, China).

2.2. Viscosity Test of EPDM Solutions

EPDM raw rubber with a certain mass was weighed first and dissolved in the solvent (cyclohexane, n-hexane, n-heptane) so that the concentration was set to be 5 wt% and 10 wt%, respectively, at room temperature. Then, the vessels containing EPDM solutions were placed into the constant temperature water bath oscillator to accelerate the dissolution process. Note that the dissolution temperature must be kept below the boiling point of the solvent to prevent volatilization. Finally, the viscosities of the EPDM solutions were measured using the rotary viscometer (Model NDJ-9S, Shanghai Changji Geological Instrument Co., Ltd., Shanghai, China) with the appropriate type of rotor and speed connector. In the process of viscosity test, the rotor should be inserted into the EPDM solution so that the rotor fully rotates in the liquid, and a solvent trap is used to prevent solvent evaporation during the measurement. Experimental deviations may arise due to variations in temperature, rotor configuration and solvent evaporation, with observed discrepancies maintaining a magnitude of approximately 3% under specified measurement conditions.

3. Results and Discussion

Three different alkane solvents were selected to dissolve the EPDM raw rubber for the purpose of obtaining three different EPDM solutions with concentrations of 5 wt% and 10 wt%, respectively. The three alkane solvents were cyclohexane, n-hexane and n-heptane, where n-heptane and n-hexane were linear structures and cyclohexane was a cyclic structure. The three-dimensional solubility parameters (δd, δp, δh) and molar volume were demonstrated in Table 1. As shown in Table 1, the major differences of the three solvents lied in the disparities of the δd value and molar volume.

3.1. Effects of Rotor Type and Speed on the Viscosity of EPDM Solution

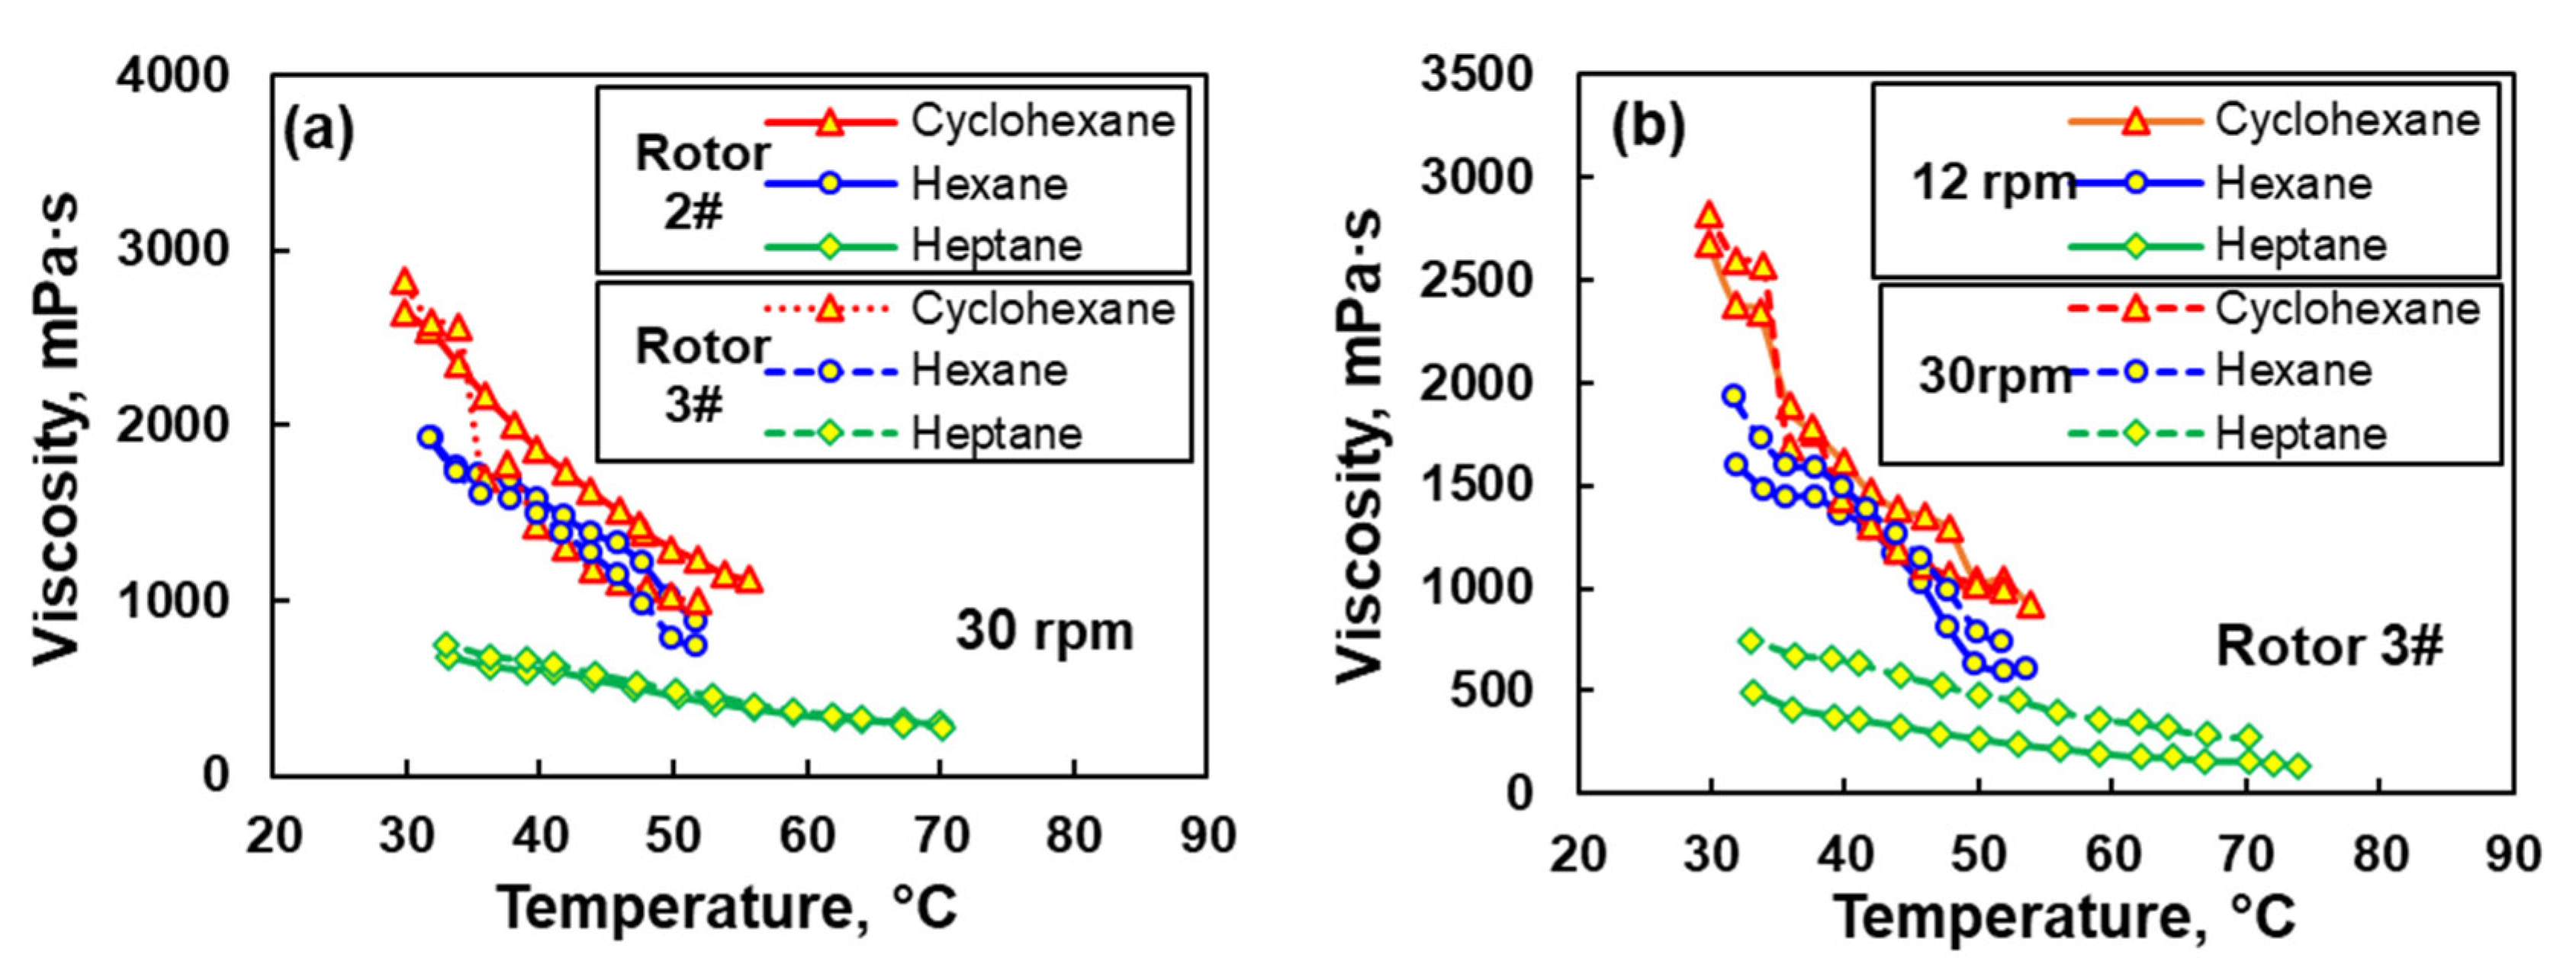
In order to investigate the influences of rotor type and speed of the rotational viscometer on the viscosities of EPDM rubber solutions (10 wt%, for example), two rotor types and speeds had been selected to determine the change of viscosities with temperature. The results were shown in Figure 3.
Firstly, the rotor speed was fixed at 30 rpm to study the effect of rotor type (No. 2 and No. 3) on the viscosity of EPDM rubber solution with temperature, as shown in Figure 4a. It could be seen that the viscosity curves of EPDM solutions with temperature almost overlapped for different rotor types, meaning that rotor type had no significant effect on the solution viscosity measured at the same rotor speed. It could also be seen that the viscosities of the three EPDM solution systems showed a gradually decreasing trend with increasing temperature, and EMDP/cyclohexane and EPDM/n-hexane solutions showed significant reductions in viscosity and the EPDM/n-heptane solution revealed a slight decrease in viscosity.
Then, the rotor type (No. 3) was fixed to discuss the effect of rotor speed (12 rpm and 30 rpm) on the viscosity of EPDM rubber solution with temperature, as shown in Figure 4b. For EPDM/hexane and EPDM/heptane solutions, higher rotor speed led to higher viscosity (dashed line). For EPDM/Cyclohexane solution, however, the viscosity showed different changes with the temperature boundary of 35 °C, namely, higher rotor speed resulted in lower viscosity under the temperature above 35 °C. Cyclohexane had the best compatibility with EPDM (as seen from the calculations below) and had the most substantial solvating effect on EPDM macromolecular chains, dissolving more EPDM macromolecular chains and increasing the viscosity of the solution. Compared with the other two solvents, cyclohexane dissolved the EPDM macromolecular chains more adequately, making the chains more easily untangled from each other. Therefore, increasing the rotor speed showed less effect on the change of viscosity of the EPDM/Cyclohexane solution. The molar volume of n-heptane was so large that increasing the rotor speed could increase the spatial distance between the macromolecular chains in the EPDM/Heptane solution. It allowed more solvent molecules to enter and improved the solvation effect of n-heptane on the EPDM macromolecular chains, and thus, led to an increase in the viscosity of the EPDM/Heptane solution system.

3.2. Effect of Temperature on the Viscosity of EPDM Solution

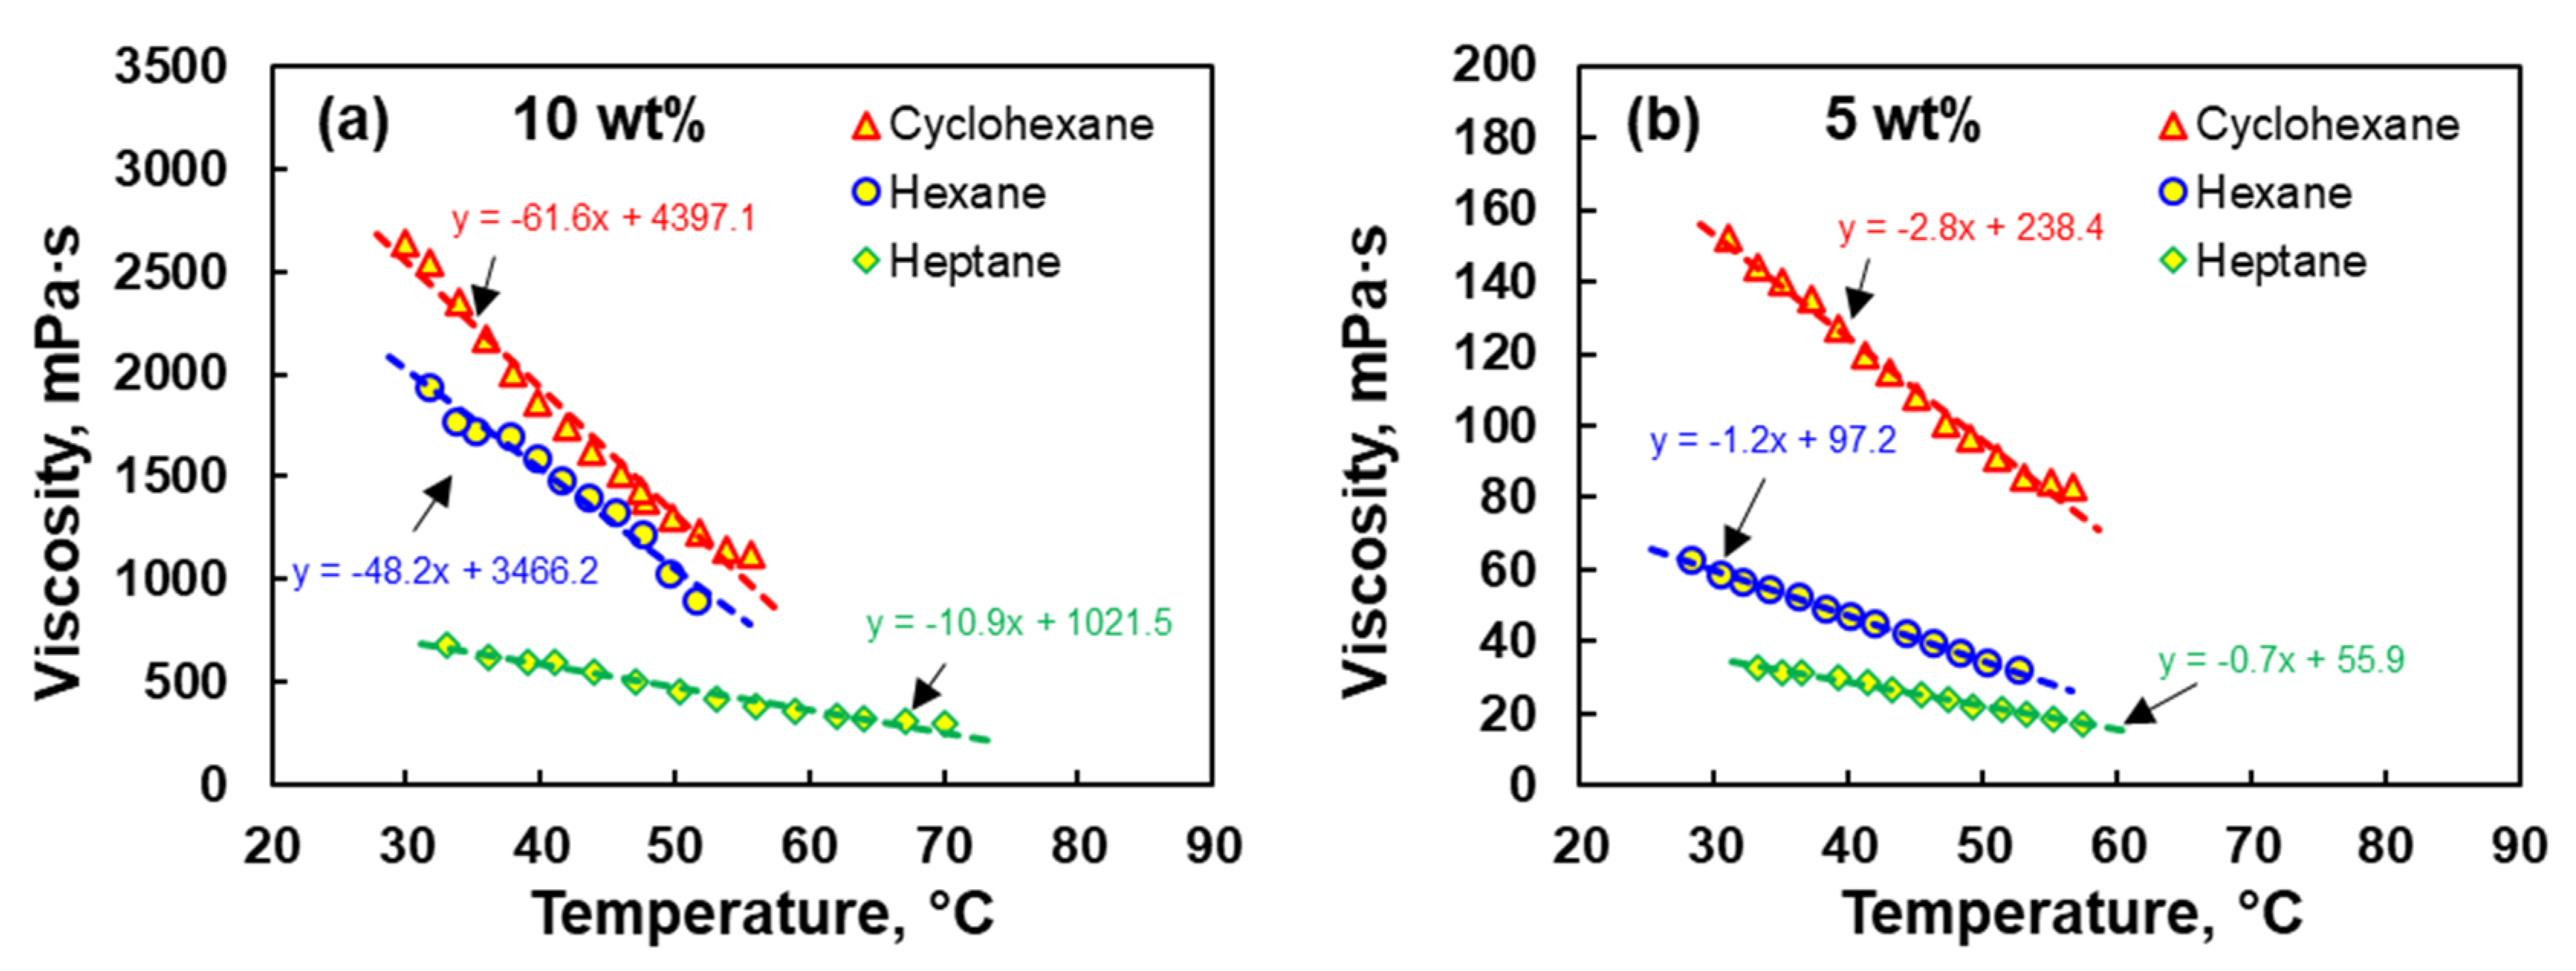
The viscosity of a rubber solution was affected by numerous factors, including solvent, temperature and testing velocity, of which the temperature was the most pronounced one. Therefore, investigation on the change of the viscosity of EPDM solution with temperature had been further made at the fixed rotor type (No. 2) and rotational speed (30 rpm), as shown in Figure 4.
As can be seen from Figure 4, the viscosities of the three EPDM solution systems showed linear changes with temperature (viscosity–temperature curve), and the EPDM/cyclohexane solution showed the most significant slope of the viscosity–temperature curve, indicating that the solution viscosity was more sensitive to the temperature change. The EPDM/n-heptane solution had the slightest slope of the viscosity–temperature curve. Therefore, we could simply use the viscosity–temperature curve to determine the type of EPDM solution system initially. The viscosity of the EPDM solution was higher when the concentration was 10 wt% by comparing Figure 4a with Figure 4b. Further analysis of the effect of the concentration of EPDM solution showed that the viscosity–temperature curve of EPDM/hexane solution was closer to that of EPDM/cyclohexane solution when the concentration was 10 wt% (Figure 4a). On the contrary, the viscosity–temperature curve of EPDM/hexane solution was similar to that of EPDM/n-heptane solution when the concentration was 5 wt% (Figure 4b).
In order to further explore the connection between the viscosity–temperature curve and the type of EPDM solution, the compatibility between EPDM and the three solvents, expressed as Ra value, was calculated, respectively, to investigate the relationship of the viscosity–temperature curve with Ra, as shown in Figure 5.
The compatibility between rubber and solvent could be expressed by their distance in space, i.e., the energy difference (Ra), which had been calculated for EPDM/cyclohexane as RaE-C = 1.12 MPa1/2, EPDM/hexane as RaE-H = 4.42 MPa1/2 and EPDM/n-heptane as RaE-P = 4.04 MPa1/2, respectively. The smaller Ra value represented better compatibility between EPDM and solvent. Therefore, it showed the highest compatibility between EPDM macromolecular chain and cyclohexane (the lowest RaE-C value), and thus, the solvation of the macromolecular chain was the strongest, resulting in the maximum solubility and viscosity of EPDM/cyclohexane solution system. In addition, the movement rate of EPDM macromolecular chains was subsequently accelerated as the temperature increased, and then the solvation and de-solvation effects reached a rapid dynamic equilibrium, resulting in a thinner thickness of the solvation layer. Macroscopically, when the viscosity test was performed, the solution viscosity showed a rapid decrease with increasing temperature. That was, the slope of the viscosity–temperature curve was the largest. Moreover, both the viscosity of the rubber solution and the slope of the viscosity–temperature curve became greater when the compatibility of the rubber with solvent was higher, so that the viscosity of the EPDM/cyclohexane solution exhibited the most sensitivity to temperature.
The Ra values of EPDM/n-hexane (RaE-H = 4.42 MPa1/2) and EPDM/n-heptane (RaE-P = 4.04 MPa1/2) were similar, and there was no apparent difference in compatibility. Hence, the viscosity of these two solution systems and the slope of the viscosity–temperature curves could not be differentiated by using the Ra value alone. Then, the solution viscosity was affected more by the molar volume of solvent than the Ra value when the compatibility of EPDM/solvent solutions were similar. Compared with n-heptane (147 mL/mol), n-hexane with smaller molar volume (131.4 mL/mol) was more easily accessible to the EPDM rubber matrix, which brought stronger solvation effect with the large molecular chains and larger solubility of EPDM in n-hexane. Therefore, the viscosity of the EPDM/hexane solution was higher than that of the EPDM/n-heptane solution. Actually, the dissolution process of EPDM was the diffusion of small solvent molecules into the EPDM matrix, and the solvation and de-solvation of macromolecular chains happened. The dissolution process finished when the two kinds of action reached a dynamic equilibrium state. The smaller the molar volume of the solvent, the stronger the solvation and the thicker the solvent layer formed. Therefore, compared with the EPDM/n-heptane solution, the decrease in the solvent layer thickness and the decreasing trend of the viscosity for EPDM/n-hexane solution became more evident with increasing temperature, that is, the slope of the viscosity–temperature curve was steeper.
The slope of viscosity-temperature curve was greatly influenced by the concentration of EPDM solution, but the variation trend of the slope with Ra was less affected. Both the viscosity and slope for the EPDM solutions increased with increasing concentration. Additionally, the slope decreased with the increase in Ra value, but it showed a higher value for smaller molar volume of solvent in the case of similar Ra value.

3.3. Relationship Between Viscosity and Compatibility of EPDM Solution

There were numerous means of characterizing rubber–solvent compatibility, including polarity, solubility parameters and interaction parameters, each of which had a different scope of application. EPDM and three solvents used in this work were non-polar substances with minor differences in polarity, which made the fitting of the experimental data extremely difficult. Therefore, in this work, the Flory–Huggins interaction parameter theory was used to fit the experimental test results.
The Flory–Huggins interaction parameter (χ) was commonly used to characterize the thermodynamic state of polymer solutions [41,42,43]. For non-polar systems:
χ = χ S + χ H
The enthalpic component (χH) of polymer–solvent interaction parameter could be related to the solubility parameters via
χ H = V i R T ( δ i δ j ) 2
The polymer–solvent interaction parameters were linked to the solubility parameters of the polymer and solvent by this equation. For non-polar systems, the entropy term χS was usually taken as a constant between 0.3 and 0.4 (χS = 0.34 is commonly used). Equation (13) could thus be rewritten as
χ = 0.34 + V i R T ( δ i δ j ) 2
According to Flory, polymer j and solvent i were expected to be fully miscible over the entire range of compositions as long as the
χ < 1 2 [ 1 + ( V i V j ) 1 2 ] 2
Thus, there existed a key value for the polymer–solvent interaction parameter
χ c = 1 2 [ 1 + ( V i V j ) 1 2 ] 2
and for (Vi/Vj) tends to 0,
χ c = 0.5
Suppose χ must be less than 0.5 to satisfy complete polymer–solvent miscibility, and χS was about 0.3. In that case, it followed that χH must be very small to satisfy the miscibility criterion and that δi and δj must have similar values. Specific interactions (such as hydrogen bonding between molecules of type i and type j to a greater extent than i-i and j-j hydrogen bonding) could lead to a lower χH and thus enhanced the mutual solubility.
For real polymer–solvent systems, experimental χ values and their dependence on composition, temperature and molar mass provided a valuable indication of the nature and extent of polymer–solvent interactions. For polymers soluble in solvents at a particular temperature, χ must be below 0.5 at high levels of Φj. The polymer was expected to be swollen by the solvent when the χ value was only slightly larger than 0.5.
Hansen used three-dimensional solubility parameter values to estimate and calculate the Flory–Huggins interaction parameters more accurately:
χ H S P = V 4 R T 4 δ d P δ d S 2 + δ p P δ p S 2 + δ h P δ h S 2 2
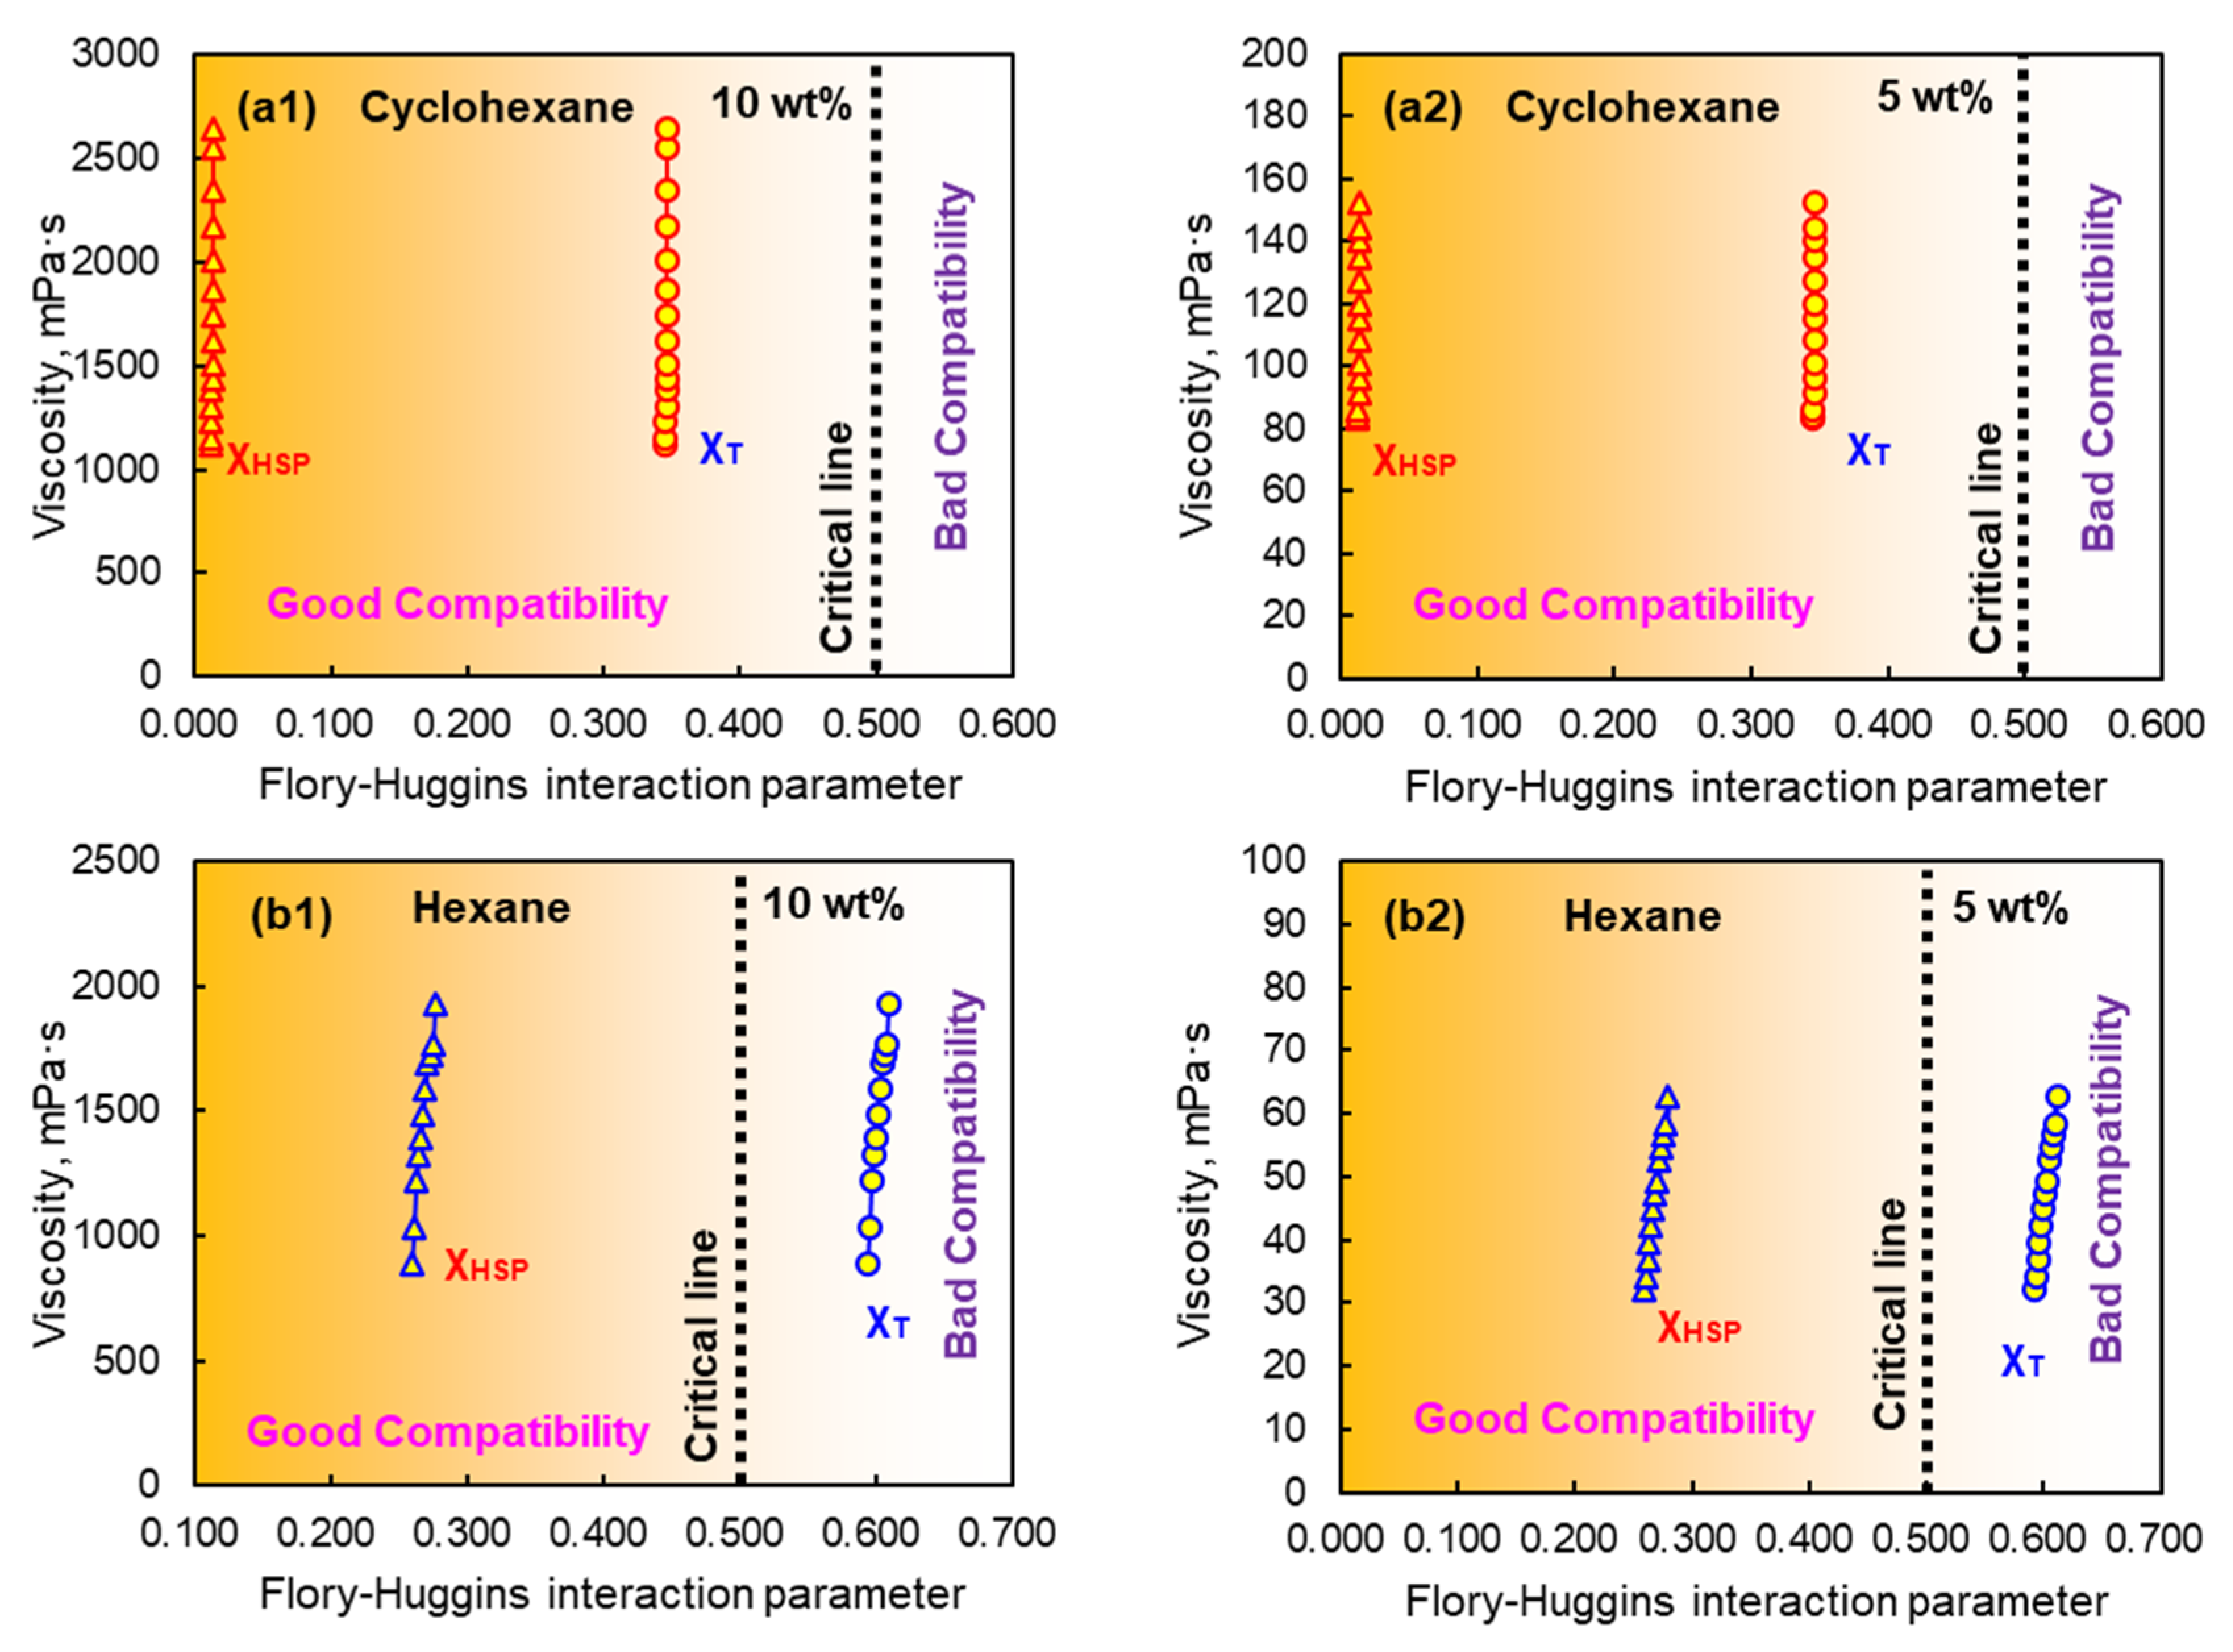
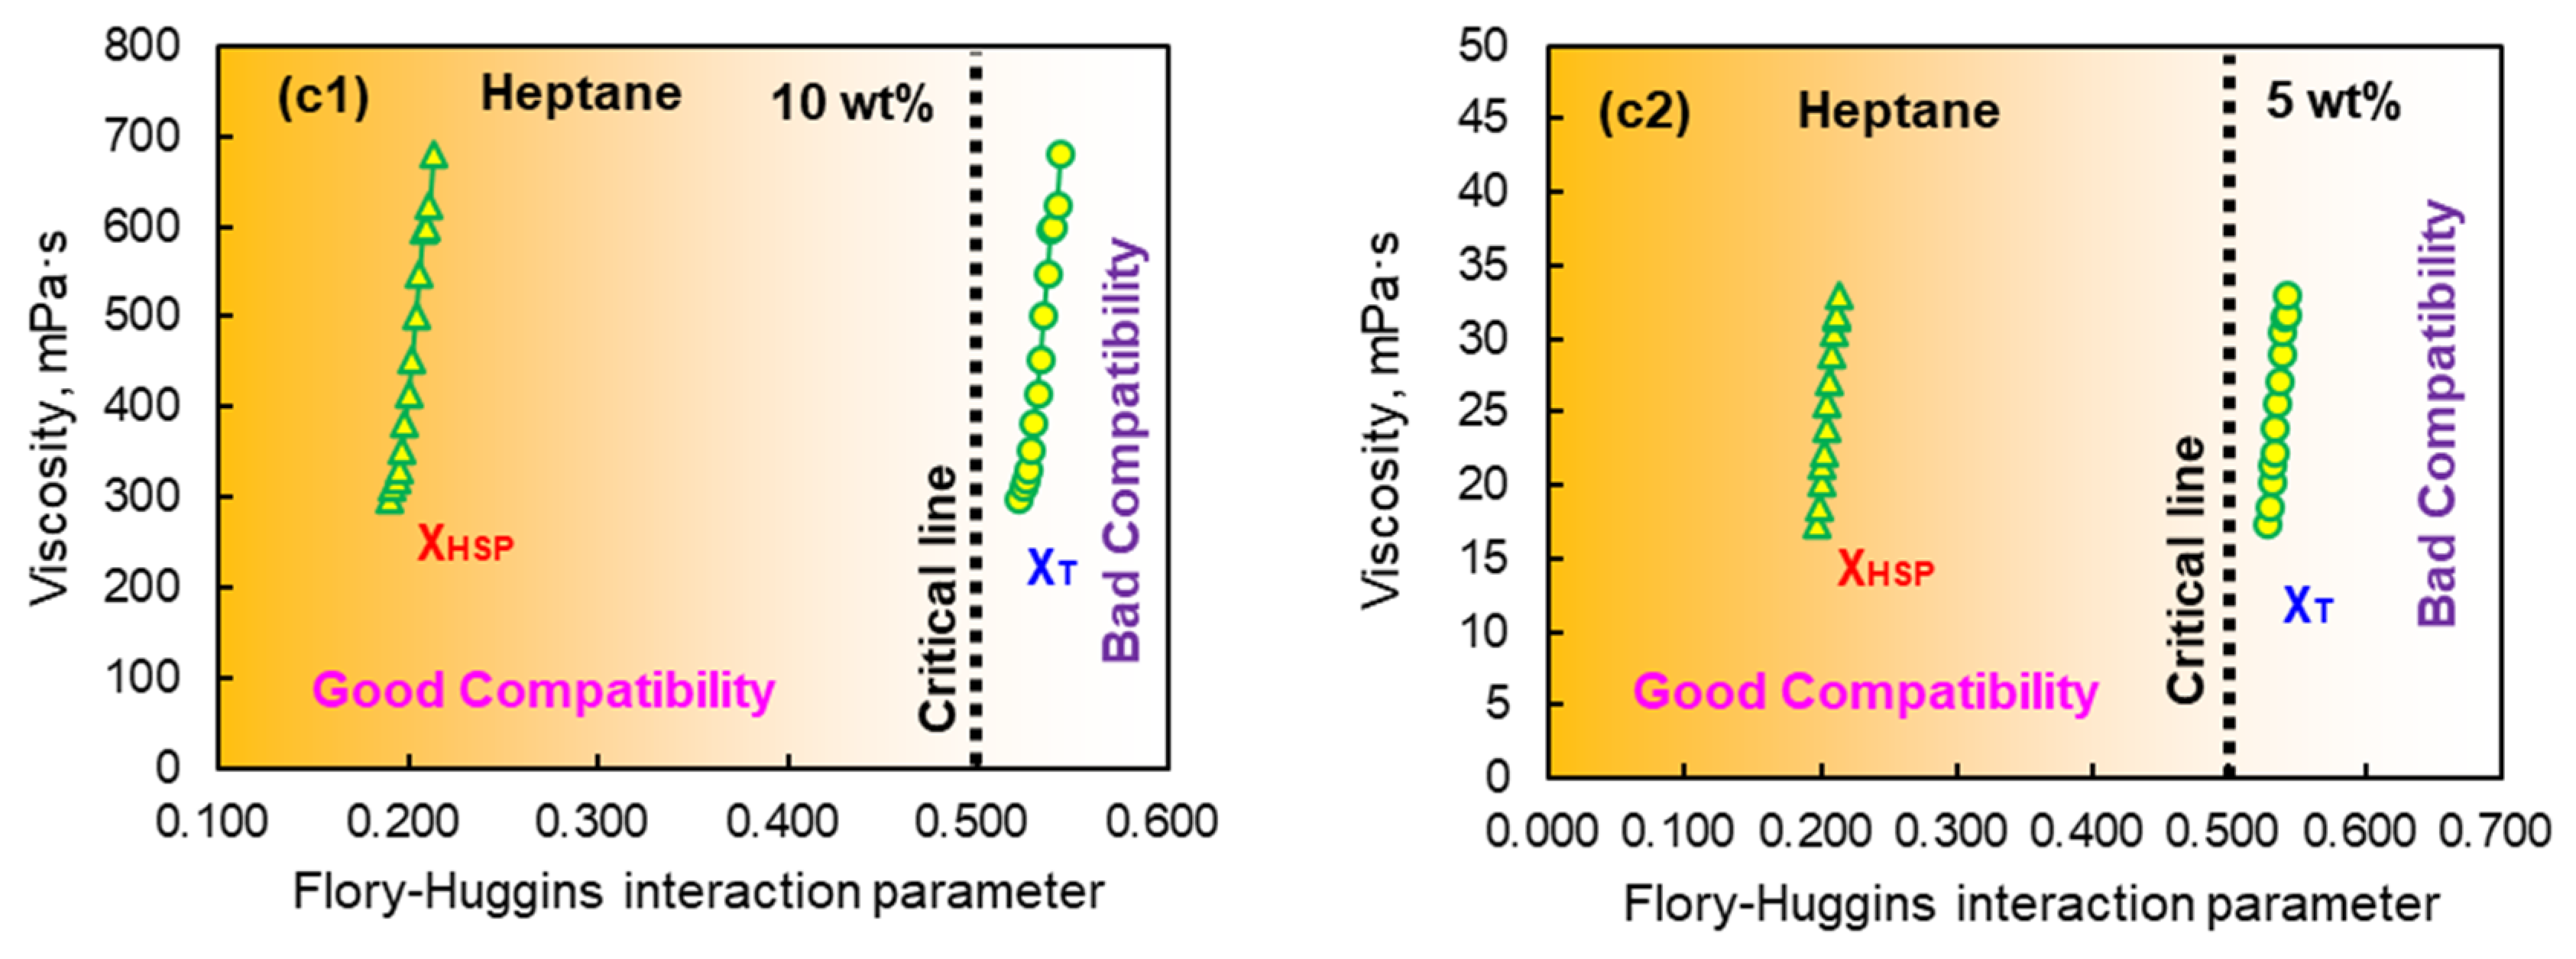
Possible factors, such as the molecular size of solvent, the interaction force between rubber and solvent and the temperature were all covered by the calculation of the Flory–Huggins interaction parameter, and therefore, it was theoretically feasible to correlate the viscosity with χ value for EPDM solutions. χ values determined from the two methods, one-dimensional solubility parameter (χT) and three-dimensional solubility parameter (χHSP), differed significantly. Then, we correlated the viscosity of EPDM solution with χT and χHSP, respectively, so as to verify the applicability of χ values. The results were shown in Figure 6.
It could be obtained that χHSP values obtained from the three-dimensional solubility parameters were all smaller than χT values, and the magnitude of the difference was around 0.33, which was consistent with the magnitude of the entropy contribution factor (χS) in Equation (14). The Flory–Huggins interaction parameter theory suggested that χ = 0.5 was the critical value, and EPDM could be better dissolved in the solvent to form a homogeneous solution when χ < 0.5. On the contrary, EPDM was difficult to dissolve in the solvent when χ > 0.5. Based on the principle of similar polarity, the three solvents selected in this work were all good solvents for EPDM, and thus χ value should be less than the critical value (χ = 0.5) theoretically. For EPDM/cyclohexane solution system, both χHSP and χT values were less than the critical value. However, for EPDM/n-hexane and EPDM/n-heptane solution systems, the calculated χT values were more than 0.5, being in the region of poor compatibility (Figure 6), which did not follow the conventional theory. It could be inferred that χHSP values would be more acceptable since these calculated values for the three EPDM solutions were consistent with the compatibility theory (all less than the critical value).
Furthermore, the viscosity and χHSP values for the three EPDM solutions were correlated for the purpose of achieving the prediction formula characterized by the relationship between viscosity and χHSP value, both experimentally and theoretically, as shown in Figure 7.
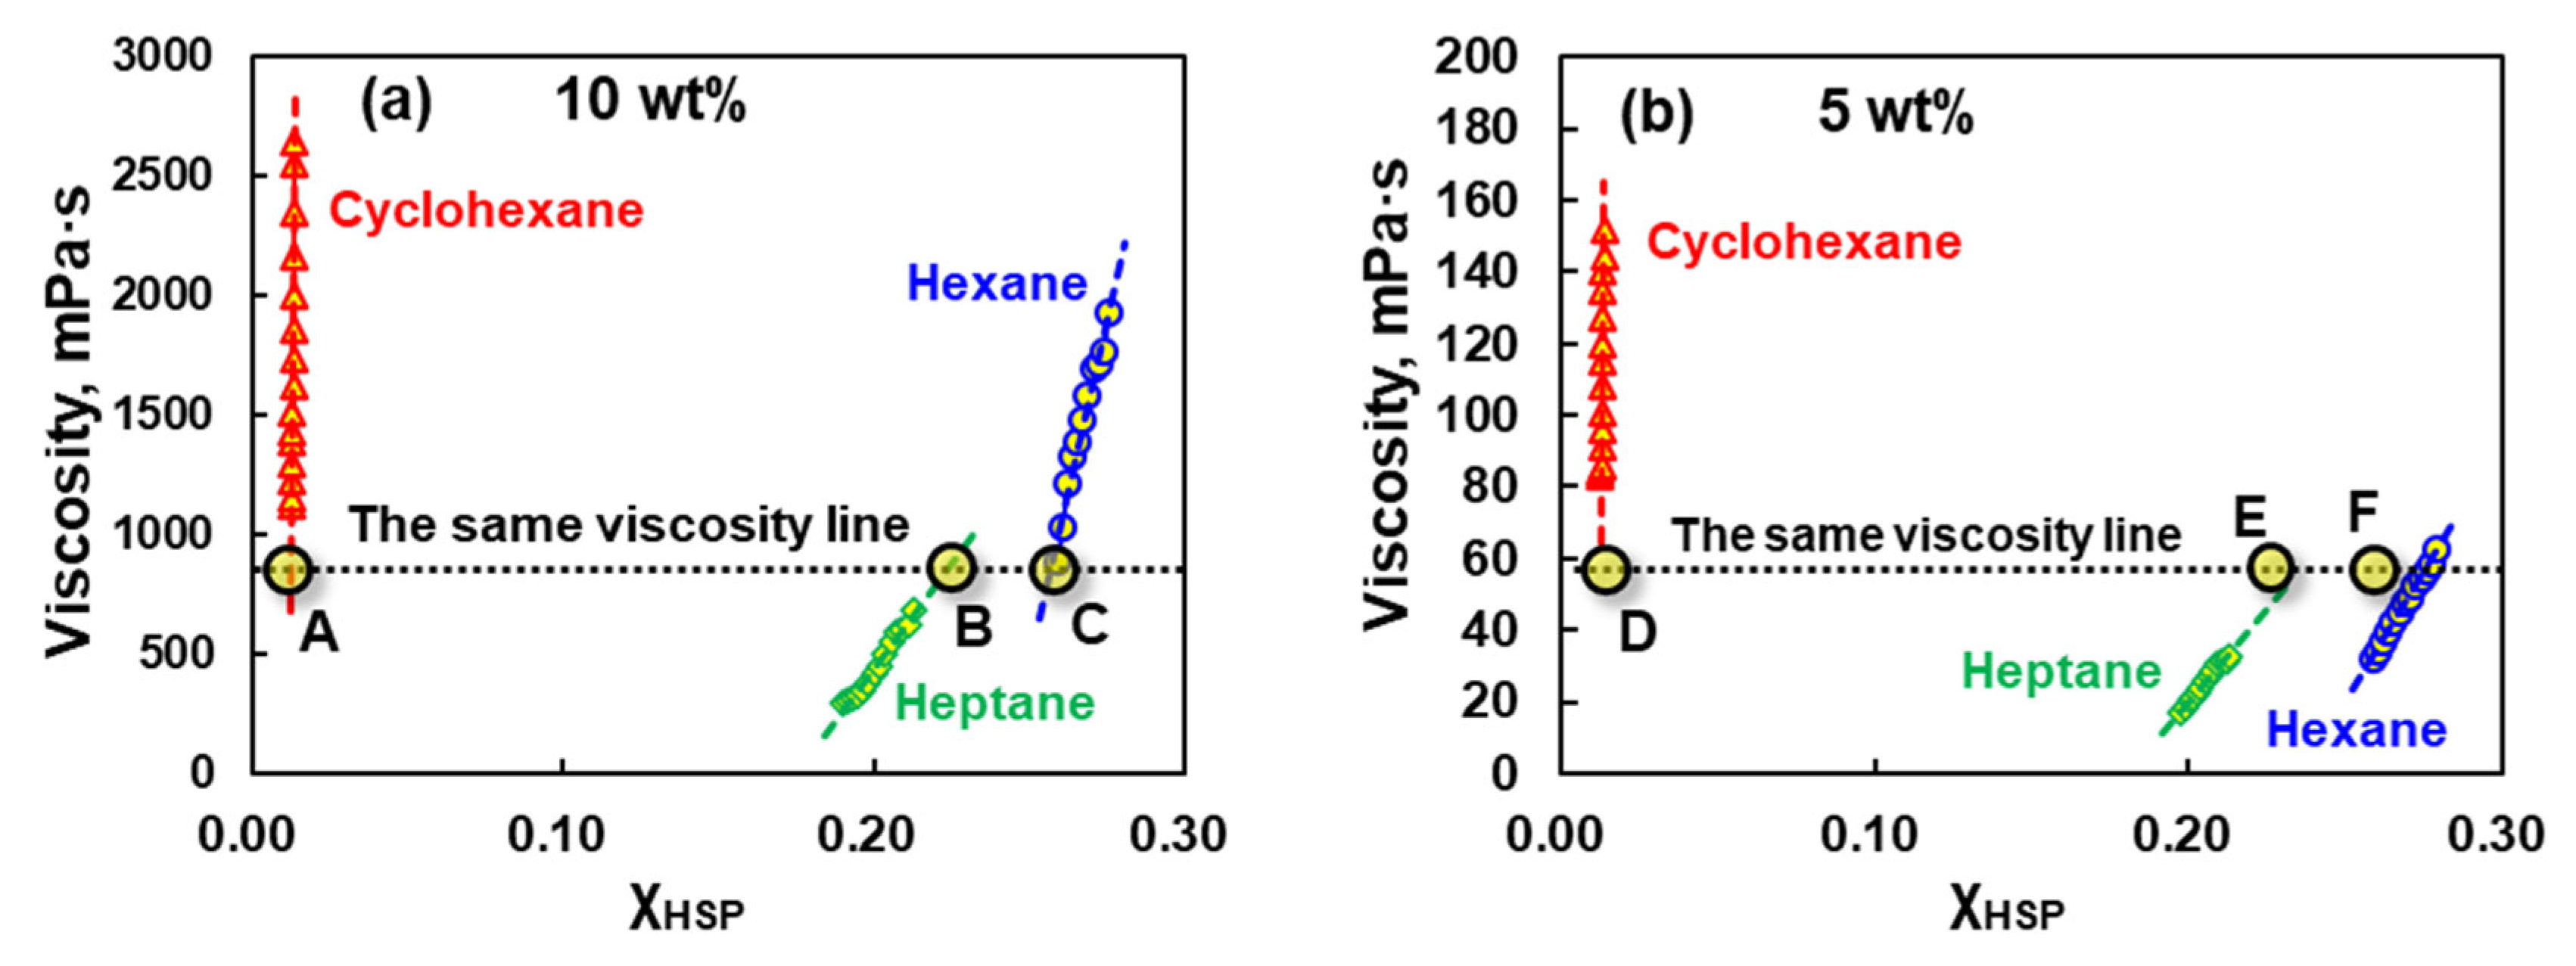
As can be seen from Figure 7a, the viscosities of the three EPDM solutions with 10 wt% showed a linear relationship with the χHSP values, and linear fittings were performed to obtain the following relationships:
For EPDM/cyclohexane:
η E C = 1492666 × χ H S P 17736   R 2 = 0.9800
For EPDM/hexane:
η E H = 56489 × χ H S P 13659   R 2 = 0.9683
For EPDM/heptane:
η E P = 17661 × χ H S P 3098   R 2 = 0.9806
As depicted, the viscosity of EPDM/cyclohexane solution varied significantly with χHSP value, and slight fluctuations in χHSP could produce remarkable changes in the solution viscosity. The EPDM/heptane solution showed the minimum change of the viscosity with χHSP value. Cyclohexane, n-hexane and n-heptane were all good solvents for EPDM, the dissolution of EPDM macromolecules, however, was much more complicated than that for small molecules. It was not only related to the large molecular weight, the entanglement molecular chains and the strong intermolecular forces of EPDM but also related to the properties of the solvent, the solvation temperature and other possible factors. Therefore, selection of solvent was one of the critical factors in determining whether the rubber material could be dissolved quickly.
The temperature became critical to the dissolution of the rubber material once the solvent was determined. As a matter of fact, the dissolution process of rubber was quite slow even though a good solvent was used, which may take hours, days or even several weeks. In addition, the viscosity of the rubber solution had a pronounced dependence on temperature. Therefore, the solution viscosities were different for different rubber solution systems at the same temperature.
The above analysis showed that the factors, such as compatibility and temperature affecting the rubber dissolving process could be integrated into a new parameter: the new Flory–Huggins interaction parameter (χHSP). Combined with the obtained fitting relations from Equation (19) to Equation (21), the viscosities of the rubber solutions at different temperatures could be extrapolated through theoretical calculations, which could be used as well to solve the problem in determining the viscosity of rubber solutions under extreme temperature. Additionally, different dissolution temperatures could be derived from theoretical calculations for the purpose of getting the same viscosity for different rubber solution systems. According to the fitting curves in Figure 7, if the viscosities of EPDM/cyclohexane, EPDM/n-hexane and EPDM/n-heptane were set to be the same value of 650 mPa·s, then the corresponding dissolution temperatures of the three EPDM solutions reaching this target viscosity (points A, B and C) could be derived by extrapolations and calculations. The theoretical calculating temperatures were TA = 61.6 °C, TB = 31.9 °C and TC = 66.1 °C, respectively. As a result, the viscosity of the EPDM solution at any possible temperature could now be calculated from this fitted formula.
As can be seen from Figure 7b, the viscosities of the three EPDM solutions with 5 wt% also showed a linear relationship with χHSP values, and the temperatures for different EPDM solutions corresponding to the same viscosity could be calculated as well, as shown by the points D, E and F in Figure 7b. The calculation method was consistent with that of 10 wt% which would not be described here again. However, this predictive model presented in Figure 7 shows the statistical limitation since it is obtained based on only three experimental points (one per solvent), which prevents a robust statistical validation of the linear model.
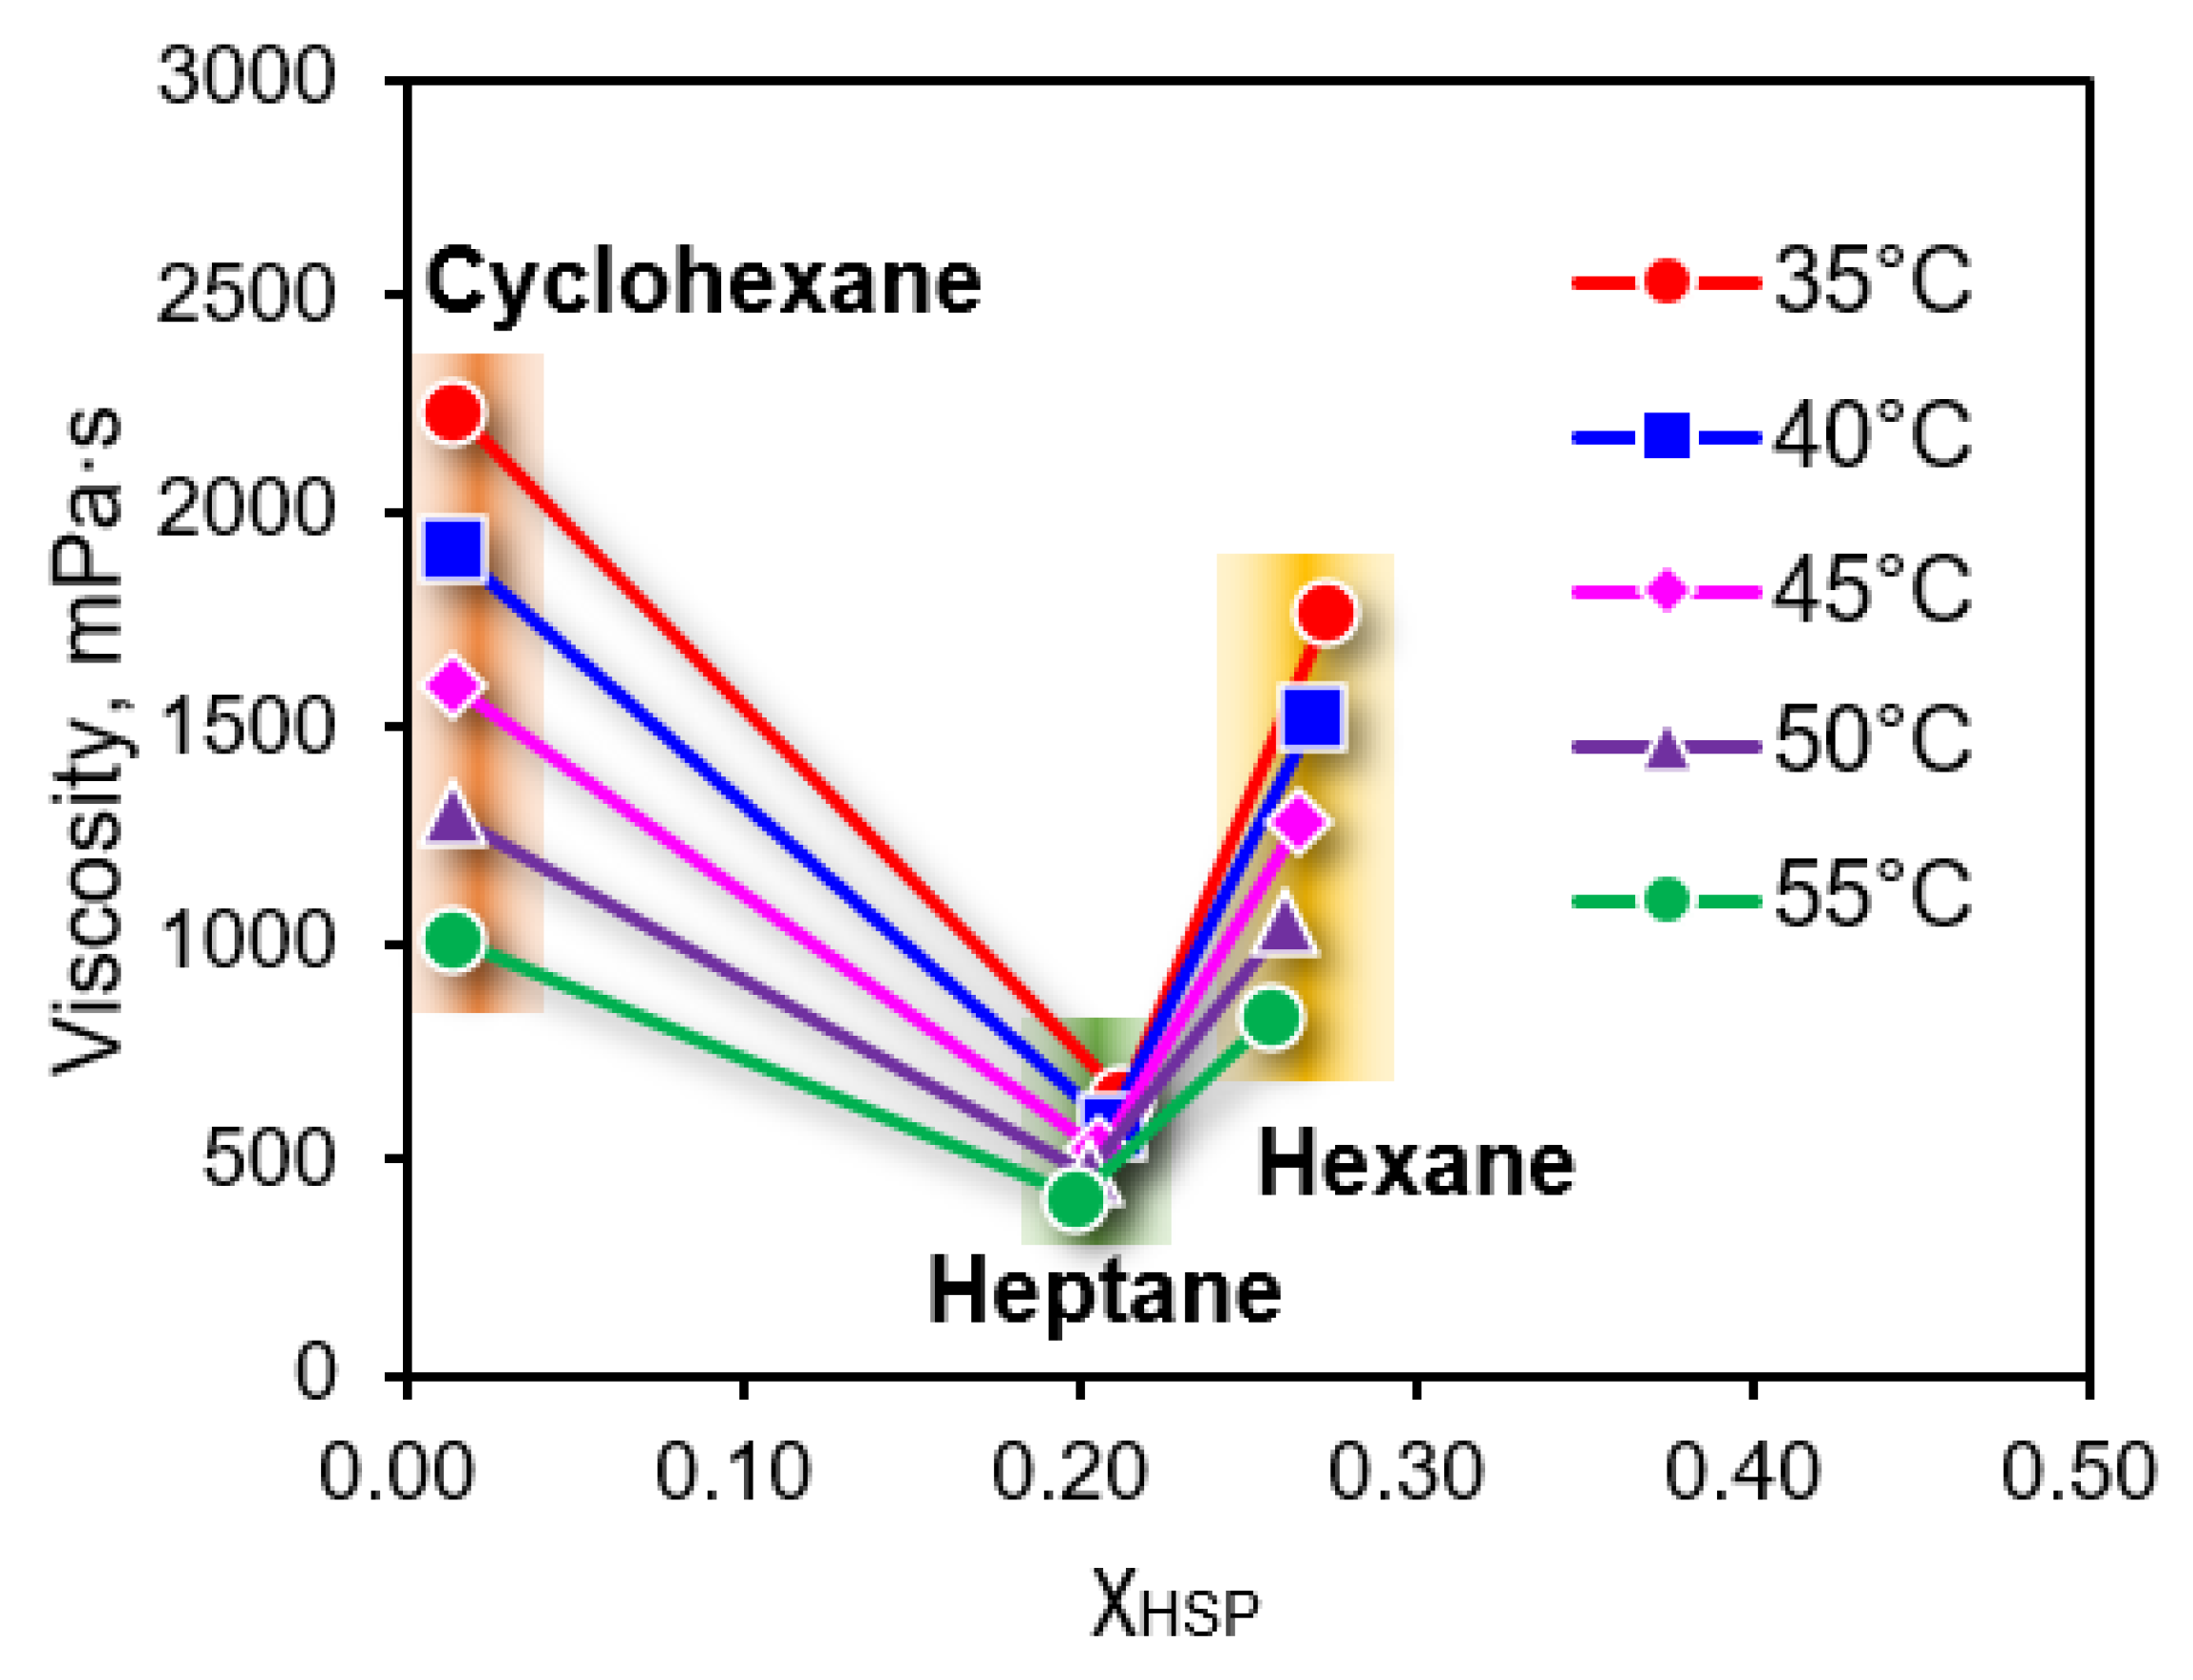
As discussed above, the temperature exerted a significant effect on the viscosity of EPDM solution. However, the temperature dependencies of the viscosity were varied for different EPDM solutions. Hence, it was necessary to investigate the relationships between viscosity and Flory–Huggins interaction parameter at a series of fixed temperatures. The results for the three EPDM solutions were shown in Figure 8.
As shown in Figure 8, in the same range of temperature from 35 °C to 55 °C, the spread of viscosity for EPDM/cyclohexane solution was more extensive than EPDM/n-hexane and EPDM/n-heptane solutions. In accordance with the Flory–Huggins interaction parameters theory, EPDM/solvent solution should show better compatibility with smaller χHSP value at the same temperature, and thus the stretching state of macromolecular chains in solvent became better, which resulted in higher viscosity value. The EPDM/cyclohexane solution exhibited the maximum viscosity due to the smallest χHSP value. On the contrary, the difference in χHSP value between EPDM/n-hexane and EPDM/n-heptane solutions was so slight (ΔχHSP < 0.07) that the compatibility of the two EPDM solutions could be assumed to be identical. At this time, the molar volume of solvent became the critical factor in determining the viscosity of EPDM solutions. Compared with n-heptane (molar volume is 147 mL/mol), n-hexane owning smaller molecular size (molar volume is 131.4 mL/mol) was more likely to enter EPDM rubber matrix and solvates the macromolecular chains, generating higher viscosity for EPDM/hexane solution system. This result was entirely consistent with that of change in the viscosity–temperature curve discussed earlier.
The formula for the χHSP value covers factors such as the molecular size of the solvent, the interaction force between the EPDM and the mixed solvent, and the temperature, etc. However, the formula for fitting the χHSP to the viscosity of the solution is derived at a specific solution concentration and shear rate, and there is a limitation in that when the concentration of the solution and the shear rate are changed, new data are required to fit a new formula.

4. Conclusions

The viscosity of EPDM solutions shows negligible dependence on rotor geometry but significant sensitivity to rotational speed, exhibiting pronounced shear-thinning behavior with increasing shear rate. Higher solution concentrations correlate with elevated viscosity, while viscosity decreases proportionally with rising temperature. The slope of viscosity–temperature curves for EPDM solutions is governed by the Ra parameter, where lower Ra values indicate enhanced polymer–solvent compatibility and consequently steeper curve gradients. When the EPDM solutions possess comparable Ra values, the molar volume of the solvent becomes a critical determinant of viscosity behavior. Quantitative analysis of interaction parameters between EPDM and alkane solvents reveals a robust correlation between solution viscosity and thermodynamic compatibility. A predictive formula is developed to calculate EPDM solution viscosity across temperature gradients, enabling rapid viscosity determination. This approach addresses the challenge of viscosity measurement under extreme conditions and offers a transferable framework for predicting viscosity in other polymer–solvent systems.

Author Contributions

Methodology, G.L.; software, Y.J.; validation, G.L.; data curation, Y.Y.; writing—original draft, Y.Y.; writing—review and editing, G.L.; supervision, G.L. All authors have read and agreed to the published version of the manuscript.

Funding

This work was supported by: (1) National Natural Science Foundation of China under Grant No. 11905084; (2) Jiangsu University “Qing Lan Project”.

Institutional Review Board Statement

Not applicable.

Informed Consent Statement

Not applicable.

Data Availability Statement

The original contributions presented in the study are included in the article, further inquiries can be directed to the corresponding author.

Conflicts of Interest

The authors declare no conflicts of interest.

References

  1. Ma, X.; Ji, T.; Zhang, J.; Shen, S.; Wang, S.; Wang, J.; Hou, X.; Yang, S.; Ma, X. A double-decker silsesquioxane of norbornene and performance of crosslinking reactive modified EPDM ablation resistance composites. Compos. Part A Appl. Sci. Manuf. 2023, 165, 107370. [Google Scholar] [CrossRef]
  2. Jovanović, V.; Samaržija-Jovanović, S.; Budinski-Simendić, J.; Marković, G.; Marinović-Cincović, M. Composites based on carbon black reinforced NBR/EPDM rubber blends. Compos. Part B Eng. 2013, 45, 333–340. [Google Scholar] [CrossRef]
  3. Li, C.; Ding, Y.; Yang, Z.; Yuan, Z.; Ye, L. Compressive stress-thermo oxidative ageing behaviour and mechanism of EPDM rubber gaskets for sealing resilience assessment. Polym. Test. 2020, 84, 106366. [Google Scholar] [CrossRef]
  4. Li, C.; Wang, Y.; Yuan, Z.; Ye, L. Construction of sacrificial bonds and hybrid networks in EPDM rubber towards mechanical performance enhancement. Appl. Surf. Sci. 2019, 484, 616–627. [Google Scholar] [CrossRef]
  5. Mishra, V. Effect of carbon black and graphene on the performance of EPDM rubber composites: A short review. IOP Conf. Ser. Mater. Sci. Eng. 2021, 1116, 012004. [Google Scholar] [CrossRef]
  6. Chen, G.; Gupta, A.; Mekonnen, T.H. Silane-modified wood fiber filled EPDM bio-composites with improved thermomechanical properties. Compos. Part A Appl. Sci. Manuf. 2022, 159, 107029. [Google Scholar] [CrossRef]
  7. OuYang, B.; Liu, Z.; Wang, X.; Zhang, T.; Zhang, C.; Chi, Q. Investigation of electrical properties of ZnO@Ag/EPDM composites. AIP Adv. 2020, 10, 095108. [Google Scholar] [CrossRef]
  8. Cazan, C. Advances in Sustainable Polymeric Materials. Polymers 2022, 14, 4972. [Google Scholar] [CrossRef]
  9. Miller-Chou, B.A.; Koenig, J.L. A review of polymer dissolution. Prog. Polym. Sci. 2003, 28, 1223–1270. [Google Scholar] [CrossRef]
  10. Narasimhan, B. Mathematical models describing polymer dissolution: Consequences for drug delivery. Adv. Drug Deliv. Rev. 2001, 48, 195–210. [Google Scholar] [CrossRef]
  11. Kaunisto, E.; Marucci, M.; Borgquist, P.; Axelsson, A. Mechanistic modelling of drug release from polymer-coated and swelling and dissolving polymer matrix systems. Int. J. Pharm. 2011, 418, 54–77. [Google Scholar] [CrossRef]
  12. Alfrey, T.; Bartovics, A.; Mark, H. The Effect of Temperature and Solvent Type on the Intrinsic Viscosity of High Polymer Solutions. J. Am. Chem. Soc. 1942, 64, 1557–1560. [Google Scholar] [CrossRef]
  13. Fischer, C.; Luttge, A. Pulsating dissolution of crystalline matter. Proc. Natl. Acad. Sci. USA 2018, 115, 897–902. [Google Scholar] [CrossRef] [PubMed]
  14. Gordon, M. Modern theory of polymer solutions. H. Yamakawa. Harper & Row, London. 1971. pp. 419. Price £9.35. Polym. Int. 2010, 4, 541–542. [Google Scholar] [CrossRef]
  15. Marani, D.; Gadea, C.; Hjelm, J.; Hjalmarsson, P.; Wandel, M.; Kiebach, R. Influence of hydroxyl content of binders on rheological properties of cerium–gadolinium oxide (CGO) screen printing inks. J. Eur. Ceram. Soc. 2015, 35, 1495–1504. [Google Scholar] [CrossRef]
  16. Cooper, W. Properties of polymers: Correlations with chemical structures. Polymer 1973, 14, 40. [Google Scholar] [CrossRef]
  17. El Aferni, A.; Guettari, M.; Kamli, M.; Tajouri, T.; Ponton, A. A structural study of a polymer-surfactant system in dilute and entangled regime: Effect of high concentrations of surfactant and polymer molecular weight. J. Mol. Struct. 2020, 1199, 127052. [Google Scholar] [CrossRef]
  18. Agasty, A.; Wisniewska, A.; Kalwarczyk, T.; Koynov, K.; Holyst, R. Scaling equation for viscosity of polydimethylsiloxane in ethyl acetate: From dilute to concentrated solutions. Polymer 2020, 203, 122779. [Google Scholar] [CrossRef]
  19. Germann, N. Shear banding in semidilute entangled polymer solutions. Curr. Opin. Colloid Interface Sci. 2019, 39, 1–10. [Google Scholar] [CrossRef]
  20. Yan, Z.-C.; Wang, W. Dynamics of polymers in concentrated solutions: A weaker self-concentration effect. Polymer 2018, 153, 33–42. [Google Scholar] [CrossRef]
  21. Flory; Paul, J. Thermodynamics of High Polymer Solutions. J. Chem. Phys. 1941, 9, 660. [Google Scholar] [CrossRef]
  22. Huang, B.; Li, X.; Fu, C.; Wang, Y.; Cheng, H. Study Rheological Behavior of Polymer Solution in Different-Medium-Injection-Tools. Polymers 2019, 11, 319. [Google Scholar] [CrossRef] [PubMed]
  23. Schmidt, F.C. The Solubility of Nonelectrolytes (Hildebrand, Joel H.). J. Chem. Educ. 1952, 29, 51. [Google Scholar] [CrossRef]
  24. Jiang, X.; Yuan, X.; Guo, X.; Zeng, F.; Liu, G. Determination of three-dimensional solubility parameters of HNBR/EPDM blends and the transport behaviors in ester solvents. J. Appl. Polym. Sci. 2022, 139, e52881. [Google Scholar] [CrossRef]
  25. Jing, Y.; Cui, Z.; Zou, H.; Tu, J.; Jiang, X.; Shi, X.; Yong, Z.; Liu, S.; Liu, G. Three-dimensional solubility parameters of natural rubber and its predictive power in diffusion coefficients. J. Appl. Polym. Sci. 2022, 139, 51473. [Google Scholar] [CrossRef]
  26. Seymour, R.B.; Sosa, J.M. Estimation of solubility parameters of nonelectrolytes. Nature 1974, 248, 759–761. [Google Scholar] [CrossRef]
  27. Nielsen, T.B.; Hansen, C.M. Elastomer swelling and Hansen solubility parameters. Polym. Test. 2005, 24, 1054–1061. [Google Scholar] [CrossRef]
  28. Murase, M.; Ohta, R.; Iseki, T. Liquid-Repellent Films Comprising Octamethylsilsesquioxane Selected Based on Three-Dimensional Solubility Parameters. Langmuir 2020, 36, 2247–2254. [Google Scholar] [CrossRef]
  29. Wang, Y.Z.; Bi, L.Y.; Zhang, H.J.; Zhu, X.T.; Liu, G.Y.; Qiu, G.X.; Liu, S.S. Predictive power in oil resistance of fluororubber and fluorosilicone rubbers based on three-dimensional solubility parameter theory. Polym. Test. 2019, 75, 380–386. [Google Scholar] [CrossRef]
  30. Liu, G.; Hoch, M.; Liu, S.; Kulbaba, K.; Qiu, G. Quantitative exploration of the swelling response for carbon black filled hydrogenated nitrile rubber with three-dimensional solubility parameters. Polym. Bull. 2015, 72, 1961–1974. [Google Scholar] [CrossRef]
  31. Wiśniewski, R.; Śmieszek, E.; Kamińska, E. Three-dimensional solubility parameters: Simple and effective determination of compatibility regions. Prog. Org. Coat. 1995, 26, 265–274. [Google Scholar] [CrossRef]
  32. Huang, J.-C.; Lin, K.-T.; Deanin, R.D. Three-dimensional solubility parameters of poly(ε-caprolactone). J. Appl. Polym. Sci. 2006, 100, 2002–2009. [Google Scholar] [CrossRef]
  33. Pospiech, D.; Gottwald, A.; Jehnichen, D.; Friedel, P.; John, A.; Harnisch, C.; Voigt, D.; Khimich, G.; Bilibin, A. Determination of interaction parameters of block copolymers containing aromatic polyesters from solubility parameters obtained from solution viscosities. Colloid Polym. Sci. 2002, 280, 1027–1037. [Google Scholar] [CrossRef]
  34. Han, K.H.; Jeon, G.S.; Hong, I.K.; Lee, S.B. Prediction of solubility parameter from intrinsic viscosity. J. Ind. Eng. Chem. 2013, 19, 1130–1136. [Google Scholar] [CrossRef]
  35. Gillespie, T. The viscosity of concentrated polymer solutions. J. Polym. Sci. 1960, 46, 383–393. [Google Scholar] [CrossRef]
  36. Peleg, M. Temperature–viscosity models reassessed. Crit. Rev. Food Sci. Nutr. 2018, 58, 2663–2672. [Google Scholar] [CrossRef]
  37. Agasty, A.; Wisniewska, A.; Kalwarczyk, T.; Koynov, K.; Holyst, R. Macroscopic Viscosity of Polymer Solutions from the Nanoscale Analysis. ACS Appl. Polym. Mater. 2021, 3, 2813–2822. [Google Scholar] [CrossRef]
  38. Yan, Y.; Guo, R.; Cheng, C.; Fu, C.; Yang, Y. Viscosity prediction model of natural rubber-modified asphalt at high temperatures. Polym. Test. 2022, 113, 107666. [Google Scholar] [CrossRef]
  39. Kol, R.; Nachtergaele, P.; De Somer, T.; D’hooge, D.R.; Achilias, D.S.; De Meester, S. Toward More Universal Prediction of Polymer Solution Viscosity for Solvent-Based Recycling. Ind. Eng. Chem. Res. 2022, 61, 10999–11011. [Google Scholar] [CrossRef]
  40. Rotational Viscometer. Science 1975, 189, 1110. [CrossRef]
  41. Liu, S.; Jing, Y.; Tu, J.; Zou, H.; Yong, Z.; Gao, Y.; Tang, Z.; Liu, G. New Flory-Huggins interaction parameter between SBR and p-phenylenediamine antioxidants and the predictive power in molecular structure and rubber formula design. J. Appl. Polym. Sci. 2022, 139, 51840. [Google Scholar] [CrossRef]
  42. Huang, J. Probe dependency of flory–huggins interaction parameters between solvents: Cases of hydrocarbons and isosteric derivatives. J. Appl. Polym. Sci. 2013, 127, 5000–5006. [Google Scholar] [CrossRef]
  43. Jiang, X.; Yuan, X.; Guo, X.; Zeng, F.; Wang, H.; Liu, G. Study on the application of Flory–Huggins interaction parameters in swelling behavior and crosslink density of HNBR/EPDM blend. Fluid Phase Equilibria 2023, 563, 113589. [Google Scholar] [CrossRef]
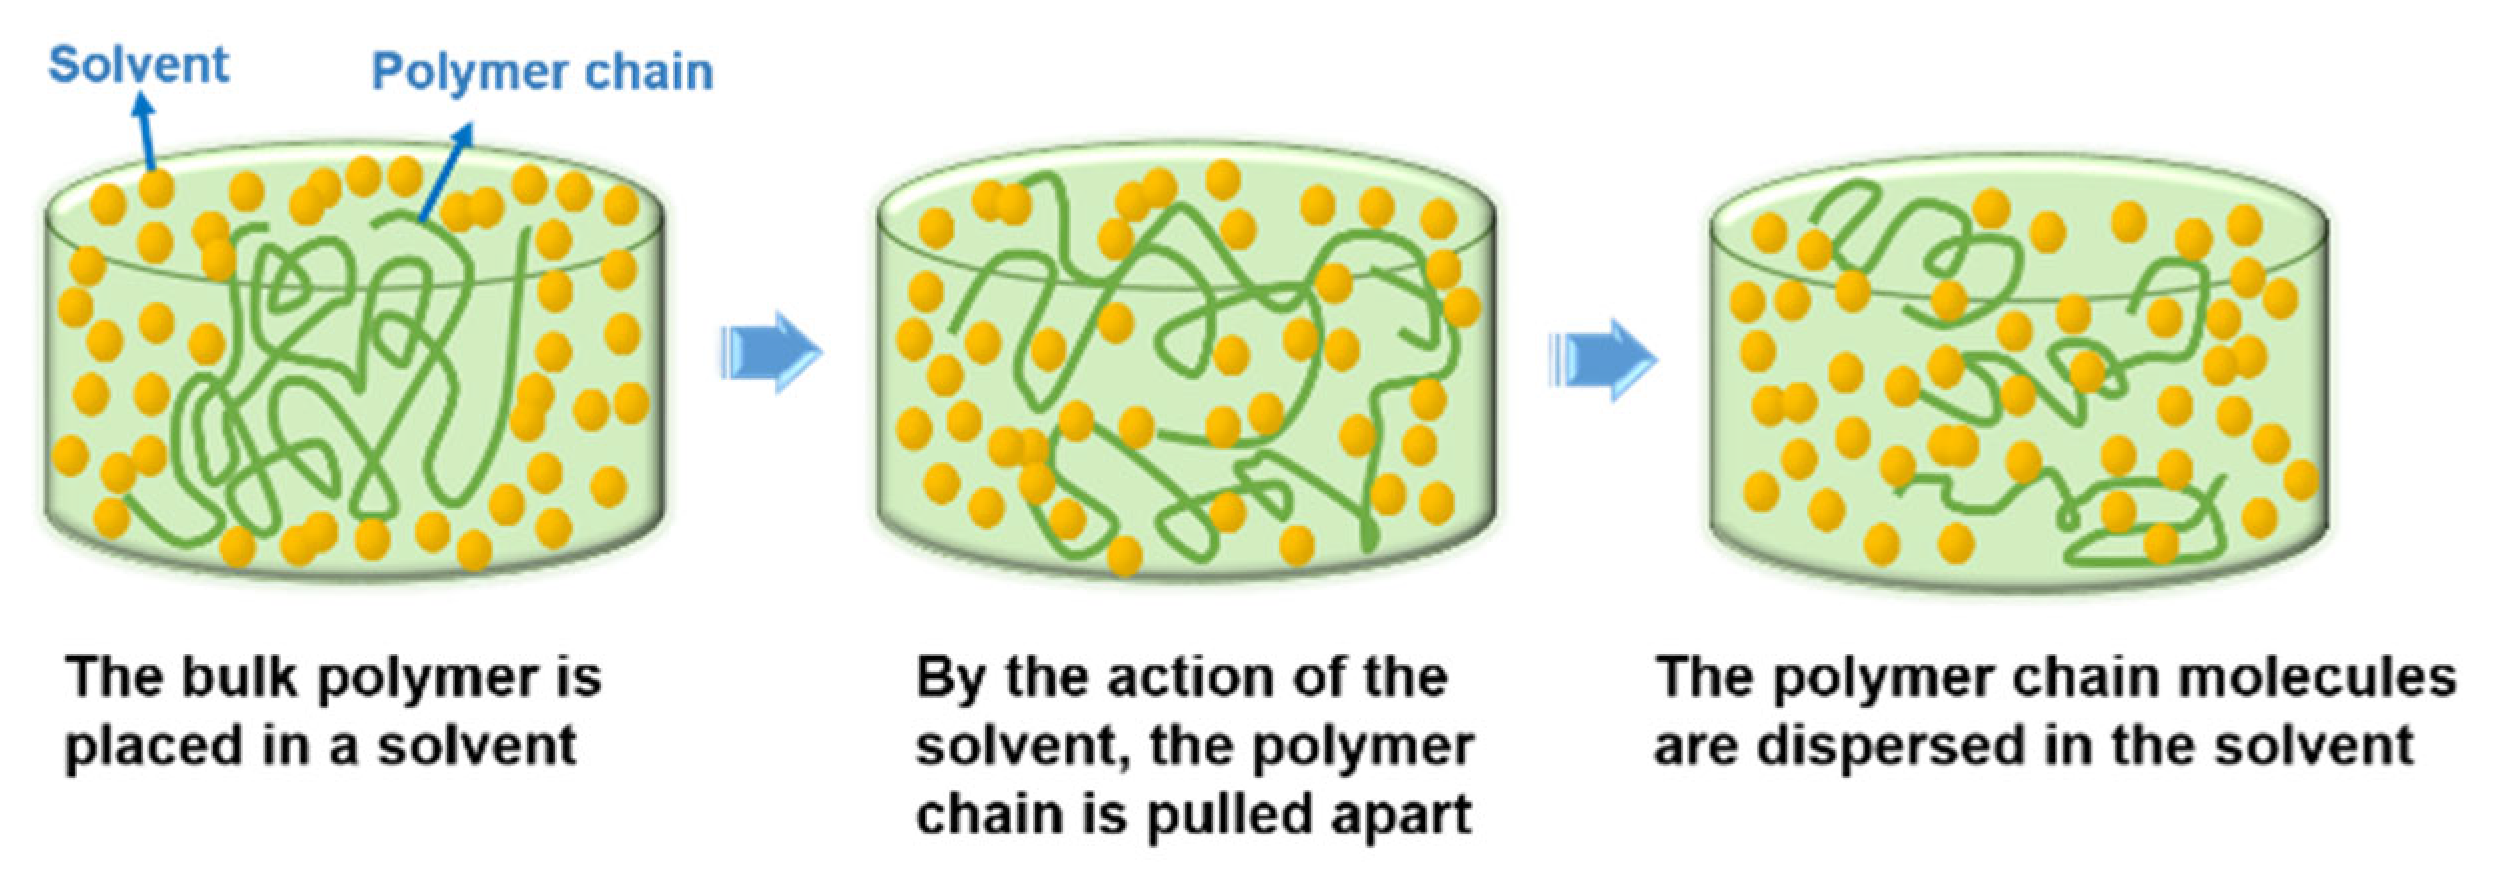
Figure 1. Polymer dissolution process.
Coatings 15 00582 g001
Figure 2. Concentration regimes of polymer solutions: red colored circles represent the solution; green chains represent the polymer chains.
Coatings 15 00582 g002
Figure 3. Change of viscosity with temperature for three EPDM solutions: (a) rotor speed: 30 rpm, type: No. 2 and No. 3; (b) rotor type: No. 3, speed: 12 rpm and 30 rpm.
Coatings 15 00582 g003
Figure 4. Change in viscosity of EPDM solution with temperature: (a) EPDM is 10 wt% and (b) EPDM is 5 wt%.
Coatings 15 00582 g004
Figure 5. Correlation of the slope of the viscosity–temperature curve with Ra: (a) EPDM is 10 wt% and (b) EPDM is 5 wt%.
Coatings 15 00582 g005
Figure 6. Relationship between EPDM solution viscosity and Flory–Huggins interaction parameters: (a1,b1,c1) EPDM is 10 wt%, (a2,b2,c2) EPDM is 5 wt%.
Coatings 15 00582 g006aCoatings 15 00582 g006b
Figure 7. Correlations of viscosity with χHSP values for EPDM solutions: (a) EPDM is 10 wt% and (b) EPDM is 5 wt%.
Coatings 15 00582 g007
Figure 8. Relationships between viscosity and χHSP value at different temperatures (taking 10 wt%, for example).
Coatings 15 00582 g008
Table 1. Basic properties of alkane solvents.
SolventMolecular
Structural
Molecular
Formula
δd,
MPa1/2
δp,
MPa1/2
δh,
MPa1/2
δt,
MPa1/2
Vmol,
(cm3/mol)
CyclohexaneCoatings 15 00582 i001C6H1216.800.216.8108.7
HeptaneCoatings 15 00582 i002C7H1615.20015.3147
HexaneCoatings 15 00582 i003C6H1415.00014.9131.4
Disclaimer/Publisher’s Note: The statements, opinions and data contained in all publications are solely those of the individual author(s) and contributor(s) and not of MDPI and/or the editor(s). MDPI and/or the editor(s) disclaim responsibility for any injury to people or property resulting from any ideas, methods, instructions or products referred to in the content.