Article

Prediction of Surface Roughness in Milling Additively Manufactured High-Strength Maraging Steel Using Broad Learning System

1
Guangdong Provincial Key Laboratory of Intelligent Morphing Mechanisms and Adaptive Robots, Harbin Institute of Technology, Shenzhen 518055, China
2
Key University Laboratory of Mechanism & Machine Theory and Intelligent Unmanned Systems of Guangdong, Harbin Institute of Technology, Shenzhen 518055, China
3
School of Mechanical Engineering and Automation, Harbin Institute of Technology, Shenzhen 518055, China
4
Department of Mechanical Engineering, College of Design and Engineering, National University of Singapore, Singapore 117575, Singapore
5
School of Automation and Electrical Engineering, Lanzhou Jiaotong University, Lanzhou 730070, China
*
Author to whom correspondence should be addressed.
These authors contributed equally to this work.
Coatings 2025, 15(5), 566; https://doi.org/10.3390/coatings15050566
Submission received: 6 April 2025 / Revised: 3 May 2025 / Accepted: 7 May 2025 / Published: 9 May 2025
(This article belongs to the Special Issue Recent Development in Post-processing for Additive Manufacturing)

Abstract

:
Additive manufacturing (AM) provides a promising method to fabricate advanced functional parts with different mechanical and material performances from their traditional counterparts. However, the poor surface quality makes the subsequent post-processing necessary for precision application. Hybrid manufacturing combining additive and subtractive manufacturing processes is an effective method to improve the surface quality of additive manufacturing (AMed) metal parts rapidly by using a subtractive process, in which surface roughness is an important technical indicator. Therefore, accurate surface roughness prediction is crucial for process and quality control in the subtractive machining of additively manufactured parts. In this study, a prediction method utilizing a broad learning system (BLS) is developed to predict the surface roughness of machined AMed maraging steel parts considering aging heat treatment. First, feature extraction was performed on the force signal during the cutting process in the time domain, frequency domain, and time–frequency domain. Then, the maximum information coefficient was used to select important features from high to low feature by feature. Furthermore, the important features and cutting parameters were fused as the input of BLS. Finally, the corresponding prediction results were compared with those based only on cutting parameters. The results show that the prediction accuracy of machined surface roughness is higher when fusing force signal features and cutting parameters. The prediction errors (mean absolute percentage error) were reduced by 67.28% and 16.39% to 0.53% and 0.51%, respectively, for the AMed maraging steels with and without heat treatment.

1. Introduction

As an emerging technique, additive manufacturing (AM) can rapidly fabricate functional parts with complex geometrical structures thanks to the high manufacturing freedom attributed to the layer-by-layer method [1]. This technique can rapidly fabricate complex productions, which is difficult or impossible for the traditional manufacturing processes. Therefore, it has become one of the most promising manufacturing technologies, which has been widely used in many fields, such as aerospace, automobile, medical, etc [2]. Among the AM techniques, laser powder bed fusion (LPBF) is good at fabricating metal parts by using a high-energy laser beam to selectively melt the preset powder bed [3]. It features high relative density and high manufacturing resolution, making it one of the most widely used AM technologies. However, the original as-built surface quality of the LPBFed part is too poor to be directly used in the precision field, which limits its further development and application in industry [4].
Moreover, due to the nature of powder particles with several tens of microns and the stair-stepping error caused by the layer-by-layer manufacturing method, the as-built surface quality of LPBFed metal parts cannot be improved infinitely. For example, the original surface roughness of the optimized LPBFed 316L is 11.74 μm (Sa) [5]. The original surface roughness of the optimized LPBFed AlSi10Mg alloy is 14.9 μm (Sa) [6]. The rough surface cannot meet the requirements for dimensional accuracy and surface finish. To improve the surface quality of the original LPBFed metals, a large number of post-processing technologies were used, which are polishing, grinding, sandblasting, etching, machining, etc. Among them, milling as a machining process is widely used because surface quality can be improved quickly by reducing the surface roughness value Ra from above ten micrometers to below 1 μm [7]. Another important point is that milling process is a promising method that can be integrated into the additive manufacturing process more easily, which is called hybrid additive and subtractive manufacturing technology. In this way, the fabrication of complex parts using additive manufacturing and the improvement of the as-built surface quality using subtractive manufacturing (milling) can be performed on the same machine. For example, Du et al. successfully improved the surface quality and dimension accuracy of LPBFed maraging steel parts by performing milling operation on the corresponding part after every ten constructed layers [8]. However, although various surface roughness modeling studies for different additive manufacturing processes have been reported by [9], surface roughness analysis in hybrid additive and subtractive manufacturing processes is rarely addressed. Particularly, studies on the surface roughness prediction of machined surfaces of additively manufactured metals using the milling process are still lacking.
In the past two decades, scholars have focused on predicting surface roughness in various cutting processes. Milling is a primary processing method, and its surface roughness has garnered significant attention. Benardos and Vosniakos categorized surface roughness prediction methods into four groups: grounded in machining theory, derived from experimental research, developed through designed experiments, and employing artificial intelligence (AI) [10]. Artificial intelligence and sensor technologies have significantly advanced the development of data-driven approaches for predicting milling surface roughness. Lo employed an adaptive-network-based fuzzy inference system (ANFIS) to predict the surface roughness of end milled parts and analyzed the impact of cutting parameters on surface quality [11]. Zain et al. utilized an artificial neural network (ANN) for similar predictions in end milling processes [12]. Chiu and Lee developed a data-driven methodology using ANFIS models to predict machining quality [13]. In this methodology, CNC machining parameters act as inputs, while the outputs are milling accuracy and surface quality. Karkalos et al. employed statistical and soft computing techniques to predict surface roughness for the milling of Ti-6Al-4V ELI alloy [14], while Wu and Lei utilized vibration signal analysis combined with an ANN for predicting the surface roughness of S45C steel in the milling process [15]. To enhance the surface integrity of AMed metal components, Li et al. introduced a data-driven predictive modeling approach for predicting the surface quality during additive manufacturing processes [16]. Rifai et al. innovatively used convolutional neural networks (CNNs) to directly assess turned and milled surface roughness from digital images of surface textures [17]. Additionally, Kong et al. proposed a two-stage feature fusion method to enhance the accuracy of surface roughness predictions in cutting processes by extracting more effective signal features [18]. Furthermore, Zhang et al. introduced an attention-based model for predicting surface roughness, utilizing two light sources to achieve superior classification of roughness grades [19]. Tian et al. developed a fuzzy broad learning system that incorporates feature selection techniques to predict surface roughness in slot milling processes [20]. In order to fulfill the demands of real-time responsiveness and predictability within intelligent manufacturing, Liu et al. proposed a method for surface roughness prediction and adaptive optimization of process parameters driven by a digital twin [21].
Chen and Liu introduced an efficient incremental learning system without deep architecture, namely the broad learning system (BLS) [22]. Due to its streamlined structure and fast training, it has garnered significant interest among researchers and engineers. Tian et al. applied the BLS to predict surface roughness in slot milling processes, and the findings indicated that while the BLS exhibits commendable predictive capabilities compared to traditional machine learning approaches, it lacks a comprehensive consideration of signal features across time, frequency, and time–frequency domains [23]. In this work, feature extraction is first conducted on the cutting force signal during the milling of additively manufactured metals. Subsequently, these signal features are fused with cutting parameters, with irrelevant or redundant features being filtered out. Finally, a broad learning system is used for surface roughness prediction, and the prediction results were compared with those considering only cutting parameters. To the best of the authors’ knowledge, this marks the pioneering application of the BLS in predicting the surface roughness of AMed workpieces during the milling process.
The subsequent sections of this article are structured as follows: Section 2 provides a comprehensive overview of the implementation process of the BLS. Section 3 describes the experimental design. Prediction results and discussion are presented in Section 4. Finally, the conclusions are summarized in Section 5.

2. Methodology

The basic architecture of the BLS is depicted in Figure 1, comprising an input layer, a hidden layer, and an output layer. For the convenience of description, the hidden layer can be further divided into a feature layer and an enhancement layer.
Let D = x i , y i i = 1 N represent the training sample dataset, where x i = x i 1 , x i 2 , , x i M , N is the number of training samples, and M represents the dimension of the feature. It is further assumed that the feature layer of the BLS contains m feature node groups, with each feature node group containing p neurons, and the enhancement layer contains n enhanced node groups, with each enhanced node group containing q nodes.
The detailed implementation procedure of BLS is delineated as follows:
Step 1: Mapping training samples to each feature node group in the feature layer. The input matrix X of the training sample is randomly assigned to each feature layer node group, where the output of the ith feature node group can be expressed as Equation (1):
F i = φ i X W F i + β F i R N × p , i = 1 , 2 , , n
where φ i is typically a linear transformation, and the weighting matrix W F i and bias term β F i are randomly generated with the appropriate dimensions.
Subsequently, the outputs of all feature node groups within the feature layer are combined into Equation (2):
F n = F 1 , F 2 , , F n
Step 2: Transforming the feature layer output into the enhancement layer. First of all, the output F n of the feature layer is propagated to the enhancement layer, where the output of the jth enhanced node group is computed according to Equation (3):
E j = ψ j F n W E j + β E j , j = 1 , 2 , , m
where ψ j denotes the activation function, and W E j and β E j represent the randomly generated weight matrix and bias term, respectively.
Next, the outputs of all enhancement nodes within the enhancement layer are combined into Equation (4):
E m = E 1 , E 2 , , E m
Step 3: Combining the outputs of all feature layers and enhancement layers. The outputs F n of all feature layers and the outputs E m of all enhancement layers are combined to form the output of the hidden layer. This combination is expressed in Equation (5):
H = F n E m
Step 4: Calculating the connection weights between the hidden layer and the final output layer. Given the actual training sample label Y, the weight matrix W from the hidden layer to the final output layer is computed using ridge regression, as described in Equation (6):
W = H T H + λ I 1 H T Y
in which I denotes an identity matrix with proper dimensions, and λ is a nonnegative regularization constant.

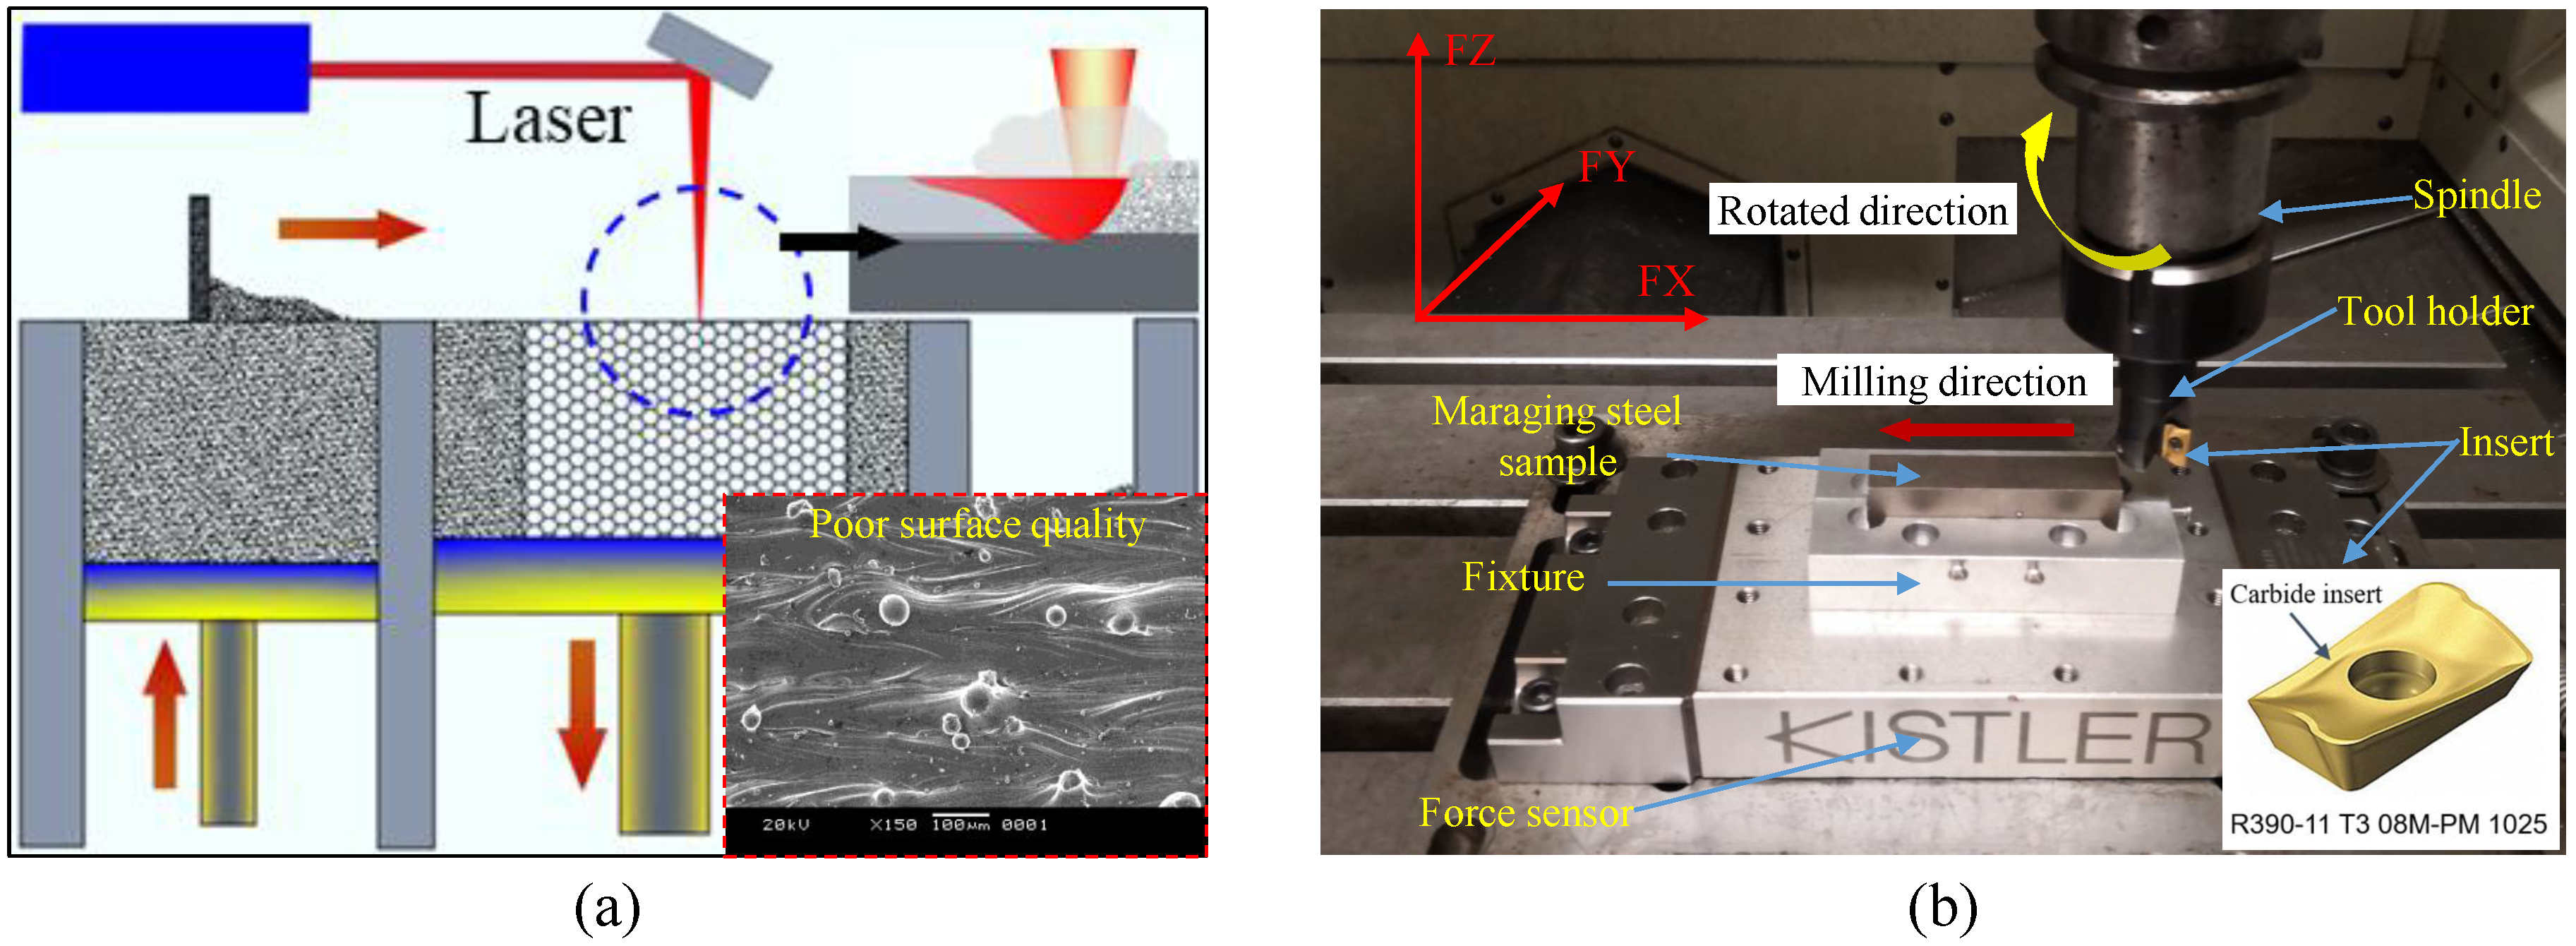
3. Experimental Design

The material applied in this study is maraging steel (18Ni300) fabricated by an LPBF AM device (DiMetal-280, Laseradd, China). The maraging steel powders are produced by the gas atomization method. The powder particle size is from 15 μm to 53 μm. The powder was approximately spherical and fabricated by Liaoning Guanda New Material Technology Corporation Limited (China). In addition, the laser used in the AM device is Yb-fiber laser with maximum power of 500 W. The wavelength of the laser is 1.064 μm with a beam spot diameter of 70 μm. To reduce the oxygen content, purity argon was used as a shielding gas to fill the building chamber during the printing process. In addition, the base substrate was a 316 L stainless steel plate, which was used for depositing maraging steel components. In order to ensure the high density, the printed components were fabricated using optimized process parameters supplied by the device supplier, as shown in Table 1. A scanning strategy with laser spot moving track rotating 45° every layer was used to further ensure high metallurgical quality and high density of the samples. The AMed sample size is 70 mm × 20 mm × 20 mm for subsequent machining. As can be observed from the SEM subfigure of the as-built part in Figure 2a, the original surface quality is very poor with a roughness (Sa) of ~10 μm.
Maraging steel is age-strengthened steel, whose mechanical property can be significantly improved by post-heat treatment. Therefore, some as-built (AB) maraging steels were treated by solution and aging treatment (SAT) to adjust their microstructure and mechanical properties. The heat treatment procedure is solution-treated at 940 °C for 2 h and then aging-treated at 490 °C for 6 h. The heating rate and cooling method are 10 °C/min and air cooling, respectively.
After additive manufacturing, a milling experiment was performed on maraging steels in a MAKINO V55 vertical CNC processing center. The spindle speed of the machine is as high as 14,000 rpm, the maximum output power is 11.0 kW, and the maximum output torque is 23.3 Nm. The cutting insert for large flat surfaces—a carbide insert (R390-11 T308M-PM 1025)—was manufactured by Sandvik, which was coated with PVD TiCN+TiN. A tool holder (SAP0.8R20-C20-200-2F indexable turning tool mill holder for R39011T3 inserts) with a diameter of 20 mm was made of steel. The influencing factors (parameters) and their corresponding levels for model training and testing under air-cooling conditions are presented in Table 2, which were designed using the Response Surface–Central Composite Design method (α = 1.682) based on the recommended cutting parameters from the tool manufacturer. The machined surface roughness (Sa) was tested three times after each cutting. In addition, to obtain the cutting force signals, a commercial triaxial force sensor (Kistler 9251A, Winterthur, Switzerland) was used during the milling process to measure the longitudinal feed force F X , transverse feed force F Y , and vertical feed force F Z , respectively, as shown in Figure 2b, and the sampling rate was set to 3000 Hz.
To observe the microstructure, grinding and polishing were first performed on the AB and SAT samples, and then etching was carried out for 2 min using dilute aqua regia ( HNO 3 : 10% and HCl: 30%). Finally, rinsing with alcohol and drying were performed successively. Then, the microstructure was analyzed using a Quanta-650 SEM device (FEI, Hillsboro, OR, USA). The surface roughness was measured on a laser confocal microscope OLYMPUS LEXT OLS-5000 (Olympus Corporation, Tokyo, Japan) according to the ISO 25178 standard. The microhardness of the parts was obtained under a load of 300 g with a dwell time of 15 s using a Vickers microhardness tester of SHIMADZU corporation (Kyoto, Japan) according to the ASTM E384-17 standard. The nanostructure analysis was carried out using an FEI Talos F200X scanning (Hillsboro, OR, USA) transmission electron microscope (TEM) sourced from USA. This sophisticated instrument was outfitted with an energy-dispersive X-ray spectroscopy (EDS) detector and operated at an accelerating voltage of 200 kV. Through its capabilities, the microscope facilitated the acquisition of a variety of imaging modalities, including bright-field TEM (BF-TEM), dark-field TEM (DF-TEM), selected area electron diffraction (SAED), high-angle-around dark field (HAADF), and high-resolution TEM (HRTEM), enabling comprehensive characterization of the nanostructures under investigation. In addition, a dual-focused ion beam technique was employed to prepare the AB and SAT TEM samples using the FEI Helios NanoLab 600i apparatus (Hillsboro, OR, USA).

4. Results and Discussion

4.1. Material Property Analysis

Cutting response is not only affected by the machining parameters but also affected by material properties. Therefore, the difference in microstructure and mechanical properties between the AB and SAT components was analyzed. The experimental results indicate that the AB part has significant differences in the microstructure and grain morphologies from the SAT one, as presented in Figure 3. The former is characterized by typical melt tracks and micron-scale cellular structures (Figure 3a) due to the laser scanning and high cooling rate [24], which also cause a microhardness of 337.0 HV. The inverse pole figure in Figure 3b shows the formation of bimodal microstructures, which are fine equiaxed and columnar grains. In addition, some longer columnar grains were observed parallel to the building direction. This is mainly attributed to the thermal gradient caused by the layer-by-layer manufacturing process. Furthermore, the EBSD phase analysis shows that the AB part is composed of 99.5% martensite phase and 0.5% austenite phase. After heat treatment, the melt track and cellular structures are replaced by homogeneous martensitic laths, as displayed in Figure 3c. Moreover, the grains become uniform polygons, which are presented in Figure 3d. At the same time, the microhardness increased sharply to 608.5 HV, which is attributed to the precipitation strengthening induced by aging treatment. It should also be mentioned that the textures of both AB and SAT LPBFed maraging steels are weaker compared to those of other LPBFed metals, such as 316L stainless steel [25]. This is because there is a solid-state phase transformation from austenite to martensite during the cooling process. Specifically, the martensite grains with a series of different orientations nucleate and grow simultaneously inside the prior austenite parent grains [26]. As a result, the initially formed strong austenite-dominated texture and large epitaxial growth grains caused by the thermal gradients during the AM process are destroyed and replaced by a weak martensite-dominated texture [27]. The reason for the weak texture in the SAT part is attributed to the microstructural homogenization after heat treatment at high temperature.
As presented in Figure 4, tensile testing was performed to study the mechanical property of the AB and SAT LPBFed maraging steels. It can be observed that the SAT part has a higher ultimate strength with a value of 1951.1 MPa compared to the AB one with 1051.8 MPa. Similar results are also observed with respect to yield strength. However, the elongation of the SAT part is much lower (6.7%) than that of the AB one with 9.8%. This indicates that the former has higher strength but lower plasticity. To study the underlying reason for the above results, TEM analysis was carried out on the AB and SAT parts to study the microstructure in detail, as presented in Figure 5. The BFTEM figure (Figure 5a) displays a short-lath α martensite phase, which was verified by the corresponding fast Fourier transform (FFT) image inserted in Figure 5b. The section indicated by a black arrow corresponds to the α martensite phase. In addition, retained equiaxed austenite phase ( γ -Fe) with a diameter of 100 nm is distributed in the martensite grain, as displayed in Figure 5b, which is consistent with the phase analysis result using EBSD. Figure 5c is the HRTEM image of the white dotted box region in Figure 5b, showing a dense interface of γ -Fe and α martensite phases. These two phases were identified via the lattice constant and were further confirmed by the FFT patterns inserted in Figure 5c.
TEM observation on the SAT sample shows a difference, with the disappearance of γ -Fe, as shown in Figure 5d–f. Instead, the short-lath martensitic grain became coarse with a width of ~2 μm. Furthermore, some nanoparticles were precipitated inside the coarse lath (Figure 5d). The corresponding center DFTEM image exhibits the presence of nanoparticles in the bright contrast, which shows a uniform distribution of the nanoparticles inside the α martensite grains, as displayed in Figure 5e. The HRTEM image (Figure 5f) was analyzed to recognize these two lattice fringes of α martensite phase and nanoparticles, in which the nanoparticles with a width of 3.67 nm were marked by white arrows. To identify the nanoparticles, FFT was performed on the section circled by a dotted white box, as presented in the subfigure inserted in Figure 5f. The results show that these nanoparticles are η -Ni3Ti phases, which are generally formed in the maraging steel after aging heat treatment [28]. According to the precipitation strengthening theory, the presence of nanoparticles is the main reason for the increase in hardness as well as tensile strength, which enhance the mechanical properties by inhibiting the motion of dislocations [29].
From the analysis of the AB and SAT LPBFed maraging steels, it can be known that there are significant differences in their microstructure and mechanical properties. This will result in different cutting responses during the machining process. Therefore, performing surface roughness predictions for as-built and SAT LPBFed maraging steels, respectively, before the milling process is imperative.

4.2. Surface Roughness Prediction

The typical machined surface morphologies of the AB and SAT samples are presented in Figure 6. From Figure 6a,b, it can be known that both samples have observable feed marks caused by the cutting tool during the removal of chip materials. In addition, some machined defects (i.e., adhering chips) were found on the AB sample (Figure 6a). Moreover, the peak and valley values of feed marks of the AB sample are a little larger than those of the SAT one, which can also be observed from the surface line profiles in Figure 6c. This is mainly because the AB sample is much softer (as shown in Figure 4), which results in high material deformation during machining under the same cutting parameters. In the contrast, the SAT is much harder and more brittle, thereby leading to relatively smaller deformation during the cutting process. Therefore, the machined surface quality of the AB and SAT samples differs, which further indicates the necessity of developing surface prediction on both samples, respectively.
In this work, surface roughness Sa was measured from the machined surfaces. A total of 20 data samples were collected from the experimental results of machined AB and SAT parts, respectively, which are designed by response surface methodology. To verify the feasibility of the BLS for predicting the surface roughness of milled additive manufacturing workpieces, the data samples are randomly divided into 3:1 for model training and testing, namely 15 training samples and 5 testing samples, as shown in Table 3.
To eliminate the impact of varying dimensions on the prediction accuracy, it is necessary to normalize the training samples. Here, min–max normalization is applied as follows:
x i ¯ j = x i j x min j x max j x min j
where x i j denotes the jth feature of the ith sample, and x m a x j and x m i n j represent the maximum and minimum values of the jth feature, respectively.
In this work, the mean absolute percentage error ( MAPE ) was adopted as the evaluation metric to assess performance, which was calculated as follows:
M A P E = 1 N i = 1 N | y i y ^ i y i | × 100 %
where N is the total number of testing samples, and y i and y ^ i denote the actual value and predicted value of the ith testing sample, respectively.
In this study, the two distinct modes of surface roughness prediction using the BLS model are described as follows:
First of all, only cutting parameters were used as inputs to the BLS model in order to predict surface roughness, and the influence of other uncertain factors on surface roughness prediction were not taken into account. In this case, this mode was marked as BLS1. Second, the actual milling process is a complex dynamic system, and there are many factors that can impact the surface roughness of a workpiece during the actual milling process. To this end, in order to capture the dynamic changes in surface roughness, we use the cutting force signal. The original force component signal during the machining process is shown in Figure 7. In order to help in the extraction of features from the time domain, frequency domain, and time–frequency domain during the machining process, the effective cutting force signals are intercepted during the machining process. Meanwhile, the empirical mode decomposition (EMD) is used to extract features in the time–frequency domain. Thus, a total of 24 signal features were extracted for each component of the cutting force. Then, it is fused with the cutting parameters as the input to the BLS model; i.e., each sample has a total of 75 features. In this case, this mode was marked as BLS2.
In spite of that, these features may be irrelevant or redundant in the process of model training, which may result in decreased prediction accuracy. Therefore, the maximum information coefficient (MIC) [30] is used to select sensitive features. The MIC can capture linear or nonlinear associations between two features. A larger value indicates a stronger dependence, and a smaller value indicates a smaller dependence. Next, all of its features are sorted by the value of MIC from large to small, and then BLS training is performed feature by feature. Finally, a total of 42 important features were selected in the AB case, and a total of 34 important features were selected in the SAT case.
Figure 8 shows the prediction results of AB and SAT samples in cutting parameter mode (BLS1) and feature fusion mode (BLS2), respectively. First, it can be seen that the prediction accuracy is different between the AB and SAT samples when using BLS1, which indicates that the material’s property will influence the prediction accuracy in this case. This is determined by the complex tool–workpiece interaction during the cutting process. Furthermore, the prediction accuracy of BLS2 in the feature fusion mode is higher than the accuracy of BLS1 in the mode that only considers the cutting parameters. To more clearly demonstrate the superiority of the feature fusion mode (BLS2) for predicting surface roughness, the prediction performance of AB and SAT in the two modes was calculated by introducing MAPE, as presented in Figure 9. It can be clearly observed that the MAPE of AB drops from 1.62% to 0.53% in the two modes, which indicates that the prediction accuracy was improved by 67.28%. In addition, the MAPE of SAT drops from 0.61% to 0.51% in the two modes, which indicates that the prediction accuracy was improved by 16.39%. This indicates that the feature fusion mode is more suitable for practical applications. Moreover, the prediction errors for the AB and SAT samples were reduced to two very close values when using BLS2. This may indicate that BLS2 can successfully eliminate the prediction errors caused by differences in material properties, indicating higher universality.

5. Conclusions

This study presented an effective approach to predicting the surface roughness of additively manufactured (AMed) high-strength maraging steel parts in subsequent machining processes. First, differences in the microstructure and mechanical properties of the steels with and without heat treatment were analyzed systematically. Furthermore, the machined surface roughness and cutting force signal were collected. Then, two broad learning systems (BLSs) were proposed to predict the surface roughness. The first one is BLS1, which only considers process parameters. The other one is BLS2, which fuses cutting parameters and cutting signal features. The results show that the prediction results based on feature fusion (BLS2) have better prediction accuracy for both AB and SAT samples. In future work, surface roughness prediction based on physics and data-driven hybrid additive and subtractive manufacturing will be a promising hot spot. The primary contributions are summarized as follows:
(1)
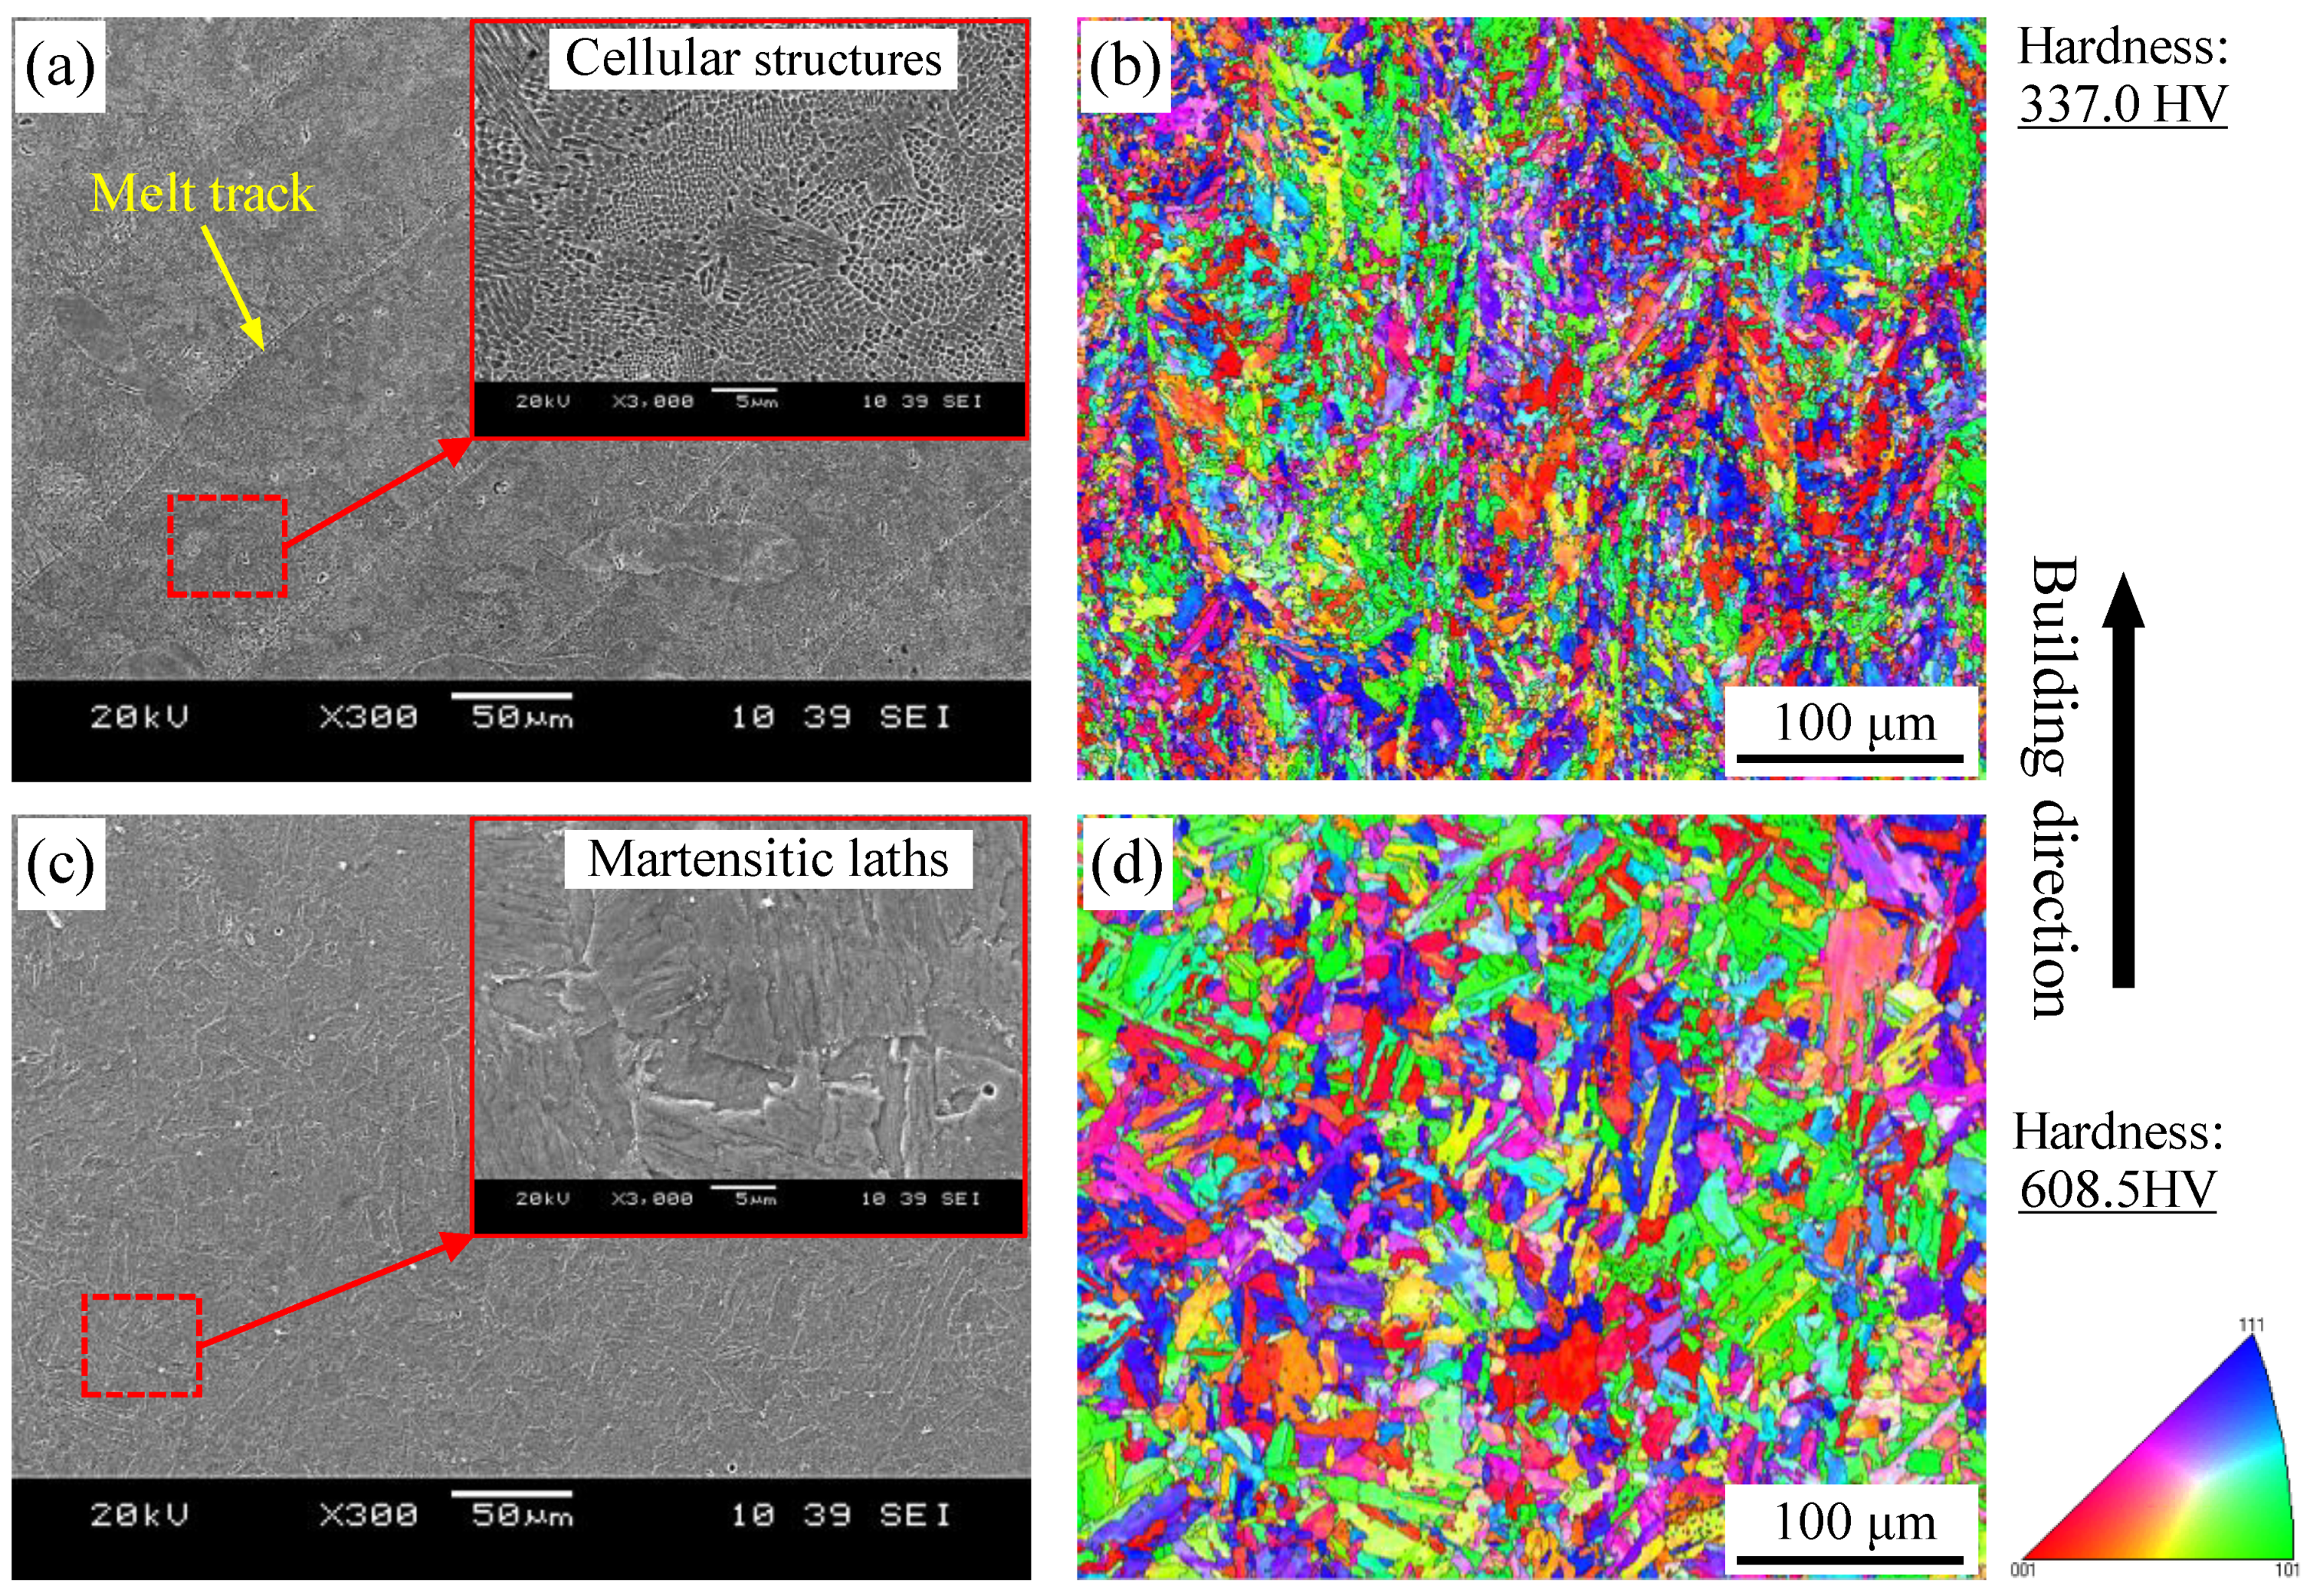
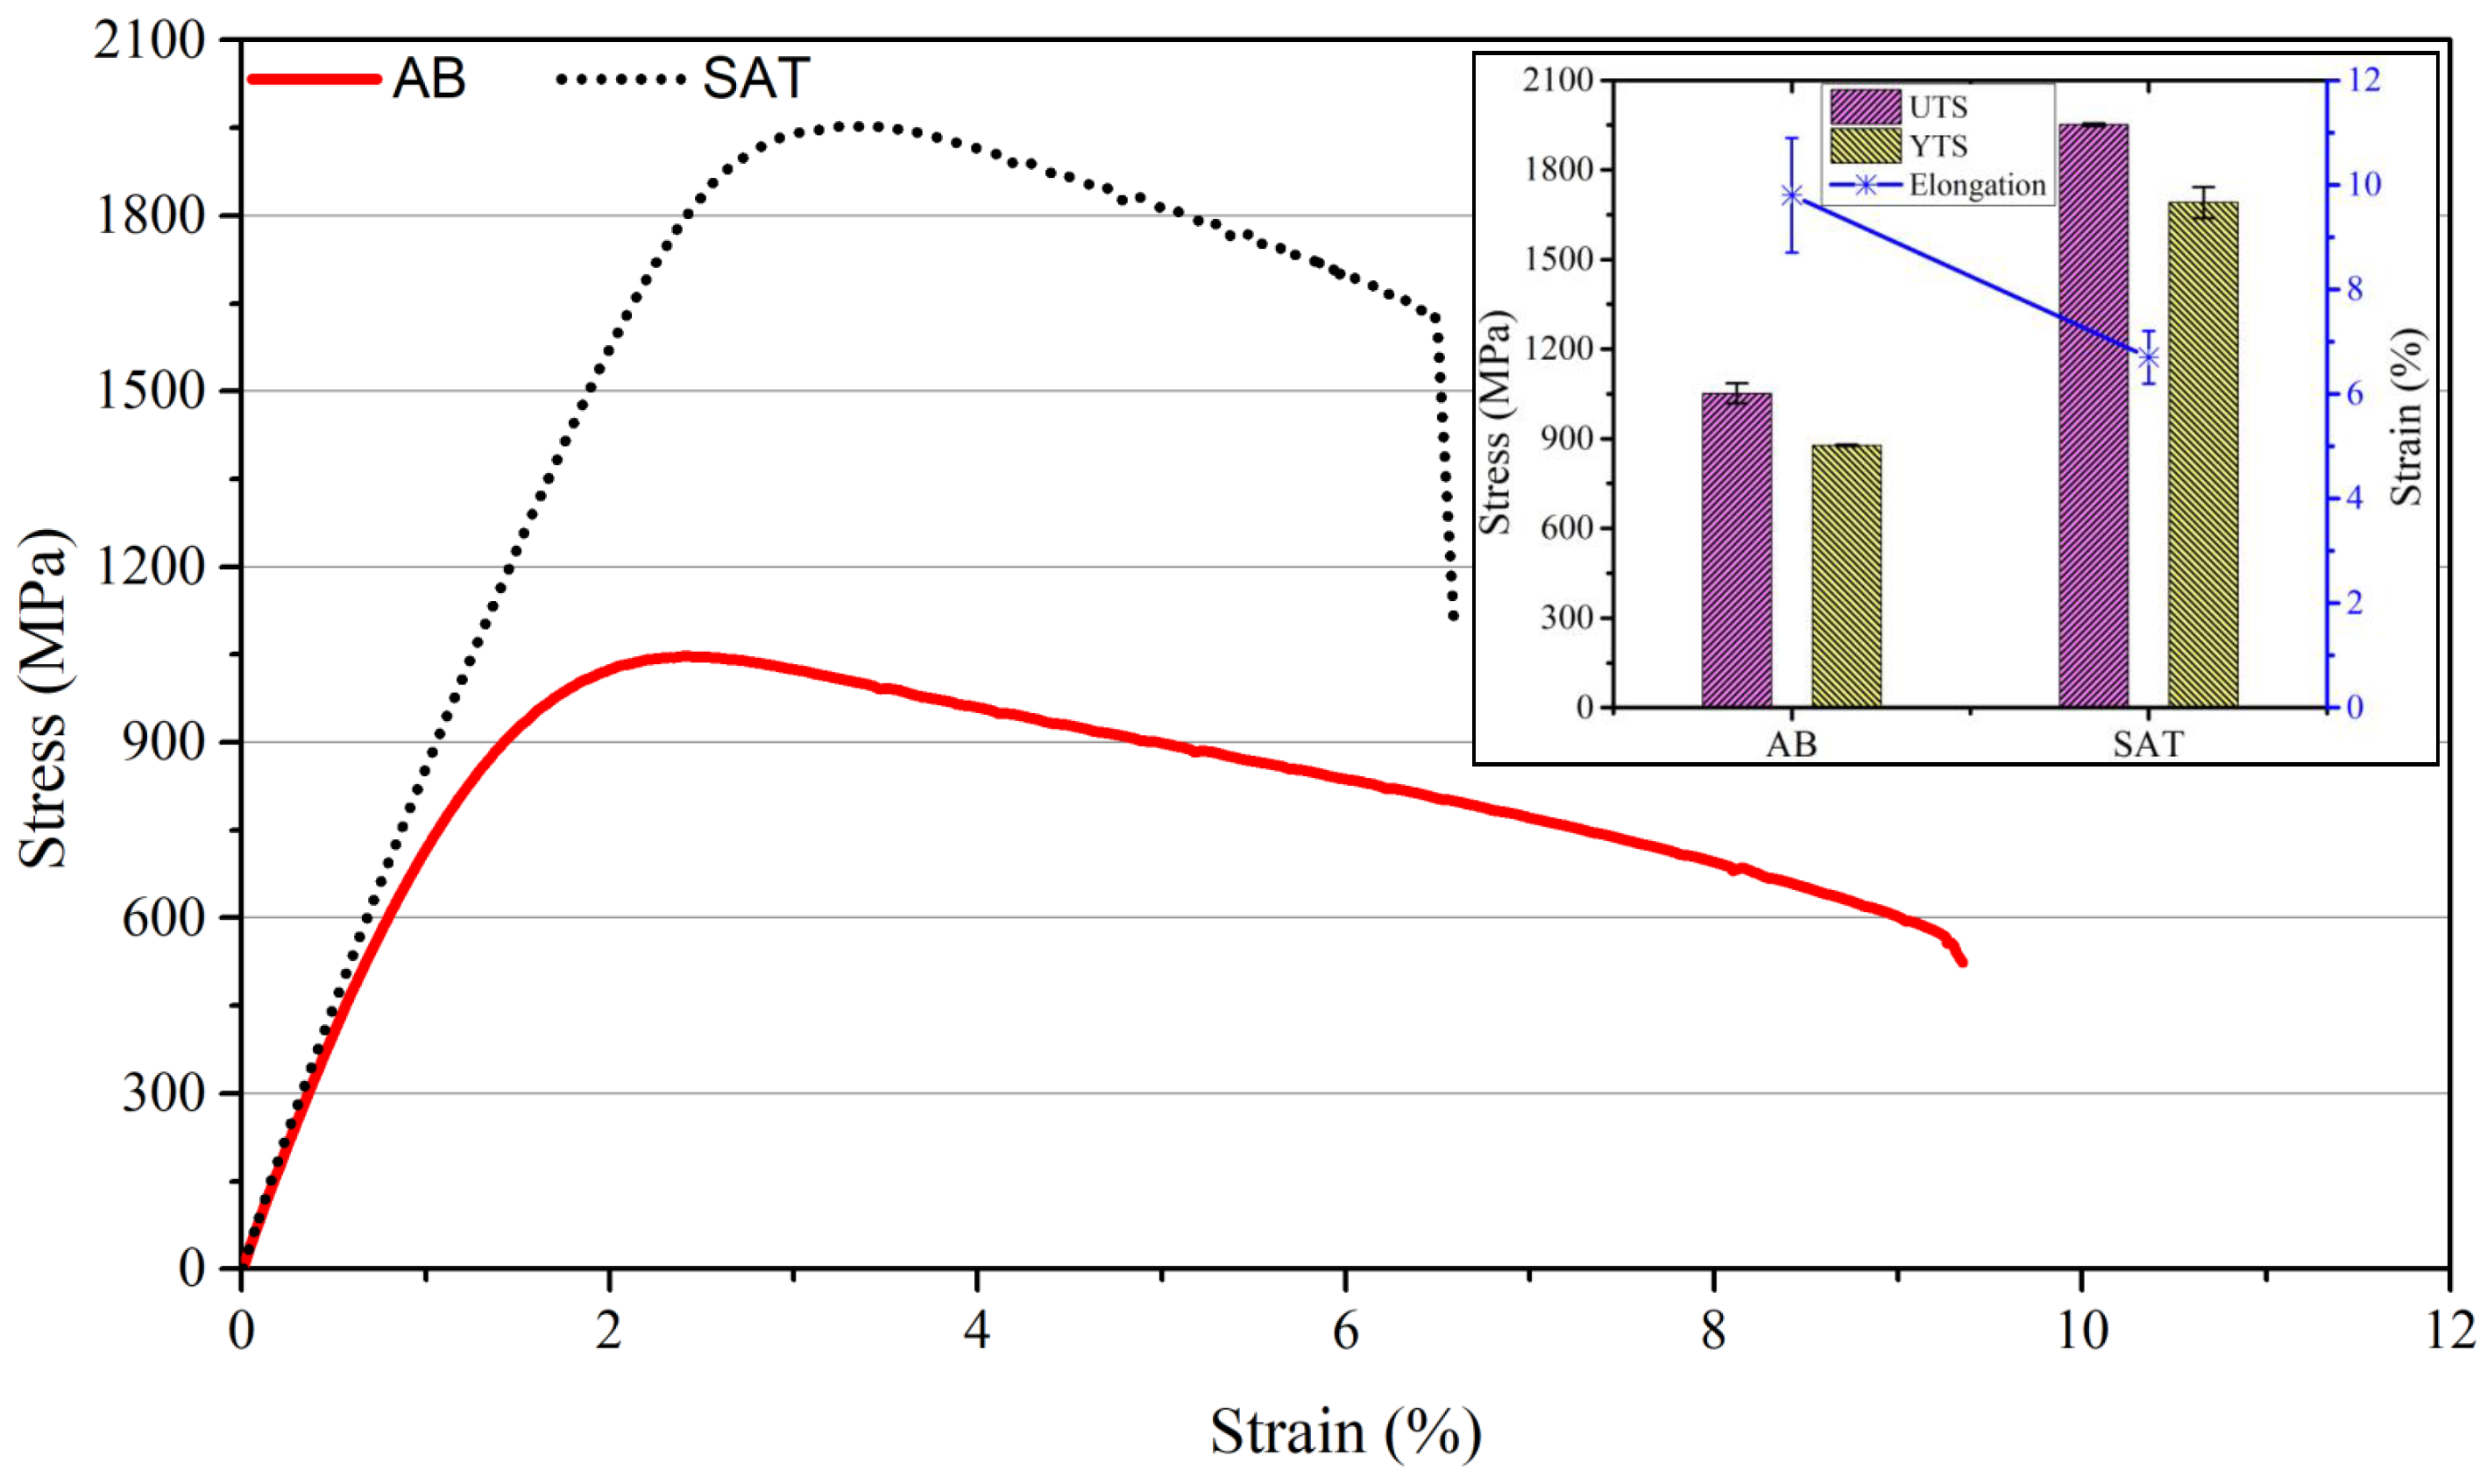
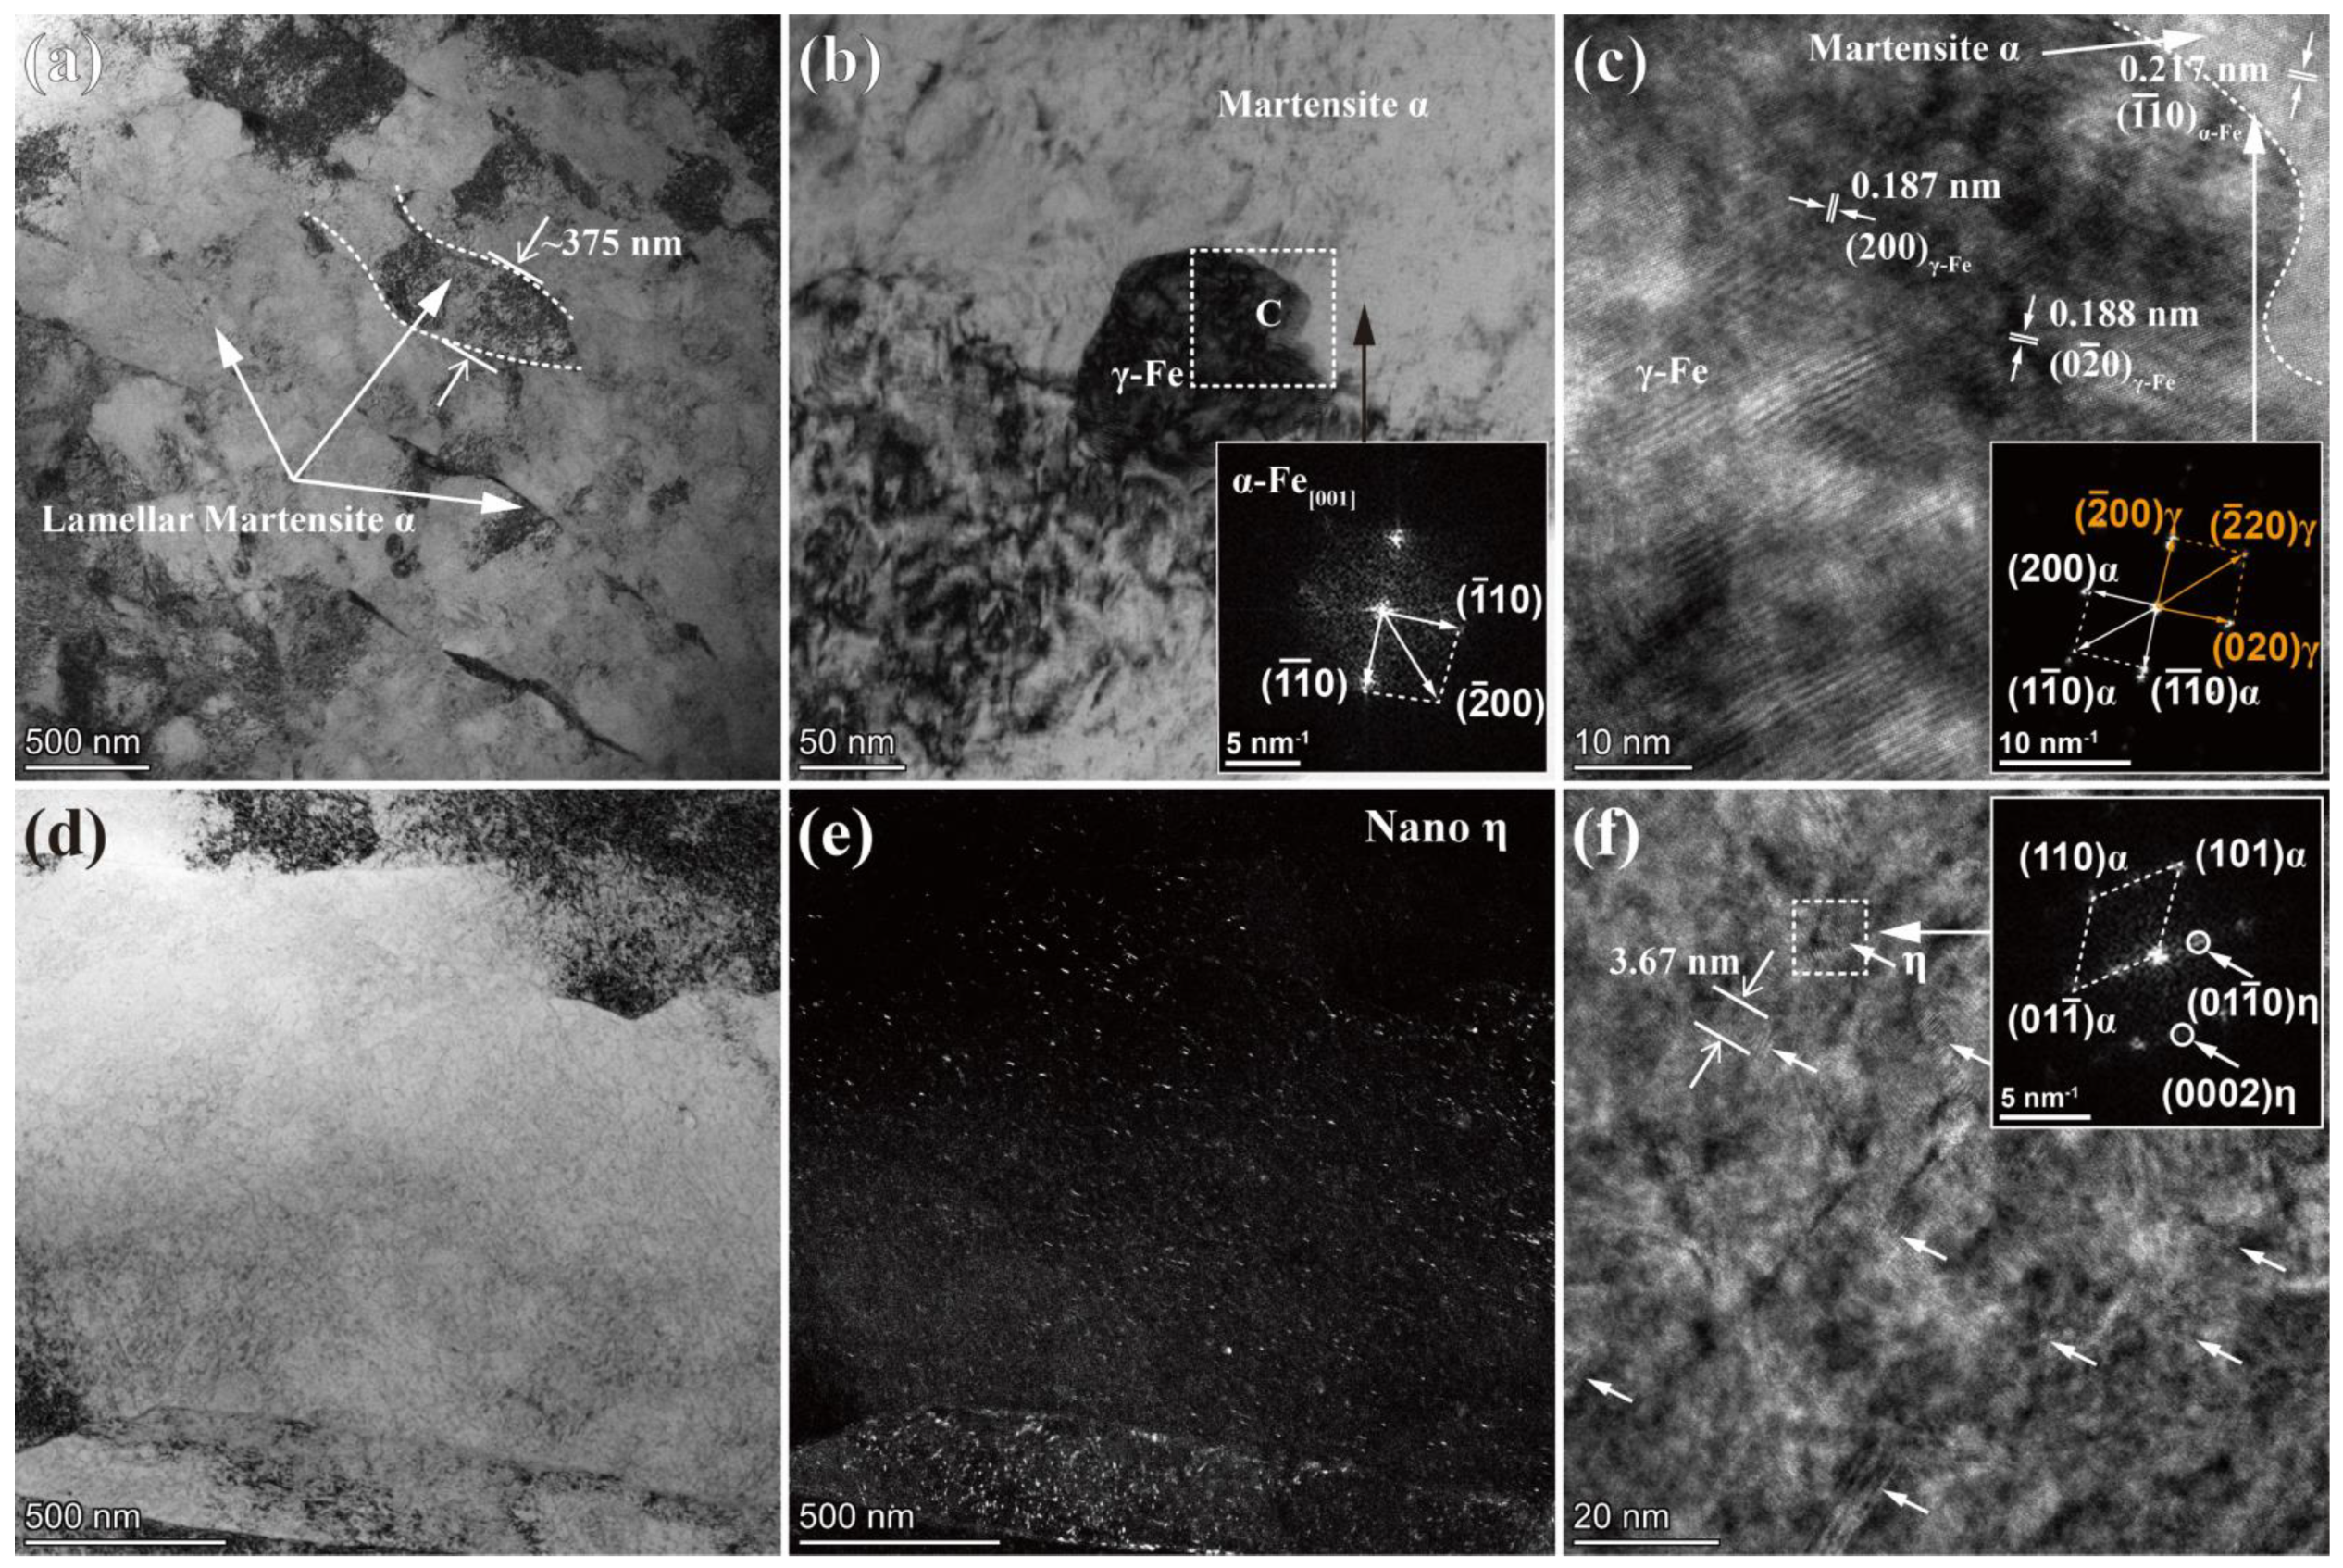
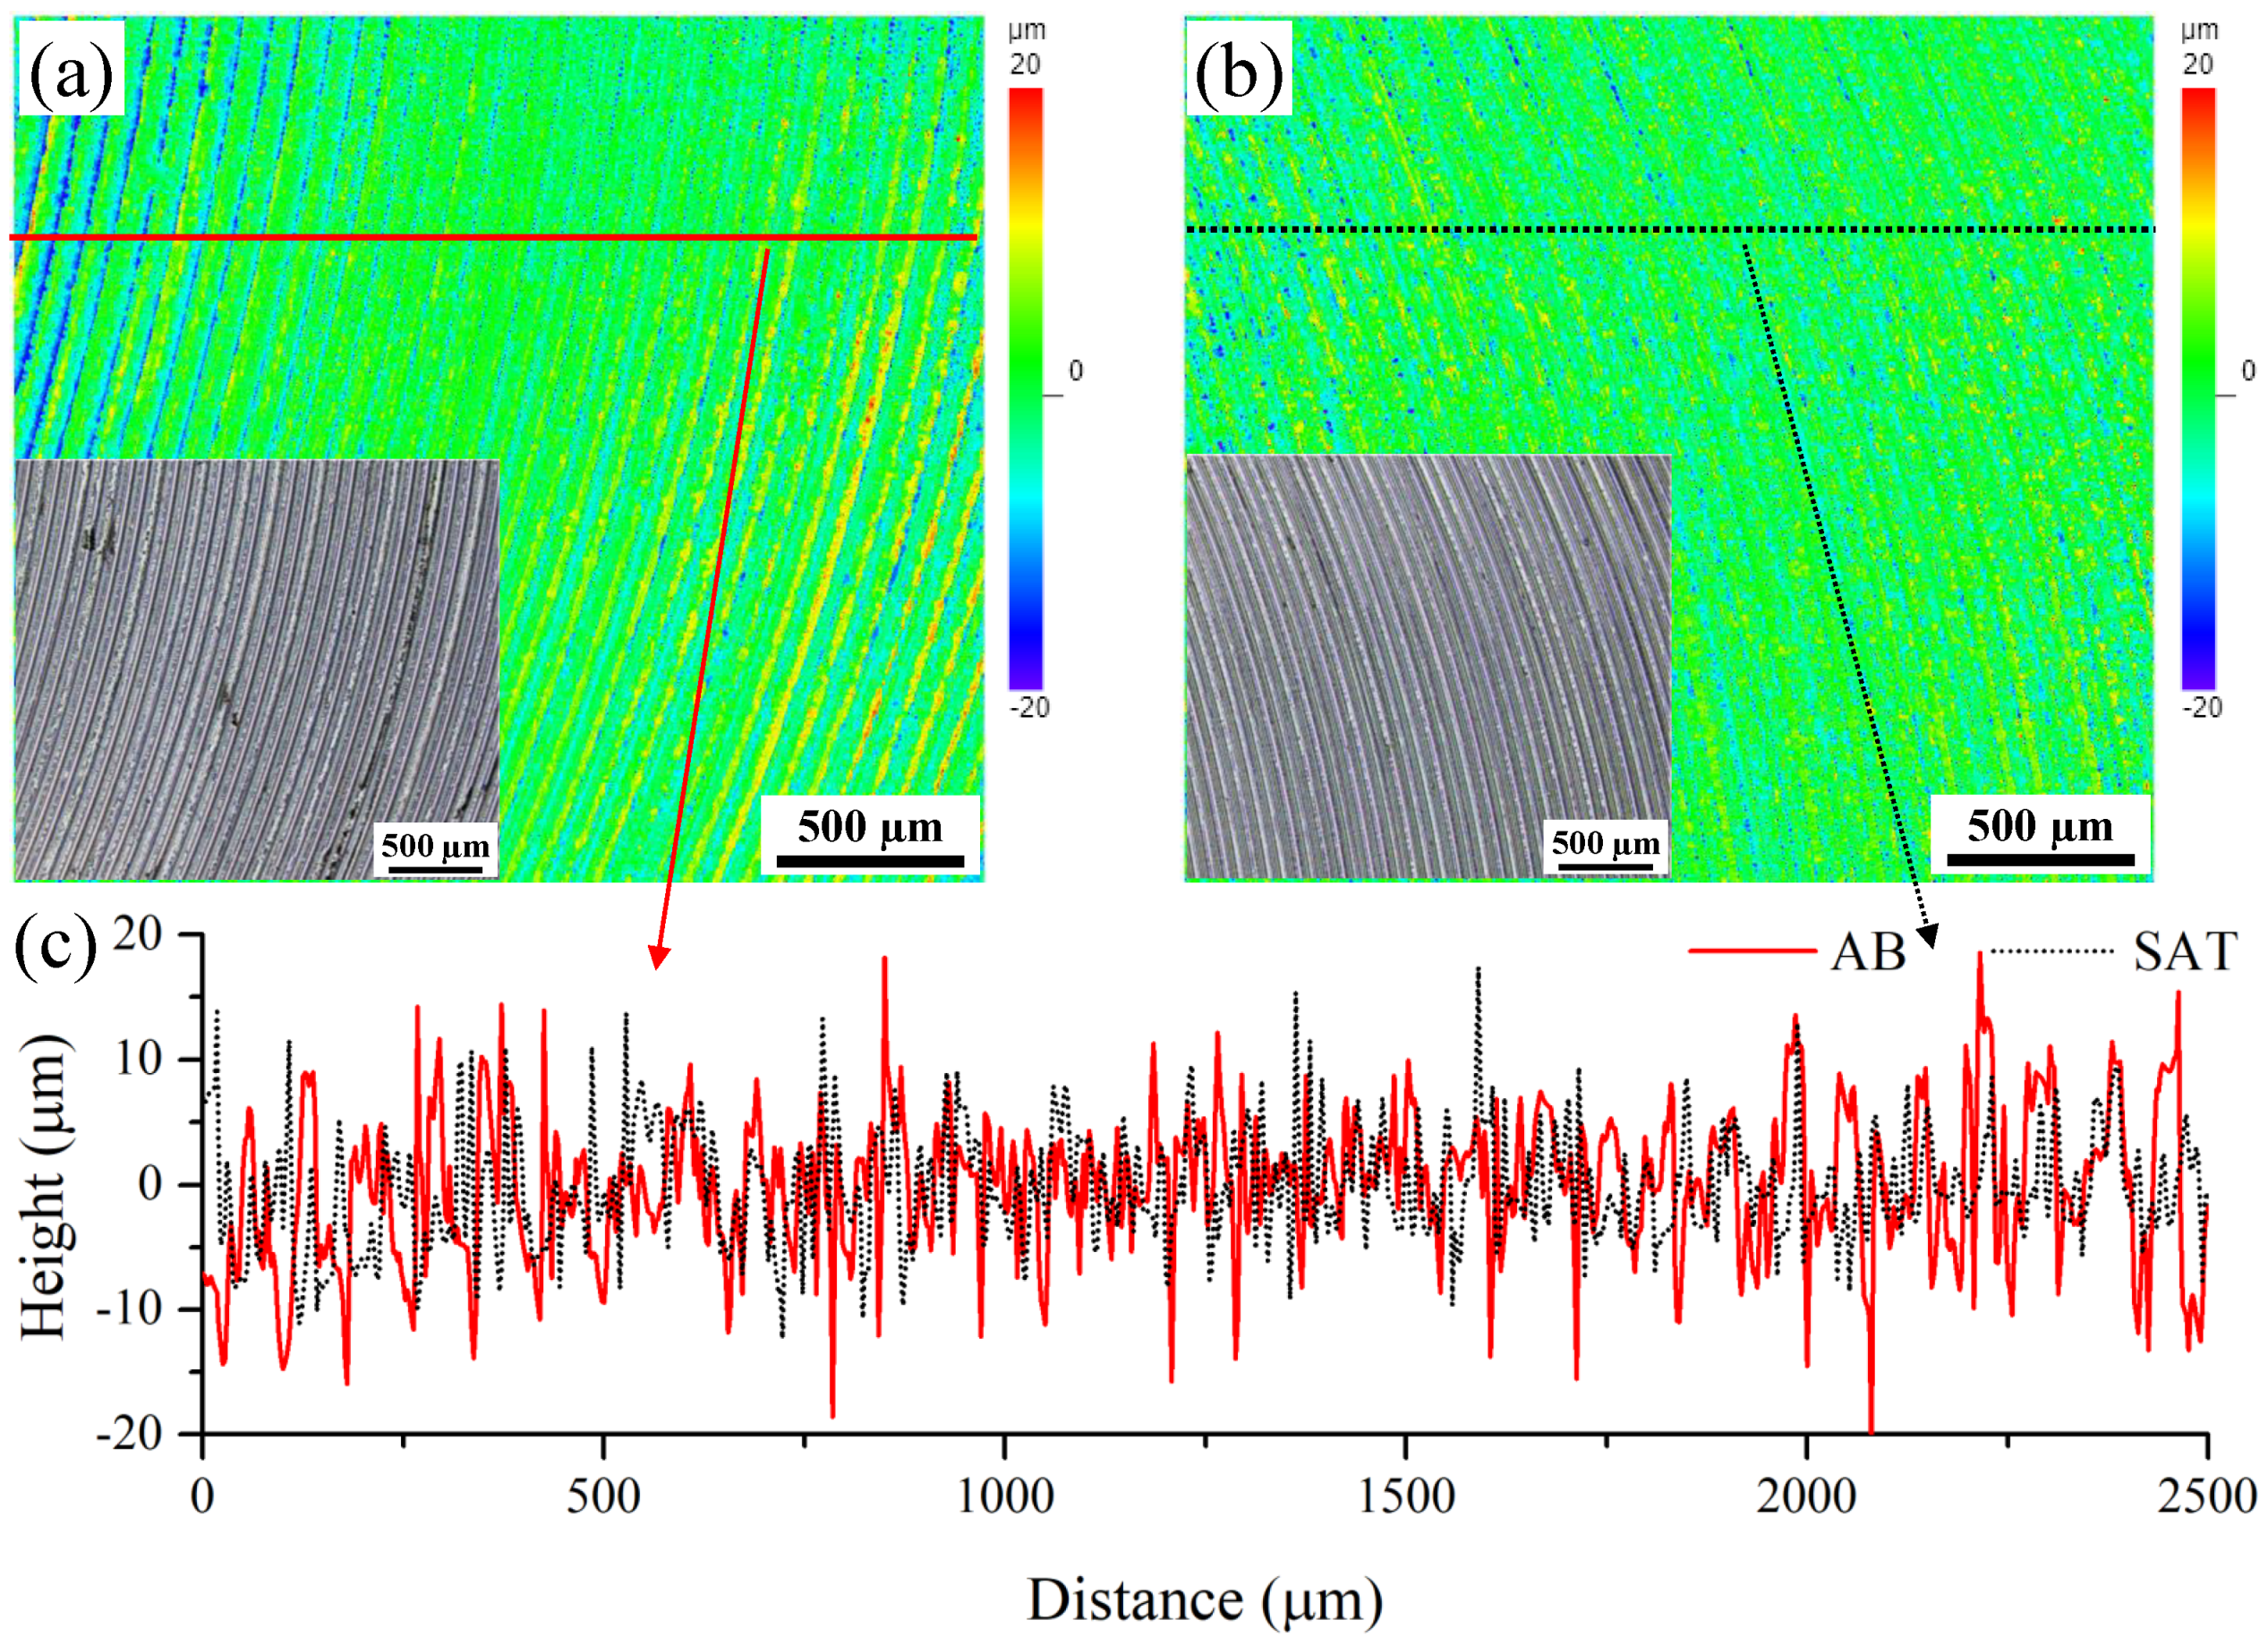
The as-built (AB) LPBFed managing steel is characterized by fine cellular structures and equiaxed and columnar grains. In contrast, the solution aging-treated (SAT) sample has typical martensite laths and uniform polygon grains. In addition, a larger number of nano-scaled particles are formed in the SAT sample. As a result, the SAT sample has much higher strength but lower plasticity, which results in different machined surface quality during the milling process.
(2)
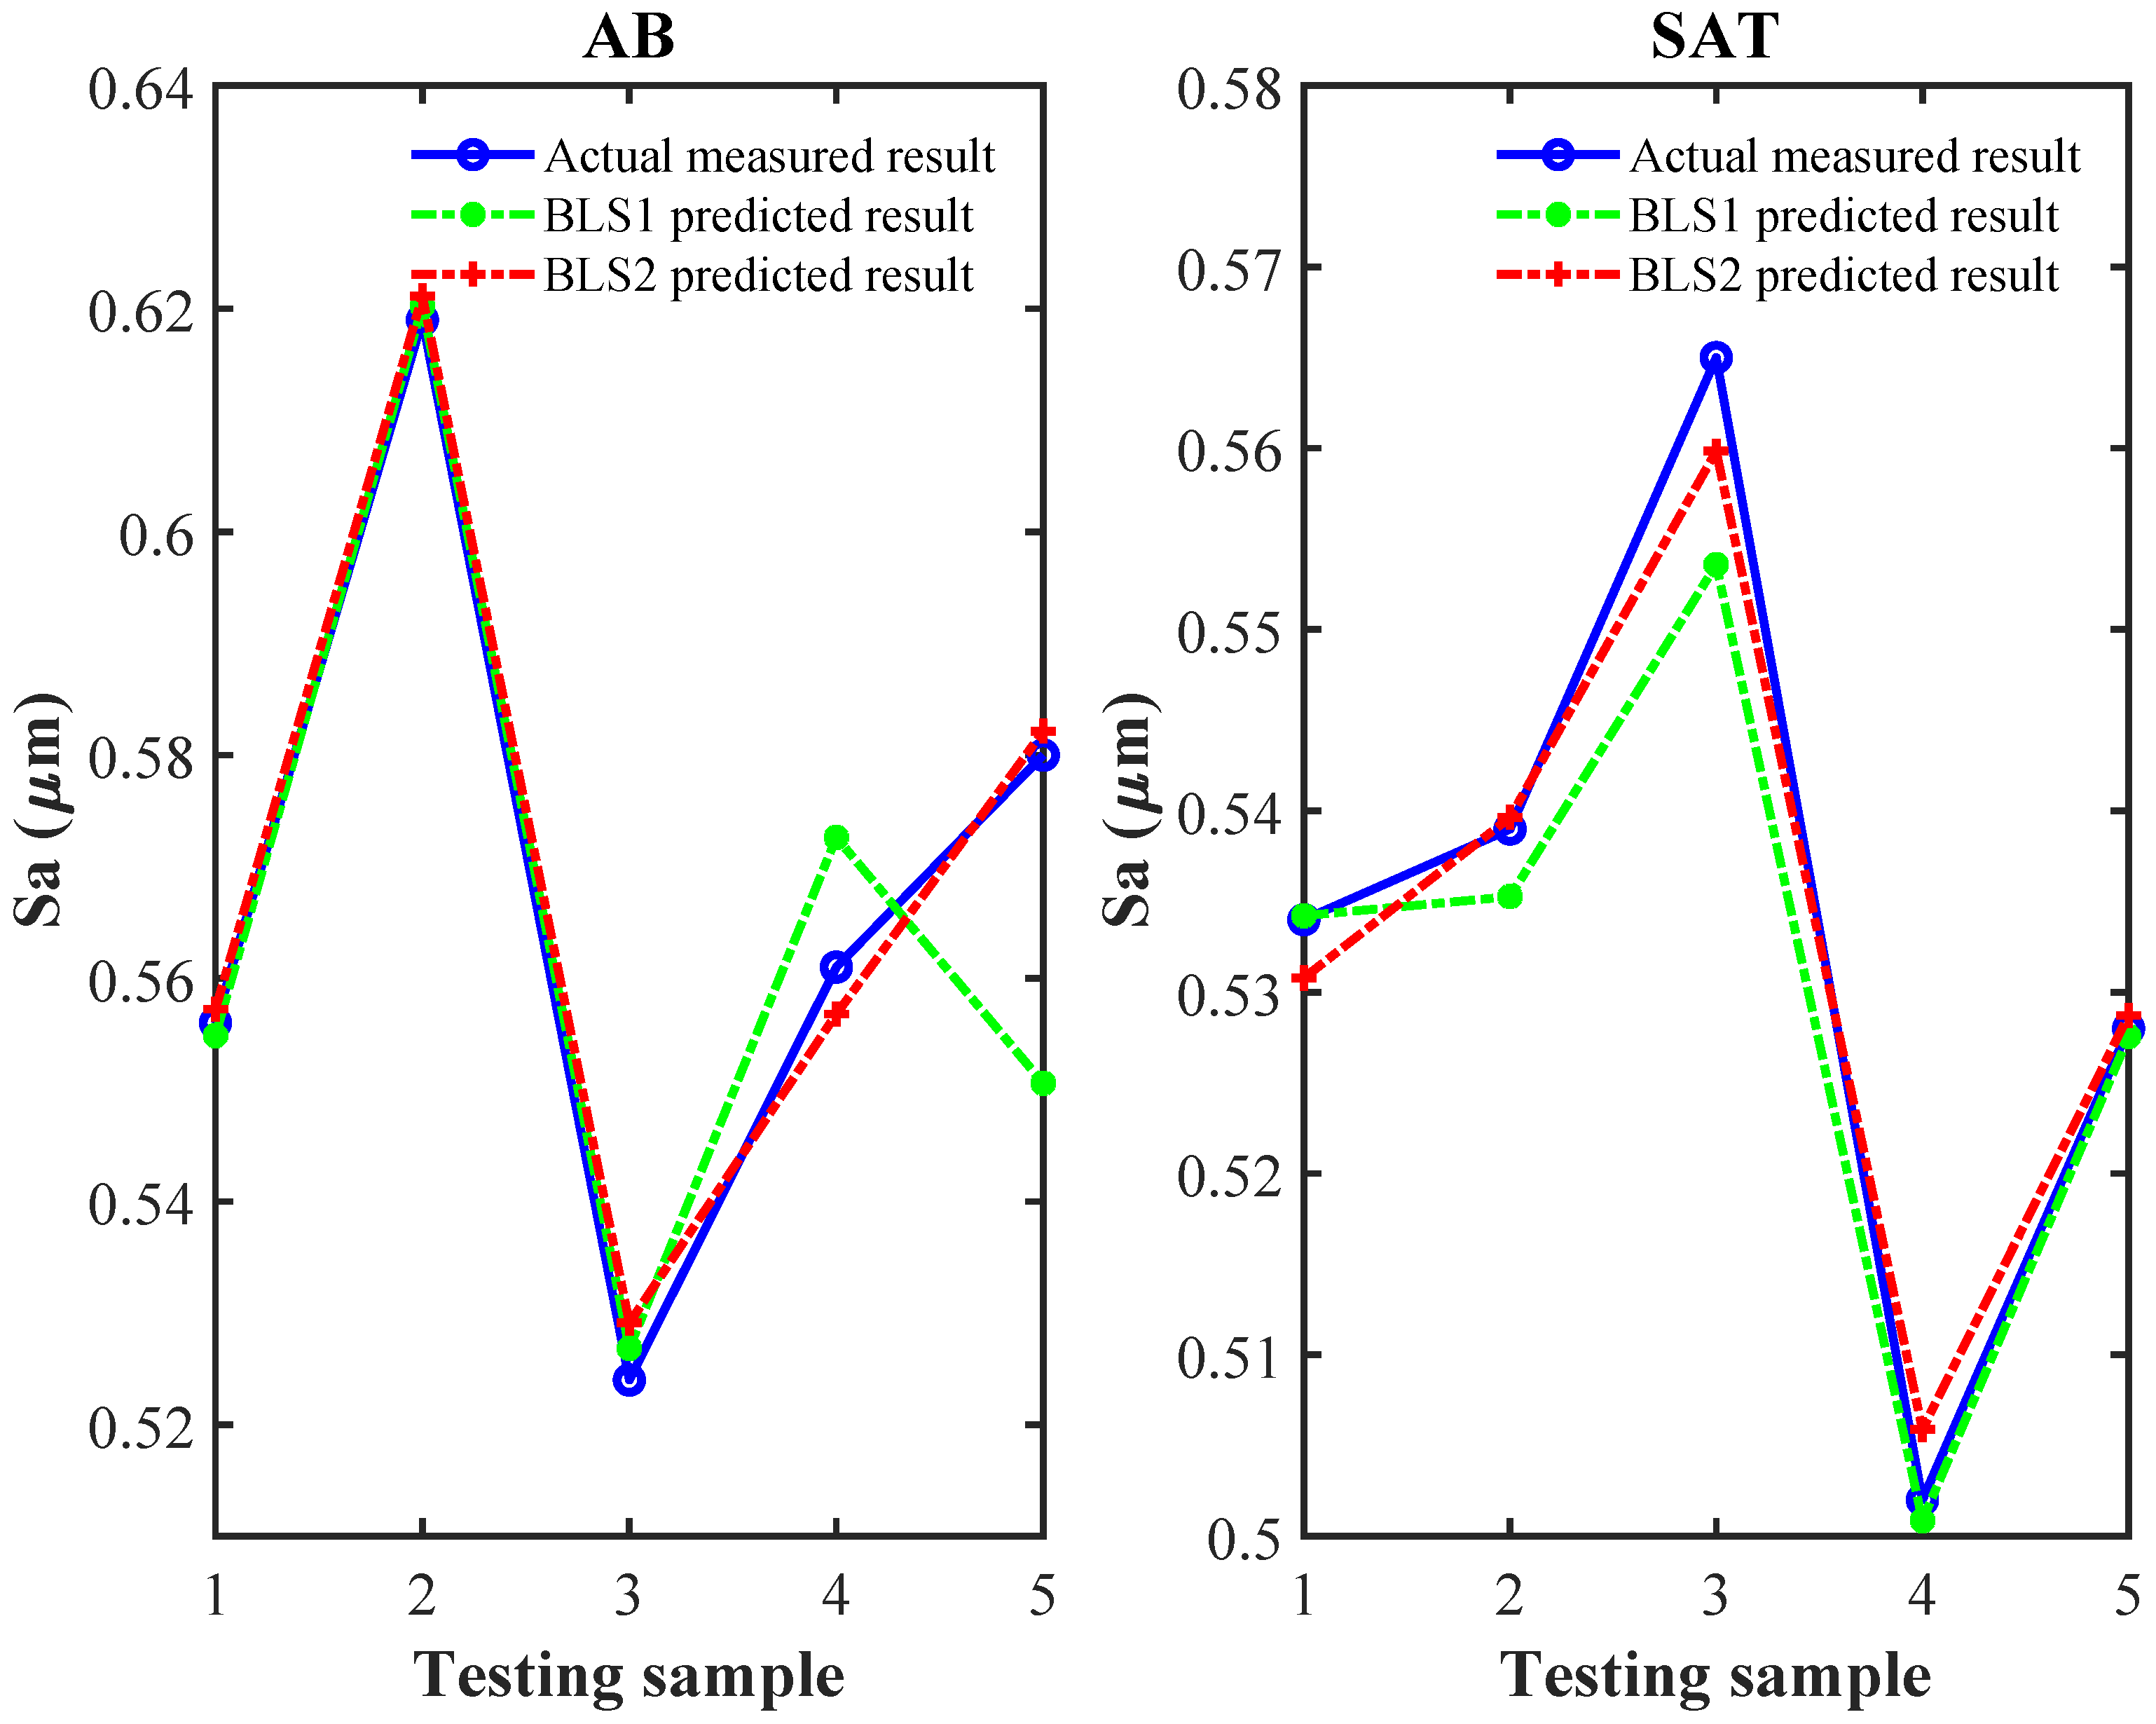
The BLS was proposed to predict the surface roughness of machined AMed workpieces under AB and SAT states. The prediction accuracy is closely related to the material properties, especially when only process parameters are considered. The results show that the mean absolute percentage error (MAPE) values of predicting the AB sample with low strength and SAT samples with high strength using BLS1 (only considering process parameters) are 1.62% and 0.61%, respectively.
(3)
The prediction accuracy was significantly improved by fusing cutting force signal features and process parameters compared to only considering process parameters, where the MAPE values for predicting surface roughness in both machined AB and SAT components saw significant reductions, with a remarkable 67.28% decrease for AB parts and a notable 16.39% decrease for SAT parts, resulting in values of 0.53% and 0.51%, respectively.

Author Contributions

Conceptualization, C.Z., W.T. and Y.B.; methodology, C.Z. and W.T.; software, W.T. and Y.B.; validation, C.Z. and Q.Y.; formal analysis, Q.Y.; investigation, C.Z. and W.T.; resources, Y.B.; data curation, Q.Y. and Y.B.; writing—original draft preparation, C.Z. and W.T.; writing—review and editing, Y.B.; visualization, W.T. and Y.B.; supervision, Y.B.; project administration, C.Z.; funding acquisition, Y.B. All authors have read and agreed to the published version of the manuscript.

Funding

This work was supported in part by the Guangdong Basic and Applied Basic Research Foundation (2023A1515110594, 2024A1515012049), in part by the Gansu Provincial Department of Education: University Teacher Innovation Fund Project under Grant No. 2024B-056, and in part by the Youth Science Foundation of Lanzhou Jiaotong University under Grant No. 2024043.

Institutional Review Board Statement

Not applicable.

Informed Consent Statement

Not applicable.

Data Availability Statement

The data presented in this study are available on request from the corresponding author.

Conflicts of Interest

The authors declare no conflicts of interest.

References

  1. Gibson, I.; Rosen, D.; Stucker, B.; Khorasani, M. Additive Manufacturing Technologies; Springer: Cham, Switzerland, 2021. [Google Scholar]
  2. Srivastava, M.; Rathee, S. Additive manufacturing: Recent trends, applications and future outlooks. Prog. Addit. Manuf. 2022, 7, 261–287. [Google Scholar] [CrossRef]
  3. Sing, S.L.; Yeong, W.Y. Laser powder bed fusion for metal additive manufacturing: perspectives on recent developments. Virtual Phys. Prototyp. 2020, 15, 359–370. [Google Scholar] [CrossRef]
  4. Bai, Y.; Lee, Y.J.; Guo, Y.; Yan, Q.; Zhao, C.; Kumar, A.S.; Xue, J.M.; Wang, H. Efficient post-processing of additive manufactured maraging steel enhanced by the mechanochemical effect. Int. J. Mach. Tools Manuf. 2023, 193, 104086. [Google Scholar] [CrossRef]
  5. Zhang, T.; Yuan, L. Understanding surface roughness on vertical surfaces of 316 L stainless steel in laser powder bed fusion additive manufacturing. Powder Technol. 2022, 411, 117957. [Google Scholar] [CrossRef]
  6. Liu, H.; Ye, M.; Ye, Z.; Wang, L.; Wang, G.; Shen, X.; Xu, P.; Wang, C. High-quality surface smoothening of laser powder bed fusion additive manufacturing AlSi10Mg via intermittent electrochemical polishing. Surf. Coatings Technol. 2022, 443, 128608. [Google Scholar] [CrossRef]
  7. Bai, Y.; Zhao, C.; Yang, J.; Hong, R.; Weng, C.; Wang, H. Microstructure and machinability of selective laser melted high-strength maraging steel with heat treatment. J. Mater. Process. Technol. 2021, 288, 116906. [Google Scholar] [CrossRef]
  8. Du, W.; Bai, Q.; Zhang, B. A novel method for additive/subtractive hybrid manufacturing of metallic parts. Procedia Manuf. 2016, 5, 1018–1030. [Google Scholar] [CrossRef]
  9. Xia, C.; Pan, Z.; Polden, J.; Li, H.; Xu, Y.; Chen, S. Modelling and prediction of surface roughness in wire arc additive manufacturing using machine learning. J. Intell. Manuf. 2022, 33, 1467–1482. [Google Scholar] [CrossRef]
  10. Benardos, P.; Vosniakos, G.C. Predicting surface roughness in machining: A review. Int. J. Mach. Tools Manuf. 2003, 43, 833–844. [Google Scholar] [CrossRef]
  11. Lo, S.P. An adaptive-network based fuzzy inference system for prediction of workpiece surface roughness in end milling. J. Mater. Process. Technol. 2003, 142, 665–675. [Google Scholar] [CrossRef]
  12. Zain, A.M.; Haron, H.; Sharif, S. Prediction of surface roughness in the end milling machining using Artificial Neural Network. Expert Syst. Appl. 2010, 37, 1755–1768. [Google Scholar] [CrossRef]
  13. Chiu, H.W.; Lee, C.H. Prediction of machining accuracy and surface quality for CNC machine tools using data driven approach. Adv. Eng. Softw. 2017, 114, 246–257. [Google Scholar] [CrossRef]
  14. Karkalos, N.; Galanis, N.; Markopoulos, A. Surface roughness prediction for the milling of Ti–6Al–4V ELI alloy with the use of statistical and soft computing techniques. Measurement 2016, 90, 25–35. [Google Scholar] [CrossRef]
  15. Wu, T.; Lei, K. Prediction of surface roughness in milling process using vibration signal analysis and artificial neural network. Int. J. Adv. Manuf. Technol. 2019, 102, 305–314. [Google Scholar] [CrossRef]
  16. Li, Z.; Zhang, Z.; Shi, J.; Wu, D. Prediction of surface roughness in extrusion-based additive manufacturing with machine learning. Robot. -Comput.-Integr. Manuf. 2019, 57, 488–495. [Google Scholar] [CrossRef]
  17. Rifai, A.P.; Aoyama, H.; Tho, N.H.; Dawal, S.Z.M.; Masruroh, N.A. Evaluation of turned and milled surfaces roughness using convolutional neural network. Measurement 2020, 161, 107860. [Google Scholar] [CrossRef]
  18. Kong, D.; Zhu, J.; Duan, C.; Lu, L.; Chen, D. Surface roughness prediction using kernel locality preserving projection and Bayesian linear regression. Mech. Syst. Signal Process. 2021, 152, 107474. [Google Scholar] [CrossRef]
  19. Zhang, T.; Guo, X.; Fan, S.; Li, Q.; Chen, S.; Guo, X. AMS-Net: Attention mechanism based multi-size dual light source network for surface roughness prediction. J. Manuf. Processes 2022, 81, 371–385. [Google Scholar] [CrossRef]
  20. Tian, W.; Zhao, F.; Sun, Z.; Zhang, J.; Gong, C.; Mei, X.; Chen, G.; Wang, H. Prediction of surface roughness using fuzzy broad learning system based on feature selection. J. Manuf. Syst. 2022, 64, 508–517. [Google Scholar] [CrossRef]
  21. Liu, L.; Zhang, X.; Wan, X.; Zhou, S.; Gao, Z. Digital twin-driven surface roughness prediction and process parameter adaptive optimization. Adv. Eng. Inform. 2022, 51, 101470. [Google Scholar] [CrossRef]
  22. Chen, C.P.; Liu, Z. Broad learning system: An effective and efficient incremental learning system without the need for deep architecture. IEEE Trans. Neural Netw. Learn. Syst. 2017, 29, 10–24. [Google Scholar] [CrossRef] [PubMed]
  23. Tian, W.; Zhao, F.; Min, C.; Feng, X.; Liu, R.; Mei, X.; Chen, G. Broad Learning System Based on Binary Grey Wolf Optimization for Surface Roughness Prediction in Slot Milling. IEEE Trans. Instrum. Meas. 2022, 71, 2502310. [Google Scholar] [CrossRef]
  24. Bertsch, K.; De Bellefon, G.M.; Kuehl, B.; Thoma, D. Origin of dislocation structures in an additively manufactured austenitic stainless steel 316L. Acta Mater. 2020, 199, 19–33. [Google Scholar] [CrossRef]
  25. Marattukalam, J.J.; Karlsson, D.; Pacheco, V.; Beran, P.; Wiklund, U.; Jansson, U.; Hjörvarsson, B.; Sahlberg, M. The effect of laser scanning strategies on texture, mechanical properties, and site-specific grain orientation in selective laser melted 316L SS. Mater. Des. 2020, 193, 108852. [Google Scholar] [CrossRef]
  26. Fernandez-Zelaia, P.; Rossy, A.M.; Campbell, Q.; Nycz, A.; Ledford, C.; Kirka, M.M. Austenitic parent grain reconstruction in martensitic steel using deep learning. Mater. Charact. 2022, 185, 111759. [Google Scholar] [CrossRef]
  27. Seede, R.; Zhang, B.; Whitt, A.; Picak, S.; Gibbons, S.; Flater, P.; Elwany, A.; Arroyave, R.; Karaman, I. Effect of heat treatments on the microstructure and mechanical properties of an ultra-high strength martensitic steel fabricated via laser powder bed fusion additive manufacturing. Addit. Manuf. 2021, 47, 102255. [Google Scholar] [CrossRef]
  28. Xiong, Z.; Timokhina, I.; Pereloma, E. Clustering, nano-scale precipitation and strengthening of steels. Prog. Mater. Sci. 2021, 118, 100764. [Google Scholar] [CrossRef]
  29. Li, Z.; Zhao, P.; Lu, T.; Feng, K.; Tong, Y.; Sun, B.; Yao, N.; Xie, Y.; Han, B.; Zhang, X.; et al. Effects of post annealing on the microstructure, precipitation behavior, and mechanical property of a (CoCrNi) 94Al3Ti3 medium-entropy alloy fabricated by laser powder bed fusion. J. Mater. Sci. Technol. 2023, 135, 142–155. [Google Scholar] [CrossRef]
  30. Reshef, D.N.; Reshef, Y.A.; Finucane, H.K.; Grossman, S.R.; McVean, G.; Turnbaugh, P.J.; Lander, E.S.; Mitzenmacher, M.; Sabeti, P.C. Detecting novel associations in large data sets. Science 2011, 334, 1518–1524. [Google Scholar] [CrossRef]
Figure 1. Diagram of the broad learning system.
Coatings 15 00566 g001
Figure 2. Experimental setup for (a) additive manufacturing and (b) milling maraging steel.
Coatings 15 00566 g002
Figure 3. (a,c) SEM and (b,d) inverse pole figures of the (a,b) AB and (c,d) SAT LPBFed maraging steel parts.
Coatings 15 00566 g003
Figure 4. Tensile stress–strain curves and results of the LPBFed maraging steel parts with and without heat treatment.
Coatings 15 00566 g004
Figure 5. TEM analysis of the (ac) AB and (df) SAT LPBFed maraging steel parts: (a,d) bright-field TEM (BFTEM) images; (b) BFTEM image of γ -Fe with inset fast Fourier transform (FFT) image; (c,f) high-resolution TEM (HRTEM) image of nanoparticles with inset fast Fourier transform (FFT) image; and (e) dark-field (DF) image corresponding to (d).
Coatings 15 00566 g005
Figure 6. Machined surface morphologies of the (a) AB and (b) SAT samples, and the corresponding (c) surface line profiles under the following cutting parameters: cutting speed of 250 m/min, feed per tooth of 80 μm, and depth of cut of 100 μm.
Coatings 15 00566 g006
Figure 7. Cutting force component signals along the X, Y, and Z directions of the force sensor from sample 6 in Table 3.
Coatings 15 00566 g007
Figure 8. Prediction results of BLS1 and BLS2 on the surface roughness of AB and SAT samples.
Coatings 15 00566 g008
Figure 9. Comparison of prediction performance between BLS1 and BLS2.
Coatings 15 00566 g009
Table 1. The process parameters for preparing the maraging steel parts in this study.
ParametersValues
Laser power (W)205
Scanning speed (mm/s)800
Layer thickness (μm)30
Hatch distance (μm)80
Table 2. Factors and levels for model training and testing on the AB and SAT AMed maraging steel (α = 1.682).
FactorsLevel
α101α
Cutting speed ( m / min )115.9150200250284.1
Feed per tooth (μm/r)39.180140200240.9
Depth of cut (μm)31.8100200300368.2
Table 3. Experimental results.
Cutting ParametersSa (μm)Status
Cutting Speed (m/min)Feed Per Tooth (μm/r)Depth of Cut (μm)ABSAT
150801000.5250.574Training
250801000.6400.491Training
1502001000.5710.516Training
2502001000.6370.525Training
150803000.6190.539Testing
350803000.5240.565Testing
1502003000.5870.510Training
2502003000.5680.530Training
115.91402000.5280.531Training
284.11402000.5610.502Testing
20039.12000.5560.534Testing
200240.92000.5350.512Training
20014031.80.5700.502Training
200140368.20.5560.537Training
2001402000.5290.557Training
2001402000.5150.540Training
2001402000.5800.528Testing
2001402000.5360.544Training
2001402000.6050.486Training
2001402000.5680.527Training
Disclaimer/Publisher’s Note: The statements, opinions and data contained in all publications are solely those of the individual author(s) and contributor(s) and not of MDPI and/or the editor(s). MDPI and/or the editor(s) disclaim responsibility for any injury to people or property resulting from any ideas, methods, instructions or products referred to in the content.

