Abstract
The in situ electrochemical behaviors of Ti-39Nb-6Zr alloy were investigated in 2.3 ppm Li+ and 1500 ppm B3+ solution at 300 °C and 14 MPa. The activation energy is 12.84 kJ/mol, and the oxidation of titanium is controlled by oxygen ions diffusion in the liquid phases. The morphology, phase structure, and composition of the oxide film after 700 h exposure time in 300 °C and 14 MPa solution were characterized. The oxide film mainly included anatase TiO2 phases, ZrO2, Nb2O5, and a slight B2O3. The morphology of the film is shown by many nanocrystalline grains and the thickness is about 5 μm. The passivation film on the alloy substrate transforms from a single-layer film structure to a double-layer film structure. The impedance of the passivation decreases with the increase in temperature, which is related to the enhanced ion conductivity of the passivation film at high temperatures. The impedance of the dense layer inside the passivation film is much greater than that of the loose layer outside, and the dense layer inside plays a crucial role in the corrosion resistance of the Ti-39Nb-6Zr alloy. During the insulation process, the impedance of the dense layer inside the passivation film first increases and then slowly decreases, and the corrosion resistance of the passivation film first increases and decreases.
1. Introduction
Nuclear energy is known for its clean, safe, and high energy density, making it an important breakthrough in addressing the depletion of renewable energy and environmental pollution. In nuclear reactors, the outer surface temperature of the nuclear fuel cladding is between 255–330 °C, and the pressure is between 7–15 MPa [1]. In PWRs (pressurized water reactors), the recirculating cooling water contains 0–2200 ppm of B3+ (in the form of H3BO3) and 0.05–5 ppm of Li (in the form of LiOH). B3+ acts as a neutron moderator [2], while LiOH is mainly used to adjust the pH value of the cooling water. The cladding is subject to corrosion from high-temperature, high-pressure recirculating cooling water, leading to the accumulation of corrosion products that form a thick oxide layer, which reduces the effective thickness of the cladding material, potentially causing the failure of the cladding tubes. Additionally, the cladding material is affected by neutron irradiation damage from nuclear fission, hydrogen-induced corrosion, and fretting wear, all of which can shorten the lifespan of the cladding tubes and even lead to nuclear leakage accidents [3,4,5,6].
Currently, commercial reactors primarily use stainless steel, nickel alloys, and zirconium alloys (such as Zr-2, Zr-4) as cladding materials due to their low thermal neutron absorption cross-section, good corrosion resistance, and compatibility with nuclear fuel [7,8,9,10,11]. However, zirconium alloys have poor corrosion resistance in high-temperature, high-pressure cooling water environments and are prone to hydrogen embrittlement under irradiation conditions, limiting their lifespan. Titanium–niobium–zirconium (Ti-Nb-Zr) alloy, on the other hand, has a low Young’s modulus and high strength, making it perform well in aerospace and biomedical fields. Additionally, this alloy exhibits good corrosion resistance and radiation tolerance, suggesting potential applications in the nuclear energy sector. While Ti-Nb-Zr titanium alloy shows advantages in corrosion resistance and radiation damage, its performance in high-temperature, high-pressure cooling water environments still requires further research and validation.
Some researchers study corrosion resistance of titanium alloy in a high-temperature and high-pressure solution environment such as supercritical water or sulfuric or acid solution by gravimetric or electrochemical tests [12,13,14]. Hu and Gurrappa [15,16] found that the oxide film on titanium alloy has good resistance performance for hydrogen permeation and the pitting corrosion. So, it is important to explore the growth of oxide film and the corrosion mechanism in a high-temperature and high-pressure water environment.
Despite the potential of titanium alloy, its application in nuclear power plants faces several challenges. The corrosion kinetics of cladding materials typically use ex situ coupon tests, where samples are periodically removed and weighed to assess high-temperature corrosion performance. Yet, they have inherent limitations: (1) the corrosion products may detach during testing, leading to significant discrepancies between measured and actual corrosion rates; (2) periodic sample removal for weighing increases experimental complexity and may introduce other influencing factors, such as stress redistribution during heating and cooling cycles [17]; (3) ex situ coupon tests provide only average corrosion data over a period, unable to monitor real-time corrosion behavior [17]. Due to these limitations, in situ electrochemical impedance spectroscopy (EIS) technology, a quasi-continuous non-destructive method, has been employed to study the real-time corrosion behavior of nuclear fuel cladding in simulated nuclear reactor coolant [18,19,20].
In this work, the corrosion performance of Ti-39Nb-6Zr alloy at 700 h exposure time with 300 °C and 14 MPa in the 2.3 ppm Li+ and 1500 ppm B3+ solution was investigated by the in situ electrochemical method. The Ti-39Nb-6Zr alloy morphology and structure after 700 h exposure time were analyzed. The corrosion mechanism and the oxide film effect on corrosion property were discussed.
2. Materials and Methods
The experimental material used was a Ti-39Nb-6Zr alloy plate with dimensions of 20 × 20 × 1 mm. Prior to the experiment, the samples were subjected to a sequence of processes involving sandpaper polishing, acetone, ethanol, and deionized water for ultrasonic cleaning. The corrosion tests were conducted in an autoclave (CORTEST AC200) with a 2.3 ppm Li+ solution containing LiOH and a 1500 ppm B3+ solution comprising H3BO3. The Wilhelm cell device was designed as an external reference electrode, and the aqueous solution was deaerated by continuously stirring with nitrogen gas (99.99%) for 60 min prior to heating and electrochemical testing. The solution temperature and pressure were increased gradually to 300 °C and 14 MPa, respectively, and then maintained at these temperatures and pressures for a duration of 700 h.
Electrochemical characterization was performed using a PARSTAT 2273 potentiostat system equipped with a custom high-temperature three-electrode configuration housed in a nickel-based alloy autoclave. The electrochemical cell comprised three primary components: (1) a titanium alloy working electrode, (2) an external Ag/AgCl Wilhelm reference electrode (0.1 mol/L KCl filling solution), and (3) a Pt counter electrode. Potentiodynamic polarization measurements were conducted with a controlled potential sweep rate of 1 mV s−1 across a potential window spanning from −1.5 V to +2.0 V versus open-circuit potential, while electrochemical impedance spectroscopy (EIS) acquisitions covered a frequency spectrum from 1 MHz to 10 mHz with 10 mV RMS AC perturbation amplitude. To mitigate thermal diffusion potential artifacts inherent to high-temperature electrochemical measurements, all recorded potentials were systematically converted to the standard hydrogen electrode (SHE) scale through the established temperature-compensated equation [21]:
where ESHE denotes the potential versus standard hydrogen electrode, ΔEm represents the measured potential relative to the Ag/AgCl external reference electrode, and B corresponds to the temperature-compensated potential offset (0.197 V at 25 °C).
ESHE = ΔEm + B
B = 0.2866 − 0.001ΔT + 1.745 × 10⁻⁷ΔT2 − 3.03 × 10⁻⁹ΔT3
ΔT = T − 25 °C accounts for thermal effects, with T being the experimental temperature in degrees Celsius. All potentials in this work corresponded to SHE.
The Tafel of the dynamic potential polarization curve is fitted by CorrView software, which can obtain the corrosion potential, corrosion current density, and polarization resistance of the sample. Electrochemical impedance spectroscopy (EIS) processed the data with equivalent circuit fitting by Zsimpwin software to assess the corrosion resistance of the material according to the Nyquist plot and Bode plot.
The Ti-39Nb-6Zr alloy specimens after 700 h immersion in 2.3 ppm Li+/1500 ppm B3+ solution at 300 °C/14 MPa were characterized. Surface and cross-sectional morphology examination was employed by field-emission scanning electron microscopy (FE-SEM, Hitachi S-4800, China) with 5 kV accelerating voltage and 10 μA probe current. Molecular structure analysis was performed via Raman spectroscopy (Horiba Jobin Yvon, Montpellier, France) with a 532 nm diode laser. The oxide film chemical state determination used X-ray photoelectron spectroscopy (XPS, VG ESCALAB 250Xi) (ThermoFisher, UK) employing a monochromatic Al Kα source, with charge compensation referenced to adventitious carbon (C 1s = 284.8 eV).
3. Results
3.1. Electrochemical Properties of Ti-39Nb-6Zr Alloy at Different Temperatures
The kinetic potential polarization curves of Ti-39Nb-6Zr alloy in 2.3 ppm Li+ + 1500 ppm B3+ solution at different temperatures are shown in Figure 1. Table 1 shows the fitting results of the kinetic potential polarization curves. The corrosion current density (icorr) is 1.49 × 10⁻⁷ A/cm2 at 15 °C and 3.72 × 10⁻⁵ A/cm2 at 300 °C as the temperature increases. The corrosion current density increases by two orders of magnitude; thus, the high-temperature environment significantly deteriorates the corrosion resistance of the metal. The polarization resistance (Rp) decreases with increasing temperature from 174,690 Ω·cm2 at 15 °C to 699 Ω·cm2 at 300 °C.
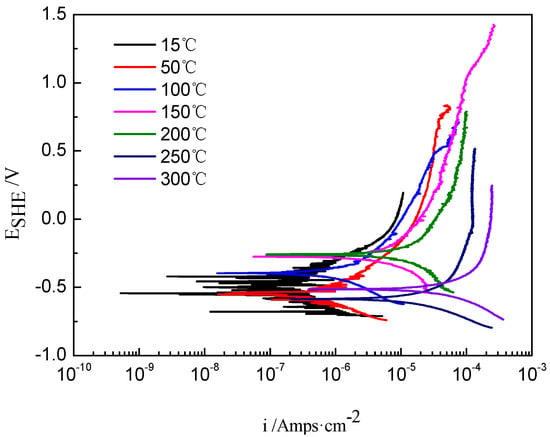
Figure 1.
The potentiodynamic polarization curves of Ti-39Nb-6Zr alloy in lithium boron solution at different temperatures.

Table 1.
Fitting results of potentiodynamic polarization curves for Ti-39Nb-6Zr alloy at different temperatures.
The activation energy (Q) for the growth of the oxide film was calculated based on the Arrhenius equation for ip = Aexp(−Q/RT) with ip as the passivation current. Figure 2 shows a linear fit of lnip versus 1/T based on the polarization curve, which yields an activation energy of 12.84 kJ/mol. This is of the same order of magnitude as that of the liquid-phase migration (<41.84 kJ/mol), and thus the growth kinetics of the oxide film of the Ti-39Nb-6Zr alloy is mainly governed by the ionic migration of the liquid phase [22]. Compared with the growth activation energy of pure titanium oxide film [23], it is higher than that of pure titanium at 15 °C~200 °C and lower than that at 200 °C~300 °C. The growth kinetics of Ti-39Nb-6Zr alloy is mainly controlled by liquid-phase migration.
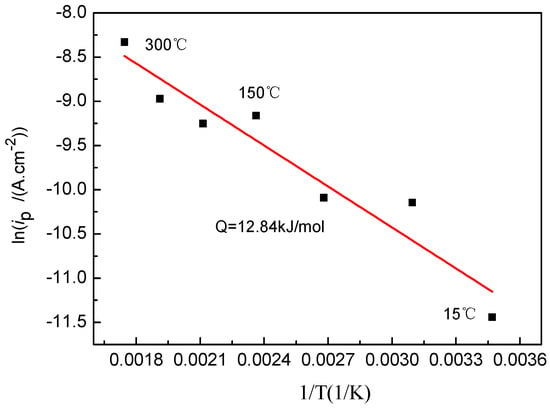
Figure 2.
Arrhenius plot of the passive current density vs. temperature.
Figure 3 shows the Nyquist and Bode plots of Ti-39Nb-6Zr alloy in 2.3 ppm Li+ + 1500 ppm B3+ solution at different temperatures. An enlarged Nyquist plot at 250–300 °C is inserted into Figure 3a. In the high-temperature and high-pressure water environment, the radius of the capacitive loop decreases with increasing temperature and pressure. Figure 3b shows that the impedance value at 0.01 Hz frequency also exhibits a tendency to decrease gradually with increasing temperature and pressure. In its phase angle diagram (Figure 3c) it can be seen that a peak appears at about 0.1 Hz frequency, which is related to the formation of passivation film on Ti-39Nb-6Zr alloy. The larger diameter of the capacitive loop, higher impedance, and larger maximum value of the phase angle imply a good corrosion resistance.
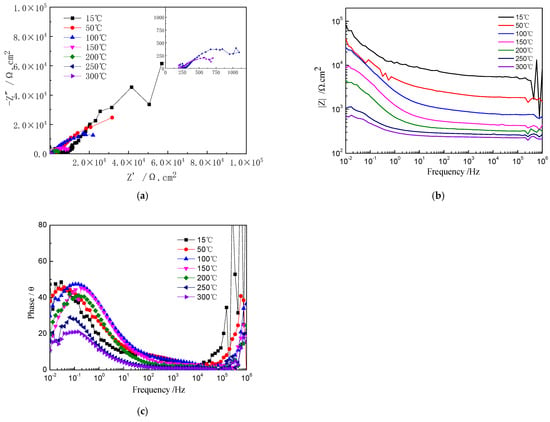
Figure 3.
EIS of Ti-39Nb-6Zr alloy at different temperatures. (a) Nyquist plots; (b) Bode plots; (c) phase angle plots.
Figure 4 shows the EIS equivalent circuit diagram of Ti-39Nb-6Zr alloy in 2.3 ppm Li+ + 1500 ppm B3+ solution at different temperatures, where Rs is the solution resistance, Rt is the charge transfer resistance, CPE(t) is related to the electric double layer, and CPEc and Rc correspond to the oxide film. The fitting results are shown in Table 2. There is a high solution resistance (Rs) of 5148 Ω·cm2 at 25 °C, but Rs decreases rapidly with increasing temperature. At the same time, with increasing temperature Rt decreases from 6643 Ω·cm2 at 25 °C to 240.7 Ω·cm2 at 300 °C. In addition, when the Ti-39Nb-6Zr alloy gets in touch with the solution, a very thin layer of dense passivation film is rapidly formed on the surface of the alloy. In addition, its equivalent resistance value Rc is 297,600 Ω·cm2, while Rc also decreases rapidly with the increase in temperature, the corrosion resistance of the passivation film decreases significantly, and the equivalent resistance value Rc decreases to 664.4 Ω·cm2 at 300 °C.
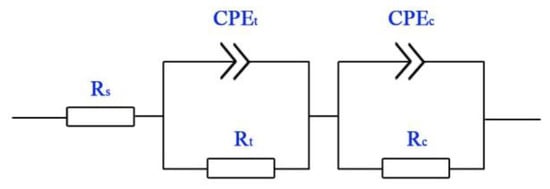
Figure 4.
Equivalent circuits of EIS spectra of Ti-39Nb-6Zr alloy in lithium borate solution at different temperatures.

Table 2.
Fitting results of EIS spectra of Ti-39Nb-6Zr alloy at different solution temperatures.
3.2. Electrochemical Characterization of Ti-39Nb-6Zr Alloy Held in 300 °C/14 MPa Aqueous Solution
The kinetic potential polarization curves of Ti-39Nb-6Zr alloy in 300 °C and 14 MPa lithium borate solutions with different holding times are shown in Figure 5a. Figure 5b,c show the curves of corrosion current density (icorr) and polarization resistance (Rp) versus time. During the holding time of 0–68 h, icorr rapidly decreased from 3.72 × 10⁻⁵ A/cm2 to 9.80 × 10⁻⁶ A/cm2 and Rp increased from 699 Ω·cm2 to 2661 Ω·cm2. The value of icorr decreased slowly until 68 h and then increased to 1.63 × 10⁻⁵ A/cm2 after 700 h. This is because at the beginning of the holding period, the passivation film grows faster, and the corrosion protection ability increases rapidly so that the corrosion current density decreases, and the growth slows down after 68 h, which makes the corrosion current density also decrease slowly.
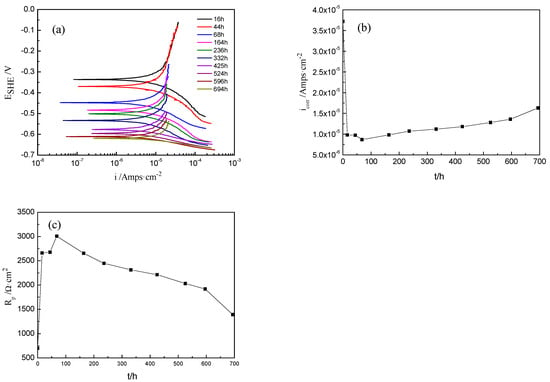
Figure 5.
Potentiodynamic polarization curves of Ti-39Nb-6Zr alloy at different exposure times at 300 °C and 14 MPa. (a) Potentiodynamic polarization curves, (b) current density vs. time, (c) polarization resistance vs. time.
Figure 6 shows the Nyquist plot of Ti-39Nb-6Zr alloy at different holding times. The capacitive loops at 0–68 h gradually become larger with the increase in holding time, while after 68 h the capacitive loops gradually become smaller with the increase in holding time. Figure 7 shows the equivalent circuit of the EIS spectrum of the Ti-39Nb-6Zr alloy after 4 h of holding time at 300 °C/14 MPa in 2.3 ppm Li+ + 1500 ppm B3+ solution, where Rs is the solution resistance, Rt is the charge transfer resistance, and CPEt is related to the electric double layer; CPEc and Rc correspond to the oxide film. Due to the appearance of the Warburg impedance deviation, which is related to the diffusion process, the fitting results of the simulated circuit are shown in Table 3. The oxide film resistance Rc grows from 664.4 Ω·cm2 to 2681 Ω·cm2 from 0–68 h, and then Rc keeps decreasing with the increase in the holding time. The trend of the value of Rc of the simulation element of the oxide film with time can be seen in Figure 6b. The rapid growth of the oxide film at the initial stage of the holding time improves its corrosion resistance, while the action of high temperature and high pressure makes the corrosion resistance of the Ti-39Nb-6Zr alloy gradually decrease.
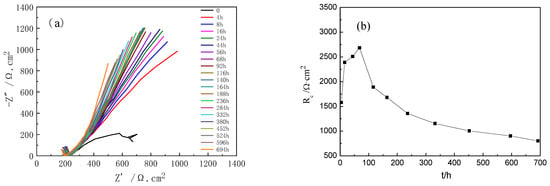
Figure 6.
Nyquist curves of Ti-39Nb-6Zr alloy at 300 °C and 14 MPa for different holding times. (a) Nyquist curve, (b) Rc vs. time.

Figure 7.
Equivalent circuit of EIS for Ti-39Nb-6Zr alloy at different temperatures.

Table 3.
EIS fitting results for Ti-39Nb-6Zr alloy at different high temperatures.
Figure 8 shows the Bode plots of Ti-39Nb-6Zr alloy in 2.3 ppm Li+ + 1500 ppm B3+ solution at 300 °C/14 MPa for different holding times. The variation trend of impedance value versus time at a frequency of 0.01 Hz is consistent with that of Rc. The phase angle diagram (Figure 8b) shows that after the temperature is stabilized at 300 °C, the frequency corresponding to the extreme value of the phase angle is shifted to the low-frequency direction.
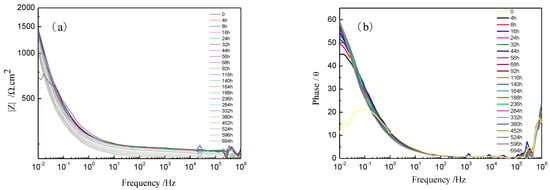
Figure 8.
Bode plots of Ti-39Nb-6Zr alloy in lithium boron solution at 300 °C/14 MPa for different holding times. (a) Bode plots; (b) phase angle plots.
3.3. Electrochemical Characterization of Ti-39Nb-6Zr Alloy During Cooling Down After 700 H Holding Time
The cooling kinetic potential polarization curves of Ti-39Nb-6Zr alloy in 2.3 ppm Li+ + 1500 ppm B3+ solution at 300 °C/14 MPa after holding temperature for 700 h are shown in Figure 9, and their fitting results are shown in Table 4. The icorr decreases with decreasing temperature, Rp is 1391 Ω·cm2 at 300 °C, while Rp increases with decreasing temperature to 12,619 Ω·cm2 at 30 Ω·cm2. In addition, as the temperature decreases, Rp increases to 12,619 Ω·cm2 at 15 °C.
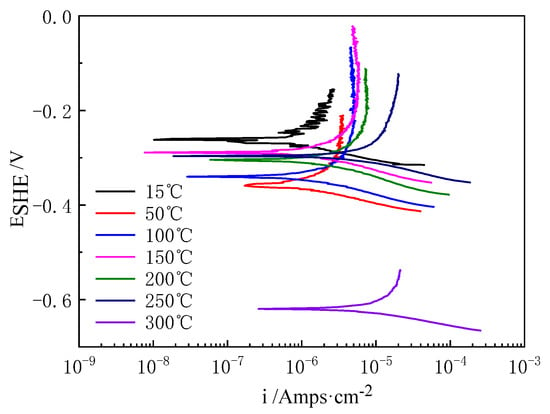
Figure 9.
Dynamic potential polarization curves of Ti-39Nb-6Zr alloy in lithium boron solution at different temperatures after 700 h of holding time.

Table 4.
Fitting results of polarization curves of Ti-39Nb-6Zr alloy in lithium boron solution at different temperatures after holding at 300 °C/14 MPa for 700 h.
The EIS curves of Ti-39Nb-6Zr alloy at different temperatures during the cooling-down period after holding at 300 °C and 14 MPa for 700 h in 2.3 ppm Li+ + 1500 ppm B3+ solution are shown in Figure 10. The Nyquist plot (Figure 10a) shows that the diameter of the capacitive loops increases gradually with decreasing temperature. The impedance value at 0.01 Hz also increases continuously with decreasing temperature. In the phase angle plot, the trend is similar to the heat process. The peaks at about 0.01 Hz are associated with the oxide film of the alloy, while the peaks at 103 Hz are also due to the presence of the transfer resistance, which increases with decreasing temperature and pressure, and hence the intensity of the peaks becomes stronger. The equivalent fitting circuit is shown in Figure 7, and the fitting results are shown in Table 5. The oxide film resistance Rc increases with the decrease in temperature and continues to rise; compared with the temperature of Rc, high-temperature and high-pressure insulation after the oxide film Rc value is lower, indicating that for the Ti-39Nb-6Zr alloy in the high-temperature and high-pressure water environment after 700 h insulation of the surface of the oxide film, corrosion resistance at all temperatures is worse than the thin oxide film formed at the time of warming.
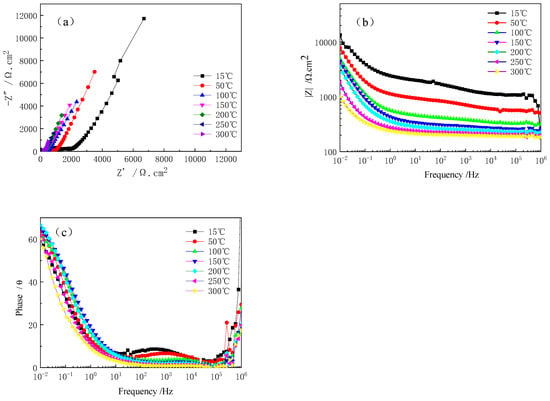
Figure 10.
EIS curves of Ti-39Nb-6Zr alloy at different temperatures during cooling down after holding at 300 °C and 14 MPa for 700 h in lithium boron solution. (a) Nyquist plot, (b) Bode plot, (c) ohase angle plot.

Table 5.
Ti-39Nb-6Zr alloy in lithium boron solution at 300 °C/14 MPa during cooling after holding for 700 h. EIS fitting results for different temperatures.
3.4. Morphology and Structure of Oxide Film
Figure 11a shows the surface morphology of Ti-39Nb-6Zr alloy in 2.3 ppm Li+ + 1500 ppm B3+ solution at 300 °C/14 MPa after holding for 700 h. Under high-temperature and -pressure conditions, the surface of Ti-39Nb-6Zr alloy is covered by a layer of nanocrystalline grains and the thickness of its oxide film is about 5 μm. The cracking phenomenon occurs at the interface between the oxide film and the substrate, which indicates that the bonding of the oxide film is poor.
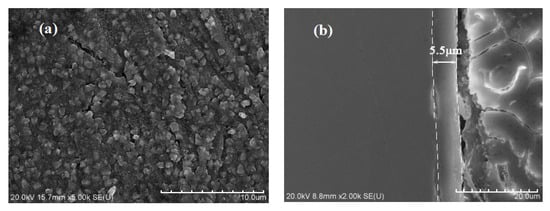
Figure 11.
The surface and cross-section morphologies of oxide film on Ti-39Nb-6Zr alloy after 700 h exposure in 2.3 ppm Li+ and 1500 ppm B3+ solution at 300 °C and 14 MPa: (a) the surface morphology, (b) the cross-section morphologies.
The Raman spectrum of Ti-39Nb-6Zr alloy in 2.3 ppm Li+ + 1500 ppm B3+ solution held at 300 °C/14 MPa for 700 h is shown in Figure 12. Four peaks are mainly present at 149 cm−1, 512 cm−1, 639 cm−1, and 830 cm−1. The peaks at 149 cm−1 and 639 cm−1 are related to anatase TiO2, the peak at 512 cm−1 originates from ZrO2, while the peak at 830 cm−1 belongs to Nb2O5. The anatase TiO2 peak is stronger, while the Raman peaks of ZrO2 and Nb2O5 are weaker.
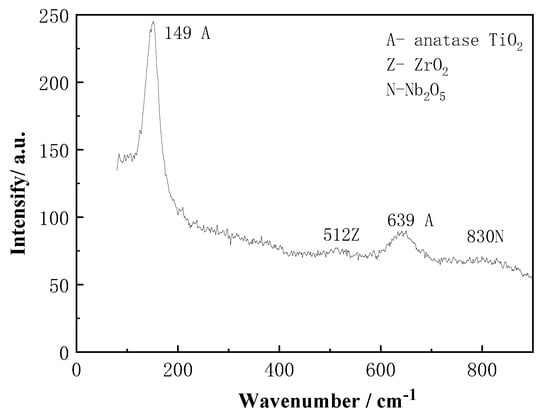
Figure 12.
Raman spectrum of oxide film on Ti-39Nb-6Zr alloy after 700 h exposure in 2.3 ppm Li+ and 1500 ppm B3+ solution at 300 °C and 14 MPa.
The XPS spectrum of the surface of the Ti-39Nb-6Zr alloy after 300 °C/14 MPa holding time of 700 h is shown in Figure 13, and there is a peak at the binding energy of 192 eV, which belongs to B1s and originates from B2O3. In addition, the O1s spectrum in Figure 11b can be divided into two peaks located at 531.6 eV and 530.8 eV, which belong to B2O3 and oxygen in the O-H group originating from adsorbed water, respectively. However, the binding energy signals associated with elements such as Ti, Nb, and Zr in the XPS spectra were weak, indicating that a large number of boron ions were adsorbed on the surface and formed B2O3.
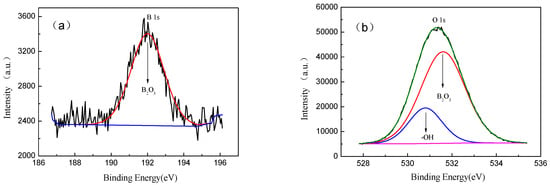
Figure 13.
Ti-39Nb-6Zr alloy boron lithium solution at 300 °C and 14 MPa, held for 700 h. XPS spectra of sample surfaces: (a) B1s, (b) O1s.
4. Discussion
The kinetic potential polarization curves and EIS plots at different temperatures during the warming stage and at different times during the holding time show that the corrosion resistance of the Ti-39Nb-6Zr alloy decreases dramatically with the increase in solution temperature. This shows that the film’s corrosion resistance is gradually enhanced with the increase in holding time, but it starts to gradually weaken after 68 h.
The corrosion process of Ti-39Nb-6Zr alloy in a high-temperature and high-pressure water environment is manifested in its oxide film growth process. It rapidly forms a passivation film in lithium borate solution, and with the increase in solution temperature, although the growth rate of the oxide film on the surface of Ti-39Nb-6Zr alloy is accelerated, the protective effect of the film on the substrate deteriorates under the action of high temperature, which makes the corrosion resistance of Ti-39Nb-6Zr alloy decrease sharply. The activation energy of the oxide film growth in different temperature ranges is 12.84 kJ/mol, and the lower activation energy of oxidation indicates that the reaction kinetics of the warming process is controlled by the diffusive migration of liquid-phase ions. When kept at 300 °C/14 MPa, the surface oxide film grew rapidly within 68 h. With the thickening of the surface film, the internal diffusion of oxygen atoms into the Ti-39Nb-6Zr alloy matrix was hindered, which was manifested by the increase in impedance and decrease in corrosion current. In addition, when the holding time continues to be extended, there are more and more defects on the surface of the film, and these defects can promote the diffusion of oxygen, boron, and lithium atoms to the interior; moreover, the enhancement of corrosion resistance by the thickening of the oxide film is smaller than the effect of these ions on the corrosion of the film, and thus the corrosion resistance of the oxide film has been weakening.
The passivation film on the alloy substrate transforms from a single-layer film structure to a double-layer film structure. The impedance of the passivation decreases with the increase in temperature, which is related to the enhanced ion conductivity of the passivation film at high temperatures. The impedance of the dense layer inside the passivation film is much greater than that of the loose layer outside, and the dense layer inside plays a crucial role in the corrosion resistance of the Ti-39Nb-6Zr alloy. During the insulation process, the impedance of the dense layer inside the passivation film first increases and then slowly decreases, and the corrosion resistance of the passivation film first increases and then decreases.
5. Conclusions
- (1)
- The oxide film of Ti-39Nb-6Zr alloy included anatase TiO2 phases, ZrO2, Nb2O5, and a slight B2O3 after 700 h at 300 °C and 14 MPa in lithium borate solution. The morphology of the film is shown by many nanocrystalline grains and the thickness is about 5 μm;
- (2)
- The activation energy is 12.84 kJ/mol from 15 °C to 300 °C. In addition, the oxidation of Ti-39Nb-6Zr alloy is controlled by oxygen ions diffusion in the liquid phases;
- (3)
- The passivation film on the alloy substrate transforms from a single-layer film structure to a double-layer film structure. The corrosion resistance of the Ti-39Nb-6Zr alloy in 2.3 ppm Li+ + 1500 ppm B3+ solution decreases significantly with increasing temperature, which is related to the enhanced ion conductivity of the passivation film at high temperatures.
Author Contributions
Conceptualization, L.C. and X.O.; methodology, L.C. and Q.H; software, L.C. and X.W.; validation, L.C. and P.P.; formal analysis, L.C.; investigation, L.C. and P.P.; resources, X.O. and Q.H.; data curation, L.C.; writing—original draft preparation, L.C.; writing—review and editing, L.C. and X.O.; visualization, L.C. and Q.H.; supervision, X.O. and Q.H.; project administration, L.C. and X.W.; funding acquisition, L.C. and X.O. All authors have read and agreed to the published version of the manuscript.
Funding
This research was sponsored by the Beijing Institute of Science and Technology Innovation Project No. 25CA001-03.
Institutional Review Board Statement
Not applicable.
Informed Consent Statement
Not applicable.
Data Availability Statement
All the data used in this study are contained within the article.
Conflicts of Interest
The authors declare no conflicts of interest.
References
- Allen, T.R.; Konings, R.J.M.; Motta, A.T. 5.03 corrosion of zirconium alloys. Compr. Nucl. Mater. 2012, 5, 49–68. [Google Scholar]
- Liu, J. Nuclear Structural Materials; Chemical Industry Press: Beijing, China, 2007; pp. 324–326. [Google Scholar]
- AlShareef, A.M. Review of the Radiation Effect on the Cladding of Zirconium Alloy in Nuclear Reactors. In Proceedings of the Saudi International Conference on Nuclear Power Engineering, Saudi, Dhahran, Saudi Arabia, 13–15 November 2023; pp. 208–219. [Google Scholar]
- Kim, S.; Kang, J.H.; Lee, Y. Hydride embrittlement resistance of Zircaloy-4 and Zr-Nb alloy cladding tubes and its implications on spent fuel management. J. Nucl. Mater. 2022, 559, 153393. [Google Scholar] [CrossRef]
- Lu, Z.P.; Shoji, T.; Dan, T.C.; Qiu, Y.B.; Yonezawa, T. The effect of roll-processing orientation on stress corrosion cracking of warm-rolled 304L stainless steel in oxygenated and deoxygenated high temperature pure water. Corros. Sci. 2010, 52, 2547–2555. [Google Scholar] [CrossRef]
- Avelar, A.M.; de Camargo, F.; da Silva, V.S.P.; Giovedi, C.; Abe, A.; Mourao, M.B. Effectiveness of Ni-based and Fe-based cladding alloys in delaying hydrogen generation for small modular reactors with increased accident tolerance. Nucl. Eng. Technol. 2023, 55, 156–168. [Google Scholar] [CrossRef]
- Jiang, G.Y.; Xu, D.H.; Wang, Y.; Liu, L.; Guo, S.W.; Kuang, W.J.; Li, Y.H. Corrosion behavior of FeCrAl alloy and NiCr coated Zircaloy-4 in hydrogenated water. Int. J. Hydrogen Energy 2022, 47, 16698–16709. [Google Scholar]
- Chen, Y.; Nie, X.; Northwood, D.O. Investigation of Plasma Electrolytic Oxidation (PEO) coatings on a Zr-2.5Nb alloy using high temperature/pressure autoclave and tribological tests. Surf. Coat. Technol. 2010, 205, 1774–1782. [Google Scholar] [CrossRef]
- Gao, P.; Li, Y.; Bai, Z.; Ding, S.; Zhang, Y.; Xing, L.; Yu, Z. Behavior mechanism and prediction models of stress corrosion cracking of stainless steels in pressurized water reactors. Nucl. Eng. Des. 2025, 434, 113897. [Google Scholar]
- Wang, X.P.; Guan, H.H.; Tiao, Y.Z.; Zhu, M.H.; Xu, C.; Jin, X.Y.; Liao, B.; Xue, W.B.; Zhang, Y.W. Enhancement of hightemperature steam oxidation resistance of Zr-1Nb alloy with ZrO2/Cr bilayer coating. Corros. Sci. 2021, 187, 109494. [Google Scholar] [CrossRef]
- Terrani, V.S.; Zinkle, J.; Snead, L.L. Advanced oxidation-resistant iron-based alloys for LWRfuel cladding. J. Nucl. Mater. 2014, 448, 420–435. [Google Scholar] [CrossRef]
- Liu, J.; Alfantazi, A.; Asselin, E. High Temperature Corrosion of Titanium Under Conditions Relevant to Pressure Leaching: Mass Loss and Electrochemistry. Corrosion 2014, 71, 352–366. [Google Scholar]
- Delville, M.H.; Botella, P.; Jaszay, T.; Frayret, J.P. Electrochemical study of corrosion in aqueous high pressure, high temperature media and measurements of materials corrosion rates: Applications to the hydrothermal treatments of organic wastes by SCWO. J. Supercrit. Fluid. 2003, 26, 169–179. [Google Scholar] [CrossRef]
- Khumsa-Ang, K.; Edwards, M.; Rousseau, S. General corrosion of chromium-coated zirconium-and titanium-based alloys in supercritical water at 500 °C. J. Nucl. Eng. Radiat. Sci. 2020, 6, 031102. [Google Scholar] [CrossRef]
- Hu, Y.; Liu, G. Properties and application of high-temperature corrosion-resisting alloy Ti-31. Rare. Metal. Mat. Eng. 1995, 25, 39–44. [Google Scholar]
- Gurrappa, I. Characterization of titanium alloy Ti-6Al-4V for chemical, marine and industrial applications. Mater. Charact. 2003, 51, 131–139. [Google Scholar] [CrossRef]
- Schefold, J.; Lincot, D.; Ambard, A.; Kerrec, O. The Cyclic Nature of Corrosion of Zr and Zr-Sn in High-Temperature Water (633 K) A Long-Term In Situ lmpedance Spectroscopic Study. J. Electrochem. Soc. 2003, 150, B451–B461. [Google Scholar] [CrossRef]
- Cai, Y.Q.; Liu, H.X.; Xu, Q.; Song, Q.S.; Liu, H.J.; Xu, L. Electrochemical behavior of zirconium in an in-situ preparing licl-kcl-zrcl4 molten slat. Int. J. Electrochem. Sci. 2015, 10, 4324–4334. [Google Scholar] [CrossRef]
- Zhong, X.; Li, M.; Zhou, B.; Yao, M.; Shen, J. In-situ electrochemical impedance spectroscopy investigations on the early stage corrosion behavior of Zircaloy-4 in high-temperature lithiated water. Corros. Sci. 2021, 182, 109223. [Google Scholar] [CrossRef]
- Bai, Z.; Li, Y.; Xing, L.; Gao, P.; Yu, Z.; Ding, S.; Macdonald, D.; Wang, S. In Situ Monitoring Techniques and Analysis Theory for Electrochemical Corrosion in Subcritical and Supercritical Aqueous Systems. J. Electrochem. Soc. 2025, 172, 021504. [Google Scholar]
- Macdonald, D.D.; Scott, A.C.; Wentrce, P. External reference electrodes for use in high temperature aqueous systems. J. Electrochem. Soc. 1979, 126, 908–911. [Google Scholar] [CrossRef]
- Liao, D.L.; Wu, G.S.; Liao, B.Q. Zeta potential of shape-controlled TiO2 nanoparticles with surfactants. Colloids Surf. A 2009, 348, 270–275. [Google Scholar] [CrossRef]
- Chen, L.; Jin, X.Y.; Pang, P.; Xue, W.B.; Luo, J. Electrochemical Study of TA2 Titanium in a High-Temperature and -Pressure Water Environment. Coatings 2021, 11, 659. [Google Scholar] [CrossRef]
Disclaimer/Publisher’s Note: The statements, opinions and data contained in all publications are solely those of the individual author(s) and contributor(s) and not of MDPI and/or the editor(s). MDPI and/or the editor(s) disclaim responsibility for any injury to people or property resulting from any ideas, methods, instructions or products referred to in the content. |
© 2025 by the authors. Licensee MDPI, Basel, Switzerland. This article is an open access article distributed under the terms and conditions of the Creative Commons Attribution (CC BY) license (https://creativecommons.org/licenses/by/4.0/).