
VOC Emission Spectrum and Industry-Specific Analysis in the Industrial Coating Industry of Hangzhou, China

 ,
,
Abstract
1. Introduction
2. Materials and Methods
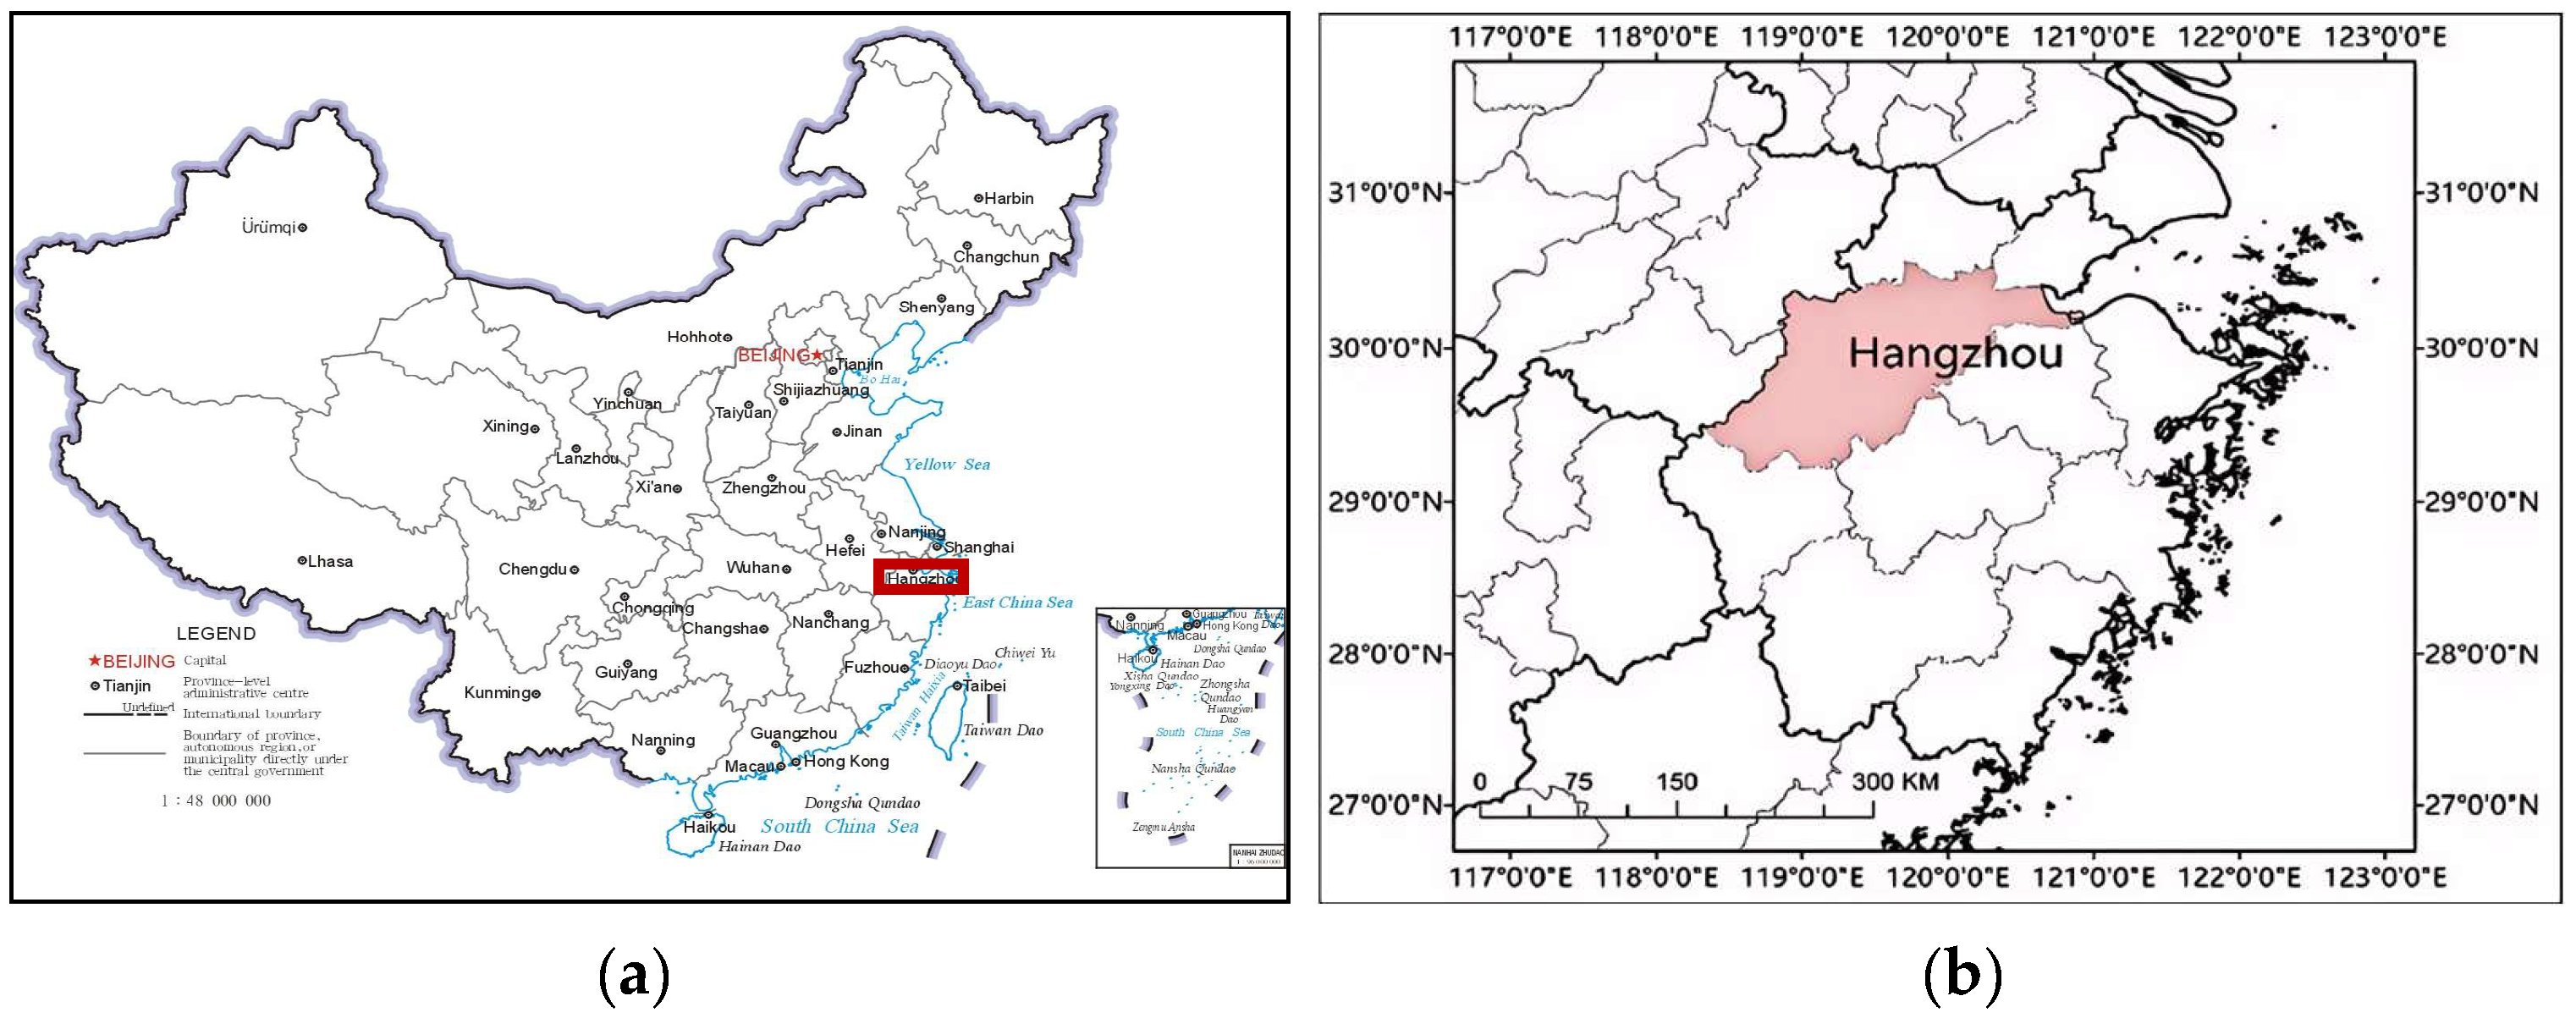
2.1. Location and Scope of the Study
2.2. Selection of Test Enterprises
2.3. Localized Testing Method
2.4. Sample Analysis
2.5. Establishment of Source Profile
2.6. Ozone Formation Potential (OFP)
3. Results and Discussion
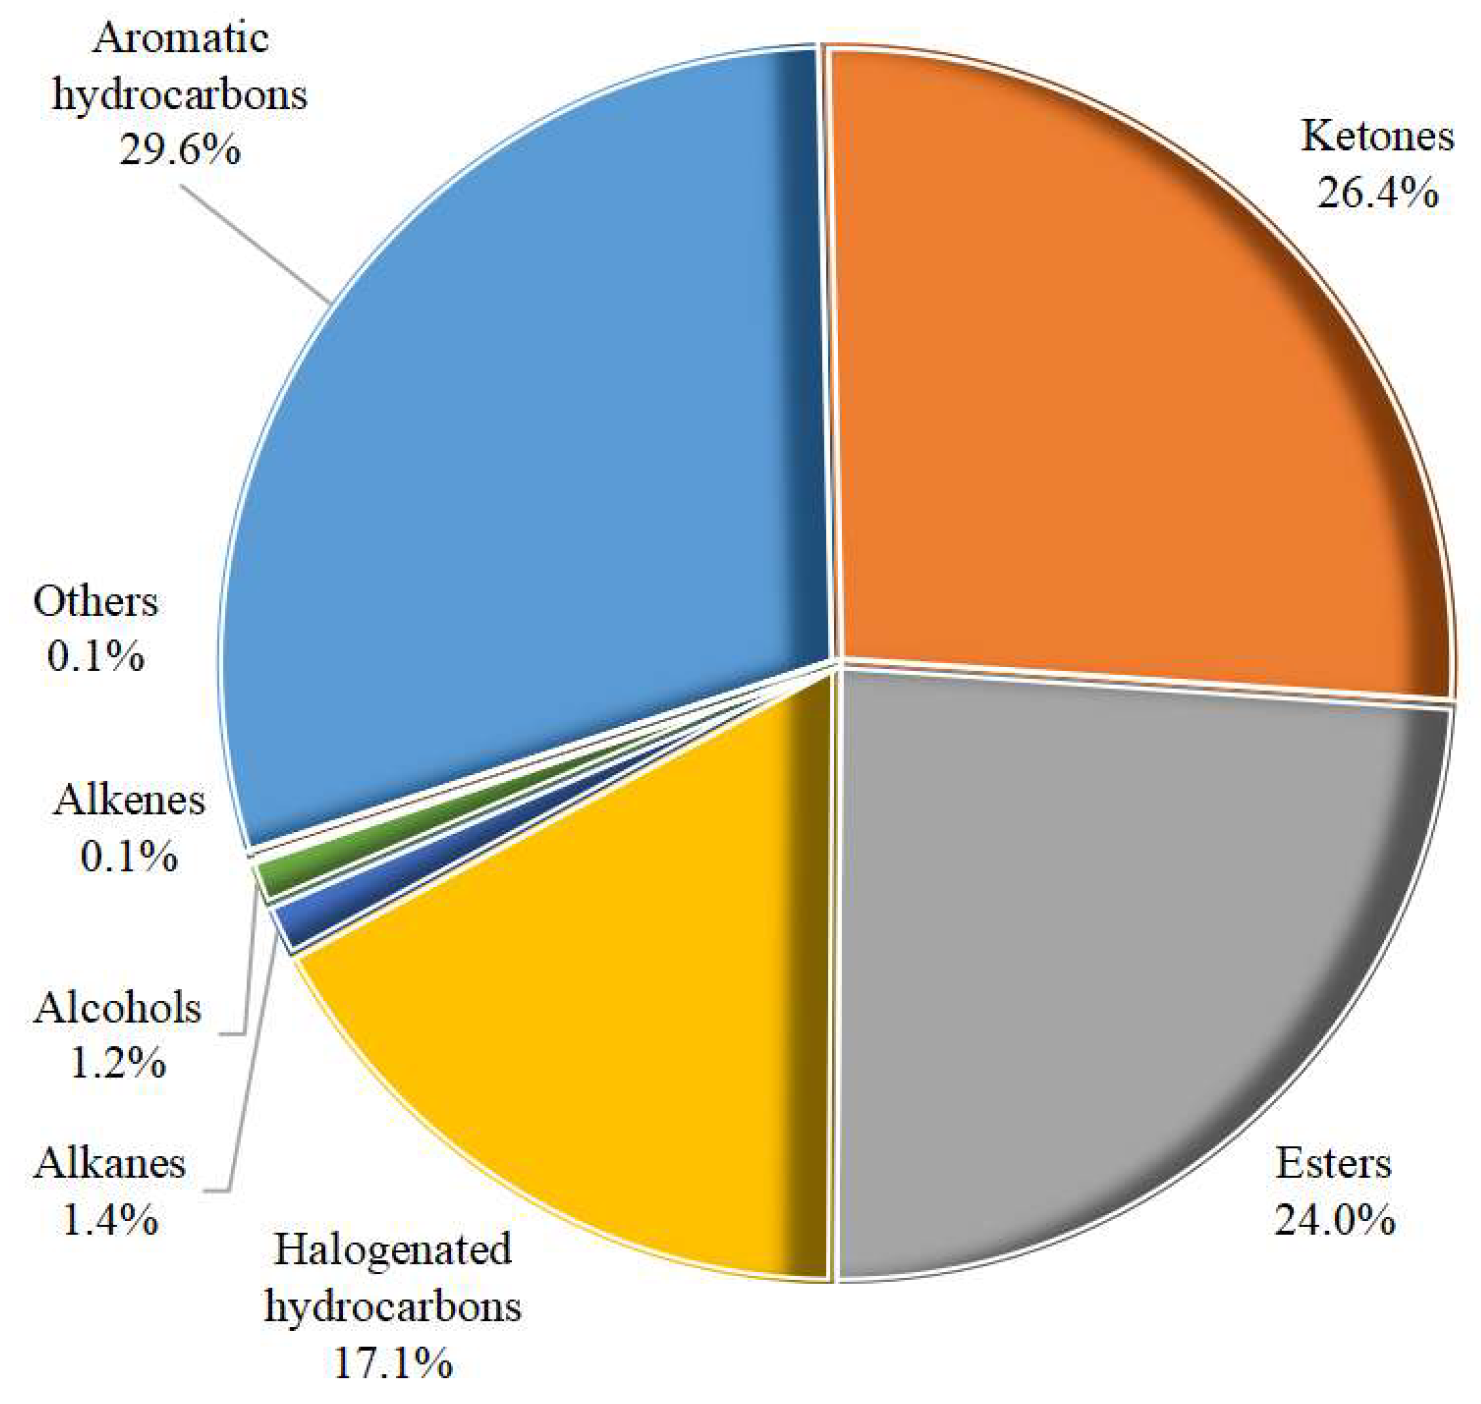
3.1. VOC Emission Component Characteristics
3.2. Analysis of VOC Emission Source Profiles in Industrial Coating
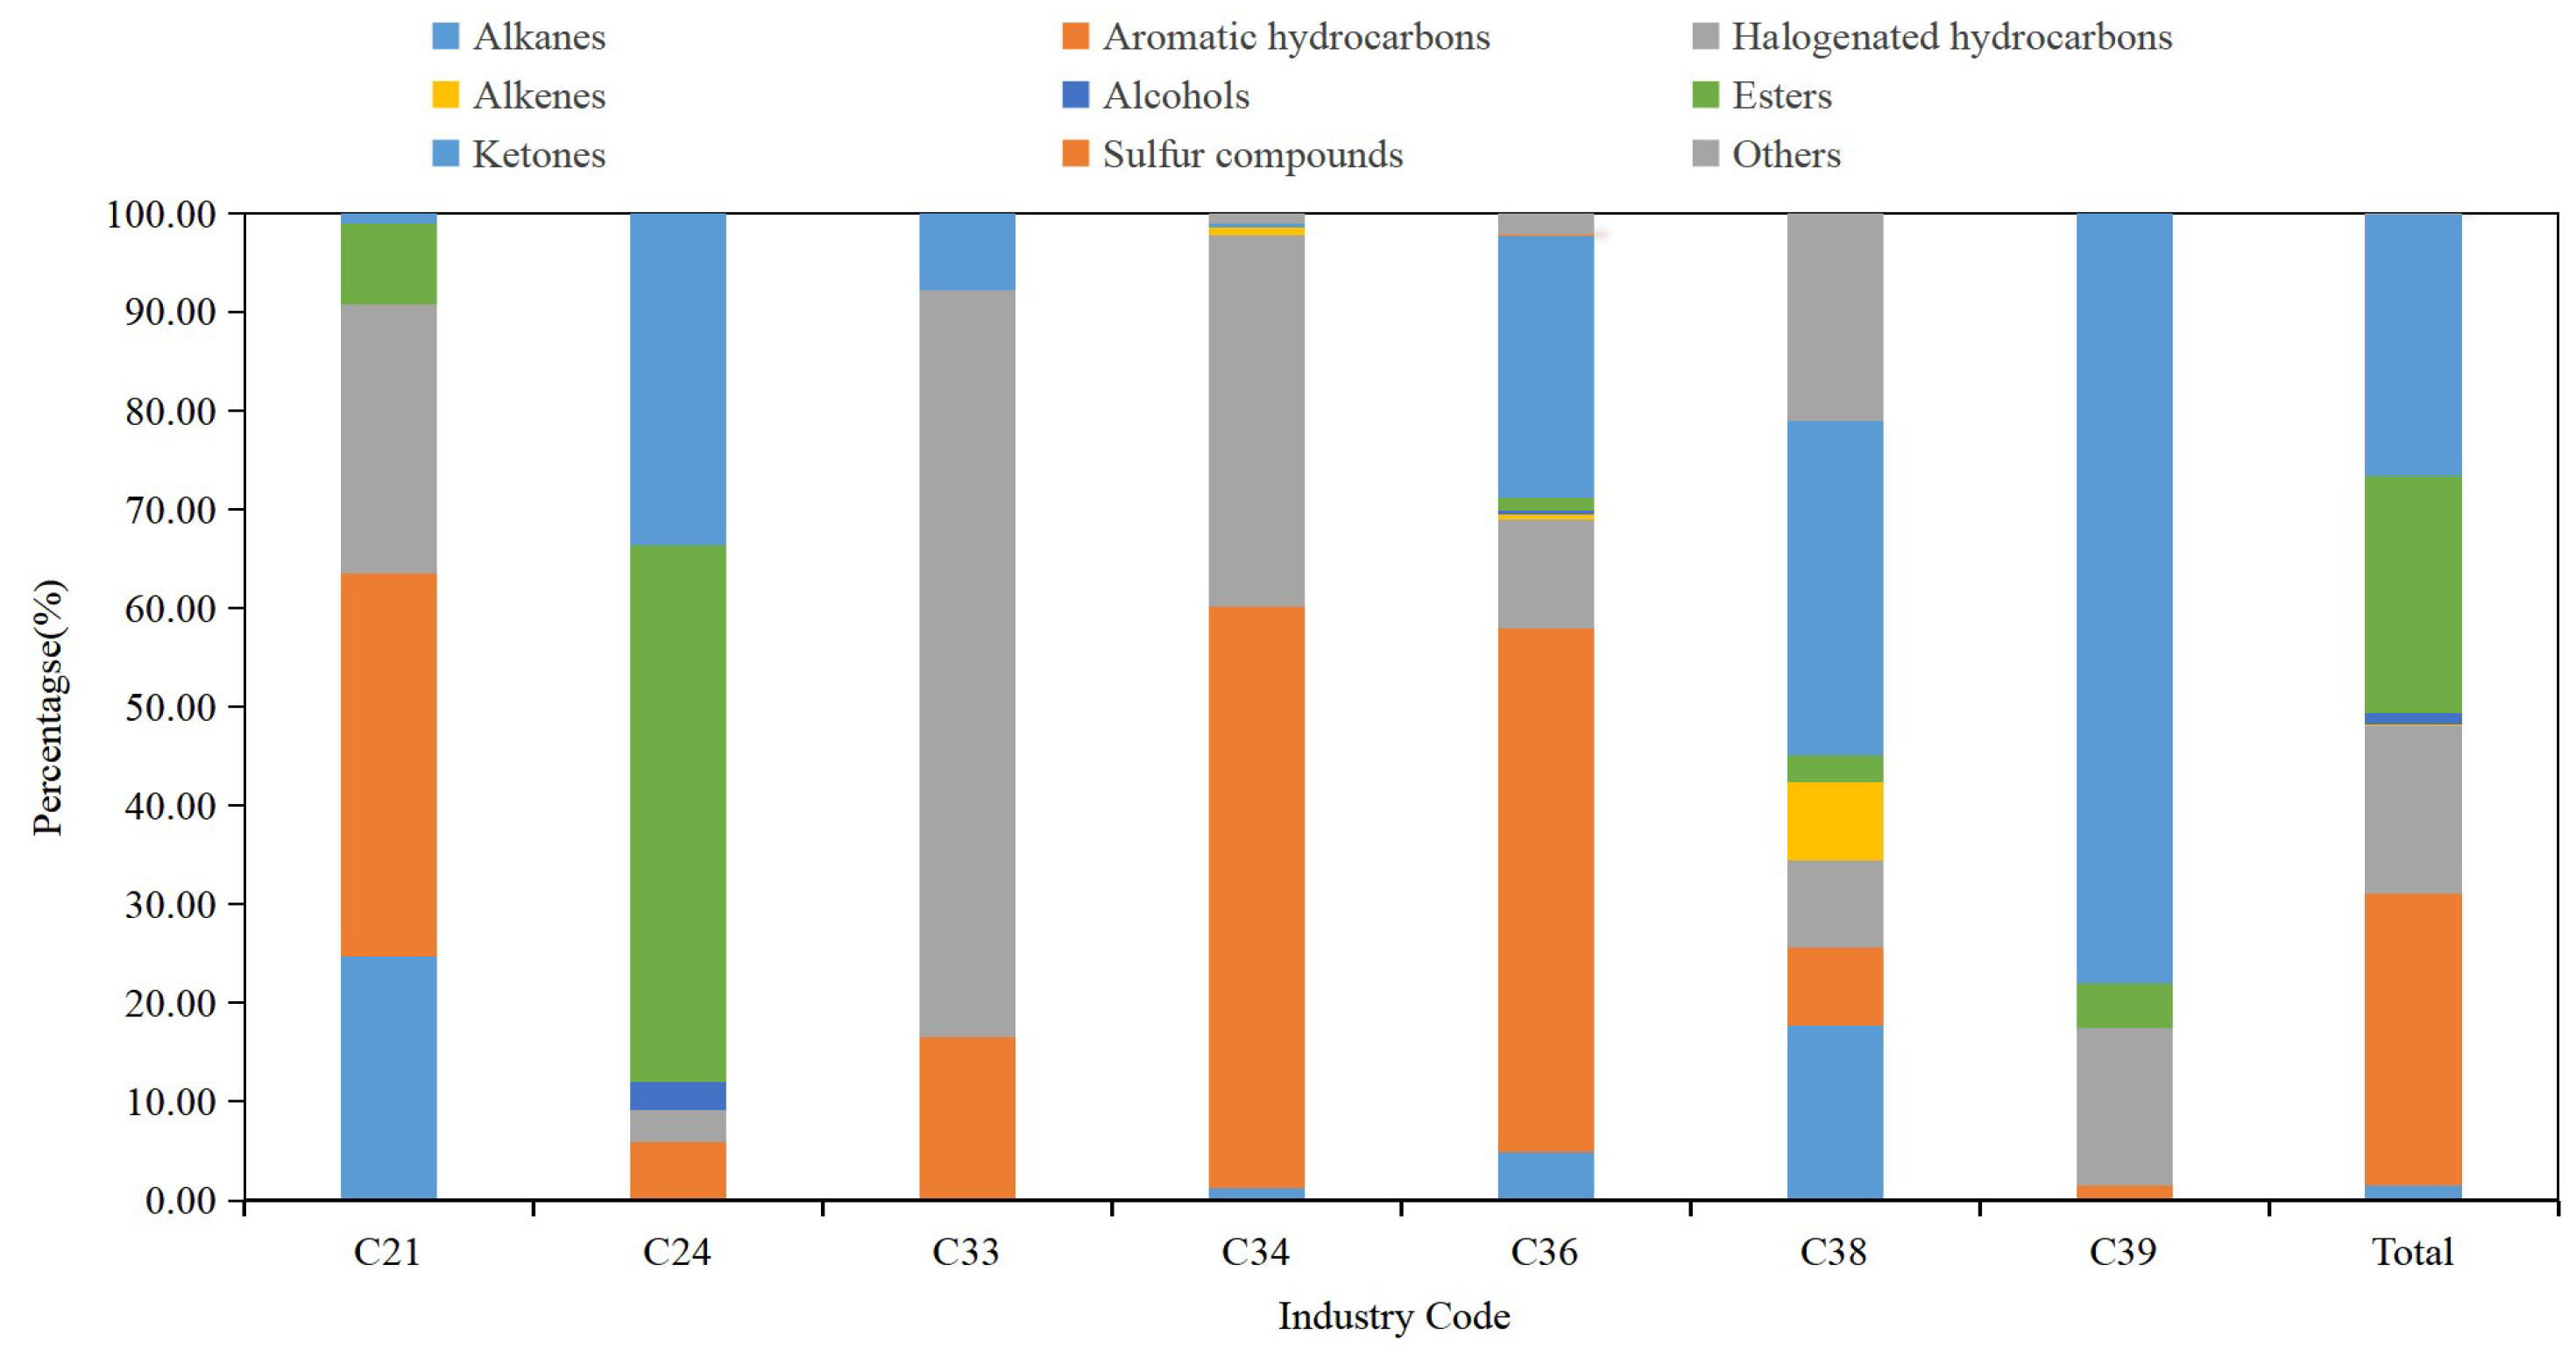
3.3. Analysis of VOC Source Profiles by Industry
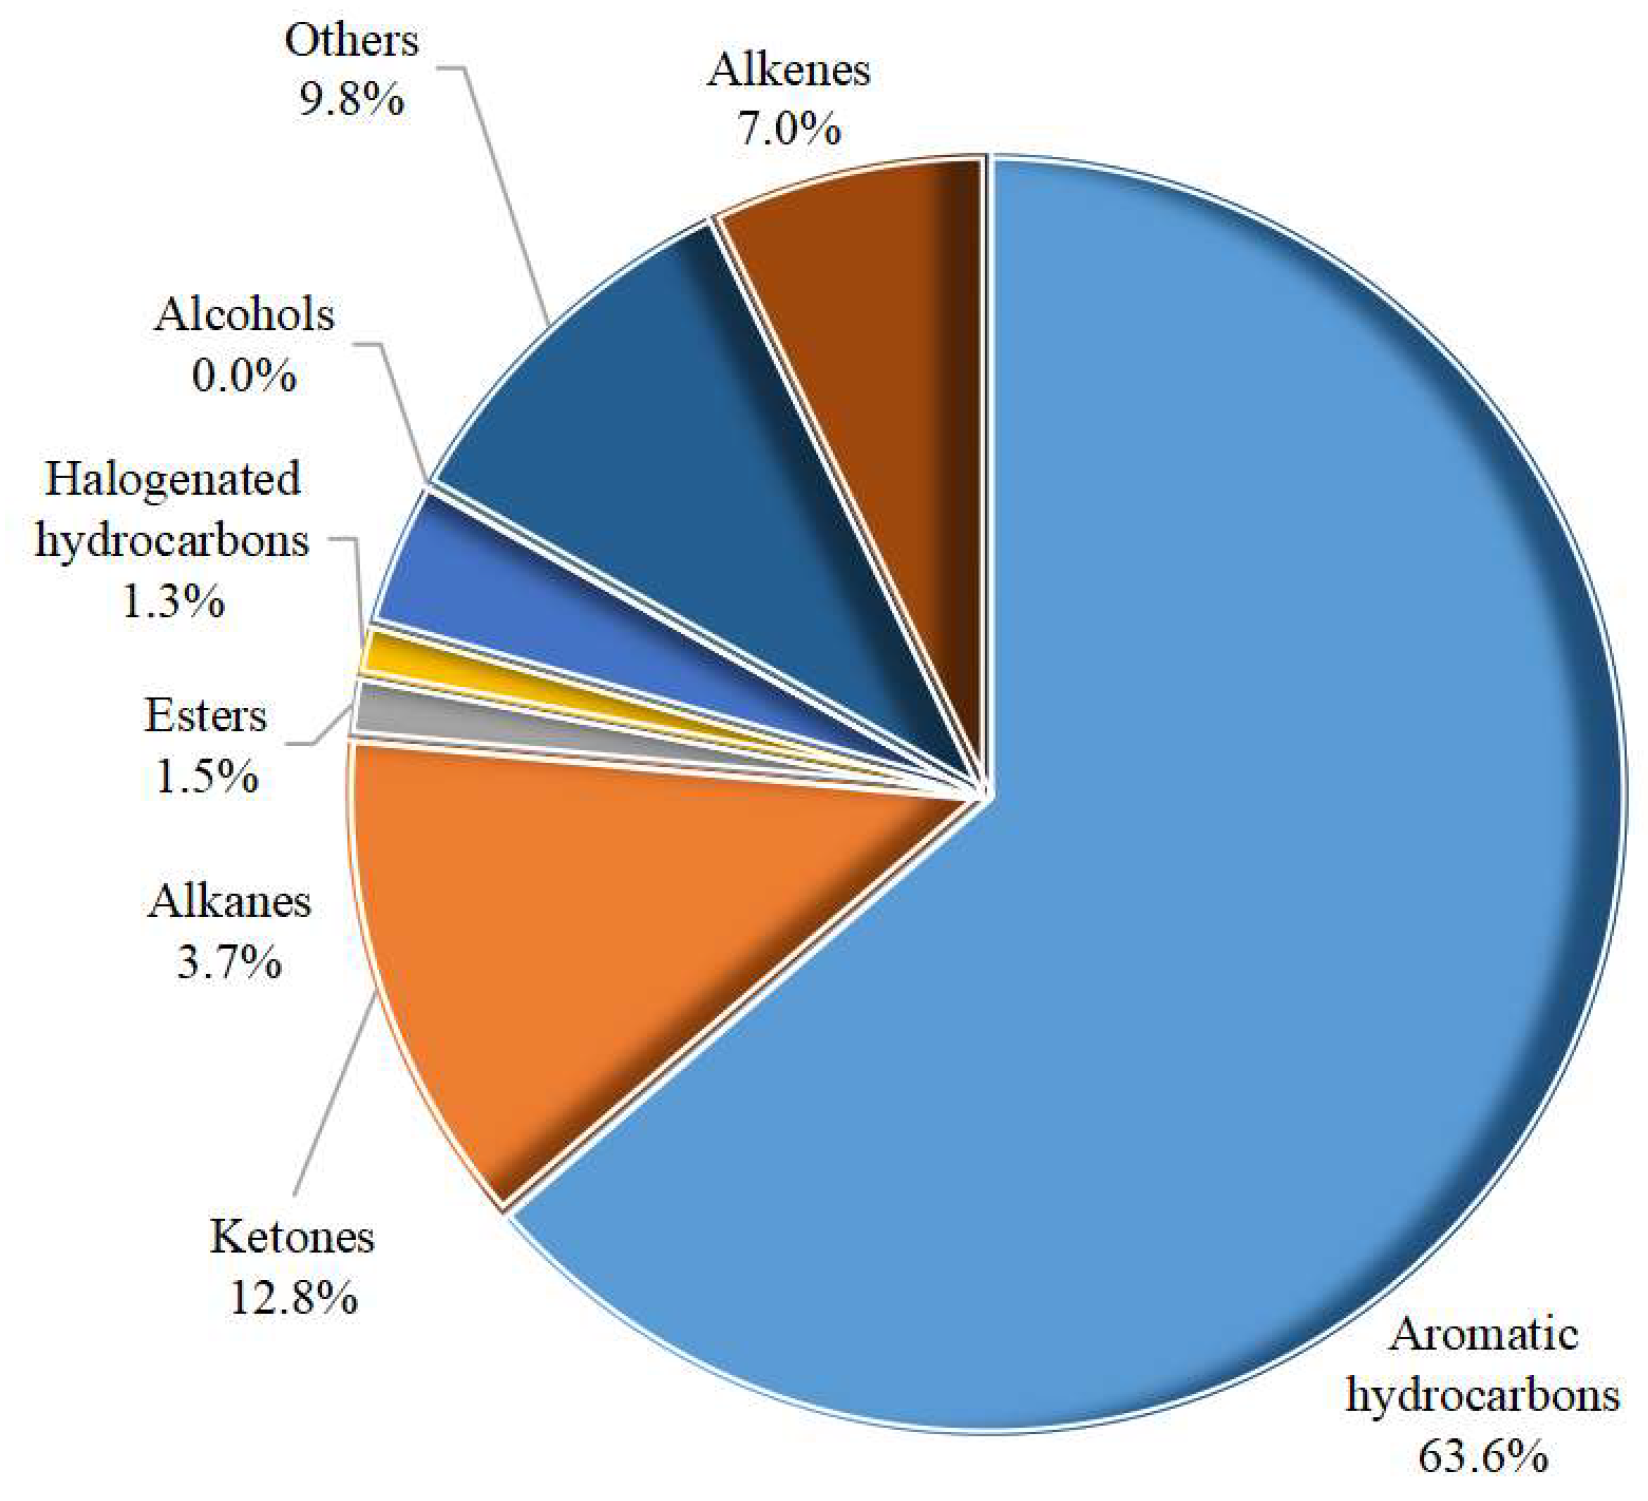
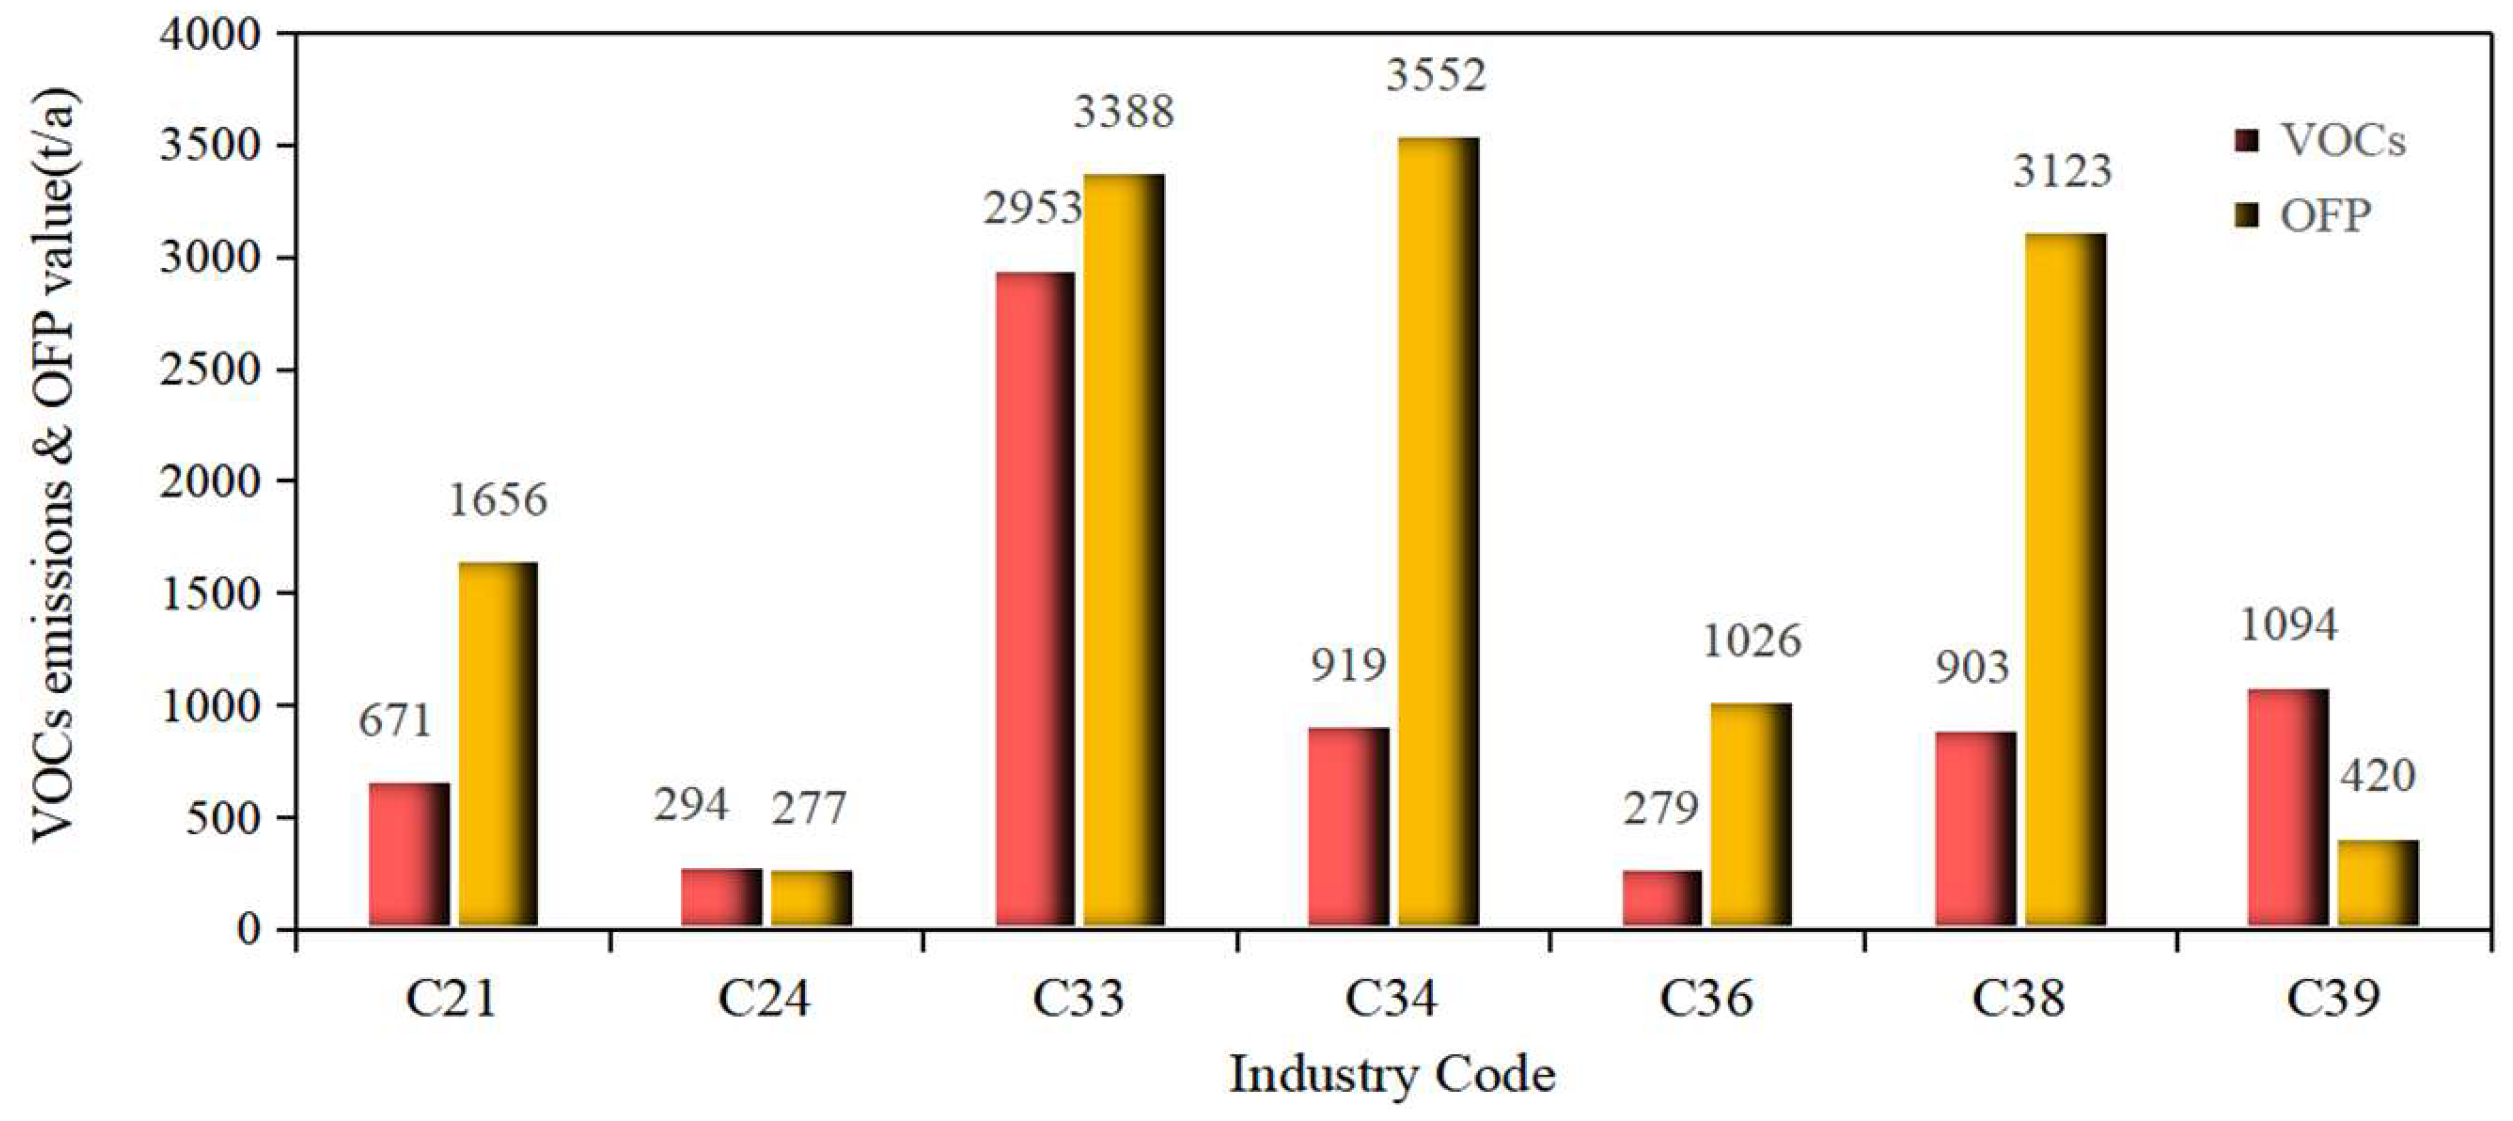
3.4. OFP of Various Industrial Coating Sectors
3.5. Comparison with Other Studies
3.6. Uncertainty Analysis
4. Conclusions
Supplementary Materials
Author Contributions
Funding
Institutional Review Board Statement
Informed Consent Statement
Data Availability Statement
Conflicts of Interest
References
- Zhang, X.; Fan, M.; Shao, S.; Song, X.; Wang, H. Socioeconomic Drivers and Mitigating Strategies of Volatile Organic Compounds Emissions in China’s Industrial Sector. Environ. Impact Assess. Rev. 2023, 101, 107102. [Google Scholar] [CrossRef]
- Wang, R.; Wang, X.; Cheng, S.; Zhu, J.; Zhang, X.; Cheng, L.; Wang, K. Determining an Optimal Control Strategy for Anthropogenic VOC Emissions in China Based on Source Emissions and Reactivity. J. Environ. Sci. 2024, 136, 248–260. [Google Scholar] [CrossRef] [PubMed]
- Chen, S.; Wang, H.; Lu, K.; Zeng, L.; Hu, M.; Zhang, Y. The Trend of Surface Ozone in Beijing from 2013 to 2019: Indications of the Persisting Strong Atmospheric Oxidation Capacity. Atmos. Environ. 2020, 242, 117801. [Google Scholar] [CrossRef]
- Hao, S.; Du, Q.; Wei, X.; Yan, H.; Zhang, M.; Sun, Y.; Liu, S.; Fan, L.; Zhang, G. Composition and Reactivity of Volatile Organic Compounds and the Implications for Ozone Formation in the North China Plain. Atmosphere 2024, 15, 213. [Google Scholar] [CrossRef]
- Yang, Y.; Ruan, Z.; Wang, X.; Yang, Y.; Mason, T.G.; Lin, H.; Tian, L. Short-Term and Long-Term Exposures to Fine Particulate Matter Constituents and Health: A Systematic Review and Meta-Analysis. Environ. Pollut. 2019, 247, 874–882. [Google Scholar] [CrossRef]
- Sonne, C.; Xia, C.; Dadvand, P.; Targino, A.C.; Lam, S.S. Indoor Volatile and Semi-Volatile Organic Toxic Compounds: Need for Global Action. J. Build. Eng. 2022, 62, 105344. [Google Scholar] [CrossRef]
- Zhang, Y.; Tian, Q.; Wei, X.; Feng, X.; Ma, P.; Hu, W.; Xin, J.; Ni, C.; Wang, S.; Zheng, C. Temperature Modulation of Adverse Consequences of Ozone Exposure on Cardiovascular Mortality: A Study of Multiple Cities in China. Atmos. Environ. 2022, 288, 119272. [Google Scholar] [CrossRef]
- Liu, X.; Zhang, H.; Lv, Z.; Bai, H.; Li, G. Characterization Identification and Speciated Emission Inventory Construction of Anthropogenic Volatile Organic Compounds (VOCs) in Beijing, China. Atmos. Pollut. Res. 2025, 16, 102452. [Google Scholar] [CrossRef]
- Zhang, Y.; Xue, L.; Carter, W.P.L.; Pei, C.; Chen, T.; Mu, J.; Wang, Y.; Zhang, Q.; Wang, W. Development of Ozone Reactivity Scales for Volatile Organic Compounds in a Chinese Megacity. Atmos. Chem. Phys. 2021, 21, 11053–11068. [Google Scholar] [CrossRef]
- Zheng, C.; Shen, J.; Zhang, Y.; Zhu, X.; Wu, X.; Chen, L.; Gao, X. Atmospheric Emission Characteristics and Control Policies of Anthropogenic VOCs from Industrial Sources in Yangtze River Delta Region, China. Aerosol Air Qual. Res. 2017, 17, 2263–2275. [Google Scholar] [CrossRef]
- Liang, X.; Chen, X.; Zhang, J.; Shi, T.; Sun, X.; Fan, L.; Wang, L.; Ye, D. Reactivity-Based Industrial Volatile Organic Compounds Emission Inventory and Its Implications for Ozone Control Strategies in China. Atmos. Environ. 2017, 162, 115–126. [Google Scholar] [CrossRef]
- Derwent, R.G.; Jenkin, M.E.; Passant, N.R.; Pilling, M.J. Reactivity-Based Strategies for Photochemical Ozone Control in Europe. Environ. Sci. Policy 2007, 10, 445–453. [Google Scholar] [CrossRef]
- Li, K.; Li, J.; Wang, W.; Tong, S.; Liggio, J.; Ge, M. Evaluating the Effectiveness of Joint Emission Control Policies on the Reduction of Ambient VOCs: Implications from Observation during the 2014 APEC Summit in Suburban Beijing. Atmos. Environ. 2017, 164, 117–127. [Google Scholar] [CrossRef]
- Zheng, H.; Kong, S.; He, Y.; Song, C.; Cheng, Y.; Yao, L.; Chen, N.; Zhu, B. Enhanced Ozone Pollution in the Summer of 2022 in China: The Roles of Meteorology and Emission Variations. Atmos. Environ. 2023, 301, 119701. [Google Scholar] [CrossRef]
- Li, M.; Zhang, Q.; Zheng, B.; Tong, D.; Lei, Y.; Liu, F.; Hong, C.; Kang, S.; Yan, L.; Zhang, Y.; et al. Persistent Growth of Anthropogenic Non-Methane Volatile Organic Compound (NMVOC) Emissions in China during 1990–2017: Drivers, Speciation and Ozone Formation Potential. Atmos. Chem. Phys. 2019, 19, 8897–8913. [Google Scholar] [CrossRef]
- Liang, X.; Sun, X.; Xu, J.; Ye, D. Improved Emissions Inventory and VOCs Speciation for Industrial OFP Estimation in China. Sci. Total Environ. 2020, 745, 140838. [Google Scholar] [CrossRef]
- Tian, J.J.; Ding, X.; An, J.Y.; Wang, X.; Huang, C. High-resolution Emission Inventory of Anthropogenic Reactive Volatile Organic Compounds in the Yangtze River Delta Region. Environ. Sci. 2023, 44, 58–65. [Google Scholar] [CrossRef]
- Yang, W.; Yu, Q.; Pei, C.; Liao, C.; Liu, J.; Zhang, J.; Zhang, Y.; Qiu, X.; Zhang, T.; Zhang, Y.; et al. Characteristics of Volatile Organic Compounds in the Pearl River Delta Region, China: Chemical Reactivity, Source, and Emission Regions. Atmosphere 2021, 13, 9. [Google Scholar] [CrossRef]
- Zhong, Z.; Zheng, J.; Zhu, M.; Huang, Z.; Zhang, Z.; Jia, G.; Wang, X.; Bian, Y.; Wang, Y.; Li, N. Recent Developments of Anthropogenic Air Pollutant Emission Inventories in Guangdong Province, China. Sci. Total Environ. 2018, 627, 1080–1092. [Google Scholar] [CrossRef]
- Lu, X.; Gao, D.; Liu, Y.; Wang, S.; Lu, Q.; Yin, S.; Zhang, R.; Wang, S. A Recent High-Resolution PM2.5 and VOCs Speciated Emission Inventory from Anthropogenic Sources: A Case Study of Central China. J. Clean. Prod. 2023, 386, 135795. [Google Scholar] [CrossRef]
- Wadden, R.A.; Uno, I.; Wakamatsu, S. Source Discrimination of Short-Term Hydrocarbon Samples Measured Aloft. Environ. Sci. Technol. 1986, 20, 473–483. [Google Scholar] [CrossRef] [PubMed]
- Scheff, P.A.; Wadden, R.A. Receptor Modeling of Volatile Organic Compounds. 1. Emission Inventory and Validation. Environ. Sci. Technol. 1993, 27, 617–625. [Google Scholar] [CrossRef]
- Fujita, E.M.; Watson, J.G.; Chow, J.C.; Magliano, K.L. Receptor Model and Emissions Inventory Source Apportionments of Nonmethane Organic Gases in California’s San Joaquin Valley and San Francisco Bay Area. Atmos. Environ. 1995, 29, 3019–3035. [Google Scholar] [CrossRef]
- Simon, H.; Beck, L.; Bhave, P.V.; Divita, F.; Hsu, Y.; Luecken, D. The development and uses of EPA’s SPECIATE database. Atmos. Pollut. Res. 2010, 1, 196–206. [Google Scholar] [CrossRef]
- Hsu, Y.; Divita, F.; Dorn, J. SPECIATE 4.5, Database Development Documentation, Final Report. EPA/600/R-16/294; Environmental Protection Agency: Durham, NC, USA, 2016. [Google Scholar]
- Li, M.; Zhang, Q.; Streets, D.G.; He, K.B.; Cheng, Y.F.; Emmons, L.K. Mapping Asian anthropogenic emissions of non–methane volatile organic compounds to multiple chemical mechanisms. Atmos. Chem. Phys. 2014, 14, 5617–5638. [Google Scholar] [CrossRef]
- Wu, R.; Xie, S. Spatial Distribution of Ozone Formation in China Derived from Emissions of Speciated Volatile Organic. Environ. Sci. Technol. 2017, 51, 2574–2583. [Google Scholar] [CrossRef]
- Zhong, Z.; Sha, Q.; Zheng, J.; Yuan, Z.; Gao, Z.; Ou, J.; Zheng, Z.; Li, C.; Huang, Z. Sector-Based VOCs Emission Factors and Source Profiles for the Surface Coating Industry in the Pearl River Delta Region of China. Sci. Total Environ. 2017, 583, 19–28. [Google Scholar] [CrossRef]
- Guo, Q.; Wang, Y.; Zheng, J.; Zhu, M.; Sha, Q.; Huang, Z. Temporal Evolution of Speciated Volatile Organic Compound (VOC) Emissions from Solvent Use Sources in the Pearl River Delta Region, China (2006–2019). Sci. Total Environ. 2024, 933, 172888. [Google Scholar] [CrossRef]
- Cao, X.; Yi, J.; Li, Y.; Zhao, M.; Duan, Y.; Zhang, F.; Duan, L. Characteristics and Source Apportionment of Volatile Organic Compounds in an Industrial Area at the Zhejiang–Shanghai Boundary, China. Atmosphere 2024, 15, 237. [Google Scholar] [CrossRef]
- Mo, Z.; Lu, S.; Shao, M. Volatile Organic Compound (VOC) Emissions and Health Risk Assessment in Paint and Coatings Industry in the Yangtze River Delta, China. Environ. Pollut. 2021, 269, 115740. [Google Scholar] [CrossRef]
- Liu, Y.; Shao, M.; Fu, L.; Lu, S.; Zeng, L.; Tang, D. Source Profiles of Volatile Organic Compounds (VOCs) Measured in China: Part I. Atmos. Environ. 2008, 42, 6247–6260. [Google Scholar] [CrossRef]
- Liu, F.; Tong, L.; Luo, Q.; Ling, Y.; Gu, H.; Lv, Y.; Shi, A.; Liu, H.; Xiao, H.; Huang, C. Emission Characteristics and Health Risk Assessment of Volatile Organic Compounds in Key Industries: A Case Study in the Central Plains of China. Atmosphere 2025, 16, 74. [Google Scholar] [CrossRef]
- Fang, L.; Liu, W.; Chen, D.; Li, G.; Wang, D. Source Profiles of Volatile Organic Compounds (VOCs) from Typical Solvent-based Industries in Beijing. Environ. Sci. 2019, 40, 128. [Google Scholar] [CrossRef]
- Ye, L.; Lu, H.; Yu, H.; Xu, L.; Yang, S. Emission Characteristics of Volatile Organic Compounds from Coating Exhaust Gas of Automobile Manufacture in Shanghai. Environ. Monit. Forewarning 2019, 11, 17–21. [Google Scholar] [CrossRef]
- Xia, S.; Qiao, Y.; Mu, S.; Zhao, Q. Emission Characteristics and Control of VOCs for Typical Automotive Coating Enterprise in Jiangsu. Environ. Monit. Forewarning 2017, 9, 19–23. [Google Scholar] [CrossRef]
- Bao, Y.S.; Wang, B.; Deng, Y.; Zhou, Z. Source Profiles and Ozone Formation Potential of VOCs Emitted from Typical Industries Using Organic Solvents in Chengdu. Acta Sci. Circumstantiae 2020, 40, 76–82. [Google Scholar] [CrossRef]
- Qi, Y.J.; Ni, J.W.; Zhao, D.X.; Yang, Y.; Han, L.Y.; Li, B.W. Emission Characteristics and Risk Assessment of Volatile Organic Compounds from Typical Factories in Zhengzhou. Environ. Sci. 2020, 41, 3056–3065. [Google Scholar] [CrossRef]
- Li, L.; Li, Z.L.; Fang, W.K.; Wang, X.C.; Pu, X.; Wang, L.T.; Yuan, R.; Zhang, W.D.; Zhai, C.Q. Speciated Emission Inventory of VOCs from Industrial Sources and Their Ozone Formation Potential in Chongqing. Environ. Sci. 2022, 43, 1756–1765. [Google Scholar] [CrossRef]
- Xiao, H.; Zhang, J.; Hou, Y.; Wang, Y.; Qiu, Y.; Chen, P.; Ye, D. Process-Specified Emission Factors and Characteristics of VOCs from the Auto-Repair Painting Industry. J. Hazard. Mater. 2024, 467, 133666. [Google Scholar] [CrossRef]
- Wang, R.; Wang, X.; Cheng, S.; Chen, L.; Cai, B.; Shen, Z. Influence of end-of-pipe treatment on VOCs emission in industrial coating industries. China Environ. Sci. 2022, 42, 593–600. [Google Scholar] [CrossRef]
- Huang, F.; Wang, P.; Liu, W.; Zhang, L.; Feng, W.; Cai, J. Source composition of volatile organic compounds in typical industries of an industrial park and its environmental impact. Environ. Sci. Technol. 2023, 46, 158–165. [Google Scholar] [CrossRef]
- Yuan, B.; Shao, M.; Lu, S.; Wang, B. Source Profiles of Volatile Organic Compounds Associated with Solvent Use in Beijing, China. Atmos. Environ. 2010, 44, 1919–1926. [Google Scholar] [CrossRef]
- GB/T 4754—2017; Industrial Classification for National Economic Activities(S). China Standards Publishing: Beijing, China, 2017. Available online: https://www.stats.gov.cn/xxgk/tjbz/gjtjbz/201710/t20171017_1758922.html (accessed on 15 September 2024).
- GB/T 16157—1996; The Determination of Particulates and Sampling Methods of Gaseous Pollutants from Exhaust Gas of Stationary Source(S). China Standards Publishing: Beijing, China, 1996. Available online: https://www.mee.gov.cn/ywgz/fgbz/bz/bzwb/jcffbz/199603/t19960306_67508.shtml (accessed on 15 September 2024).
- HJ/T 397—2007; Technical Specifications for Emission Monitoring of Stationary Source(S). China Standards Publishing: Beijing, China, 2007. Available online: https://www.mee.gov.cn/ywgz/fgbz/bz/bzwb/jcffbz/200712/t20071213_114278.shtml (accessed on 15 September 2024).
- HJ 732—2014; Emission from Stationary Sources-Sampling of Volatile Organic Compounds-Bags Method(S). China Standards Publishing: Beijing, China, 2014. Available online: https://www.mee.gov.cn/ywgz/fgbz/bz/bzwb/jcffbz/201501/t20150115_294220.shtml (accessed on 15 September 2024).
- Carter, W. Reactivity Estimates for Selected Consumer Product Compounds; Air Resources Board: Sacramento, CA, USA, 2008; Available online: https://intra.engr.ucr.edu/~carter/pubs/aminrep.pdf (accessed on 20 March 2024).
- Yang, Y.; Liu, B.; Hua, J.; Yang, T.; Dai, Q.; Wu, J.; Feng, Y.; Hopke, P.K. Global Review of Source Apportionment of Volatile Organic Compounds Based on Highly Time-Resolved Data from 2015 to 2021. Environ. Int. 2022, 165, 107330. [Google Scholar] [CrossRef]
- Li, W.; Mao, Q.; Wu, G.; Wu, J. Characteristics and Sources of VOCs Emission during the O3 Pollution Prone Season in an Industrial City in Eastern China. Aerosol Air Qual. Res. 2024, 24, 240164. [Google Scholar] [CrossRef]
- Cai, C.; Geng, F.; Tie, X.; Yu, Q.; An, J. Characteristics and Source Apportionment of VOCs Measured in Shanghai, China. Atmos. Environ. 2010, 44, 5005–5014. [Google Scholar] [CrossRef]
- Guo, H.; Cheng, H.R.; Ling, Z.H.; Louie, P.K.K.; Ayoko, G.A. Which Emission Sources Are Responsible for the Volatile Organic Compounds in the Atmosphere of Pearl River Delta? J. Hazard. Mater. 2011, 188, 116–124. [Google Scholar] [CrossRef]
- Xiong, C.; Wang, N.; Zhou, L.; Yang, F.; Qiu, Y.; Chen, J.; Han, L.; Li, J. Component Characteristics and Source Apportionment of Volatile Organic Compounds during Summer and Winter in Downtown Chengdu, Southwest China. Atmos. Environ. 2021, 258, 118485. [Google Scholar] [CrossRef]
- Wang, H.L.; Jing, S.A.; Wang, Q.; Huang, C. Measurement and characterization of emissions of volatile organic compounds in solvent use. Res. Environ. Sci. 2016, 29, 1433–1439. [Google Scholar] [CrossRef]
- Han, F.; Zhong, H.; Li, T.; Wang, Y.; Liu, F. Storage Stability of Volatile Organic Compounds from Petrochemical Plant of China in Different Sample Bags. J. Anal. Methods Chem. 2020, 2020, 9842569. [Google Scholar] [CrossRef]
- Hsieh, C.-C.; Horng, S.-H.; Liao, P.-N. Stability of Trace-Level VOLatile Organic Compounds Stored in Canisters and Tedlar Bags. Aerosol Air Qual. Res. 2003, 3, 17–28. [Google Scholar] [CrossRef]


| Industry Code | Category Name | VOC Emissions (t/a) | Percentage (%) |
|---|---|---|---|
| C21 | Furniture Manufacturing | 671 | 9.4% |
| C24 | Cultural, Educational, and Sporting Goods Manufacturing | 294 | 4.1% |
| C33 | Metal Products Industry | 2953 | 41.5% |
| C34 | General Equipment Manufacturing | 919 | 12.9% |
| C36 | Automobile Manufacturing | 279 | 3.9% |
| C38 | Electrical Machinery and Equipment Manufacturing | 903 | 12.7% |
| C39 | Computer, Communication, and Other Electronic Equipment Manufacturing | 1094 | 15.4% |
| Total | 7113 | 100% |
| Enterprise Name | Industry Code | Category Name | Type of Coating Used | Waste Gas Treatment Facility |
|---|---|---|---|---|
| Enterprise 1 | C21 | Furniture Manufacturing | Solvent-based, Water-based | Adsorption/Desorption Catalytic Oxidation |
| Enterprise 2 | C21 | Furniture Manufacturing | Solvent-based | Adsorption/Desorption Catalytic Oxidation |
| Enterprise 3 | C21 | Furniture Manufacturing | Solvent-based | Adsorption/Desorption Catalytic Oxidation |
| Enterprise 4 | C21 | Furniture Manufacturing | Solvent-based | Adsorption/Desorption Catalytic Oxidation |
| Enterprise 5 | C24 | Cultural, Educational, and Sporting Goods Manufacturing | Water-based | Activated Carbon Adsorption |
| Enterprise 6 | C24 | Cultural, Educational, and Sporting Goods Manufacturing | Solvent-based | Adsorption/Desorption Catalytic Oxidation |
| Enterprise 7 | C24 | Cultural, Educational, and Sporting Goods Manufacturing | Solvent-based | Adsorption/Desorption Catalytic Oxidation |
| Enterprise 8 | C24 | Cultural, Educational, and Sporting Goods Manufacturing | Solvent-based | Spray Washing + Activated Carbon Adsorption |
| Enterprise 9 | C24 | Cultural, Educational, and Sporting Goods Manufacturing | Water-based Paint | Activated Carbon Adsorption |
| Enterprise 10 | C33 | Metal Products Industry | Solvent-based | High-Temperature Incineration |
| Enterprise 11 | C33 | Metal Products Industry | Solvent-based | Activated Carbon Adsorption + RTO |
| Enterprise 12 | C33 | Metal Products Industry | Solvent-based | Adsorption/Desorption Catalytic Oxidation |
| Enterprise 13 | C33 | Metal Products Industry | Solvent-based | Adsorption/Desorption Catalytic Oxidation |
| Enterprise 14 | C33 | Metal Products Industry | Solvent-based | Adsorption/Desorption Catalytic Oxidation |
| Enterprise 15 | C33 | Metal Products Industry | Solvent-based | Adsorption/Desorption Catalytic Oxidation |
| Enterprise 16 | C34 | General Equipment Manufacturing | Water-based Paint | Activated Carbon Adsorption |
| Enterprise 17 | C34 | General Equipment Manufacturing | Powder Coating | Photocatalysis + Activated Carbon Adsorption |
| Enterprise 18 | C34 | General Equipment Manufacturing | Solvent-based | TO |
| Enterprise 19 | C34 | General Equipment Manufacturing | Solvent-based | Adsorption/Desorption Catalytic Oxidation |
| Enterprise 20 | C36 | Automobile Manufacturing | Solvent-based | Adsorption/Desorption Catalytic Oxidation |
| Enterprise 21 | C36 | Automobile Manufacturing | Solvent-based | Regenerative Thermal Oxidizer |
| Enterprise 22 | C36 | Automobile Manufacturing | Solvent-based | Regenerative Thermal Oxidizer |
| Enterprise 23 | C36 | Automobile Manufacturing | Solvent-based | Regenerative Thermal Oxidizer |
| Enterprise 24 | C36 | Automobile Manufacturing | Water-based, Solvent-based | Adsorption/Desorption Catalytic Oxidation |
| Enterprise 25 | C38 | Electrical Machinery and Equipment Manufacturing | Solvent-based | Adsorption/Desorption Catalytic Oxidation |
| Enterprise 26 | C38 | Electrical Machinery and Equipment Manufacturing | Solvent-based, Water-based | Spray Washing + Activated Carbon Adsorption |
| Enterprise 27 | C39 | Computer, Communication, and Other Electronic Equipment Manufacturing | Solvent-based, Water-based | Adsorption/Desorption Catalytic Oxidation |
| Enterprise 28 | C39 | Computer, Communication, and Other Electronic Equipment Manufacturing | Solvent-based | Adsorption/Desorption Catalytic Oxidation |
| Compound Category | VOC Component | Mass Percentage (Standard Deviation) | ||||||
|---|---|---|---|---|---|---|---|---|
| C21 | C24 | C26 | C34 | C36 | C38 | C39 | ||
| Alkanes | n-Hexane | 2.93 (0.03) | 0.06 (0.00) | ND | ND | 0.05 (0.00) | ND | 0.19 (0.00) |
| Methylcyclopentane | 2.48 (0.03) | 0.07 (0.00) | ND | ND | ND | ND | 0.09 (0.00) | |
| Isopentane | ND | ND | ND | ND | 0.33 (0.01) | 3.06 (0.00) | ND | |
| n-Butane | ND | ND | ND | 0.53 (0.01) | ND | 11.17 (0.00) | ND | |
| n-Pentane | ND | ND | ND | ND | ND | 3.40 (0.00) | ND | |
| 3-Methylpentane | 6.65 (0.09) | ND | ND | ND | ND | ND | ND | |
| Cyclohexane | 1.02 (0.01) | ND | ND | ND | 3.14 (0.07) | ND | ND | |
| Isobutane | ND | ND | ND | ND | ND | ND | ND | |
| 2,2-Dimethylbutane | 1.10 (0.01) | ND | ND | ND | ND | ND | ND | |
| 2,3-Dimethylbutane | 1.87 (0.02) | ND | ND | ND | ND | ND | ND | |
| 2-Methylpentane | 10.43 (0.10) | ND | ND | ND | ND | ND | ND | |
| 2,4-Dimethylpentane | 0.24 (0.00) | ND | ND | ND | ND | ND | ND | |
| 3-Methylhexane | 0.02 (0.00) | ND | ND | ND | ND | ND | ND | |
| Benzene Series | Toluene | 17.14 (0.08) | 2.01 (0.02) | 1.88 (0.02) | 35.07 (0.17) | 11.34 (0.10) | 3.94 (0.03) | 0.70 (0.01) |
| m/p-Xylene | 13.02 (0.09) | 2.03 (0.01) | 7.72 (0.04) | 13.00 (0.08) | 13.11 (0.13) | ND | 0.25 (0.00) | |
| Ethylbenzene | 3.74 (0.03) | 1.16 (0.01) | 4.38 (0.03) | 4.00 (0.03) | 4.47 (0.04) | 1.77 (0.02) | 0.06 (0.00) | |
| o-Xylene | 2.21 (0.02) | 0.49 (0.01) | 3.22 (0.02) | 4.76 (0.03) | 4.63 (0.04) | 1.72 (0.02) | 0.07 (0.00) | |
| Benzene | ND | ND | ND | 2.43 (0.05) | 0.47 (0.01) | 2.31 (0.01) | ND | |
| 1,2,4-Trimethylbenzene | ND | ND | ND | ND | 1.61 (0.03) | ND | ND | |
| Styrene | 2.19(0.04) | ND | ND | 0.02 (0.00) | 4.92 (0.11) | ND | ND | |
| 1,3,5-Trimethylbenzene | ND | ND | ND | ND | 1.77 (0.03) | ND | ND | |
| p-Ethyltoluene | ND | ND | ND | ND | 1.77 (0.03) | ND | ND | |
| m-Ethyltoluene | ND | ND | ND | ND | 3.17 (0.05) | ND | ND | |
| o-Ethyltoluene | ND | ND | ND | ND | 1.77 (0.03) | ND | ND | |
| 1,2,3-Trimethylbenzene | ND | ND | ND | ND | 1.96 (0.03) | ND | ND | |
| Propylbenzene | ND | ND | ND | ND | 1.69 (0.03) | ND | ND | |
| Isopropylbenzene | ND | ND | ND | ND | 0.61 (0.01) | ND | ND | |
| m-Diethylbenzene | ND | ND | ND | ND | 0.31 (0.01) | ND | ND | |
| p-Diethylbenzene | ND | ND | ND | ND | 0.32 (0.01) | ND | ND | |
| Halogenated Hydrocarbons | Dichloromethane | 26.28 (0.08) | 0.30 (0.00) | 67.66(0.17) | 30.53 (0.21) | 10.99 (0.15) | 9.17 (0.05) | 15.97 (0.13) |
| 1,2-Dichloroethane | ND | 0.99 (0.02) | 6.59 (0.08) | 1.12 (0.02) | ND | ND | ND | |
| Chloromethane | ND | 0.06 (0.00) | 0.70 (0.02) | 6.23 (0.12) | ND | ND | 0.02 (0.00) | |
| Hexachlorobutadiene | ND | ND | ND | 0.16 (0.00) | ND | ND | ND | |
| Difluorodichloromethane | ND | 0.18 (0.00) | ND | ND | ND | ND | ND | |
| 1,2-Dichloropropane | ND | ND | 0.20 (0.00) | ND | ND | ND | ND | |
| 1,1-Dichloroethylene | ND | 0.19 (0.00) | ND | ND | ND | ND | ND | |
| Alkenes | Butadiene | ND | ND | ND | 0.93 (0.02) | 0.14 (0.00) | 1.43 (0.02) | ND |
| trans-2-Butene | ND | ND | ND | ND | 0.20 (0.00) | 1.28 (0.02) | ND | |
| cis-2-Butene | ND | ND | ND | ND | 0.20 (0.00) | 1.31 (0.02) | ND | |
| n-Butene | ND | ND | ND | ND | 0.57 (0.01) | 3.29 (0.05) | ND | |
| Alcohols | Isopropanol | ND | 2.00 (0.04) | ND | ND | 0.56 (0.01) | ND | ND |
| Esters | Ethyl Acetate | 7.76 (0.14) | 54.33 (0.05) | ND | ND | 1.11 (0.02) | ND | 4.53 (0.06) |
| Vinyl Acetate | ND | ND | ND | ND | ND | 1.39 (0.02) | ND | |
| Ketones | Acetone | 0.63 (0.01) | 26.23 (0.05) | 4.81 (0.12) | 0.16 (0.00) | 18.98 (0.20) | 13.25 (0.08) | 52.92 (0.33) |
| 2-Butanone | 0.28 (0.01) | 4.82 (0.04) | 2.85 (0.07) | ND | 7.02 (0.10) | 11.78 (0.03) | 15.54 (0.07) | |
| 4-Methyl-2-pentanone | ND | 4.86 (0.06) | ND | ND | 0.12 (0.00) | 8.78 (0.12) | 9.67 (0.04) | |
| 2-Hexanone | ND | 0.15 (0.00) | ND | ND | ND | ND | ND | |
| Sulfur | Carbon Disulfide | ND | ND | ND | ND | 0.19 (0.00) | ND | ND |
| Compounds Others | Acrolein | ND | 0.02 (0.00) | ND | 1.07 (0.02) | 0.31 (0.01) | 1.90 (0.03) | ND |
| Acetaldehyde | ND | 0.01 (0.00) | ND | ND | 0.55 (0.01) | 18.03 (0.03) | ND | |
| Methyl tert-Butyl Ether | ND | ND | ND | ND | 0.05 (0.00) | 1.01 (0.00) | ND | |
| Tetrahydrofuran | ND | 0.02 (0.00) | ND | ND | 0.36 (0.01) | ND | ND | |
| Propionaldehyde | ND | ND | ND | ND | 0.50 (0.01) | ND | ND | |
| Butyraldehyde | ND | ND | ND | ND | 0.70 (0.02) | ND | N0 (N0) | |
| Compound Category | VOC Component | Detection Frequencies | Mass Percentage | Subtotal |
|---|---|---|---|---|
| Alkanes | n-Hexane | 17.65% | 0.295% | 1.44% |
| Methylcyclopentane | 11.76% | 0.062% | ||
| Isopentane | 11.76% | 0.008% | ||
| n-Butane | 8.82% | 0.044% | ||
| n-Pentane | 8.82% | 0.006% | ||
| 3-Methylpentane | 5.88% | 0.314% | ||
| Cyclohexane | 5.88% | 0.066% | ||
| Isobutane | 2.94% | 0.005% | ||
| 2,2-Dimethylbutane | 2.94% | 0.038% | ||
| 2,3-Dimethylbutane | 2.94% | 0.079% | ||
| 2-Methylpentane | 2.94% | 0.504% | ||
| 2,4-Dimethylpentane | 2.94% | 0.009% | ||
| 3-Methylhexane | 2.94% | 0.008% | ||
| Aromatic hydrocarbons | Toluene | 94.12% | 20.88% | 29.65% |
| m/p-Xylene | 85.29% | 5.030% | ||
| Ethylbenzene | 85.29% | 1.810% | ||
| o-Xylene | 79.41% | 1.510% | ||
| Benzene | 20.59% | 0.279% | ||
| 1,2,4-Trimethylbenzene | 11.76% | 0.007% | ||
| Styrene | 11.76% | 0.123% | ||
| 1,3,5-Trimethylbenzene | 8.82% | 0.003% | ||
| p-Ethyltoluene | 8.82% | 0.003% | ||
| m-Ethyltoluene | 8.82% | 0.006% | ||
| o-Ethyltoluene | 8.82% | 0.003% | ||
| 1,2,3-Trimethylbenzene | 5.88% | 0.002% | ||
| Propylbenzene | 5.88% | 0.001% | ||
| Isopropylbenzene | 2.94% | 0.001% | ||
| m-Diethylbenzene | 2.94% | 0.0002% | ||
| p-Diethylbenzene | 2.94% | 0.0002% | ||
| Halogenated Hydrocarbons | Dichloromethane | 64.71% | 15.27% | 17.06% |
| 1,2-Dichloroethane | 17.65% | 1.25% | ||
| Chloromethane | 14.71% | 0.389% | ||
| Hexachlorobutadiene | 2.94% | 0.008% | ||
| Difluorodichloromethane | 2.94% | 0.0003% | ||
| 1,2-Dichloropropane | 2.94% | 0.105% | ||
| 1,1-Dichloroethylene | 2.94% | 0.038% | ||
| Alkenes | Butadiene | 8.82% | 0.036% | 0.05% |
| trans-2-Butene | 5.88% | 0.001% | ||
| cis-2-Butene | 5.88% | 0.001% | ||
| n-Butene | 5.88% | 0.013% | ||
| Alcohols | Isopropanol | 11.76% | 1.24% | 1.24% |
| Esters | Ethyl Acetate | 32.35% | 24.02% | 24.03% |
| Vinyl Acetate | 2.94% | 0.005% | ||
| Ketones | Acetone | 52.94% | 21.86% | 26.43% |
| 2-Butanone | 38.24% | 2.78% | ||
| 4-Methyl-2-pentanone | 17.65% | 1.78% | ||
| 2-Hexanone | 2.94% | 0.003% | ||
| Sulfur | Carbon Disulfide | 5.88% | 0.003% | 0.003% |
| Compounds Others | Acrolein | 11.76% | 0.060% | 0.10% |
| Acetaldehyde | 11.76% | 0.032% | ||
| Methyl tert-Butyl Ether | 8.82% | 0.002% | ||
| Tetrahydrofuran | 5.88% | 0.002% | ||
| Propionaldehyde | 2.94% | 0.002% | ||
| Butyraldehyde | 2.94% | 0.005% |
Disclaimer/Publisher’s Note: The statements, opinions and data contained in all publications are solely those of the individual author(s) and contributor(s) and not of MDPI and/or the editor(s). MDPI and/or the editor(s) disclaim responsibility for any injury to people or property resulting from any ideas, methods, instructions or products referred to in the content. |
© 2025 by the authors. Licensee MDPI, Basel, Switzerland. This article is an open access article distributed under the terms and conditions of the Creative Commons Attribution (CC BY) license (https://creativecommons.org/licenses/by/4.0/).
Share and Cite
Tang, W.; Xia, Y.; He, P.; Tao, S.; Zhang, Q.; Wang, D.; Lin, J. VOC Emission Spectrum and Industry-Specific Analysis in the Industrial Coating Industry of Hangzhou, China. Coatings 2025, 15, 429. https://doi.org/10.3390/coatings15040429
Tang W, Xia Y, He P, Tao S, Zhang Q, Wang D, Lin J. VOC Emission Spectrum and Industry-Specific Analysis in the Industrial Coating Industry of Hangzhou, China. Coatings. 2025; 15(4):429. https://doi.org/10.3390/coatings15040429
Chicago/Turabian StyleTang, Wei, Yang Xia, Ping He, Shenwei Tao, Qiyi Zhang, Dongrui Wang, and Jinpeng Lin. 2025. "VOC Emission Spectrum and Industry-Specific Analysis in the Industrial Coating Industry of Hangzhou, China" Coatings 15, no. 4: 429. https://doi.org/10.3390/coatings15040429
APA StyleTang, W., Xia, Y., He, P., Tao, S., Zhang, Q., Wang, D., & Lin, J. (2025). VOC Emission Spectrum and Industry-Specific Analysis in the Industrial Coating Industry of Hangzhou, China. Coatings, 15(4), 429. https://doi.org/10.3390/coatings15040429