Article

A Resource Composition Optimization Algorithm Based on Improved Polar Bear Optimization Algorithm for Manufacturing Wallboard for Coating Machine

1
Faculty of Printing, Packaging Engineering and Digital Media Technology, Xi’an University of Technology, Xi’an 710048, China
2
Xi’an Aerospace-Huayang Mechanical & Electrical Equipment Co., Ltd., Xi’an 710101, China
*
Author to whom correspondence should be addressed.
Coatings 2025, 15(4), 418; https://doi.org/10.3390/coatings15040418
Submission received: 3 March 2025 / Revised: 26 March 2025 / Accepted: 31 March 2025 / Published: 1 April 2025

Abstract

:
Aiming at the problem of the low collaborative efficiency of outsourced processing of wallboard parts of a coating machine under a network collaborative manufacturing mode, this paper proposes a wallboard manufacturing resource composition optimization method based on the Improved Polar Bear Optimization (IPBO) algorithm. The processing process of the wallboard is analyzed, and the process-level splitting of the wallboard manufacturing task is completed; the required manufacturing resource service portfolio is determined, and the resource evaluation indicator system for key performance indicators of wallboard manufacturing resources is established; non-cooperative game decision-making is used to construct a wallboard manufacturing resource composition optimization model from two aspects, namely, quality indicators and flexibility indicators; an adaptive vision and mutation strategy is introduced to carry out the Polar Bear Optimization (PBO) algorithm. Finally, the improved algorithm is used to solve the wallboard manufacturing resource composition optimization model. The experimental results show that the IPBO algorithm reduces the average convergence time by 6.51% and the optimal convergence time by 9.26% compared with the suboptimal Dung Beetle Optimization (DBO) algorithm, and 65%–72% of the test points of the IPBO algorithm are more in line with the preference criteria of the Pareto frontier. Meanwhile, it demonstrates both validity and superiority in solving the problem of expanding the size of wallboards for coating machines.

1. Introduction

The wallboard is a reference component of the winding and unwinding system of the coating machine (as shown in Figure 1), and its processing efficiency directly determines the manufacturing efficiency of the coating machine. In the field of coating machine manufacturing, small and medium-sized enterprises (SMEs) occupy a large proportion of the industry, facing the dilemma of fragmented distribution of manufacturing resources as well as unsatisfactory industrial synergy effect. In order to promote the industry to a new stage of high-quality development, it is necessary to break the status quo by using the network collaborative manufacturing model to integrate resources and improve synergy efficiency [1]. Under the network collaborative manufacturing mode [2], the use of a networked manufacturing resource collaboration platform to achieve the optimal allocation of wallboard manufacturing resources in the industrial agglomeration region of coating equipment manufacturing greatly improves the efficiency of collaboration between industrial chains and shortens the production cycle of wallboard processing. Efficiently optimizing the wallboard manufacturing resource composition is the key to realizing the network collaborative manufacturing of the core components of coating equipment [3].
Manufacturing resource composition optimization is a non-deterministic polynomial problem that requires consideration of the effects of both functional and non-functional factors. Tong et al. [4] proposed a manufacturing service matching algorithm based on the cohort effect, which solved the problem of inaccurate matching due to the individualized requirements of the service demander and the ambiguity of the demand expression. Li et al. [5] proposed a matching method based on the Markov decision-making process and cross-entropy for the demand problem of complex machine tools in a single collaborative manufacturing task to achieve the matching of the manufacturing task with the manufacturing service. Bouzar et al. [6] extracted the TF-IDG vector in the manufacturing capability information and utilized the vector to successfully match the set of marquee services that satisfy the requirements for the subtasks. Xiao et al. [7] proposed a manufacturing resource matching decision-making method based on multidimensional information fusion for accurate matching of manufacturing resources. Liu et al. [8] proposed an optimal manufacturing resource selection method for a guide roller cloud based on a composite algorithm of extensible clustering and the fuzzy analytic hierarchy process (FAHP), which utilizes an improved extended clustering algorithm combined with the FAHP to achieve the optimal guide roller production equipment for optimal collaborative manufacturing resource selection. Shi et al. [9] used an extended comprehensive evaluation method to achieve the optimal selection of the set of manufacturing resources for sewing machine housings on the basis of ontology modeling of manufacturing resources. Rodriguez et al. [10] focused on large-scale QoS combination-aware service combination and proposed a hybrid method for the automated combination of Web services to minimize the number of services in the resultant combination. Du et al. [11] designed an edge service combination model and proposed an edge service combination method based on the BAS optimization algorithm. Timing et al. [12] proposed a multi-objective optimization algorithm based on a coarse-grained model of sub-component layers, which improves the performance of Web service combination optimization. However, a manufacturing resource composition optimization method for the wallboard of a coating machine has not yet been proposed, which is one of the research directions of this paper.
For the construction of a multi-objective normalization model, Yue et al. [13] established a cutting energy consumption model with an AITiCrN-coated tool as the research object; Zhang et al. [14] proposed a new video semantics-based resource virtualization representation framework, which supports real-time updating, state monitoring, and authenticity auditing of virtual resources; Liu et al. [15] developed a dynamic multi-objective optimization model with interactivity and uncertainty for real-time reservoir flood control operations; Rahmani et al. [16] proposed a new DTR model considering transmission lines and a new multi-objective solution method for security-constrained optimal tidal current problems in power system operation. However, wallboards for coating machines have not been modeled, and current research fails to consider the interests of both the demand side of cloud manufacturing services for wallboards and the operators of wallboard collaboration platforms.
For the manufacturing resource composition optimization decision, Liang et al. [17] proposed a Qos-Aware collaborative manufacturing service composition optimization method based on a deep reinforcement learning algorithm and achieved the optimal recommendation of the manufacturing service composition through model training. Zhou et al. [18] proposed a manufacturing service composition optimization algorithm for the collaborative problem of logistics and manufacturing services in a cloud manufacturing environment, and simultaneously generated a scheduling scheme for both machining tasks and logistics tasks. Zhao [19] combined the fuzzy c-mean clustering algorithm and genetic algorithm to propose a method for grouping manufacturing resources based on manufacturing features and aggregate features; moreover, meta-heuristic algorithms have been widely used for solving service composition optimization problems. Common methods include the Multi-Objective Genetic algorithm [20] (NSGA-II), Particle Swarm Optimization (PSO) algorithm [21], Artificial Bee Colony (ABC) algorithm [22] (ABC), and the PBO algorithm [23]. The PBO algorithm simulates the search strategy of polar bears in the Arctic environment, which shows good performance on classical test functions for low-dimensional optimization problems and, at the same time, can effectively deal with dynamically changing environments for dynamic optimization problems. It has been used in the construction of smart grid systems [24], the composition optimization algorithm for economic emission scheduling [25], the arrangement of fuel assemblies in the core of nuclear reactors [26], and prediction of thermophysical properties of chemicals [27], among others, have been widely used. The PBO algorithm provides a new idea for wallboard manufacturing resource composition optimization, but it still faces the problems of slower convergence and a tendency to fall into a local optimum.
Although there have been a large number of studies on multi-objective modeling and manufacturing resource portfolio optimization decision making, there are fewer related studies on coating machine wallboards. In summary, the following deficiencies in manufacturing resource composition optimization for coating machine wallboards exist at present:
  • The results of the evaluation of wallboard manufacturing resources are subjective and inadequately supported by data.
  • There is a lack of models and efficient solution algorithms related to the actual production of wallboards.
To this end, this paper proposes a resource composition optimization method for wallboard manufacturing based on the IPBO algorithm, which works as follows:
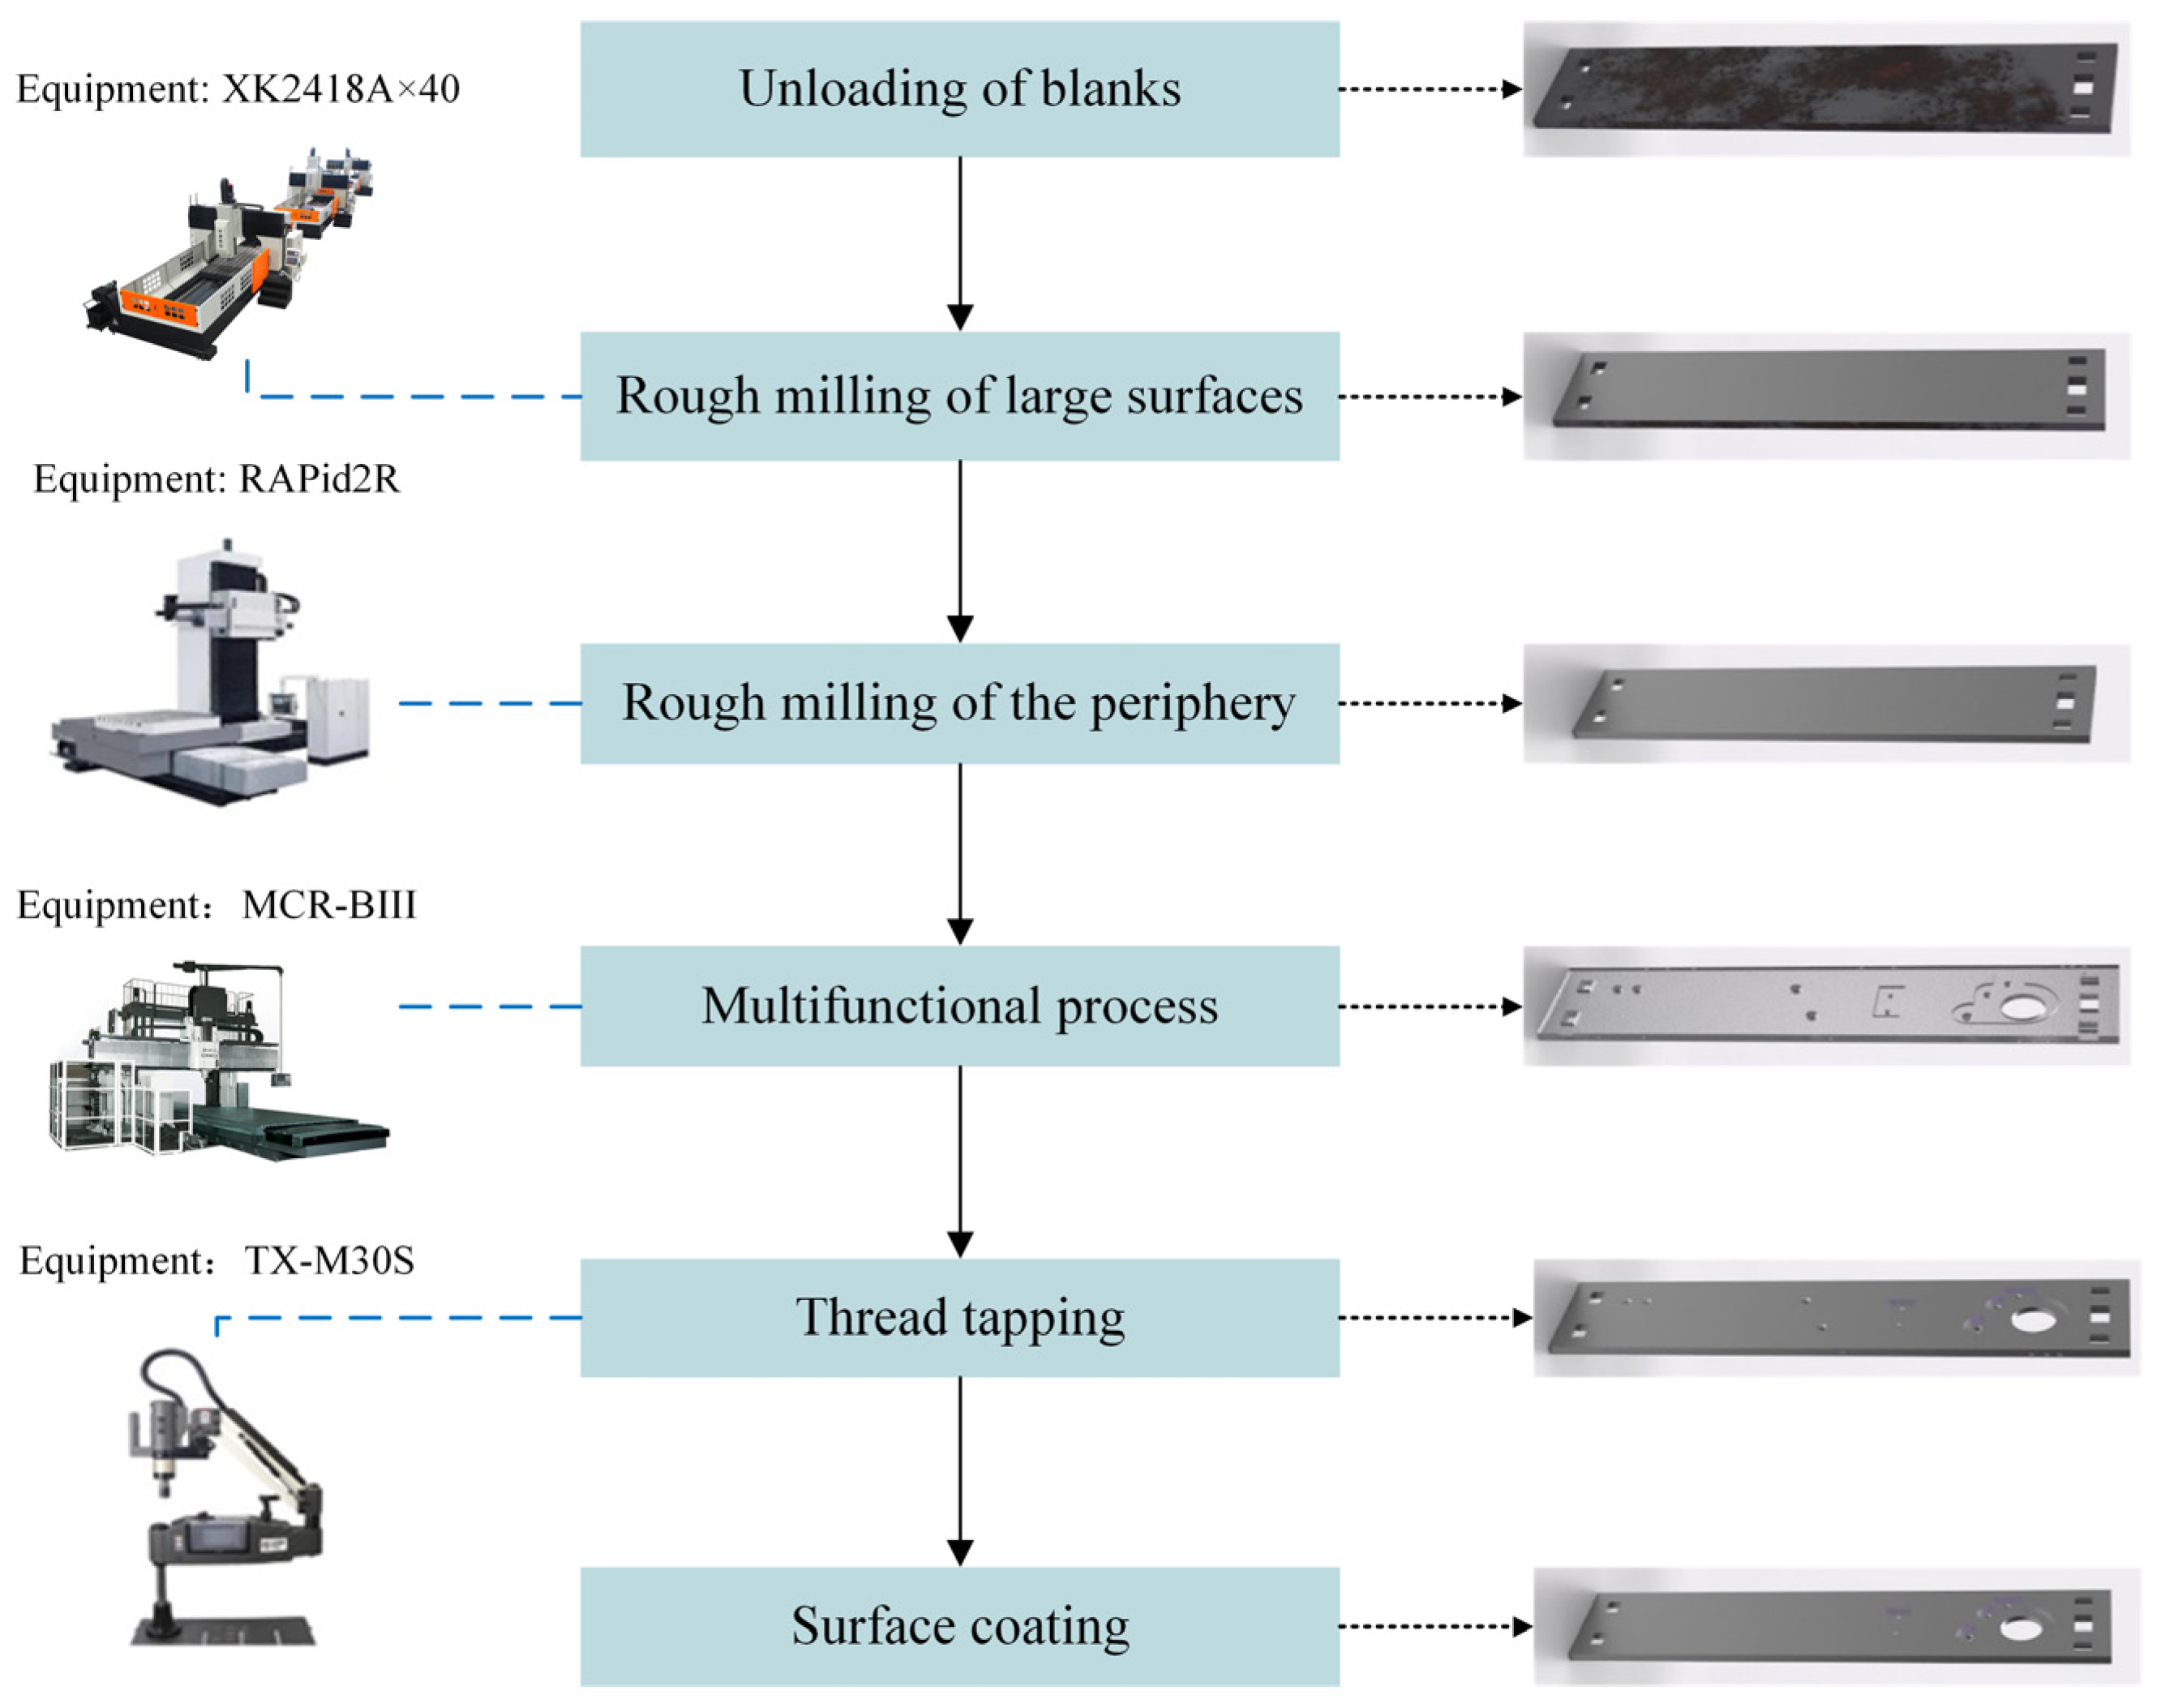
  • Based on the actual production research, the processing technology of the wallboard is analyzed, and the task decomposition of wallboard manufacturing process level is realized.
  • A manufacturing resource composition evaluation indicator system for wallboards is proposed, and a non-cooperative game decision is used to construct a wallboard manufacturing resource composition optimization model.
  • The PBO algorithm is improved from two perspectives: adaptive horizon and mutation strategy, and the IPBO algorithm is applied to solve the model.
The experimental results demonstrate that the IPBO algorithm has lower adaptation compared to the other five algorithms, and the average convergence time is improved by 6.51% and the optimal convergence time is improved by 9.26% compared to the suboptimal DBO algorithm. Meanwhile, the Pareto front of the IPBO algorithm is more in line with the preference criteria for modeling and has advantages in solving the large-scale scaling problem.

2. Materials and Methods
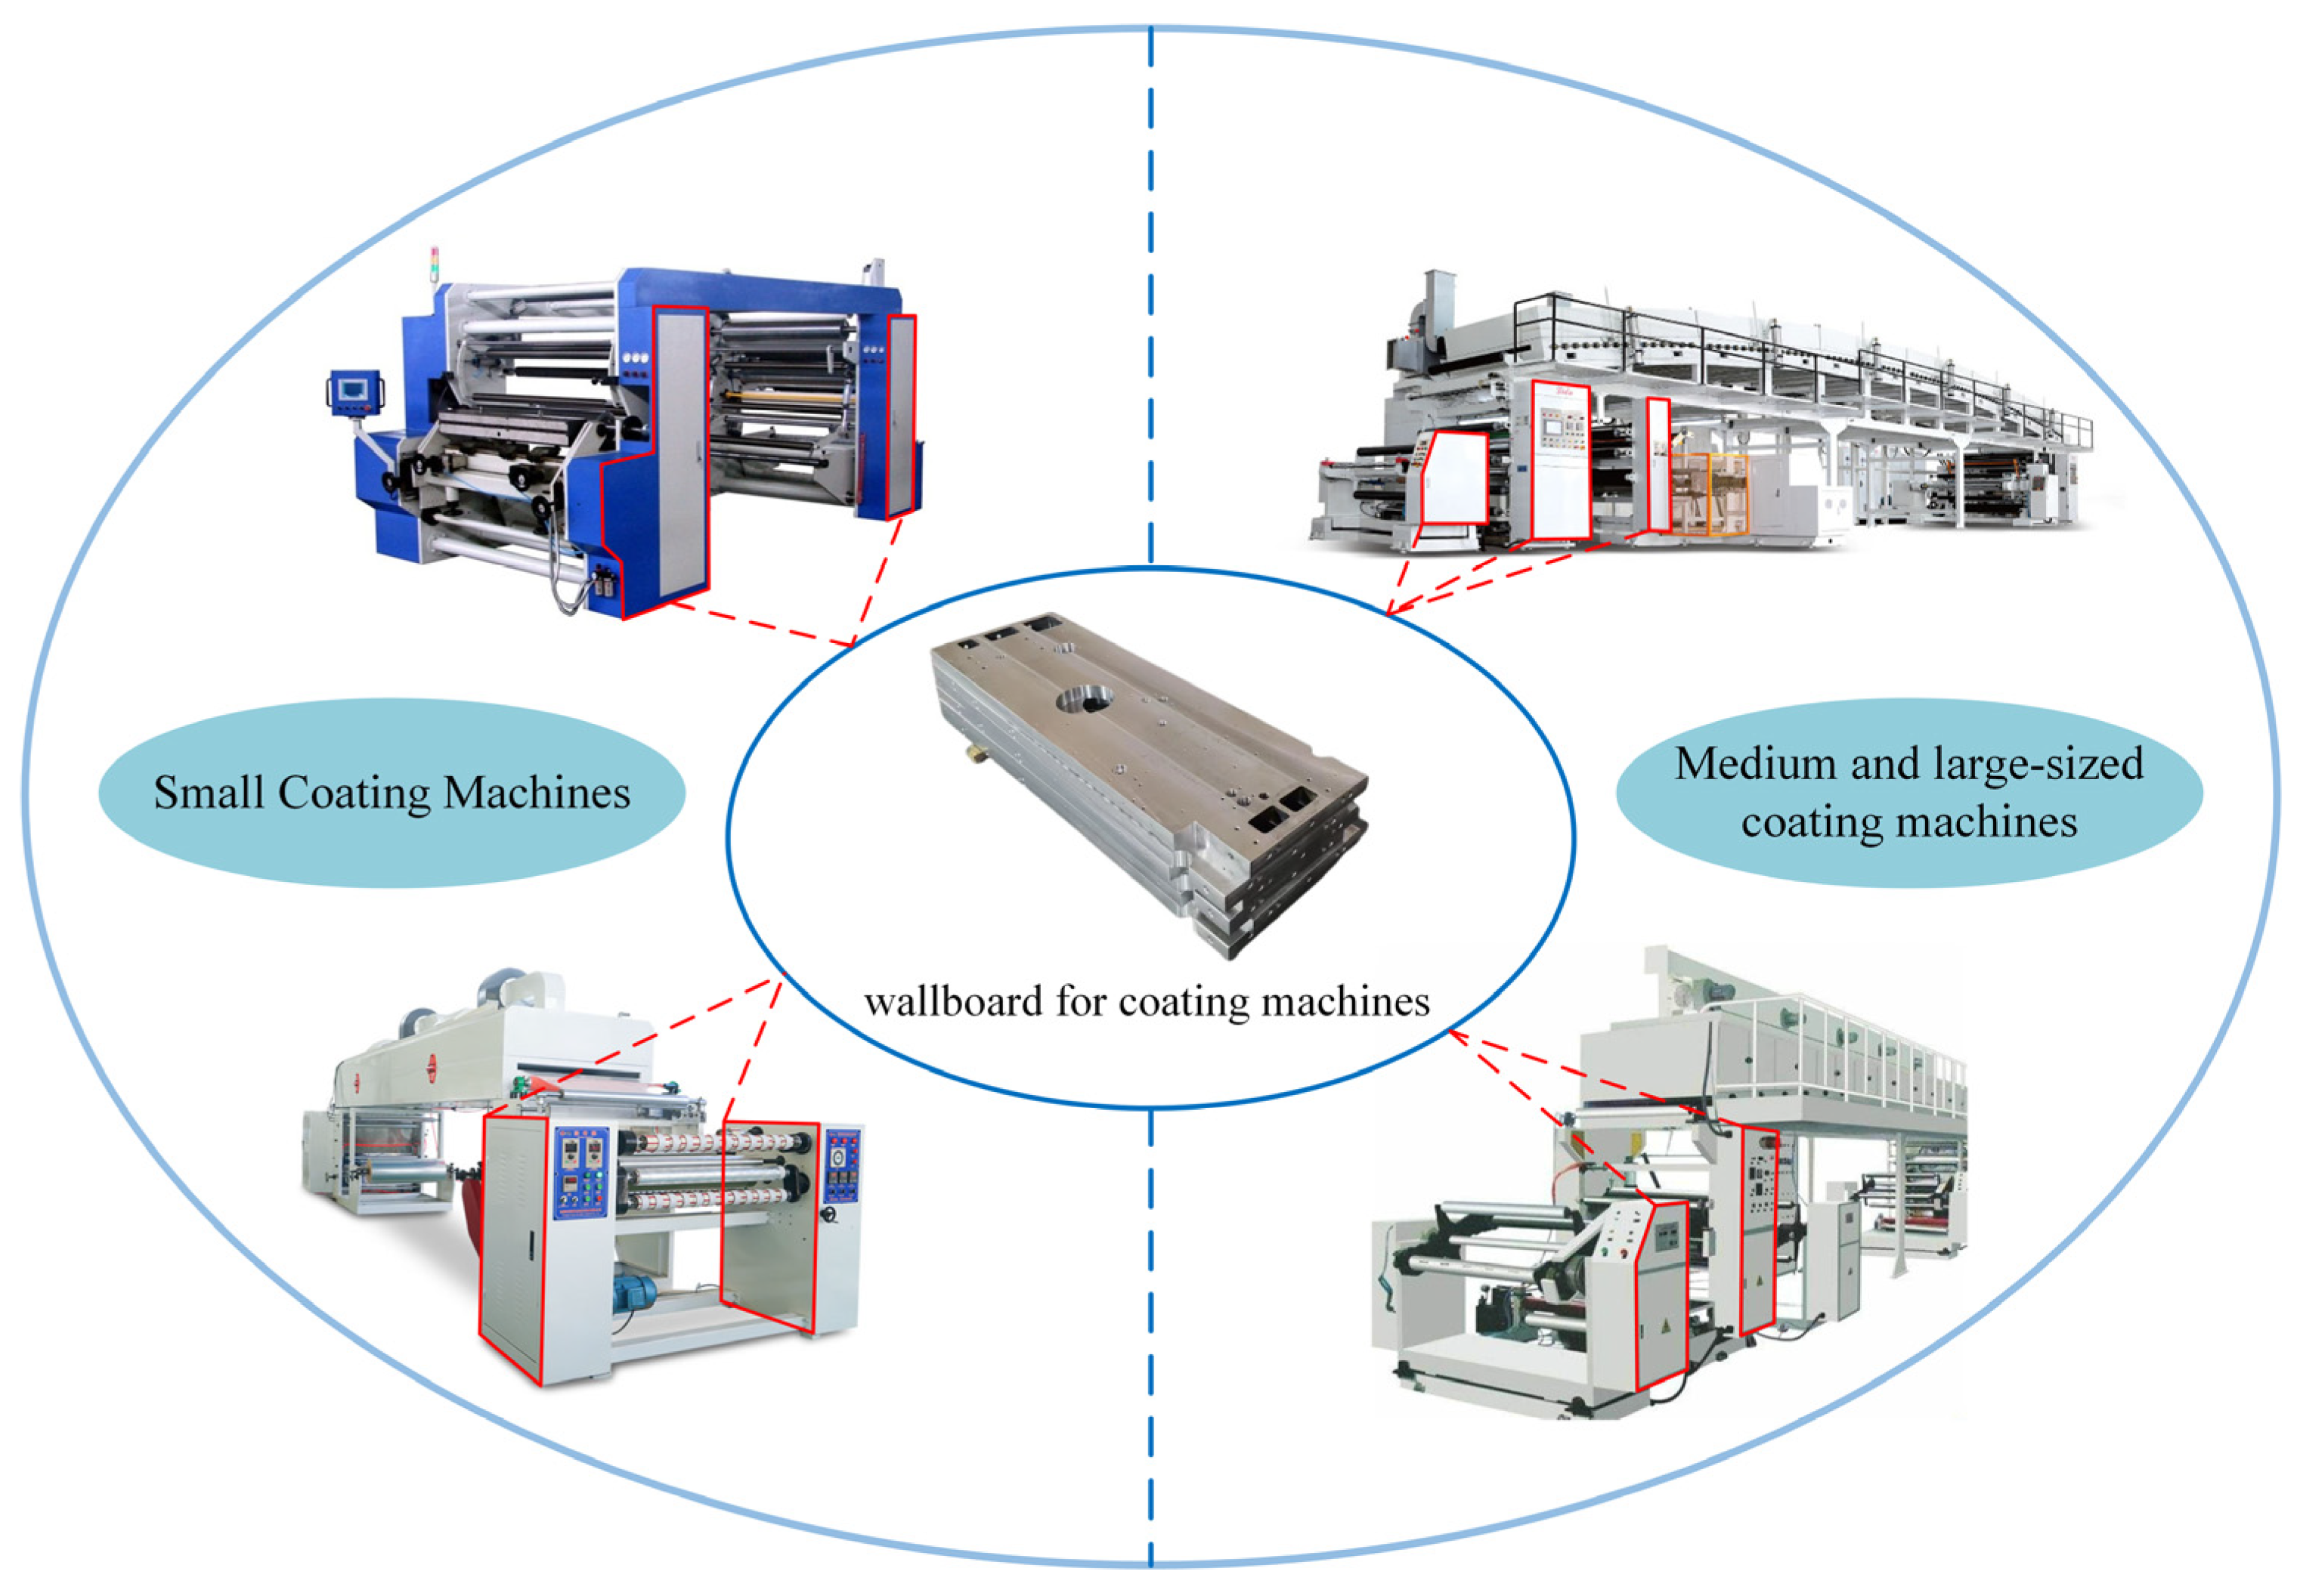
2.1. Materials

Manufacturing resource analysis and task decomposition: This paper takes the wallboard of the coating machine as the research object. Through the actual production research, we get the manufacturing process flow and required manufacturing resources of the wallboard, as shown in Figure 2. According to the corresponding processing equipment, the wallboard manufacturing task is decomposed into six processes: blank discharging, rough milling of the large surface, fine milling of the periphery, composite machining, tapping of the screw holes, and painting of the surface.

2.2. Analysis of Wallboard Resource Composition Optimization Issues

Under cloud manufacturing conditions, after the cloud platform receives a manufacturing demand issued by a user, the demand is transformed into a corresponding manufacturing task, and the cloud platform decomposes the manufacturing task issued by the user into multiple highly integrated process manufacturing subtasks according to specific rules and restrictions. These manufacturing sub-tasks can be accomplished independently by a certain manufacturing resource or by a combination of certain manufacturing resources. Subsequently, based on specific manufacturing requirements, the manufacturing resources that meet the criteria are filtered out and effectively integrated to form the optimal manufacturing resource combination that achieves the desired goal. The manufacturing resource composition optimization process is shown in Figure 3.
The manufacturing service combination and optimization process consists of three parts.
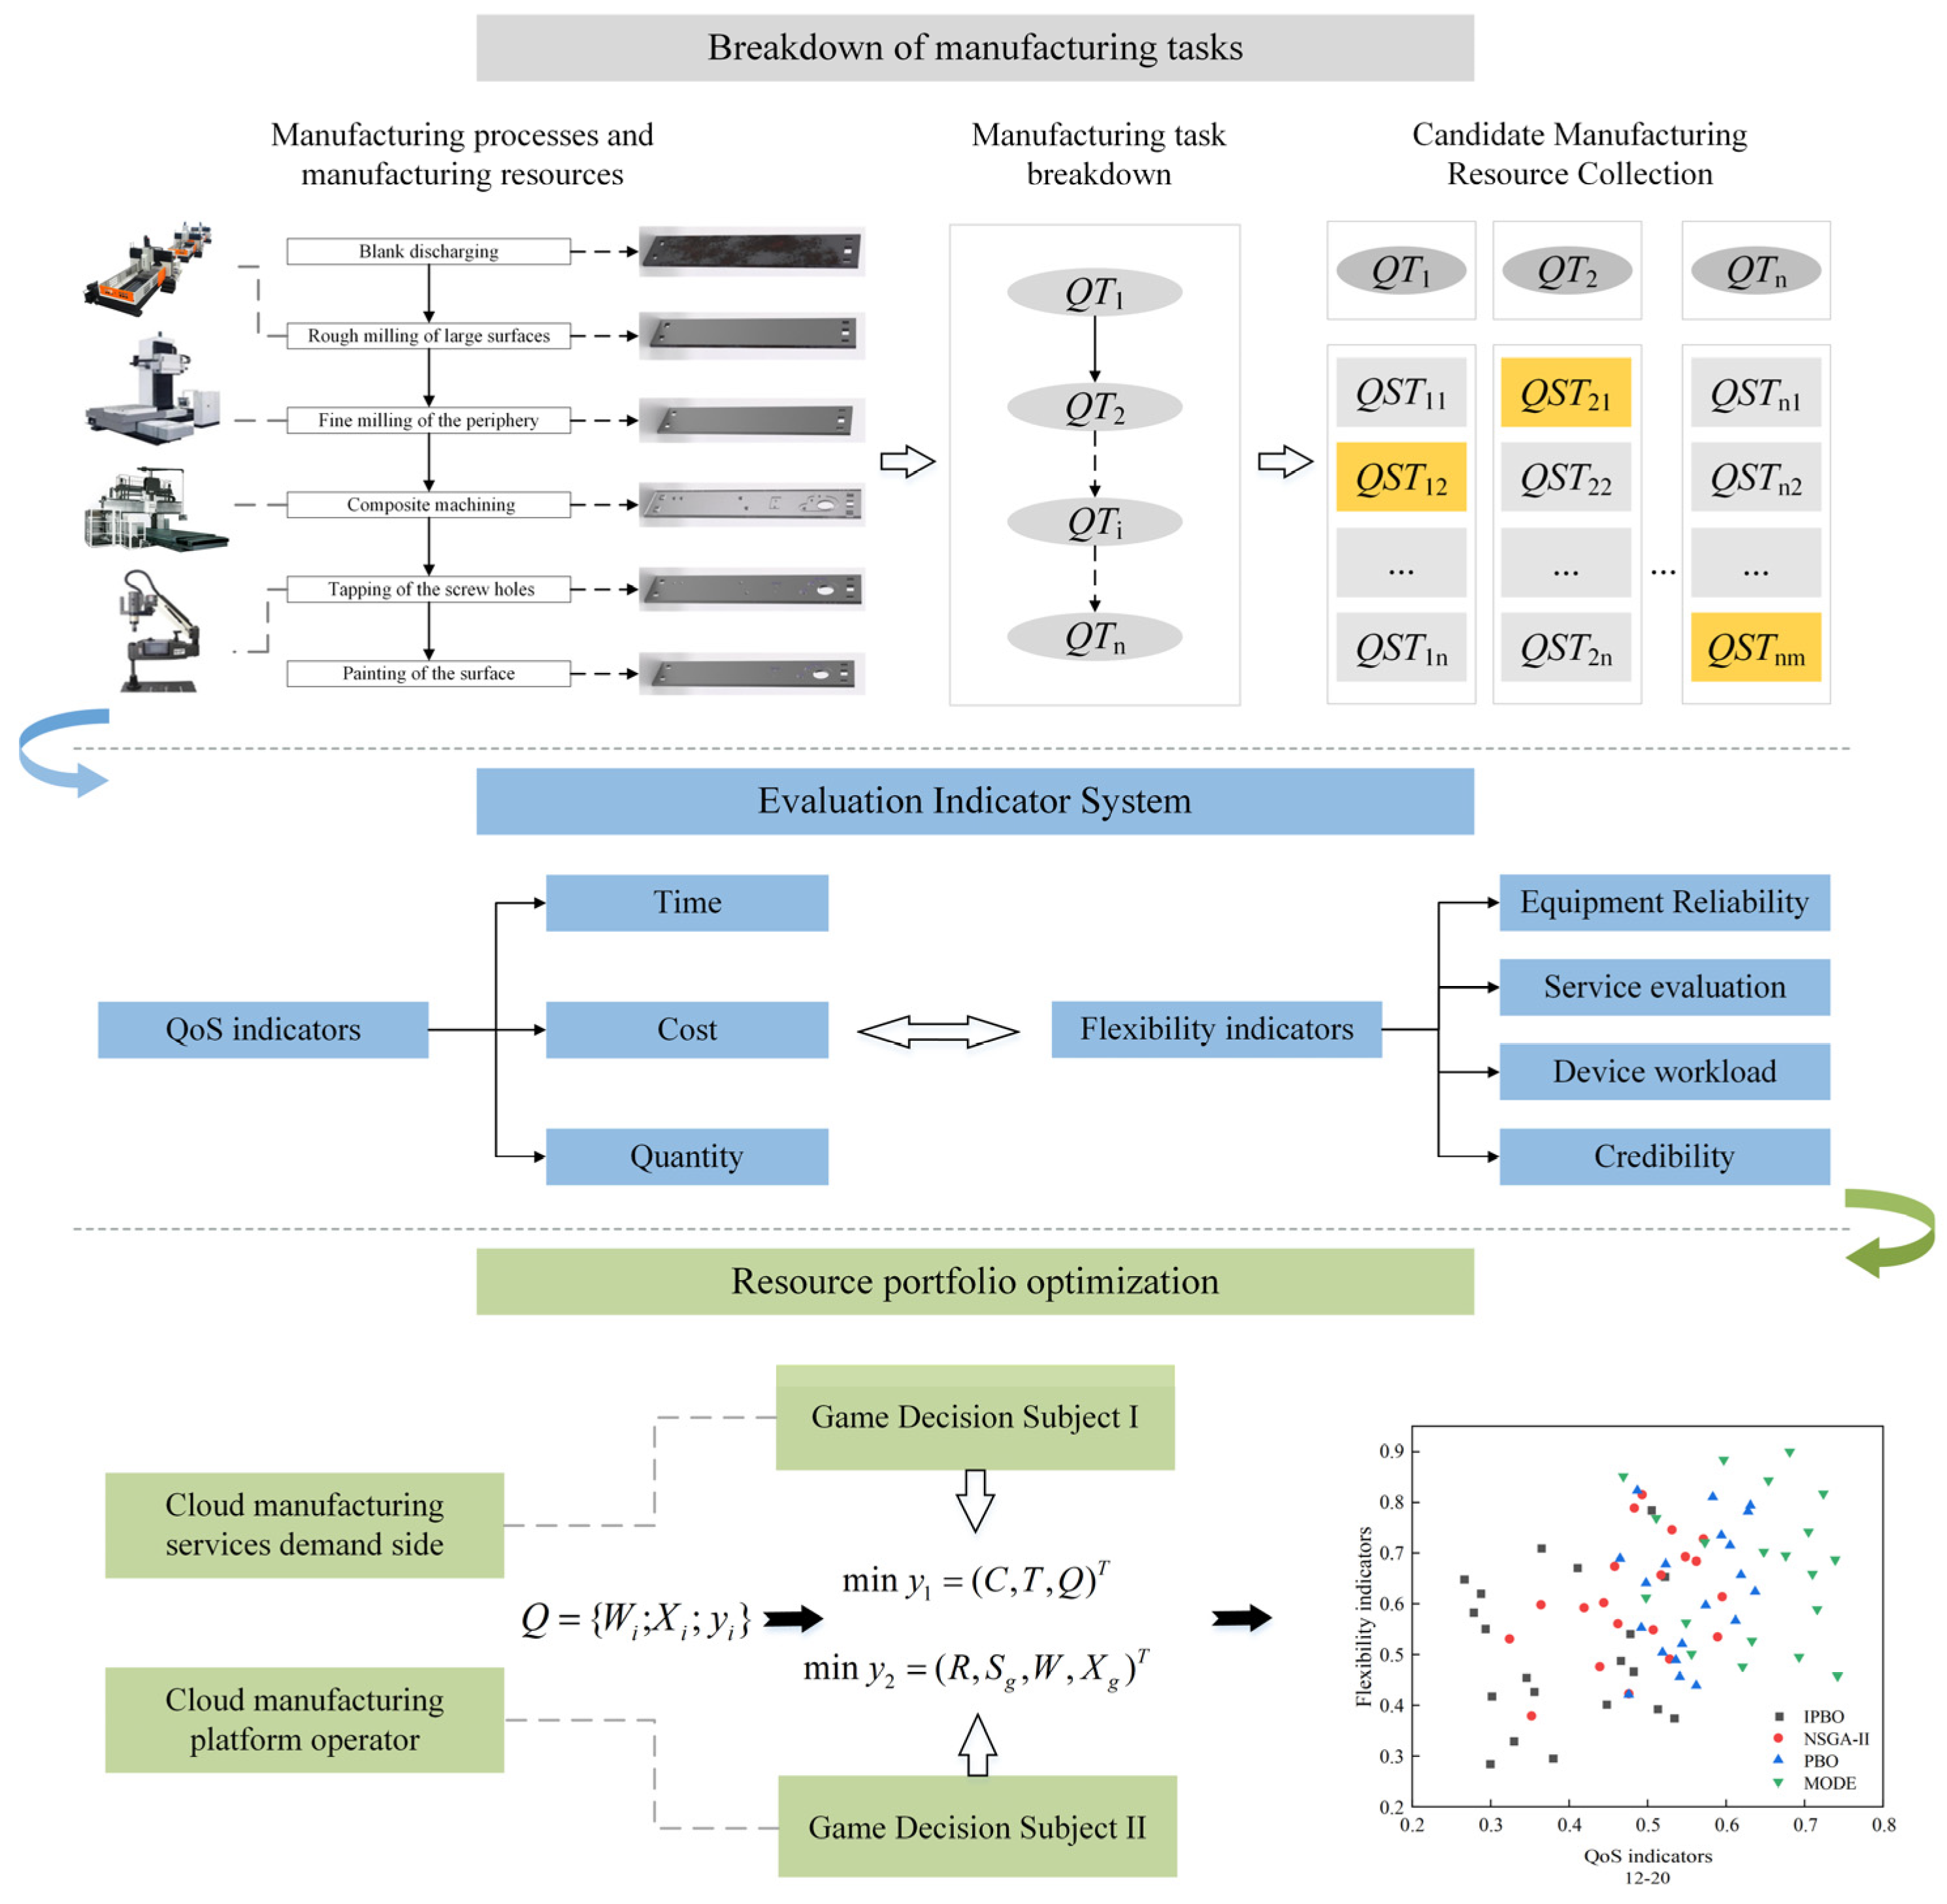
  • Manufacturing resource analysis and task decomposition: Based on the wallboard manufacturing requirements put forward by the user, the cloud platform first disassembles the overall manufacturing task into multiple process manufacturing sub-tasks, and then carries out the subsequent processing based on the functional and non-functional attributes of these process manufacturing sub-tasks. Match the manufacturing resources that satisfy the wallboard processing requirements and form the set of candidate manufacturing resources QTi, QTi = {QSTi,1, QSTi,2, QSTi,3, …, QSTi,n}, where QTi denotes the set of wallboard manufacturing resources corresponding to the ith wallboard manufacturing process sub-task, and QSTi,j denotes the ith candidate wallboard manufacturing resource and the jth wallboard manufacturing resource in the set.
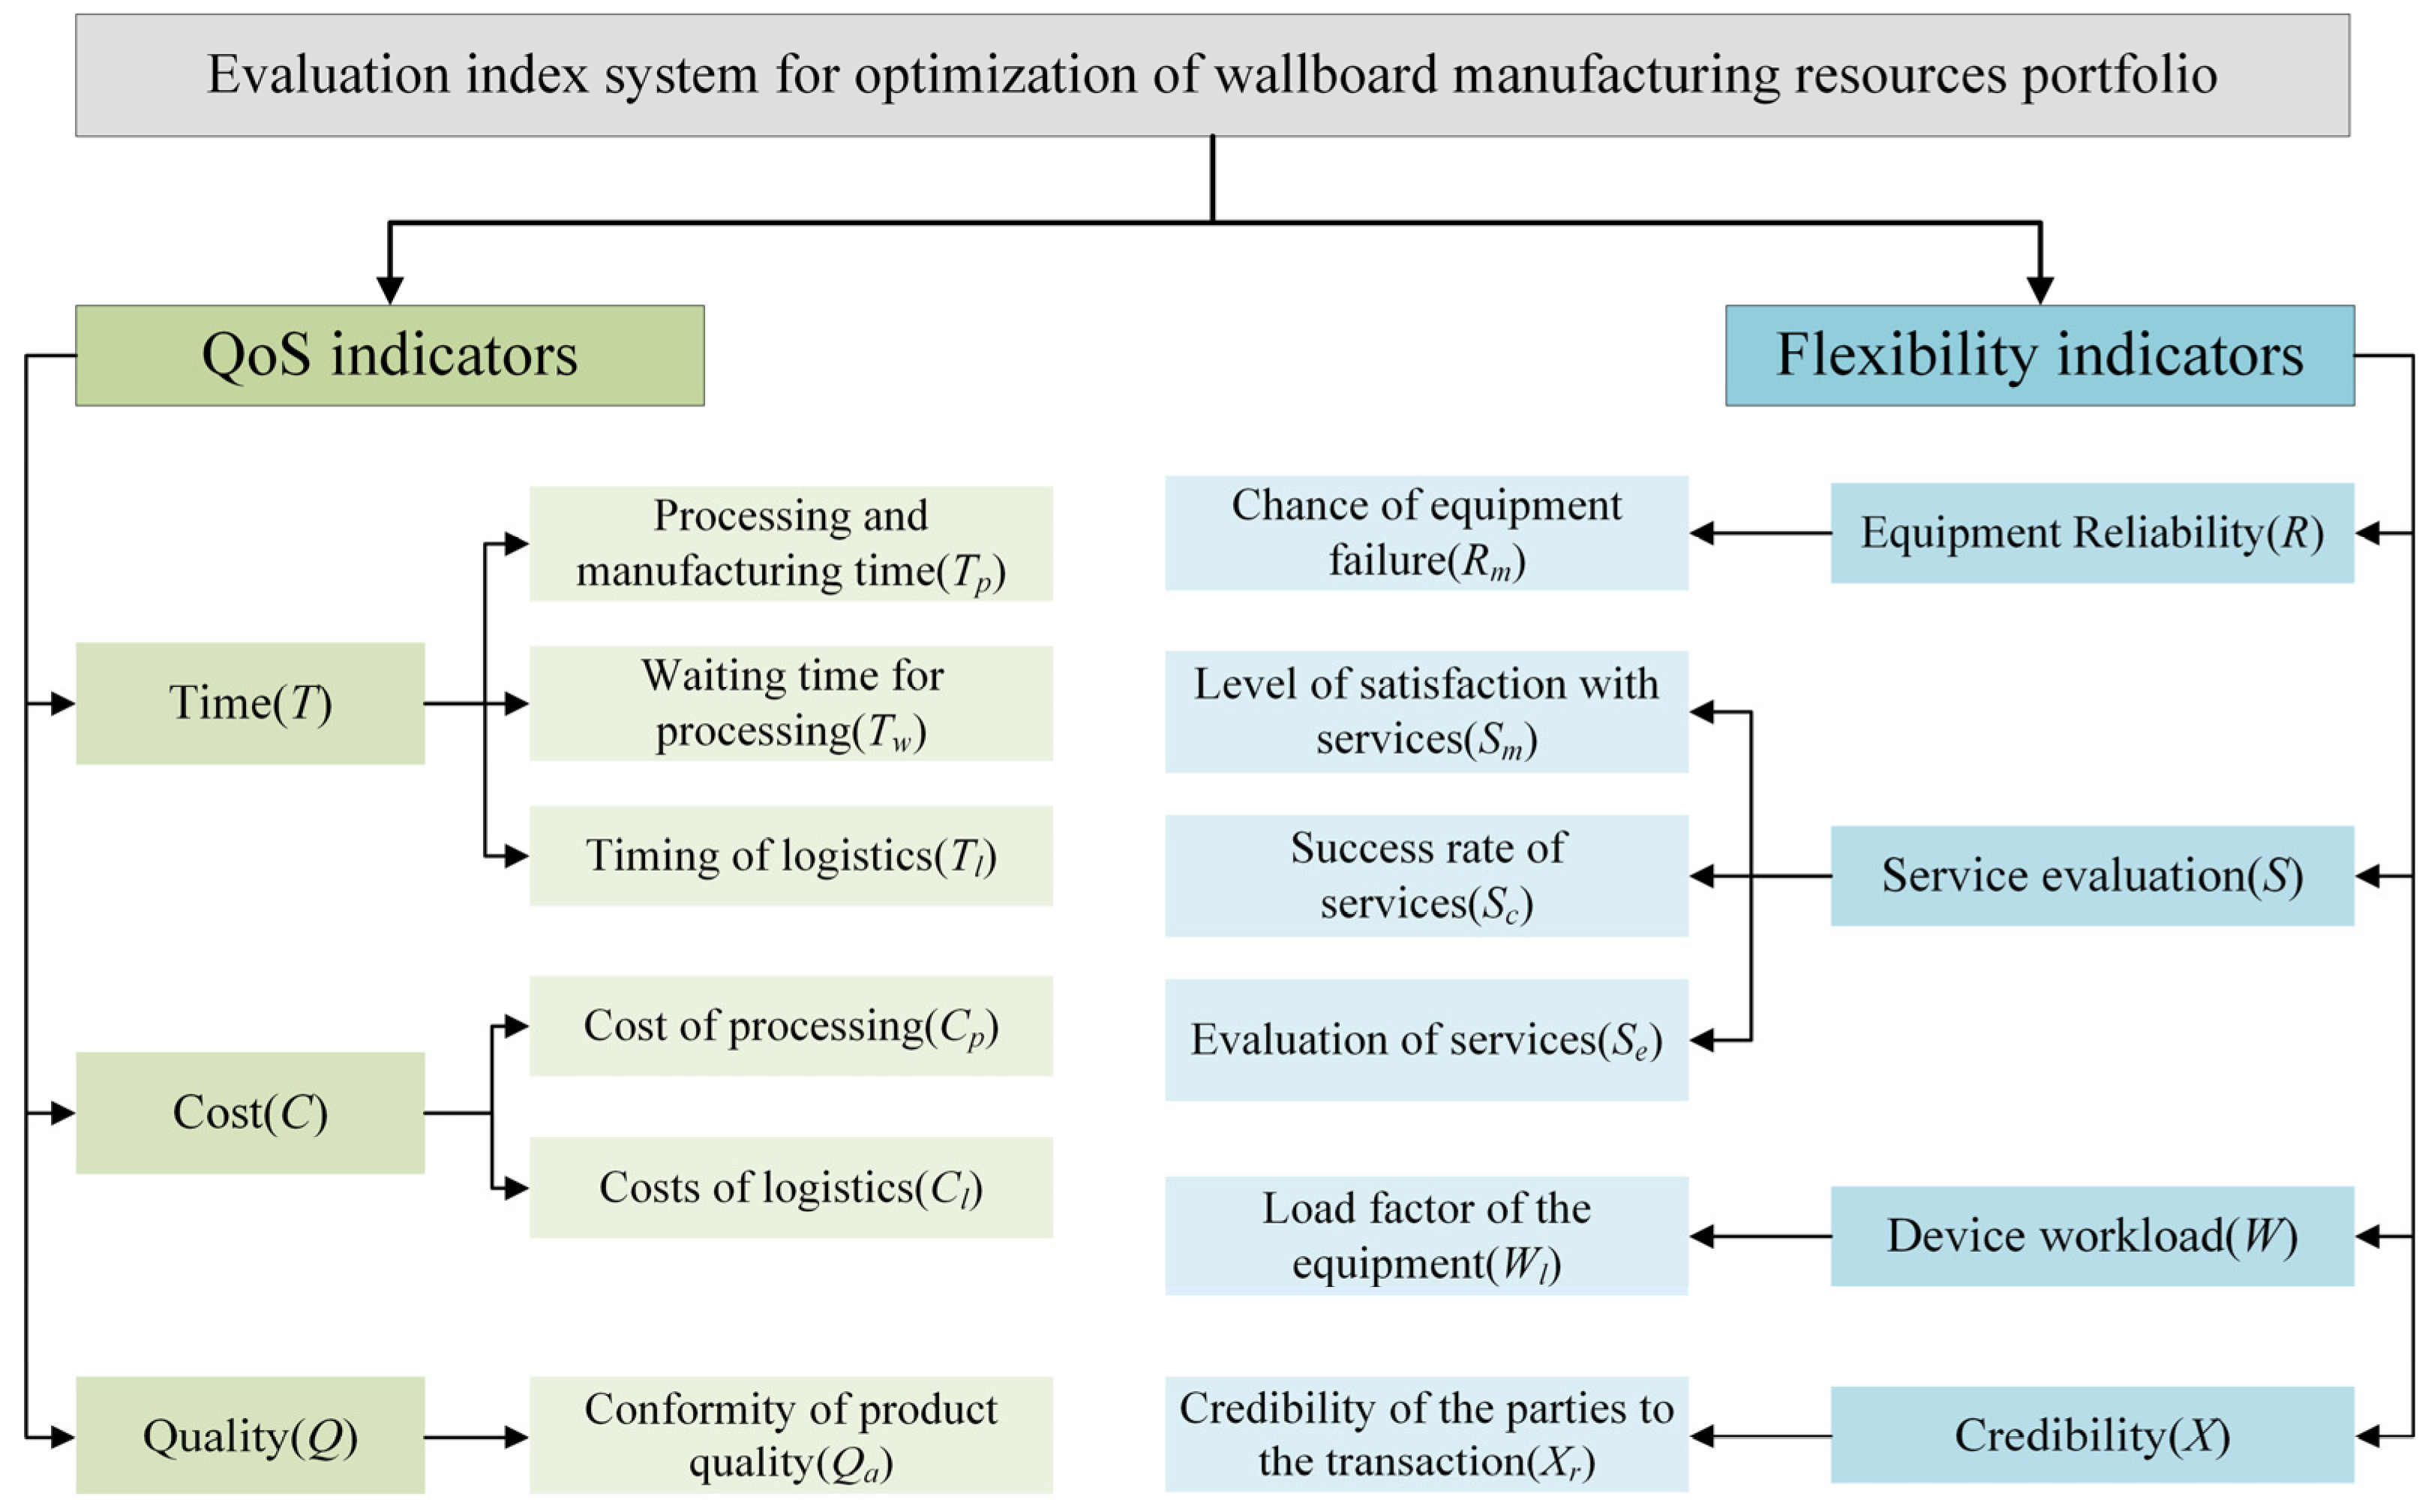
  • Construct a manufacturing resource composition optimization indicator system: Constructing a reasonable indicator system can help organizations and individuals optimize resource allocation more effectively and promote continuous improvement. From the aspects of QoS indicators and flexibility indicators, consider the common interests of the demand side and the operation side, and construct a portfolio optimization assessment indicator system.
  • Manufacturing resource composition optimization method: In order to meet the demand of manufacturing tasks, these manufacturing resources are combined to complete the manufacturing tasks together. The non-cooperative game idea is used to construct the manufacturing resource composition optimization model, and the IPBO algorithm is used to solve the problem of composition optimization of manufacturing resources.

2.3. Wallboard Manufacturing Resource Composition Optimization Evaluation Indicator System

The participants in wallboard collaborative manufacturing include the demand side of wallboard cloud manufacturing services and the wallboard collaborative platform operator, where the service demand side is further divided into the demand side of wallboard manufacturing resources and the wallboard manufacturing resource provider. When making an optimization choice for wallboard manufacturing resource composition, it is necessary to take into account the interests of both parties and the uncertainties that may occur in the manufacturing process. Therefore, this paper divides the evaluation system into two dimensions, service quality and flexible service evaluation, in order to provide a comprehensive assessment of manufacturing resource composition optimization. The established evaluation indicator system for wallboard manufacturing resource composition optimization is shown in Figure 4.
The QoS indicators of the wallboard manufacturing resource composition optimization evaluation index system include time T, cost C, and quality Q. Among them, the time indicator is further divided into processing time Tp, waiting time Tw, and logistic time Tl; the cost indicator is divided into processing cost Cp and logistic cost Cl; and the quality indicator is expressed by the average quality qualification rate of a single manufacturing resource, Qa, i.e., the quality qualification rate of the manufacturing resource provider for the completion of manufacturing tasks. The quality indicator is expressed by the average quality pass rate Qa of a single manufacturing resource, i.e., the quality pass rate of the manufacturing task completed by the manufacturing resource provider.
In addition, the state of both trading parties when completing the manufacturing task should also be considered; therefore, the flexibility indicators of the evaluation index system of wallboard manufacturing resource composition optimization are proposed. The flexibility indicators include equipment reliability R, service evaluation S, device workload W, and credibility X. Among them, the equipment reliability indicator is expressed in terms of the failure rate of processing equipment Rm; the service evaluation indicators include service satisfaction Sm, service success rate Sc, and evaluation of service Se; the workload indicator is expressed in terms of the load factor Wl of the processing equipment; and the credibility indicator is expressed in terms of the credibility Xr of the parties to the transaction.

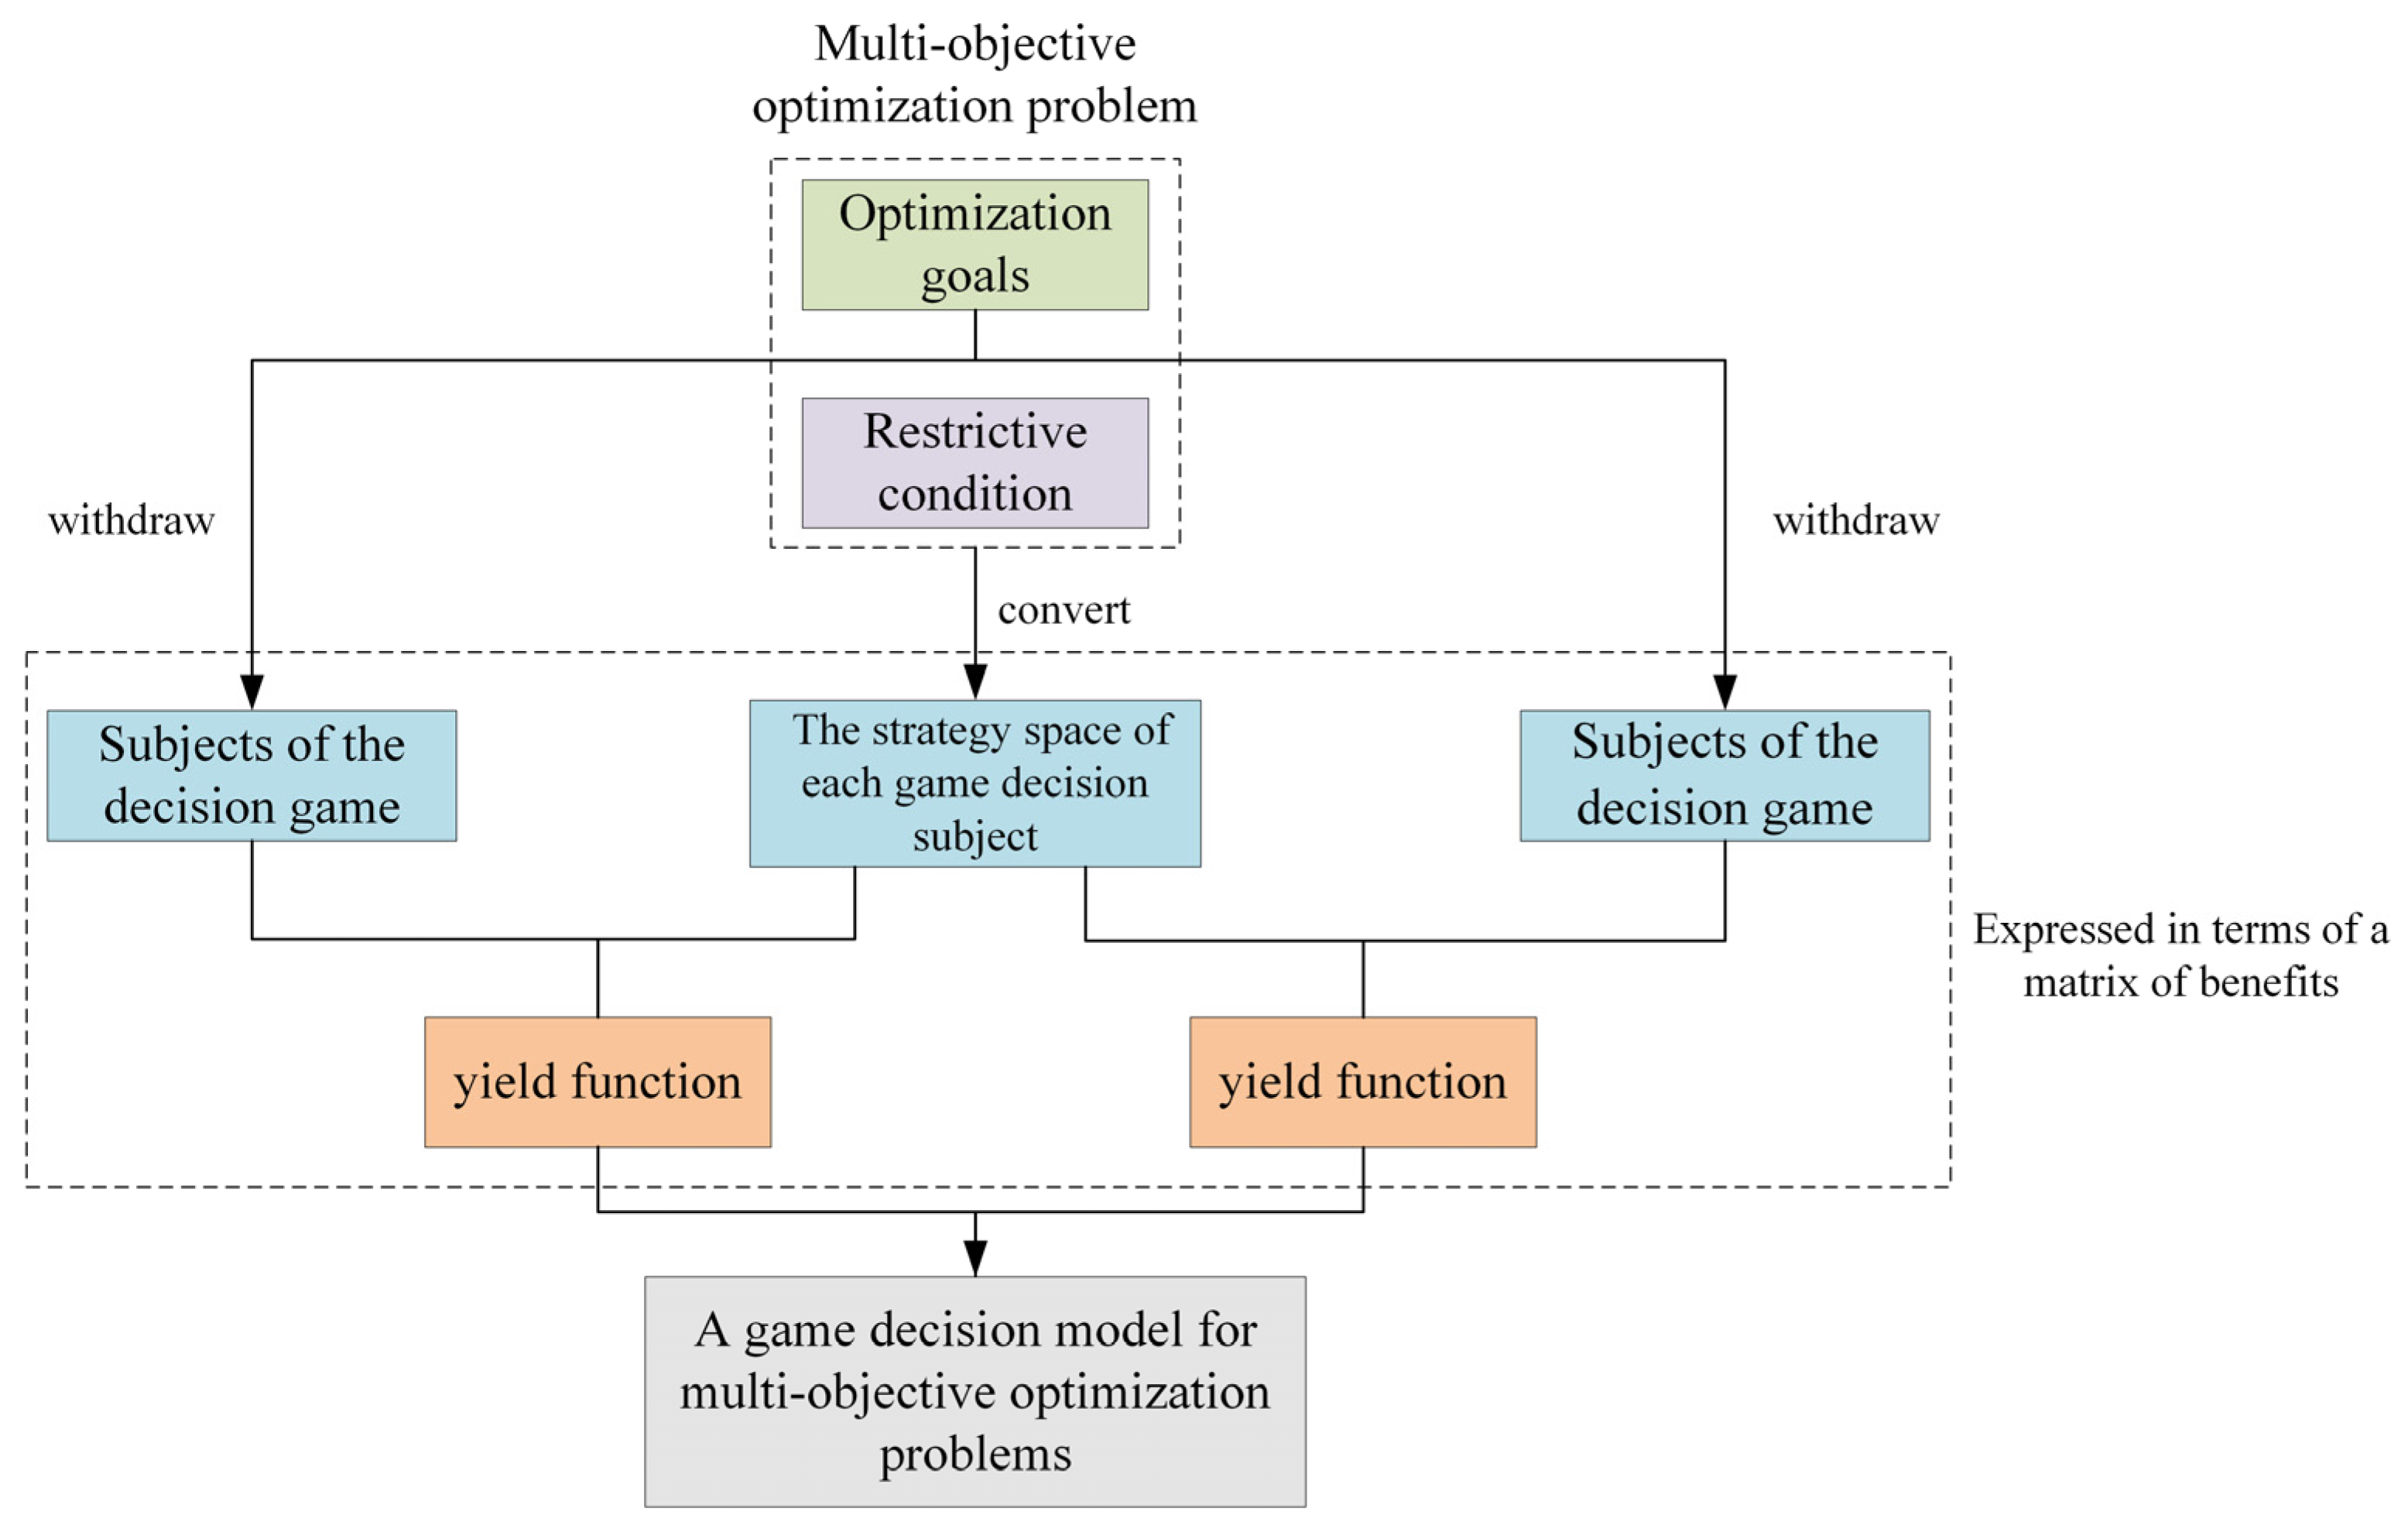
2.4. A Resource Composition Optimization Model for Cloud Manufacturing of Wallboards Based on Non-Cooperative Game

After establishing the evaluation indicator system of the wallboard manufacturing resource composition optimization, a non-cooperative game [28] is introduced to model the above system. A non-cooperative game is a branch of game theory. In the realization process of a non-cooperative game task, both sides of the game will tend to maximize their own interests and make decisions according to their own information and interests. Its decision-making model is shown in Equation (1).
Q = { W i ; X i ; y i   ( i = 1 , 2 , , n ) }
where Wi denotes the game subject, Xi denotes the strategy space, and yi denotes the payoff function.
In this paper, the demand side of wallboard cloud manufacturing service and the operator of the cloud manufacturing platform are taken as two game subjects, and the non-cooperative game decision-making model construction process is shown in Figure 5.
Based on the evaluation indicator system of wallboard manufacturing resource composition optimization established above, the cloud manufacturing resource composition optimization model of the wallboard is established as follows.
  • A single game decision subject model for QoS indicators:
QoS decision indicators include time T, cost C, and quality Q, which need to be satisfied with the least total time; the least total cost; and the highest pass rate. As shown in Equation (2),
min T = w p T p + w w T w + w l T l = w p i = 1 n T p ( i ) / n + w w i = 1 n T w ( i ) / n + w l i = 1 n T l ( i ) / n min C = w p C p + w l C l = w p i = 1 n C p ( i ) / n + w l i = 1 n C l ( i ) / n min Q = i = 1 n 1 Q a ( i ) / n
The objective function of a single game decision maker for wallboard manufacturing resources is established based on the above indicators. In addition, the manufacturing resource has its constraints, in which the total time T of the collaborative manufacturing service should be less than the maximum time Tmax specified by the demand side; the total cost C of the collaborative manufacturing service should be less than the maximum cost Cmax provided by the demand side; and the quality of the product after the completion of the collaborative manufacturing service, Q, should be greater than the minimum quality Qmin proposed by the demand side. Therefore, based on the indicators and constraints mentioned above, the established objective function of the QoS single game decision body model for wallboard manufacturing resources is shown in Equation (3).
min y 1 = ( C , T , Q ) T s . t . T T max   C C max   Q ( i ) Q min , i = 1 , 2 , , n
2.
A single game decision subject model with flexible indicators:
The items in flexible decision-making need to satisfy the highest reliability, i.e., the lowest equipment failure rate; the highest service evaluation; the most appropriate workload, which here translates into the lowest value; and the highest reputation. As shown in Equation (4),
min R = i = 1 n R m ( i ) / n max S = w m S m + w c S c + w e S e = w m i = 1 n S m ( i ) / n + w c i = 1 n S c ( i ) / n + w e i = 1 n S e ( i ) / n min W = i = 1 n W l ( i ) / n max X = i = 1 n X r ( i ) / n
The objective function of a single game decision subject at the flexible end is established based on the above indicators. In addition, the flexibility indicator has its own constraints, in which the comanufacturing service reliability R should be greater than the minimum reliability Rmin, the service evaluation S should be higher than the specified minimum service evaluation Smin, the credibility X should be higher than the specified minimum credibility Xmin, and the workload W, i.e., the equipment loading rate, should range from 60% to 80%, with close to 70% being preferred.
Therefore, based on the above indicators and constraints, the objective function of the flexible single-game decision subject model for wallboard manufacturing resources is established, as shown in Equation (5), where PM(W) is the defined penalty function, and exb is a fairly large value. The penalty function limits W to the specified range, while the smaller W obtained finally indicates the more qualified Sg = 1/S, Xg = 1/X. Rmin, Smin, and Xmin represent the minimum reliability, the minimum service evaluation, and the minimum credibility that the demand side can accept, respectively.
  min   y 2 = ( R , S g , W , X g ) T s . t . R ( i ) R min , i = 1 , 2 , , n ;   S ( i ) S min , i = 1 , 2 , , n ;   X ( i ) X min , i = 1 , 2 , , n ;   W l ( i ) = i = 1 n ( W l i - 70 % ) 2 + i = 1 n P M ( W l i ) P M ( W ) = 0         if   60 % < = W < = 80 % e x b   if   W < 60 % or   W > 80 %  
3.
A resource composition optimization model for cloud manufacturing of wallboards:
Based on the QoS indicator optimization model and flexibility indicator optimization model for wallboard manufacturing resources established above, the non-cooperative game decision-making model is established, as shown in Equation (6). In the model, the two parties involved in the game compete by using their respective benefit functions, aiming to maximize their own interests. This not only ensures that the interests of the demand side of wallboard manufacturing services are satisfied, but also ensures that the collaborative manufacturing task can be executed smoothly.
min y 1 = ( C , T , Q ) T s . t . T T max   C C max   Q ( i ) Q min , i = 1 , 2 , , n   min   y 2 = ( R , S g , W , X g ) T s . t . R ( i ) R min , i = 1 , 2 , , n ;   S ( i ) S min , i = 1 , 2 , , n ;   X ( i ) X min , i = 1 , 2 , , n ;   W l ( i ) = i = 1 n ( W l i - 70 % ) 2 + i = 1 n P M ( W l i ) P M ( W ) = 0         if   60 % < = W < = 80 % e x b   if   W < 60 % or   W > 80 %

2.5. PBO Algorithm

The PBO algorithm is a nature-inspired optimization algorithm derived from the survival and behavioral patterns of polar bears in the harsh natural environment of the Arctic. First, polar bears need to move with the help of an ice floe until they find prey, which corresponds to global search; when they find prey, they will approach it as soon as possible and finish hunting, which corresponds to local search; at the same time, the reproduction and death strategies of polar bears are introduced to dynamically adjust the population size, which reduces the amount of computation during each iteration.

2.5.1. Global Search

The global search can be viewed as the movement of the ice floe itself when the polar bear’s movement on the ice floe is not taken into account. The ice floe drift formula as shown in Equation (7):
X ¯ j t ( i ) = X ¯ j t 1 ( i ) + s i g n ( w ) α + γ
where α is a random number of (0, 1], γ is a random number of [0, ω], and ω is a segmented function that denotes the Euclidean distance between the current polar bear’s position and the best-positioned polar bear in the population; it is calculated as shown in Equation (8):
w = i = 1 n ( x i b e s t x i ) 2
where n denotes the individual dimension, xibest denotes the ith dimension of the best individual, xi denotes the ith dimension of the current individual, and ω denotes the Euclidean distance between the current individual and the best individual.

2.5.2. Local Search

When a polar bear finds a prey, it will approach the prey and search for the best position. At this time, the hunting behavior of the polar bear is described by a modified cloverleaf equation, which is shown in Equation (9):
x 0 n e w = x 0 o l d ± r cos φ 1 x 1 n e w = x 1 o l d ± r [ sin φ 1 + cos φ 2 ] x 2 n e w = x 2 o l d ± r [ sin φ 1 + sin φ 2 + cos φ 3 ] x n 2 n e w = x n 2 o l d ± r [ k = 1 n 2 sin φ k + cos φ n 1 ] x n 1 n e w = x n 1 o l d ± r [ k = 1 n 1 sin φ k + cos φ n ]
where xinew denotes the coordinates on the ith dimension after local search; xiold denotes the coordinates on the ith dimension before a local move; φi denotes the random number on the ith dimension and φi ∈ [0, 2π]; + denotes the positive direction searching, and − denotes the negative direction searching; and r denotes the field of view of the polar bear. The field of view is computed as shown in Equation (10):
r = 4 α × cos φ 0 sin φ 0
where α denotes the visible distance, and φ0 ∈ [v0, 2π] denotes the inclination of the polar bear toward its prey.

2.5.3. Reproduction and Death

The PBO algorithm controls population size by modeling the reproduction and mortality of polar bears with an initial population size of 75% of the maximum population size, N. The PBO algorithm is designed to control population size by modeling the reproduction and mortality of polar bears. Reproduction and mortality are controlled in each iteration by Equation (11):
d e a t h if       k < 0.25 r e p r o d u c t i o n   if       k > 0.75
where k ∈ [0, 1] and is a random number. When k < 0.25 and the population size is greater than 50% of N, the weakest individual in the population dies; when k > 0.75 and the population size is less than N, the optimal individual in the current population is selected to reproduce with one of the top 10% individuals in the population other than the optimal individual, and the reproduction strategy is shown in Equation (12):
x j r e p r o d u c t i o n = x j b e s t + x j t 2
where xjreproduction denotes the jth-dimensional coordinate of the newly reproducing individual; xjbest denotes the jth-dimensional coordinate of the optimal individual of the current population; and xtj denotes the jth-dimensional coordinate of the individual with fitness ranked t in the population.
With the above description, the basic flow of the PBO algorithm is shown in Figure 6.

2.6. Composition Optimization Method Based on IPBO Algorithm

In this paper, the PBO algorithm is improved from two aspects: local search and mutation. On the one hand, the adaptive field of view is utilized instead of the fixed field of view to dynamically adjust the range of local search so that the chance of falling into the local optimum is further reduced; on the other hand, the mutation strategy is incorporated into the algorithm to improve the global search capability.

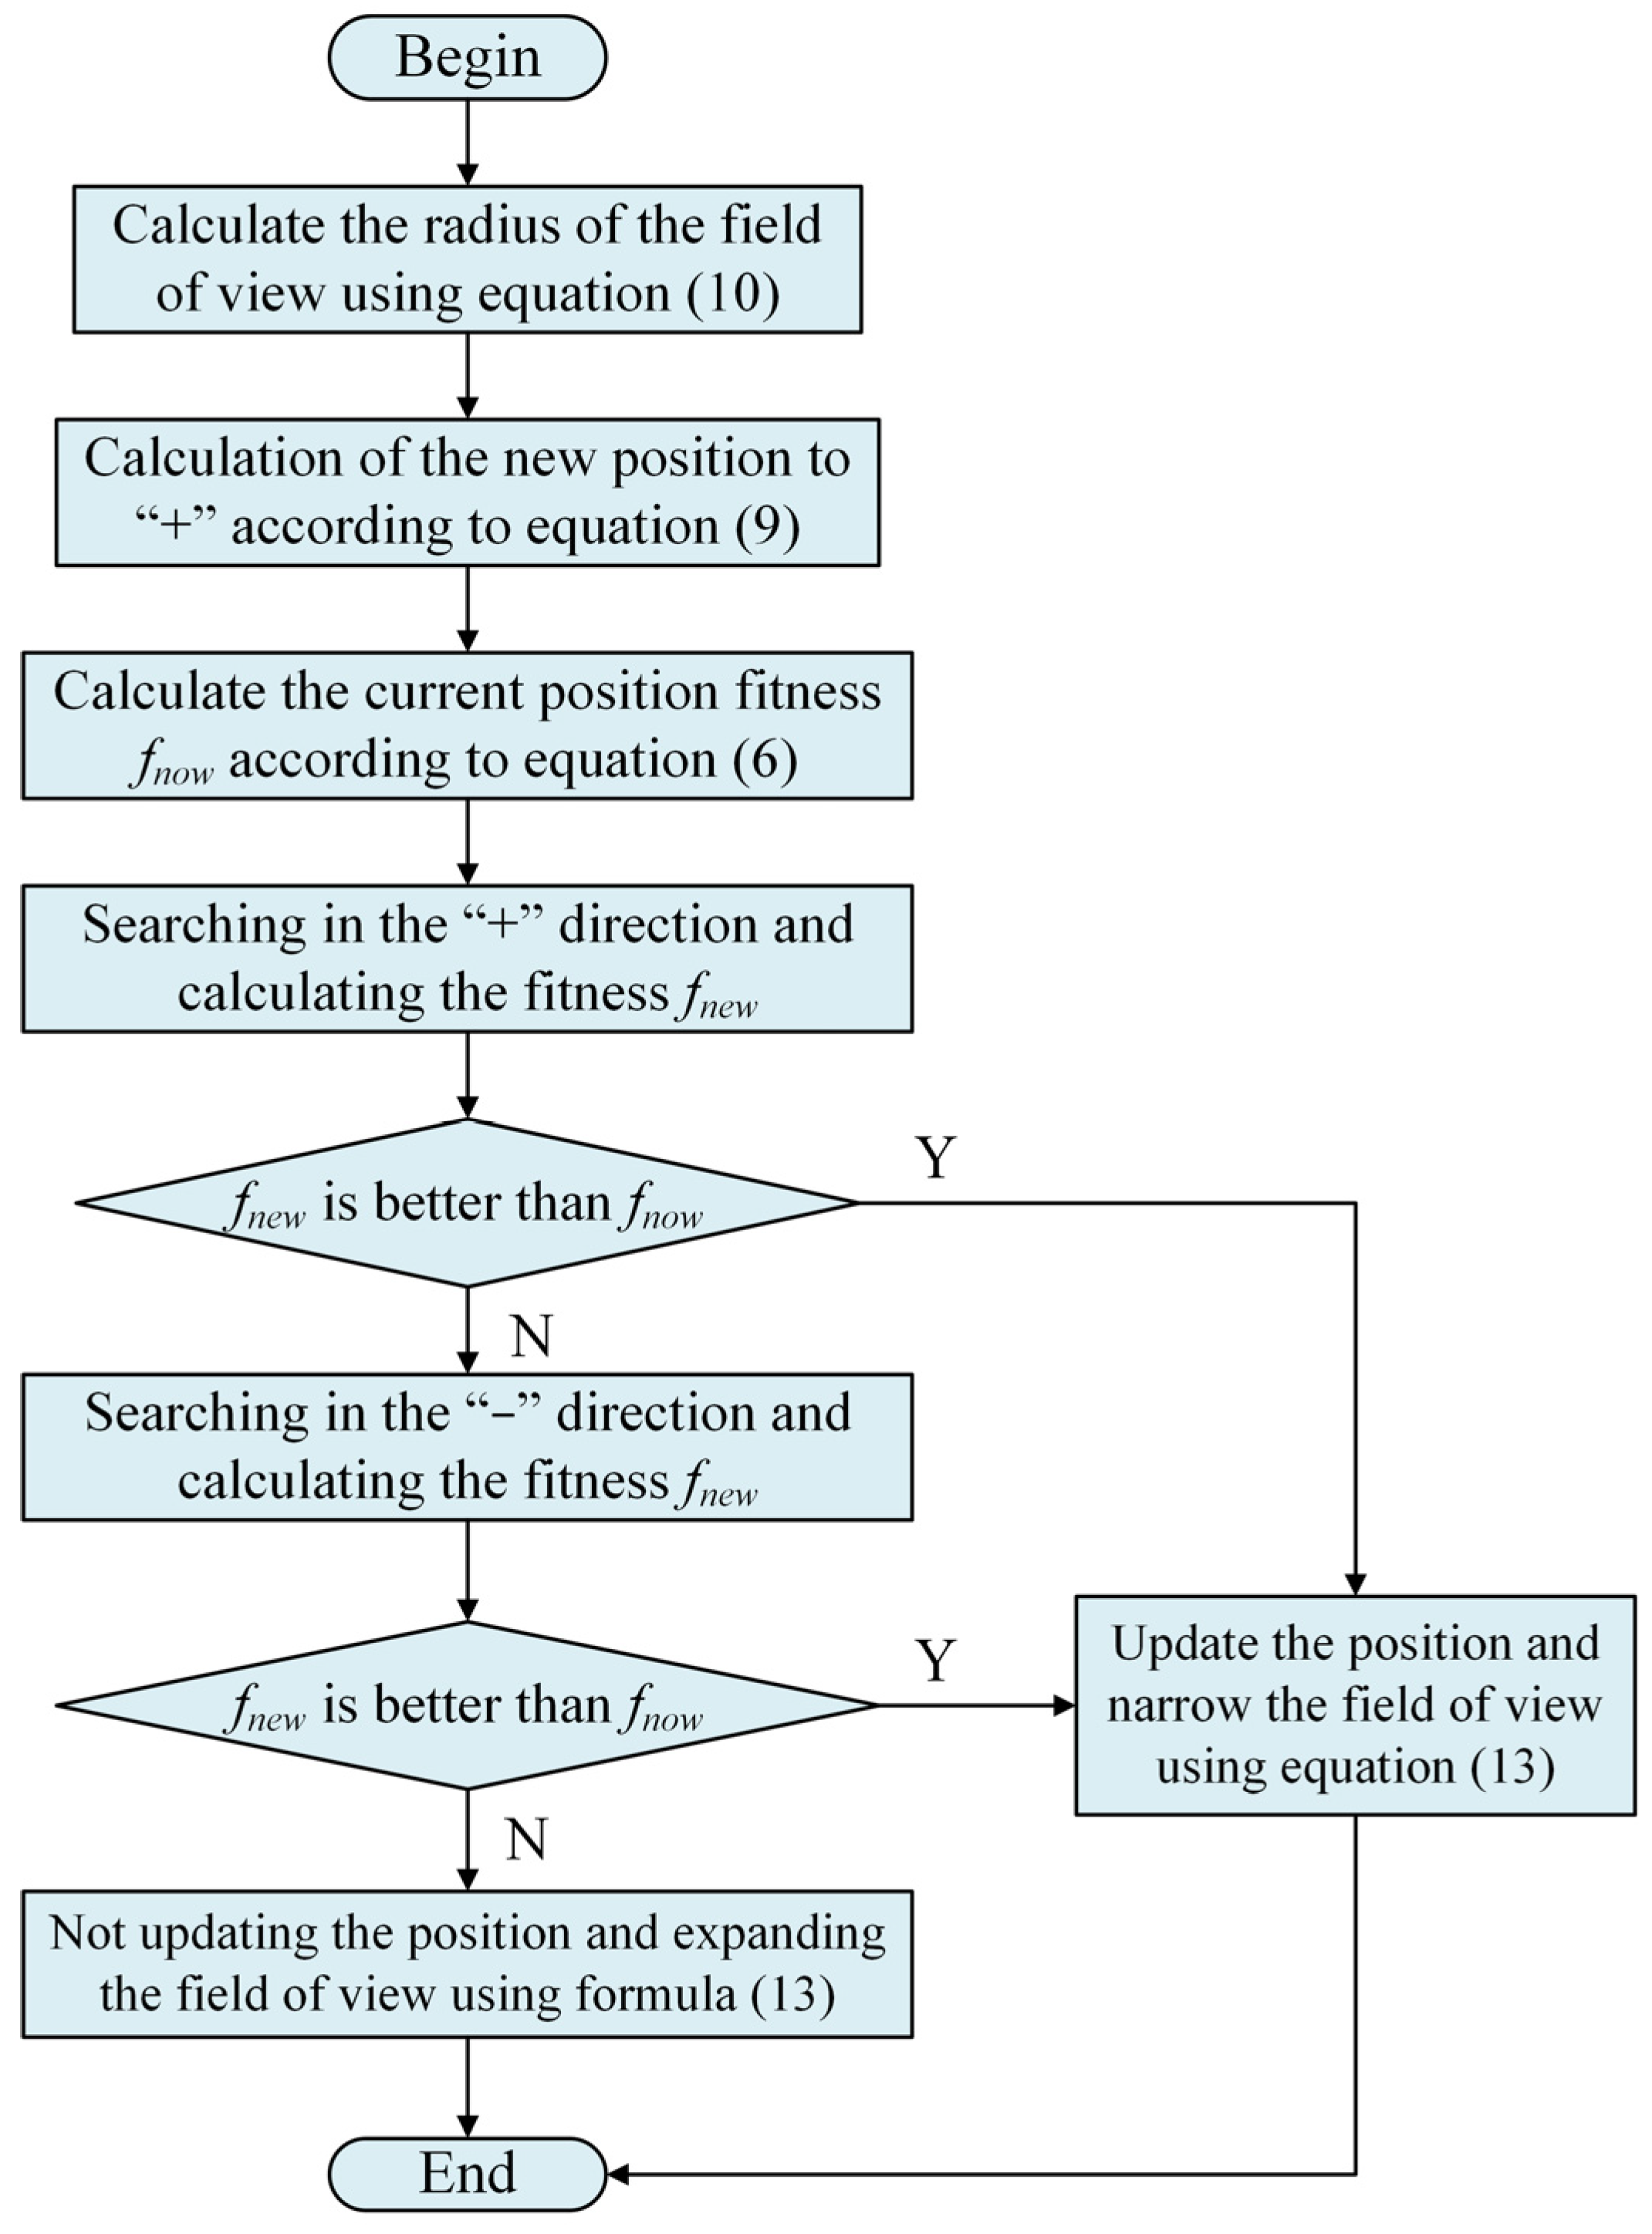
2.6.1. Adaptive Field of View

In the PBO algorithm, the radius of the field of view is an important parameter that is used to limit the search range of polar bears when performing localized searches. The size of the radius of the field of view directly affects the range of movement of the polar bear when searching for prey. However, the field of view is fixed at the beginning of the algorithm and at the later stage of the search, and too large or too small a field of view range will affect the overall search time and search accuracy of the algorithm. To avoid this problem, this paper introduces an adaptive field of view, and the field of view change strategy is shown in Equation (13):
V enlarge = V n o w 1 + t T λ V s h r i n k = V n o w 1 t T λ
where Venlarge denotes the enlarged field of view; Vshrink denotes the reduced field of view; Vnow denotes the current field of view range; t and T represent the current iteration number and the maximum iteration number, respectively; and λ denotes the adjustment coefficient, which takes the value in the range of (0, 1], and this adjustment coefficient keeps increasing with the increase of t.
In the local search process, the PBO algorithm’s search direction is mainly divided into forward search (+) and backward search (−). At the beginning stage, the fitness value of the current position is calculated first, and then a search is conducted in the “+” direction to calculate the fitness value. If the new position is better, then the position is updated and the field of view is narrowed; if the fitness value of the new position is worse, the search is conducted in the “−” direction. If the new position is better, the position is updated and the field of view is narrowed; if the new position is worse, the original position is not changed and the field of view is expanded. The steps of the field of view change are shown in Figure 7.

2.6.2. Strategy of Variation

In the process of solving a function, PBO algorithms select the best or the worst individuals for reproduction and death, thereby easily falling into the local optimal solution. In order to solve this problem, the mutation operation in the genetic mutation algorithm can be introduced to speed up the search process, improve the global optimization ability, and effectively avoid the dilemma of falling into the local optimum. Unlike the traditional mutation algorithm, the mutation operation is not performed at each iteration, but by determining whether the best individual of the population has changed after several iterations, to decide whether to perform the mutation operation. Figure 8 shows the specific steps of the mutation operation, where t represents the current number of iterations, T represents the maximum number of iterations to be iterated, fitt denotes the current individual fitness, and fitt-limit denotes the individual fitness under t-limit iterations.

2.6.3. IPBO Algorithm

In accordance with the traditional PBO algorithm, the IPBO algorithm flow is shown in Figure 9. In the initialization parameters, the maximum population size is set to N; the maximum number of iterations is T; n is a randomly generated population consisting of 75% of individuals; the dimension of the objective function solution is M; and the variance factor is p.

3. Results

In order to verify the superiority and feasibility of the improved method, algorithm performance comparison, arithmetic analysis, and scale-up examples were designed, respectively. MatLabR2024b software was used to accomplish the above operations, the operating system was Windows 10, and the running space was 16 GB.

3.1. Algorithm Performance Comparison

The DTLZ1, DTLZ2 functions from the DTLZ [29] function set (Deb Thiele Laumanns Zitzler, DTLZ) and the C-DTLZ1,C-DTLZ2 functions from the C-DTLZ [30] function set (Constrained Deb Thiele Laumanns Zitzler, C-DTLZ) were selected as the test functions. Hypervolume indicator (HV), generational distance (GD), and inverted generational distance (IGD) were selected to evaluate the algorithm performance.
  • The hypervolume indicator, HV [31], measures the volume of the target space constituted between the non-dominated solution set and a reference point, and a larger value of HV indicates better convergence and diversity of the solution set, i.e., better overall performance of the algorithm. The specific expression is shown in Equation (14), where δ is the Lebesgue used to measure the volume, S denotes the set of non-dominated solutions, |S| denotes the number of non-dominated solutions, and vi denotes the hypervolume formed by the reference point and the ith solution in the solution set.
    H V = δ i = 1 S v i
  • Generation distance GD is an indicator used to evaluate the convergence of multi-objective optimization algorithms [32]. The smaller the value of GD—indicating that the solution is closer to the real Pareto solution set—the better the convergence performance. The specific expression is shown in Equation (15), where P is the set of non-dominated solutions on the frontier derived by the algorithm, P* denotes the solutions distributed on the optimal Pareto frontier, d(a, b) denotes the minimum Euclidean distance between the two decision-making subjects of the game, and P is the total number of solutions on the Pareto frontier obtained.
    G D ( P , P * ) = 1 P b P d 2 a , b 1 2
  • Inverse generation distance (IGD) calculates the average value of the distance between each solution in the solution set and the true preamble [33]. The distribution of the solution set is also taken into account, and the smaller value of IGD reflects the better overall performance of the algorithm in terms of convergence and diversity, as shown in the expression in Equation (16).
    I G D ( P , P * ) = 1 P * a P * d 2 a , b 1 2
In this paper, the effectiveness of the IPBO algorithm in wallboard manufacturing resource composition optimization is analyzed by comparing the selected algorithm evaluation indicators, using the self-constructed dataset of the group to simulate the manufacturing resource composition selection process for the wallboard parts’ manufacturing requirements. The Multi-Objective Differential Evolution (MODE) algorithm [34], PBO algorithm, NSGA-II algorithm, DBO algorithm [35], Grey Wolf Optimizer (GWO) algorithm, and IPBO algorithm are introduced for algorithmic comparisons, and each of the algorithms is set up in the same experimental environment. The initial conditions of the algorithms are shown in Table 1.
Table 2, Table 3 and Table 4 show the GD test results, IGD test results, and HV test results under the corresponding function sets, where the number of populations in the first four groups is 50 and the number of iterations is 100, and the number of populations in the last four groups is 150 and the number of iterations is 200, respectively, where the results of the optimal algorithm are labeled in boldface type.
It can be seen that for the eight problems of the selected test functions, the IPBO algorithm has the best GD performance on six problems compared to the other algorithms, while the NSGA-II algorithm obtains the best GD value only for the DTLZ2 test function when the population size is 50 and the number of iterations is 100, and the DBO algorithm obtains the best GD value only for the DTLZ2 test function when the population size is 150 and the number of iterations is 200. The best GD values were obtained for the test function. IGD performed best on seven problems, while the DBO algorithm obtained the best IGD values only for the DTLZ2 test function with a population size of 100 and 200 iterations/HV performed best on six problems, while the DBO algorithm obtained the best C-DTLZ1 test function only with a population size of 100 and 200 iterations HV values, and the NSGA-II algorithm obtains the best HV values only for the C-DTLZ1 test function with a population size of 50 and an iteration number of 100, proving the superiority of the IPBO algorithm in terms of diversity and convergence.

3.2. Arithmetic Analysis

Figure 10a shows the best average fitness of the four algorithms under the conditions of population size of 50 and iteration number of 200, and it can be seen that the fitness tends to level off when the iteration number is 70. The IPBO algorithm has the lowest value of the best fitness and the fastest convergence speed, and it can be seen that the IPBO algorithm’s convergence performance is significantly better than that of the PBO algorithm, and that the GWO and MODE algorithms are slightly better than the DBO and NSGA-II algorithms. From Figure 10b, it can be seen that the worst convergence time, average convergence time, and optimal convergence time of the IPBO algorithm are lower than those of the other algorithms. The optimal convergence time is only 2.94 s, which is 9.26% lower than the optimal convergence time of the second-best DBO algorithm, and the average convergence time is 4.74 s, which is 6.51% lower than the average convergence time of the second-best DBO algorithm.
Figure 11 shows the Pareto frontiers of the algorithms solving the resource composition optimization problem for the same dataset and modeling conditions with the population size set to 50/100 and the number of iterations set to 150/200 conditions for the objective function of 14 points, respectively. It can be seen that the IPBO algorithm has smaller QoS indicator parameters and smaller flexible indicator parameters in most cases compared to the remaining five algorithms, and analyzing the Pareto frontier distributions of the four figures, the IPBO algorithm has 65%–72% of the points that are more in line with the preference criteria in modeling, which proves the superiority of the IPBO algorithm.

3.3. Examples of Scaling up

In order to further validate the applicability of the IPBO algorithm to the coating machine wallboard manufacturing problem, the case is extended to nine different sizes of coating machine wallboard manufacturing problems. If each sub-task corresponds to 20 candidate services, the 6 sub-processes can be expanded to (6–20), (6–40), (6–60), (12–20), (12–40), (12–60), (18–20), (18–40), and (18–60), totaling 9 groups, respectively. Using the self-built database and incorporating Equation (4), the QoS distribution graph of the problem above expanded is obtained, as shown in Figure 12. It can be seen that most of the red data points obtained by the IPBO algorithm are located at the top, which indicates that the IPBO algorithm obtains better quality when dealing with the problem of wallboard manufacturing for coating machines. Additionally, the control of time and cost remains within a much smaller range. As the problem size increases, the IPBO algorithm consistently distributes the red data points in the upper region. This phenomenon also proves the applicability of the IPBO algorithm in the coating machine wallboard manufacturing problem.
The QoS indicator and the flexibility indicator, as the two subjects of the non-cooperative game, together determine the advantages and disadvantages of the model. In order to verify the distribution of decision-making under the mutual influence of the two game subjects, the solution set obtained by bringing the self-built database into Equation (7) is normalized using Equation (17) [36], in which xmax and xmin are the maximum and minimum values of the evaluation indicators, respectively, and if xmax = xmin, then qk = 1. The distribution of the solution set obtained is shown in Figure 13, according to the modeling situation. It can be seen that the smaller the indicators of the two subjects, the better the algorithmic scheme, proving its effectiveness. From the figure, it can be seen that most of the solution sets obtained by the IPBO algorithm are distributed in the lower left, which indicates that the IPBO algorithm has a certain advantage in solving the non-cooperative game model. With the expansion of the problem scale, the difference between the results obtained by the IPBO algorithm and the remaining five algorithmic methods becomes more and more. This indicates that the IPBO algorithm has some advantages in solving the non-cooperative game model, and as the problem size increases, the difference between the results of the IPBO algorithm and the other five algorithms becomes more and more obvious, which demonstrates the applicability of the IPBO algorithm to large-scale problems. However, the solution sets of the MODE algorithm are mostly distributed in the upper right, which indicates that the optimization ability of this method is weak in solving the model. The NSGA-II and PBO algorithms have comparable optimization abilities in solving the model, with the solution sets of the two algorithms distributed in the middle. The overall distribution of the DBO algorithm is in the middle, between the IPBO algorithm and the NSGA-II algorithm, indicating that the distribution of the flexibility indicator is a little worse. The GWO algorithm has a slightly worse distribution. The overall distribution of the DBO algorithm is between the IPBO algorithm and the NSGA-II algorithm, indicating that its distribution in the flexibility indicator is slightly worse. The solution set of the GWO algorithm is mostly distributed in the lower right, which indicates that its distribution in the QoS indicator is unsatisfactory.
q k = x k x min x max x min ,   i f     x k   is   a   positive   attribute x max x k x max x min ,   i f     x k   is   a   negative   attribute

4. Discussion

In Section 2, by analyzing the manufacturing processes of coating machine wallboards, the candidate manufacturing resource sets corresponding to each process are obtained, laying the foundation for the subsequent discussion on improving the manufacturing efficiency of coating machine wallboards. After that, considering the common interests of the demand side of wallboard cloud manufacturing service and the operator of wallboard collaborative platform, the evaluation indicator system of wallboard manufacturing resource composition optimization is proposed, and the wallboard cloud manufacturing resource composition optimization model is established by combining non-cooperative game theory. For the problems of the PBO algorithm, such as the slow convergence and the tendency to fall into the local optimum, the IPBO algorithm is applied to solve this model. It is worth noting that the proposed IPBO algorithm may not be the optimal solution. In this paper, we verify the effectiveness of the proposed method in solving the optimal solution through the three parts: algorithm performance comparison, arithmetic power analysis, and scale-up examples.
As can be seen from the results in Figure 9 and Figure 10, although the IPBO algorithm can effectively solve the problems of lower efficiency, slow convergence, and having fallen into local optimality when solving the model, 38%–45% of the points still have distributions on the Pareto front surface that are not optimal. By analyzing Figure 12 and Figure 13, it can be found that although the IPBO algorithm has advantages over comparison algorithms in the problem of scaling up the manufacturing scale of multiple datasets, there are still some datasets with poor distribution. In addition, the current theoretical analysis only applies to the research of the self-built database, and the conclusion is not necessarily applicable to the actual production site or other manufacturing parts. For the manufacturing process of more complex parts, solving the resource optimization model problem still needs further exploration. At the same time, in actual production, the establishment of the evaluation indicator system still has many uncertainties. A more accurate establishment of the flexibility indicator will further affect the algorithm’s solution results, which also points out the direction for subsequent research.

5. Conclusions

In this paper, we take the wallboard of a coating machine as the research object, and for the service composition optimization of the wallboard of a coating machine, we propose an effective method to arrive at the composition optimization decision of the wallboard manufacturing resources, which improves the production quality of the wallboard, shortens the production time, reduces the cost, and improves the production efficiency of the coating machine. At the same time, we take into account the common interests of the resource demand side and the platform operator, providing a new idea for solving this kind of part-level multi-objective optimization problems. However, there are still many uncertainties in the manufacturing production problems at different scales in this study, and the processing procedures and corresponding manufacturing resource sets are more complex in the actual production process. Additionally, the indicators for the two subjects under the non-cooperative game are not comprehensive, and more QoS indicators and flexibility indicators are often considered in actual production. Therefore, in the subsequent research, the manufacturing process of the wallboard of the coating machine can be more refined, and a more comprehensive collection of manufacturing resources of the wallboard of the coating machine can be collected and summarized. The indicators in the modeling can be improved so that the experimental conclusions can be closer to the real production situation. In this paper, the following conclusions are obtained through field research, completing the process-level splitting of the manufacturing tasks of wallboards for coating machines, obtaining the candidate matching set of wallboards, and then establishing the evaluation system, modeling, solving, and validation:
  • With the same number of iterations and population size of the test function, compared to the NSGA-II algorithm, PBO algorithm, DBO algorithm, GWO algorithm, and MODE algorithm, the IPBO algorithm has a lower GD value under six conditions, with a minimum of 2.96 × 10⁻³ under the DTLZ1 function; a lower IGD value under seven conditions, with a minimum of 3.06 × 10⁻³ under the C-DTLZ1 function of 3.06 × 10⁻³; and high HV values under six conditions, with a maximum value of 9.24 × 10⁻¹ under the DTLZ1 function. This further illustrates the effectiveness of the IPBO algorithm in solving such problems.
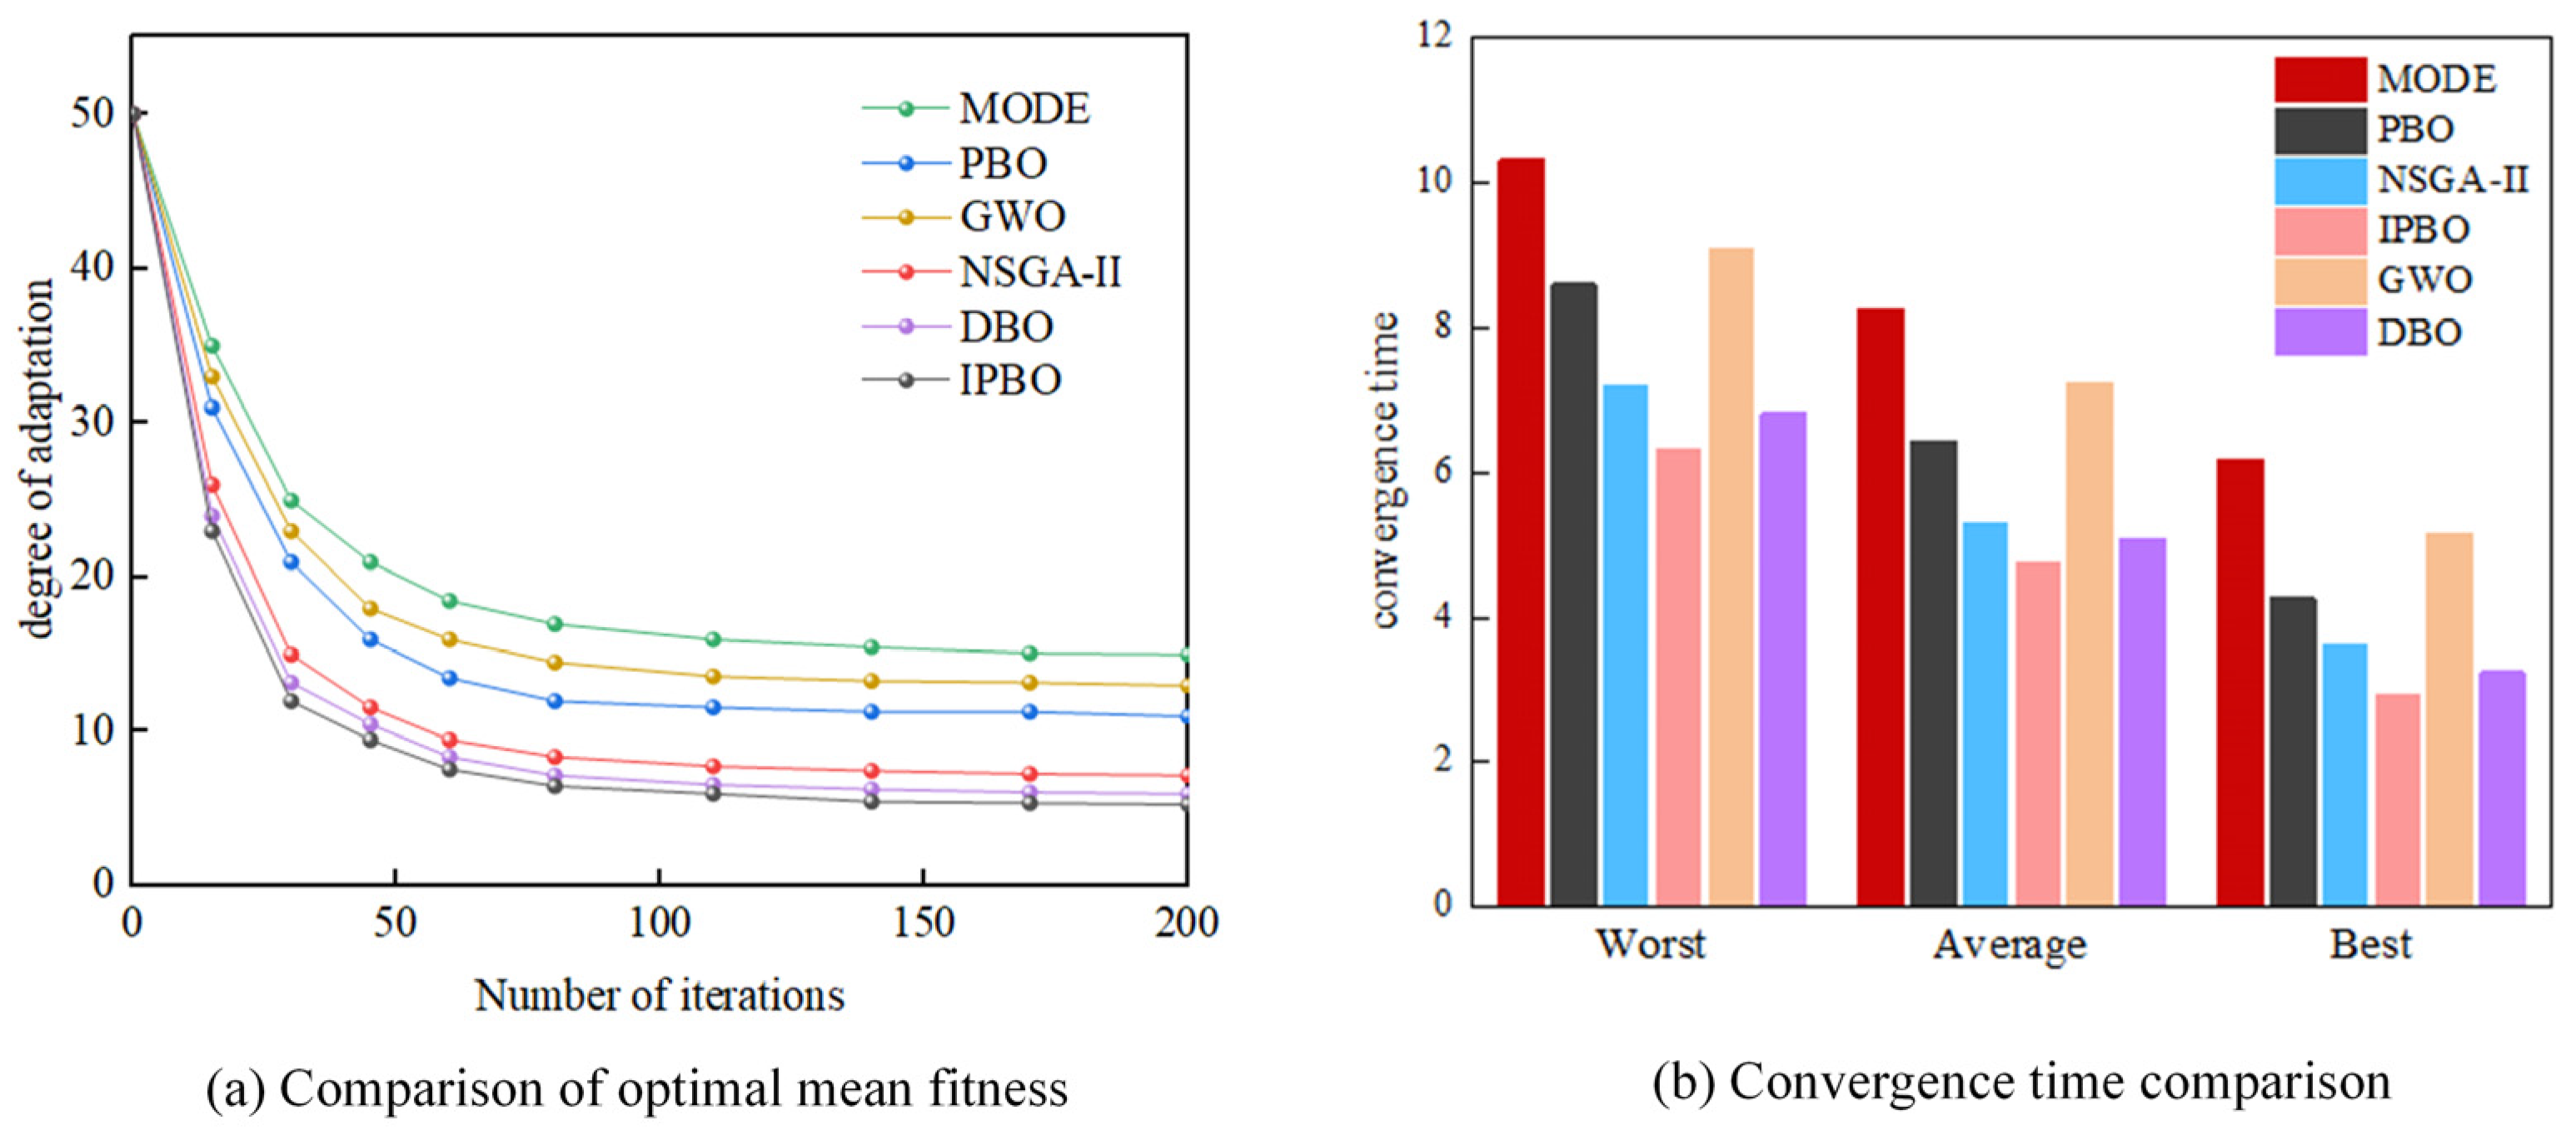
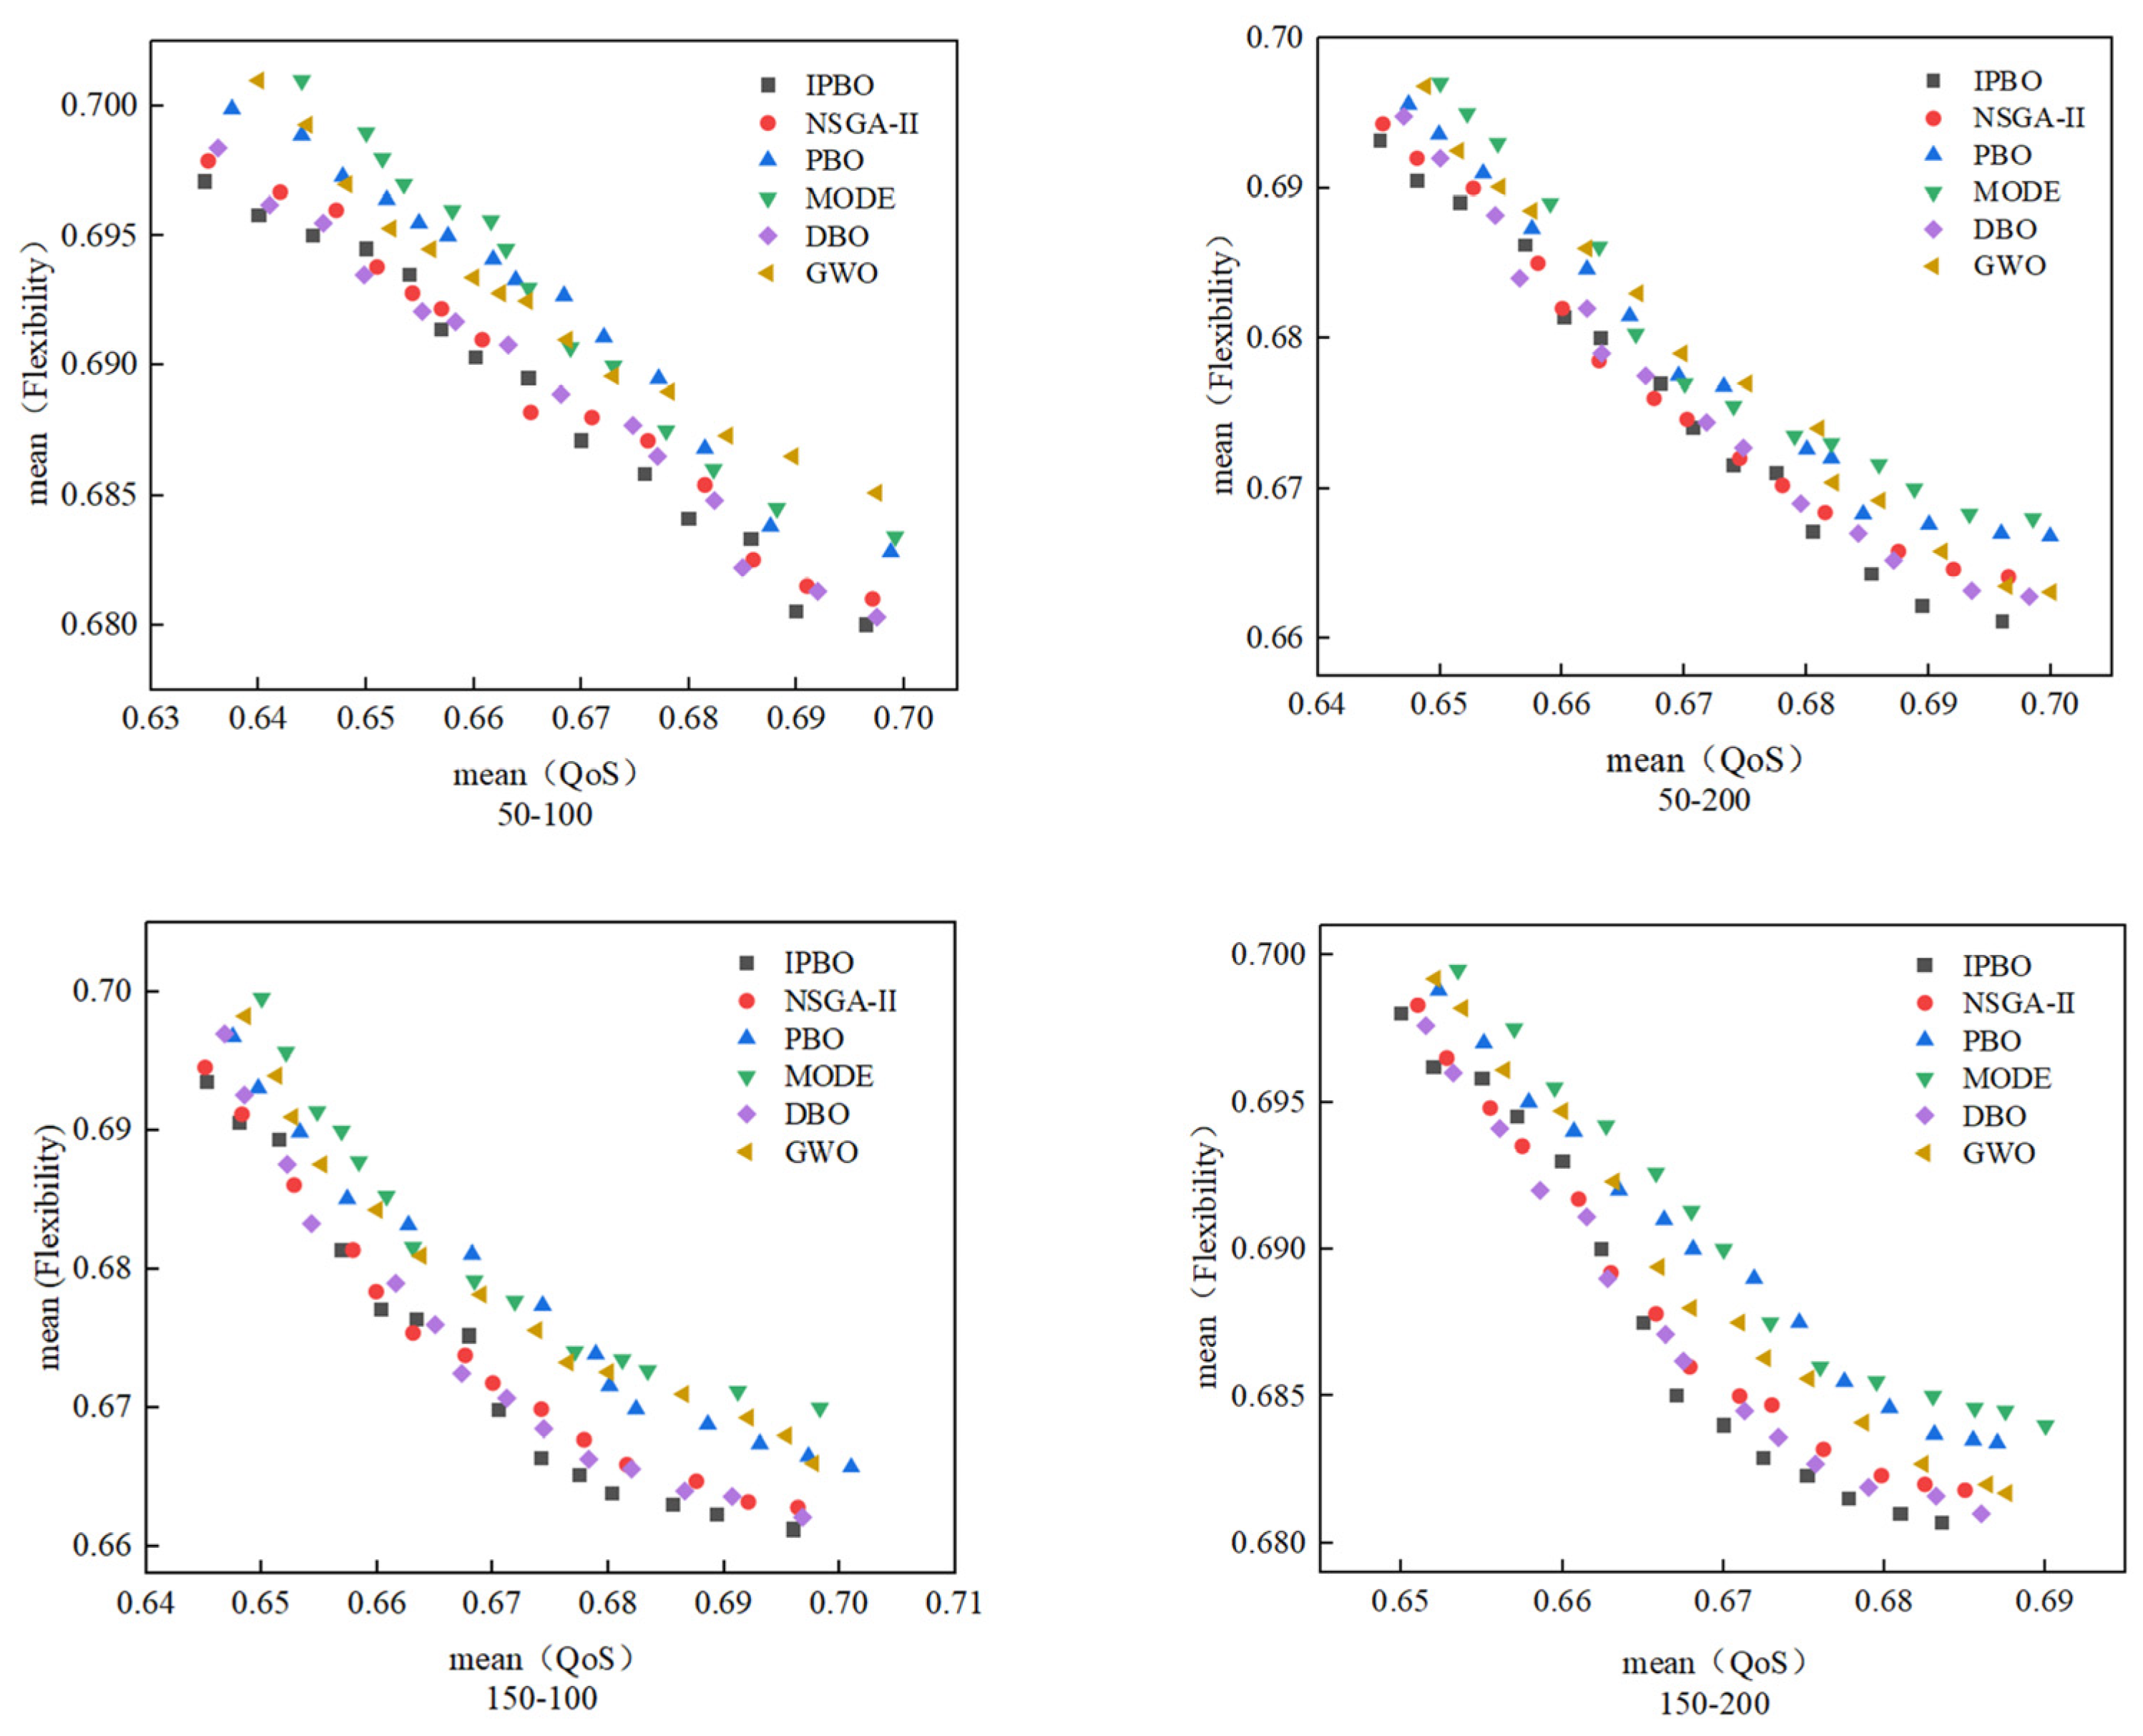
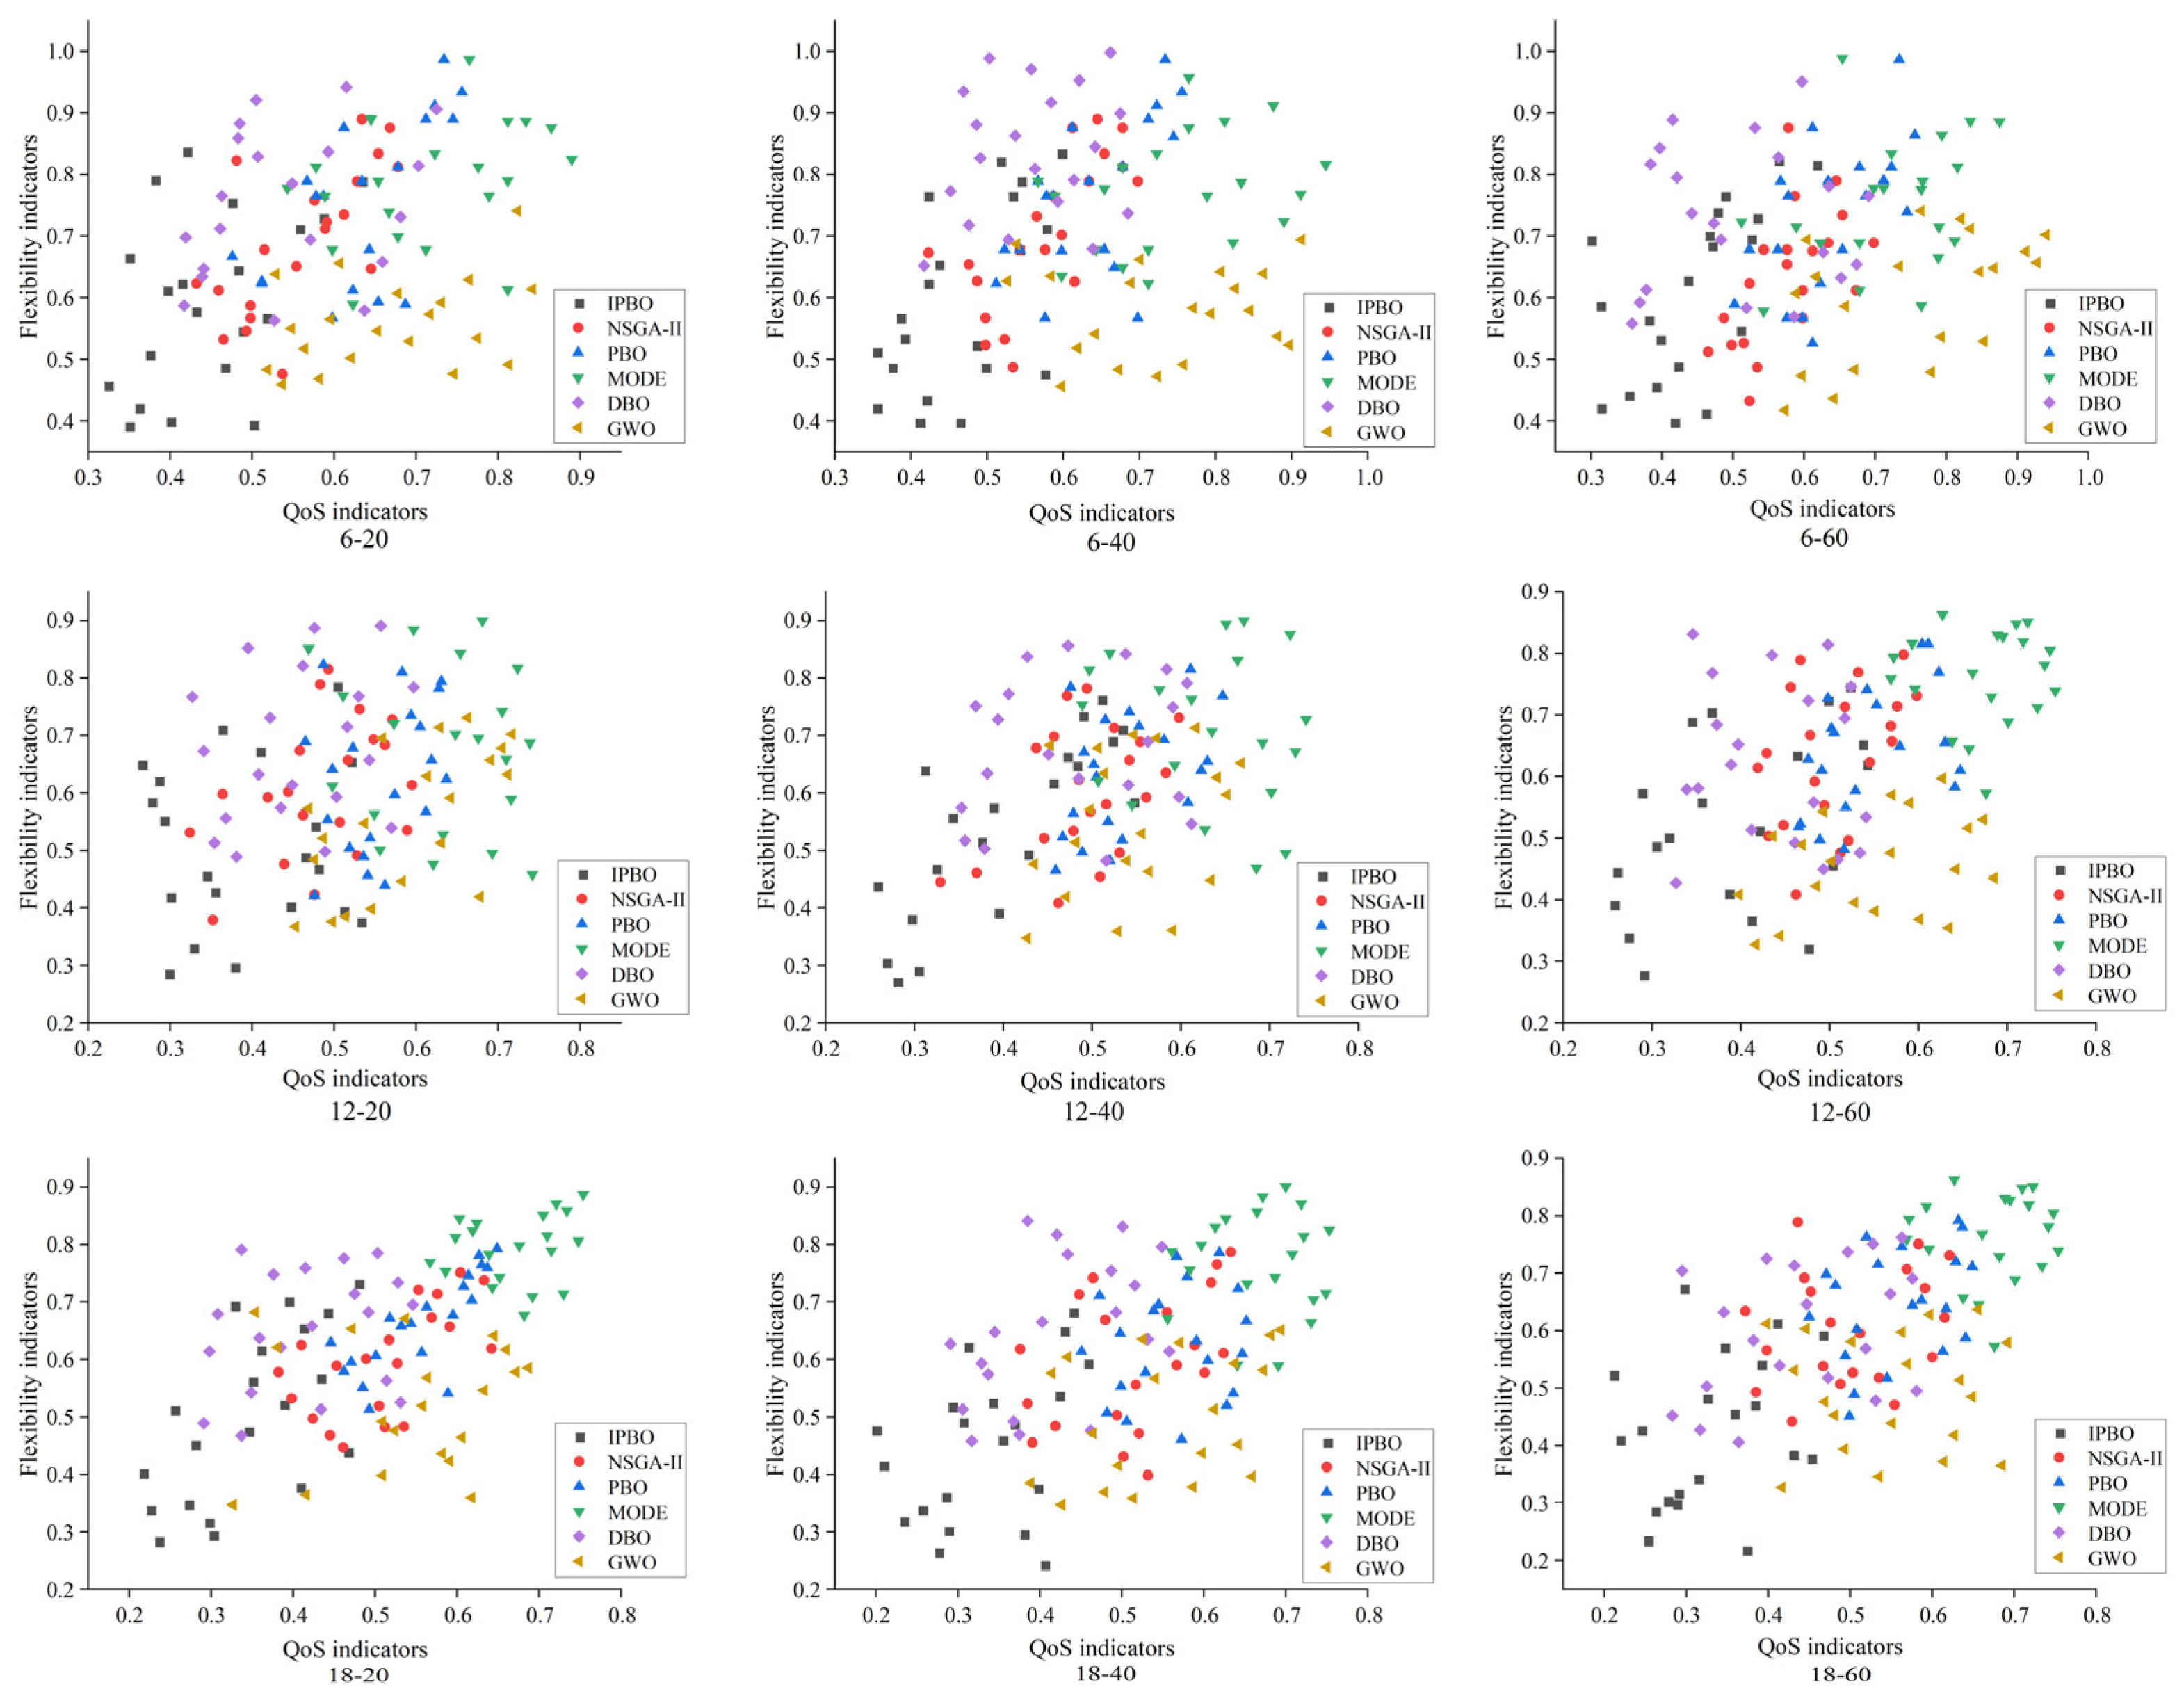
  • The IPBO algorithm has lower fitness under specific iteration and population size conditions, with the fitness function leveling off as the number of iterations approaches 70. It also has faster convergence, with an optimal convergence time of only 2.94 s, which is a 9.26% reduction in the optimal convergence time compared to the suboptimal DBO algorithm. The average convergence time is reduced by 6.51%. Moreover, for the conditions set in Conclusion I, the Pareto frontier distribution of the IPBO algorithm for most of the test points is more in line with the preference criteria in the modeling, with smaller flexibility indicator values for smaller QoS indicator values.
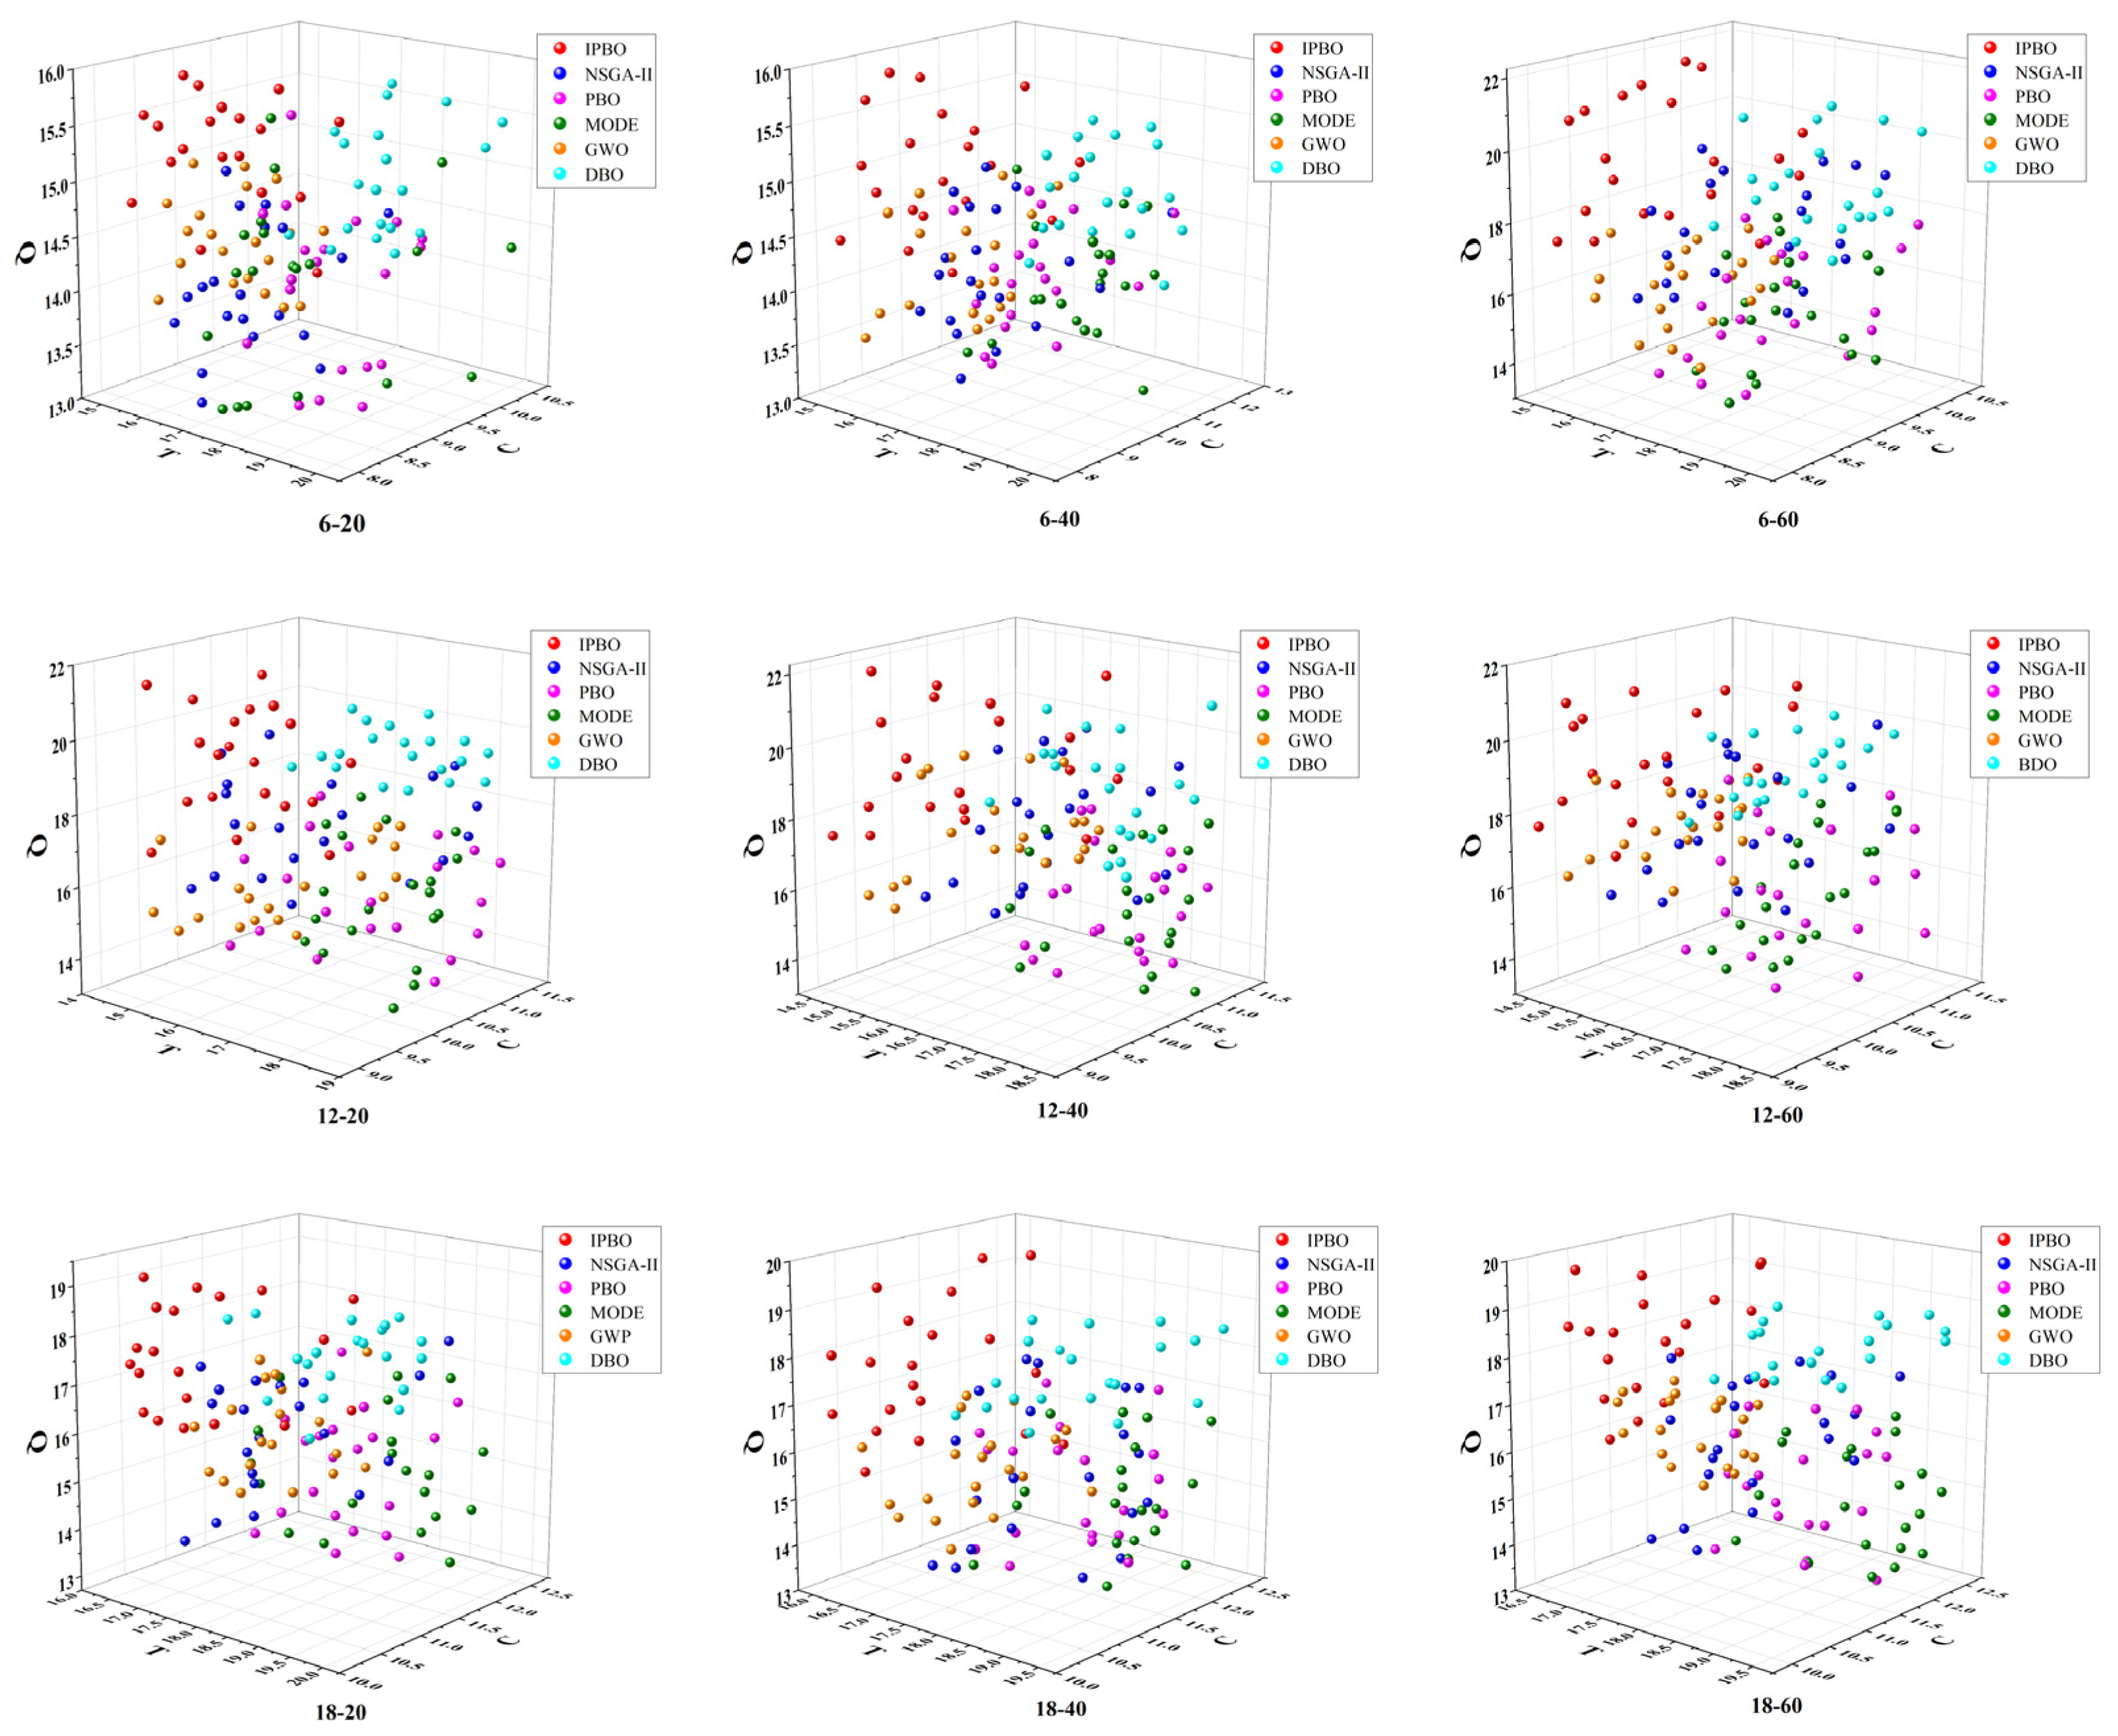
  • Expanding the problem to the manufacturing of wallboards for nine different sizes of coating machines, the QoS values of the four algorithms were compared, which can positively reflect the benefit of the demand side of the service. On the basis of six processes, twelve processes, and eighteen processes, the time indicators of the IPBO algorithms are all concentrated in (14–17) h, (15–18) h, and (17–19) h; the cost indicators are all concentrated in (8–9), (9–10.5), and (10–12); and the quality indicators are all concentrated in (14–16), (17–22), and (16–20). At the same time, through normalization, the IPBO algorithm obtains smaller values for the flexibility indicator, concentrated between (0.25–0.75).

Author Contributions

Conceptualization, Z.G. and S.L.; methodology, Z.G. and S.Q.; software, Z.G. and S.Q.; validation, Z.G. and L.Z.; formal analysis, Z.G.; investigation, Z.G.; resources, Z.G. and G.S.; data curation, J.Z.; writing—original draft preparation, Z.G.; writing—review and editing, Z.G. and S.L.; visualization, Z.G.; supervision, L.Z.; project administration, Z.G. and G.S.; funding acquisition, S.L. All authors have read and agreed to the published version of the manuscript.

Funding

This research was funded by the National Key Research and Development Program of China (Program No. 2023YFB3308800) and the Key Research and Development Program of Weinan City (Program No. 2024ZDYFJH-767).

Institutional Review Board Statement

Not applicable.

Informed Consent Statement

Not applicable.

Data Availability Statement

Data are contained within the article.

Conflicts of Interest

The authors S.Q. and L.Z. are employed by Xi’an Aerospace-Huayang Mechanical & Electrical Equipment Co., Ltd. The remaining authors declare that this research was conducted in the absence of any commercial or financial relationships that could be construed as a potential conflict of interest.

References

  1. Wei, X. Optimized Configuration of Manufacturing Resources for Middle and Lower Batch Customization Enterprises in Cloud Manufacturing Environment. Complexity 2020, 2020, 5619758. [Google Scholar]
  2. Mou, J. Multi-Objective Optimization for Resource Allocation in Intelligent Manufacturing. Int. J. Simul. Model. 2024, 23, 359–370. [Google Scholar]
  3. Song, C.; Zheng, H.; Han, G. Cloud edge collaborative service composition optimization for intelligent manufacturing. IEEE Trans. Ind. Inform. 2022, 19, 6849–6858. [Google Scholar]
  4. Tong, H.; Zhu, J. New peer effect-based approach for service matching in cloud manufacturing under uncertain preferences. Appl. Soft Comput. 2020, 94, 106444. [Google Scholar]
  5. Li, X.; Fang, Z.; Yin, C. A machine tool matching method in cloud manufacturing using Markov Decision Process and cross-entropy. Robot. Comput. Integr. Manuf. 2020, 65, 101968. [Google Scholar]
  6. Bouzary, H.; Chen, F.F. A classification-based approach for integrated service matching and composition in cloud manufacturing. Robot. Comput. Integr. Manuf. 2020, 66, 101989. [Google Scholar]
  7. Xiao, Y.; Li, C.; Song, L.; Yang, J.; Su, J. A multidimensional information fusion-based matching decision method for manufacturing service resource. IEEE Access 2021, 9, 39839–39851. [Google Scholar]
  8. Liu, S.; Zhang, Z.; Jiang, X. An Optimal Selection Method of Cloud Manufacturing Resource for Guide Roller based on Combination Algorithm. J. Imaging Sci. Technol. 2024, 68, 1–10. [Google Scholar]
  9. Shi, K.; Liu, S.; Zhang, Z.; Qian, S.; Zhu, L.; Zhang, H. optimization Method of Sewing Machine Case Manufacturing Resources Sets. In Proceedings of the 2023 IEEE 3rd International Conference on Information Technology, Big Data and Artificial Intelligence (ICIBA), Chongqing, China, 26–28 May 2023; Volume 3, pp. 1530–1534. [Google Scholar]
  10. Rodriguez-Mier, P.; Mucientes, M.; Lama, M. Hybrid optimization algorithm for large-scale QoS-aware service composition. IEEE Trans. Serv. Comput. 2015, 10, 547–559. [Google Scholar]
  11. Du, Z.; Miao, H. Research on edge service composition method based on BAS algorithm. Comput. Intell. Neurosci. 2021, 2021, 9931689. [Google Scholar]
  12. Li, T.; Zhang, Y.; Li, K.; Li, Y.; Ma, X. A multi-objective optimization algorithm based on subgroup stratified coarse-grained model and its application. Comput. Electr. Eng. 2021, 92, 107180. [Google Scholar]
  13. Meng, Y.; Sun, X.; Dong, S.; Wang, Y.; Liu, X. Cutting energy consumption modelling of end milling cutter coated with AlTiCrN. Coatings 2023, 13, 679. [Google Scholar] [CrossRef]
  14. Zhe, Z.; Chen, Y.; Lyu, S. Virtualization of Manufacturing Resources in Cloud Manufacturing Environment. In Proceedings of the 2019 International Conference on Robotics, Intelligent Control and Artificial Intelligence, Shanghai, China, 20–22 September 2019; pp. 83–88. [Google Scholar]
  15. Liu, X.; Luo, J. A dynamic multi-objective optimization model with interactivity and uncertainty for real-time reservoir flood control operation. Appl. Math. Model. 2019, 74, 606–620. [Google Scholar]
  16. Rahmani, S.; Amjady, N. Enhanced goal attainment method for solving multi-objective security-constrained optimal power flow considering dynamic thermal rating of lines. Appl. Soft Comput. 2019, 77, 41–49. [Google Scholar]
  17. Liang, H.; Wen, X.; Liu, Y.; Zhang, H.; Zhang, L.; Wang, L. Logistics-involved QoS-aware service composition in cloud manufacturing with deep reinforcement learning. Robot. Comput. Integr. Manuf. 2021, 67, 101991. [Google Scholar]
  18. Zhou, L.; Zhang, L.; Horn, B.K.P. Collaborative optimization for logistics and processing services in cloud manufacturing. Robot. Comput. Integr. Manuf. 2021, 68, 102094. [Google Scholar]
  19. Zhao, C.; Ma, C.; Zhang, H.; Ma, Z.; Yang, J.; Li, M.; Wang, X.; Lv, Q. Modeling manufacturing resources based on manufacturability features. Sci. Rep. 2022, 12, 10775. [Google Scholar]
  20. Verma, S.; Pant, M.; Snasel, V. A comprehensive review on NSGA-II for multi-objective combinatorial optimization problems. IEEE Access 2021, 9, 57757–57791. [Google Scholar]
  21. Geng, Z.; Kong, W.; Wang, X. Adaptive search based Grey Wolf optimization algorithm for multi-objective optimization of ethylene cracking furnace. Swarm Evol. Comput. 2025, 92, 101810. [Google Scholar]
  22. Kaya, E.; Gorkemli, B.; Akay, B.; Karaboga, D. A review on the studies employing artificial bee colony algorithm to solve combinatorial optimization problems. Eng. Appl. Artif. Intell. 2022, 115, 105311. [Google Scholar]
  23. Polap, D.; Wozniak, M. Polar bear optimization algorithm: Meta-heuristic with fast population movement and dynamic birth and death mechanism. Symmetry 2017, 9, 203. [Google Scholar] [CrossRef]
  24. Iqbal, M.M.; Zia, M.F.; Beddiar, K.; Benbouzid, M. Optimal scheduling of grid transactive home demand responsive appliances using polar bear optimization algorithm. IEEE Access 2020, 8, 222285–222296. [Google Scholar]
  25. Fayyaz, S.; Sattar, M.K.; Waseem, M.; Ashraf, M.U.; Ahmad, A.; Hussain, H.A.; Alsubhi, K. Solution of combined economic emission dispatch problem using improved and chaotic population-based polar bear optimization algorithm. IEEE Access 2021, 9, 56152–56167. [Google Scholar]
  26. Nasr, M.A.; Zangian, M.; Abbasi, M.; Zolfaghari, A. Neutronic and thermal-hydraulic aspects of loading pattern optimization during the first cycle of VVER-1000 reactor using Polar Bear Optimization method. Ann. Nucl. Energy 2019, 133, 538–548. [Google Scholar]
  27. Tian, Y.; Liu, X.; Zhang, L.; Luo, Q.; Xu, Q.; Yao, H.; Yang, F.; Wang, J.; Dang, C.; Xuan, Y. Prediction of thermophysical properties of chlorine eutectic salts via artificial neural network combined with polar bear optimization. J. Energy Storage 2022, 55, 105658. [Google Scholar]
  28. Yu, J.; Zhang, Y.; Sun, C. Balance of exploration and exploitation, Non-cooperative game-driven evolutionary reinforcement learning. Swarm Evol. Comput. 2024, 91, 101759. [Google Scholar]
  29. Deb, K.; Thiele, L.; Laumanns, M.; Zitzler, E. Scalable test problems for evolutionary multiobjective optimization. In Evolutionary Multiobjective Optimization: Theoretical Advances and Applications; Springer: London, UK, 2005; pp. 105–145. [Google Scholar]
  30. Deb, K.; Jain, H. An evolutionary many-objective optimization algorithm using reference-point-based nondominated sorting approach, part I: Solving problems with box constraints. IEEE Trans. Evol. Comput. 2013, 18, 577–601. [Google Scholar]
  31. Xu, B.; Lv, J.; Liu, J. Manufacturing Cloud Service Composition Optimization Based on Usability Analysis. Ind. Eng. Manag. 2024, 29, 1–11. [Google Scholar]
  32. Schutze, O.; Esquivel, X.; Lara, A.; Coello, C.A.C. Using the averaged Hausdorff distance as a performance measure in evolutionary multiobjective optimization. IEEE Trans. Evol. Comput. 2012, 16, 504–522. [Google Scholar]
  33. Coello, C.A.C.; Cortés, N.C. Solving multiobjective optimization problems using an artificial immune system. Genet. Program. Evolvable Mach. 2005, 6, 163–190. [Google Scholar]
  34. Babu, B.; Anbarasu, B. Multi-objective differential evolution (MODE): An evolutionary algorithm for multi-objective optimization problems (MOOPs). In Proceedings of the International Symposium and 58th Annual Session of IIChE, Delhi, India, 14–17 December 2005. [Google Scholar]
  35. Zhu, F.; Li, G.; Tang, H.; Li, Y.; Lv, X.; Wang, X. Dung beetle optimization algorithm based on quantum computing and multi-strategy fusion for solving engineering problems. Expert. Syst. Appl. 2024, 236, 121219. [Google Scholar] [CrossRef]
  36. Gao, Y.; Yang, B.; Wang, S.; Zhang, Z.; Tang, X. Bi-objective service composition and optimal selection for cloud manufacturing with QoS and robustness criteria. Appl. Soft Comput. 2022, 128, 109530. [Google Scholar] [CrossRef]
Figure 1. Wallboard for coating machines.
Coatings 15 00418 g001
Figure 2. Wallboards for coating machines.
Coatings 15 00418 g002
Figure 3. Manufacturing service portfolio and optimization process.
Coatings 15 00418 g003
Figure 4. Wallboard manufacturing resource composition optimization evaluation indicator system.
Coatings 15 00418 g004
Figure 5. Non-cooperative game decision-making modeling process.
Coatings 15 00418 g005
Figure 6. Flow of the PBO algorithm.
Coatings 15 00418 g006
Figure 7. The process of adaptive vision.
Coatings 15 00418 g007
Figure 8. The process of mutation.
Coatings 15 00418 g008
Figure 9. Flow of the IPBO algorithm.
Coatings 15 00418 g009
Figure 10. Comparison of adaptation and convergence times.
Coatings 15 00418 g010
Figure 11. Pareto frontiers for resource composition optimization problems.
Coatings 15 00418 g011
Figure 12. Distribution of optimal QoS solutions for the resource composition optimization problem in wallboard manufacturing.
Coatings 15 00418 g012
Figure 13. Resource composition optimization distribution for coating machine wallboard manufacturing.
Coatings 15 00418 g013
Table 1. Parameterization of individual algorithms.
ArithmeticParameters
MODEMaximum number of iterations: 100/200 Population size: 50/150, external archive size: 50, scaling factor: 0.5, crossover prob ability: 0.2
PBOMaximum number of iterations: 100/200, Population size: 50/150, Search space dimension: 6, Search range: [−10, 10], Local search step: 0.1, Variation rate: 0.02, Number of elite reservations: 2
NSGA-IIMaximum number of iterations: 100/200, Population size: 50/150, External archive size: 50, Crossover ratio: 0.6, Variation ratio: 0.3, Variation rate: 0.02
IPBOMaximum number of iterations: 100/200, Population size: 50/150, Search space dimension: 6, Search range: [−10, 10], Local search step:0.1, Variation rate: 0.02, Number of elite reservations: 2, Initial field of view adjustment factor: 0.25, Variation ratio: 0.4
DBOMaximum number of iterations: 100/200, Population size: 50/150, Number of variable dimensions: 2, Penalty factor C: 0.3, Learning factor: 0.5, inertia weight: 0.9, randomization factor: 0.1
GWOMaximum number of iterations: 100/200, Population size: 50/150, Convergence factor: linearly decreasing from 2.0 to 0, Search space range: [−10, 10]
Table 2. Test results for GD.
Test FunctionGWODBOMODEPBOIPBONSGA-II
DTLZ14.88 × 10−23.73 × 10−25.69 × 10−24.39 × 10−13.62 × 10−23.88 × 10⁻²
DTLZ22.03 × 10−13.52 × 10−25.32 × 10−24.78 × 10−22.68 × 10−18.75 × 10⁻³
C-DTLZ14.48 × 10−23.23 × 10−23.96 × 10−25.19 × 10−22.86 × 10−23.86 × 10⁻²
C-DTLZ24.57 × 10−24.07 × 10−23.54 × 10−24.39 × 10−23.28 × 10−24.21 × 10⁻²
DTLZ17.26 × 10−34.63 × 10−38.14 × 10−36.33 × 10−32.96 × 10−35.39 × 10⁻³
DTLZ26.85 × 10−12.96 × 1027.32 × 10−13.94 × 10−13.56 × 10−24.22 × 10⁻²
C-DTLZ16.06 × 10−25.03 × 10−27.91 × 10−25.97 × 10−21.68 × 10−22.58 × 10⁻²
C-DTLZ25.31 × 10−23.92 × 10−26.36 × 10−26.27 × 10−22.86 × 10−23.73 × 10⁻²
Table 3. Test results for IGD.
Test FunctionGWODBOMODEPBOIPBONSGA-II
DTLZ11.96 × 10−12.28 × 10−27.36 × 10−22.84 × 10−11.33 × 10−22.94 × 10⁻¹
DTLZ26.91 × 10−29.83 × 10−35.49 × 10−27.62 × 10−27.59 × 10−32.64 × 10⁻²
C-DTLZ15.36 × 10−24.47 × 10−25.28 × 10−24.52 × 10−23.94 × 10−26.84 × 10⁻²
C-DTLZ27.16 × 10−25.11 × 10−26.28 × 10−28.29 × 10−14.29 × 10−26.92 × 10⁻³
DTLZ15.33 × 10−28.36 × 1031.68 × 10−23.28 × 10−21.98 × 10−24.38 × 10⁻²
DTLZ21.76 × 10−17.28 × 10−23.81 × 10−18.76 × 10−25.81 × 10−26.13 × 10⁻²
C-DTLZ14.83 × 10−35.06 × 10−34.29 × 10−34.19 × 10−33.06 × 10−37.39 × 10⁻³
C-DTLZ25.94 × 10−23.13 × 10−24.06 × 10−64.29 × 10−29.28 × 10−35.29 × 10⁻²
Table 4. Test results for HV.
Test FunctionGWODBOMODEPBOIPBONSGA-II
DTLZ18.66 × 10−18.73 × 10−18.54 × 10−18.91 × 10−19.24 × 10−19.06 × 10⁻¹
DTLZ27.38 × 10−17.59 × 10−17.64 × 10−17.23 × 10−18.29 × 10−17.76 × 10⁻¹
C-DTLZ14.92 × 10−15.22 × 10−15.12 × 10−14.88 × 10−15.09 × 10−15.47 × 10⁻¹
C-DTLZ27.25 × 10−17.69 × 10−17.43 × 10−17.18 × 10−18.06 × 10−17.94 × 10⁻¹
DTLZ16.54 × 10−18.86 × 10−16.68 × 10−16.34 × 10−19.15 × 10−18.28 × 10⁻¹
DTLZ24.97 × 10−15.37 × 10−14.77 × 10−15.16 × 10−16.27 × 10−15.93 × 10⁻¹
C-DTLZ18.17 × 10−19.76 × 1019.64 × 10−17.61 × 10−18.26 × 10−18.86 × 10⁻¹
C-DTLZ26.53 × 10−17.64 × 10−17.19 × 10−16.27 × 10−18.32 × 10−15.29 × 10⁻¹
Disclaimer/Publisher’s Note: The statements, opinions and data contained in all publications are solely those of the individual author(s) and contributor(s) and not of MDPI and/or the editor(s). MDPI and/or the editor(s) disclaim responsibility for any injury to people or property resulting from any ideas, methods, instructions or products referred to in the content.

