Article

Calibration and Verification of Coated Caragana korshinskii Seeds Based on Discrete Element Method

College of Mechanical and Electrical Engineering, Inner Mongolia Agricultural University, Hohhot 010018, China
*
Author to whom correspondence should be addressed.
Coatings 2025, 15(4), 387; https://doi.org/10.3390/coatings15040387
Submission received: 30 January 2025 / Revised: 8 March 2025 / Accepted: 20 March 2025 / Published: 26 March 2025

Abstract

:
The accurate modeling of seed motion characteristics is crucial for optimizing seed-metering devices in agricultural machinery. This study investigated the physical properties and contact parameters of coated Caragana korshinskii seeds through a combined approach of calibration experiments and verification tests. Physical experiments were conducted to measure basic parameters including seed dimensions, density, moisture content, and angle of repose. The Plackett–Burman experimental design was employed to screen significant parameters affecting seed motion, followed by the Path of Steepest Ascent method and Response Surface Methodology to establish optimal parameter combinations. Results identified three key parameters: seed-to-seed coefficient of restitution (0.221), seed-to-seed static friction coefficient (0.337), and seed-to-aluminum static friction coefficient (0.117). Verification tests using a 4BQD-40 broadcast seeder demonstrated good agreement between simulation and physical experiments, with relative errors of 1.56% for the angle of repose. Seeding efficiency showed consistent results between calibration (354 g/min) and verification tests (347 g/min), while breakage rates remained within acceptable ranges (2.3% predicted vs. 4.1% actual). The established parameter set provides a reliable foundation for discrete element simulation of coated Caragana korshinskii seed motion in metering devices, contributing to the optimization of seeding equipment design.

1. Introduction

Caragana korshinskii plays a crucial role in soil conservation, windbreak construction, and sustainable agriculture. It holds significant ecological and economic importance in arid and semi-arid regions. Currently, there is an increasing demand for Caragana korshinskii in ecological restoration projects, requiring efficient and large-scale seeding operations [1,2]. However, the unique physical properties of coated Caragana korshinskii seeds present challenges to traditional seeding equipment.
The seed-metering device is a crucial component in agricultural machinery used for precision planting, widely employed in field crop seeding operations [3,4,5]. The performance of seed-metering devices directly affects crop seeding quality and yield; therefore, improving their precision and operational efficiency remains a significant focus in agricultural machinery research. During the design and optimization of seed-metering devices, the dynamic interaction between seeds and the metering mechanism is a critical factor. Understanding seed motion characteristics accurately is essential for optimizing metering device performance [6,7]. Consequently, calibration experiments have become an indispensable part of research as a vital means of obtaining seed motion characteristic parameters.
The core of calibration experiments lies in establishing seed motion models within metering devices through experimental data, providing a basis for simulation analysis and performance evaluation [8,9,10]. Bembenek et al. [11] developed a discrete element model for material compaction in roller compactors, which demonstrated greater applicability compared to finite element methods. Zhao et al. conducted physical and calibration experiments to measure and calibrate the physical parameters of sunflower seeds. Liu et al. [12] calibrated powder simulation parameters based on the JKR model using particle scaling theory, with experimental results providing a reference for subsequent seed coating simulation. Wang et al. [13] proposed a new method for calibrating corn seed discrete element parameters through regression analysis with active target parameter searching. Adilet et al. [14] established nonlinear relationships between dynamic macroscopic fertilizer particle characteristics and DEM parameters. Su et al. [15] developed a finite element model for Caragana korshinskii stem cubes incorporating elastic, plastic, and viscous mechanical properties. Currently, the accuracy and broad applicability of calibration test results have become key research issues [16]. The physical characteristics of coated and uncoated seeds differ significantly, leading to insufficient research on coated seed motion characteristics during the metering process, necessitating physical parameter testing and calibration experiments for coated seeds.
This research aims to evaluate seed-metering device performance under actual working conditions and verify calibration test results through combined calibration and verification experiments on coated Caragana korshinskii seeds. Physical experiments were conducted to obtain physical parameters of coated Caragana korshinskii seeds, and a discrete element model was established in EDEM software (2020) to conduct parameter calibration experiments for Caragana korshinskii seeds, resulting in optimal simulation parameter combinations. The research findings can provide a reference for seed-metering device design optimization and theoretical support for improving seeding precision and operational efficiency.

2. Materials and Methods

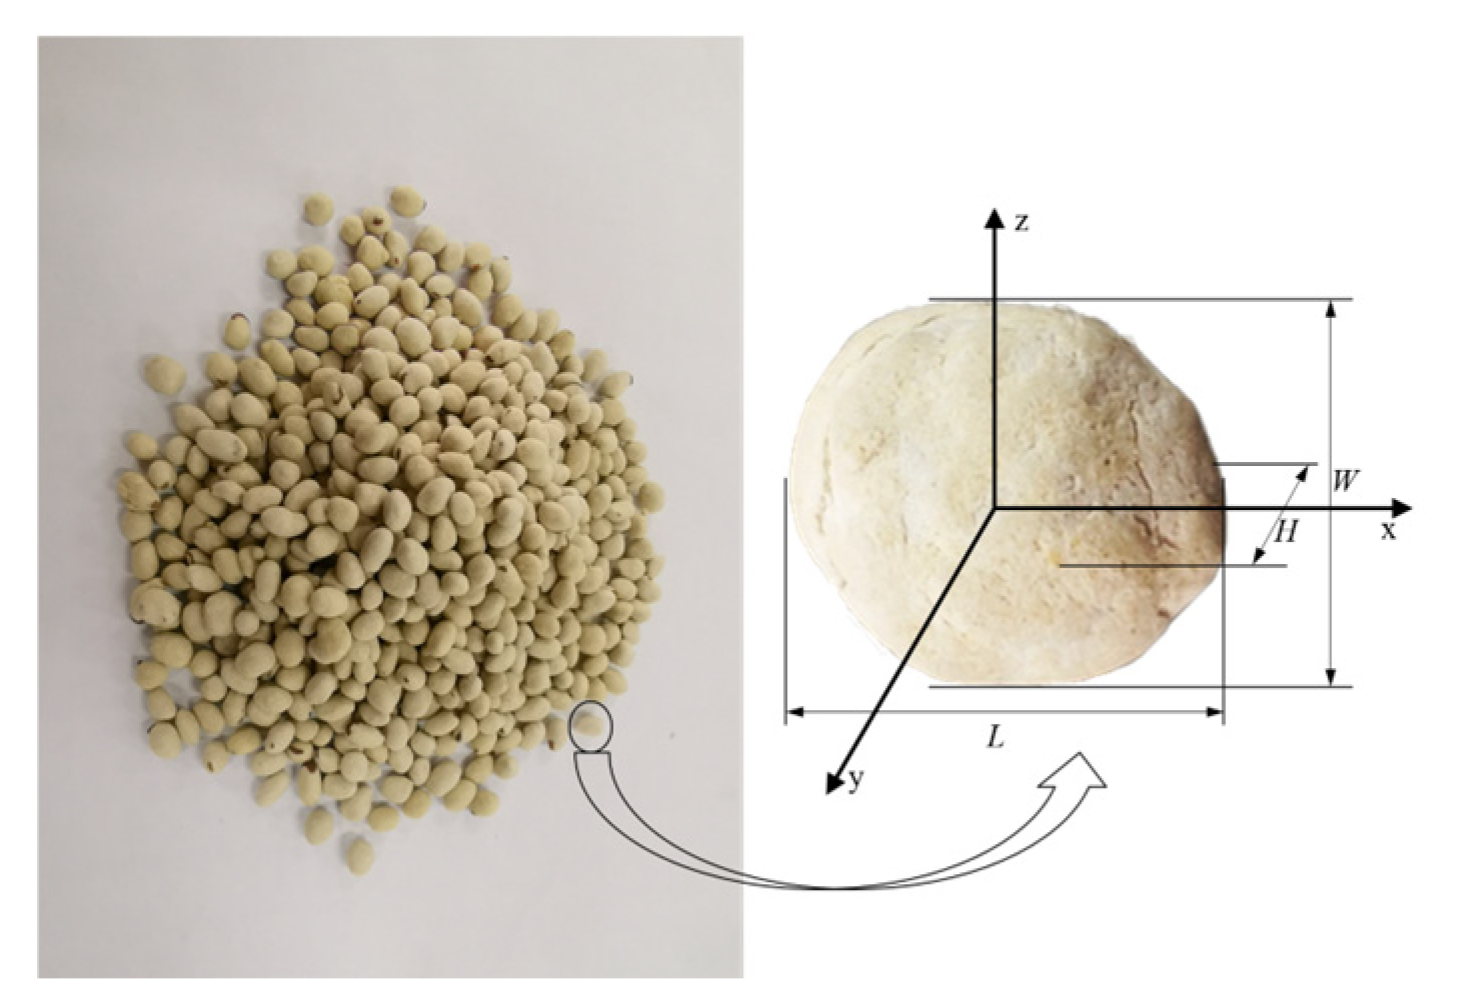
2.1. Determination of Basic Physical Parameters of Coated Caragana korshinskii Seeds

The experimental material consisted of coated Caragana korshinskii seeds suitable for growth in the Inner Mongolia region. Their basic physical parameters were measured to provide a foundation for subsequent physical and simulation experiments. The coated Caragana korshinskii seeds are shown in Figure 1.
A random sample of 1000 coated Caragana korshinskii seeds was weighed using an electronic balance with 0.1 g precision to determine their thousand-grain weight. The morphological dimensions of the coated seeds, including length, width, and height, were measured using a vernier caliper with 0.02 mm precision on 10 randomly selected seeds, with the average values recorded. The particle density of coated Caragana korshinskii seeds was measured using the liquid immersion method. The moisture content was determined according to the GB5009.3-2016 methodology [17,18,19]. The basic physical parameters of coated Caragana korshinskii seeds are presented in Table 1.

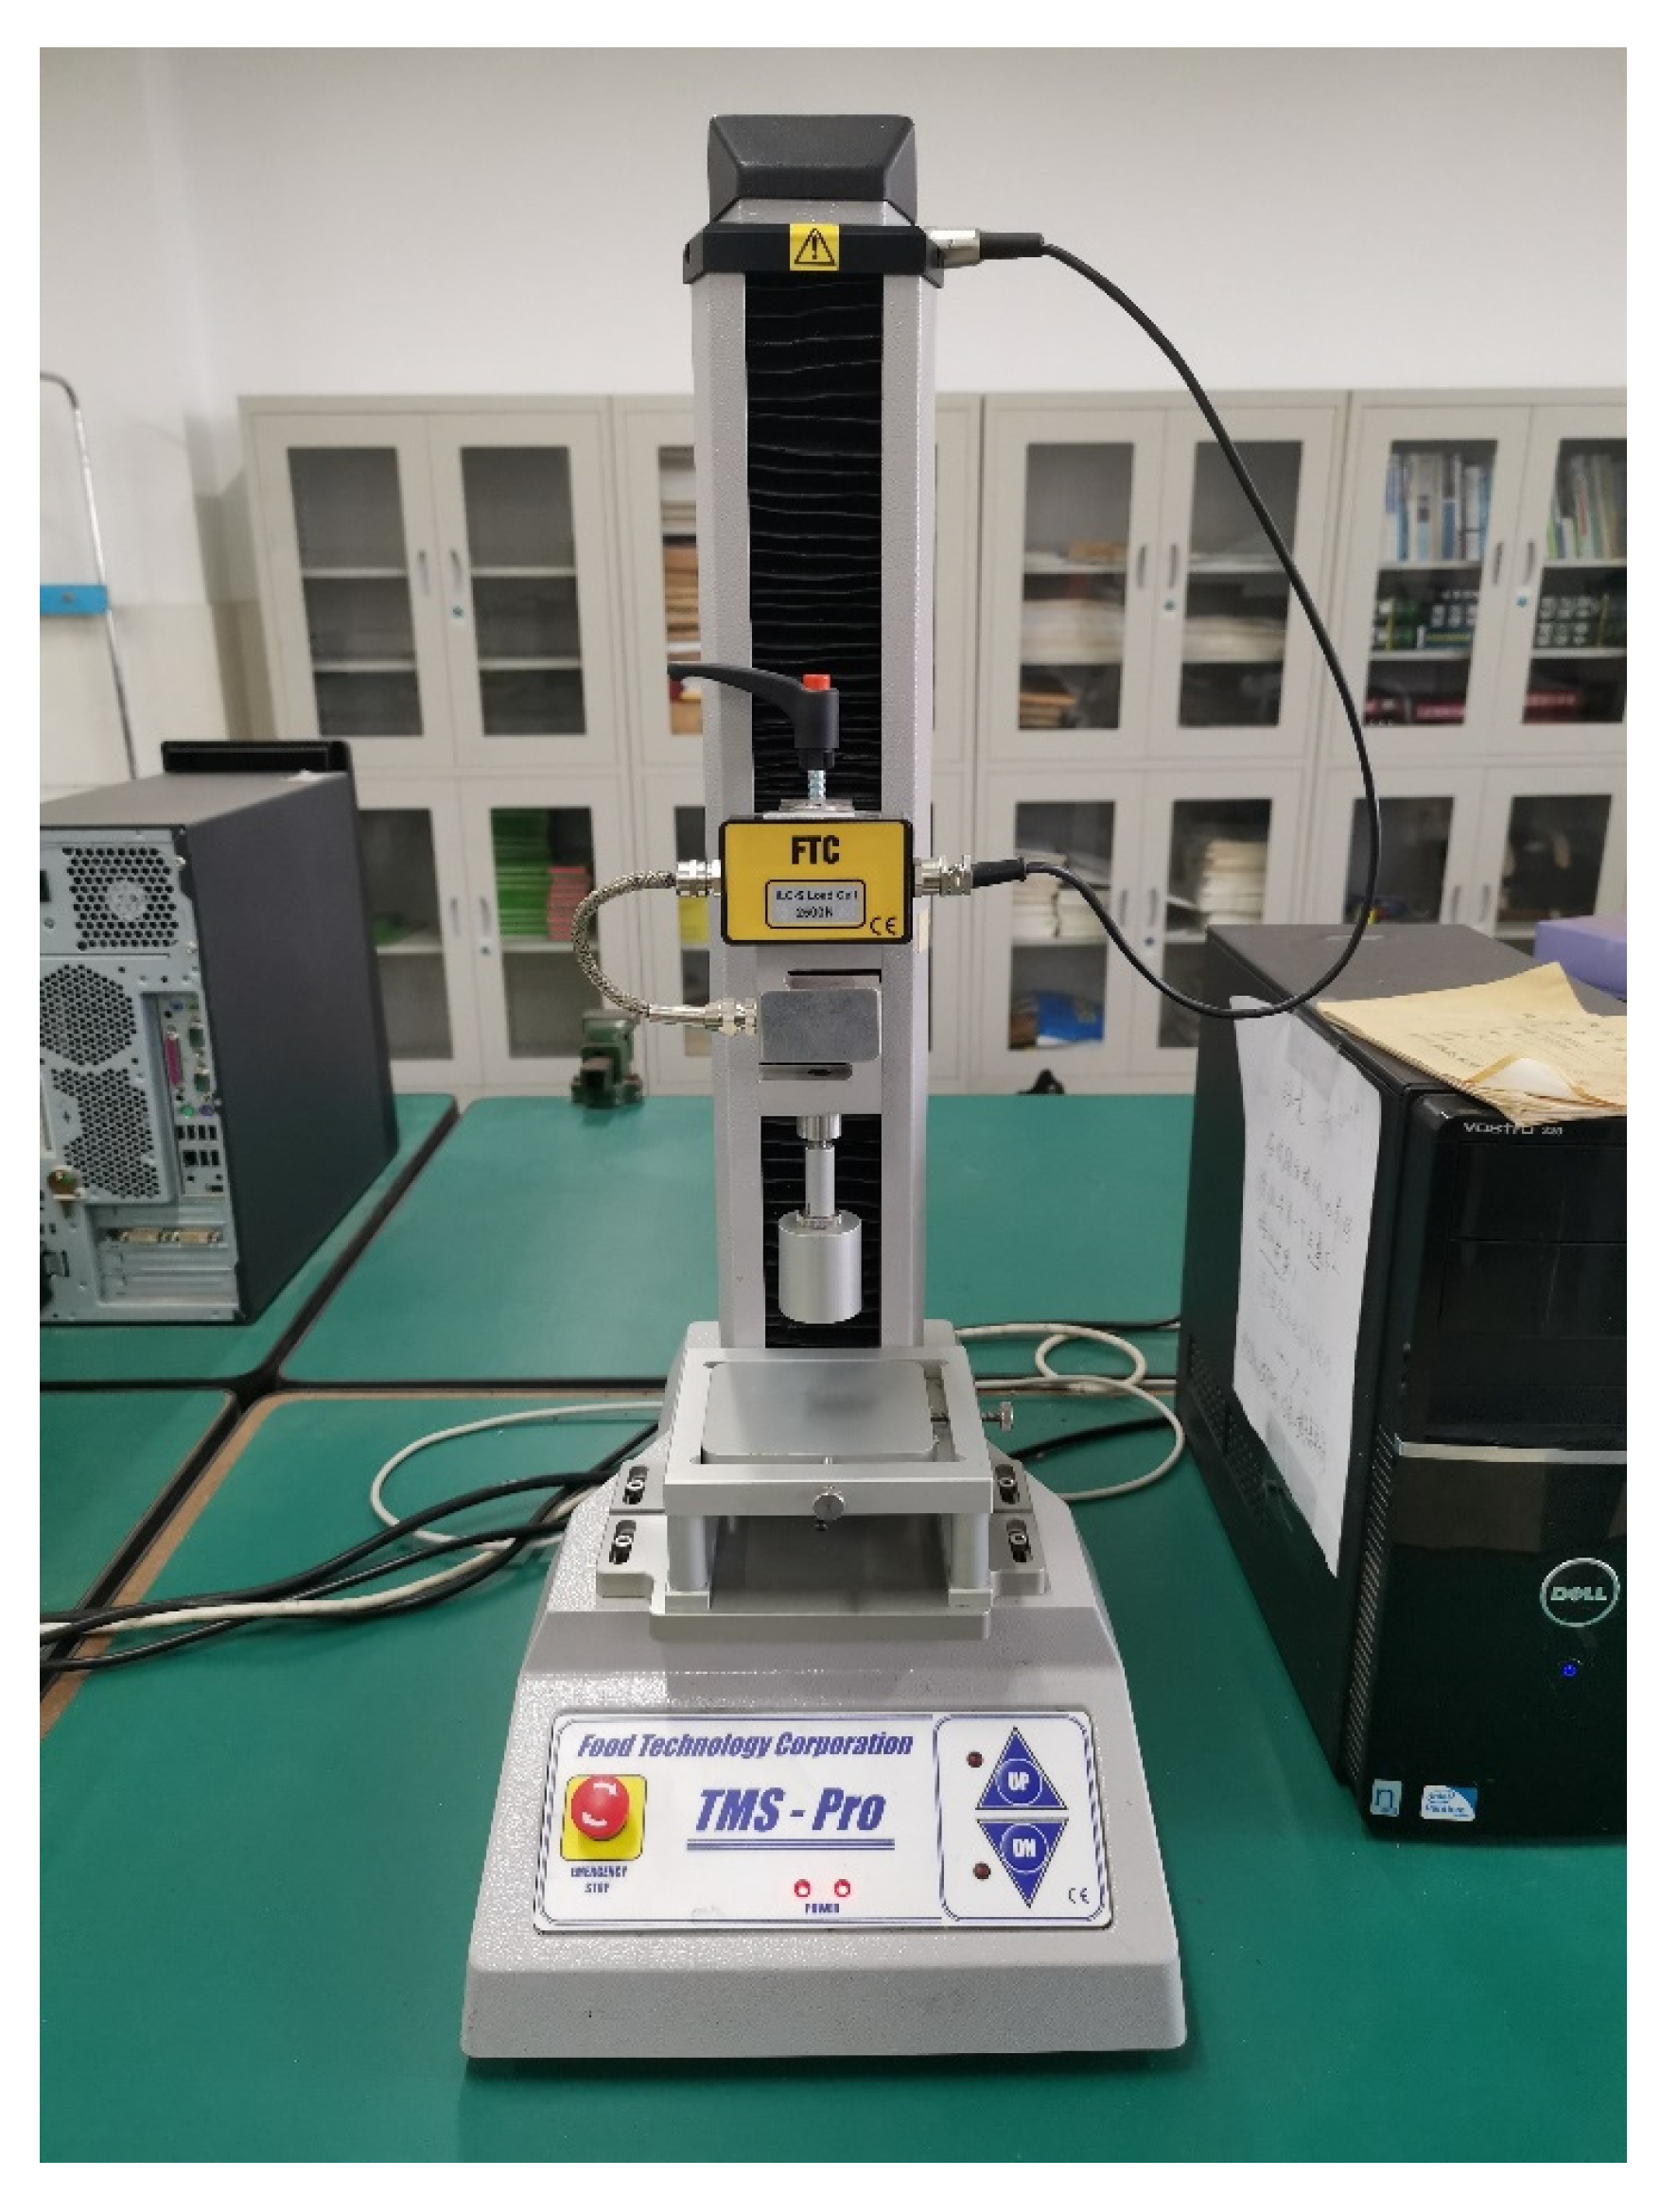
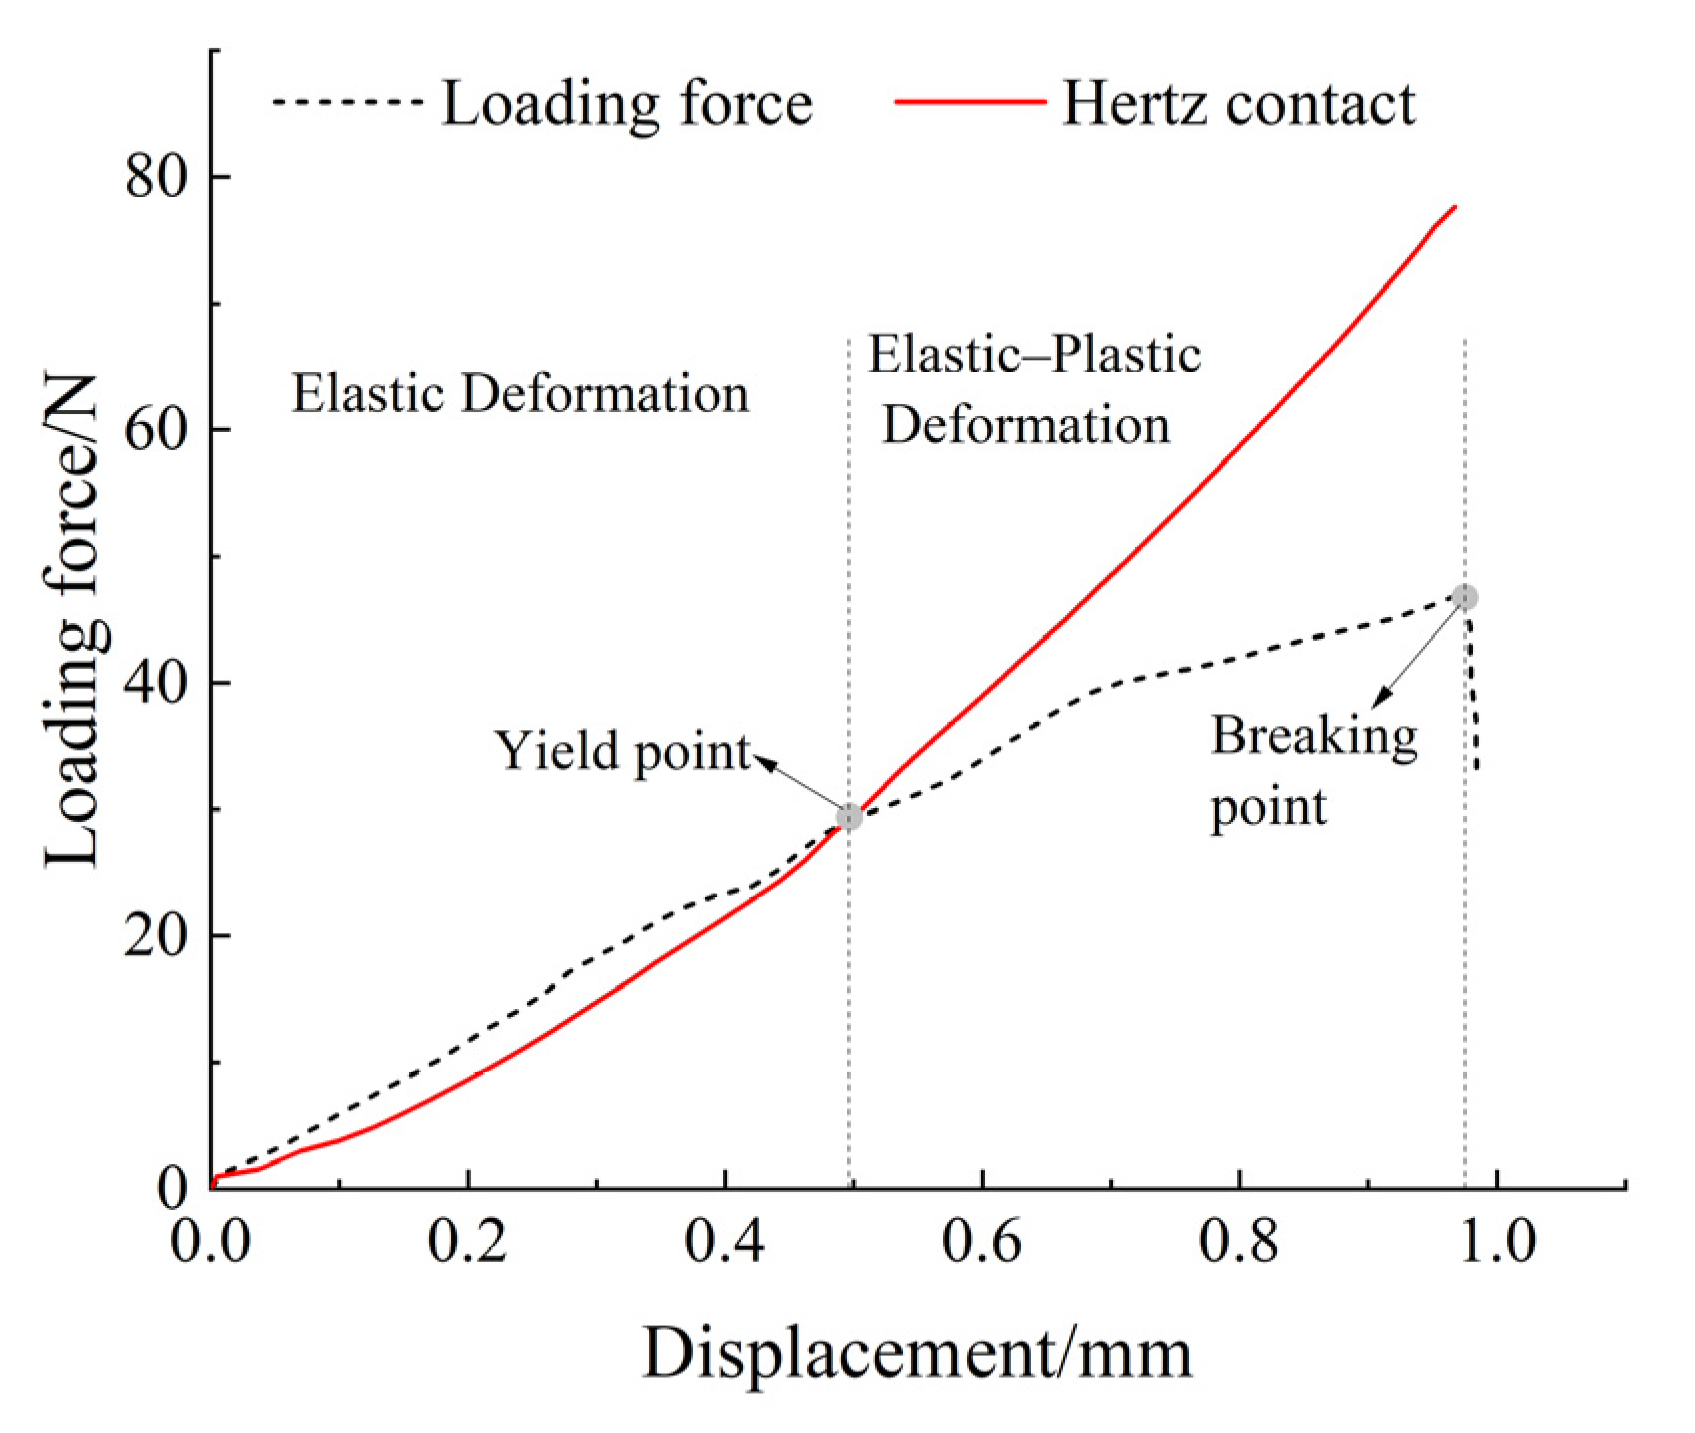
2.2. Determination of Shear Modulus for Coated Caragana korshinskii Seeds

Based on the morphological measurements, the seeds were relatively small in size. Referencing the literature, the Poisson’s ratio range was determined to be 0.3–0.5 [12,20,21]. The elastic modulus of coated Caragana korshinskii seeds was obtained through compression tests using a professional food texture analyzer (TMS-PRO) [22], as shown in Figure 2.
During the experiment, coated Caragana korshinskii seeds were placed horizontally on a plate and tested using a 10 mm diameter circular probe. The probe’s pre-test speed was set at 30 mm/min, test speed at 15 mm/min, and post-test speed at 30 mm/min. The seed deformation was set to 30%, with a breakpoint threshold of 70%. Loading was applied along the seed height direction, and load–displacement data during seed compression were obtained through software post-processing [12,23]. Figure 3 presents the force–displacement curve of the single-particle compression test. In the initial loading stage, the force–displacement relationship follows the Hertz contact model, indicating that the material primarily undergoes elastic deformation. As the loading force increases, the curve gradually deviates from the Hertz theoretical model and exhibits a significant change at the yield point, marking the transition to elastic–plastic deformation. With further loading, the material reaches the breaking point, corresponding to the inflection point where the curve declines, indicating material fracture.
The shear modulus is a crucial parameter in the simulation of coated Caragana korshinskii seeds [24,25]. In this study, the shear modulus was calculated using Equation (1):
G = E 2 1 + μ F = 4 3 E 1 μ 2 d 2 δ 3 2
where G represents the shear modulus of coated Caragana korshinskii seeds (Pa), E represents Young’s modulus (Pa), μ represents Poisson’s ratio, F represents the force (N), d represents the diameter (mm), and δ represents the compression displacement (mm).
The experiment was repeated 30 times, and using Equation (1), the average shear modulus range was determined to be 5–20 MPa.
In 30 repetitive compression resistance tests of coated Caragana korshinskii seeds, the maximum compression resistance was 62.5 N and the minimum was 36.7 N, though these extreme values occurred infrequently. The compression resistance primarily fell within the 40 N–50 N range, as shown in Figure 4. This variation may be attributed to inconsistent coating shell thickness formed during the seed coating process, resulting in different strengths among coated Caragana korshinskii seeds. Additionally, inherent strength variations exist in the Caragana korshinskii seeds themselves. Based on the statistical distribution analysis of seed breakage force, data show that 98% of the seed samples break when the force exceeds 40 N. Considering that the main goal of this study is to maximize seed integrity, we have adopted a conservative approach by setting 40 N as the critical force threshold.

2.3. Determination of Contact Parameters for Coated Caragana korshinskii Seeds

The static friction coefficient, defined as the ratio of maximum static friction force to normal pressure on the contact surface, was measured using a CNY-1 type inclined plane apparatus for both seed-to-seed and seed-to-aluminum plate interactions [26], as shown in Figure 5. To determine the static friction coefficient between seeds, a group of seeds was placed on a seed-covered inclined surface. The incline angle was gradually increased until the seed group reached a critical sliding state. The angle displayed on the digital angle meter was recorded and used to calculate the static friction coefficient between coated Caragana korshinskii seeds using Equation (2). For measuring the static friction coefficient between the seeds and the aluminum plate, the seed-covered surface was replaced with an aluminum plate, following the same testing procedure. After multiple trials and averaging, the static friction coefficient between coated Caragana korshinskii seeds was determined to be 0.295 ± 0.131, while the static friction coefficient between seeds and aluminum plate was 0.111 ± 0.036.
μ = tan α
where μ represents the static friction coefficient, and α represents the angle indicated by the inclined plane apparatus when the coated Caragana korshinskii seeds are about to slide on the measurement surface.
Similar to the static friction coefficient testing method, rolling friction coefficients were determined by placing seeds on both aluminum and seed-covered surfaces of the inclined plane apparatus. The angle at which seeds began stable rolling was recorded and used to calculate rolling friction coefficients between the seed-to-aluminum plate and seed-to-seed interactions. Due to the small volume and irregular shape of coated Caragana korshinskii seeds, significant variations were observed in rolling friction coefficients. After multiple trials, the rolling friction coefficient between seeds was determined to be 0.667 ± 0.082, while between seeds and the aluminum plate, it was 0.214 ± 0.043. To enhance experimental accuracy, these rolling friction coefficients were further calibrated through simulation experiments based on physical test results.
The coefficient of restitution was determined by dropping individual coated Caragana korshinskii seeds from a fixed height above the seed plate and recording the bouncing process using a high-speed camera (PCO.DIMAX, Excelitas, Waltham, MA, USA), as shown in Figure 6. A layer of seeds was arranged on a seed bed, and seeds were released from a height of 50 cm with an initial velocity of 0 m/s, allowing them to fall freely onto the seed bed. Upon impact, the seeds exhibited rebound behavior. The fall and rebound processes were captured using a high-speed camera. The results were then analyzed using the data processing module of TEMA software (version 3.4-500, Image Systems, Linköping, Sweden). After 10 repetitive trials, the coefficient of restitution between seeds was found to be 0.219 ± 0.016, while between the seeds and aluminum plate, it was 0.558 ± 0.076.

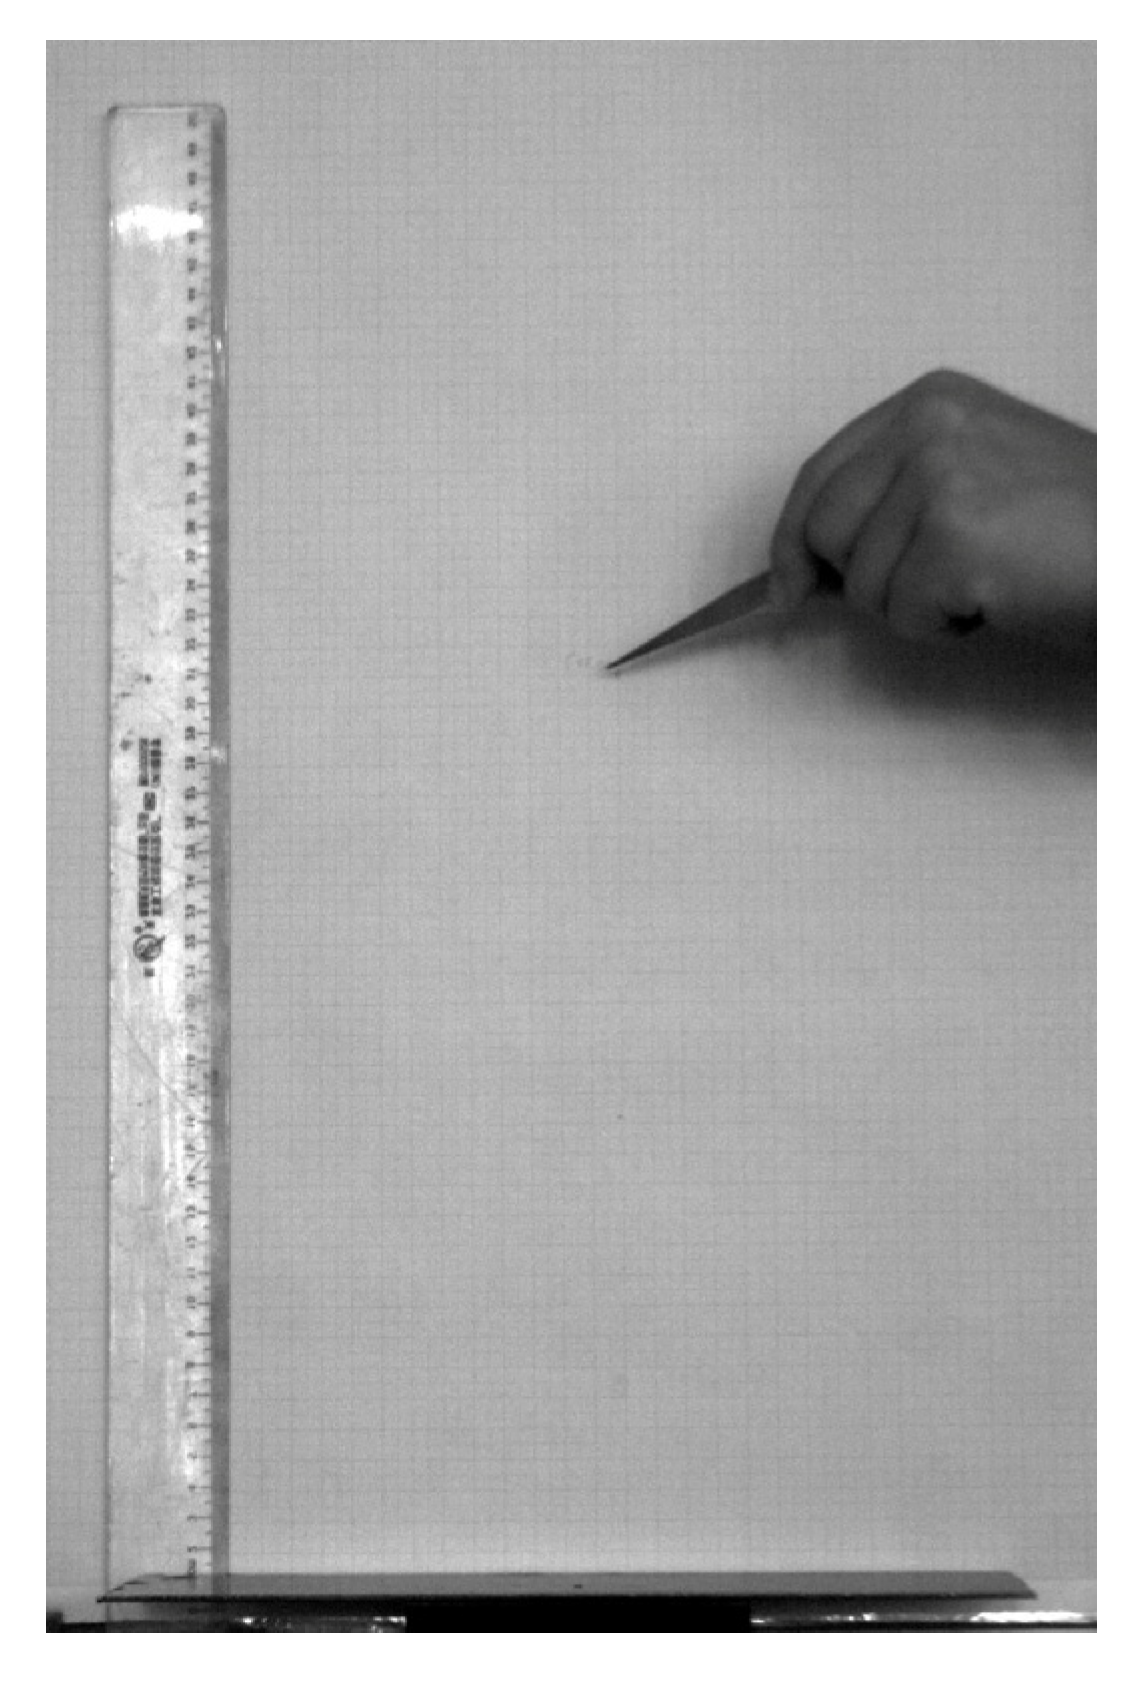
2.4. Determination of Angle of Repose for Coated Caragana korshinskii Seeds

The angle of repose is a crucial physical parameter of coated Caragana korshinskii seeds, directly influencing seed contact parameter calibration and hopper design. Physical experiments were conducted to determine this parameter using the drawer-removal method. A custom-made test box was fabricated with dimensions of 200 mm × 110 mm × 60 mm, featuring a material compartment of 50 mm × 110 mm × 60 mm. The material compartment was filled to 80% capacity with coated Caragana korshinskii seeds. The drawer plate was quickly withdrawn, allowing seeds to freely collapse and form a natural angle, which represents the angle of repose. After 10 repetitive measurements following this procedure, the angle of repose for coated Caragana korshinskii seeds was determined to be 36.47° ± 0.3.

2.5. Simulation Parameter Settings

Based on physical test results, a simulation model of coated Caragana korshinskii seeds was established in EDEM software using the multi-sphere particle filling method, as shown in Figure 7. The drawer-removal test box was designed using SoilWorks software (2018), exported in STP format, and imported into EDEM software for simulation experiments, as illustrated in Figure 8a.
A virtual particle plane was established above the box compartment to generate coated Caragana korshinskii seed particles. The particle generation was set to dynamic mode with a generation rate of 5000/s, producing a total of 3500 particles. To balance experimental accuracy and computational efficiency, particles were simulated using fixed dimensions. The total simulation time was set to 15 s, with a particle generation period of 3.5 s, Rayleigh Time Step of 6.87 × 10⁻⁶ s, and grid size of 3R. The Hertz–Mindlin no-slip model was selected for particle contact modeling. After particle generation was completed, the drawer plate was rapidly withdrawn, allowing seeds to freely disperse and collapse, forming a natural pile state as shown in Figure 8b. The angle of repose was obtained through the linear fitting of the pile profile using Matlab software (2022).

2.6. Testing Methodology

The calibration process for the angle of repose followed a systematic approach: first using the Plackett–Burman experimental design to screen parameters with significant influence, then applying the Path of Steepest Ascent method to determine optimal parameter levels, and finally employing Response Surface Methodology to establish a second-order regression model between significant parameters and the angle of repose for optimization. Based on previous experimental results, Plackett–Burman trials were conducted for coated Caragana korshinskii seeds’ angles of repose [27]. The test factors are shown in Table 2, and the experimental design and results are presented in Table 3.
Pareto chart analysis revealed that parameters D, G, and C had significant effects on the angle of repose. The Path of Steepest Ascent method experiments were conducted using the parameters identified as having a significant influence. The relative errors between the resting angles obtained in each trial and the physical resting angle (36.47°) are presented in Table 4. Through this method, the optimal ranges were determined as C (0.217–0.229), D (0.270–0.374), and G (0.105–0.133). Using these ranges as high and low levels, Box–Behnken experiments were designed, with parameter level coding shown in Table 5.

2.7. Seed Metering Verification Experiments

Verification experiments of coated Caragana korshinskii seeds in the metering device were conducted based on calibration results, as shown in Figure 9, to validate the calibration accuracy. Physical experiments utilized a 4BQD-40 broadcast seeder, while simulation experiments were performed using a three-dimensional model of the seeder. The primary evaluation metrics included seed metering efficiency and seed breakage rate. Metering efficiency was assessed by comparing actual and simulated seed discharge rates to verify the calibration results’ applicability under real conditions. Breakage rate evaluated seed damage during the metering process, with simulation predicting breakage through force analysis and physical experiments measuring actual seed damage proportions. Simulation parameters matched those of calibration experiments, using 10,000 seed particles. In simulations, seeds experiencing forces exceeding 40 N were classified as damaged, while physical experiments counted damaged seeds discharged from the metering device. In the physical experiments, the seeder’s working speed was set to 20 r/min, and the same speed was used in the simulation tests. Comparing experimental results with calibration data validated the calibration accuracy and provided a foundation for optimizing seed-metering device performance.

3. Results

3.1. Calibration Test Results

Analysis of parameter contributions from the Plackett–Burman experiments for coated Caragana korshinskii seeds, as shown in Figure 10, revealed that parameters A, C, D, G, and H exhibited positive effects on the angle of repose, indicating that the angle increases with these factors. Conversely, parameters B, E, and F showed negative effects, with the angle decreasing as these factors increased. A contribution rate analysis of the factors identified the top three influential parameters as D, G, and C, which significantly impacted the angle of repose. Based on significance levels, the key parameters were determined to be the seed-to-seed static friction coefficient, seed-to-aluminum static friction coefficient, and seed-to-seed coefficient of restitution.
The Box–Behnken experimental design and results are presented in Table 6. Using Design-Expert 11.0 software, the following second-order regression equation for the angle of repose was obtained:
θ = 40.86 + 1.42 C + 4.36 D + 1.71 G + 1.32 C D 0.3875 C G + 0.955 D G 3.92 C 2 3.89 D 2 3.21 G 2
Variance analysis results of the Box–Behnken experiments are shown in Table 7. The fitted model demonstrated high significance (p < 0.01) with a determination coefficient R2 = 0.9790 and an adjusted determination coefficient adjusted R2 = 0.9521, both approaching 1, indicating excellent model fit. Parameters C, D, G, C2, D2, and G2 showed extremely significant effects on the angle of repose. The interaction term CD showed significant influence, while CG and DG interactions were not significant. The static friction coefficient between seeds is a key parameter that describes the frictional force between the seed surfaces. As the friction force between seeds increases, the seeds are less likely to slide during the sowing process, which affects the packing state of the seeds [9,19]. Experimental results show that the static friction coefficient between seeds has a significant impact on the resting angle; a higher friction coefficient typically results in a larger resting angle. This indicates that when designing seeders in the future, a proper friction coefficient setting is crucial for optimizing seed motion characteristics. The static friction coefficient between the seeds and the aluminum plate determines the sliding resistance when the seeds come into contact with the seeding equipment. An increase in friction can cause the seeds to move less smoothly within the equipment, potentially affecting the seeding efficiency. Therefore, adjusting the friction between the seed and the contact surface of the equipment is important for controlling seed stability and preventing irregular flow. The restitution coefficient represents the seed’s rebound ability after collision. During the sowing process, frequent collisions between seeds and equipment occur, and a higher restitution coefficient results in seeds bouncing more easily, which alters the way the seeds interact with the equipment. The quadratic terms (C2, D2, and G2) in Equation (3) indicate that these parameters not only influence the angle of repose directly but also exhibit nonlinear effects. Specifically, the interaction terms CD, CG, and DG reflect the inter-relationships between the parameters, suggesting that the combination of seed-to-seed and seed-to-equipment contact, friction characteristics, and rebound ability are important factors affecting the resting angle. The regression model developed in this study provides a clear description of the relationship between physical seed parameters (friction coefficient and restitution coefficient) and seed behavior, offering a scientific basis for the design and optimization of seeding equipment.
Using Design-Expert 11.0 software and targeting the angle of repose, the second-order regression equation was solved to obtain a parameter set closely matching physical experiment averages: seed-to-seed coefficient of restitution of 0.221, seed-to-seed static friction coefficient of 0.337, and seed-to-aluminum static friction coefficient of 0.117. To verify the accuracy and reliability of the simulation calibration, five angle of repose simulations were conducted using these parameters in EDEM. The resulting average angle of repose was 37.04°, showing a relative error of 1.56% compared to physical experiment values. This minimal difference indicates no significant disparity between simulation and physical experiments, as illustrated in Figure 11.

3.2. Seeding Performance Tests

Verification experiments of the seed-metering device were conducted based on calibration results. The findings demonstrated consistency between calibration and verification tests regarding seeding efficiency. Specifically, the calibration tests showed a seeding efficiency of 354 g/min, while the actual verification tests achieved 347 g/min. This variation can be attributed to multiple experimental factors, including seed surface friction, air flow velocity, and metering device operational conditions. These results validate the calibration methodology and indicate stable, reliable metering device performance across different test conditions.
The breakage rate is a key indicator for assessing whether seeds are damaged during the seeding process. Figure 12 shows a comparison of broken and unbroken seeds, with seed surface exposure used as the criterion for determining breakage. Comparing simulation and actual test results, the calibration tests predicted a breakage rate of 2.3%, while verification tests showed an actual rate of 4.1%. This difference falls within acceptable error margins, demonstrating that calibration tests effectively reflect seed breakage patterns in actual metering operations. Minor variations in breakage rates may be attributed to changes in seed physical properties, operating environment conditions, and inherent seed variations. In practical applications, breakage rates may fluctuate due to environmental factors (such as humidity and temperature) and seed variety differences [28]. Therefore, while calibration test results provide valuable reference data, multiple environmental variables affecting breakage rates should be considered in metering device design and optimization.
Comparison between calibration and verification test results shows a good correlation in both seeding efficiency and breakage rates, validating the accuracy of seed motion characteristics derived from calibration tests. Despite minor discrepancies in certain aspects (such as breakage rates), calibration test results effectively guide actual metering device performance evaluation and optimization. These findings hold significant reference value for future seed-metering device design, particularly in coordinating virtual simulations with actual testing and providing a basis for simulation model parameter calibrations.

4. Conclusions

This study systematically evaluated metering device performance and verified calibration test accuracy through combined calibration and verification experiments. The calibration tests provided key parameters for seed motion in the metering device: seed-to-seed coefficient of restitution (0.221), seed-to-seed static friction coefficient (0.337), and seed-to-aluminum static friction coefficient (0.117). Verification tests using calibrated parameters showed only a 1.56% relative error compared to physical test values. Through calibration testing, a successful seed motion model was established, providing accurate parameters for simulation analysis.
Verification test results confirmed the high accuracy of calibration-derived parameters in practical applications, with good consistency between experimental data for seeding efficiency and breakage rates. Specifically, the minimal deviation between predicted and actual seeding efficiency demonstrates that calibration tests effectively reflect metering device performance under various operating conditions. Breakage rate variations remained within reasonable bounds, further validating the reliability and applicability of calibration test results.

Author Contributions

Conceptualization, Z.T.; methodology, X.T.; software, Z.T.; validation, Z.T. and H.X.; formal analysis, X.T.; investigation, P.B.; resources, P.B.; data curation, Z.T. and B.J.; writing—original draft preparation, Z.T.; writing—review and editing, H.H.; visualization, H.H.; supervision, H.X. and B.J.; project administration, P.B.; funding acquisition, X.T. and Z.T. All authors have read and agreed to the published version of the manuscript.

Funding

This research was funded by the National Natural Science Foundation of China (No. 42367046), the Natural Science Foundation of Inner Mongolia Autonomous Region (2023LHMS04010), Special Research Projects for First-Class Disciplines (YLXKZX-NND-034), and Scientific Research Projects of Higher Education Institutions in Inner Mongolia Autonomous Region (NJZZ23032).

Institutional Review Board Statement

Not applicable.

Informed Consent Statement

Not applicable.

Data Availability Statement

All data analyzed during this study are included in this article.

Conflicts of Interest

The authors declare no conflicts of interest.

References

  1. Deaker, R.; Roughley, R.J.; Kennedy, I.R. Legume Seed Inoculation Technology—A Review. Soil Biol. Biochem. 2004, 36, 1275–1288. [Google Scholar] [CrossRef]
  2. Taylor, A.G.; Allen, P.S.; Bennett, M.A.; Bradford, K.J.; Burris, J.S.; Misra, M.K. Seed Enhancements. Seed Sci. Res. 1998, 8, 245–256. [Google Scholar] [CrossRef]
  3. Li, C.; Tang, Y.; McHugh, A.D.; Wu, X.; Liu, M.; Li, M.; Xiong, T.; Ling, D.; Tang, Q.; Liao, M.; et al. Development and Performance Evaluation of a Wet-Resistant Strip-till Seeder for Sowing Wheat Following Rice. Biosyst. Eng. 2022, 220, 146–158. [Google Scholar] [CrossRef]
  4. Zhou, H.; Dai, F.; Shi, R.; Zhao, C.; Deng, H.; Pan, H.; Zhao, Q. Simulation and Optimization of a Pendulum-Lever-Type Hole-Seeding Device. Agriculture 2024, 14, 750. [Google Scholar] [CrossRef]
  5. Yu, D.; Peng, F.; Zeng, Z.; Zhang, M.; Yang, W.; Zang, Y.; He, J.; Huang, Y.; Wu, Y.; Zhong, W.; et al. Vibrational Dynamics of Rice Precision Hole Seeders and Their Impact on Seed Dispensation Efficacy. Agriculture 2024, 14, 324. [Google Scholar] [CrossRef]
  6. Wei, L.; Wang, Q.; Niu, K.; Bai, S.; Wei, L.; Qiu, C.; Han, N. Design and Test of Seed–Fertilizer Replenishment Device for Wheat Seeder. Agriculture 2024, 14, 374. [Google Scholar] [CrossRef]
  7. Ma, X.; Liu, M.; Hou, Z.; Gao, X.; Bai, Y.; Guo, M. Numerical Simulation and Experimental Study of Pelletized Coating of Small Grain Forage Seeds. Trans. Chin. Soc. Agric. Eng. 2023, 39, 43–52. [Google Scholar]
  8. Zeng, F.; Cui, J.; Li, X.; Bai, H. Establishment of the Interaction Simulation Model between Plug Seedlings and Soil. Agronomy 2023, 14, 4. [Google Scholar] [CrossRef]
  9. Bai, H.; Wu, Y.; Ma, Y.; Xuan, D.; Du, W.; Liu, F.; Zhao, X. Discrete Element Model Construction and Dehulling Simulation Verification Based on Harvested Quinoa Grains. J. Food Sci. 2024, 89, 9336–9353. [Google Scholar] [CrossRef]
  10. Li, X.; Zhang, Z.; Zhao, L.; Zhang, H.; Shi, F. Research on the Calibration Method of the Bonding Parameters of the EDEM Simulation Model for Asphalt Mixtures. Coatings 2024, 14, 1553. [Google Scholar] [CrossRef]
  11. Bembenek, M.; Buczak, M.; Baiul, K. Modelling of the Fine-Grained Materials Briquetting Process in a Roller Press with the Discrete Element Method. Materials 2022, 15, 4901. [Google Scholar] [CrossRef] [PubMed]
  12. Liu, M.; Hou, Z.; Ma, X.; Zhang, X.; Dai, N. Determination and Testing of Pelletized Coated Particles. INMATEH-Agric. Eng. 2022, 66, 247–256. [Google Scholar] [CrossRef]
  13. Wang, Y.; Liang, Z.; Zhang, D.; Cui, T.; Shi, S.; Li, K.; Yang, L. Calibration Method of Contact Characteristic Parameters for Corn Seeds Based on EDEM. Trans. Chin. Soc. Agric. Eng. 2016, 32, 36–42. [Google Scholar] [CrossRef]
  14. Adilet, S.; Zhao, J.; Sayakhat, N.; Chen, J.; Nikolay, Z.; Bu, L.; Sugirbayeva, Z.; Hu, G.; Marat, M.; Wang, Z. Calibration Strategy to Determine the Interaction Properties of Fertilizer Particles Using Two Laboratory Tests and DEM. Agriculture 2021, 11, 592. [Google Scholar] [CrossRef]
  15. Su, Q.; Zhang, J.; Liu, W.; Ma, X.; Yu, Z.; Liu, Z. Fracture Failure Model of Caragana Korshinskii Kom. Branches Constructed Using ABAQUS/Explicit. Forests 2025, 16, 90. [Google Scholar] [CrossRef]
  16. Hanley, K.J.; O’Sullivan, C.; Oliveira, J.C.; Cronin, K.; Byrne, E.P. Application of Taguchi Methods to DEM Calibration of Bonded Agglomerates. Powder Technol. 2011, 210, 230–240. [Google Scholar] [CrossRef]
  17. Xiao, L.; Sha, W.; Tao, C.; Hou, C.; Xiao, G.; Ren, J. Effect on Purine Releasement of Lentinus Edodes by Different Food Processing Techniques. Food Chem. X 2022, 13, 100260. [Google Scholar] [CrossRef]
  18. Xu, T.; Fu, H.; Liu, M.; Feng, W.; Zhang, R.; Wang, Y.; Wang, J. Ellipsoidal Seed Modeling and Simulation Parameter Selection Based on the Discrete Element Method. Mater. Today Commun. 2023, 37, 106923. [Google Scholar] [CrossRef]
  19. Shi, L.; Zhao, W.; Sun, B.; Sun, W.; Zhou, G. Determination and Analysis of Basic Physical and Contact Mechanics Parameters of Quinoa Seeds by DEM. Int. J. Agric. Biol. Eng. 2023, 16, 35–43. [Google Scholar] [CrossRef]
  20. Chen, X.; Wang, X.; Bai, J.; Fang, W.; Hong, T.; Zang, N.; Wang, G. Virtual Parameter Calibration of Pod Pepper Seeds Based on Discrete Element Simulation. Heliyon 2024, 10, e31686. [Google Scholar] [CrossRef]
  21. Walunj, A.; Chen, Y.; Tian, Y.; Zeng, Z. Modeling Soil–Plant–Machine Dynamics Using Discrete Element Method: A Review. Agronomy 2023, 13, 1260. [Google Scholar] [CrossRef]
  22. Hasseldine, B.P.J.; Gao, C.; Collins, J.M.; Jung, H.-D.; Jang, T.-S.; Song, J.; Li, Y. Mechanical Response of Common Millet (Panicum miliaceum) Seeds under Quasi-Static Compression: Experiments and Modeling. J. Mech. Behav. Biomed. Mater. 2017, 73, 102–113. [Google Scholar] [CrossRef]
  23. Du, C.; Han, D.; Song, Z.; Chen, Y.; Chen, X.; Wang, X. Calibration of Contact Parameters for Complex Shaped Fruits Based on Discrete Element Method: The Case of Pod Pepper (Capsicum annuum). Biosyst. Eng. 2023, 226, 43–54. [Google Scholar] [CrossRef]
  24. Ma, X.; Yu, Z.; Liu, M.; Wang, J.; Su, Q.; Zhang, J.; Xie, J.; Wang, T. Mechanical Properties and Critical State Characteristics of Maize Root-Soil Composites at Different Soil Depths. Biosyst. Eng. 2025, 250, 163–173. [Google Scholar] [CrossRef]
  25. Portnikov, D.; Kalman, H. Determination of Elastic Properties of Particles Using Single Particle Compression Test. Powder Technol. 2014, 268, 244–252. [Google Scholar] [CrossRef]
  26. Ma, X.; Guo, M.; Tong, X.; Hou, Z.; Liu, H.; Ren, H. Calibration of Small-Grain Seed Parameters Based on a BP Neural Network: A Case Study with Red Clover Seeds. Agronomy 2023, 13, 2670. [Google Scholar] [CrossRef]
  27. Hou, Z.; Dai, N.; Chen, Z.; Qiu, Y.; Zhang, X. Measurement and Calibration of Physical Property Parameters for Agropyron Seeds in a Discrete Element Simulation. Trans. Chin. Soc. Agric. Eng. 2020, 36, 46–54. [Google Scholar] [CrossRef]
  28. Rundlöf, M.; Andersson, G.K.S.; Bommarco, R.; Fries, I.; Hederström, V.; Herbertsson, L.; Jonsson, O.; Klatt, B.K.; Pedersen, T.R.; Yourstone, J.; et al. Seed Coating with a Neonicotinoid Insecticide Negatively Affects Wild Bees. Nature 2015, 521, 77–80. [Google Scholar] [CrossRef]
Figure 1. Coated Caragana korshinskii seeds.
Coatings 15 00387 g001
Figure 2. Professional food physical property analyzer.
Coatings 15 00387 g002
Figure 3. Compression test results.
Coatings 15 00387 g003
Figure 4. Distribution map of compressive capacity.
Coatings 15 00387 g004
Figure 5. Friction test: (a) friction between species; (b) friction between seed plates.
Coatings 15 00387 g005
Figure 6. Coefficient of restitution test.
Coatings 15 00387 g006
Figure 7. Simulation model of coated Caragana korshinskii seeds.
Coatings 15 00387 g007
Figure 8. Simulation test of angle of repose by drawing board method: (a) initial state; (b) experimental process.
Coatings 15 00387 g008
Figure 9. Verification test.
Coatings 15 00387 g009
Figure 10. Plackett–Burman test parameter contribution analysis.
Coatings 15 00387 g010
Figure 11. Coated Caragana korshinskii seed resting angle test comparison: (a) simulation test; (b) physical test.
Coatings 15 00387 g011
Figure 12. Seed fragmentation.
Coatings 15 00387 g012
Table 1. Basic physical parameters of Coated Caragana korshinskii seeds.
Physical Parameters Value
Particle densitykg·m−31060.3 ± 0.21
Thousand-grain weightg76.4 ± 0.53
Moisture content%8.35 ± 0.06
Overall dimensions (L × W × H)mm × mm × mm6.832 ± 0.48 × 4.818 ± 0.19 × 4.542 ± 0.68
Table 2. Test factors.
FactorsCode
Poisson’s ratio of coated Caragana korshinskii seedsA
Shear modulus of coated Caragana korshinskii seeds/MpaB
Coefficient of restitution between coated Caragana korshinskii seedsC
Static friction coefficient between coated Caragana korshinskii seedsD
Rolling friction coefficient between coated Caragana korshinskii seedsE
Coefficient of restitution between coated Caragana korshinskii seeds and aluminum plateF
Static friction coefficient between coated Caragana korshinskii seeds and aluminum plateG
Rolling friction coefficient between coated Caragana korshinskii seeds and aluminum plateH
Table 3. Plackett–Burman test protocol and results.
NO.ABCDEFGHAngle of Repose θ (°)
10.5200.2350.1660.5850.4820.1470.17137.76
20.3200.2350.4260.5850.4820.0770.25742.25
30.350.2350.1660.7490.6340.0770.25717.99
40.5200.2050.4260.7490.6340.0770.17139.17
50.550.2050.1660.7490.4820.1470.25734.56
60.550.2350.4260.7490.4820.0770.17145.45
70.3200.2350.1660.7490.6340.1470.17133.83
80.550.2350.4260.5850.6340.1470.25764.39
90.3200.2050.4260.7490.4820.1470.25745.67
100.5200.2050.1660.5850.6340.0770.25715.59
110.350.2050.4260.5850.6340.1470.17148.33
Table 4. Steepest climb test design scheme and results.
NO.CDGRelative Error/%
10.2050.1660.07775.11
20.2110.2180.09146.93
30.2170.2700.10529.39
40.2230.3220.11919.94
50.2290.3740.13327.18
60.2350.4260.14731.13
Table 5. Parameter level coding table.
LevelCDG
−10.2170.2700.105
00.2230.3220.119
+10.2290.3740.133
Table 6. Box–Behnken test protocol and results.
NO.CDGAngle of Repose θ (°)
1−1−1029.22
21−1027.88
3−11034.94
411038.85
5−10−129.15
610−134.26
7−10133.30
810136.87
90−1−128.20
1001−135.24
110−1129.71
1201140.53
1300039.64
1400039.95
1500041.77
1600041.10
1700039.82
Table 7. Box–Behnken test regression model analysis of variance.
SourceSum of SquaresdfF-Valuep-Value
Model395.18936.3<0.0001
C16.16113.360.0081
D152.251125.88<0.0001
G23.5119.430.0031
CD7.0215.810.0468
CG0.600610.49660.5038
DG3.6513.020.126
C264.69153.490.0002
D263.79152.740.0002
G243.51135.980.0005
Residual8.477
Lack of Fit4.9331.860.2768
Pure Error3.534
Cor Total403.6516
Disclaimer/Publisher’s Note: The statements, opinions and data contained in all publications are solely those of the individual author(s) and contributor(s) and not of MDPI and/or the editor(s). MDPI and/or the editor(s) disclaim responsibility for any injury to people or property resulting from any ideas, methods, instructions or products referred to in the content.

