Study on Fatigue Characteristics of Cement-Emulsified Asphalt Mortar Under Coupled Effects of Humidity and Freeze–Thaw

 ,
,  ,
,
Abstract
1. Introduction
2. Materials and Methods
2.1. Raw Materials and Mix Proportions
2.1.1. Raw Materials
2.1.2. Mix Proportions
2.1.3. Specimen Preparation
2.2. Compressive Strength
2.3. Humidity–Freeze–Thaw Coupling Condition Design
2.3.1. Humidity Conditions
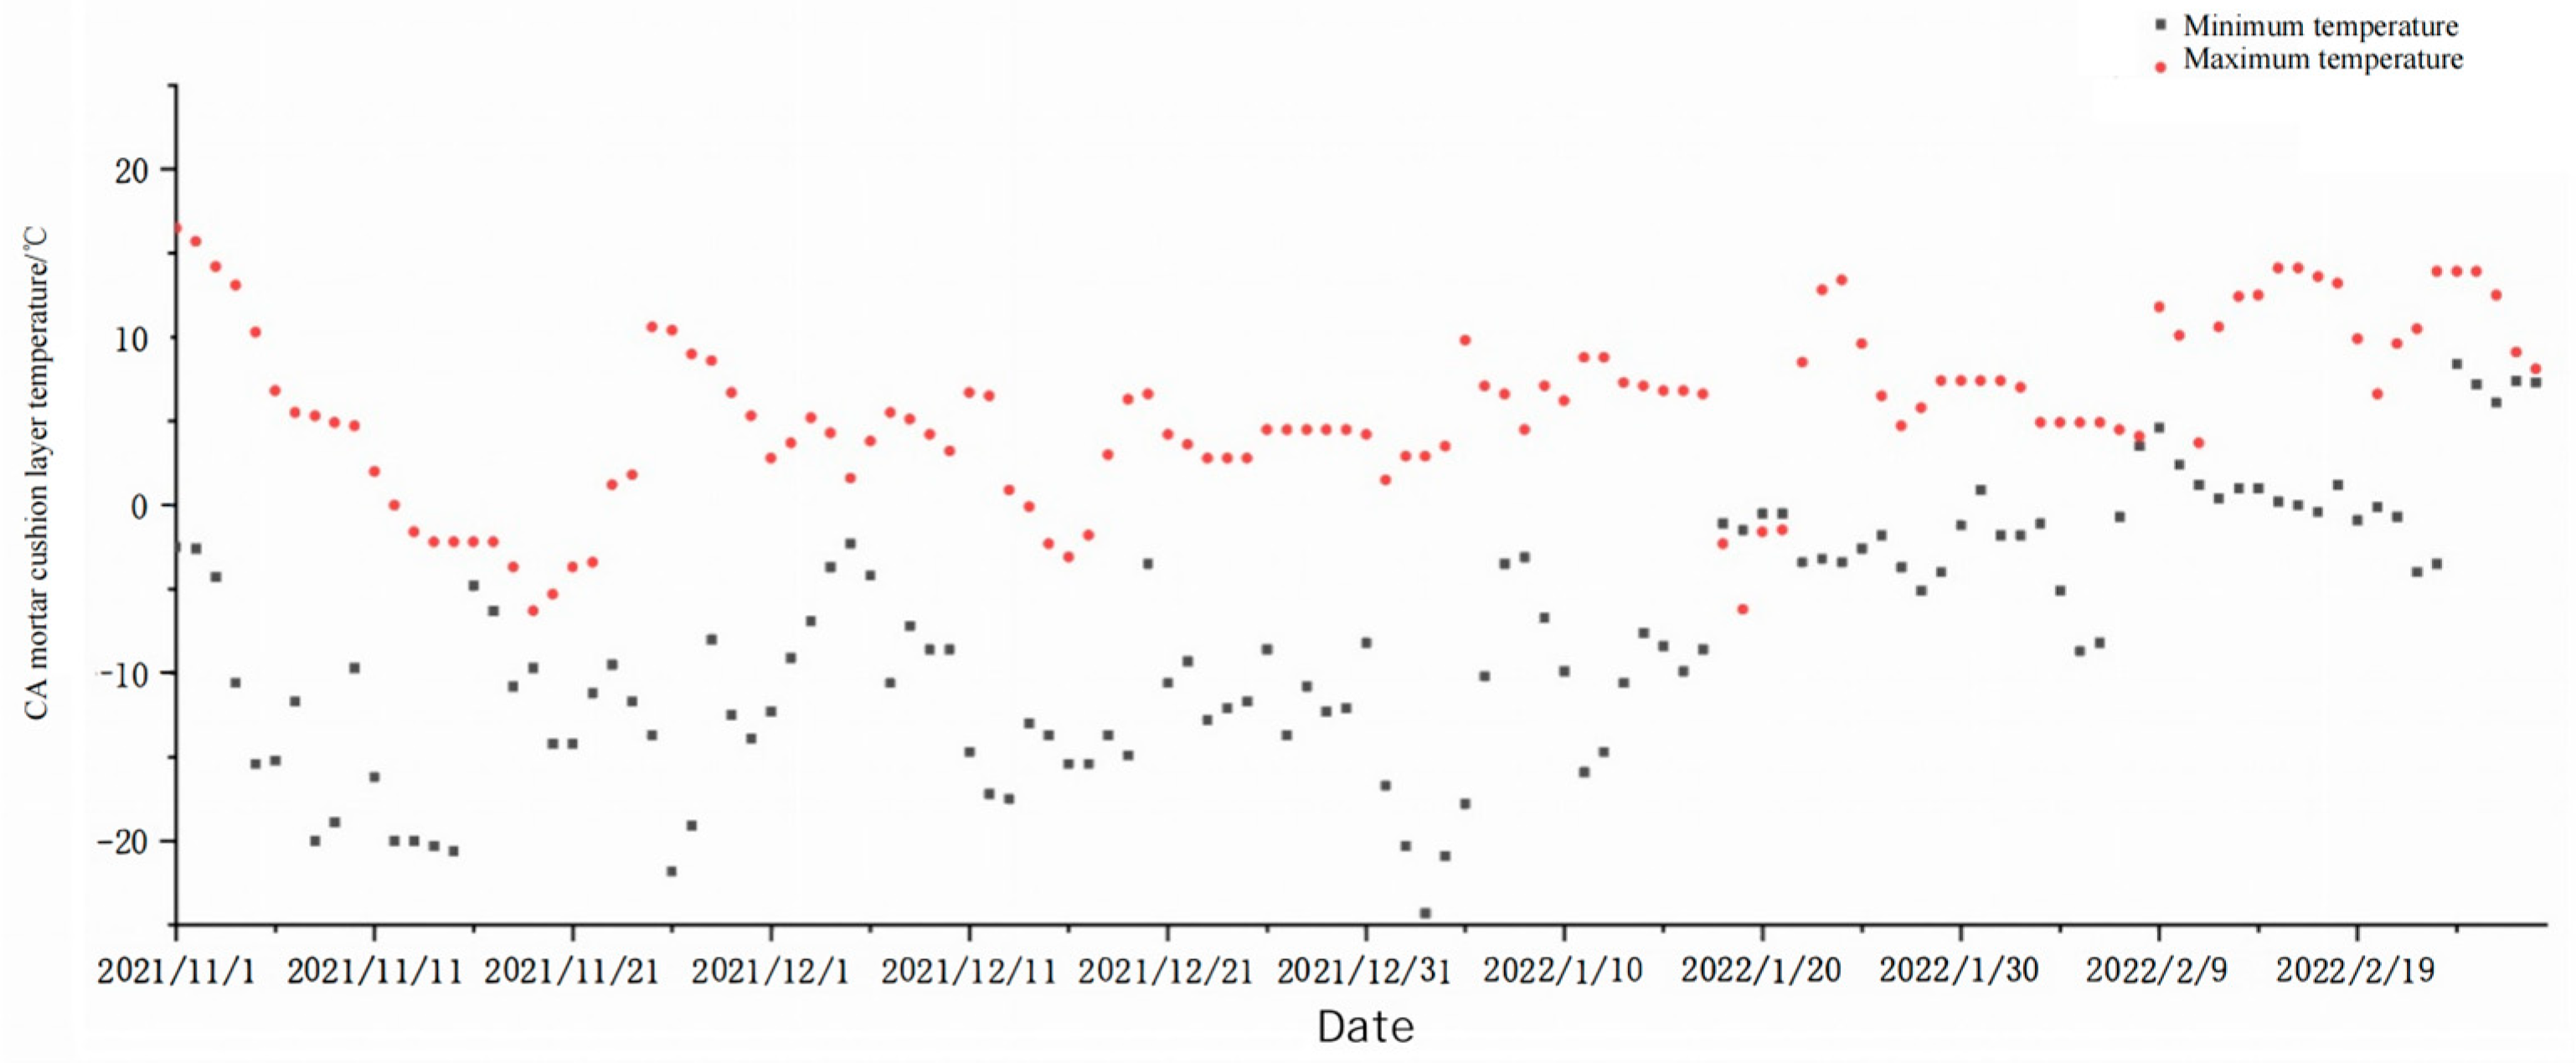
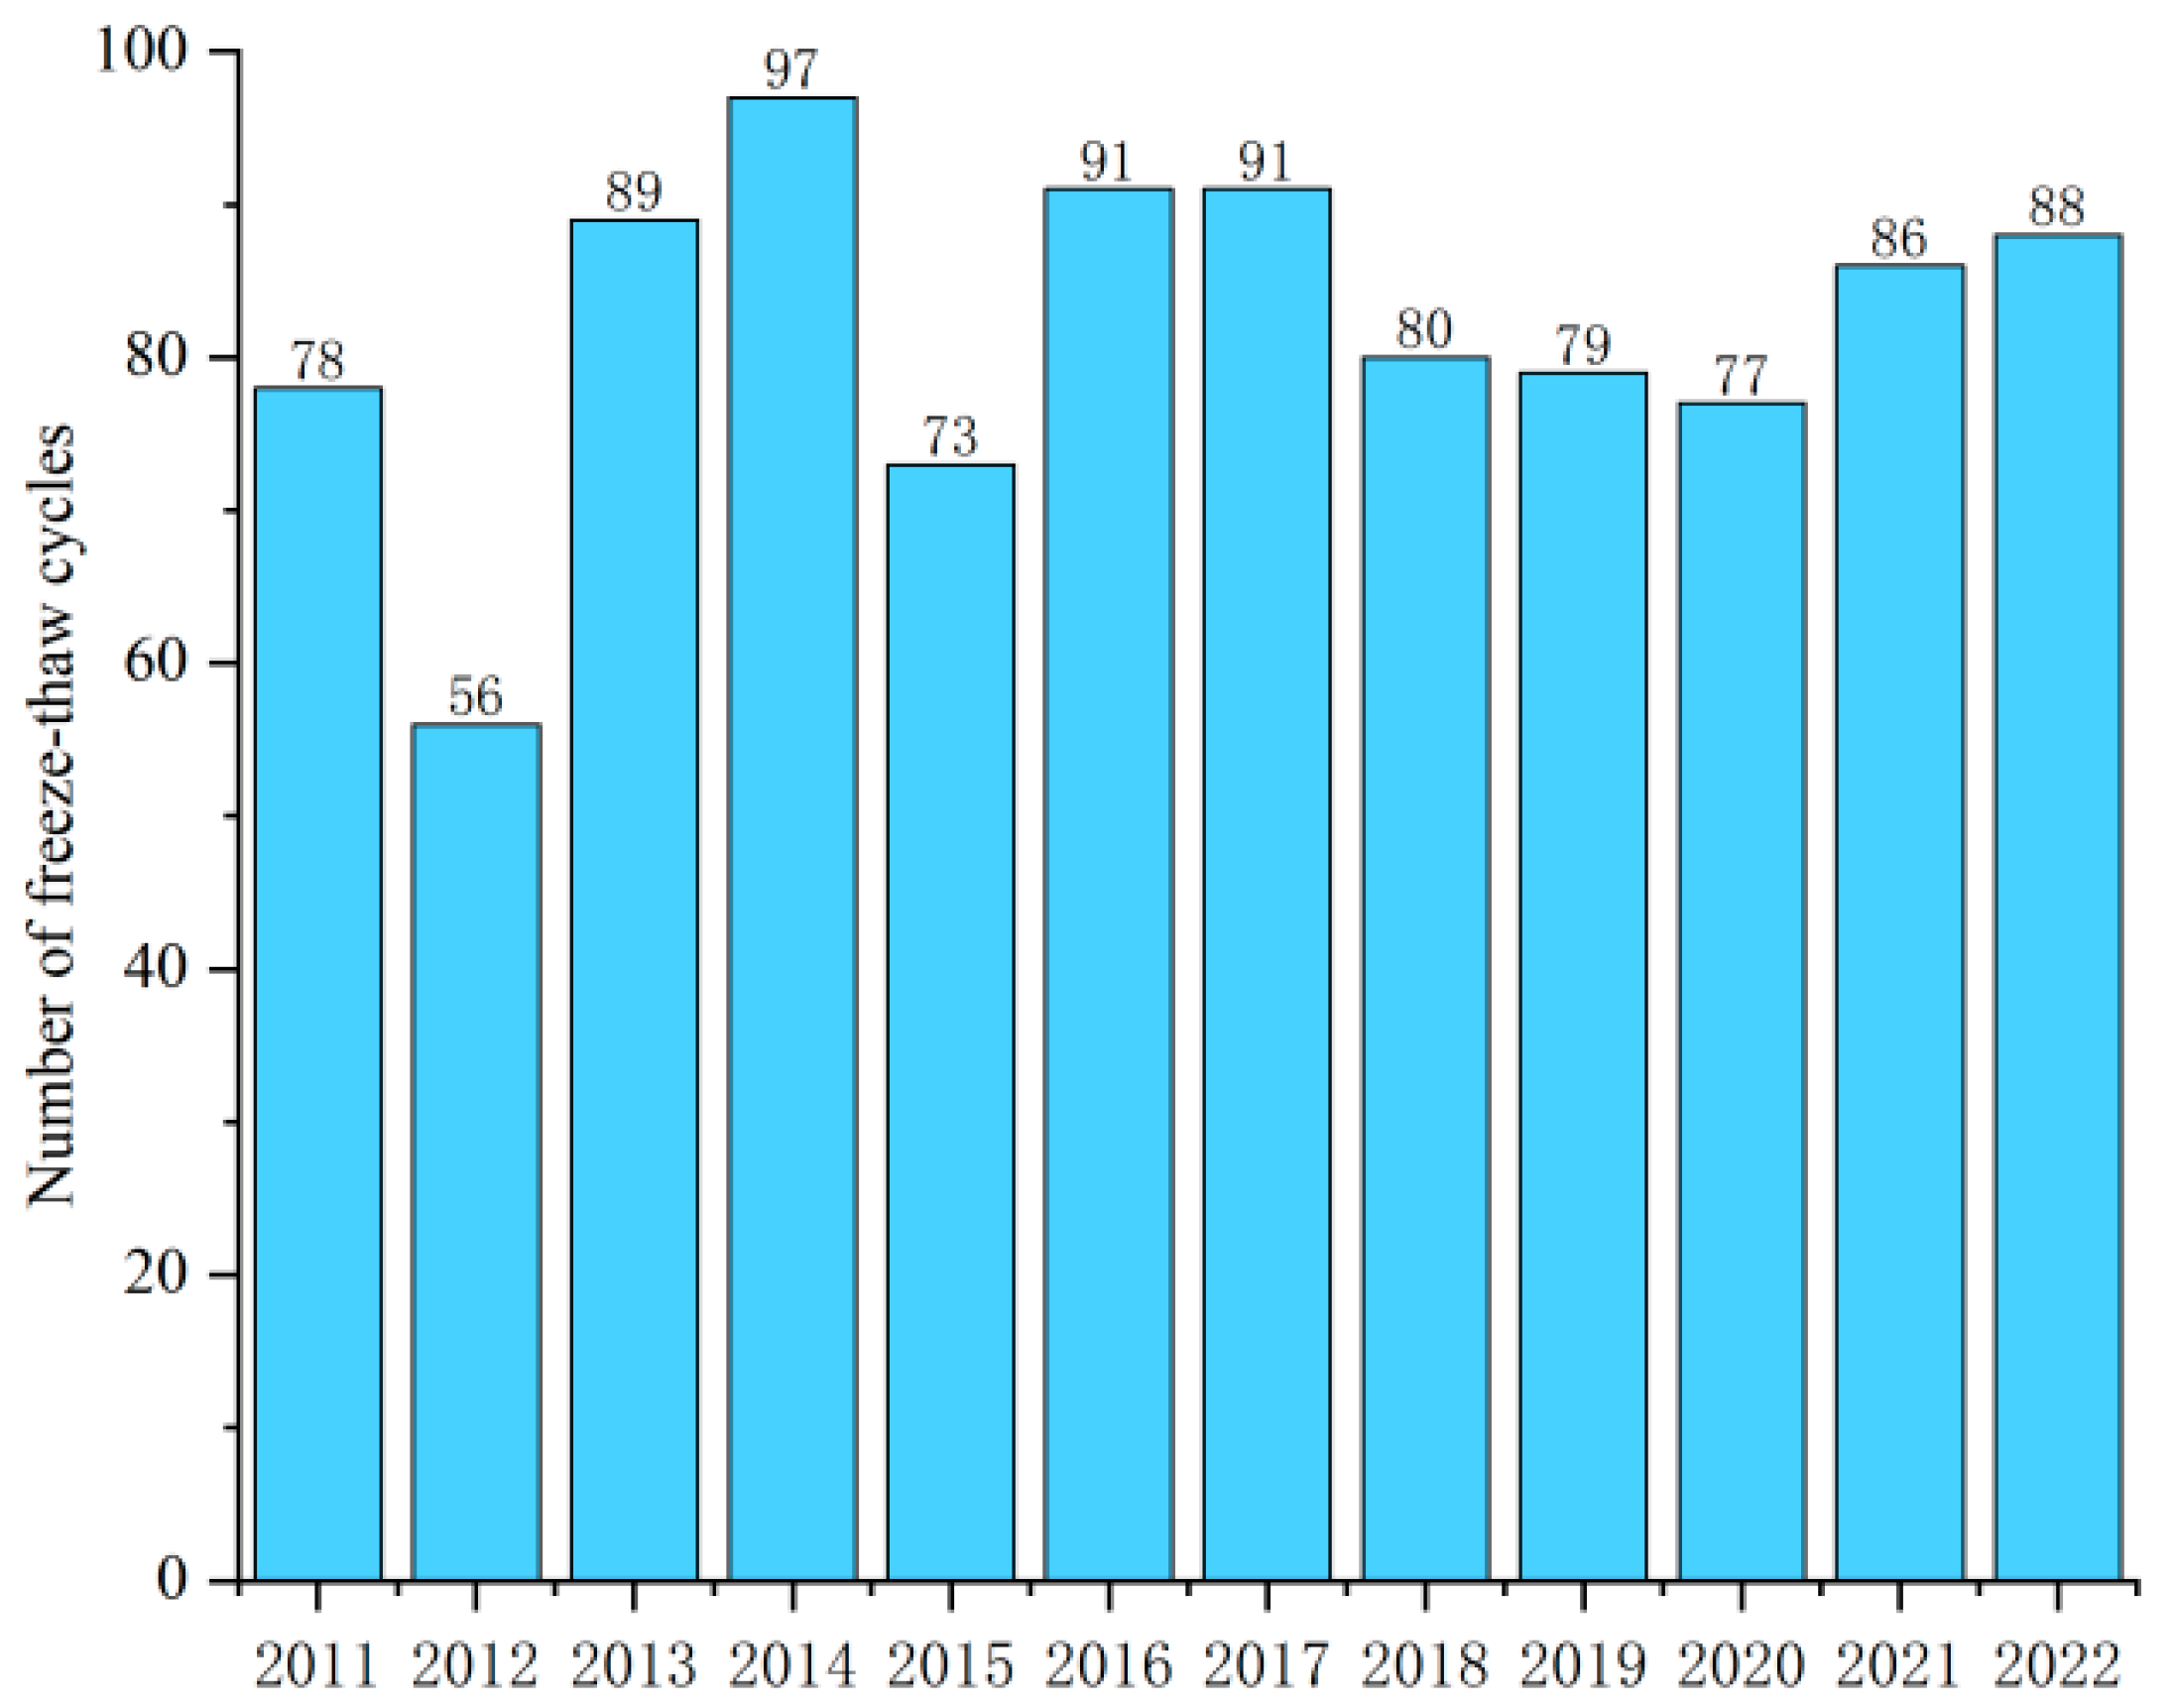
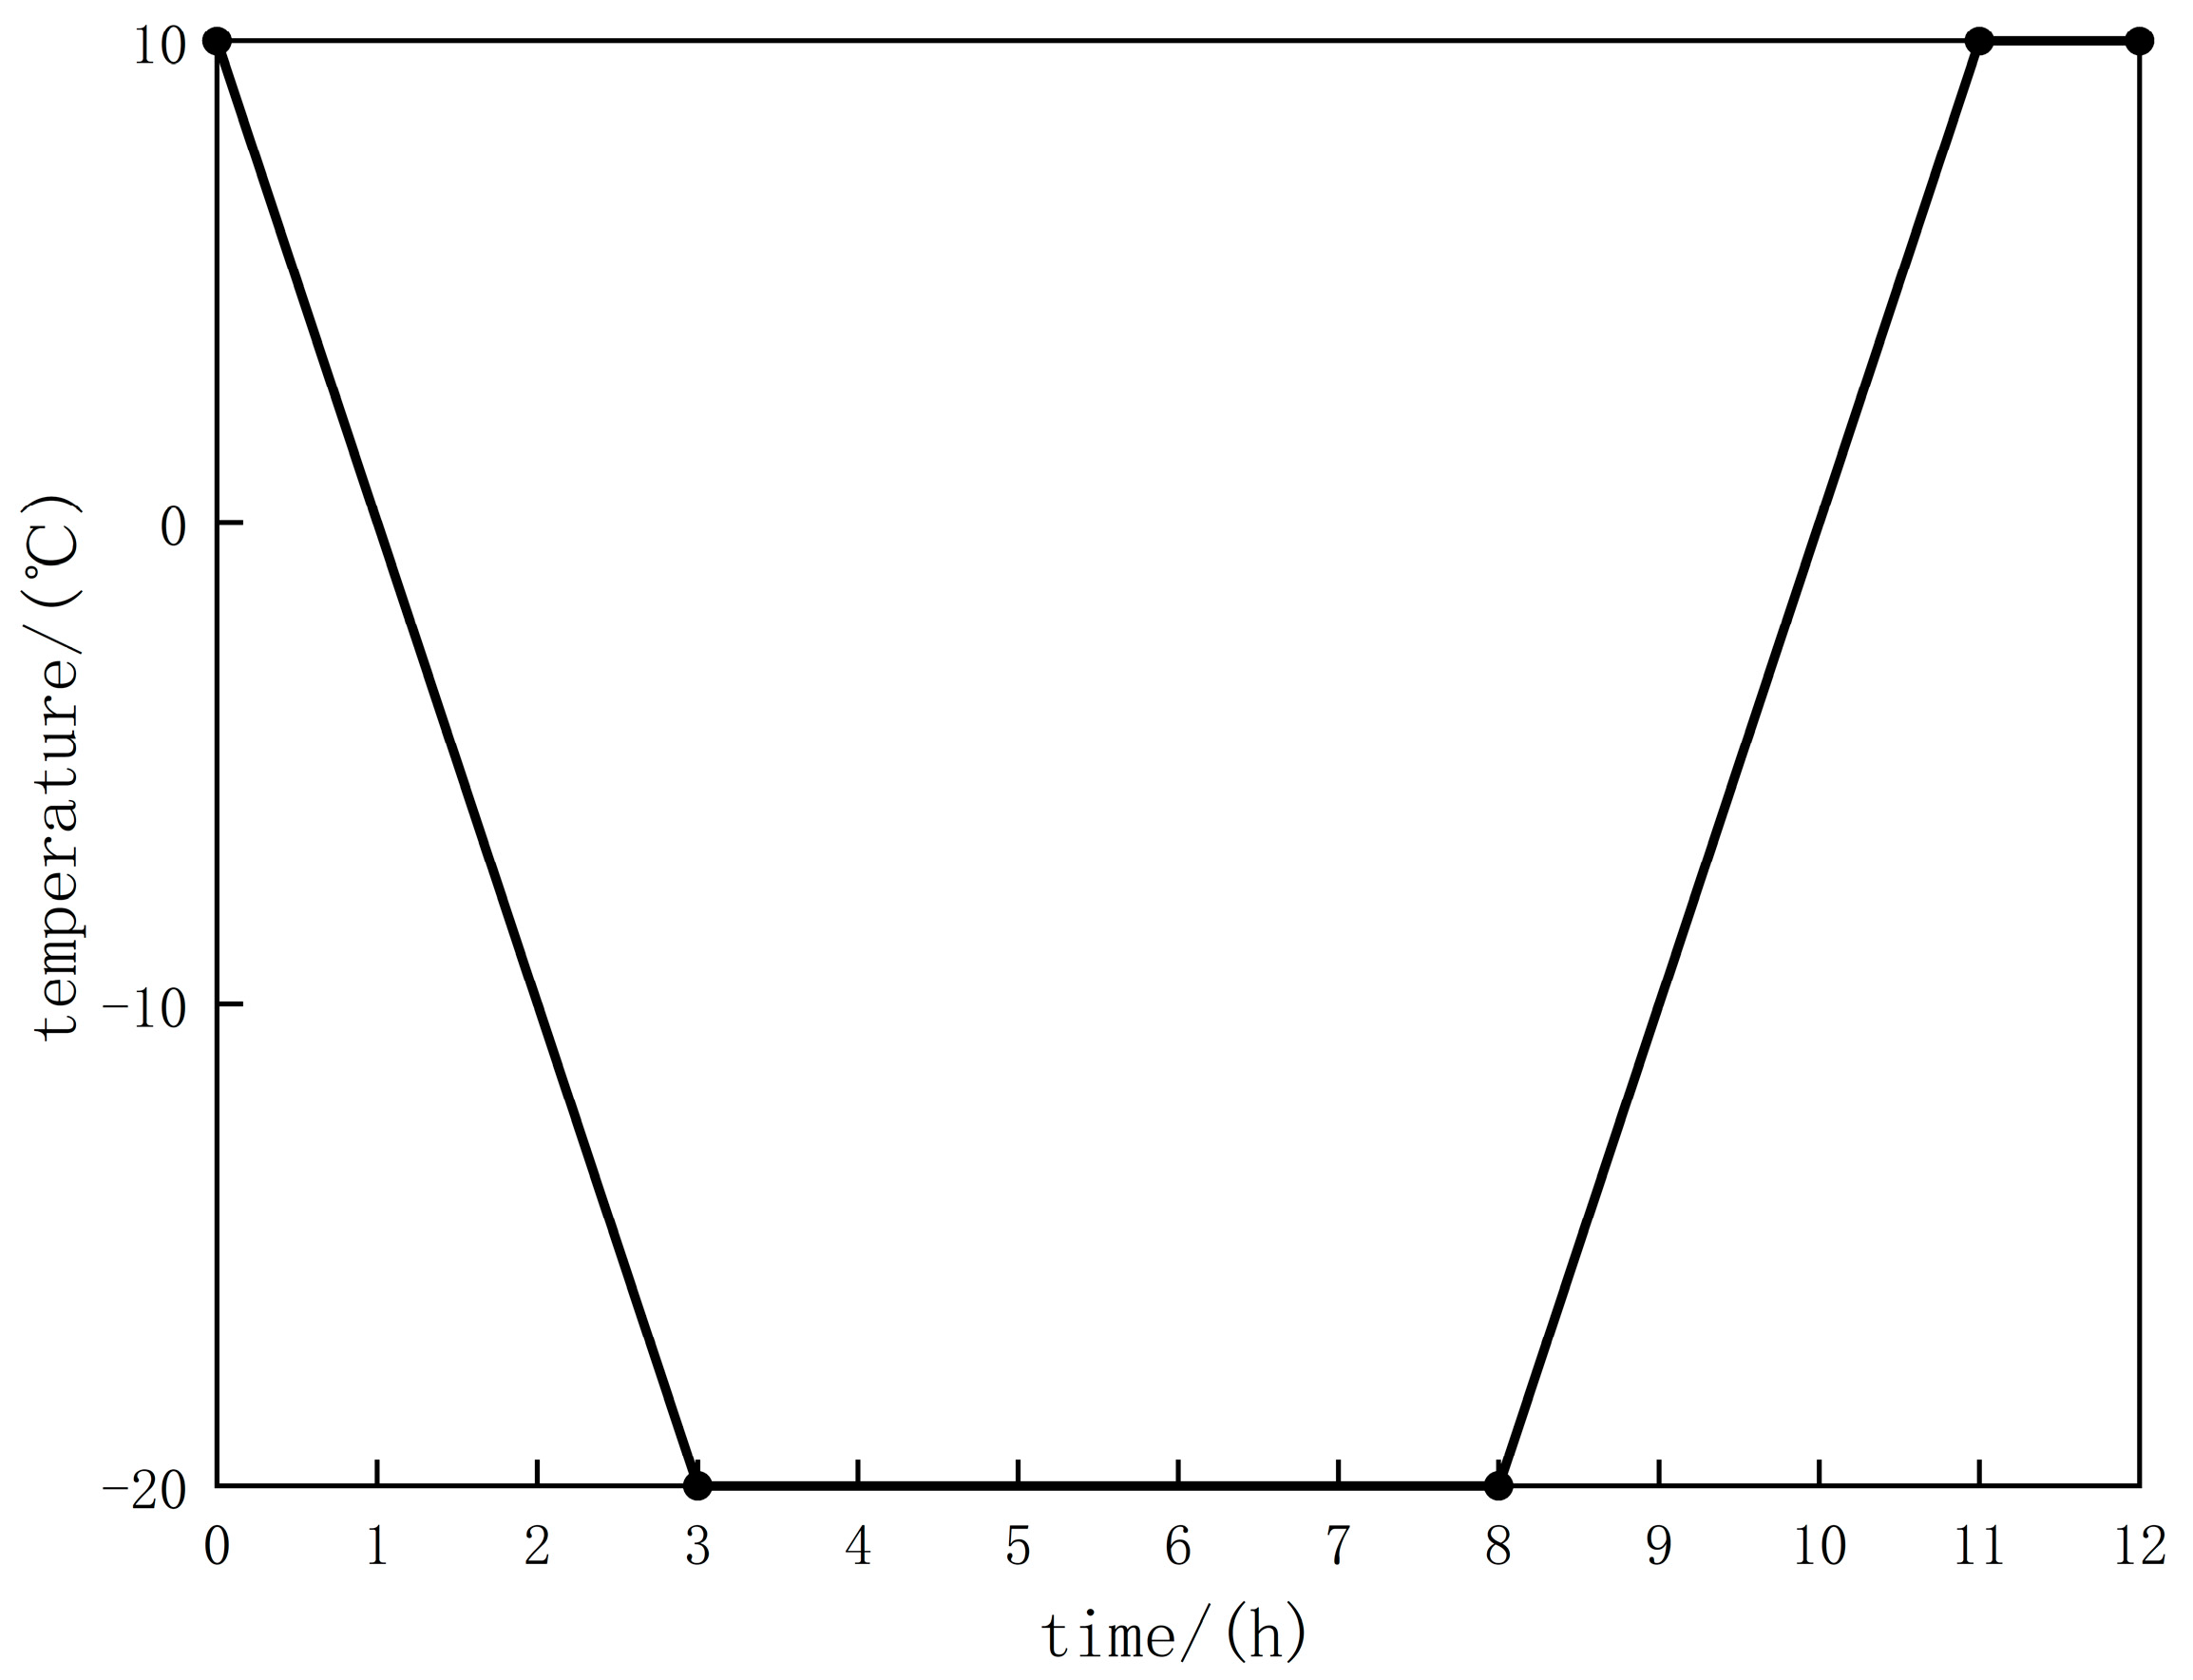
2.3.2. Temperature Conditions
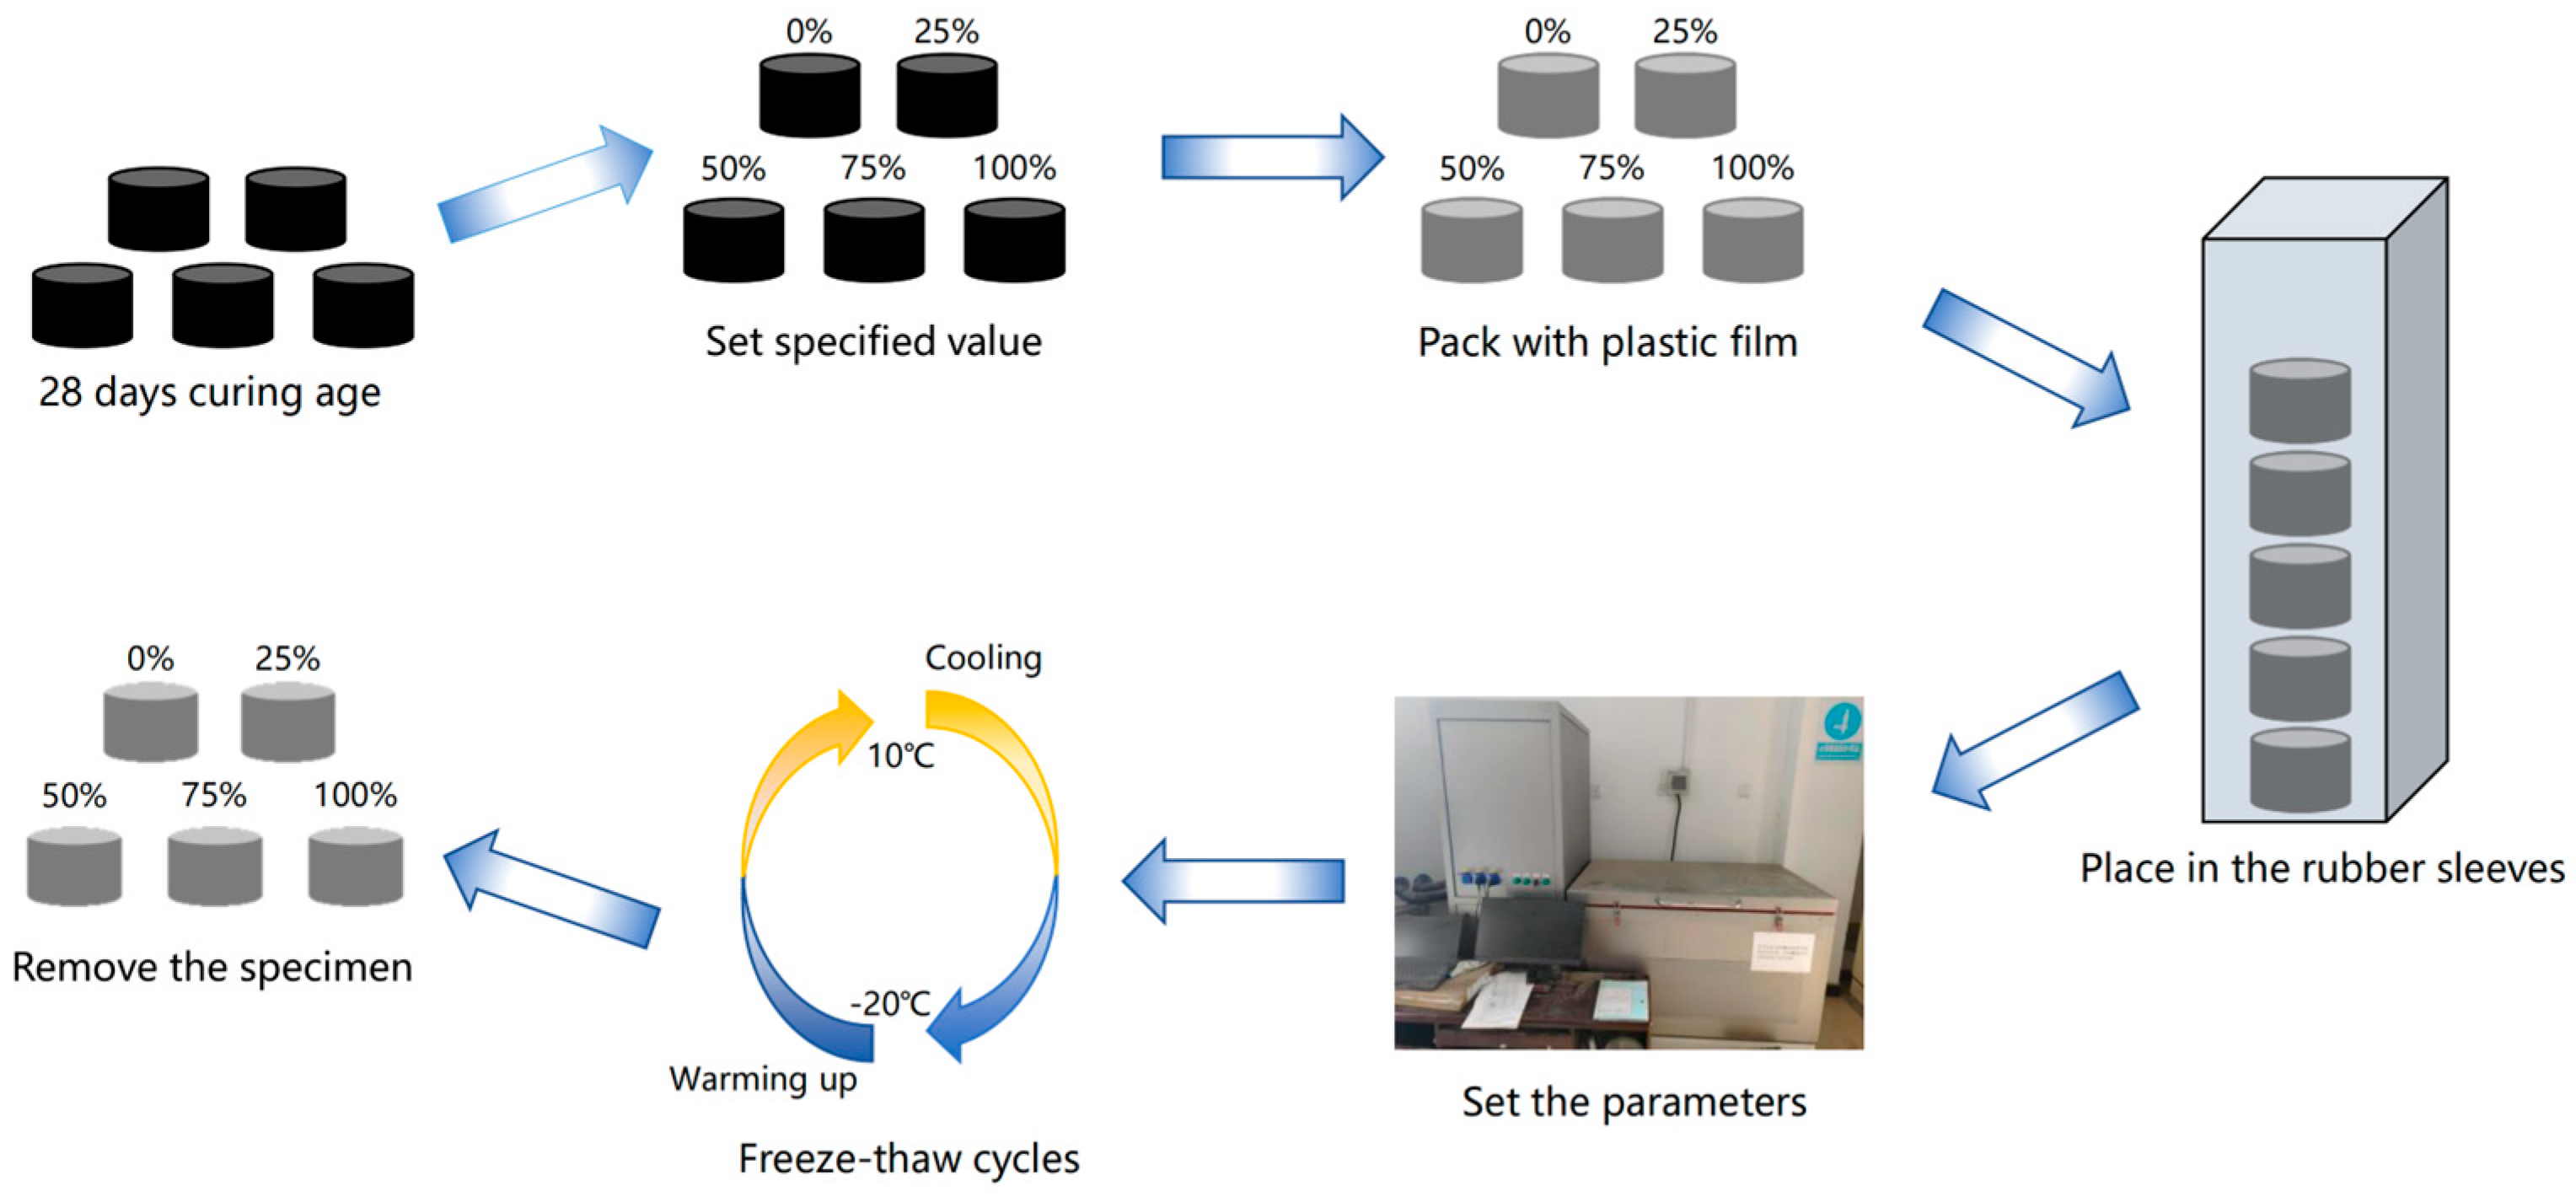
2.3.3. Freeze–Thaw Cycle Process
2.4. Design of Fatigue Test Under Humidity–Freeze–Thaw Coupling
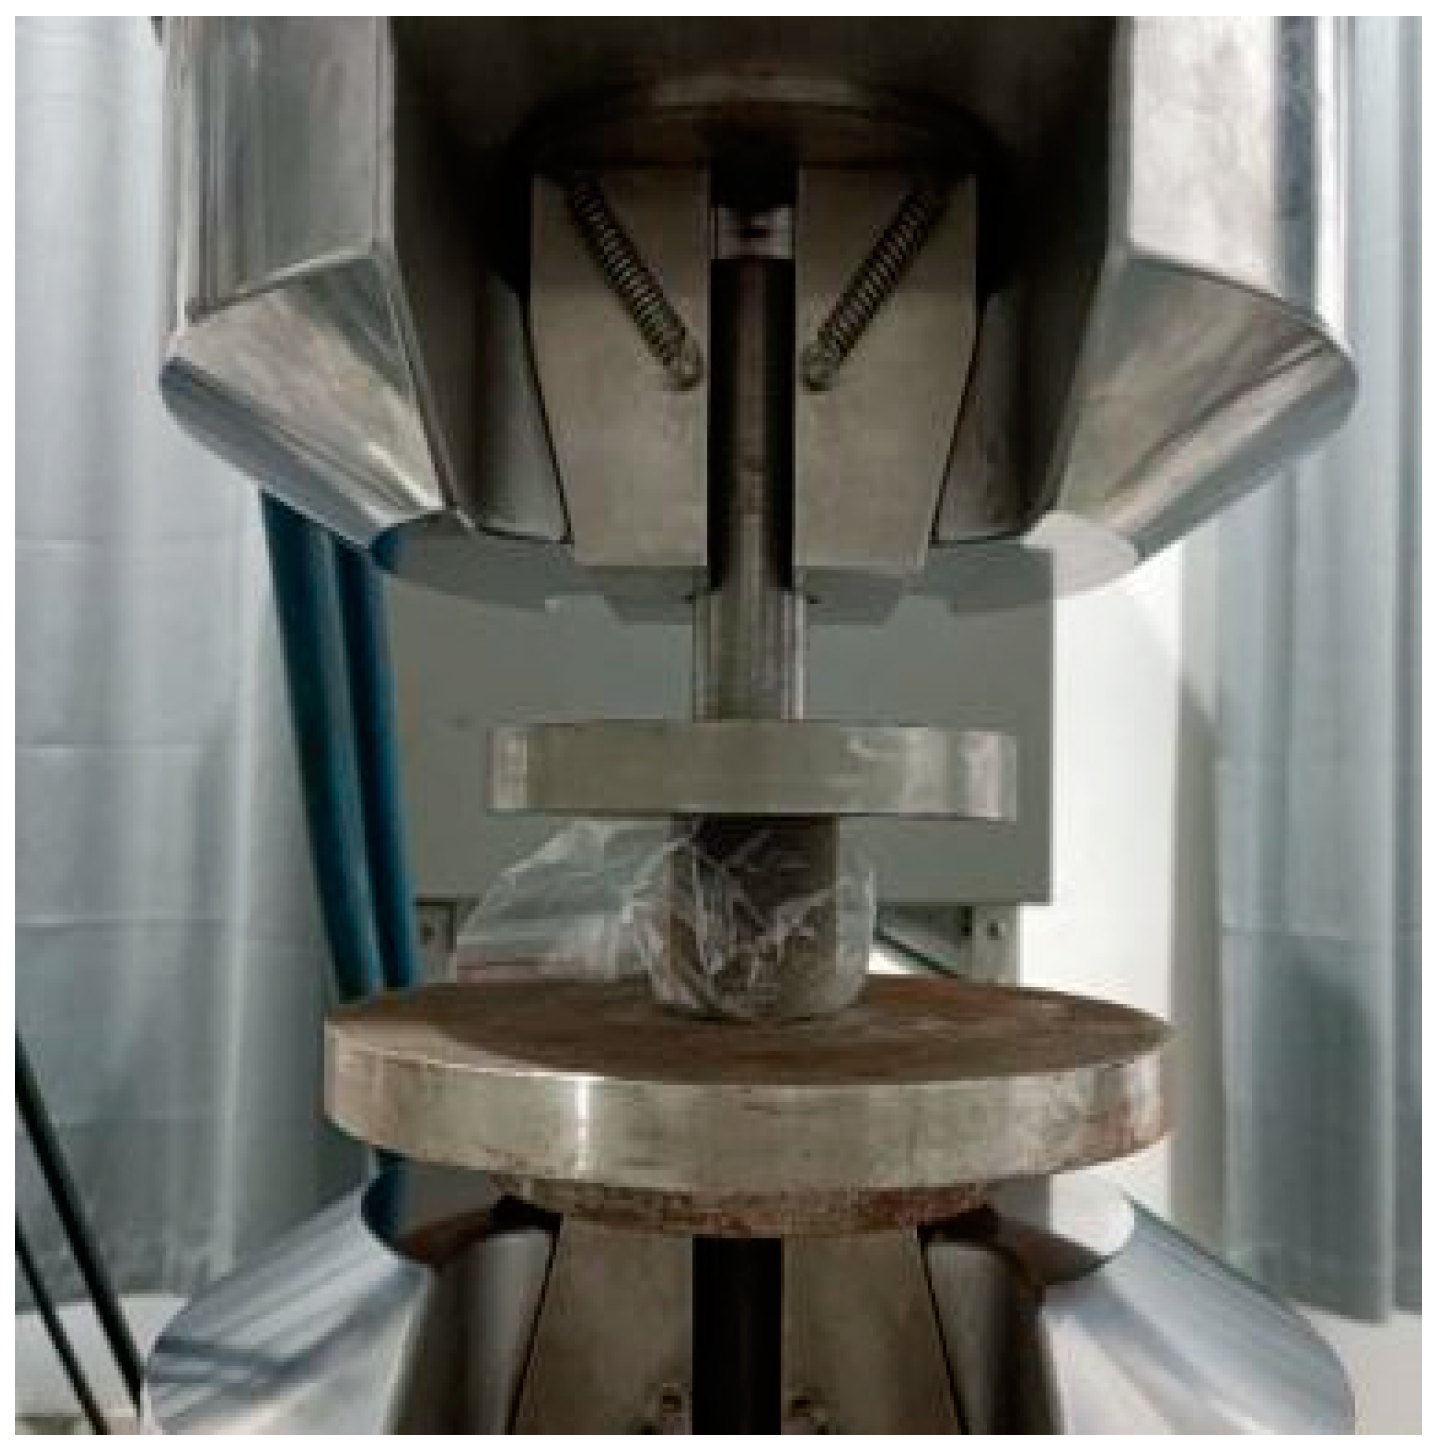
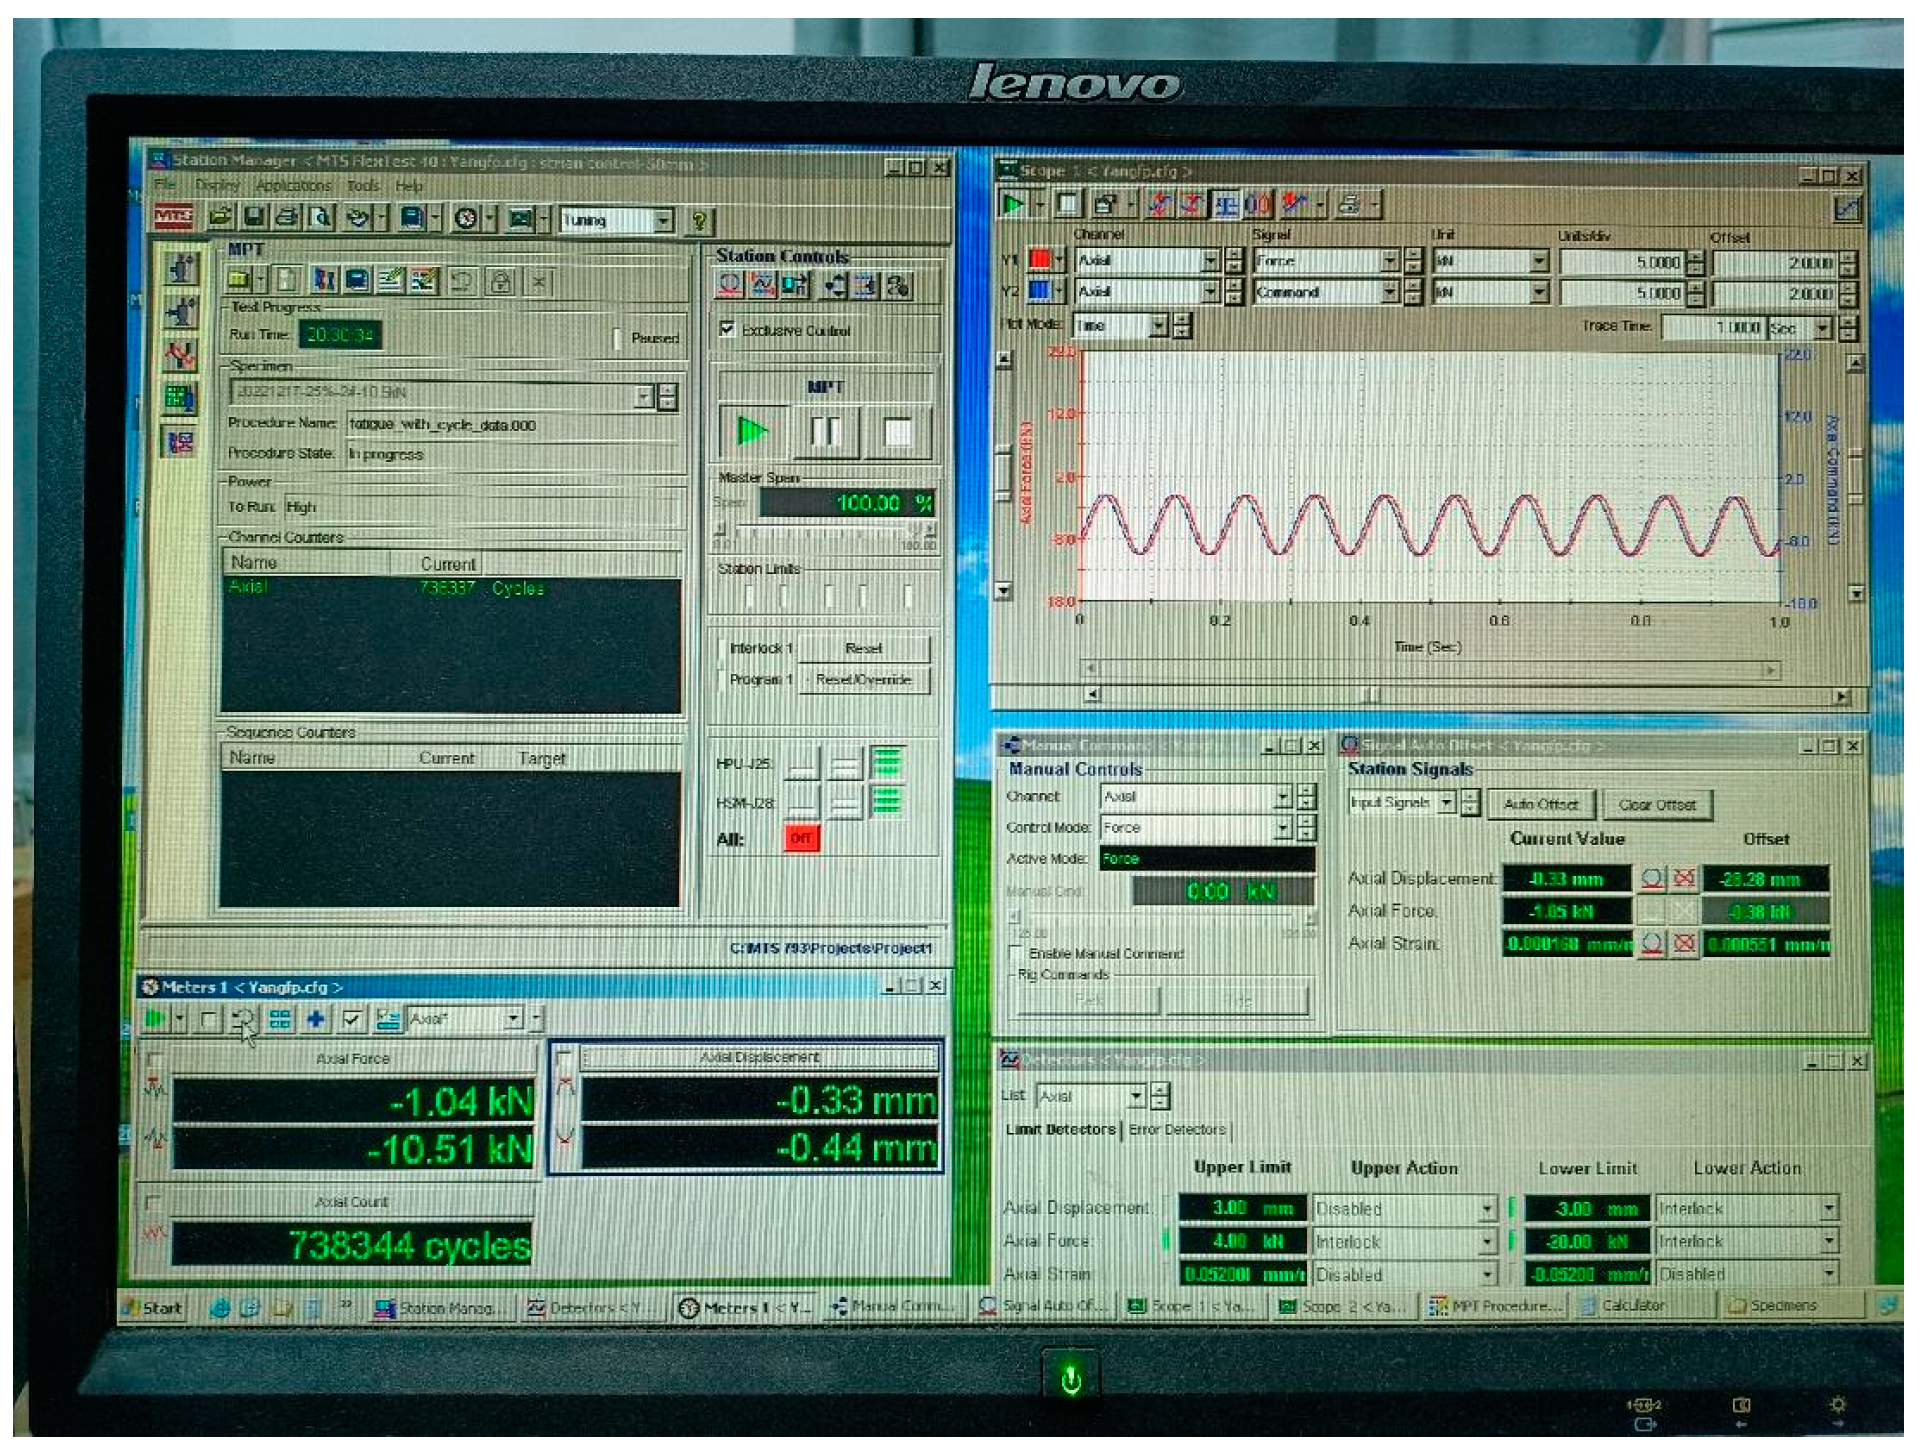
2.4.1. Fatigue Test Steps
2.4.2. Fatigue Stress Level
2.5. SEM Test Method
3. Results and Discussion
3.1. Mechanical Properties Under Humidity–Freeze–Thaw Coupling
3.2. Fatigue Life of CA Mortar Under Humidity–Freeze–Thaw Coupling
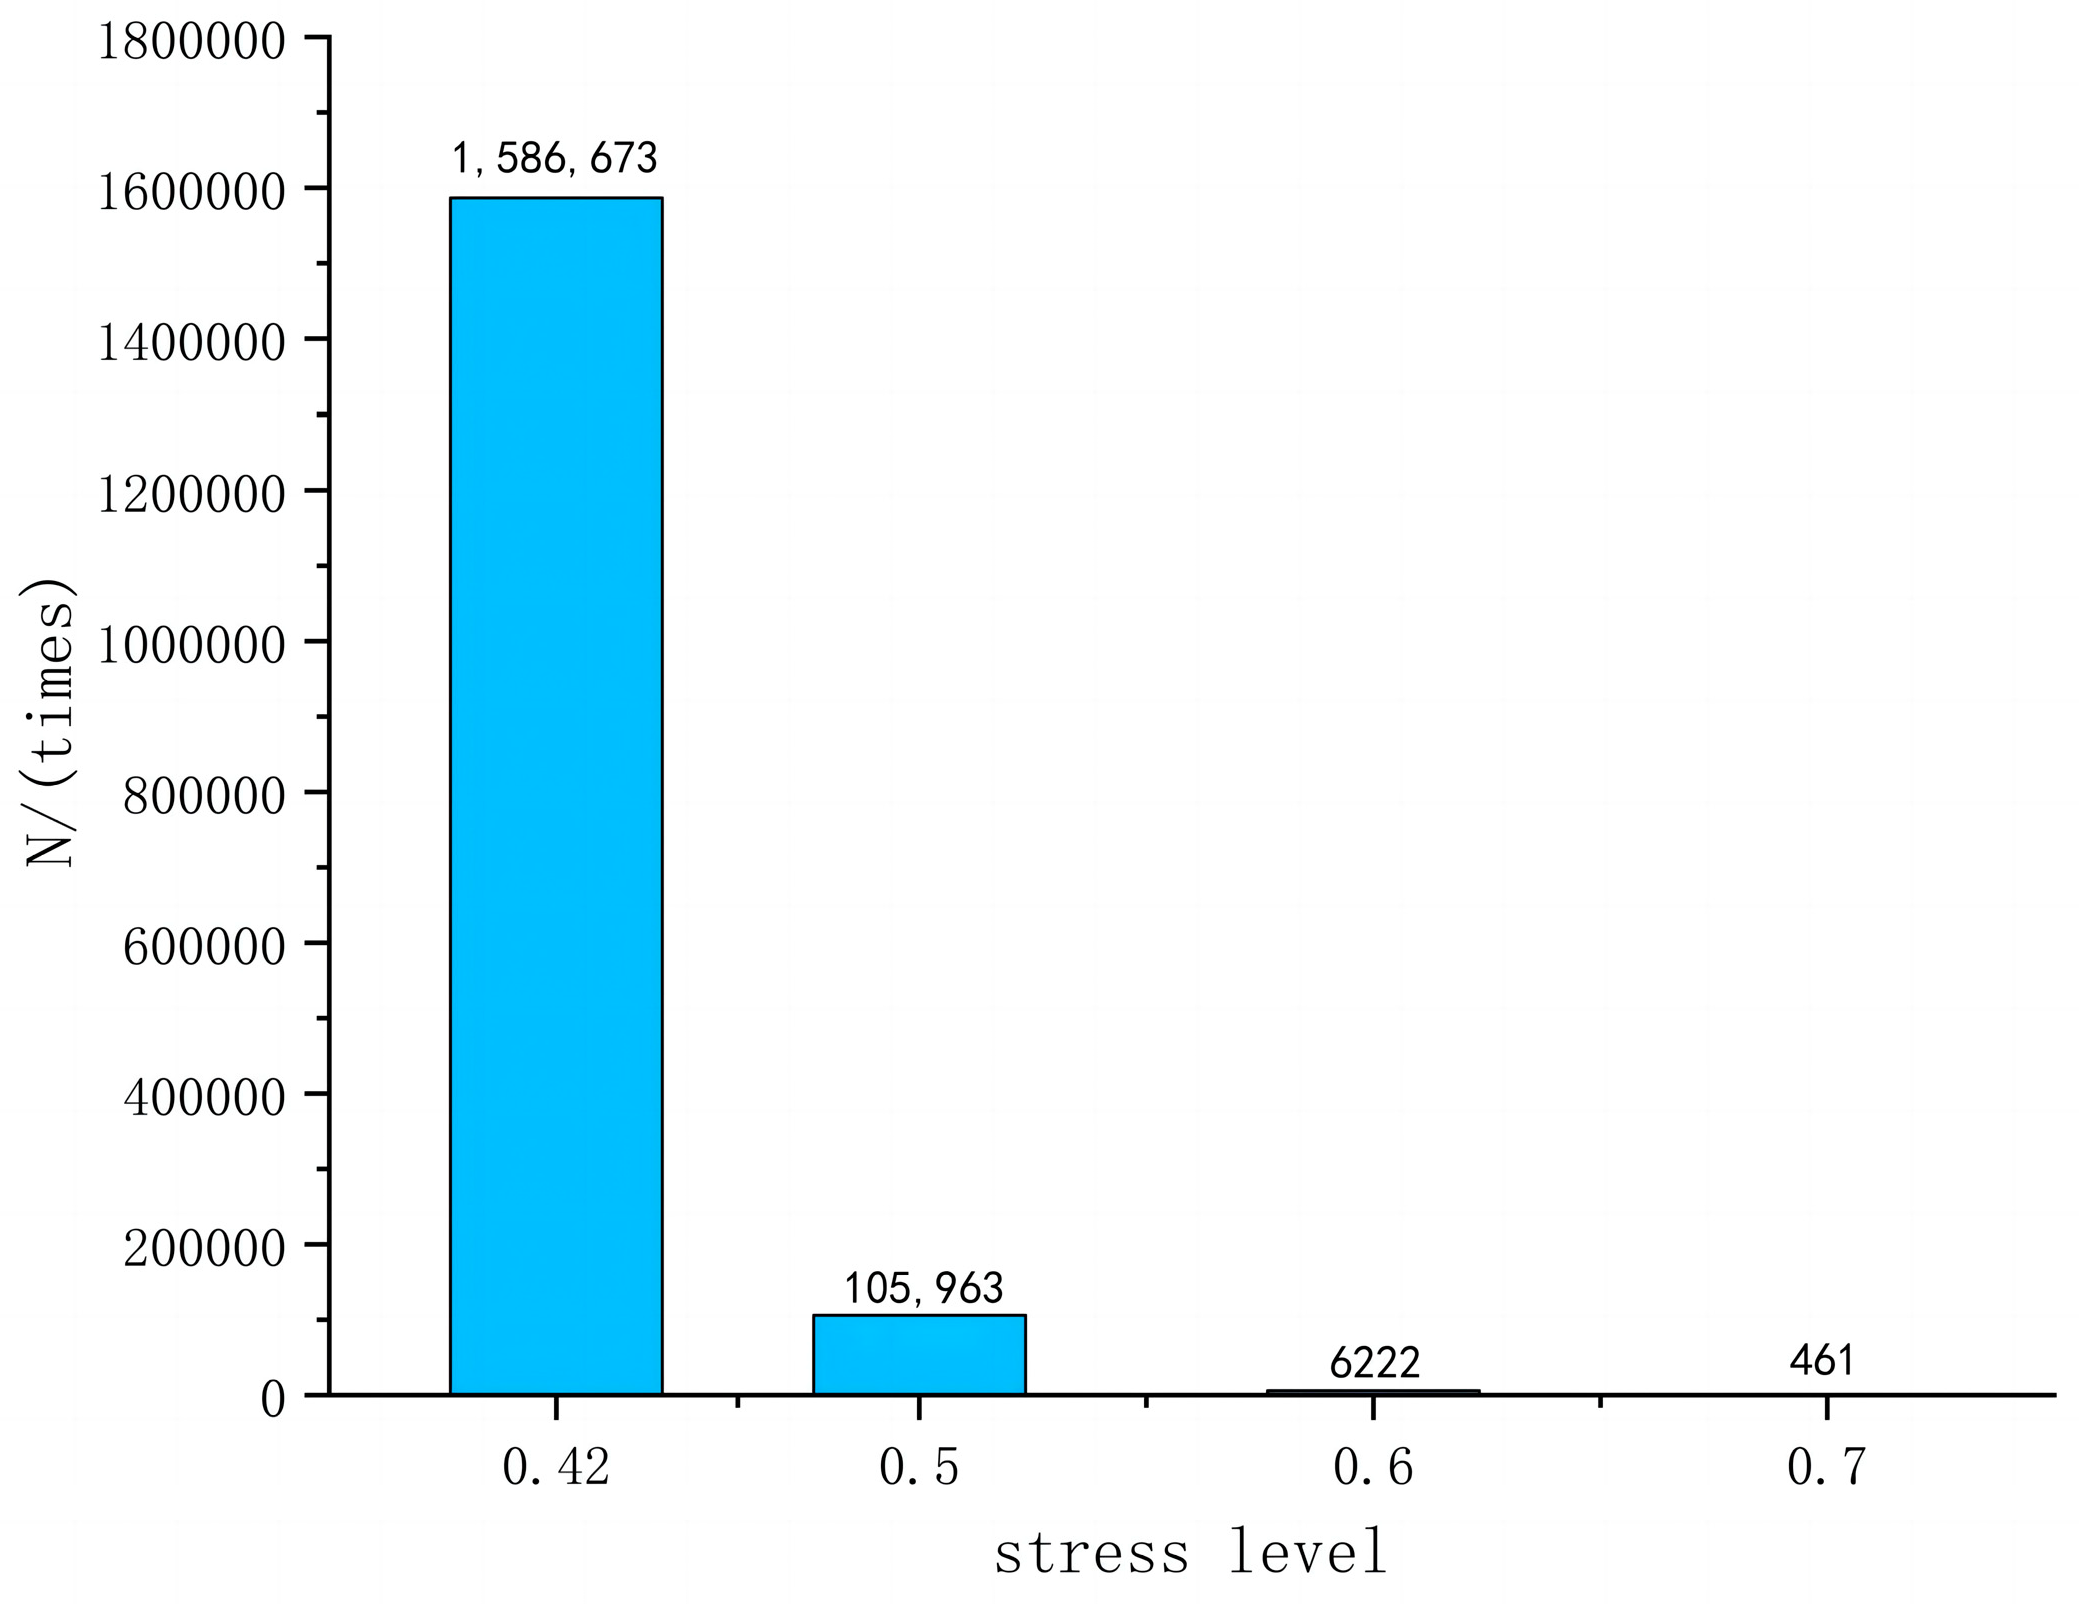
3.2.1. Fatigue Life Under the Same Fatigue Stress
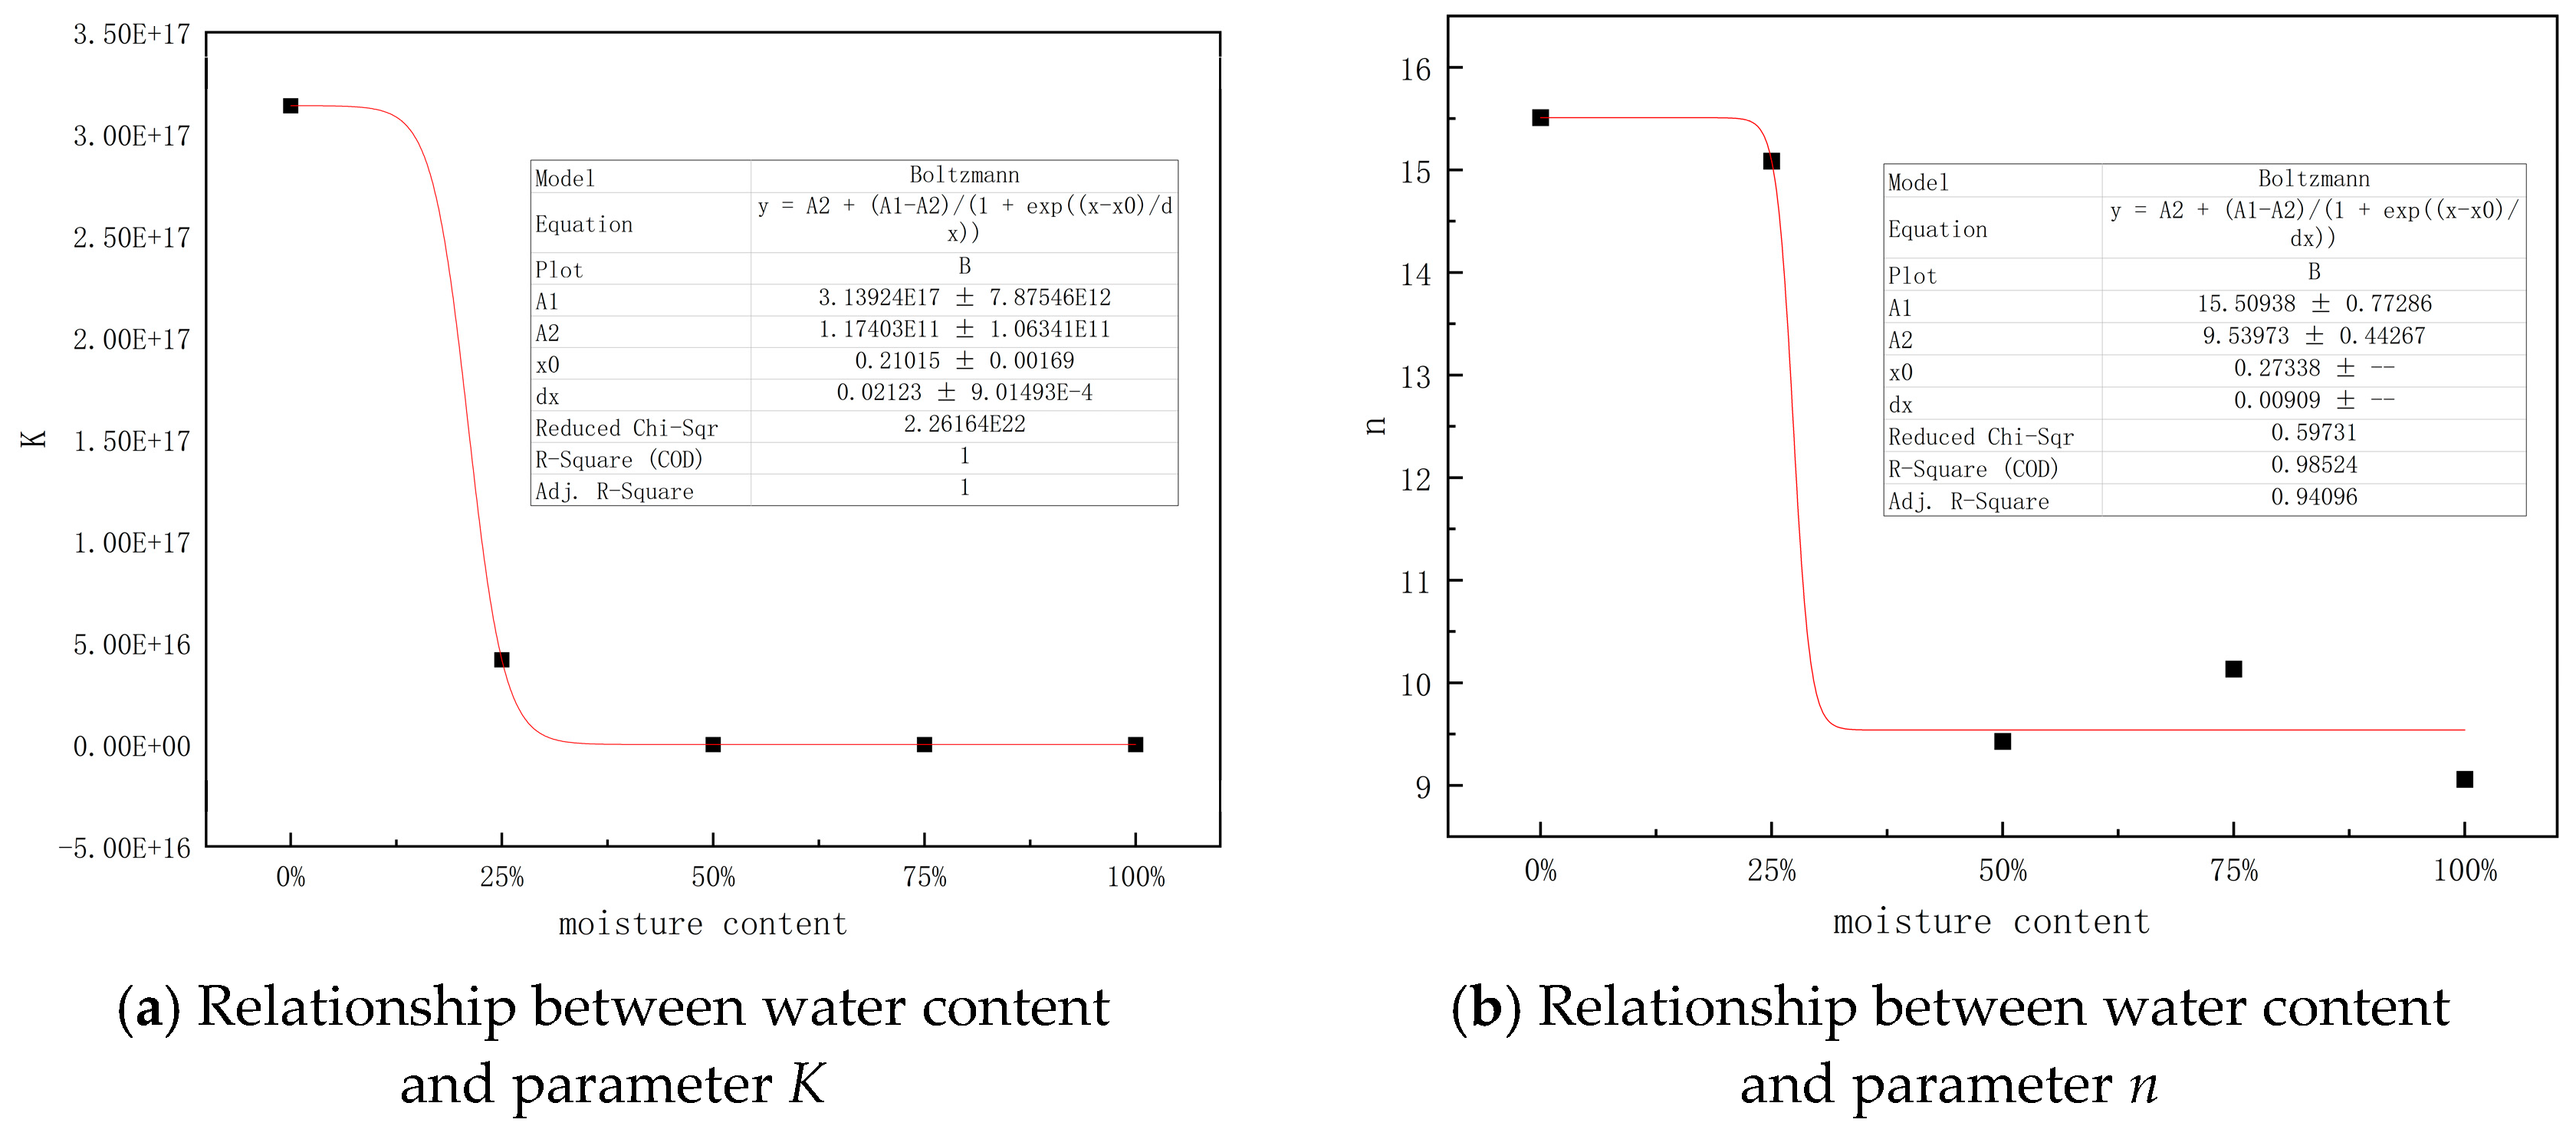
3.2.2. Influence of Moisture Content on Fatigue Life Under Humidity–Freeze–Thaw Coupling
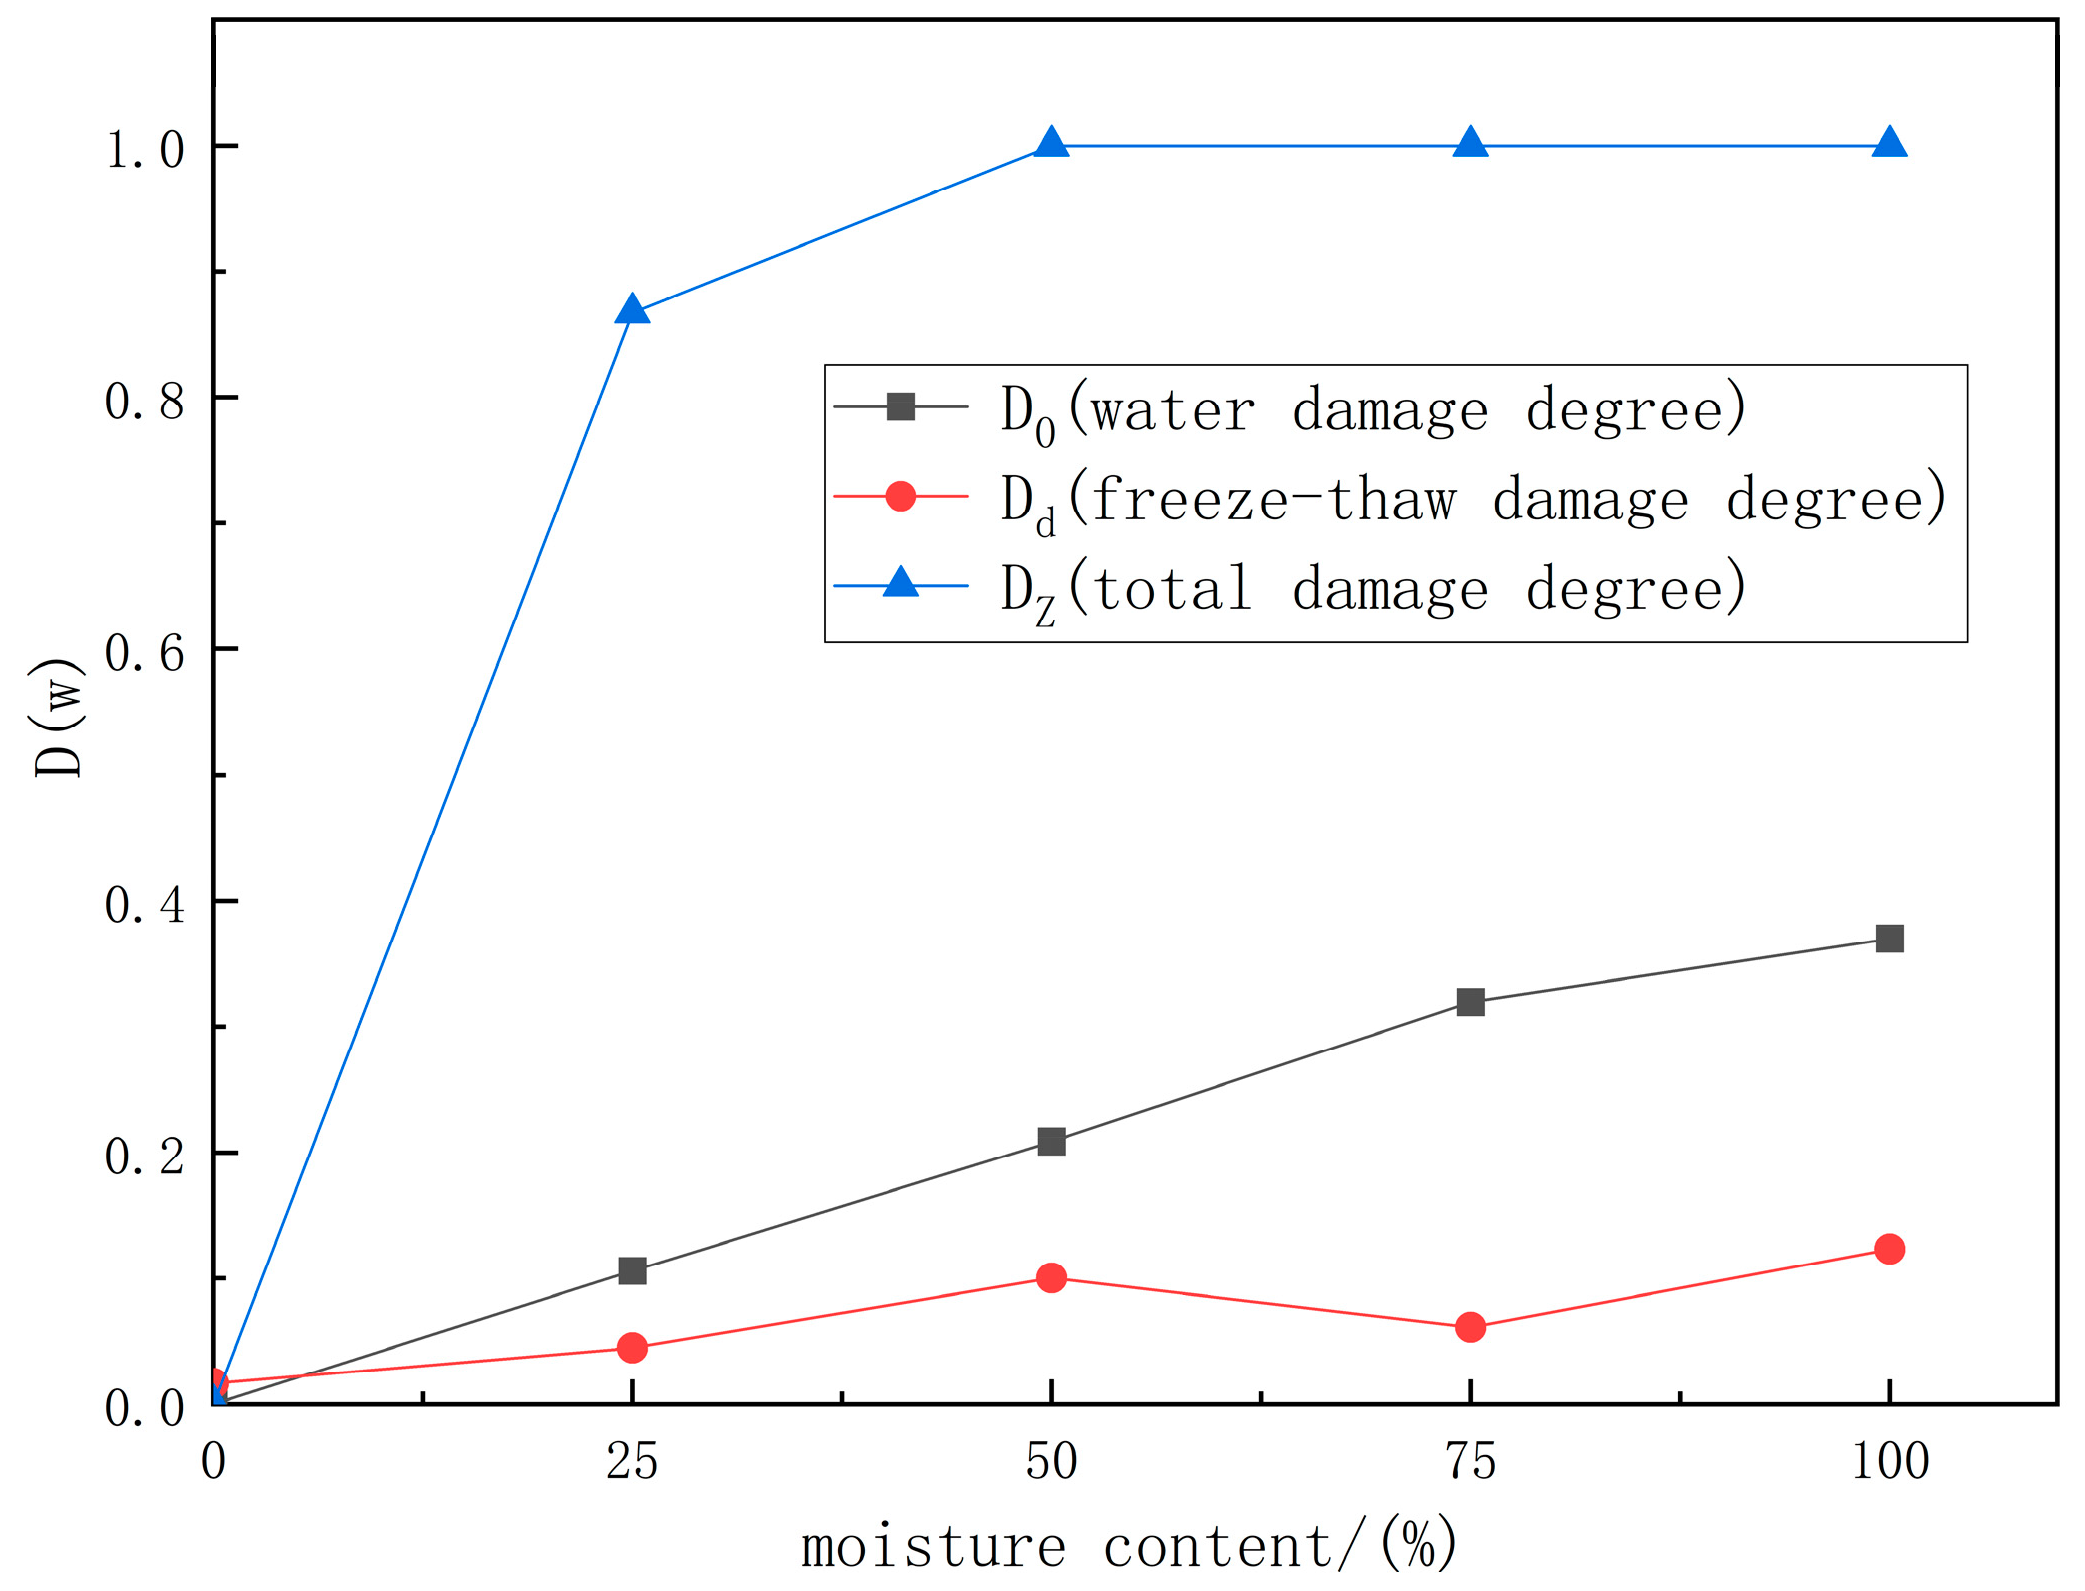
3.2.3. Influence of Moisture Content on Performance Damage Under Humidity–Freeze–Thaw Coupling
3.3. Fatigue Damage Mechanism of CA Mortar Under Humidity–Freeze–Thaw Coupling
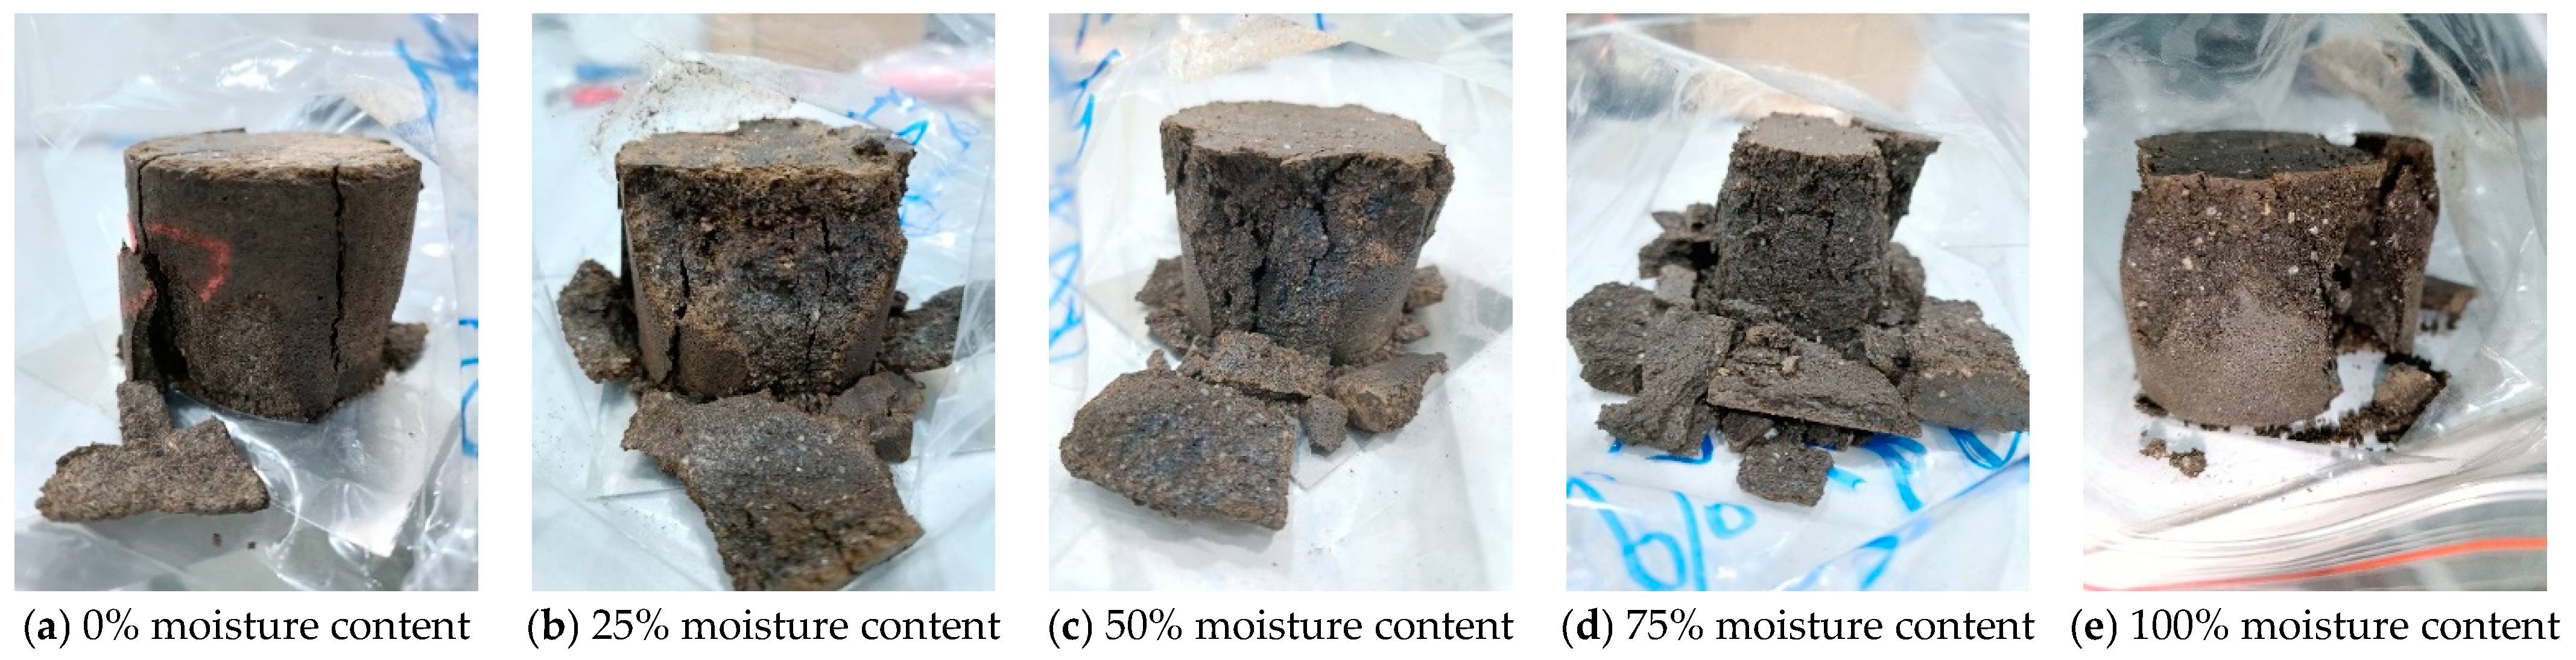
3.3.1. Macroscopic Damage
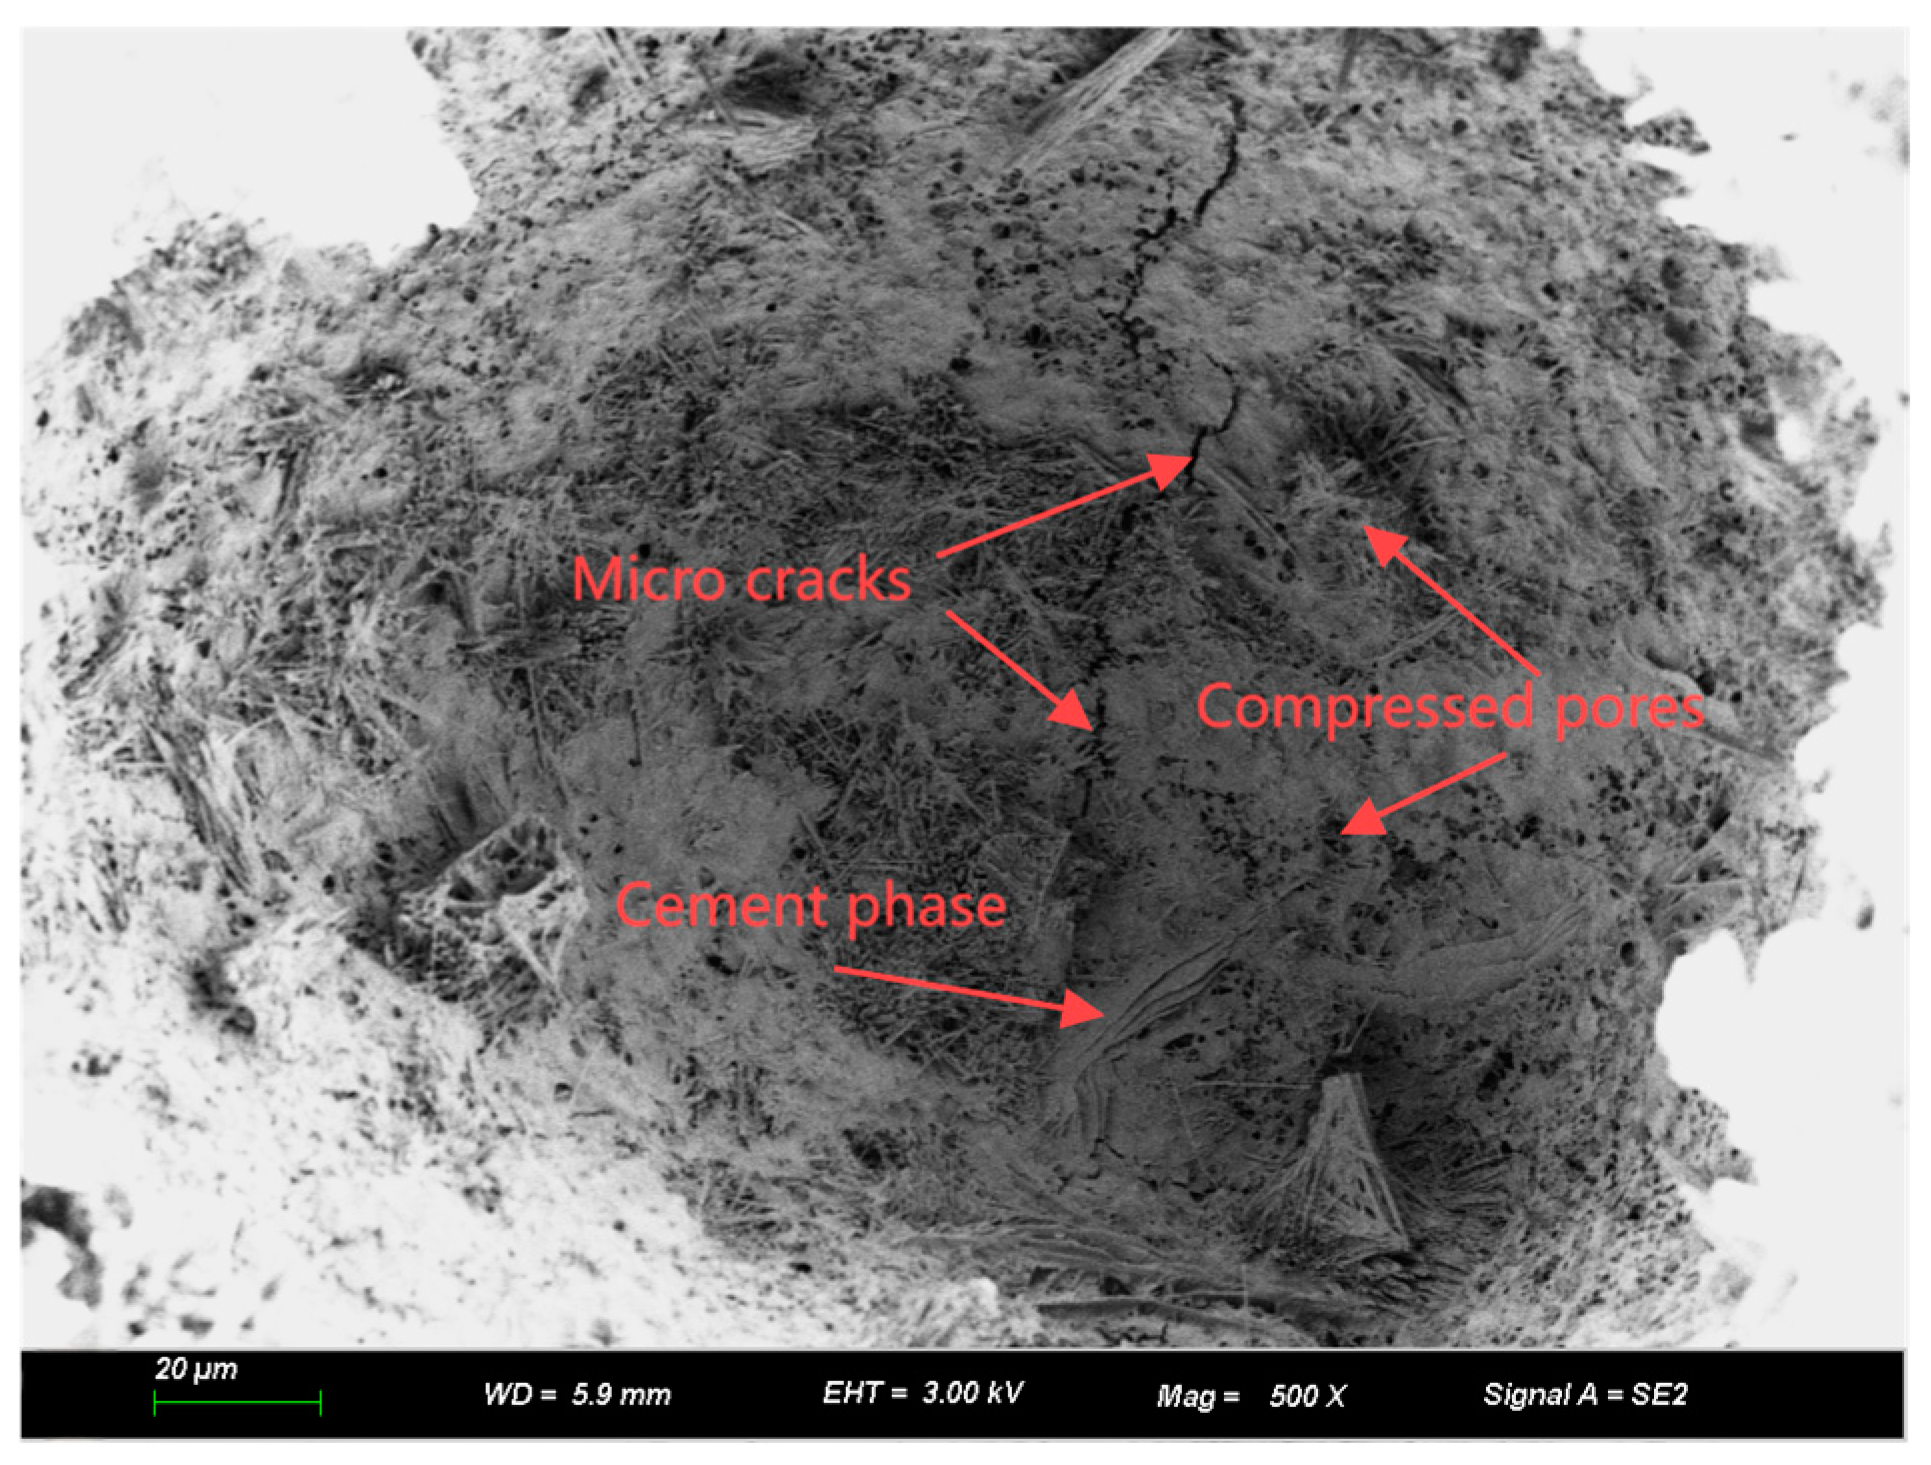
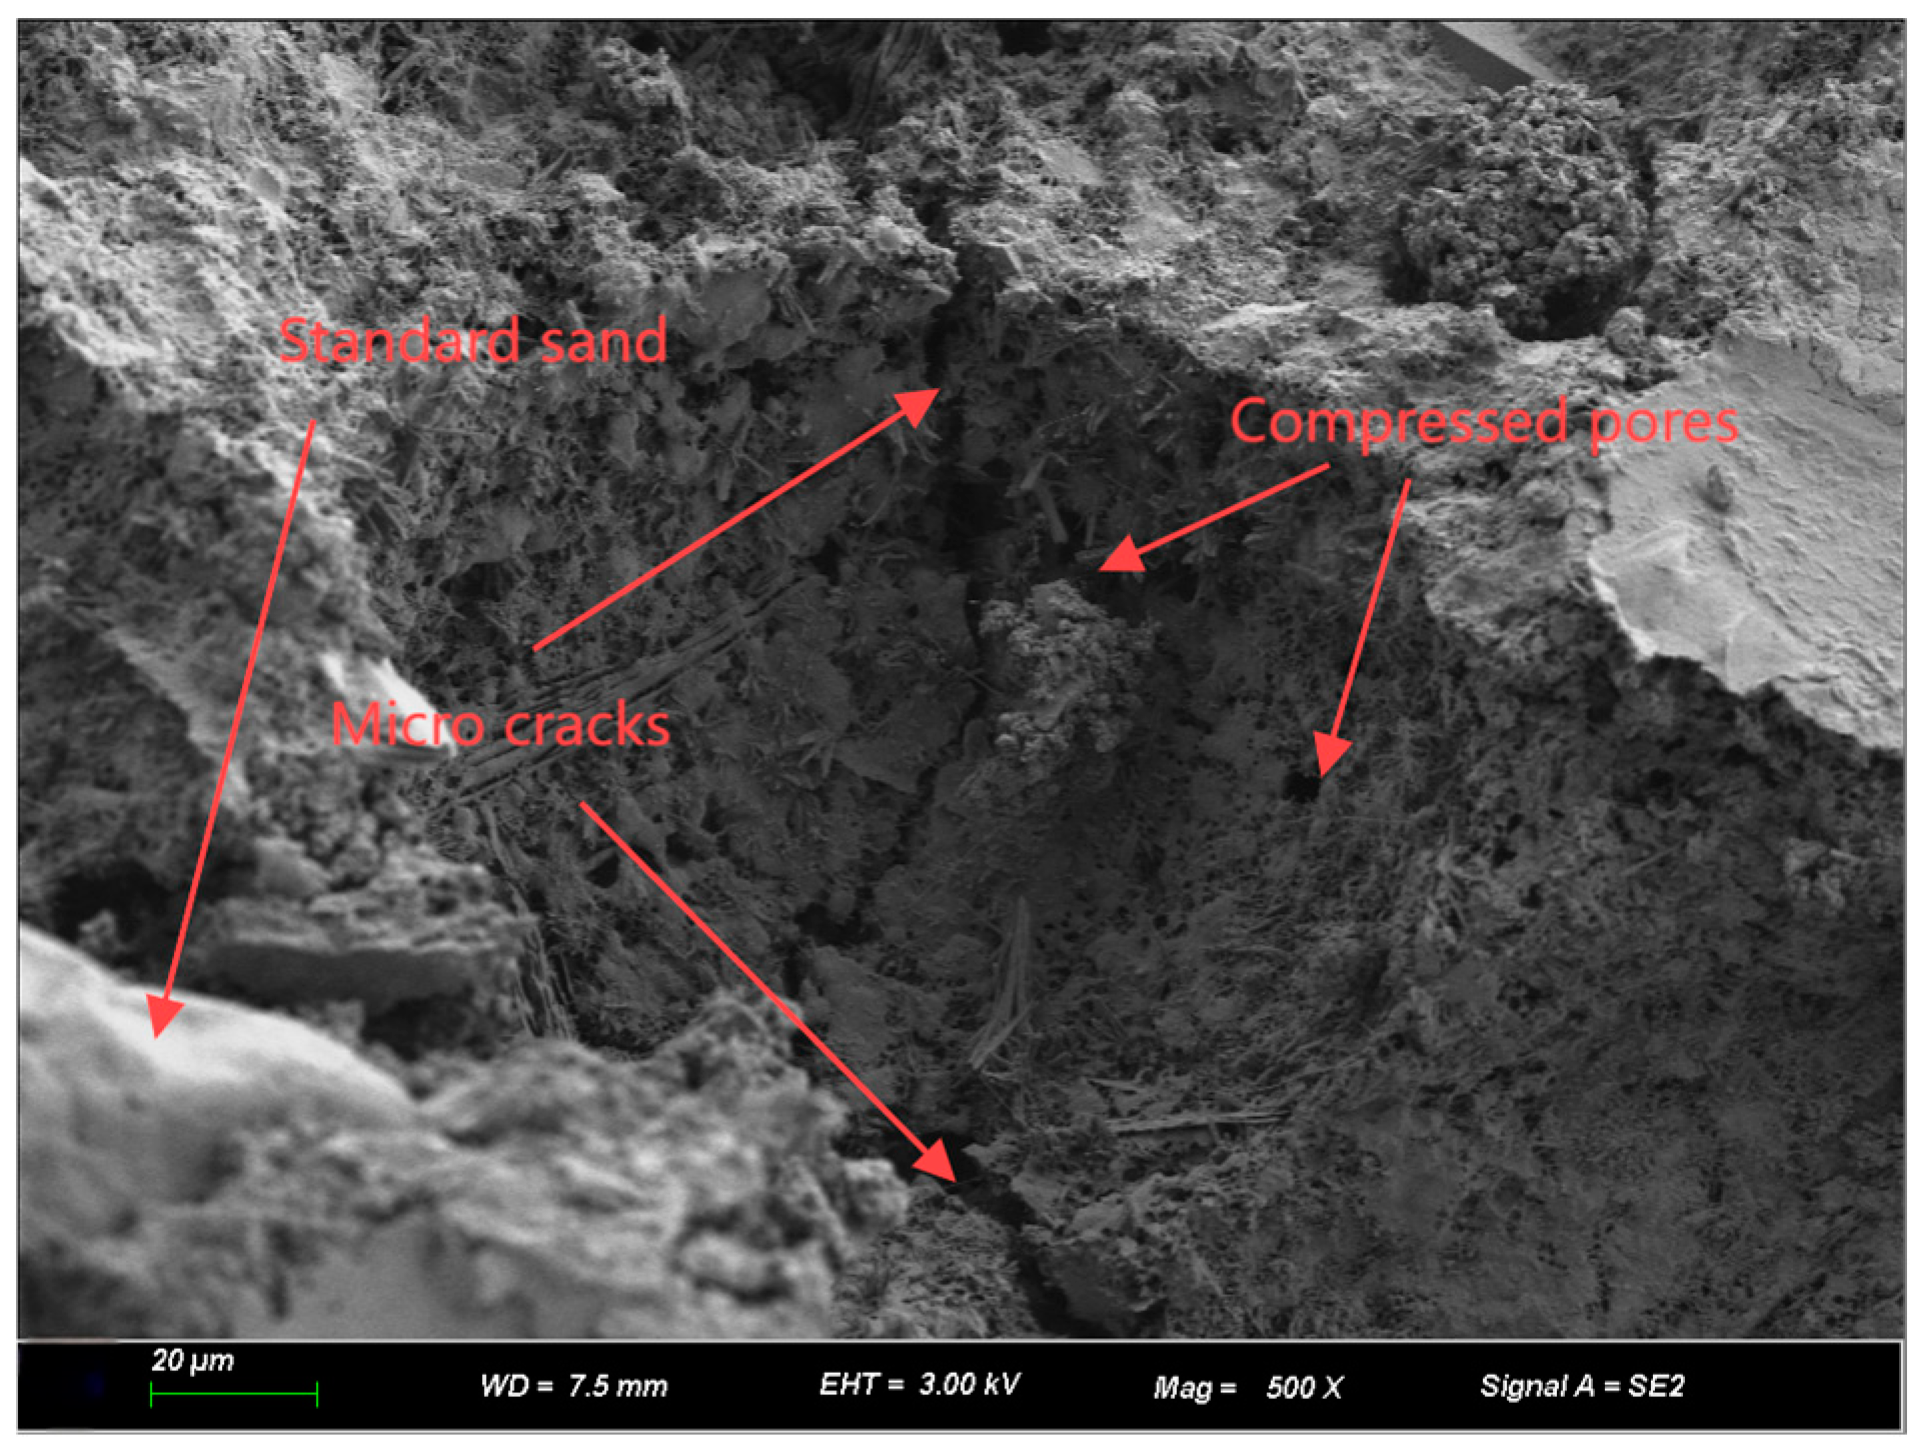
3.3.2. SEM Microstructure
4. Conclusions
Author Contributions
Funding
Institutional Review Board Statement
Informed Consent Statement
Data Availability Statement
Conflicts of Interest
References
- Yang, K.N.; Jin, S.S. Performance of Cement Emulsified Asphalt Mortar: A Review. Mater. Rep. 2021, 35, 145–149+157. (In Chinese) [Google Scholar]
- Wang, F.; Liu, Y. The Compatibility and Preparation of the Key Components for Cement and Asphalt Mortar in High-Speed Railway. In Reliability and Safety in Railway; IntechOpen: London, UK, 2012; pp. 223–262. [Google Scholar]
- Umar, H.A.; Zeng, X.; Lan, X.; Zhu, H.; Li, Y.; Zhao, H.; Liu, H. A Review on Cement Asphalt Emulsion Mortar Composites, Structural Development, and Performance. Materials 2021, 14, 3422. [Google Scholar] [CrossRef]
- Zeng, X.; Li, Y.; Ran, Y.; Yang, K.; Qu, F.; Wang, P. Deterioration mechanism of CA mortar due to simulated acid rain. Constr. Build. Mater. 2018, 168, 1008–1015. [Google Scholar] [CrossRef]
- Zeng, X.; Xie, Y.; Deng, D.; Wang, P.; Qu, F. A study of the dynamic mechanical properties of CRTS I type CA mortar. Constr. Build. Mater. 2016, 112, 93–99. [Google Scholar] [CrossRef]
- Liu, J.; Zheng, X.; Li, S.; Ding, R.; Zeng, Z.; Weng, Z.; Yang, D. Effect of the stabilizer on bubble stability and homogeneity of cement emulsified asphalt mortar in slab ballastless track. Constr. Build. Mater. 2015, 96, 135–146. [Google Scholar] [CrossRef]
- Yuan, Q.; Zheng, D.H.; Wang, Y. Cement asphalt mortar for high-speed rail. Chin. Sci. Bull. 2020, 65, 2384–2394. (In Chinese) [Google Scholar] [CrossRef]
- Wang, Q.; Yan, P.Y.; Kong, X.M.; Yang, J.B. Compressive strength development and microstructure of cement-asphalt mortar. J. Wuhan Univ. Technol.-Mater. Sci. Ed. 2011, 26, 998–1003. [Google Scholar] [CrossRef]
- Wang, Z.J.; Shu, X.; Rutherford, T.; Huang, B.S.; Clarke, D. Effects of asphalt emulsion on properties of fresh cement emulsified asphalt mortar. Constr. Build. Mater. 2015, 75, 25–30. [Google Scholar] [CrossRef]
- Wang, Q.; Yan, P.Y.; Yang, J.B.; Kong, X.M. Strength mechanism of cement-asphalt mortar. J. Mater. Civ. Eng. 2011, 23, 1353–1359. [Google Scholar]
- Rutherford, T.; Wang, Z.J.; Shu, X.; Huang, B.S.; Clarke, D. Laboratory investigation into mechanical properties of cement emulsified asphalt mortar. Constr. Build. Mater. 2014, 65, 76–83. [Google Scholar] [CrossRef]
- Liu, B.J.; Liang, D. Effect of mass ratio of asphalt to cement on the properties of cement modified asphalt emulsion mortar. Constr. Build. Mater. 2017, 134, 39–43. [Google Scholar] [CrossRef]
- Leiben, Z.S.; Wang, X.F.; Wang, Z.J.; Yang, B.; Tian, Y.Y.; He, R. Damping characteristics of cement asphalt emulsion mortars. Constr. Build. Mater. 2018, 173, 201–208. [Google Scholar] [CrossRef]
- Fang, L.; Yuan, Q.; Deng, D.H.; Pan, Y.R.; Wang, Y. Effect of Mix Parameters on the Dynamic Mechanical Properties of Cement Asphalt Mortar. J. Mater. Civ. Eng. 2017, 29, 1–9. [Google Scholar] [CrossRef]
- Tian, Q.; Yuan, Q.; Fang, L.; Wang, Y.; Liu, Z.Q.; Deng, D.H. Estimation of elastic modulus of cement asphalt binder with high content of asphalt. Constr. Build. Mater. 2017, 133, 98–106. [Google Scholar] [CrossRef]
- Zhao, C.; Jiao, H.C.; Zhou, B.; Liu, F.; Zhang, F.L.; Luo, Y.; Yuan, J. Research on Mechanical Properties of Cement Emulsified Asphalt Mortar Under the Influence of Water-to-Cement Ratios and Water-Reducing Agent. Buildings 2025, 15, 22. [Google Scholar] [CrossRef]
- Li, Y.L.; Li, X.; Tan, Y.Q. Effect of aging on fatigue performance of cement emulsified asphalt repair material. Constr. Build. Mater. 2021, 292, 123417. [Google Scholar] [CrossRef]
- Li, Y.L.; Sun, H.J.; He, X.; Tan, Y.Q. Fatigue damage and creep characteristics of cement emulsified asphalt composite binder. Constr. Build. Mater. 2020, 234, 117416. [Google Scholar] [CrossRef]
- Luo, Y.F.; Li, Y.W. Research progress on durability of CA mortar. Pop. Sci. Technol. 2010, 10, 82–83. (In Chinese) [Google Scholar]
- Ministry of Railways of the People’s Republic of China. Interim Technical Specifications for Cement Emulsion Asphalt Mortar for CRTS II Type Slab Ballastless Track on Passenger Dedicated Line Railways; China Railway Publishing House: Beijing, China, 2008.
- Tian, D.M.; Deng, D.H.; Tian, Q.; Pan, Y.R.; Tang, S. Effect of water on dynamic mechanical properties of cement emulsified asphalt mortar. J. Chin. Ceram. Soc. 2013, 41, 1507–1513. (In Chinese) [Google Scholar]
- Xu, H.; Wang, P.; Sun, H.W.; Zeng, X.H.; Zhao, P.R. Experiment of dynamic compressive behaviors of cement asphalt mortar under different water immersion duration. J. Build. Mater. 2015, 18, 861–866. (In Chinese) [Google Scholar]
- Yan, H.; Hu, H.F.; Zeng, X.H.; Pan, Z.L.; Tian, C.X. Studies on mechanical changes of CA mortar for slab track under hydrostatic effect. High Speed Railw. Technol. 2014, 5, 7–10+32. (In Chinese) [Google Scholar]
- Wang, W.T.; Wang, L.B.; Xiong, H.C.; Luo, R. A review and perspective for research on moisture damage in asphalt pavement induced by dynamic pore water pressure. Constr. Build. Mater. 2019, 204, 631–642. [Google Scholar] [CrossRef]
- Yeon, J.H.; Kim, K.K. Potential applications of phase change materials to mitigate freeze-thaw deteriorations in concrete pavement. Constr. Build. Mater. 2018, 177, 202–209. [Google Scholar] [CrossRef]
- Yang, X.L.; Shen, A.Q.; Guo, Y.C.; Zhou, S.B.; He, T.Q. Deterioration mechanism of interface transition zone of concrete pavement under fatigue load and freeze-thaw coupling in cold climatic areas. Constr. Build. Mater. 2018, 160, 588–597. [Google Scholar] [CrossRef]
- Li, Y.L.; Sun, H.J.; He, X.; Tan, Y.Q. Freeze-thaw damage and creep behavior of cement asphalt composite binder. Constr. Build. Mater. 2020, 245, 118407. [Google Scholar] [CrossRef]
- Cui, S.G. Study on frost resistance and microscopic mechanism of CRTS II CA mortar. Transp. Res 2013, 41, 54–57. (In Chinese) [Google Scholar]
- Wang, K.; Wu, X.; Su, S.M.; Zhou, Y.Y.; Wang, J.J. Analysis of freeze-thaw performance of cement asphalt mortar under fatigue environment. Transp. World 2024, 4, 29–32. (In Chinese) [Google Scholar]
- Hua, L.M. Study on the Microstructure and Durability of Cement Emulsified Asphalt Mortar; Yangzhou University: Yangzhou, China, 2023. (In Chinese) [Google Scholar]
- Li, Y.L.; He, X.; Sun, H.J.; Tan, Y.Q. Effect of freeze–thaw on fatigue damage characteristics of cement emulsified bitumen mastic. Road Mater. Pavement Des. 2021, 22, 1543–1558. [Google Scholar] [CrossRef]
- Kong, D.Y.; Mao, J.D.; Qian, X.Q.; Meng, T.; Yang, L.J. Frost resistance of CA mortar used in CRTS II ballastless slab track. J. Build. Mater. 2011, 14, 859–863. (In Chinese) [Google Scholar]
- Gao, L.; You, M.X.; Xiao, H.; Ma, Z.R.; Ma, Z.; Gan, Z.Y. Experimental Study on Relation Between Temperature Distribution in CRTS II Slab-type Ballastless Track and Ambient Temperature. Railw. Eng. 2016, 56, 6–9. (In Chinese) [Google Scholar]
- Xu, H.; Lin, H.S.; Wang, P.; Yan, H. The influence of water immersion on the mechanical property of cement asphalt mortar and its implications on the slab track. J. Vibroeng. 2017, 19, 477–486. [Google Scholar] [CrossRef]
- Li, Y.L.; He, X.; Sun, H.J.; Tan, Y.Q. Effects of freeze-thaw on dynamic mechanical behavior of cement emulsified asphalt composite binder. Constr. Build. Mater. 2019, 213, 608–616. [Google Scholar] [CrossRef]
- He, M.; Yuan, J.; Zhu, X. Fatigue damage characteristics and reliability analysis of asphalt mixtures using damage mechanics. Constr. Build. Mater. 2025, 458, 139748. [Google Scholar] [CrossRef]


| Needle Penetration 25 °C (0.1 mm) | Elongation 15 °C (cm) | Softening Point (°C) | Flash Point (°C) | Solubility (%) | Residual Penetration Ratio (%) | Residual Ductility (cm) |
|---|---|---|---|---|---|---|
| 68 | 105 | 46 | 300 | 107 | 68 | 10 |
| Density (g/cm3) | Standard Consistency Water Consumption (%) | Initial Condensation Time (min) | End Coagulation Time (min) | Fineness (%) | 28d Compressive Strength (MPa) | 28d Flexural Strength (MPa) |
|---|---|---|---|---|---|---|
| 3.08 | 27.8 | 40 | 450 | 2.8 | 45 | 6.7 |
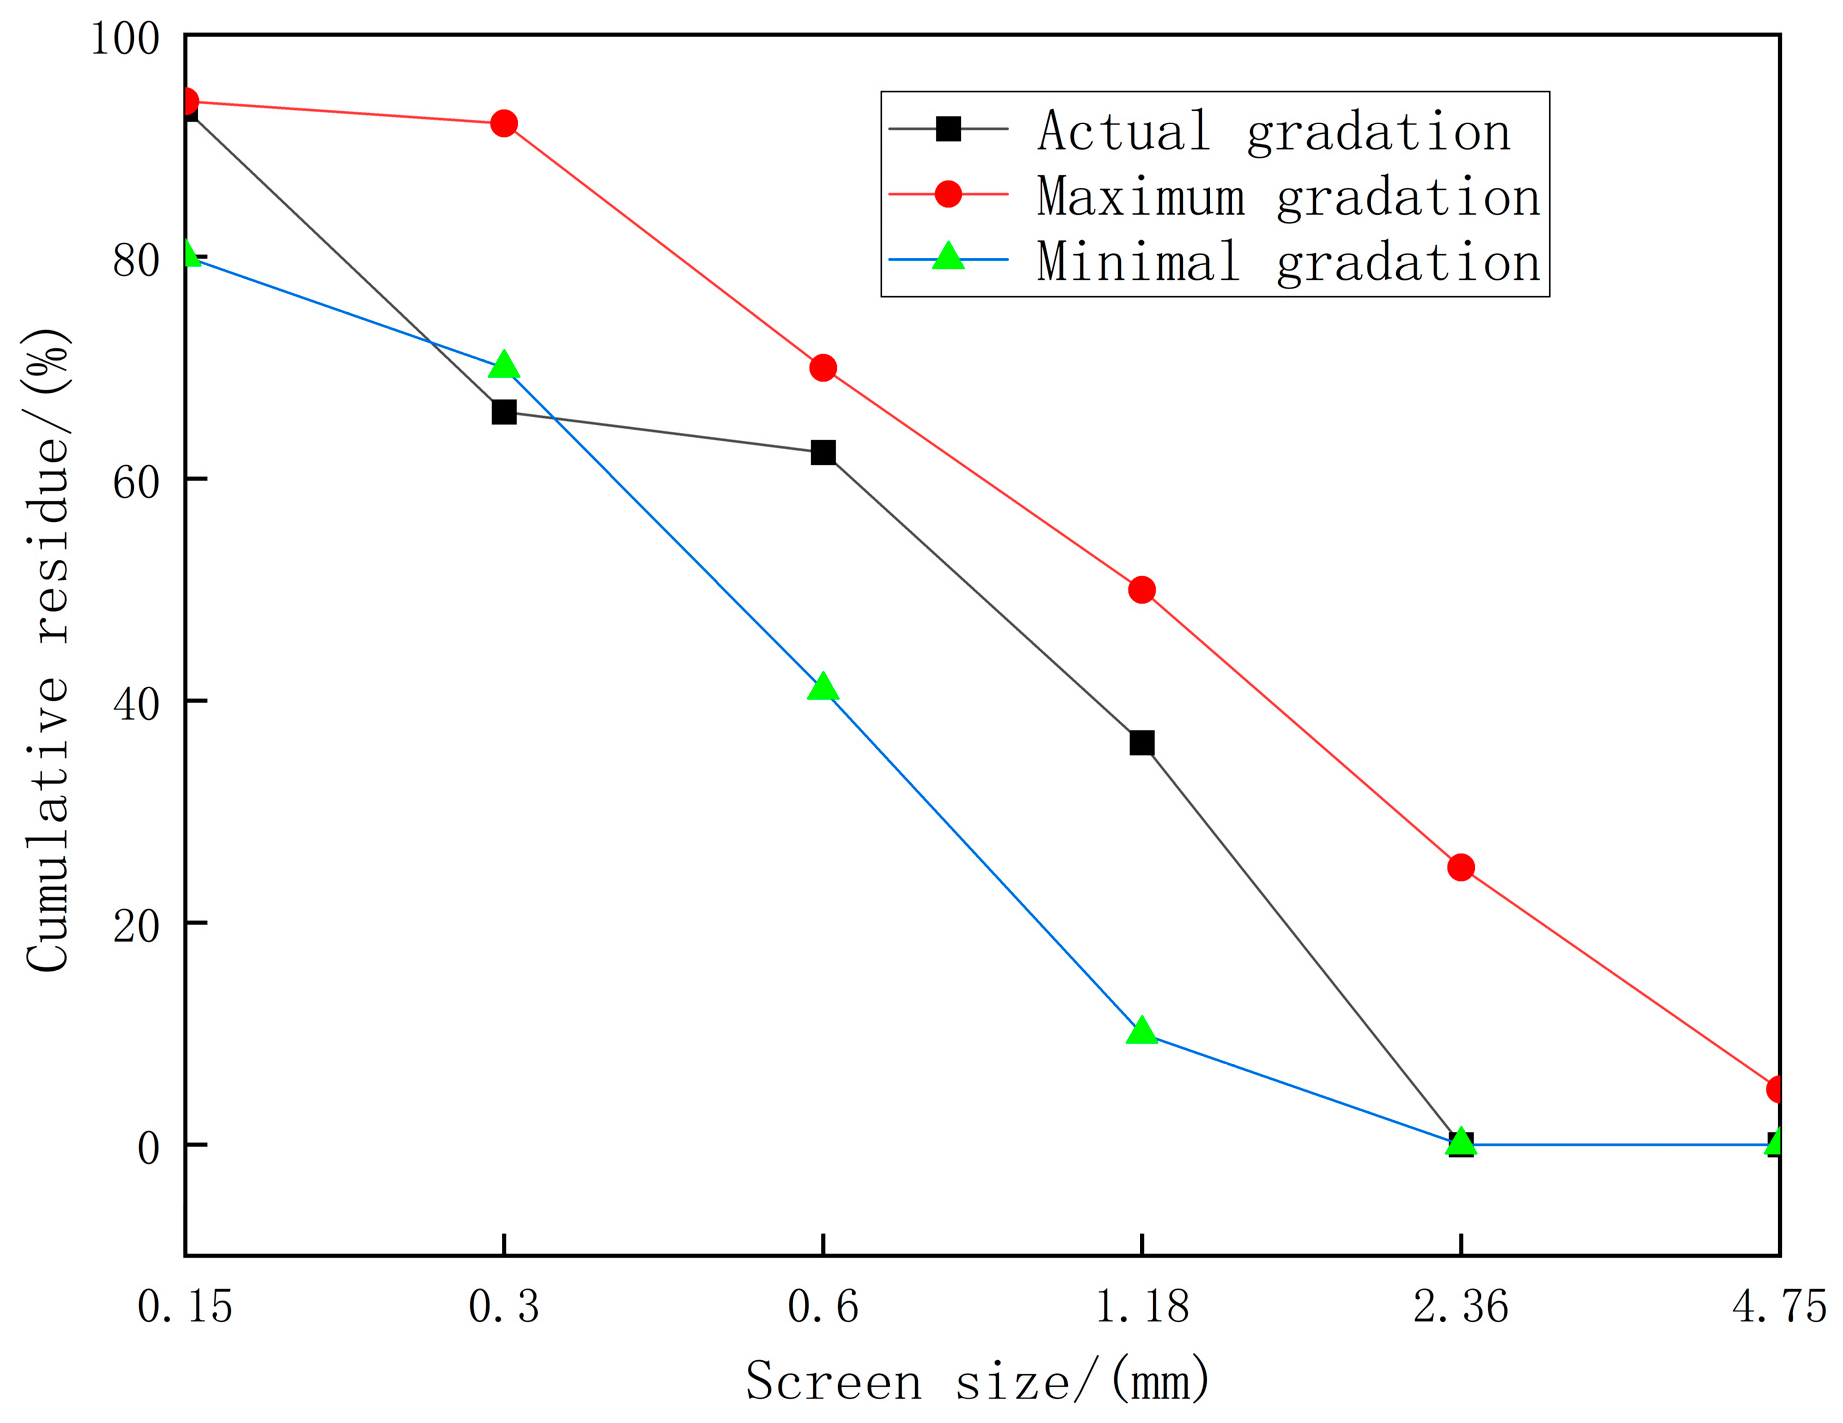
| Screen Size/mm | 4.75 | 2.36 | 1.18 | 0.6 | 0.3 | 0.15 |
|---|---|---|---|---|---|---|
| Count the residue/% | 0 | 0.02 | 36.2 | 26.16 | 3.64 | 27.28 |
| Cumulative residue/% | 0 | 0.02 | 36.22 | 62.38 | 66.02 | 93.3 |
| Cement/(kg/m3) | Emulsified Asphalt/(kg/m3) | Sand/(kg/m3) | Water/(kg/m3) | UEA/(kg/m3) |
|---|---|---|---|---|
| 563 | 225 | 867 | 185 | 28 |
| Moisture Content (%) | Fatigue Stress (Stress Level) | |||
|---|---|---|---|---|
| 0 | 8.92 (0.70) | 7.64 (0.60) | 6.37 (0.50) | 5.35 (0.42) |
| 25 | 8.92 (0.78) | 7.64 (0.67) | 6.37 (0.56) | 5.35 (0.47) |
| 50 | 7.39 (0.73) | 6.37 (0.63) | 5.35 (0.53) | 4.33 (0.43) |
| 75 | 7.39 (0.85) | 6.37 (0.74) | 5.35 (0.62) | 4.33 (0.50) |
| 100 | 7.39 (0.92) | 6.37 (0.79) | 5.35 (0.67) | 4.33 (0.54) |
| Condition | Moisture Content (%) | Maximum Load (kN) | Strength (MPa) |
|---|---|---|---|
| Before Freeze–Thaw | 0 | 24.98 | 12.73 |
| 25 | 22.33 | 11.38 | |
| 50 | 19.76 | 10.07 | |
| 75 | 16.99 | 8.66 | |
| 100 | 15.73 | 8.02 | |
| After Freeze–Thaw | 0 | 24.57 | 12.52 |
| 25 | 21.33 | 10.87 | |
| 50 | 17.78 | 9.06 | |
| 75 | 15.95 | 8.13 | |
| 100 | 13.79 | 7.03 |
| Moisture Content (%) | Fatigue Life N Under Different Fatigue Stresses (Stress Levels) (Times) | |||
|---|---|---|---|---|
| 0 | 8.92 (0.70) | 7.64 (0.60) | 6.37 (0.50) | 5.35 (0.42) |
| 461 | 6222 | 105,963 | 1,586,673 | |
| 25 | 8.92 (0.78) | 7.64 (0.67) | 6.37 (0.56) | 5.35 (0.47) |
| 421 | 3676 | 30,578 | 428,448 | |
| 50 | 7.39 (0.73) | 6.37 (0.63) | 5.35 (0.53) | 4.33 (0.43) |
| 233 | 4516 | 69,238 | 484,630 | |
| 75 | 7.39 (0.85) | 6.37 (0.74) | 5.35 (0.62) | 4.33 (0.50) |
| 269 | 1834 | 9242 | 79,417 | |
| 100 | 7.39 (0.92) | 6.37 (0.79) | 5.35 (0.67) | 4.33 (0.54) |
| 18 | 624 | 2796 | 18,997 | |
| Parameter | Moisture Content (%) | ||||
|---|---|---|---|---|---|
| 0 | 25 | 50 | 75 | 100 | |
| K | |||||
| n | |||||
| R2 | 1.0000 | 1.0000 | 0.9995 | 1.0000 | 0.9999 |
| Damage Degree | Moisture Content (%) | ||||
|---|---|---|---|---|---|
| 0 | 25 | 50 | 75 | 100 | |
| 0.0000 | 0.1060 | 0.2090 | 0.3197 | 0.3700 | |
| 0.0165 | 0.0448 | 0.1003 | 0.0612 | 0.1234 | |
| 0.0000 | 0.8673 | 0.9999 | 0.9999 | 0.9999 | |
| Ratio (%) | Moisture Content (%) | ||||
|---|---|---|---|---|---|
| 0 | 25 | 50 | 75 | 100 | |
| 0.00 | 12.23 | 20.90 | 31.97 | 37.00 | |
| 0.00 | 5.17 | 10.03 | 6.12 | 12.34 | |
Disclaimer/Publisher’s Note: The statements, opinions and data contained in all publications are solely those of the individual author(s) and contributor(s) and not of MDPI and/or the editor(s). MDPI and/or the editor(s) disclaim responsibility for any injury to people or property resulting from any ideas, methods, instructions or products referred to in the content. |
© 2025 by the authors. Licensee MDPI, Basel, Switzerland. This article is an open access article distributed under the terms and conditions of the Creative Commons Attribution (CC BY) license (https://creativecommons.org/licenses/by/4.0/).
Share and Cite
Jin, S.; Liu, P.; Wang, Z.; Zhou, D.; Li, X.; Xu, Z.; Zhang, Y.; Yan, Y.; Zhao, Y. Study on Fatigue Characteristics of Cement-Emulsified Asphalt Mortar Under Coupled Effects of Humidity and Freeze–Thaw. Coatings 2025, 15, 369. https://doi.org/10.3390/coatings15040369
Jin S, Liu P, Wang Z, Zhou D, Li X, Xu Z, Zhang Y, Yan Y, Zhao Y. Study on Fatigue Characteristics of Cement-Emulsified Asphalt Mortar Under Coupled Effects of Humidity and Freeze–Thaw. Coatings. 2025; 15(4):369. https://doi.org/10.3390/coatings15040369
Chicago/Turabian StyleJin, Shanshan, Pengfei Liu, Zhen Wang, Daxing Zhou, Xiang Li, Zengmiao Xu, Yang Zhang, Yuling Yan, and Yaodong Zhao. 2025. "Study on Fatigue Characteristics of Cement-Emulsified Asphalt Mortar Under Coupled Effects of Humidity and Freeze–Thaw" Coatings 15, no. 4: 369. https://doi.org/10.3390/coatings15040369
APA StyleJin, S., Liu, P., Wang, Z., Zhou, D., Li, X., Xu, Z., Zhang, Y., Yan, Y., & Zhao, Y. (2025). Study on Fatigue Characteristics of Cement-Emulsified Asphalt Mortar Under Coupled Effects of Humidity and Freeze–Thaw. Coatings, 15(4), 369. https://doi.org/10.3390/coatings15040369