Abstract
This work presents a physics-guided parameter estimation framework for cold spray additive manufacturing (CSAM), focusing on simulating and validating deposit profiles across diverse process conditions. The proposed model employs a two-zone flow representation: quasi-constant velocity near the nozzle exit followed by an exponentially decaying free jet to capture particle acceleration and impact dynamics. The framework employs a comprehensive approach by numerically integrating drag-dominated particle trajectories to predict deposit formation with high accuracy. This physics-based framework incorporates both operational and geometric parameters to ensure robust prediction capabilities. Operational parameters include spray angle, standoff distance, traverse speed, and powder feed rate, while geometric factors encompass nozzle design characteristics such as exit diameter and divergence angle. Validation is performed using 36 experimentally measured profiles of commercially pure titanium powder. The simulator shows excellent agreement with the experimental data, achieving a global root mean square error (RMSE) of 0.048 mm and a coefficient of determination , improving the mean absolute error by more than 40% relative to a neural network-based approach. Sensitivity analyses reveal that nozzle geometry, feed rate, and critical velocity strongly modulate the amplitude and shape of the deposit. Notably, decreasing the nozzle exit diameter or divergence angle significantly increases local deposition rates, while increasing the standoff distance dampens particle velocities, thereby reducing deposit height. Although the partial differential equation (PDE)-based framework entails a moderate increase in computational time—about 50 s per run, roughly 2.5 times longer than simpler empirical models—this remains practical for most process design and optimization tasks. Beyond its accuracy, the PDE-based simulation framework’s principal advantage lies in its minimal reliance on sampling data. It can readily be adapted to new materials or untested process parameters, making it a powerful predictive tool in cold spray process design. This study underscores the simulator’s potential for guiding parameter selection, improving process reliability and offering deeper physical insights into cold spray deposit formation.
1. Introduction
Cold spray additive manufacturing (CSAM) is a solid-state fabrication technique that deposits metals and alloys by accelerating powder particles to high velocities (500–1000 m/s) without melting [1]. By avoiding oxidation and thermal damage, CSAM has proven valuable in aerospace applications, successfully demonstrating capabilities from rotational parts to complex fin arrays [2]. The process has also found applications in biomedical surface treatments, enhancing implant properties [3], and in energy infrastructure, where its high deposition rate enables protective coatings for corrosion resistance in harsh environments [4].
These advantages, combined with the ability to build freeform shapes and perform in situ repairs, position CSAM as a compelling alternative to conventional thermal spray and fusion-based methods in industrial applications.
Despite its promise, CSAM process development and control remain challenging due to the complex interplay of gas dynamics, particle behavior, and deposition phenomena [5,6]. To address these challenges, researchers have explored several modeling approaches for cold spray and CSAM.
Empirical models rely on experimental data to derive correlations between process parameters and outcomes. For example, Silvello et al. [7] constructed response surface models from experimental databases to predict particle impact velocity and other outputs. Such models treat the process as a “black box”, using statistical or regression fits without explicit physical formulas. They can capture trends but often require large datasets and may lack applicability beyond the conditions for which they were trained.
Hybrid empirical–analytical methods combine theoretical insight with parameter fitting. For instance, Cai et al. [8] approximated the single-track deposit profile in CSAM using a Gaussian curve with a constant scaling factor determined empirically. Similarly, Klinkov et al. [9] introduced models for deposition efficiency that incorporate concepts like critical velocity but still require empirical input for specific materials. Hybrid models are more interpretable than purely empirical ones and embed some physics (e.g., geometric assumptions), yet they often involve tunable parameters that must be fitted for each material or spray condition.
With the rise of data-driven techniques, machine learning (ML) has been applied to cold spray modeling. In these approaches, algorithms learn the complex non-linear relationships between inputs (e.g., gas conditions and particle properties) and outputs (e.g., deposition efficiency or deposit geometry) from data. Ikeuchi et al. [10] developed a neural network to predict the cross-sectional profile of cold spray deposit tracks, achieving accuracy comparable to analytical models for both normal and off-normal spray angles. Hamrani et al. [11] employed a two-stage ML framework (classification followed by regression) to first predict whether deposition occurs and then estimate the deposition efficiency (DE) for given process parameters. This ML-driven inverse analysis, enhanced with Bayesian optimization, can identify optimal spraying conditions for high efficiency. ML models can handle high-dimensional interactions and optimize the process in ways not obvious from theory; however, they generally require substantial training data and can struggle to extrapolate beyond the domain of the training set.
While the existing modeling approaches have yielded valuable insights, they face several limitations that motivate the need for a new framework:
Many models require extensive experimentation for calibration or training. Trial-and-error optimization is still common in industrial cold spray practice, which is costly and time-consuming [12]. For example, empirical frameworks [7] and machine learning models [11] both depend on a large volume of experimental data to cover different materials and spraying conditions. This dependency not only raises development costs but also impedes rapid process tuning for new applications.
Models fitted to one material or set of parameters often do not generalize well to others. A correlation or neural network trained on a specific powder and nozzle may lose accuracy if any aspect of the process changes (e.g., a different particle size or substrate). Hamrani et al. [11] noted that their ML model should be validated on diverse materials and systems to ensure its findings generalize. In practice, empirical coefficients might need re-fitting for each new material, and ML models may require retraining, making it difficult to apply prior models broadly without repeating experiments.
Geometric fitting factors (such as the amplitude or spread of a deposit cross-section) are often tuned ad hoc rather than derived from process physics [13]. Silvello et al. [7] explicitly describe their methodology as empirical, “without a pre-allocated analytical framework”, where the model acts as a black box to map inputs to outputs. This indicates that the underlying parameters were not calculated from physical laws but adjusted to fit data. The consequence is that such models may fail to capture causal relationships and can mispredict outside of their calibration range.
This research addresses these shortcomings by introducing a framework that remains firmly grounded in physical principles while minimizing empirically fitted parameters. The novelty lies in systematically linking typically empirical factors to the governing physics of gas flow, particle dynamics, and deposition efficiencies. Specifically, this approach replaces the bulk of empirical methods—commonly used for parameters such as the amplitude factor A and characteristic radius —with physics-based calculations. This framework establishes a direct connection between process parameters and deposition characteristics by weaving together several key elements:
- Incorporation of gas flow dynamics and free-jet modeling: The spray pattern and in-flight trajectories are characterized through an exponential-decay free-jet velocity profile, whereby standoff distance effects can be accounted for beyond simplistic “flat” velocity assumptions.
- Implementation of a drag-force-based particle velocity model: Final particle velocities are determined as a function of standoff distance through direct integration of a drag equation along the nozzle axis. Traditional “one-size-fits-all” velocity assumptions are refined by this approach, through which predictive fidelity is improved.
- Proposal of a theoretically guided deposition efficiency factor that leverages the concept of critical velocity to capture the transition from rebound to adherence and its effect on the amplitude factor.
- Mass conservation and geometric considerations: Finally, A is derived by ensuring consistency between the powder feed rate (), material density (), and the volume integral of the deposition profile. is determined by considering the nozzle exit diameter, divergence angle, and standoff distance. This geometric approach captures the natural spread of the particle jet and ensures the deposition profile’s radial extent reflects the actual spray conditions.
Together, these components reinforce a physically grounded approach that ties flow conditions, particle trajectories, and mass balance directly to the geometry of the deposited material. The remainder of this paper is organized as follows: Section 2 presents a comprehensive review of related research in CSAM modeling. Section 3 details our methodology and theoretical framework. Section 4 presents the results and provides an in-depth discussion of our findings. Finally, Section 5 offers conclusions and suggests directions for future research.
2. Related Works
A variety of cold spray modeling strategies have been proposed in the literature, each with its own strengths and limitations. While some models rely on purely empirical data to correlate process parameters with build outcomes, others incorporate physical principles that allow for improved predictive capabilities with fewer experiments. Table 1 provides a comprehensive comparison of the major contributions and highlights the open challenges in current modeling approaches. Building upon these insights, our work aims to integrate physics-based analyses to reduce dependence on empirical fitting and improve generalizability.

Table 1.
Comparison of cold spray modeling approaches and proposed contribution.
As shown in Table 1, the approaches range from purely empirical correlations to intricate analytical models and machine learning methods. Despite considerable progress, many current methods rely on experimentally derived parameters that limit their generalization to new materials or process windows. In the following section, the methodology is presented for developing a physics-guided model that reduces dependence on empirical fittings and offers improved adaptability across diverse manufacturing scenarios.
3. Fundamental Model Development
The model builds upon Klinkov’s physical principles with several key improvements. The foundation starts with the particle jet distribution profile, initially described by Equation (1):
where r represents the distance from the nozzle axis, while and serve as parameters that control the shape of the distribution, typically obtained through experimental data fitting [9]. This Gaussian profile hypothesis assumes that the concentration of particles (or resulting coating thickness) is highest along the centerline of the jet and decays radially. Physically, this reflects the fact that an axisymmetric supersonic jet has maximum density/velocity at the core and lower values toward the periphery. If the spray distance effect and the effect of nozzle angle are added, the deposit growth in the z-axis direction becomes
where A is an amplitude factor that scales the overall deposition rate, , and accounts for how the nozzle angle affects deposition efficiency [13]. represents the influence of the spray distance on deposition efficiency. The function is the particle distribution profile, modified to incorporate the effects of spray distance, ensuring a more accurate representation of the deposition process. For a complete description of , a scaling coefficient that ensures mass conservation while capturing standoff distance effects is introduced, which can be described by Equation (2):
While parameter fitting through experimental data effectively captures the relationships between spray angle, nozzle speed, and standoff distance, these relationships can vary significantly across different operational conditions and powder characteristics [13]. Therefore, our primary objective focuses on implementing physics-based equations to estimate standoff distance effects, the geometric parameter, and the amplitude factor.
3.1. Physics-Based Parameter Estimation
To establish a more robust physical foundation for the cold spray deposition model, a comprehensive approach is developed that replaces empirically fitted parameters with physics-based calculations. This method integrates gas dynamics, particle ballistics, and deposition efficiency to determine the amplitude factor A and geometric parameter while accounting for standoff distance effects.
3.1.1. Gas Flow and Free-Jet Modeling
The foundation of the approach begins with modeling the gas flow field. As shown in Equation (3), the gas velocity along the spray axis follows a piecewise function, incorporating a near-field constant velocity region and far-field decay. The function uses the gas velocity at the nozzle exit (), acceleration zone length (), and characteristic decay length () as key parameters. These free-jet modeling equations assume the gas expands isentropically from the nozzle, and then mixes with ambient air as a turbulent jet. Following a similar structure, Equation (4) describes the gas density distribution, which maintains a constant density in the acceleration zone before exponentially decaying [17,18,19].
3.1.2. Particle Velocity Evolution
The particle trajectory is determined by the drag force equation presented in Equation (5). This differential equation relates the particle’s velocity change to various physical parameters, including the particle mass (), velocity (), drag coefficient (), local gas density (), which varies with standoff distance, local gas velocity (), which follows the exponential decay profile, cross-sectional area (), and the position along the spray axis (x). The particle velocity evolution equation is based on balancing drag force with particle inertia. The hypothesis here is that the primary force on a particle in the cold spray flow is aerodynamic drag (gravity and other forces are negligible over the short flight). As the particle travels through the nozzle and free jet, it is accelerated by the gas if (drag in the direction of motion) or decelerated if it overtakes the gas. The drag coefficient encapsulates complex fluid effects (shock formation around the particle at high Mach, viscous drag, and pressure drag). Through the numerical solution of this equation, particle velocity can be estimated at any given standoff distance [20].
This system is solved numerically to obtain particle trajectories and velocities at any point along the spray path. The solution provides essential inputs for calculating both the spatial distribution of particles and their impact conditions, which directly influence the deposition efficiency and final deposit geometry. The particle velocity at impact, , is particularly crucial as it determines whether deposition occurs through the deposition efficiency factor . This creates a direct link between particle ballistics and deposit formation, making accurate particle trajectory modeling essential for predicting the amplitude factor.
3.1.3. Deposition Efficiency Factor
The critical velocity concept forms the basis of the deposition efficiency factor, expressed in Equation (6). During cold spray deposition, particle adhesion occurs through complex mechanical and thermal processes at impact. These mechanisms are predominantly governed by the particle’s kinetic energy, which must exceed a material-dependent threshold for successful bonding. This threshold is characterized by the critical velocity (), below which particles typically rebound from the surface rather than adhere. The concept of a “critical velocity” above which particles stick was first introduced by Assadi et al. [21]. The transition from rebound to adhesion is modeled through a logistic function that incorporates the critical velocity () and transition steepness parameter (k) to model the deposition behavior. The logistic function hypothesis is that deposition efficiency follows a sigmoidal curve with respect to impact velocity (or particle kinetic energy).
3.1.4. Parameter Calculation
The total volume deposited in one pass is calculated using Equation (7), which combines the feed rate (), material density (), and deposition efficiency. The geometric parameter , defined in Equation (8), accounts for nozzle geometry and standoff distance effects through the exit diameter (), standoff distance (), and divergence angle () shown in Figure 1. The hypothesis behind Equation (8) is based on the assumption that the particle jet expands conically after exiting the nozzle due to turbulent mixing and momentum exchange with the surrounding ambient air. The boundary of this expansion is defined geometrically as a function of the nozzle exit diameter, standoff distance (distance from nozzle exit to substrate), and the divergence angle of the jet.
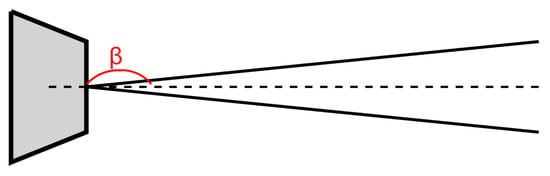
Figure 1.
Nozzle divergence angle.
Finally, Equation (9) determines the amplitude factor A by relating the total volume to the integral of the deposition profile.
This physics-based approach provides a more robust foundation for parameter estimation compared to purely empirical fitting, while maintaining the flexibility to account for different operating conditions. The whole process is shown in Figure 2.
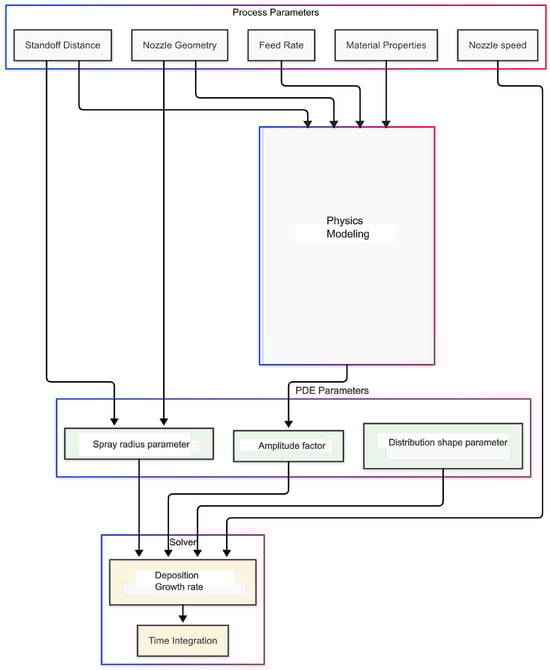
Figure 2.
Cold spray process flow diagram.
In addition, a more detailed depiction of the physics modeling process is provided in the accompanying flowchart, clarifying the interdependencies between key parameters and physical phenomena in Figure 3.
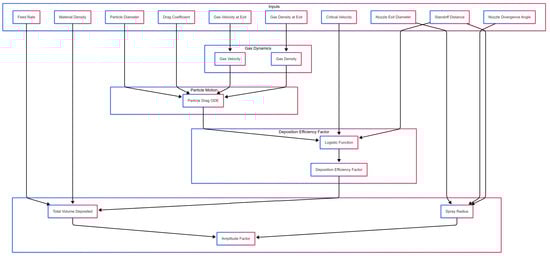
Figure 3.
Physics modeling flow diagram.
The presented framework, while incorporating key physical phenomena, relies on several simplifying assumptions that warrant explicit acknowledgment:
- The drag coefficient () is assumed to be constant, although it is typically dependent on the Mach number, Reynolds number, and temperature—parameters that vary within the nozzle plume. Velocity predictions could be further refined by incorporating dependencies on flow conditions.
- The flow is considered steady-state, neglecting transient effects that may arise due to fluctuations in operating conditions.
- The thermal properties of the substrate are assumed to be uniform, ignoring localized variations due to material heterogeneity or prior thermal exposure.
- The deposition rate is modeled as uniform across the build surface, disregarding variations due to process dynamics and external disturbances.
4. Results and Discussion
This section presents the comparison between the experimentally measured single-track profiles and those predicted by the cold spray simulation. Commercially pure titanium (cp-Ti) was selected for this study due to its widespread use in aerospace and biomedical applications, as well as the extensive experimental data available in the literature to validate findings. As detailed in the methodology, a PDE solver was employed to model deposit build-up under varying input conditions (spray angle, traverse speed, and standoff distance). The simulation results were post-processed to extract a representative 2D cross-sectional profile at the mid-length of the build, and then aligned and compared to the experimentally measured profiles originally reported by Ikeuchi et al. The experimental dataset comprised 36 samples produced using a full factorial design of process parameters, with spray angles ranging from 45° to 90°, traverse speeds from 25 to 200 mm/s, and standoff distances between 30 and 50 mm. The parameters chosen for the model are given in Table 2 below:
Table 2.
Selected parameter values used in the cold spray simulation.
A nozzle exit velocity of 790 m/s was chosen based on the operating conditions of 5 MPa and 600 °C nitrogen, as employed in experiments. Several cold spray studies have reported that under these high-pressure, high-temperature N2 conditions, Ti particles reach velocities of approximately 700–800 m/s, close to or slightly above the critical velocity of cp-Ti [22,23]. The measured deposit efficiencies and single-track profiles are consistent with impact velocities in this range, supporting the selection of 790 m/s as the nominal exit velocity. In high-pressure cold spray, most particle acceleration occurs within the diverging section of the nozzle (typically 50–70 mm in length), with further velocity adjustments in the free-jet region [22]. Here, the near-nozzle flow field was represented as a region of quasi-constant velocity (70 mm), followed by an exponentially decaying velocity beyond the exit. This dual-zone approximation has been widely used to capture the rapid drop in gas velocity as the jet expands into the ambient environment. The length scale of 100 mm for the decay region is consistent with previous numerical simulations of supersonic free jets, which show that the gas velocity can drop by 50%–70% over a few nozzle diameters downstream [24].
At 5 MPa and 600 °C in the stagnation chamber, the density of the nitrogen propellant is considerably higher than 1 kg/m3. However, the rapid expansion through the de Laval nozzle significantly reduces the density by the time the jet exits. Experimental and computational studies report exit densities on the order of 0.5–1.0 kg/m3—comparable to ambient air densities—once the gas has fully expanded to near-atmospheric pressure [23]. Therefore, a nominal value of 1 kg/m3 was employed in the simulation to mimic the expanded flow conditions at the nozzle exit. The actual nozzle geometry was adopted from the Impact Innovations 5/11 system used in the experiments. The 6.2 mm exit diameter aligns with the manufacturer’s specifications and sets the initial cross-sectional area for the jet flow [10]. For small particles in supersonic flow, the aerodynamic drag coefficient is typically in the 0.4–1.0 range. Many models use this ∼0.4–0.5 value for fast-moving powder in continuum flow [25]. As particle morphology affects —irregular or angular Ti powder can experience higher effective drag, reducing acceleration—a value around 0.5 is often a reasonable assumption for Grade-2 Ti powder in N2. The exact critical velocity for Ti can vary with conditions [26]. Zybała et al. [27] have noted a broad range of ∼690–890 m/s for CP titanium. The lower end (∼690 m/s) applies when conditions favor bonding (e.g., particle preheating and oxide break-up), whereas the upper end (∼850–890 m/s) may be needed in less ideal cases (e.g., room-temperature particles or oxide-covered surfaces). Numerous studies agree that CP Ti requires a high critical velocity of ∼700 m/s (when using heated nitrogen or helium) for successful cold spray deposition [28].
To illustrate the general quality of the model predictions, Figure 4 (representative samples) compares the experimentally measured deposit cross-sections (red markers) with the simulated profiles (blue lines) for each combination of process parameters. The raw height data were plotted as a function of the distance along the x-axis to capture the peak and width of the deposit. Additionally, Figure 5 presents a three-dimensional visualization of the simulated deposit for Sample 1, providing insight into the complete spatial distribution of the deposited material. The 3D profile clearly demonstrates the model’s ability to capture the characteristic asymmetric deposition pattern resulting from the oblique spray angle, as well as the gradual height transitions along the spray direction. This 3D visualization capability is particularly valuable for CSAM applications, where understanding the complete spatial characteristics of single-track deposits serves as a fundamental building block for developing more complex multi-track and multi-layer structures. The ability to accurately predict these 3D profiles enables better toolpath planning and optimization of layer-by-layer build strategies, which is crucial for achieving dimensional accuracy and structural integrity in CSAM components. The model accurately captures both the overall profile shape and key geometric features, including the maximum height, profile width, and asymmetric deposition characteristics inherent to oblique spray angles. For Sample 1, despite the challenging 45° spray angle, the simulation achieves a low RMSE of 0.049 mm and mean absolute error (MAE) of 0.038 mm. The maximum height prediction shows particularly good agreement, with the simulation closely matching the experimental peak of approximately 1.15 mm. The slight underprediction of peak height (maximum error of 0.116 mm) may be attributed to the complexity of particle impact and bonding behavior at highly oblique angles. Sample 14, sprayed at a more moderate 60° angle, shows similarly strong agreement with experimental measurements (RMSE = 0.062 mm, MAE = 0.055 mm). The increased standoff distance (40 mm vs. 30 mm) appears to have minimal impact on prediction accuracy, suggesting robust model performance across different spray distances. The simulation successfully captures the slightly increased profile asymmetry characteristic of oblique spray angles while maintaining accurate prediction of both the peak height (∼1.25 mm) and overall profile shape.
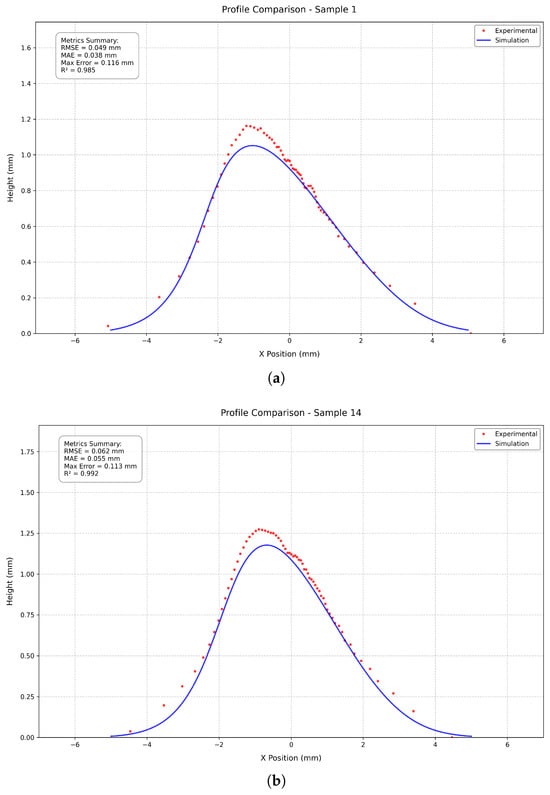
Figure 4.
Comparison between experimental measurements (red dots) and simulated profiles (blue line) for two representative cold spray single-track deposits with different spray angles and standoff distances. The profiles demonstrate excellent agreement in both shape and magnitude across different processing conditions. (a) Profile comparison for spray angle 45°, traverse speed 25 mm/s, and standoff distance 30 mm (Sample 1). RMSE = 0.049 mm and R2 = 0.985. (b) Profile comparison for spray angle 60°, traverse speed 25 mm/s, and standoff distance 40 mm (Sample 14). RMSE = 0.062 mm and R2 = 0.992.
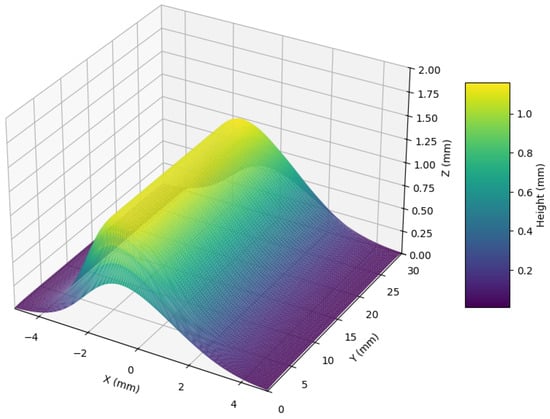
Figure 5.
Three-dimensional visualization of the simulated cold spray deposit for Sample 1 (45° spray angle, 25 mm/s traverse speed, and 30 mm standoff distance). The color map represents deposit height, illustrating the characteristic asymmetric profile and gradual height transition along the spray direction.
Across all 36 samples, the model demonstrated exceptional performance, with a global RMSE of 0.048 mm, MAE of 0.033 mm, and MXAE of 0.254 mm. The MAPE of 10.51% indicates strong relative accuracy across varying profile heights, while the correlation coefficient R of 0.995 and R2 of 0.991 confirm agreement with experimental measurements. Figure 6 illustrates the accuracy of the model at the maximum height through a comparison of predicted versus experimental heights across all samples.
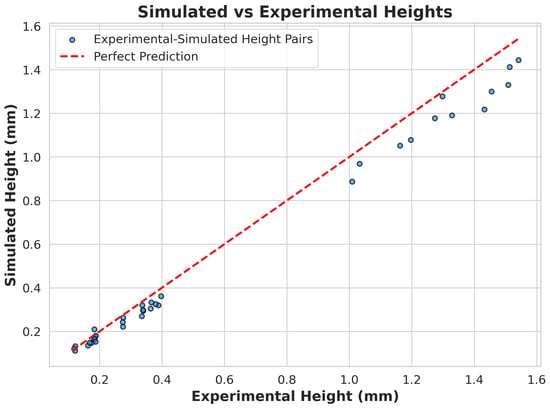
Figure 6.
Comparison between simulated and experimental maximum heights for all samples. Each blue dot represents an individual sample, plotting its experimentally measured maximum height (x-axis) against the corresponding simulated maximum height (y-axis).
As shown in Table 3, the physics-based approach achieved a 42.4% improvement in MAE compared to the neural network method previously reported by Ikeuchi et al. [10] (0.033 mm vs. 0.058 mm). While our model showed a marginally higher maximum absolute error (0.254 mm vs. 0.152 mm) and MAPE (10.51% vs. 8.34%), it offers the significant advantage of not requiring training data, making it more versatile for new processing conditions and materials. The high correlation coefficient (0.995, R2 = 0.991) suggests that the simulation successfully captures the fundamental physics of the cold spray deposition process.
Table 3.
Comparison of performance metrics between the current physics-based simulation and the neural network approach from Ikeuchi et al. [10].
Sensitivity Analysis
The sensitivity analysis was structured to evaluate the model’s response to variations in both direct operational parameters and gas model parameters. For the baseline case, cold spray operating conditions with a powder feed rate of 2.9 kg/h, nozzle exit diameter of 6.2 mm, and divergence angle of 3.0° were selected. The standoff distance was set to 50 mm, with a spray angle of 25° relative to the surface normal. The parameter values here are taken from the experimental setup.
To systematically assess parameter sensitivity, the direct process parameters that operators can control were examined. For each parameter, the amplitude factor A was computed while varying the parameter by from its baseline value, maintaining all other parameters at their nominal values. The examined direct parameters included the following:
The response variable for all analyses was the normalized change in amplitude factor, , where represents the baseline amplitude factor. This normalization allows direct comparison of sensitivity across parameters with different physical units and scales. Results were visualized through comparative bar charts showing the relative impact of each parameter variation on the amplitude factor shown in Figure 7.
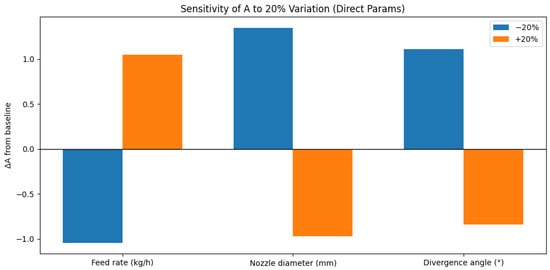
Figure 7.
Sensitivity results for A.
The sensitivity analysis revealed significant dependencies between key process parameters and the model’s predicted deposition behavior, particularly through variations in the amplitude factor A. Starting from a baseline amplitude factor of (corresponding to typical operating conditions: feed rate of kg/h, nozzle exit diameter of mm, and divergence angle of ), we observed distinct patterns of influence for each parameter examined.
The powder feed rate demonstrated a direct linear relationship with the amplitude factor. A reduction in feed rate (to kg/h) resulted in a proportional decrease in A to , while a increase (to kg/h) yielded an A value of . This linear scaling validates the model’s implementation of mass conservation principles and suggests that the deposition rate scales predictably with material input. The nozzle exit diameter exhibited the strongest influence on the amplitude factor, but with notably non-linear behavior. Reducing the diameter by 20% (to 4.96 mm) increased A to 6.5712, while a 20% increase (to 7.44 mm) decreased A to 4.2523. This inverse relationship reflects the fundamental physics of particle distribution: as the nozzle diameter increases, the same mass flux is distributed over a larger area, resulting in lower local deposition rates. The non-linear nature of this response suggests complex interactions between the nozzle geometry and the resulting particle distribution pattern. For the nozzle divergence angle, we observed a sensitivity comparable to that of the feed rate but with distinct non-linear characteristics. A 20% decrease in divergence angle (to 2.4°) increased A to 6.3326, while a 20% increase (to 3.6°) reduced A to 4.3821. This behavior aligns with theoretical expectations: smaller divergence angles concentrate the particle stream more effectively, leading to higher local deposition rates, while larger angles disperse particles over a wider area.
To quantify the model’s sensitivity to the key process parameters of gas modeling, we conducted a systematic analysis examining the influence of exit velocity (: 700–900 m/s), critical velocity (: 700–900 m/s), and standoff distance (20–100 mm) on deposition characteristics. This sensitivity study provides insights into which parameters most strongly influence the cold spray deposition process.
Figure 8 demonstrates the model’s sensitivity to velocity parameters across different standoff distances. The analysis reveals that the velocity difference () serves as a critical parameter controlling deposition behavior. Equation (5) shows hows how particle velocity decreases due to drag forces, with the effect becoming more pronounced at larger standoff distances. The decreasing amplitude factor reflects this velocity loss, as particles arriving at the substrate with lower velocities are less likely to achieve successful deposition. The separation between the two curves ( and 200 m/s) demonstrates the importance of the initial velocity difference. When particles start with significantly more kinetic energy than needed for deposition, this excess energy serves as a “buffer” against velocity losses during flight, allowing particles to maintain sufficient velocity for deposition, even at larger standoff distances. This explains why the orange curve ( m/s) maintains higher amplitude factors throughout the range. Particularly interesting is the behavior at longer standoff distances (80–100 mm). Here, the curves begin to converge, but the higher conditions maintain better deposition performance. At 100 mm, the amplitude factor for m/s is approximately twice that of m/s. This demonstrates how the initial velocity advantage becomes crucial for maintaining deposition efficiency at extended standoff distances.
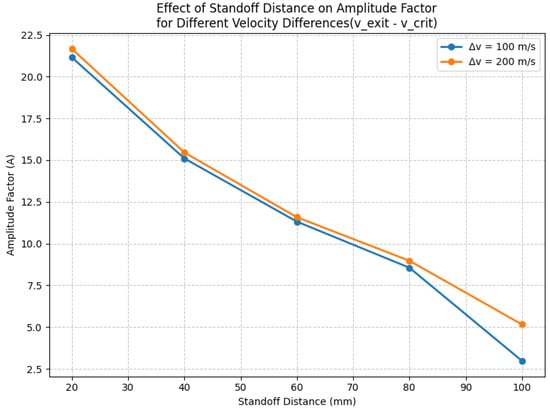
Figure 8.
Sensitivity results for velocity difference.
The near-linear decay in amplitude factor with standoff distance (rather than exponential) suggests that the process is operating in a regime where the gas–particle coupling remains relatively stable. This is consistent with the supersonic free-jet behavior typically observed in cold spray, where the gas velocity field follows a predictable decay pattern described by Equation (3). A key consideration in evaluating the practicality of cold spray simulations is the required computational time. The run times of the proposed physics-based approach were compared with those reported for Klinkov’s model under 36 representative test cases. These simulations were performed on an equivalent workstation environment, ensuring a consistent basis for comparison. Averaged over the 36 simulations, the proposed physics-based method requires approximately ∼51 s per run, compared to ∼20 s for Klinkov’s model. This corresponds to roughly a 2.5-fold increase in computational time. The additional overhead primarily arises from more detailed physics-based formulations that account for gas flow dynamics, particle velocity decay, and local geometry effects. By contrast, Klinkov’s approach simplifies some of these interactions, thus achieving faster—but less comprehensive—predictions.
Despite this higher cost, the absolute computational time of under one minute per simulation remains reasonable for most research and industrial process optimization workflows. In many CSAM contexts, the benefit of higher fidelity and reduced reliance on empirical fitting outweighs the penalty of longer run times, especially when dealing with costly materials or complex geometries. Moreover, the model’s improved physics-based foundation can translate into better predictive accuracy over a broader parameter space, thus reducing the need for extensive calibration experiments.
5. Conclusions
This study has advanced the modeling capabilities for CSAM by developing a physics-based approach that enhances simulation accuracy while reducing reliance on empirical fitting. The integration of gas dynamics, particle ballistics, and deposition mechanics provides a more robust theoretical foundation for cold spray process simulation compared to purely empirical models. The proposed model demonstrates exceptional agreement with experimental measurements across diverse processing conditions, achieving an overall RMSE of 0.048 mm and correlation coefficient of 0.995. This represents a 42.4% improvement in mean absolute error compared to previous neural network approaches, while maintaining comparable accuracy metrics across all experimental test cases. Particularly noteworthy is the model’s ability to accurately capture both symmetric and asymmetric deposition profiles across varying spray angles, traverse speeds, and standoff distances without requiring extensive calibration data. Sensitivity analysis revealed that nozzle exit diameter exerts the strongest influence on deposition characteristics, followed by divergence angle and powder feed rate. The velocity differential between exit velocity and critical velocity emerged as a crucial parameter controlling deposition behavior, particularly at extended standoff distances where particle velocity decay becomes significant. These insights provide valuable guidance for process optimization in practical CSAM applications. While the physics-based approach incurs approximately a 2.5 times greater computational cost compared to simplified empirical models, the absolute simulation time of approximately 51 s per run remains practical for industrial applications. The enhanced predictive capabilities across a broader parameter space justify this modest increase in computational overhead, particularly when working with expensive materials or complex geometries where experimental iteration would be prohibitively costly. Despite these advances, several limitations remain in the current implementation. The assumption of a constant drag coefficient oversimplifies the complex gas–particle interactions that occur in supersonic flow regimes. Future work should incorporate Mach-dependent drag models and account for particle size distributions to better represent the polydisperse powder characteristics typical in industrial CSAM processes. Additionally, the thermal aspects of particle impact and bonding, particularly the adiabatic heating and thermal softening effects, are not fully captured in the current model and represent an important direction for future development. The next phase of this research will focus on extending the model to multi-track and multi-layer configurations, incorporating substrate thermal evolution and residual stress development. Integration with toolpath planning algorithms would enable optimized deposition strategies for complex geometries while minimizing material waste and build defects. Further validation across different material systems, particularly for high-value aerospace alloys and functionally graded materials, would demonstrate the model’s broader applicability for emerging CSAM applications. This work represents a significant step toward establishing a comprehensive physics-based simulation framework for cold spray additive manufacturing that balances computational efficiency with predictive accuracy. By reducing reliance on extensive experimental calibration while maintaining high fidelity, the approach offers a valuable tool for both research and industrial implementation of cold spray technology for advanced manufacturing applications.
Author Contributions
Conceptualization, M.M.R. and A.H.; methodology, M.M.R.; software, M.M.R.; validation, M.M.R.; formal analysis, M.M.R.; investigation, M.M.R. and M.S.A.S.; resources, D.M. and A.A.; data curation, M.M.R.; writing—original draft preparation, M.M.R.; writing—review and editing, A.H., M.S.A.S., A.A. and D.M.; visualization, M.M.R.; supervision, D.M.; project administration, D.M. and A.A.; funding acquisition, A.A. All authors have read and agreed to the published version of the manuscript.
Funding
This research was funded by DEVCOM—Army Research Laboratory through the W911NF2020256 grant.
Institutional Review Board Statement
Not applicable.
Informed Consent Statement
Not applicable.
Data Availability Statement
The data presented in this study are available on request from the corresponding author. The data are not publicly available due to ongoing research activities.
Acknowledgments
The authors gratefully acknowledge support from the DEVCOM—Army Research Laboratory through the W911NF2020256 grant.
Conflicts of Interest
The authors declare no conflicts of interest.
Abbreviations
The following abbreviations are used in this manuscript:
| CSAM | Cold Spray Additive Manufacturing |
| PDE | Partial Differential Equation |
| ODE | Ordinary Differential Equation |
| RMSE | Root Mean Square Error |
| MAE | Mean Absolute Error |
| MXAE | Maximum Absolute Error |
| MAPE | Mean Absolute Percentage Error |
| DE | Deposition Efficiency |
| ML | Machine Learning |
References
- Gärtner, F.; Stoltenhoff, T.; Schmidt, T.; Kreye, H. The cold spray process and its potential for industrial applications. J. Therm. Spray Technol. 2006, 15, 223–232. [Google Scholar] [CrossRef]
- Lynch, M.E.; Gu, W.; El-Wardany, T.; Hsu, A.; Viens, D.; Nardi, A.; Klecka, M. Design and topology/shape structural optimisation for additively manufactured cold sprayed components. Virtual Phys. Prototyp. 2013, 8, 213–231. [Google Scholar] [CrossRef]
- Liao, T.Y.; Biesiekierski, A.; Berndt, C.; King, P.; Ivanova, E.; Thissen, H.; Kingshott, P. Multifunctional cold spray coatings for biological and biomedical applications: A review. Prog. Surf. Sci. 2022, 97, 100654. [Google Scholar] [CrossRef]
- Hassani-Gangaraj, S.M.; Moridi, A.; Guagliano, M. Critical review of corrosion protection by cold spray coatings. Surf. Eng. 2015, 31, 803–815. [Google Scholar] [CrossRef]
- Suhonen, T.; Varis, T.; Dosta, S.; Torrell, M.; Guilemany, J.M. Residual stress development in cold sprayed Al, Cu and Ti coatings. Acta Mater. 2013, 61, 6329–6337. [Google Scholar] [CrossRef][Green Version]
- Al-Mangour, B.; Dallala, R.; Zhim, F.; Mongrain, R.; Yue, S. Fatigue behavior of annealed cold-sprayed 316L stainless steel coating for biomedical applications. Mater. Lett. 2013, 91, 352–355. [Google Scholar] [CrossRef]
- Silvello, A.; Cavaliere, P.D.; Albaladejo, V.; Martos, A.; Dosta, S.; Cano, I.G. Powder Properties and Processing Conditions Affecting Cold Spray Deposition. Coatings 2020, 10, 91. [Google Scholar] [CrossRef]
- Cai, Z.; Deng, S.; Liao, H.; Zeng, C.; Montavon, G. The Effect of Spray Distance and Scanning Step on the Coating Thickness Uniformity in Cold Spray Process. J. Therm. Spray Technol. 2014, 23, 354–362. [Google Scholar] [CrossRef]
- Klinkov, S.V.; Kosarev, V.F.; Ryashin, N.S.; Shikalov, V.S. Influence of Particle Impact Angle on Formation of Profile of Single Coating Track During Cold Spraying. AIP Conf. Proc. 2018, 2027, 020007. [Google Scholar] [CrossRef]
- Ikeuchi, D.; Vargas-Uscategui, A.; Wu, X.; King, P.C. Neural Network Modelling of Track Profile in Cold Spray Additive Manufacturing. Materials 2019, 12, 2827. [Google Scholar] [CrossRef]
- Hamrani, A.; Medarametla, A.; John, D.; Agarwal, A. Machine-Learning-Driven Optimization of Cold Spray Process Parameters: Robust Inverse Analysis for Higher Deposition Efficiency. Coatings 2025, 15, 12. [Google Scholar] [CrossRef]
- Ardeshiri Lordejani, A.; Romanenghi, L.; Pollastri, A.; Guagliano, M.; Bagherifard, S. Deposit shape control for local repair and welding by cold spray. J. Manuf. Process. 2024, 112, 45–59. [Google Scholar] [CrossRef]
- Vanerio, D.; Kondas, J.; Guagliano, M.; Bagherifard, S. 3D modelling of the deposit profile in cold spray additive manufacturing. J. Manuf. Process. 2021, 67, 521–534. [Google Scholar] [CrossRef]
- Wu, Y.; Sun, C.; Lu, J.; Li, T.; Wu, J.; Xie, H. Efficient layer-building approach for promising cold spray additive manufacturing. J. Manuf. Process. 2025, 133, 642–653. [Google Scholar] [CrossRef]
- Kotoban, D.; Grigoriev, S.; Okunkova, A.; Sova, A. Influence of a shape of single track on deposition efficiency of 316L stainless steel powder in cold spray. Surf. Coat. Technol. 2017, 309, 951–958. [Google Scholar] [CrossRef]
- Chen, C.; Xie, Y.; Verdy, C.; Liao, H.; Deng, S. Modelling of coating thickness distribution and its application in offline programming software. Surf. Coat. Technol. 2017, 318, 315–325. [Google Scholar] [CrossRef]
- Ashkenas, H.; Sherman, F. Structure and Utilization of Supersonic Free Jets in Low Density Wind Tunnels. In Rarefied Gasdynamics 4; Academic Press: New York, NY, USA, 1966. [Google Scholar]
- Champagne, V.K., Jr.; Ozdemir, O.C.; Nardi, A. (Eds.) Practical Cold Spray; Springer: Cham, Switzerland, 2021. [Google Scholar] [CrossRef]
- Yin, S.; Lupoi, R. Gas Flow, Particle Acceleration and Heat Transfer in Cold Spray Additive Manufacturing. In Cold Spray Additive Manufacturing; Springer Tracts in Additive Manufacturing; Springer International Publishing: Cham, Switzerland, 2021; pp. 9–52. [Google Scholar] [CrossRef]
- Shikalov, V.S.; Klinkov, S.V.; Usynin, S.Y.; Kosarev, V.F. Spherical particles velocity in a supersonic jet flowing out from an ejector nozzle used in cold spray. AIP Conf. Proc. 2018, 2027, 030040. [Google Scholar] [CrossRef]
- Assadi, H.; Gärtner, F.; Stoltenhoff, T.; Kreye, H. Bonding mechanism in cold gas spraying. Acta Mater. 2003, 51, 4379–4394. [Google Scholar] [CrossRef]
- Zahiri, S.; Yang, W.; Jahedi, M. Characterization of Cold Spray Titanium Supersonic Jet. J. Therm. Spray Technol. 2009, 18, 110–117. [Google Scholar] [CrossRef]
- An, S.; Joshi, B.; Yarin, A.L.; Swihart, M.T.; Yoon, S.S. Supersonic Cold Spraying for Energy and Environmental Applications: One-Step Scalable Coating Technology for Advanced Micro- and Nanotextured Materials. Adv. Mater. 2020, 32, 1905028. [Google Scholar] [CrossRef]
- Oyinbo, S.T.; Jen, T.-C. A comparative review on cold gas dynamic spraying processes and technologies. Manuf. Rev. 2019, 6, 25. [Google Scholar] [CrossRef]
- Leitz, K.H.; O’Sullivan, M.; Plankensteiner, A.; Lichtenegger, T.; Pirker, S.; Kestler, H.; Sigl, L. CFDEM Modelling of Particle Heating and Acceleration in Cold Spraying. In Proceedings of the 19th Plansee Seminar, Plansee SE, Reutte, Austria, 29 May–2 June 2017; Volume RM 37/1. [Google Scholar]
- Żórawski, W.; Molak, R.; Mądry, J.; Sienicki, J.; Góral, A.; Makrenek, M.; Scendo, M.; Dobosz, R. Experimental and Numerical Investigations of Titanium Deposition for Cold Spray Additive Manufacturing as a Function of Standoff Distance. Materials 2021, 14, 5492. [Google Scholar] [CrossRef] [PubMed]
- Zybała, R.; Bucholc, B.; Kaszyca, K.; Kowiorski, K.; Soboń, D.; Żórawski, W.; Moszczyńska, D.; Molak, R.; Pakieła, Z. Properties of Cold Sprayed Titanium and Titanium Alloy Coatings after Laser Surface Treatment. Materials 2022, 15, 9014. [Google Scholar] [CrossRef] [PubMed]
- Hussain, T. Cold Spraying of Titanium: A Review of Bonding Mechanisms, Microstructure and Properties. Key Eng. Mater. 2013, 533, 53–90. [Google Scholar] [CrossRef]
Disclaimer/Publisher’s Note: The statements, opinions and data contained in all publications are solely those of the individual author(s) and contributor(s) and not of MDPI and/or the editor(s). MDPI and/or the editor(s) disclaim responsibility for any injury to people or property resulting from any ideas, methods, instructions or products referred to in the content. |
© 2025 by the authors. Licensee MDPI, Basel, Switzerland. This article is an open access article distributed under the terms and conditions of the Creative Commons Attribution (CC BY) license (https://creativecommons.org/licenses/by/4.0/).