Article

Scratch Resistance and Damage Mechanisms Arising in Titanium Carbide–Nickel Aluminide-Based Laser DED Clads on D2 Tool Steel

by
Zhila Russell
,
Mark Yao Amegadzie
,
Achilles Marian Sonica David
and
Kevin Paul Plucknett
*
Department of Mechanical Engineering, Dalhousie University, 1360 Barrington Street, Halifax, NS B3H 4R2, Canada
*
Author to whom correspondence should be addressed.
Coatings 2025, 15(3), 330; https://doi.org/10.3390/coatings15030330
Submission received: 20 February 2025 / Revised: 7 March 2025 / Accepted: 9 March 2025 / Published: 13 March 2025

Abstract

:
TiC-based cermet clads were applied onto high-Cr-containing, cold work D2 tool steel substrates through laser-directed energy deposition (L-DED). A novel suspension-based preplacement method was used to apply the feedstock prior to laser cladding. The preplaced material was then subjected to laser processing using various laser powers (200 to 350 W) and scanning speeds (58 to 116 mm/min.), resulting in the fabrication of high-density clads on the substrates. Hardness profiles were generated by cross-sectional micro-indentation of the clad layers. Micro-Vickers hardness (HV) values of the cermet clads were measured from load–displacement curves under a range of applied normal forces, which are in the range of 265.7 to 890.3 HV. As a preliminary assessment of the wear response, a variety of single-pass scratch testing approaches were undertaken. A qualitative evaluation of ‘interface’ mechanics between the ‘clad’ and substrate material was also performed by cross-sectional scratching of the clads; as a chemical clad is developed, this effectively is assessing the transitions through the clad microstructure. Failure modes and damage mechanism were examined at different processing parameters by means of acoustic emission (AE) and coefficient of friction (COF) measurements, together with assessment of the post-test microstructures. The scratch hardness (HSp) of the cermet clads varied within the range of 4.88 to 7.58 GPa, as a function of applied normal force (ranged within 10–40 N), which was considerably higher than the D2 substrate (HSp = 3 GPa).

Graphical Abstract

1. Introduction

Ultra-high-strength steels, which are utilised in numerous applications in everyday life, are highly sensitive to damage caused by fatigue [1], wear [2], and stress corrosion cracking [3]. These types of damage, in applications with geometrically optimised components, are usually followed by costly replacement of the parts. Consequently, discovering preventive measures and feasible in situ repair strategies have been attractive scientific and industrial pursuits for many years, especially focusing on laser cladding [4,5,6] or direct ceramic particle injection into a surface melt zone [7]. Enhancement of the functional properties of steel surface by application of ceramic composite coatings has been found to be an effective technique, again using laser cladding [8,9], plasma electrolytic oxidation [10], or high-velocity oxyfuel thermal spray [11]. Ceramic particles invariably have much higher elastic modulus abrasion resistance in comparison to the majority of metals and typically maintain their mechanical integrity at elevated temperatures. A variety of deposition techniques have been previously reported, such as chemical and physical vapor deposition (CVD and PVD), plasma-based implantation, sputtering, pulsed electrode surfacing and deposition, boriding, carburisation, laser deposition, etc. However, these techniques are often expensive, require complicated procedures, long fabrication times, and often lead to fairly thin coatings. Table 1 outlines some examples of high-performance ceramic-based coatings/clads on metal substrates, their associated processing routes, and their measured hardness values and thicknesses, as reported in the open literature [12,13,14,15,16,17,18,19,20,21].
In particular, laser ‘hardening’ has been explored by a number of researchers for modification of the surface properties on hard steels. Increased wear and hardness have been reported when the surface was subjected to a high-energy laser, where high heating/cooling rates and quenching of the substrate resulted in the formation of a martensitic structure [22,23]. Laser cladding has been applied to rebuild material following removal of the damaged zone through grinding. This allows restoration of both the original dimensions and mechanical properties of the component, with particular attention to the fatigue life that can qualify for the minimum safety level. Laser cladding thus offers in situ repair of high-value components such as turbine blades, speciality tools, gas turbine parts, and internal combustion engine components [4,24].
With this in mind, the present study investigates the use of laser-based cladding for applying TiC-Ni3Al-based clads onto D2 cold worked tool steel substrate. The TiC-Ni3Al system is particularly interesting for such applications, with both TiC-Ni3Al bulk materials [21,25,26] and thermal spray coatings [11] previously having been shown to outperform WC-Co and WC-CoCr in terms of their corrosion resistance [11,24] and high-temperature strength [25], while exhibiting comparable wear behaviour at less than half the mass for an equivalent volume of material [11,21]. To the best of the authors’ knowledge, to date, there have not been any substantial laser cladding studies based on the TiC-Ni3Al system, with only HVOF- [11,27] and cold-compaction-based [28] powder metallurgy coatings being evaluated. A novel preplacement approach is developed, based on the use of an aqueous suspension of TiC-NixAly-Ni and sodium alginate as an in situ gelation aid, to facilitate a robust powder coating prior to laser cladding. Using this dip-coating approach allows moderately complex-shaped components to be coated with the feedstock material, which is much more challenging to achieve with dry-powder preplacement. Furthermore, an important benefit of utilising suspension-based preplacement is that the effective powder solid loading in the suspension is significantly greater (i.e., 50 vol.% solids) than when using dry powder (typically 3 to 5 times higher when using micron-sized feedstock powders). The present work subsequently investigates the effects of laser cladding parameters on the microstructures and micro-mechanical/tribological behaviour of the clad D2 substrates. The importance of tribological characterisation for 3D printed metals has been highlighted in a recent review [29]. In the present case, this is achieved through scratch testing both on the clad surface and through the clad region.

2. Experimental Procedures

2.1. Materials

The present TiC-Ni3Al cermet formulations were prepared by mixing TiC powders and the constituent precursors to form the intermetallic Ni3Al binder phase through a reaction sintering approach; in this instance, a mixture of NixAly and Ni was employed. The final Ni3Al content in the mixtures was targeted from 30 to 50 vol% of the overall cermet composition; however, it is anticipated that there will be some dilution during laser processing. The TiC powder (lot no. PL20126240; with a manufacturer specified particle size of 1.0–2.0 µm) used in this work was procured from Pacific Particulate Materials Ltd. (Vancouver, BC, Canada), while both the Ni powder (lot no. L10W013; with a manufacturer-reported particle size of 2.2–3.0 μm) and NixAly powder (lot nos. D28 × 029 and G19X071, respectively, where each lot was noted with a manufacturer-specified D50 = 32 μm) were purchased from Alfa Aesar (Ward Hill, MA, USA); it should be noted that the NixAly powder exhibited a 1:1 weight ratio between Ni and Al. After weighing the starting materials, each examined cermet composition was ball milled for 24 h with yttria-stabilised zirconia milling media in acetone, followed by a 24 h drying period. The dried powders were subsequently sieved through a −75 μm stainless steel mesh screen, to eliminate any potential hard agglomerates. The laser clads were fabricated onto annealed and precision-ground D2 tool steel plates supplied from McMaster-Carr (Douglasville, GA, USA). The substrate specimens were sectioned into a final geometry of 75 × 50 × 5 mm and were subjected to abrasive grit blasting with a 300 μm zirconia shot prior to preplacement of the cermet feed material, as follows.
Stable, aqueous cermet suspensions with 50 wt.% solid loading were then developed from a solution of 1.6 wt.% sodium alginate and distilled water, with 0.1 vol.% Darvan® C-N (Vanderbilt Minerals LLC, Norwalk, CT, USA) added as a dispersant. The suspension pH was then adjusted to a value of 8.5 using a solution of NaOH; it has previously been shown that this pH/dispersant combination results in low-viscosity, high-solid-content TiC suspensions [30]. The cermet/alginate suspension was subsequently homogenised on a magnetic stir plate for an average of 3 h at 385 rpm and then vacuum-degassed. An ‘in-house’ dip-coating apparatus, with a linear driven stage in the vertical direction, was designed and employed for preplacement of feed material on the substrate by a simple dip-coating approach. The part to be dip-coated is then lowered into the stabilised suspension. Precise control of withdrawal speeds at 0.05 mm/s (at an angle of 90° to the suspension surface) was obtained via a control board interfaced to an Arduino controller (Arduino AG, Ivrea, Italy). The D2 tool steel coupons were immersed and withdrawn from the coating suspension, with the long dimension of the coupon oriented parallel to the direction of withdrawal. After dip-coating, the substrates were dried at 20 ± 3 °C for 24 h prior to laser cladding. This process gave rise to adhered powder coatings that were roughly 200 to 250 µm in thickness. Figure 1 shows an example of a coated coupon prior to L-DED cladding. The chemical compositions of the coating feedstock mixtures and D2 steel substrate are provided in Table 2 and Table 3, respectively.

2.2. Laser Cladding

Following dip-coating and drying, the preplaced cermet coatings were laser-clad onto D2 substrates using an Optomec MTS 500-CA LENS system equipped with a 1 kW ytterbium-doped fibre laser (IPG Photonics; λ = 1070 nm), integrated with a five-axis CNC vertical machining centre to control the velocity of the workpiece. The segmented 3D model of targeted clad dimension was generated via Mastercam Mill 2019 software, coupled with the available L-DED system. A laser spot size diameter (D) of ~780 µm was achieved at a standoff distance set to 7.9 mm, under an argon atmosphere with oxygen content < 10 ppm. The effect of test parameters was assessed under initial applied values of laser power (P) of 200, 250, 300, and 350 W. Similarly, the scanning speed (V) was varied between 58 and 116 mm/min. for each of the evaluated laser powers. The outlined parameters were derived based on preliminary studies of a slightly wider parameter range, with conditions outside of these ranges showing either poor clad generation or excess dilution. A hatch spacing of 500 µm was used for all laser clad trials. The laser beam moved above the preplaced, suspension-coated substrate at pre-determined interaction times (τ), in seconds, as defined in Equation (1) [31]:
τ = D V

2.3. Microstructural Characterisation

Following laser processing, the clad samples were sectioned perpendicular to their planar surface, using a precision saw, and were then mounted prior to grinding/polishing down to a 0.25 µm final diamond paste particle size. The general appearance of the clads and three-dimensional measurements of the surface were performed on both the as-printed and mechanically tested specimens using 3D confocal laser scanning microscope (CLSM; VK-X200/X210, Keyence, Mississauga, ON, Canada). Microstructural characterisation was conducted using optical microscopy (OM; Olympus BX-51, Olympus Corp., Tokyo, Japan) and field emission scanning electron microscopy (FE-SEM; Model S-4700, Hitachi High Technologies, Tokyo, Japan). Compositional analysis was performed in the FE-SEM using energy dispersive X-ray spectroscopy (EDS; Inca X-maxN, Oxford Instruments, Concord, MA, USA). Moreover, EDS analysis was used to analyse the clad zone in order to observe and report the dilution, instead of using a more conventional method that measures the dilution simply by clad dimensional characteristics [32,33]. FE-SEM imaging, in conjunction with CLSM observations, was performed on multiple clad layers for verification of the clad dimensions and their related surface roughness. Additionally, electron backscattered diffraction (EBSD) was utilised in the FE-SEM for a more complete understanding of the represented phases, grain morphology, and crystallographic texture of clad cross-sections. Initially, the sample surface was ground through a series of silicon carbide (SiC) abrasive papers, following 320, 400, 600, 800, and finally 1200 grit sizes. This was followed by polishing through 15 μm, 3 μm, and 1 μm diamond suspensions, and finally a 0.05 μm colloidal SiO2 step; this overall process took approximately 1.5 h. EBSD analysis was later performed using the same Hitachi FE-SEM, operated with a Nordlys Oxford Instruments EBSD detector. The sample was tilted to an angle of 70° relative to the original orientation (i.e., perpendicular to the electron beam axis) to ensure optimal data collection by the detector. A step size of 1.5 μm was used during EBSD analysis to index the sample. After EBSD data acquisition, the EBSD map was refined by extrapolating wild spikes. Subsequently, a moderate level of zero solution extrapolation was applied to obtain the final EBSD compositional map.
Laser processing parameters are often simplified into a singular energy input for a given build volume. The magnitude of energy output within a specified unit of length value of energy density, ED, is calculated based on volumetric energy density [34], derived from those utilised in laser powder bed fabrication (Equation (2)):
E D = P V H Z
where P is the laser power and V is the laser traverse rate (as before), H is the line hatch spacing of adjacent laser raster tracks, and Z is the layer thickness (z-step size). In the present case, the determined ED value is used to compare clads fabricated with different build parameters but potentially similar ED values. Microstructural parameters that are determined from the clad cross-sections are shown schematically in Figure 2.
X-ray diffraction (XRD) was also performed on both dip-coated D2 surfaces, prior to laser heating, and clad surfaces after laser heating, using a Bruker D9 Advance XRD system (Bruker AXS, Madison, WI, USA). In the second instance, the surface was lightly polished to ensure it was flat for XRD.

2.4. Mechanical Testing

2.4.1. Micro-Vickers Indentation

Vickers hardness analysis was conducted based on ASTM E2546 [35] using an instrumented indentation system (Nanovea® PB1000, Nanovea Inc, Irvine, CA, USA). Indentations were performed by application of a linearly increasing normal load to a fixed final load, prior to unloading to the initial position. The examined operating conditions for the Vickers indentation experiments are listed in Table 4. Indentation tests were performed on cross-sections of the clad specimens, where the clad/substrate interfaces were imbedded perpendicularly in a Bakelite resin disc; both ends of the clad sample were exposed on either side of the Bakelite block, and both faces were subjected to sequential polishing to achieve an average surface roughness of Ra ≤ 10 nm prior to the indentation procedure. Indentations were then performed in three regions relative to the clad structure: top, intermediate, and near the clad/substrate (zones 1, 2, and 3, respectively, as shown schematically in Figure 2), where each is spaced relative to the previous indent at a separation distance determined by multiplying the generated indentation depth by 10.
The indentation hardness (H) was subsequently determined from the recorded load–displacement curves, and then verified through diagonal measurement in the SEM. Two specimens were tested from each cladding category, with five separate indentations at each load for defined regions: top, intermediate, clad/substrate interface; these are subsequently referred to as zones 1, 2, and 3, respectively. Indentation loads of 1, 3, and 5 N applied normal force were used in each case. Microstructural observations were subsequently performed on the indented surfaces to observe plastic deformation and potential crack formation.

2.4.2. Scratch Test Procedure

Micro-scratch-hardness tests were performed using a Universal Micro Tribometer (UMT-1; CETR, Campbell, CA, USA), using a diamond stylus with apex angle of 120 ± 5°, and a nominal tip radius of 200 μm. The test was conducted with reference to the standards ASTM G171-03 [36] and ASTM C1624-05 [37]. A schematic representation of the experimental setup to assess the scratch properties of the clads is presented in Figure 3. Measuring the scratch width, one can define the sample scratch hardness [38], as follows (Equation (3)):
H S p = k F z W 2
where k is a constant, Fz is the normal force on the stylus in grams, and W is the scratch width (in µm); this equation then provides the scratch hardness number (in GPa). For scratch testing, the coefficient of friction (COF) is obtained dynamically throughout the test. In addition to evaluating the COF vs. time response, the presented data also show examples of the mean COF values, which are obtained by averaging over the stable friction region.
The scratch hardness of a material was determined by producing a 5 mm long scratch on the sample surface under a series of constant loads (5, 10, 20, 30, and 40 N), which were applied in three different directions (x, y, and z) with respect to the laser scanning path for the cermet-based clads. Cross-sectional scratches were utilised, which are generally performed to examine the adhesive characteristics of brittle coating systems [38,39]; this procedure was conducted in the present work in order to observe the variation in scratch resistance within the respective cross-sectional clad zones, while also highlighting if any brittle failure arose within the ceramic-rich surface zone of the clads. The width of the scratches was then determined by profiling with the CLSM for scratches generated in both directions on the clad D2 substrates (with the procedure outlined in Figure 3).
A schematic diagram of the generated scratches, with respect to their orientations on the clad specimen, is provided in Figure 3b. The frictional force (µ) and resultant acoustic emission (AE) signals during each scratch pass were measured continuously during the tests. Each scratch measurement was repeated at 5 locations for each sample, to ensure the reproducibility of the results. A semi-quantitative measure of coating/clad adherence, the critical load (LC), and the generated failure mode(s) were verified by performing a series of microstructural analyses in relation to the obtained scratch data. Subsurface cracking and other possible interlayer events detected by AE were further examined using focused ion beam microscopy (FIB; Model F-2000A, Hitachi High Technologies, Tokyo, Japan), sectioning into the scratch track in order to view the sub-surface cross-sections.
Through thickness, stacked CLSM images, and associated metrology measurements, along with FE-SEM images, were used to generate an understanding of the deformation and failure mechanisms of the L-DED clad layers in relation to the processing parameters. In this context, widths of generated scratch tracks (W) were accurately measured using CLSM for calculation of scratch hardness values. A minimum of three scratch tracks were assessed for each process condition/orientation combination examined.

3. Results and Discussion

3.1. Directed Energy Deposition Laser Cladding

The laser processing parameters explored for determining optimum laser cladding conditions are presented in relation to the resultant ED and surface roughness of the composite clads in Figure 4. Calculated values for ED obviously decreased when the laser in reaction time decreased where, in contrast (Figure 4a), higher surface roughness was observed (Figure 4b). Similar results have been reported by previous authors working on laser cladding [40,41]. AM components are often represented by the quality of their printed surfaces. Nevertheless, it is well known that laser cladding typically generates high surface roughness and often requires post-processing steps. It is worth mentioning that only sound clads, with the potential for being utilised without any post-processing steps, were included in the measurements of surface roughness values in the present work; as a consequence, the subsequent evaluation of mechanical behaviour focuses on clads obtained at 300 and 350 W laser power. It is also apparent, and later confirmed in cross-sectional imaging, that these clads show a comparatively low surface roughness (Figure 4b).
Examples of surface morphologies related to various ED values are shown in Figure 4c–f. Macro-characterisation of the as-processed samples, by means of CLSM measurements, revealed that successful clad layers were built within the narrow range of 300 to 350 W laser power and 0.84 to 6.77 mm/s laser scanning speed. As a consequence, only clads obtained at these two laser powers are discussed in further detail. The surface roughness of the fabricated clads was strongly dependent on the calculated ED, where visibly smother surfaces were observed at higher ED values (i.e., >150 J mm−3), reaching the lowest roughness (Ra = 3–3.5 μm). At lower calculated ED values, the resultant clads exhibit an irregular surface, with uneven scan lines and cavities between tracks, as shown in Figure 4c.
Figure 5 demonstrates a typical clad cross-section, examined using SEM, demonstrating typical clad thickness values of 160 to 240 µm. Figure 6 presents CLSM optical micrographs of the near-surface transverse cross-sections of fabricated clads processed at various laser powers and scanning speeds, resulting in different levels of ED. From these (and similar) optical images, it is possible to see that the laser power and scan speed both play a crucial role in clad formation, and clad quality/microstructure. At V = 6.77 mm/s and P = 300 W laser power, with resulting τ = 0.5 s (shown in Figure 6a), a large volume of unmelted particles was observed. However, at a lower scanning speed, V = 3.38 mm/s, presented in Figure 6b, τ was effectively increased to 0.9 s, resulting in the formation of fully remelted and solidified microstructures that contain a minimal number of pores and defects. As shown in Figure 6c, increasing the laser power to 350 W, for the same scanning speed, effects the kinetics of melt pool generation in a positive manner, with the formation of homogeneously nucleated hard particles. Subsequently, as shown in Figure 6d, at longer beam interaction time (i.e., τ = 1.6 s), formation of dendritic structure is observed.

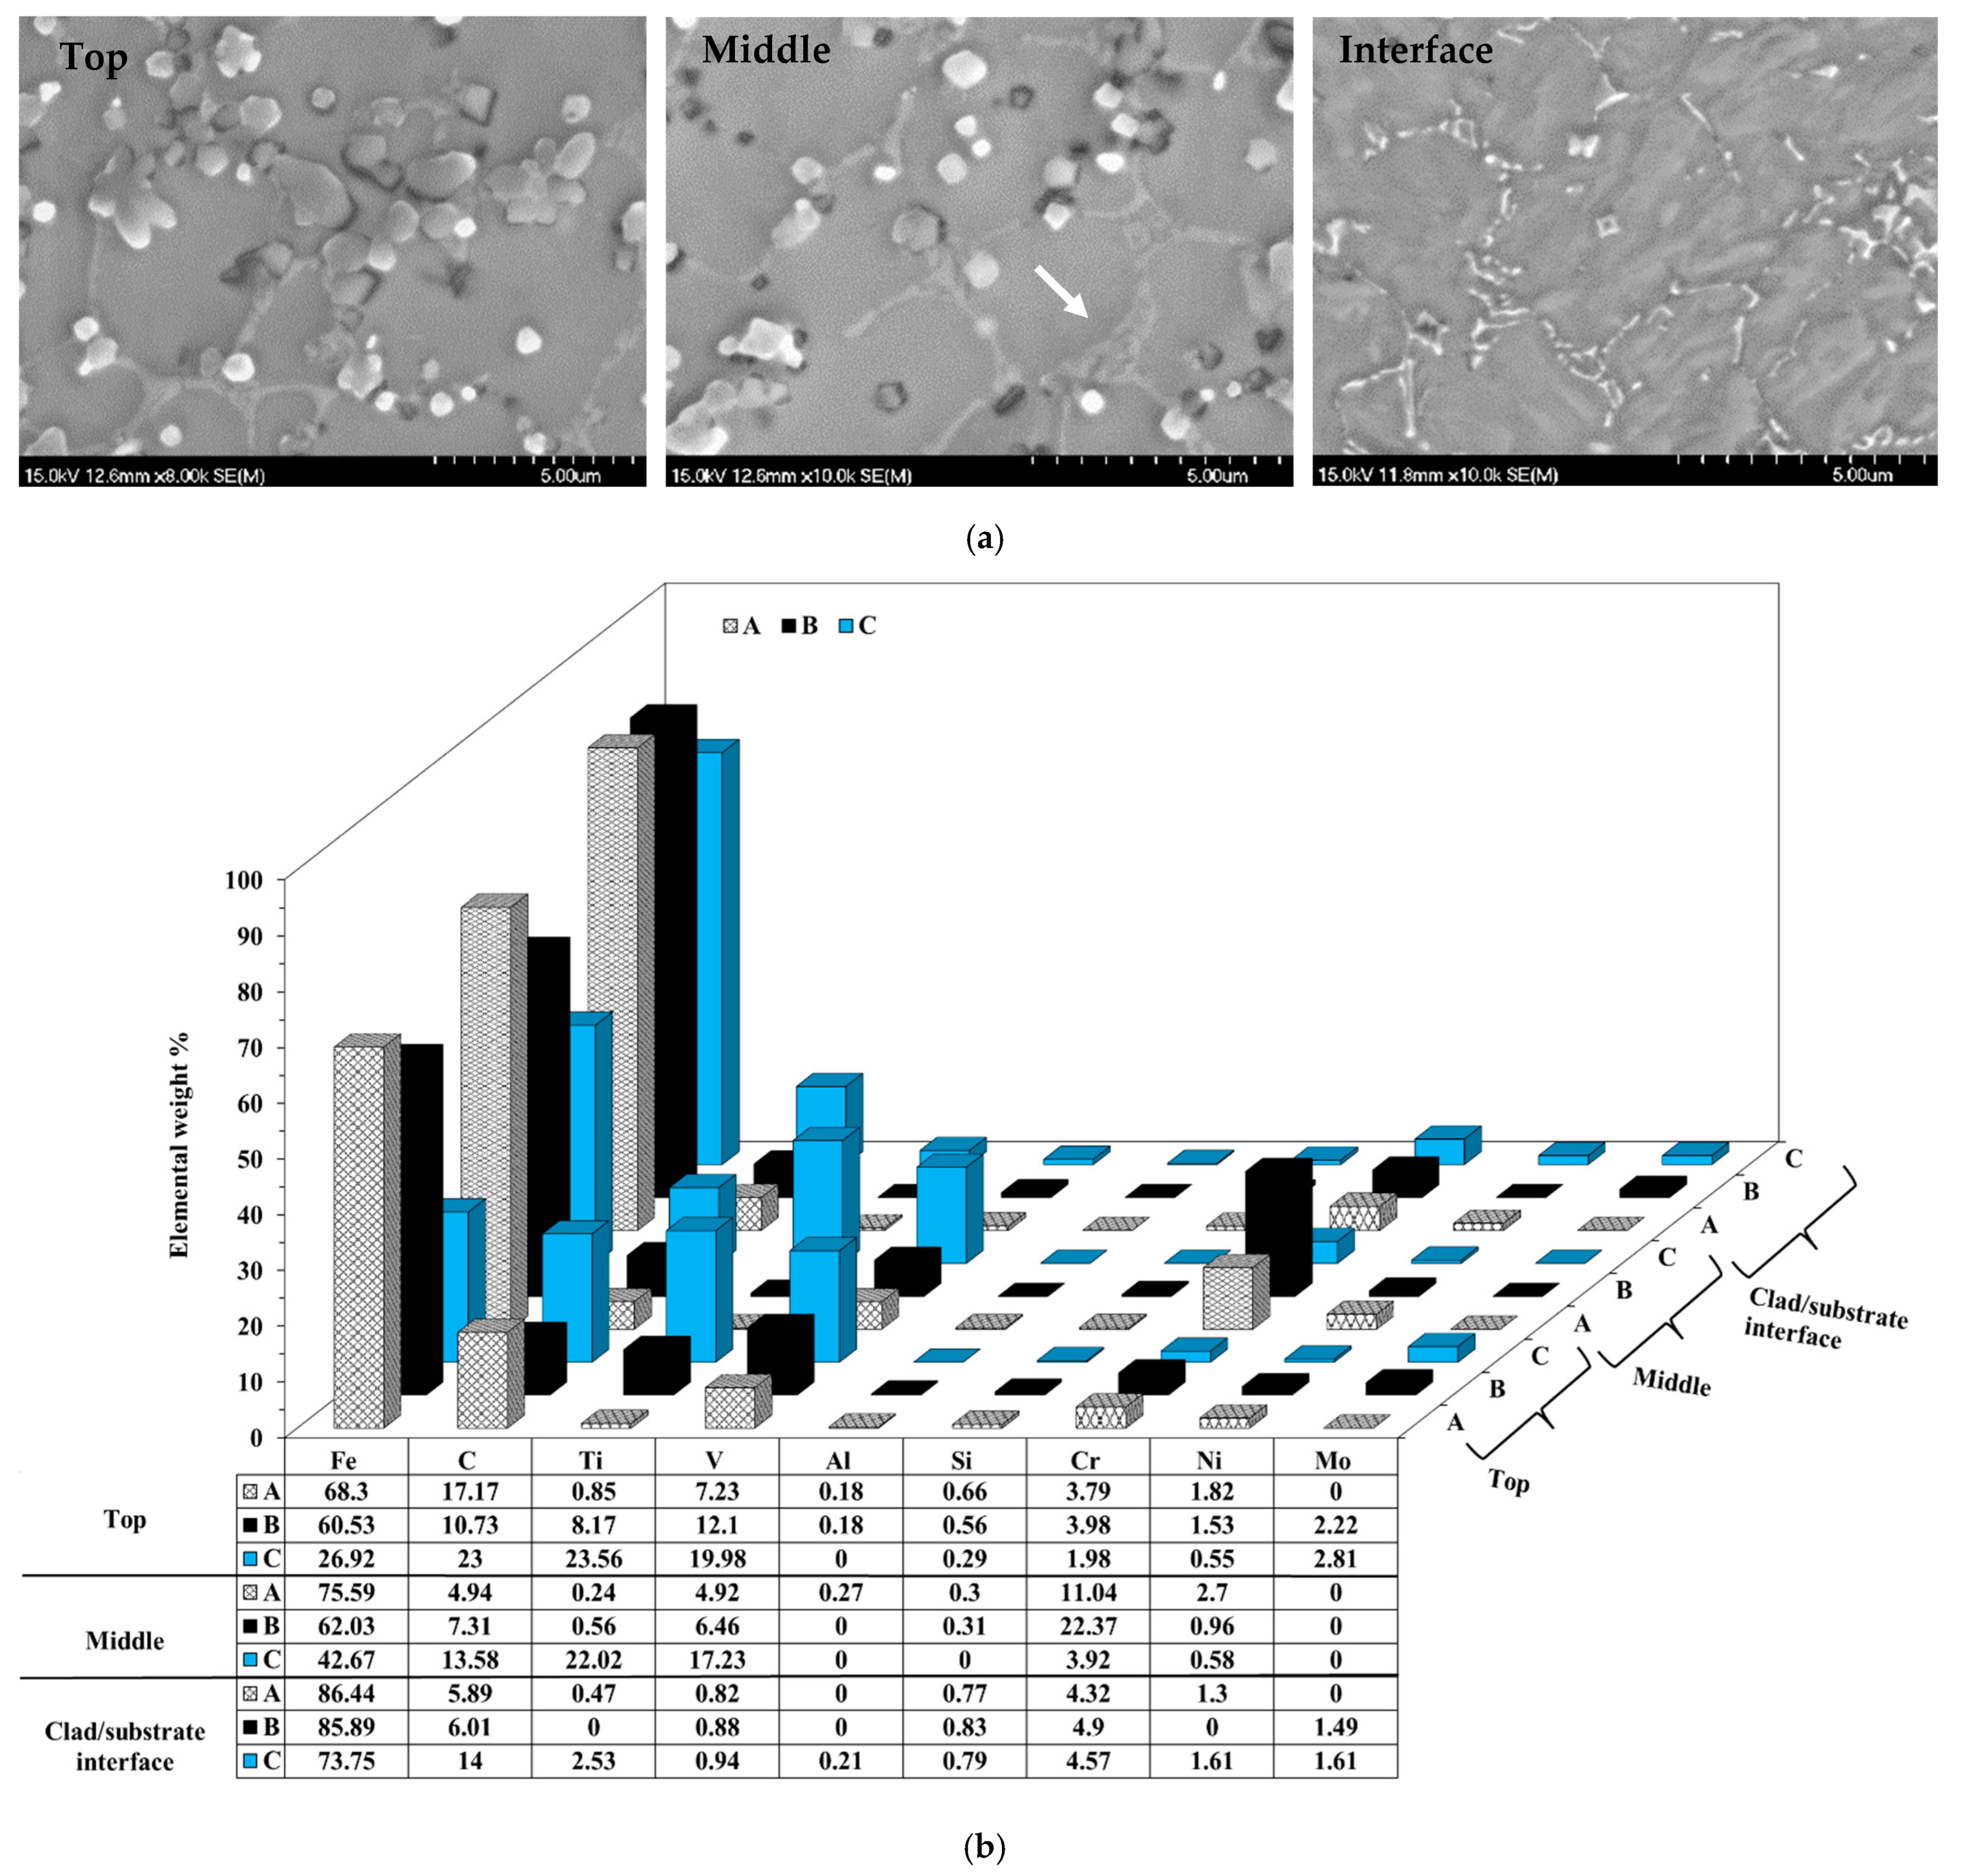
3.2. Microstructural and Phase Analysis

Figure 7 presents SEM micrographs obtained from the polished cross-section of a laser-deposited layer (P = 350 W and τ = 1.4 s), highlighting the main clad zones (top, middle, clad/substrate interface, and the underlying heat-affected zone), in respect to the substrate and the central axis of the beam diameter. These cross-sectional SEM micrographs reveal the formation of a high-density clad layer on the surface of the substrate that is well bonded and contains no microcracks. It is also apparent that there is clear dilution of the nominal TiC-Ni3Al preplaced clad composition, as the apparent TiC content is visibly reduced; this dilution effect is discussed in greater detail below. The general microstructure throughout the clad layer exhibits a mix of columnar and equiaxed structure, which can be anticipated to form at different cooling rates. The carbide network consists of M2C/M6C and MC carbides in the form of both columnar and near-equiaxed grain structures, which also change in size and morphology as the distance from the substrate decreases. At the bottom region of the clad, continuation of the substrate lattice structure presents a heat-affected zone region (HAZ) that can grow into the clad. This type of microalloying can provide a complete metallurgical bond between the clad and substrate. From observations of the morphology generated for P = 350 W and τ = 1.4 s, the levels of residual porosity were reduced essentially down to zero.
Microstructural evaluation of the clads fabricated at various laser scanning speeds revealed that any size refinement of the hard carbide phase is closely correlated with the laser scan speed. This is attributed to reduced irradiation time and the resultant energy absorbed into the melt pool. Therefore, an increased solidification rate results in the formation of a finer microstructure and minimal dendritic growth of TiC particles. Similar results have been observed by other research groups, suggesting that faster cooling rates due to higher extraction of energy by the substrate, and therefore formation of a finer microstructure, result from use of increased laser scanning speed [42,43,44]. The average distribution of the solidified phases and their chemical compositions within the TiC-based clad on D2 steel (P = 350 W and τ = 1.4 s), with respect to depth from surface, was verified through combined EBSD and EDS analysis; this information is provided in Figure 8 and Figure 9. As demonstrated in Figure 8, discrete chemical phases are contained through the depth of the clad layer, observed through a phase map obtained from EBSD analysis. The EBSD phase map features three colours, specifically green, red, and yellow, which were selected during the analysis and correspond to FCC iron, TiC, and NiAl, respectively. These observations are further confirmed by X-ray diffraction, shown in Figure 10, which compares the dip-coated surface prior to laser cladding (Figure 10a) with that obtained after cladding (Figure 10b). The XRD demonstrates the retention of TiC, dilution by the D2 steel substrate while molten, and retention of NiAl (rather than formation of Ni3Al). In this instance, reaction of the elemental Ni directly with the steel is likely.
Furthermore, the phase map (Figure 9) reveals a texture predominantly comprised of the green colour, which conforms to the D2 substrate on which the clad was generated. The distribution of TiC-NiAl was characterised by red and yellow colours, indicating that the clad was reasonably coherent. In this sense, no islands of TiC or Ni3Al only were observed within any particular zone of the D2 substrate (green colour). This figure shows that NiAl is homogeneously distributed in the form of equiaxial grains. The presence of NiAl highlights decomposition of the original Ni3Al components, with the extra Ni incorporated into the ferrous matrix. Furthermore, it is apparent that there is significant dilution of the pre-placed TiC-Ni3Al material, with the substrate ferrous matrix intimately mixed with the TiC. The top portion of the clad demonstrates the presence of the preplaced feed stock constituents of TiC, Ni, and Al, in addition to the aforementioned Fe content (~70 wt.%), as shown in Figure 9; this highlights the moderately high degree of dilution of the clad by the substrate. With the exception of Mo, which was only detected at the clad/substrate interface, high concentrations of the main D2 alloying elements, namely, V and Cr (~5.8 and ~5.5 wt.%, respectively), were also detected near the surface of the clad layer. The middle portion of the clad cross-section was found to maintain the approximate elemental composition of the top of the clad, with a homogeneous dispersion of the hard phases (as shown in Figure 8 and Figure 9b). Compositional analyses on the clad/substrate interface, slightly above the HAZ, demonstrated the presence of higher Fe content (~83 wt.%), while the concentrations of Ti, C, Ni, Al, and V were simultaneously reduced. The average content of C through the depth of clad layer was relatively constant, which with the recorded decrease for the Ti content resulted in an increase in C:Ti ratio as the clad depth increased (Figure 9b). Again, these overall observations confirm the dilution effect of the substrate on the initial surface powder composition.
The phases present through the depth of the clad structure were further verified by high-magnification SEM and compositional EDS analysis (Figure 11). The cross-sectional morphology and compositional variation indicated that within each clad zone, there are three distinct phases: metallic matrix (region A), primary carbides (B), and secondary hard phases (C), as shown in Figure 11a. The metallic matrix (A) is formed during the fast solidification of Fe solid solution, supersaturated with up to 0.85 wt.% Ti, 0.18 wt.% Al, and 1.82 wt.% Ni, in addition to Cr and V (3.79 and 7.23 wt.%, respectively). In the mid-clad zone, the elemental concentration of the metallic matrix exhibited an increase in Fe, Cr, Ni, and Al, while the concentrations of Ti and V were reduced. At the clad/substrate interface, the elemental composition of the metallic matrix was characterised with further reduction in the initial TiC-Ni3Al cermet components, while the concentration of Fe and its alloying elements was increased further toward the composition of the as-received D2 substrate. The primary carbide phase, which is denoted as (B) in Figure 11a, was composed of 60.5 wt.% Fe, V, Ti, Cr, Si, Al, and Mo near the top surface of clad cross-section. At the mid-section of the clad layer, no Mo or Al was detected in the structure of primary carbides (Figure 11b), while reduction in the Ti, C, Ni, V, and Si concentrations coincided with a significant increase in Cr content. No traces of the original cermet composition (i.e., Ti, C, Ni, or Al) were detected within the composition of the primary carbide phase at the clad/substrate interface and (B) was mainly composed of Fe, C, Mo, V, Si, and Cr with lower concentration, in comparison to those recorded for middle of the clad layer. The microstructure of secondary carbides occurring at various clad depths (i.e., top, middle, clad/substrate interface) is denoted with (C) in Figure 11a.

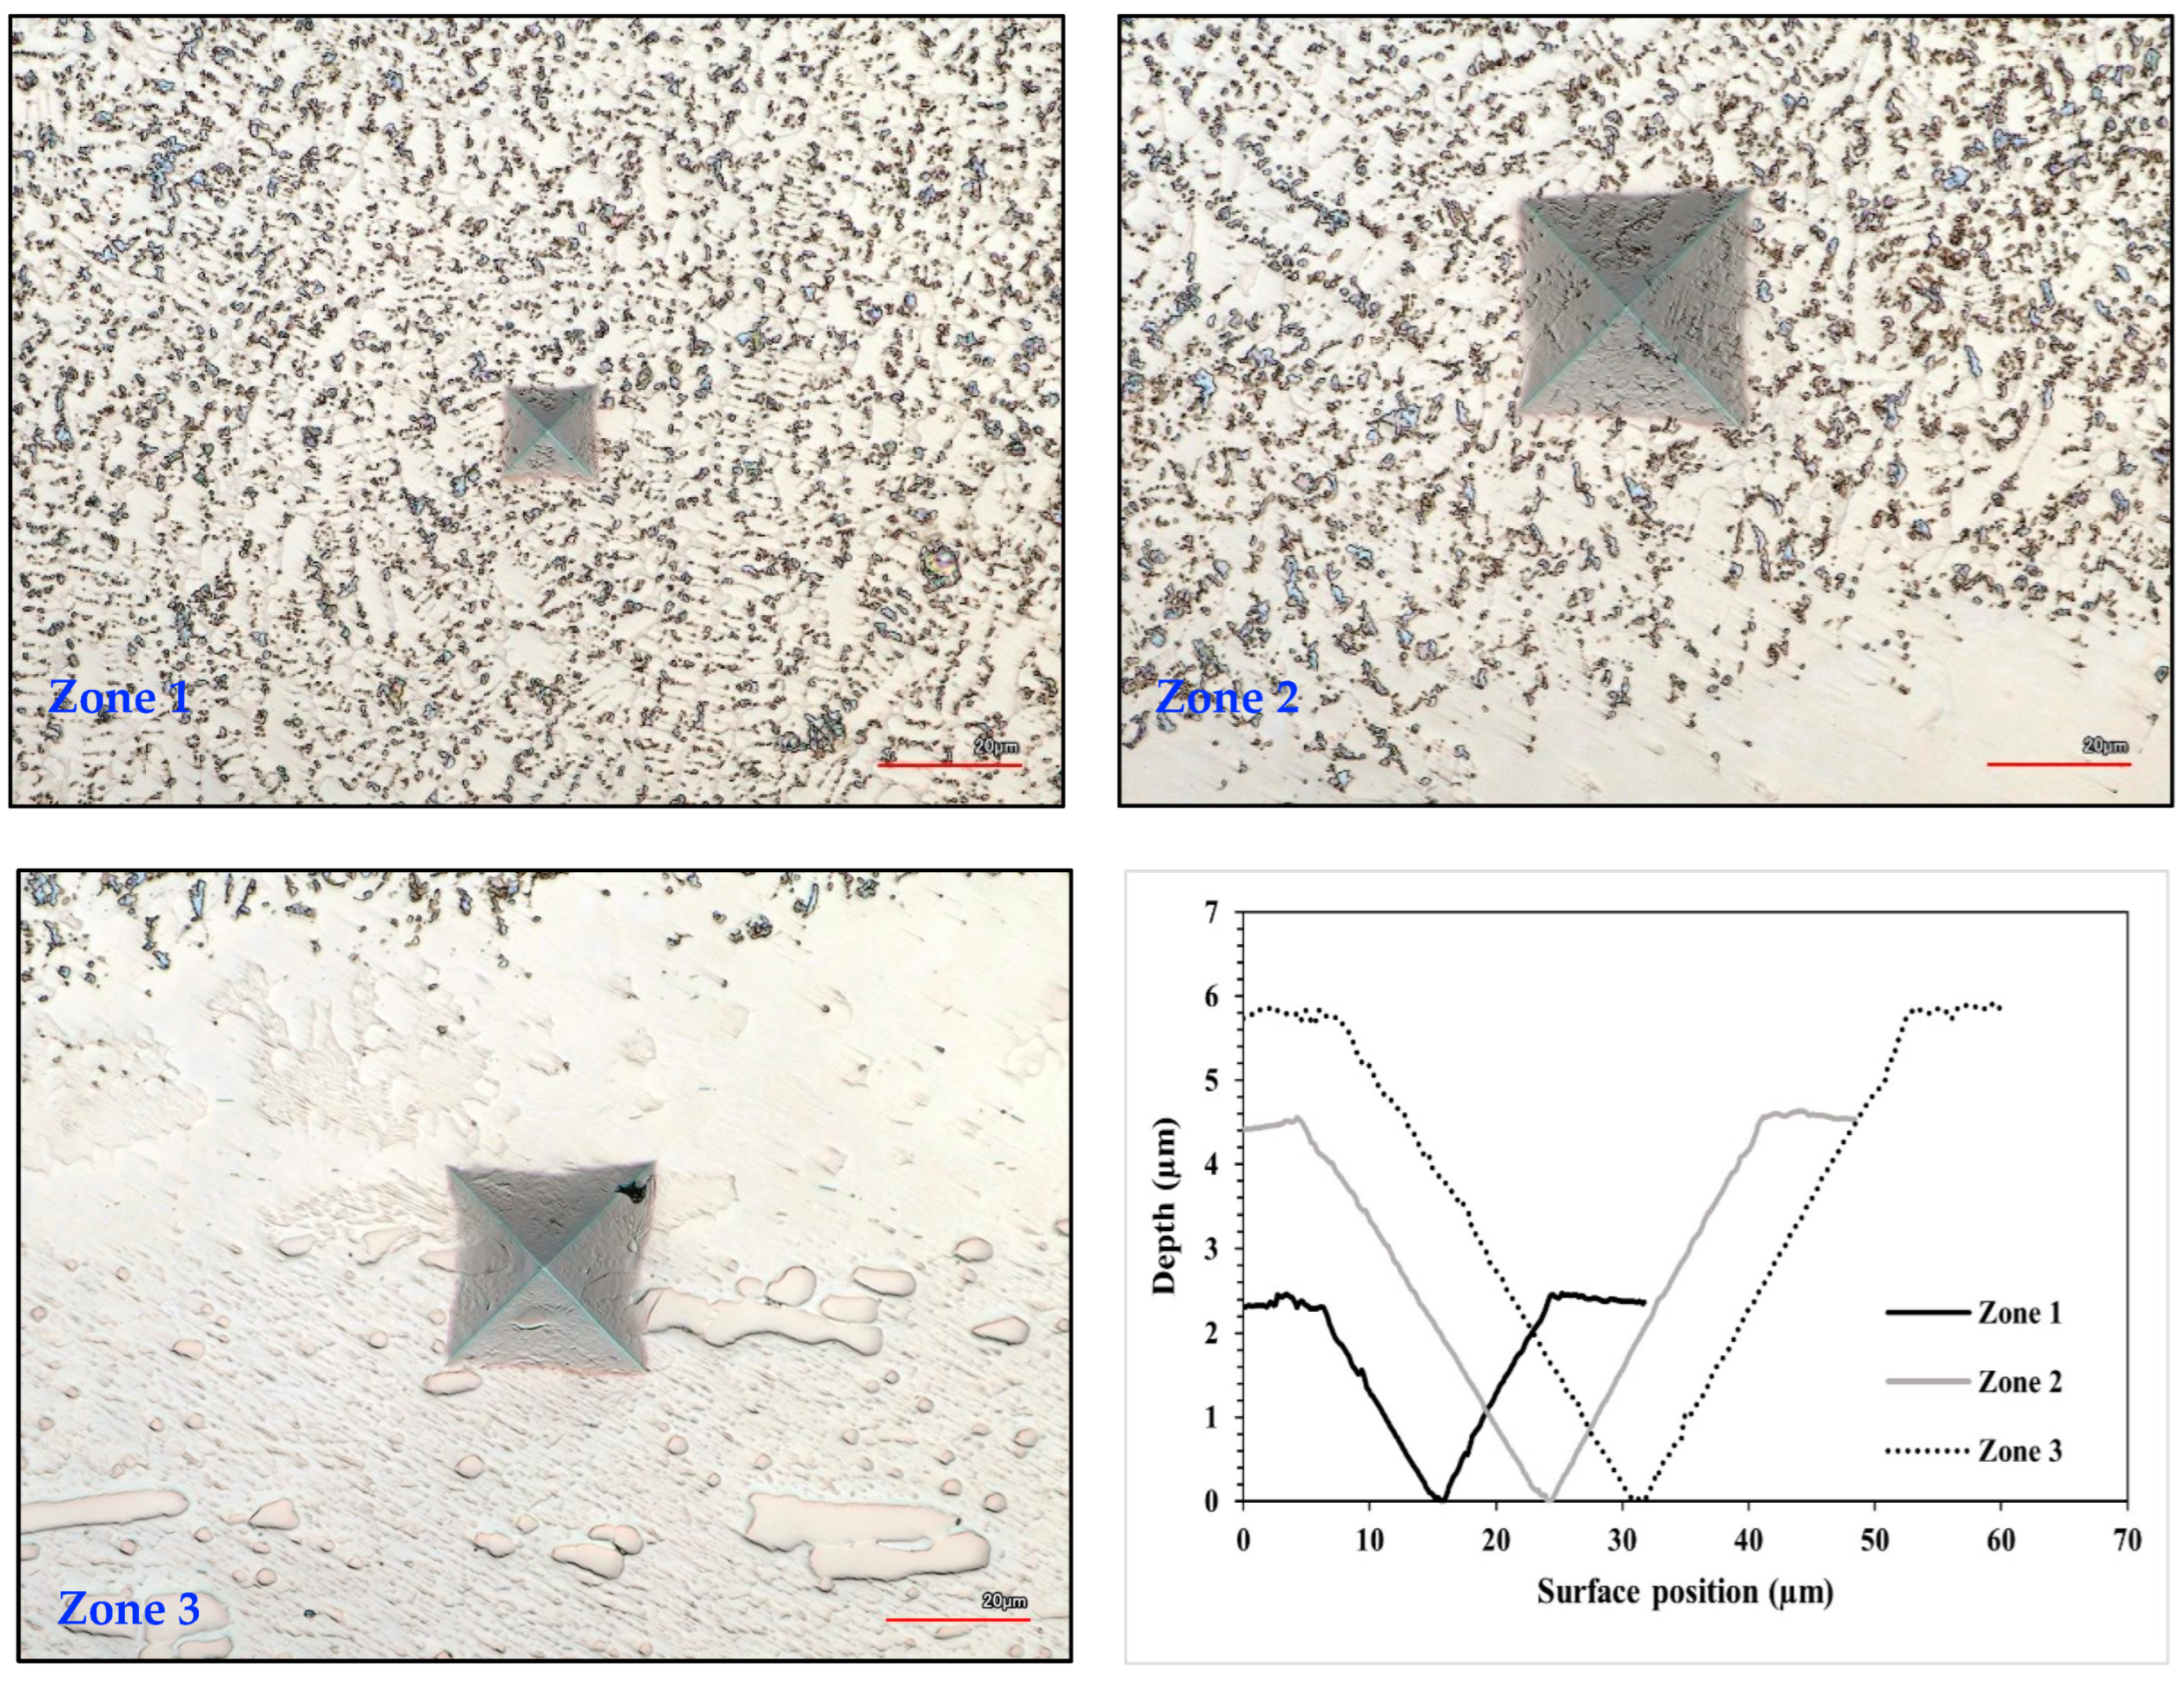
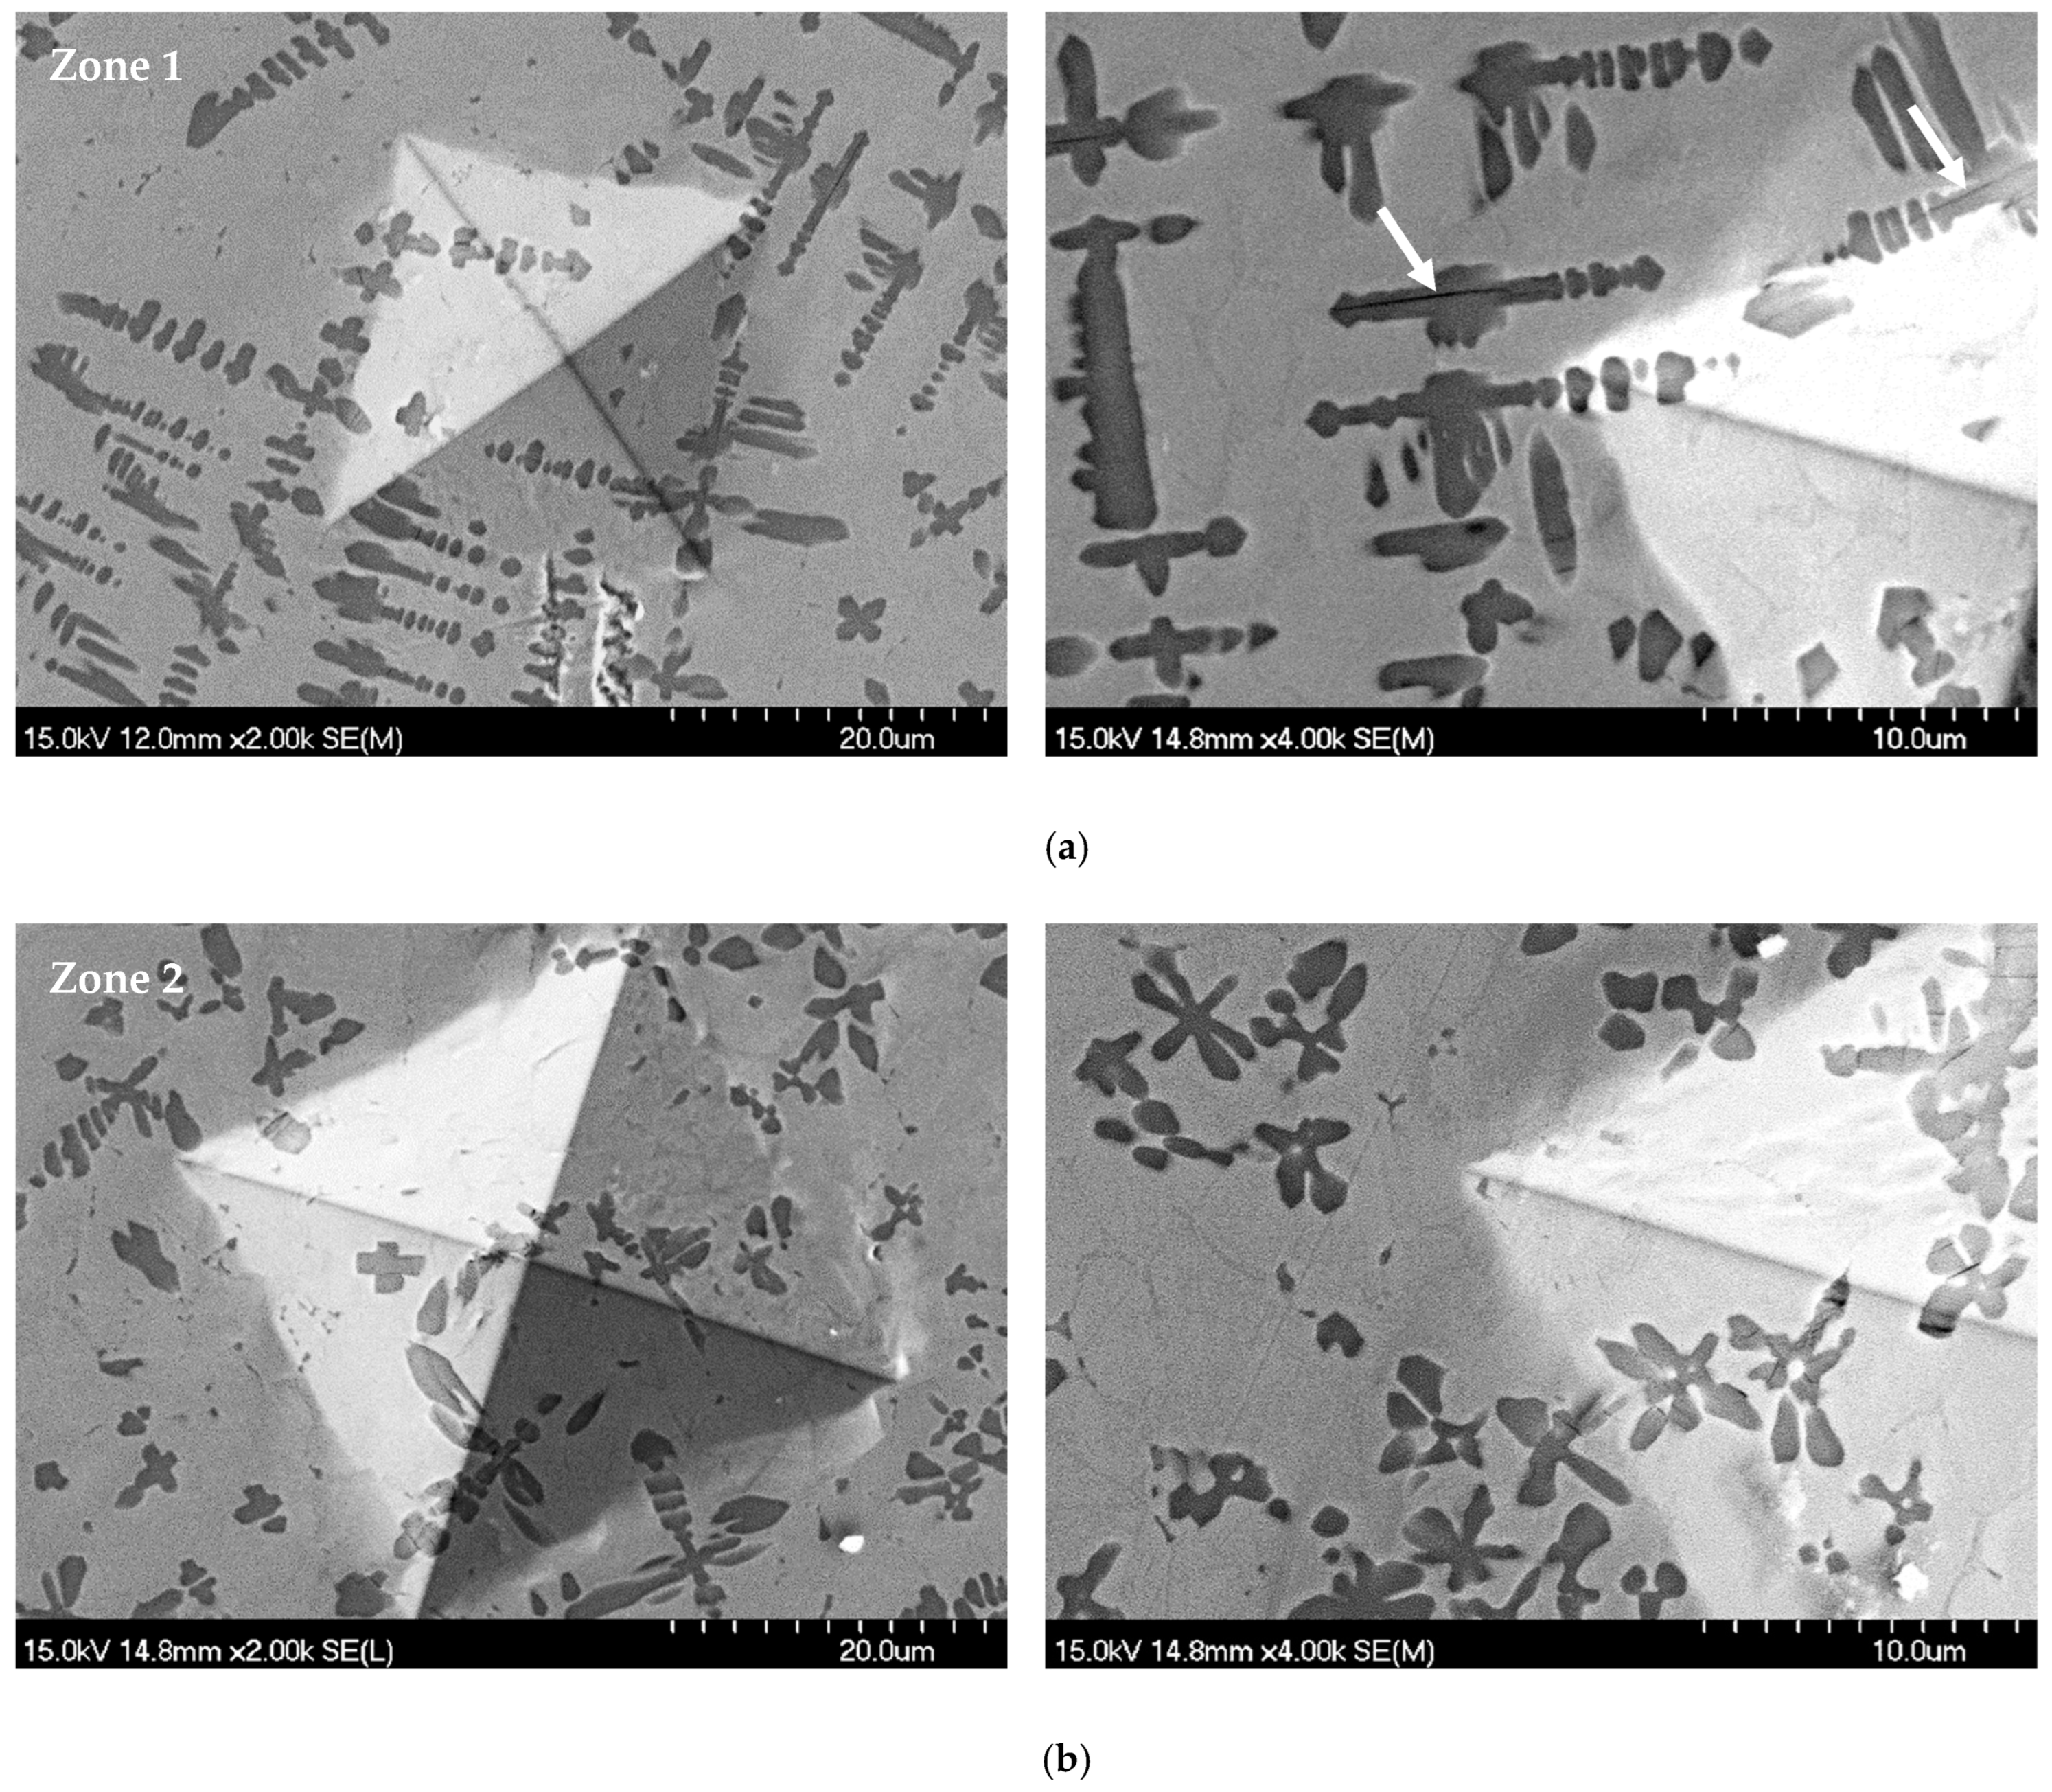
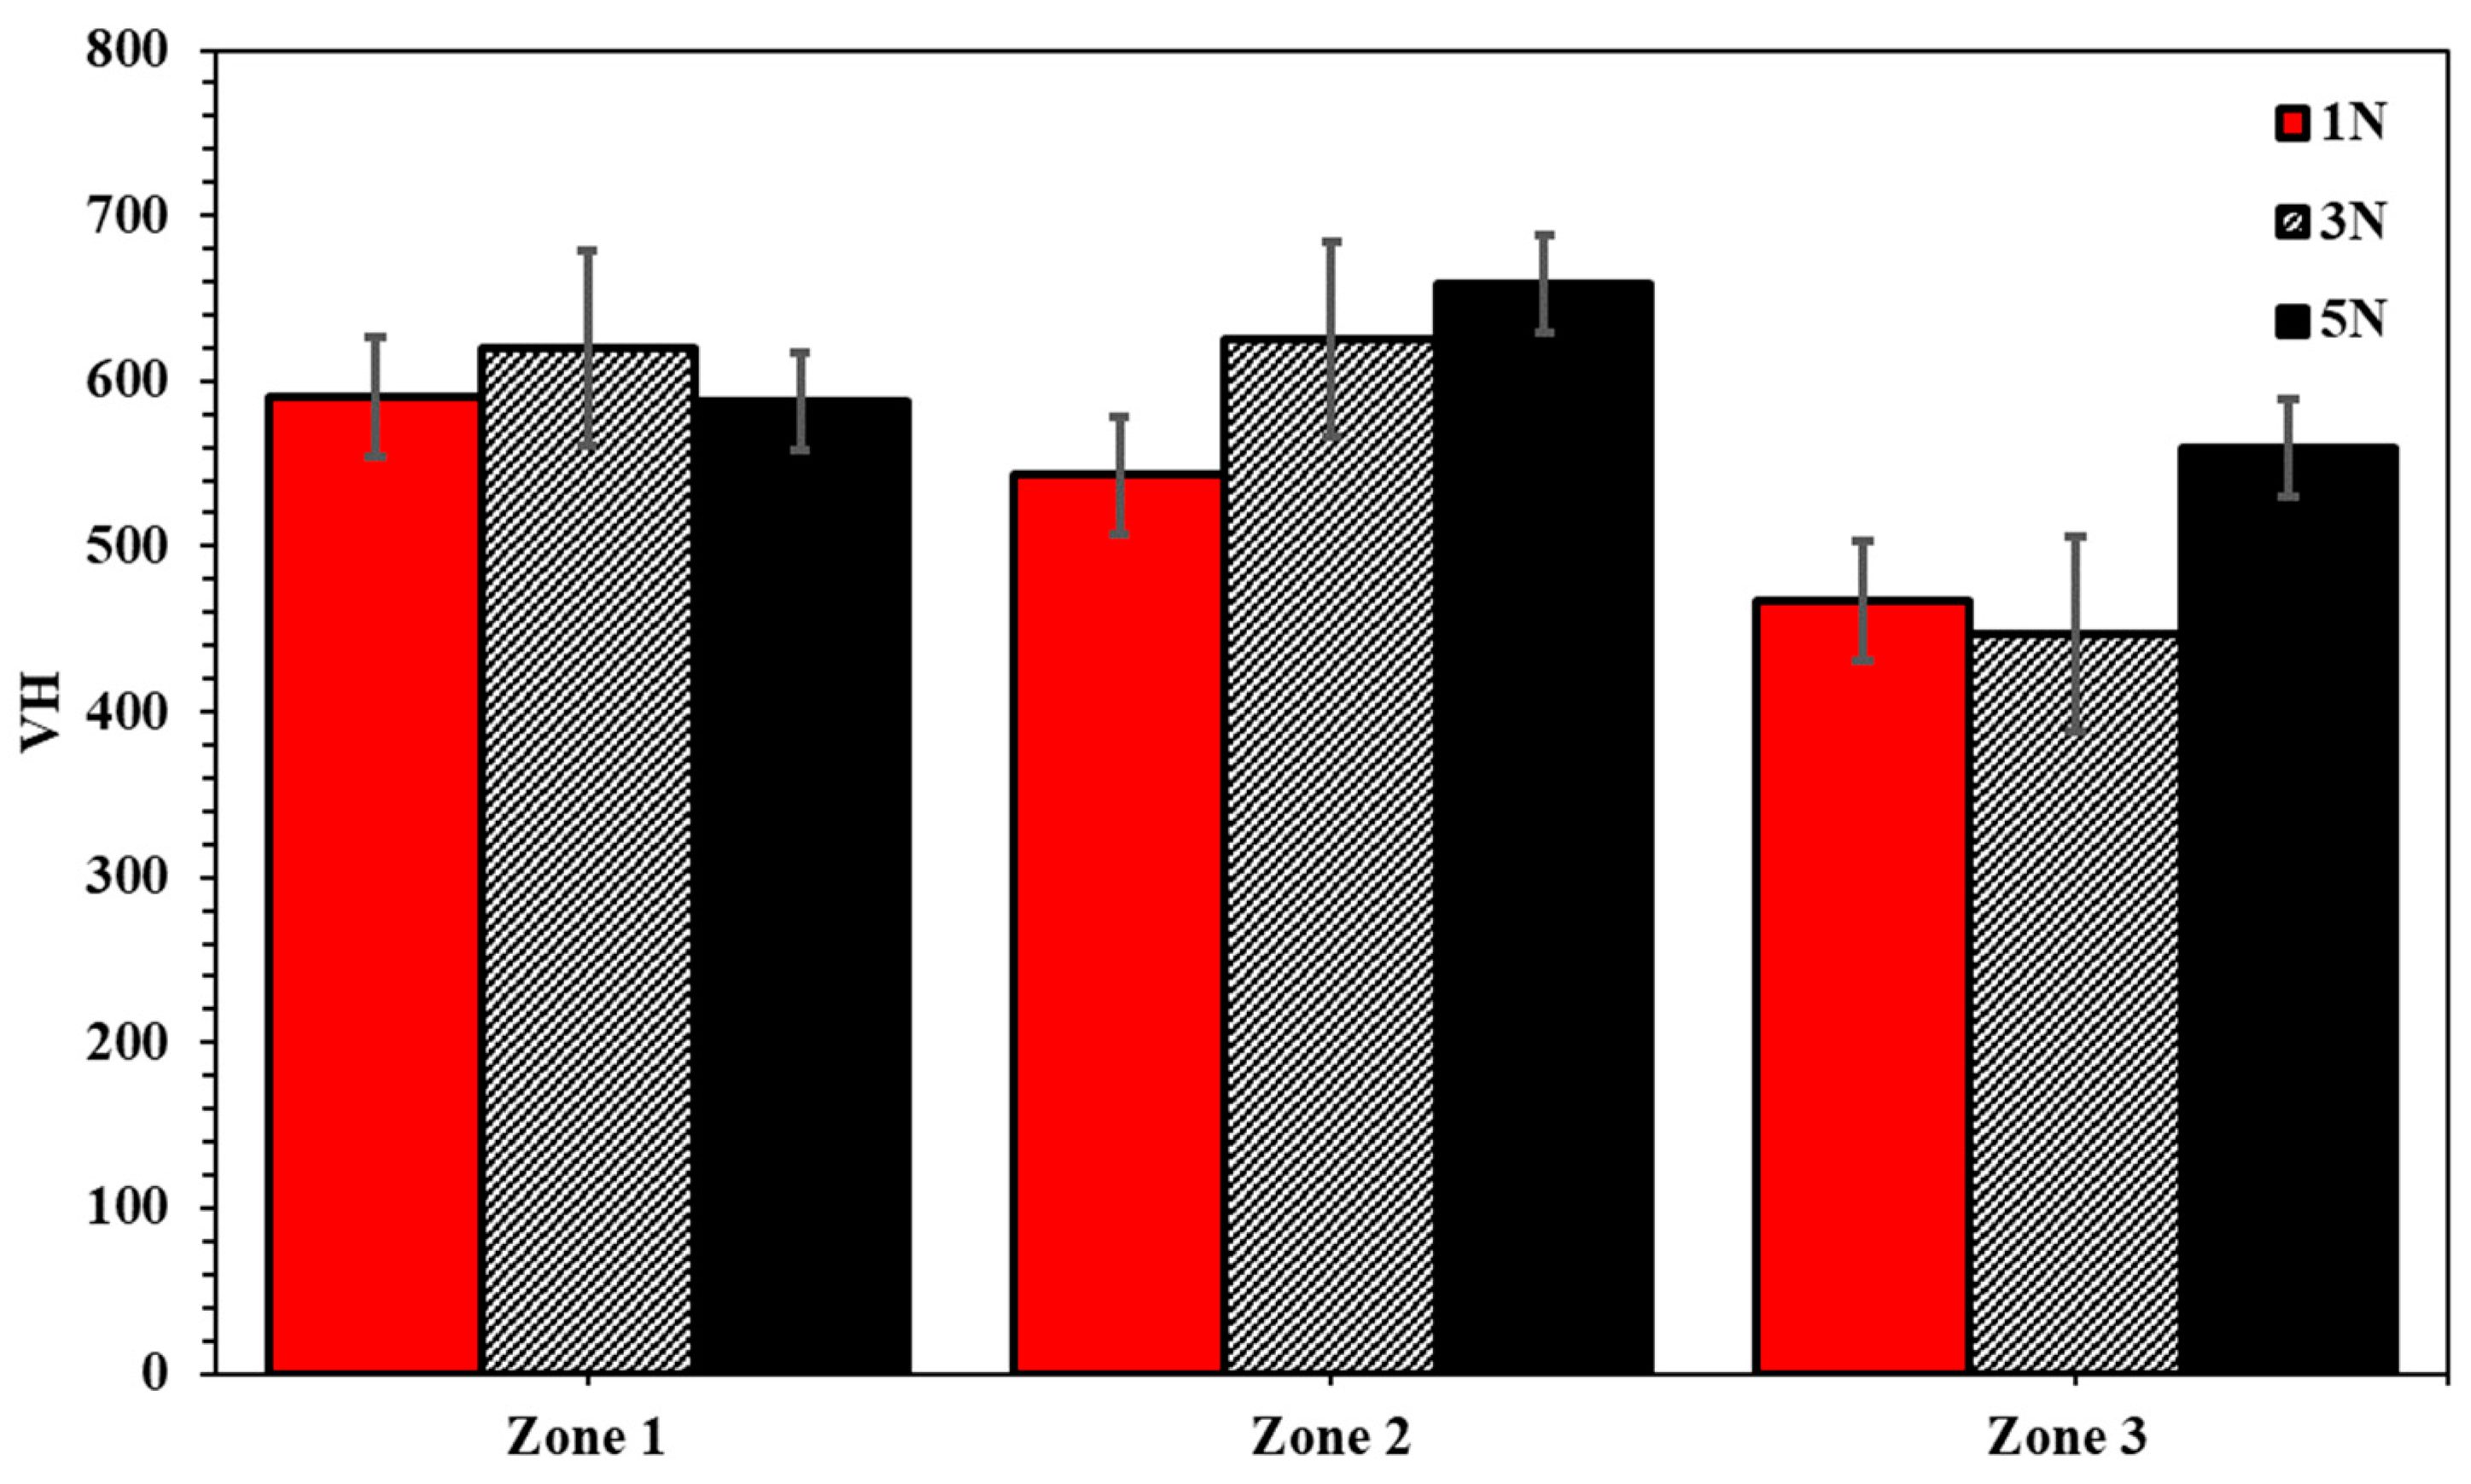
3.3. Microhardness Evaluation

Figure 12 presents examples of the Vickers indentations obtained within zone 1 (top of the of clad), zone 2 (mid-section of the clad), and zone 3 (near the substrate/clad interface), under an applied load of 5 N. Laser scans were used to generate an accurate profile of the indents, to help assess the type of deformation within the indent at various depths under the applied loads. The indented depth, at constant load, exhibited an increase when moving from the surface of the clad towards the substrate, highlighting reduced hardness due to the reduction in the volume of hard phase.
Representative SEM micrographs obtained from indentations imprints on cross-sections of the clads are presented in Figure 13, in relation to its location on the surface of the clad, notably for the following: zone 1, which is the top portion, and zone 2, which is located at the mid-section of clad layer. The images also highlight the corners of the indentation at higher magnifications. According to the microscopy results, the indents exhibit clear boundaries with sharp edges and no extended damage outside of the indentation area. However, a few isolated microcracks, which appear to show a clear crystallographic directionality with the cubic carbide (white arrows), were observed at higher magnifications within the hard phase of the composite clads.
Figure 14 demonstrates the results of micro-Vickers indentation measurements on the cross-sections of the TiC-Ni3Al clads on D2 hard tool steel as a function of depth into the clad layer. The average HV values have been plotted in relation to the measurement location from the clad surface under the range of applied loads examined. Regardless of the value of applied normal load, the highest hardness values were recorded at the top surface of the examined cross-section. In the middle section of the clad, a slight decrease in hardness values was observed. At the clad/substrate interface, a value of 737 HV is recorded for the applied load of 5 N.

3.4. Scratch Testing

The resistance of a coated surface to penetration by a moving stylus, under a constant applied normal force, can be utilised as a preliminary evaluation of a material’s wear resistance. A representative example of the confocal images used for profiling widths of scratch tracks is provided in Figure 15. Figure 15 demonstrates the mean values of scratch hardness and COF obtained following scratch testing of TiC-based (with a nominal Ni3Al content of 30 vol.%) clads on D2 tool steel substrates, as a function of the applied normal force. Both the mean COF and HSp exhibit a small increase in magnitude when increasing the applied load, reaching the highest value of HSp = 7.58 ± 0.59 GPa, with an associated COF of 0.23 ± 0.04, when testing at 40 N applied normal load. Scratch hardness represents the amount of work required to create a scratch on a specimen and, in principle, eventually fracture the coating/clad (adhesively or cohesively) for thin coatings/brittle clads. Therefore, a coating/clad with greater scratch hardness exhibits better adherence and thus it can be expected to show enhanced tribological performance. The COF represents the interfacial friction at the indenter–surface contact, which generates elastic and plastic strain with progression of the indenter tip along the scratch track. The highest COF was recorded for the as-received (i.e., uncoated) D2 substrate, regardless of the applied load, while the friction response improves drastically after applying the clad layer. As is demonstrated in Figure 16, at higher applied loads, an increased scratch hardness is observed, in contrast with a slight increase in COF which can be related to increased contact area at higher loads. In terms of the nominal TiC-Ni3Al composition, previous work has assessed the scratch hardness of bulk TiC-Ni3Al cermets, and specifically the influence of Ni3Al ordering heat treatments [45]. It was shown that the scratch hardness for these materials varied from HSp = 11.89 GPa for the as-sintered cermet (with 30 vol.% Ni3Al) up to 18.12 GPa after ordering at 1200 °C/2 h; the scratch tests in this prior work were performed at a higher applied load of 100 N. While the nominal Ni3Al content (prior to laser heating) is similar in the present case, the clad layer is effectively diluted through partial incorporation of a ferrous component, with Ni3Al itself transformed to NiAl through Ni depletion into the surrounding Fe-rich areas. As a result, the present scratch hardness values are roughly half those of the bulk cermets.
The average width and depth of the scratch profiles did not demonstrate any significant variation when they were compared in relation to the direction of the laser scan. This is attributed to a homogeneously solidified microstructure for the fabricated clads and an absence of gross microstructural segregation between the overlapping layers.
Figure 17 illustrates example micrographs related to scratch damage arising on the surfaces for a clad processed at P = 350 W and τ = 0.6 s, under constant applied loads of 10 N, 20 N, 30 N, and 40 N. The plastic deformation of traditional polycrystalline metals through the movement of lattice dislocations within individual grains is well known [46,47]. The progression of scratch damage on the clad D2 substrate, under an applied load of 10 N (Figure 17a), shows that slight plastic deformation of the surface was accompanied by the formation of Hertz-type tensile cracks at the edges of the scratch track. By increasing the applied normal force to 20 N (Figure 17b), the appearance of conformal cracks within the structure of the hard carbide phases was observed, in accordance with the initiation of buckling cracks at the edges of the scratch track. Under an applied load of 30 N, buckling cracks were again observed at the edges of the scratch track, which were combined with cohesive spallation of the clad at 40 N.
Figure 18 demonstrates the values obtained for HSp and COF from scratch testing of TiC-based composite clads as a function of the calculated ED values (through varying laser power and scan speed). As might be anticipated, improved surface properties and reduced surface roughness were observed in contrast to overall reduction in COF for specimens fabricated under ED values up to 379.5 J/mm3. When the ED values exceeded these values, an increase in the resultant surface roughness also resulted in increasing COF, which was more noticeable at higher applied loads. Subsequently, computed values for HSp exhibited a general increase in relation to the increasing values of ED, which again began to decrease once ED values reached 379.5 J/mm3.
Information gained through acoustic emission (AE) measurements was also used to locate surface and sub-surface cracking, as well as possible crack propagation, that was associated with scratch testing damage. Scratches parallel to the direction of laser scan showed relatively few AE events. In contrast, a substantial increase in the fluctuations of AE was detected where scratches were generated perpendicular to the direction of the laser scan. This correlates with crack formation perpendicular to the scratch direction. Collected AE data, as a function of its detected location on the scratch track, are presented in Figure 19; these scratches were generated under an applied force of 40 N, with the scratches both parallel and perpendicular to the laser scan direction. During microstructural analysis of the corresponding scratch tracks, it was found that the periodic repetition of the AE events corresponds to the location of the existing track-bands perpendicular to the direction of the moving indenter tip.
Several scratch damage techniques have been reported within the literature for evaluation of the adhesion/cohesion bond strength in thick coatings, such as scratching the top surface under constantly increasing applied load [38,48,49]. However, as with the case reported for thermal spray coatings, due to the high thickness and surface roughness, this technique was found inadequate [50], and therefore was not applied in the present work. Cross-sectional scratch analysis was proposed for assessing plasma spray coatings, which were examined by sliding a stylus from the substrate towards the coating surface under a constant applied load [38]. Consequently, in the present work, an approach utilising this cross-sectional scratch analysis technique was conducted. This was performed in association with subsequent microstructural and topographical investigations of the cross-sectional scratches generated under constant applied loads from 10 N to 40 N. Figure 20 presents an example of such a cross-sectional scratch analysis for the TiC-Ni3Al clad D2 tool steel, highlighting the change in scratch depth, which was constructed by stitching a sequence of CLSM images. Track cross-section measurements revealed a significant decrease in both the width and depth of the scratch tracks as the stylus was moved from the substrate towards the surface of clad. Moreover, increasing the applied normal force was observed to increase the projected scratch depth and the width within the substrate region. However, within the clad area, the depth of scratch track remained essentially unchanged up to 30 N applied normal force. Cohesive fracture of the clads at the end of scratch tracks was only observed for tests performed under a 40 N applied normal force.
A series of SEM micrographs obtained from a single scratch track on the cross-section of a TiC-Ni3Al clad D2 tool steel sample are presented in Figure 21, highlighting the change in scratch width (and hence the scratch hardness) when transitioning from the bulk D2 material into the clad layer itself. Images obtained from various portions of the cross-sectional scratch track clearly demonstrate the impact of the applied clads on the observed damage mechanism(s) and scratch resistivity of the D2 substrate. Lateral- and tensile-type crack formation occurs on the edges of the scratch track within the substrate region, the extent of which was significantly reduced as the stylus moved toward the surface of the clad. As highlighted in Figure 21, the presence of primary and secondary hard carbide phases hinders the deformation of the projected area during scratching, by both inhibiting movement of dislocations and also increasing the local hardness/elastic modulus through the presence of the hard carbide phases. Consequently, the morphology of the scratch edges within the heat-affected zone and through the thickness of the clad exhibits a transition in deformation mechanism characterised by buckling and conformal cracking due to the increase in overall hardness. No adhesive failure was observed between the clad and substrate due to a high degree of diffusion occurring between them during laser processing.
Two types of failure may be expected during the cross-sectional scratch evaluation of hard coatings/clads, namely, adhesive and cohesive [38]. During adhesive failure, a cone-shaped fracture takes place at the interface between the substrate and coating/clad. Cohesive failure, on the other hand, is an indication of failure within the coating/clad itself, rather than at the interface. In the present work, the geometry of the resulting cone-shaped fracture at the tip of the scratch was measured and the area of the fracture was calculated following (Equation (4)) [50]:
Acn = LxxLy
where Acn is the cone area, Lx is cone diameter, and Ly refers to the depth of formed cone. The formation of cone-shaped fractures in the TiC-based clads on D2 substrates was observed once the constant applied scratch load exceeded 30 N (Figure 22). At loads of 30 N and 40 N, cone-shaped fractures were observed to originate within the coatings, which suggests a cohesive failure mode predominates above this critical load. During high-magnification imaging of the projected conical areas, it was also noticed that most of the widening of the cone base is related to movement of the stylus through the porous layer that contains the top surface porosity for the as-fabricated clads (Figure 22). Thus, a general increase in the measured conical area was noticed as a function of increasing surface roughness.
Any potential oscillations arising for either the COF or the AE events were recorded simultaneously during cross-sectional scratch tests; examples of the recorded data are provided in Figure 23. Detected AE peaks were generally sensed during the movement of the stylus through the HAZ layer, which increased in intensity proportionally to the value of applied force. A constant increase in the value of COF was recorded for scratches generated within the substrate portion of the sample. However, once the stylus entered the clad layer, the COF values were significantly reduced. The COF was found to remain essentially constant within the clad portion of the scratch, regardless of the applied load.

4. Conclusions

TiC-based L-DED clads were successfully applied onto high-Cr-containing, cold work D2 tool steel substrates using laser deposition, starting with a TiC-Ni3Al composition feedstock. To achieve this, a novel suspension-based gelation preplacement method was used for the feedstock prior to laser cladding. The adhered, preplaced TiC-NixAly-Ni coating, with a uniform thickness, was then subjected to laser processing using various laser powers and scanning speeds. Microstructural examination confirmed high-density clads with refined microstructures and minimal levels of porosity. Dilution with the steel substrate resulted in NiAl formation, along with a ferrous-based phase. For laser powers of 300 W and 350 W, high-quality clads were fabricated at range of scanning speeds; a relationship between ED and surface roughness was confirmed for these process conditions.
In terms of the mechanical behaviour, the maximum values for HV were recorded at the top surface of the examined cross-section, with an average value of HV = 659. In the mid-section of the clad, a slight decrease in hardness values was observed. At the clad/substrate interface, 560 HV was reported for the applied load of 5 N. A substantial decrease in hardness was observed with increasing depth into the substrate, with respect to the clad surface, due to the reduced concentration of the hard carbide phases.
Single-pass scratch testing was used for qualitative and quantitative evaluation of the micro-tribological properties of the clads. Post-scratch morphology of the cermet clads demonstrated that abrasive damage is generated in the clad layer, which can be anticipated to progress by plastic deformation and brittle failure. Within the range of 10 N to 40 N applied normal force, the scratch hardness of the cermet clads (HSp) varied within the range of 4.9 to 7.6 GPa, whereas the D2 substrate exhibited a consistent value of HSp ≈ 3 GPa.

Author Contributions

Conceptualisation, Z.R. and K.P.P.; methodology, Z.R., M.Y.A., A.M.S.D. and K.P.P.; validation, Z.R., M.Y.A., A.M.S.D. and K.P.P.; formal analysis, Z.R., M.Y.A., A.M.S.D. and K.P.P.; investigation, Z.R., M.Y.A. and A.M.S.D.; resources, K.P.P.; data curation, Z.R.; writing—original draft preparation, Z.R.; writing—review and editing, Z.R. and K.P.P.; supervision, K.P.P.; project administration, K.P.P.; funding acquisition, K.P.P. All authors have read and agreed to the published version of the manuscript.

Funding

This work was support through the NSERC Strategic Project Network, Holistic Innovation in Additive Manufacturing (HI-AM), via Grant No. NETGP 494158-16.

Institutional Review Board Statement

Not applicable.

Informed Consent Statement

Not applicable.

Data Availability Statement

Dataset available on request from the authors.

Acknowledgments

The authors would like to thank Zoheir Farhat (Dalhousie University) for valuable technical discussions and suggestions. Paul Bishop is gratefully acknowledged for providing access to the laser DED system, while Greg Sweet and Addison Rayner are also thanked for conducting the laser DED processing runs.

Conflicts of Interest

The authors declare no conflicts of interest.

References

  1. Palin-Luc, T.; Jeddi, D. The gigacycle fatigue strength of steels: A review of structural and operating factors. Procedia Struct. Integ. 2018, 13, 1545–1553. [Google Scholar] [CrossRef]
  2. Olorundaisi, E.; Jamiru, T.; Adegbola, A.T. Mitigating the effect of corrosion and wear in the application of high strength low alloy steels (HSLA) in the petrochemical transportation industry—A review. Mater. Res. Express 2020, 6, 1265k9. [Google Scholar] [CrossRef]
  3. Ramamurthy, S.; Atrens, A. Stress corrosion cracking of high-strength steels. Corros. Rev. 2013, 31, 1–31. [Google Scholar] [CrossRef]
  4. Vedani, M. Microstructural evolution of tool steels after Nd-YAG laser repair welding. J. Mater. Sci. 2004, 39, 241–249. [Google Scholar] [CrossRef]
  5. Kattire, P.; Paul, S.; Singh, R.; Yan, W. Experimental characterization of laser cladding of CPM 9V on H13 tool steel for die repair applications. J. Manuf. Process. 2015, 20, 492–499. [Google Scholar] [CrossRef]
  6. Leunda, J.; Soriano, C.; Sanz, C.; Navas, V.G. Laser cladding of vanadium-carbide tool steels for die repair. Phys. Procedia 2011, 12, 345–352. [Google Scholar] [CrossRef]
  7. Cabeza, M.; Castro, G.; Merino, P.; Penaa, G.; Roman, M. A study of laser melt injection of TiN particles to repair maraging tool steels. Surf. Interface Anal. 2014, 46, 861–864. [Google Scholar] [CrossRef]
  8. Du, B.; Zou, Z.; Wang, X.; Qu, S. Laser cladding of in situ TiB2/Fe composite coating on steel. Appl. Surf. Sci. 2008, 254, 6489–6494. [Google Scholar] [CrossRef]
  9. Wu, Q.; Li, W.; Zhong, N.; Gang, W.; Haishan, W. Microstructure and wear behavior of laser cladding VC-Cr7C3 ceramic coating on steel substrate. Mater. Des. 2013, 49, 10–18. [Google Scholar] [CrossRef]
  10. Wang, Y.; Jiang, Z.; Yao, Z.; Tang, H. Microstructure and corrosion resistance of ceramic coating on carbon steel prepared by plasma electrolytic oxidation. Surf. Coat. Tech. 2010, 204, 1685–1688. [Google Scholar] [CrossRef]
  11. Russell, Z.; Gaier, M.; Froning, M.J.; Plucknett, K.P. The aqueous corrosion and wear responses of HVOF-deposited TiC-Ni3Al cermet coatings on AISI 4130 steel substrates. Surf. Coat. Tech. 2023, 473, 130018. [Google Scholar] [CrossRef]
  12. Morimoto, J.; Sasaki, Y.; Fukuhara, S.; Abe, N.; Tukamoto, M. Surface modification of Cr3C2-NiCr cermet coatings by direct diode laser. Vacuum 2006, 80, 1400–1405. [Google Scholar] [CrossRef]
  13. Xu, J.; Zou, B.; Zhao, S.; Hui, Y.; Huang, W.; Zhou, X.; Wang, Y.; Cai, X.; Cao, X. Fabrication and properties of ZrC-ZrB2/Ni cermet coatings on a magnesium alloy by atmospheric plasma spraying of SHS powders. Ceram. Int. 2014, 40, 15537–15544. [Google Scholar] [CrossRef]
  14. Arata, Y.; Kobayashi, A.; Habara, Y. Ceramic coatings produced by means of a gas tunnel-type plasma jet. J. Appl. Phys. 1987, 62, 4884–4889. [Google Scholar] [CrossRef]
  15. Qiao, L.; Wu, Y.; Hong, S.; Long, W.; Cheng, J. Wet abrasive wear behavior of WC-based cermet coatings prepared by HVOF spraying. Ceram. Int. 2021, 47, 1829–1836. [Google Scholar] [CrossRef]
  16. Möller, A.; Hahn, H. Synthesis and characterization of nanocrystalline Ni/ZrO2 composite coatings. Nanostruct. Mater. 1999, 12, 259–262. [Google Scholar] [CrossRef]
  17. Fouilland-Paille, L.; Ettaqi, S.; Benayoun, S.; Hantzpergue, J.J.J. Structural and mechanical characterization of Ti/TiC cermet coatings synthesized by laser melting. Surf. Coat. Tech. 1997, 88, 204–211. [Google Scholar] [CrossRef]
  18. Li, N.; Liu, W.; Xiong, H.; Qin, R.; Huang, S.; Zhang, G.; Gao, C. In-situ reaction of Ti-Si-C composite powder and formation mechanism of laser deposited Ti6Al4V/ (TiC+Ti3SiC2) system functionally graded material. Mater. Des. 2019, 183, 108155. [Google Scholar] [CrossRef]
  19. Li, Y.; Zhang, D.; Ye, Z.; Ye, G.; He, R.; Wang, H.; Cong, W. The reinforcement mechanisms of graphene oxide in laser-directed energy deposition fabricated metal and ceramic matrix composites: A comparison study. Int. J. Adv. Manuf. Technol. 2022, 119, 1975–1988. [Google Scholar] [CrossRef]
  20. Koc, R.; Meng, C.; Swift, G.A. Sintering properties of submicron TiC powders from carbon coated titania precursor. J. Mater. Sci. 2000, 35, 3131–3141. [Google Scholar] [CrossRef]
  21. Stewart, T.L.; Plucknett, K.P. The sliding wear of TiC- and Ti(C,N) cermets prepared with a stoichiometric Ni3Al binder. Wear 2014, 318, 153–167. [Google Scholar] [CrossRef]
  22. Pantelis, D.I.; Bouyiouri, E.; Kouloumbi, N.; Vassiliou, P.; Koutsomichalis, A. Wear and corrosion resistance of laser surface hardened structural steel. Surf. Coat. Tech. 2002, 161, 125–134. [Google Scholar] [CrossRef]
  23. Kennedy, E.; Byrne, G.; Collins, D.N. A review of the use of high power diode lasers in surface hardening. J. Mater. Proc. Tech. 2004, 155–156, 1855–1860. [Google Scholar] [CrossRef]
  24. Clare, A.; Oyelola, O.; Folkes, J.; Farayibi, P. Laser cladding for railway repair and preventative maintenance. J. Laser Appl. 2012, 24, 032004. [Google Scholar] [CrossRef]
  25. Memarrashidi, Z.; Plucknett, K.P. Factors influencing the aqueous corrosion of high performance ceramic-metal composites. J. Mater. Res. 2017, 32, 3333–3343. [Google Scholar] [CrossRef]
  26. Plucknett, K.P.; Becher, P.F.; Waters, S.B. Flexure strength of melt-infiltration processed TiC/Ni3Al composites. J. Am. Ceram. Soc. 1998, 81, 1839–1844. [Google Scholar] [CrossRef]
  27. Russell, Z.; Sparling, W.A.; Stewart, T.L.; Gray, P.; Gaier, M.; Froning, M.J.; Mazzanti, G.; Plucknett, K.P. Gelation-based feed-stock technologies for HVOF thermal spray development: Micro-composite powder preparation and HVOF coating microstructure. Surf. Coat. Tech. 2023, 452, 129089. [Google Scholar] [CrossRef]
  28. Yang, Z.R.; Li, X.X.; Zhang, X.J.; Zhang, Q.Y.; Cao, Y. Microstructure and characterizations of one-step forming TiC/Ni3Al–Ni3Al multicoating on 316L stainless steel. Powder Metall. 2016, 59, 112–120. [Google Scholar] [CrossRef]
  29. Shah, R.; Pai, N.; Rosenkran, A.; Shirvan, K.; Marian, M. Review: Tribological behavior of additively manufactured metal components. J. Manuf. Mater. Process. 2022, 6, 138. [Google Scholar] [CrossRef]
  30. Collier, R.B.; Plucknett, K.P. A comparison of anionic and cationic polyelectrolytes for the aqueous colloidal processing of titanium carbide ceramics. Int. J. Refract. Met. Hard Mater. 2011, 29, 298–305. [Google Scholar] [CrossRef]
  31. Toyserkani, E.; Khajepour, A.; Corbin, S.F. Laser Cladding; CRC Press LLC.: Boca Raton, FL, USA, 2005. [Google Scholar]
  32. Sreekanth, S.; Ghassemali, E.; Hurtig, K.; Joshi, S.; Andersson, J. Effect of direct energy deposition process parameters on single-track deposits of alloy 718. Metals 2020, 10, 96. [Google Scholar] [CrossRef]
  33. Kim, J.D.; Peng, Y. Melt pool shape and dilution of laser cladding with wire feeding. J. Mater. Process. Technol. 2000, 104, 284–293. [Google Scholar] [CrossRef]
  34. Gu, D.; Shen, Y. Effects of processing parameters on consolidation and microstructure of W-Cu components by DMLS. J. Alloys Compd. 2009, 473, 107–115. [Google Scholar] [CrossRef]
  35. ASTM E2546-15; Standard Practice for Instrumented Indentation Testing. ASTM: West Conshohocken, PA, USA, 2015.
  36. ASTM G171-03; Standard Test Method for Scratch Hardness of Materials Using a Diamond Stylus. ASTM: West Conshohocken, PA, USA, 2009.
  37. ASTM C1624-05; Standard Test Method for Adhesion Strength and Mechanical Failure Modes of Ceramic Coatings by Quantitative Single Point Scratch Testing. ASTM: West Conshohocken, PA, USA, 2015.
  38. ISO 27307-15; Thermal Spraying, Evaluation of Adhesion/Cohesion of Thermal Sprayed Ceramic Coatings by Transverse Scratch Testing. ISO: Geneva, Switzerland, 2015. Available online: https://www.iso.org/standard/51692.html (accessed on 7 March 2025).
  39. Bull, S.J.; Berasetegui, E.G. An overview of the potential of quantitative coating adhesion measurement by scratch testing. Tribol. Int. 2006, 39, 99–114. [Google Scholar] [CrossRef]
  40. Tonelli, L.; Fortunato, A.; Ceschini, L. CoCr alloy processed by selective laser melting (SLM): Effect of laser energy density on microstructure, surface morphology, and hardness. J. Manuf. Proc. 2020, 52, 106–119. [Google Scholar] [CrossRef]
  41. Zhou, X.; Li, K.; Zhang, D.; Liu, X.; Ma, J.; Liu, W.; Shen, Z. Textures formed in a CoCrMo alloy by selective laser melting. J. Alloys Compd. 2015, 631, 153–164. [Google Scholar] [CrossRef]
  42. Kadolkar, P.; Dahotre, N.B. Variation of structure with input energy during laser surface engineering of ceramic coatings on aluminum alloys. Appl. Surf. Sci. 2002, 199, 222–233. [Google Scholar] [CrossRef]
  43. Chande, T.; Mazumder, J. Estimating effects of processing conditions and variable properties upon pool shape, cooling rates, and absorption coefficient in laser welding. J. Appl. Phys. 1984, 56, 1981–1986. [Google Scholar] [CrossRef]
  44. Tian, Y.S.; Chen, C.Z.; Chen, L.B.; Chen, L.X. Study on the microstructure and wear resistance of the composite coatings fabricated on Ti-6Al-4V under different processing conditions. Appl. Surf. Sci. 2006, 253, 1494–1499. [Google Scholar] [CrossRef]
  45. Gaier, M.; Todorova, T.Z.; Russell, Z.; Farhat, Z.N.; Zwanziger, J.W.; Plucknett, K.P. The influence of intermetallic ordering on wear and indentation properties of TiC-Ni3Al cermets. Wear 2019, 426–427, 390–400. [Google Scholar] [CrossRef]
  46. Zhao, H.; Qiu, F.; Jin, S.; Jiang, Q. High room-temperature plastic and work-hardening effect of the NiAl-matrix composites reinforced by particulates. Intermetallics 2011, 19, 376–381. [Google Scholar] [CrossRef]
  47. Weertman, J.R.; Farkas, D.; Hemker, K.; Kung, H.; Mayo, M.; Mitra, R.; Van Swygenhoven, H. Structure and mechanical behavior of bulk nanocrystalline materials. MRS Bull. 1999, 24, 44–50. [Google Scholar] [CrossRef]
  48. Bouzakis, K.D.; Asimakopoulos, A.; Michailidis, N.; Kompogiannis, S.; Maliaris, G.; Giannopoulos, G.; Pavlidou, E.; Erkens, G. The inclined impact test, an efficient method to characterize coatings’ cohesion and adhesion properties. Thin Solid Films 2004, 469–470, 254–262. [Google Scholar] [CrossRef]
  49. Lacombe, R. Adhesion Measurement Methods; CRC Press: Boca Raton, FL, USA, 2005. [Google Scholar] [CrossRef]
  50. Vencl, A.; Arostegui, S.; Favaro, G.; Zivic, F.; Mrdak, M.; Mitrović, S.; Popovic, V. Evaluation of adhesion/cohesion bond strength of the thick plasma spray coatings by scratch testing on coatings cross-sections. Tribol. Int. 2011, 44, 1281–1288. [Google Scholar] [CrossRef]
Figure 1. Examples of the D2 tool steel coupons after dip-coating but prior to subsequent L-DED cladding.
Coatings 15 00330 g001
Figure 2. Microstructural representation of the clad dimensions obtained from low-magnification SEM imaging on polished clad/substrate cross-sections. Note that the x-axis in the lower right-hand corner denotes the direction of the laser scan.
Coatings 15 00330 g002
Figure 3. (a) A schematic representation of the scratch testing procedure, indicating the path of the stylus displacement with respect to the direction of the laser scan during cladding. (b) The relative orientations of the analysed scratch regions, demonstrating the direction of the generated scratches in relation to the direction of the laser scan during cladding: x—parallel, y—perpendicular, and z—normal to the laser scan.
Coatings 15 00330 g003
Figure 4. Laser processing parameters explored for determining optimum laser cladding conditions in relation to (a) the average calculated ED (J/mm3), and (b) the measured surface roughness, Ra (in µm). Low-magnification, plan-view optical microscopy imaging on examples of surfaces representing clads fabricated under conditions of (c) P = 300 W, ED = 96.22 J/mm3, τ = 0.5 s, (d) P = 300 W, ED = 213.4 J/mm3, τ = 0.9 s, (e) P = 350 W, ED = 143.9 J/mm3, τ = 0.9 s, and (f) P = 350 W, ED = 275.1 J/mm3, τ = 1.4 s.
Coatings 15 00330 g004
Figure 5. Typical SEM cross-sectional view of a ceramic–metal L-DED clad, highlighting the thickness and uniformity.
Coatings 15 00330 g005
Figure 6. Examples of CLSM micrographs obtained from the near-surface transverse cross-sections of fabricated clads processed at (a) P = 300 W, V = 6.77 mm/s, (b) P = 300 W, V = 3.38 mm/s, (c) P = 350 W, V = 6.77 mm/s, and (d) P = 350 W, V = 3.38 mm/s.
Coatings 15 00330 g006
Figure 7. SEM micrographs illustrating the variation in morphology with the TiC-based clad on D2 steel, laser-processed at P = 350 W and τ = 1.4 s. Note that the x-axis denotes the direction of the laser scan.
Coatings 15 00330 g007
Figure 8. EBSD ‘phase map’ of the surface L-DED clad region. Note that the ‘free-surface’ is at the top of the image.
Coatings 15 00330 g008
Figure 9. Elemental distribution of TiC-based (30 vol.%) L-DED clad on D2 steel (P = 350 W, τ = 1.4 s), demonstrating (a) EBSD analysis (left) and EDS mapping (right), and (b) variation in the chemical composition through the depth of the clad layer.
Coatings 15 00330 g009
Figure 10. X-ray diffraction traces for (a) the dip-coated TiC-NixAly-Ni layer before laser cladding, and (b) the laser clad layer after light surface polishing.
Coatings 15 00330 g010
Figure 11. Representative FE-SEM micrographs obtained from polished cross-sections of the dip-coated TiC-30 vol.% Ni3Al layer laser clad onto D2 steel (with an applied laser power of 350 W, at τ = 1.4 s). (a) The phases identified in the clad layer, namely, the metallic matrix (A), primary carbides (B), and secondary carbides (C) arising at the top and middle of the clad, and the clad/substrate interface. (b) The results of the corresponding EDS analyses of the phases outlined in (a).
Coatings 15 00330 g011
Figure 12. CLSM images and associated 2D cross-sectional profiles for the indents obtained using an applied load of 5 N within zones 1, 2, and 3.
Coatings 15 00330 g012
Figure 13. SEM images of Vickers indents obtained under 5 N applied normal force: (a) at the top of the clad, showing cracking in the carbide phase near the indent corner, and (b) at the clad/substrate interface.
Coatings 15 00330 g013
Figure 14. Instrumented micro-Vickers indentation results obtained from cross-sections of the TiC-based clads on D2 demonstrating the calculated HV values under 1 N, 3 N, and 5 N applied force.
Coatings 15 00330 g014
Figure 15. A representative example of post-scratch, CLSM-generated 2D (left) and 3D (right) images for TiC-based (with a nominal Ni3Al content of 30 vol.%) L-DED clads onto a D2 steel substrate, (P = 350 W and τ = 0.6 s, ED = 253.14 J/mm2) under constant load of 20 N. Note that the x-axis corresponds to the direction of the laser scan, as shown schematically in Figure 3.
Coatings 15 00330 g015
Figure 16. (a) Calculated scratch hardness (HSp) and (b) COF values obtained from scratch testing of TiC-based (with a nominal Ni3Al content of 30 vol.%) clad onto D2 tool steel (scratch orientation is parallel to the direction of the laser scan) under conditions of P = 350 W and τ = 0.6 s (i.e., ED = 253.14 J/mm2).
Coatings 15 00330 g016
Figure 17. Post-scratch micrographs from TiC-based clad (with a nominal Ni3Al content of 30 vol.%) onto D2 steel under conditions of P = 350 W and τ = 0.6 s (i.e., ED = 253.14 J/mm2), under applied normal loads of (a) 10 N, (b) 20 N, (c) 30 N, and (d) 40 N. Note that the scratch area is on the right-hand side in each image.
Coatings 15 00330 g017
Figure 18. Results of abrasive scratch testing under applied constant normal loads on TiC-based composite clads as a function of applied ED: (a) COF and (b) scratch hardness.
Coatings 15 00330 g018
Figure 19. Plots of the AE events occurring for scratch hardness tests obtained under applied force of 40 N: (a) parallel to the direction of the laser scan, and (b) normal to the direction of the laser scan. In each case the scratch direction is highlighted with a yellow arrow.
Coatings 15 00330 g019
Figure 20. An example of cross-sectional scratch depth profile on the L-DED clad D2 tool steel under applied loads of 10 N, 20 N, 30 N, and 40 N. The overall image was generated by stitching sequential CLSM images. Note that the bulk material is shown on the left-hand side of the image, with the clad layer and free-surface on the right-hand side.
Coatings 15 00330 g020
Figure 21. Microstructural evaluation of a scratch track through the bulk/cladding cross-section, generated for a TiC-based clad on D2 substrate (processed at P = 350 W and τ = 0.6 s, with a resultant ED = 253.14 J/mm2); the scratch direction is highlighted by the yellow arrow. Stitched image shows an overview of the scratch and the individual images highlight the regions shown in each black box.
Coatings 15 00330 g021
Figure 22. (a) SEM image of the tip of a through thickness scratch, for TiC-based cermet clad on D2 steel under 30 N applied normal force. (b) CLSM image of conical fracture arising within the scratch cross-section. The associated x-axis denotes the laser scanning direction during clad fabrication.
Coatings 15 00330 g022
Figure 23. Representative AE events (a), and COF (b), curves obtained from scratch testing of TiC-based clad onto a D2 substrate under applied normal loads ranging from 5 N to 40 N. Samples were processed at P = 350 W and τ = 0.6 s, with an ED = 253.1 J/mm2.
Coatings 15 00330 g023
Table 1. Hardness of some advanced composite coatings/clads and their related processing routes reported in the literature. Bulk TiC/Ni and TiC/Ni3Al cermets are also shown for comparison.
CompositionProcessing TechniqueHardnessThickness (µm)Source
Cr3C2/25% Ni–CrHigh-velocity oxyfuel (HVOF), direct diode laserHV 1032 [12]
ZrB2–ZrC/NiSelf-propagating high-temperature synthesis (SHS), atmospheric plasma spraying (APS)HV0.1 525.02 (±96.08)~200 to 300[13]
Al2O3Gas tunnel-type plasma jetHV 1200~100 to 150[14]
WC–Cr3C2/Ni and WC/NiHVOFHV0.3 1188 and 1105320 to 370[15]
Ni/ZrO2ElectroplatingHV25 260 to 600Not given[16]
Ti/TiCLaser melting (LM)HV 700100 to 250 before HAZ[17]
Ti/SiCLaser deposition (LD)HV 647.5~150 hard layer (HAZ to 400)[18]
Graphene oxide/TiCPowder-fed laser deposition (PFLD)HV0.1 250–350432 per layer (10 layers)[19]
TiC/20 wt.% Ni (bulk)SinteringHV 219 to 1295Not applicable[20]
TiC/20 vol.% Ni3Al (bulk)Vacuum sinteringHV5 1260Not applicable[21]
Table 2. Nominal initial chemical compositions of the examined clad formulations prior to laser heating.
Clad Component CompositionsCompositional wt.%
TiCNiAlNi
TiC-30 vol.% Ni3Al60.235.2614.53
TiC-40 vol.% Ni3Al51.6213.9138.44
TiC-50 vol.% Ni3Al43.0217.3948.05
Table 3. Standard chemical composition of the D2 substrates used in the present work.
CCrMoVMnSiFe
AISI D2 Tool Steel1.55120.80.90.350.25Balance
Table 4. Micro-Vickers indentation parameters applied for the testing of TiC-Ni3Al-based L-DED clads on D2 tool steel.
Indenter Poisson ratio0.7
Indenter elastic modulus (GPa)1140
Sample Poisson ratio0.238
Applied force1 N3 N5 N
Loading/unloading rate (µm/s)153070
Disclaimer/Publisher’s Note: The statements, opinions and data contained in all publications are solely those of the individual author(s) and contributor(s) and not of MDPI and/or the editor(s). MDPI and/or the editor(s) disclaim responsibility for any injury to people or property resulting from any ideas, methods, instructions or products referred to in the content.

