
Research on Microstructure Evolution Rules of TA18 Titanium Alloy Tube During the Differential Heating Push-Bending Forming Process

 ,
,
Abstract
1. Introduction
2. Test Schemes
2.1. Materials
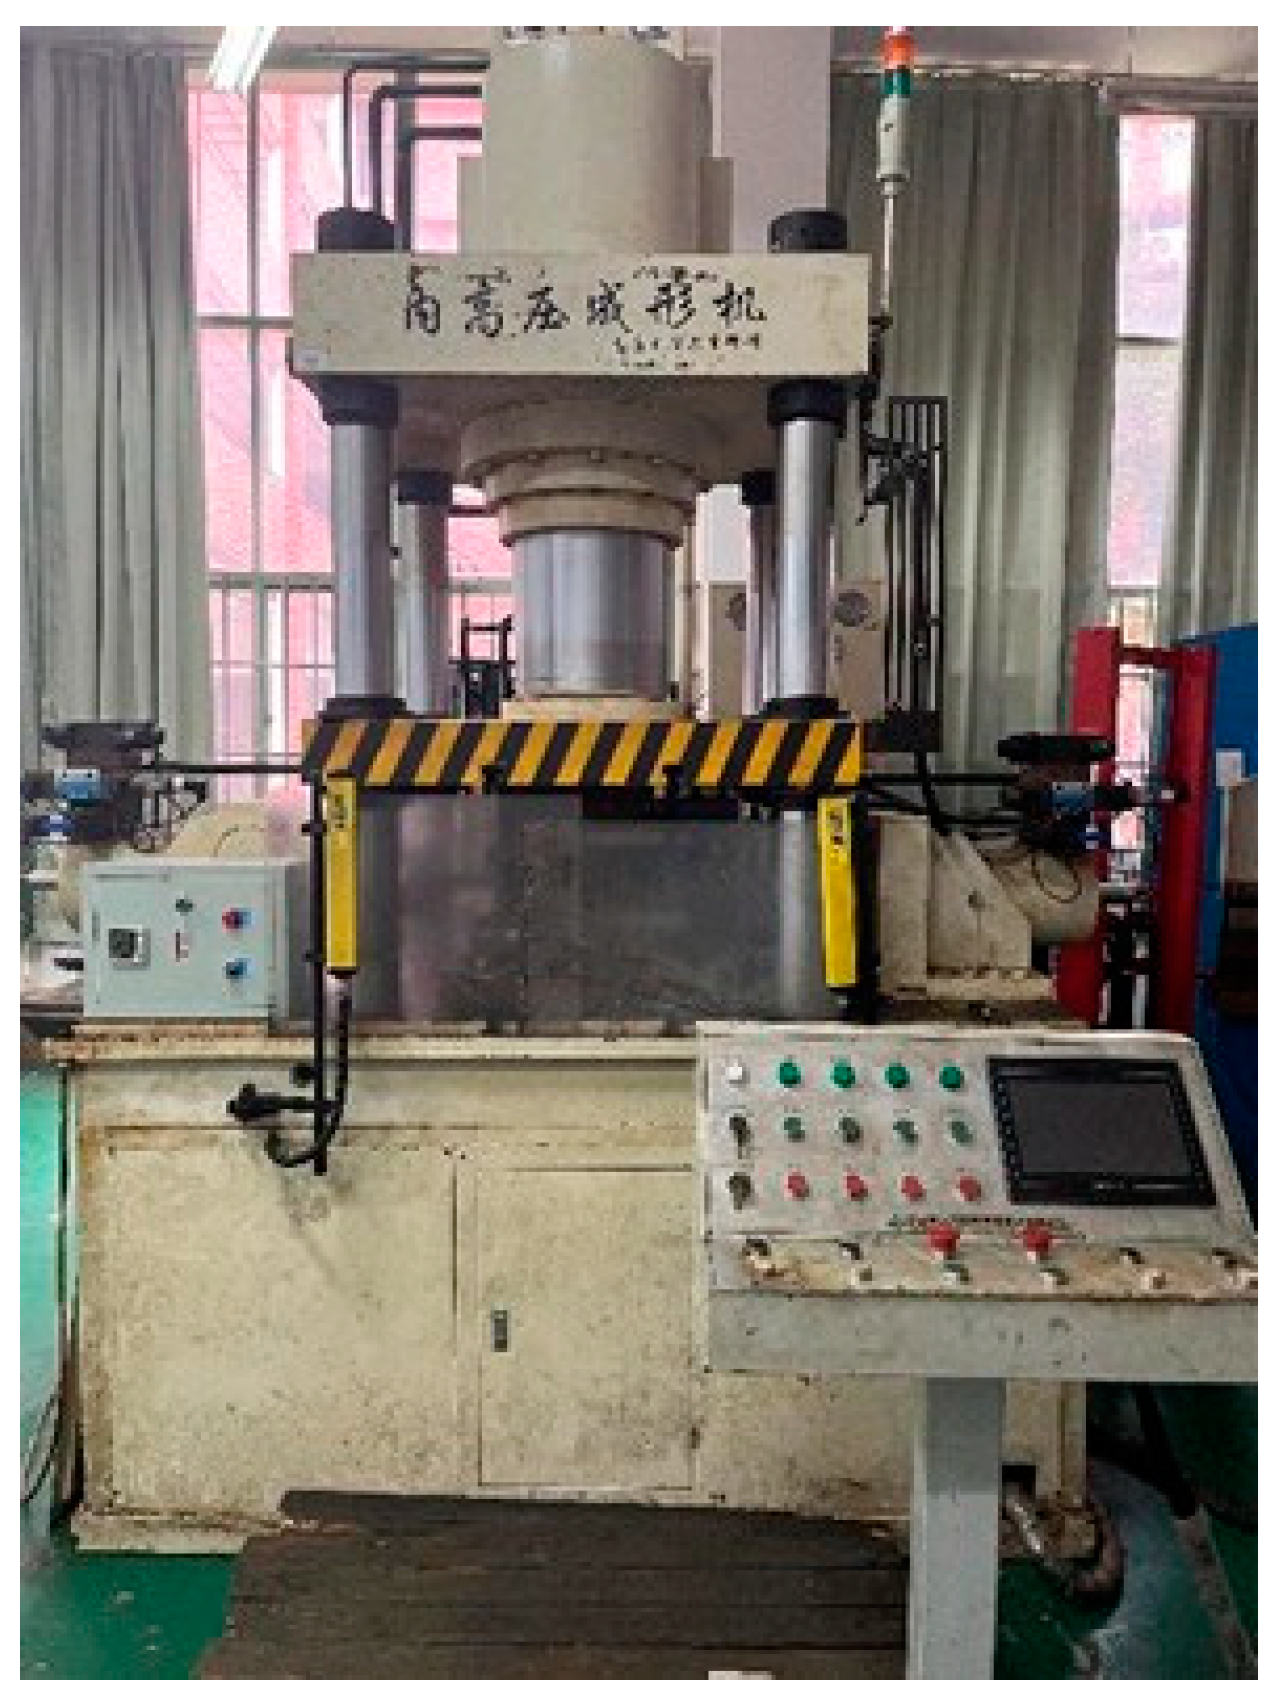
2.2. Differential Heating Push-Bending Method
3. Model Construction
3.1. Finite Element Model
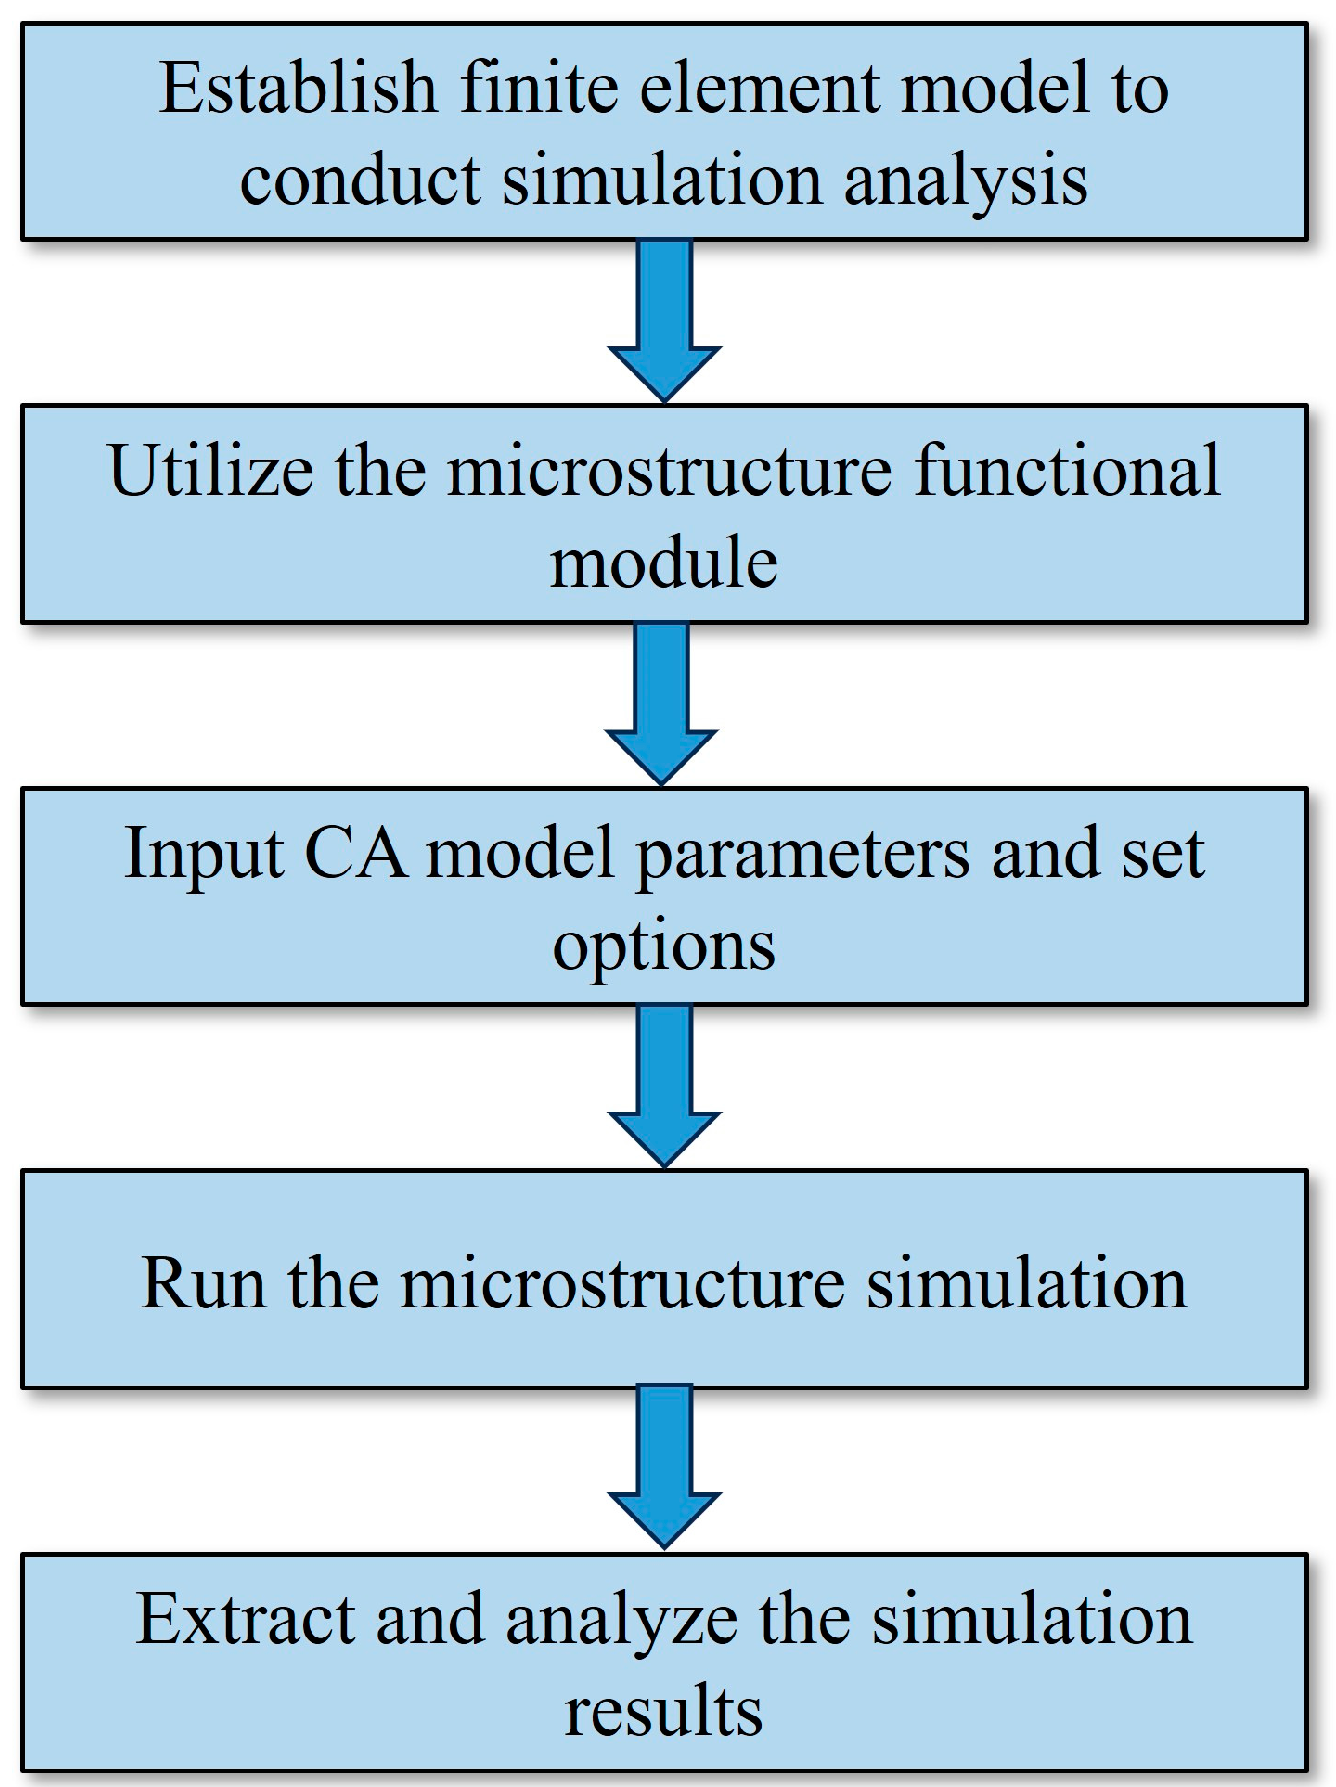
3.2. Cellular Automata Model
4. Results and Discussion
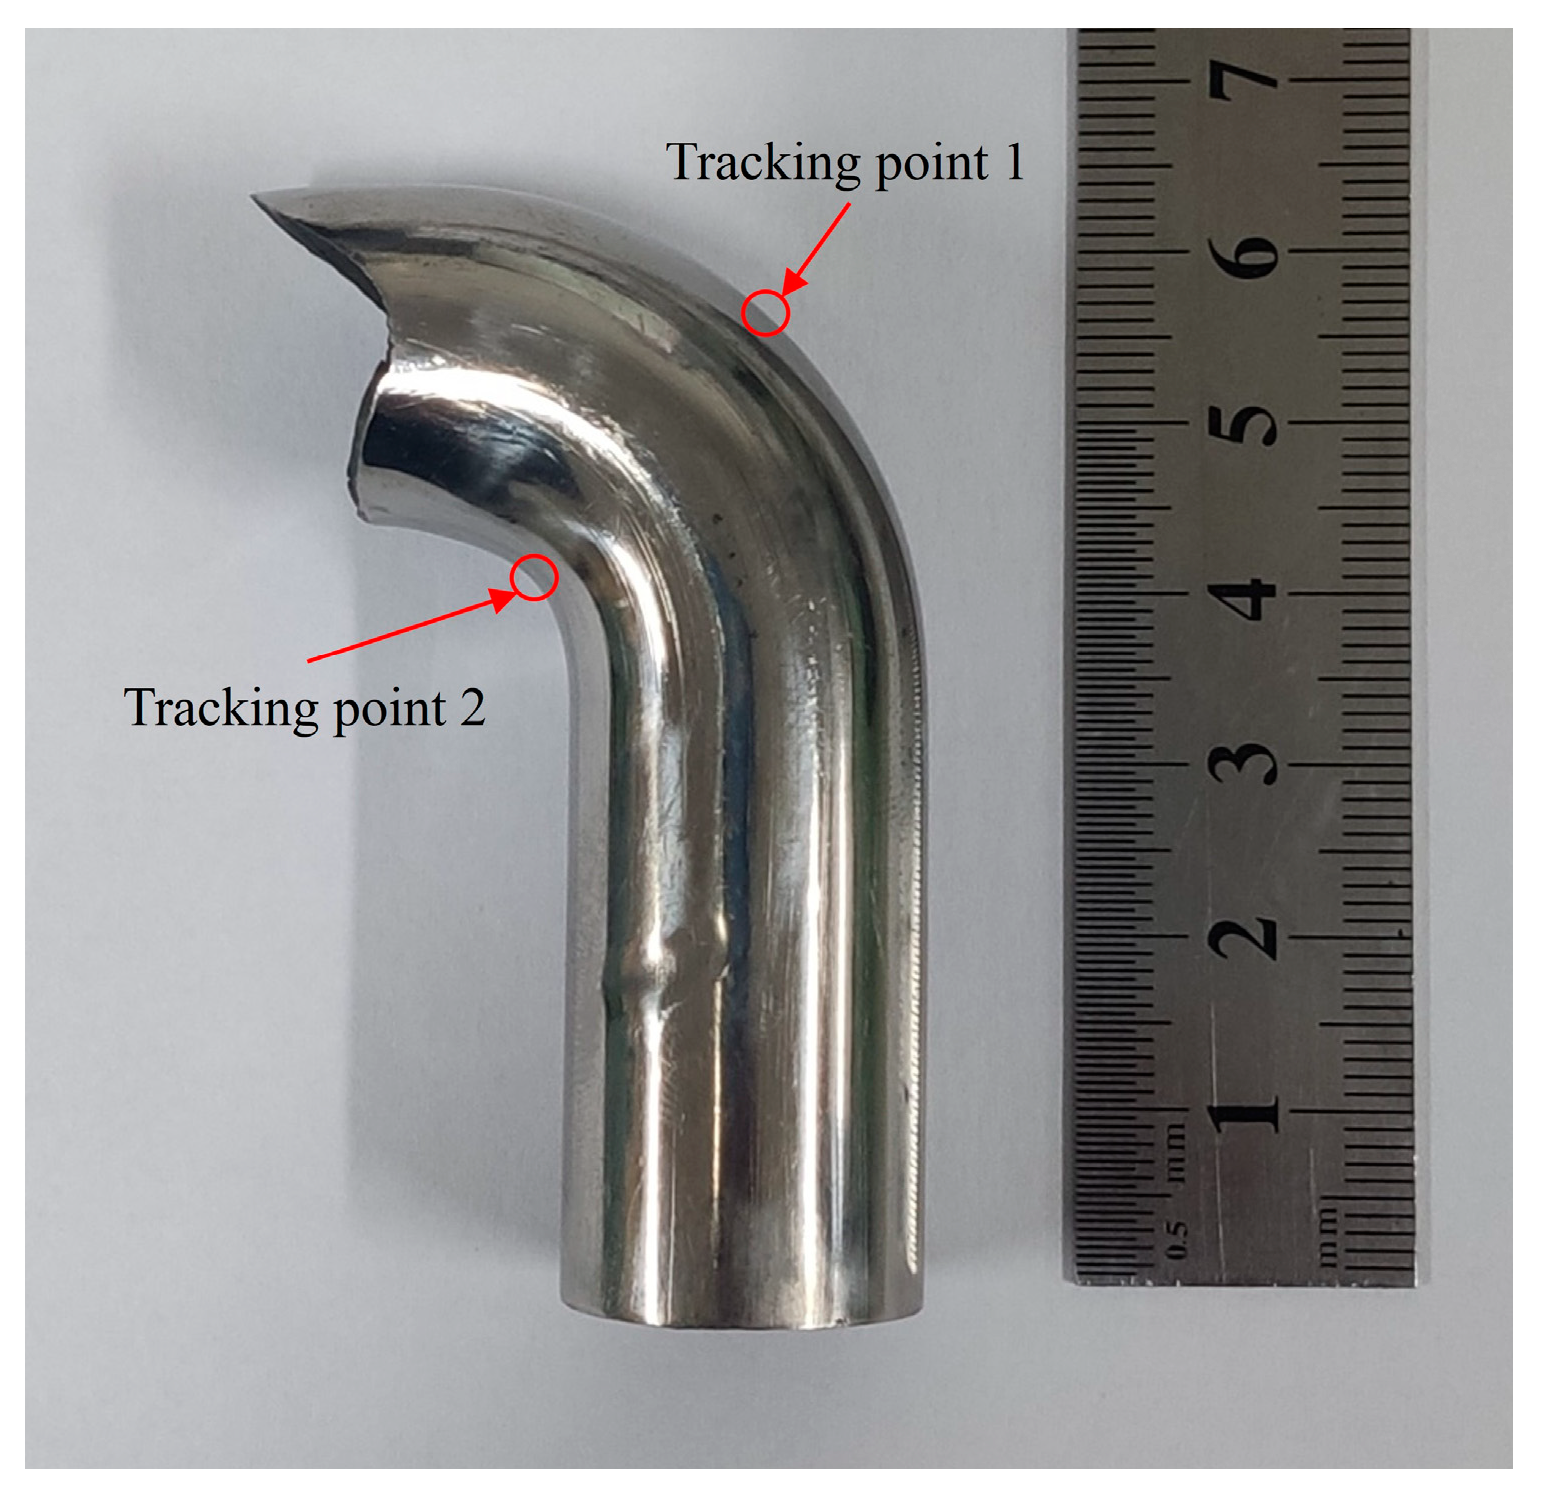
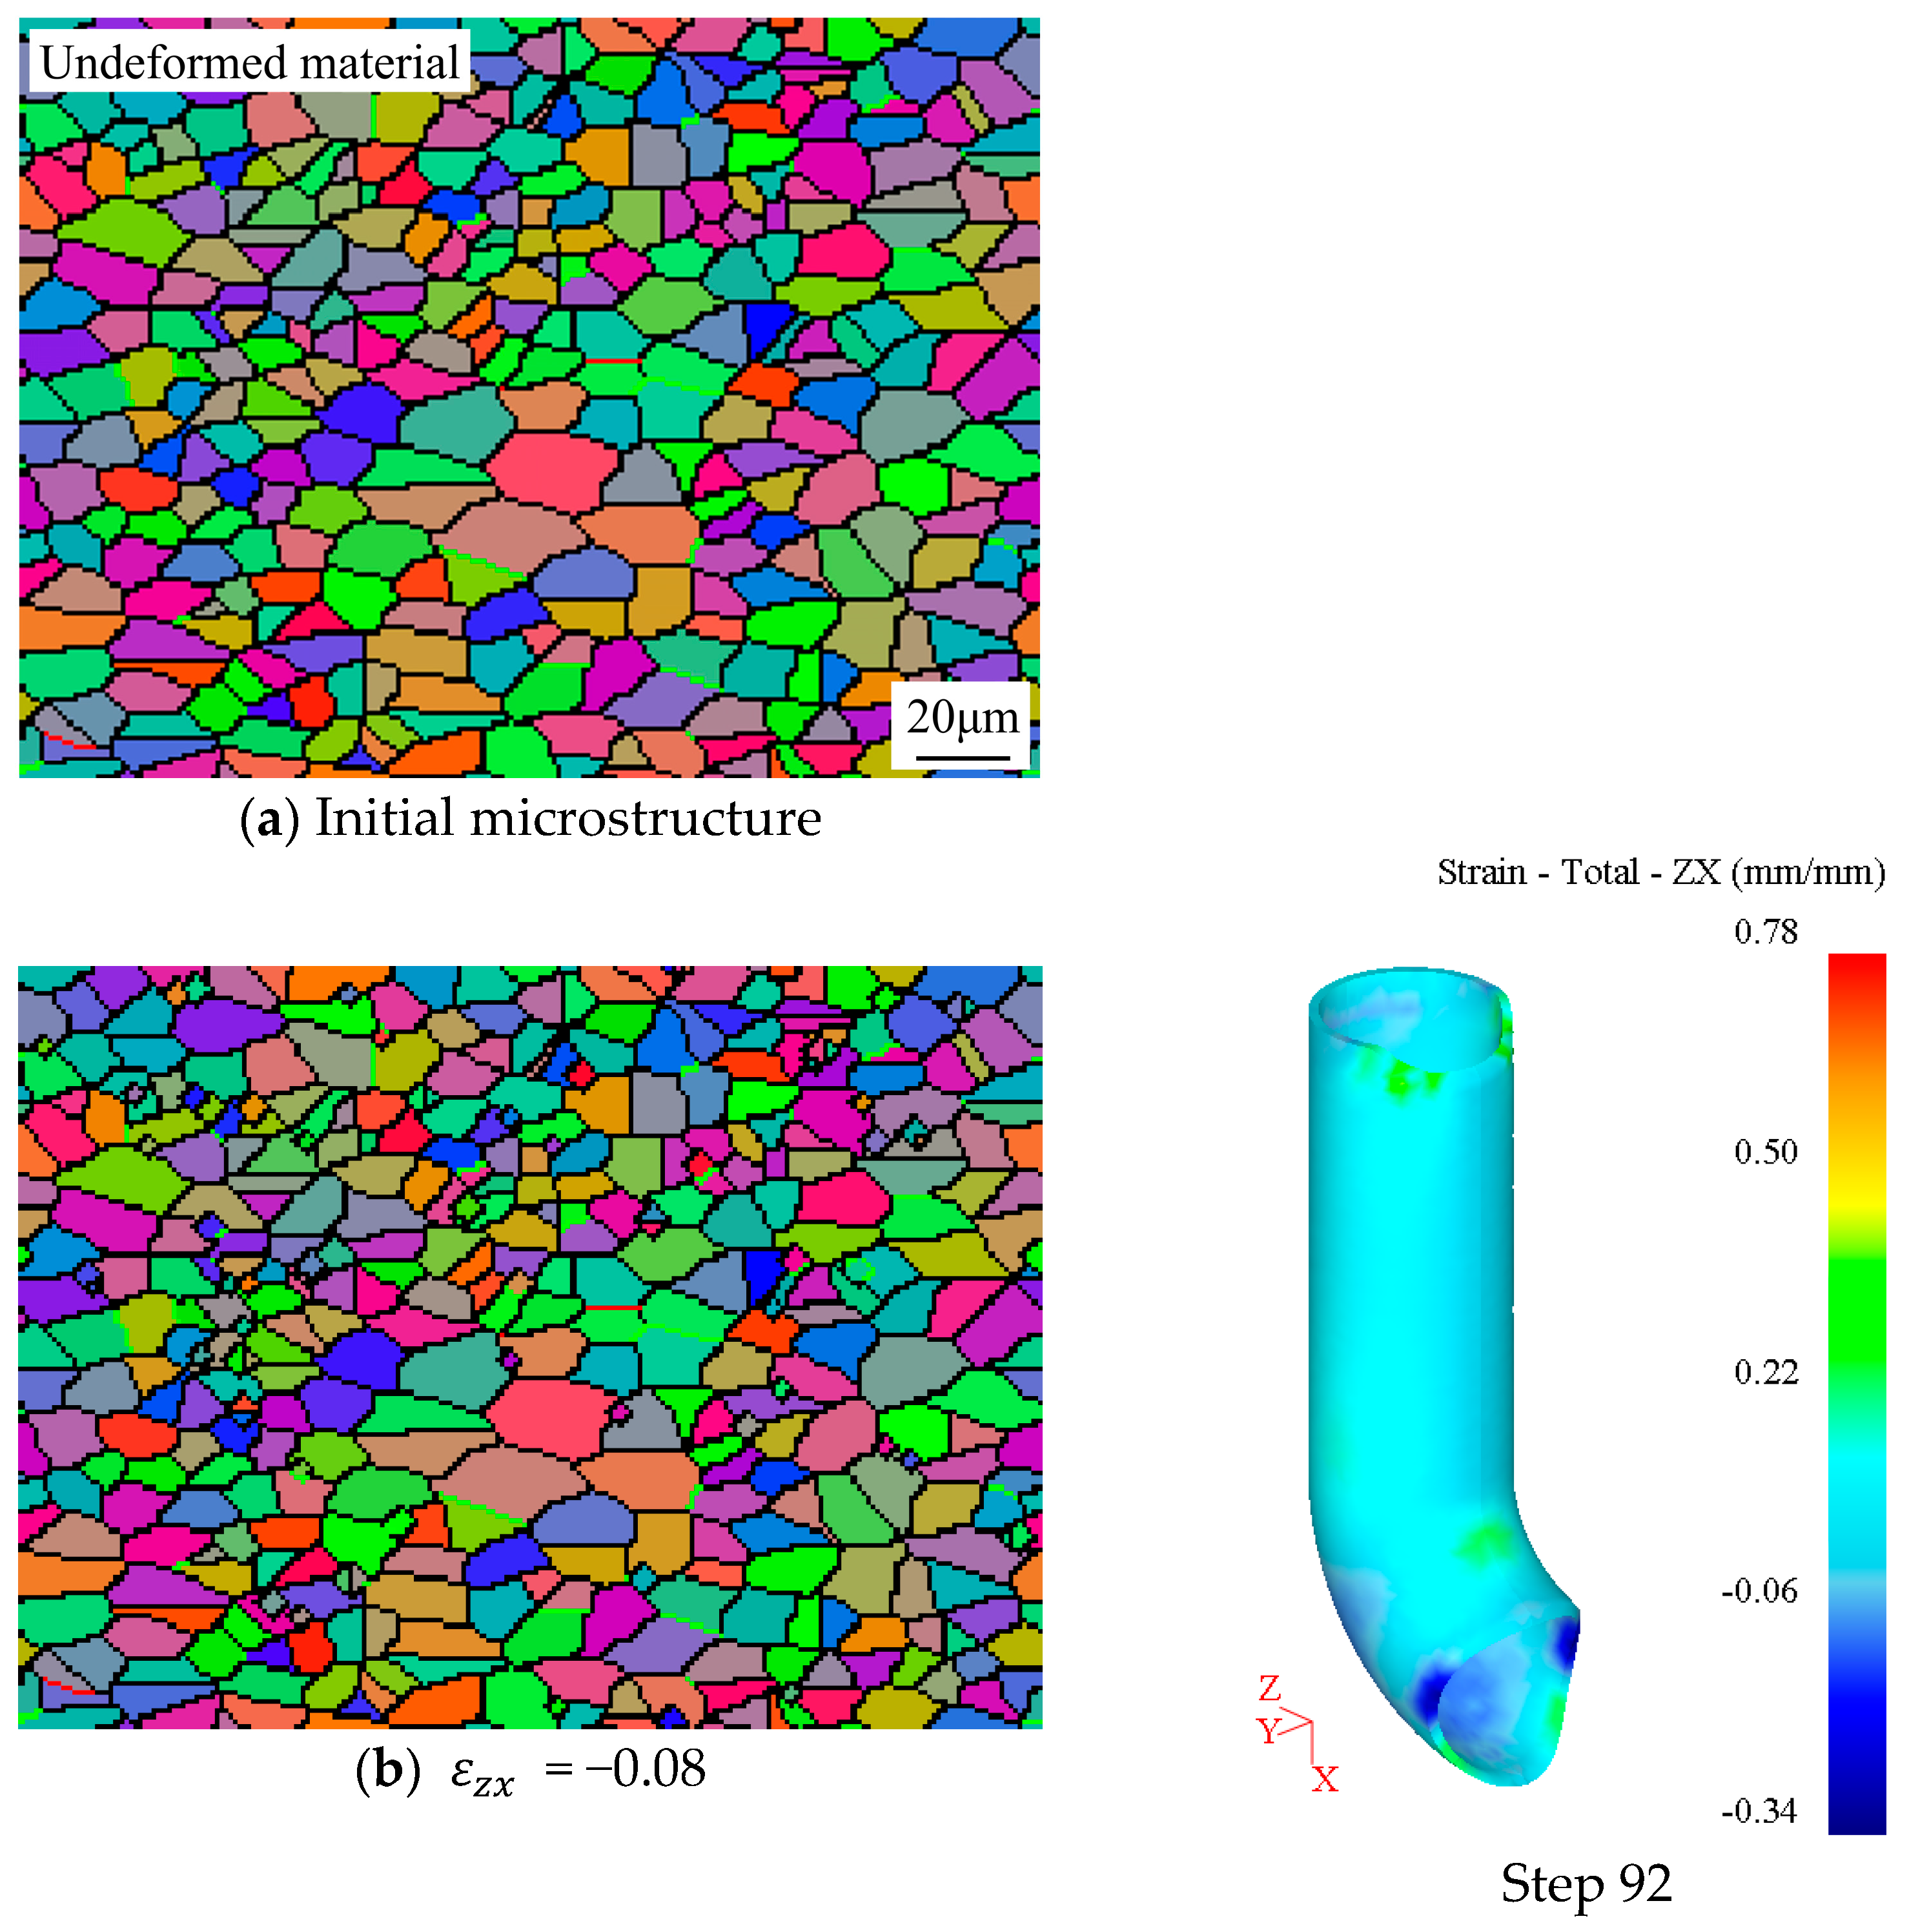
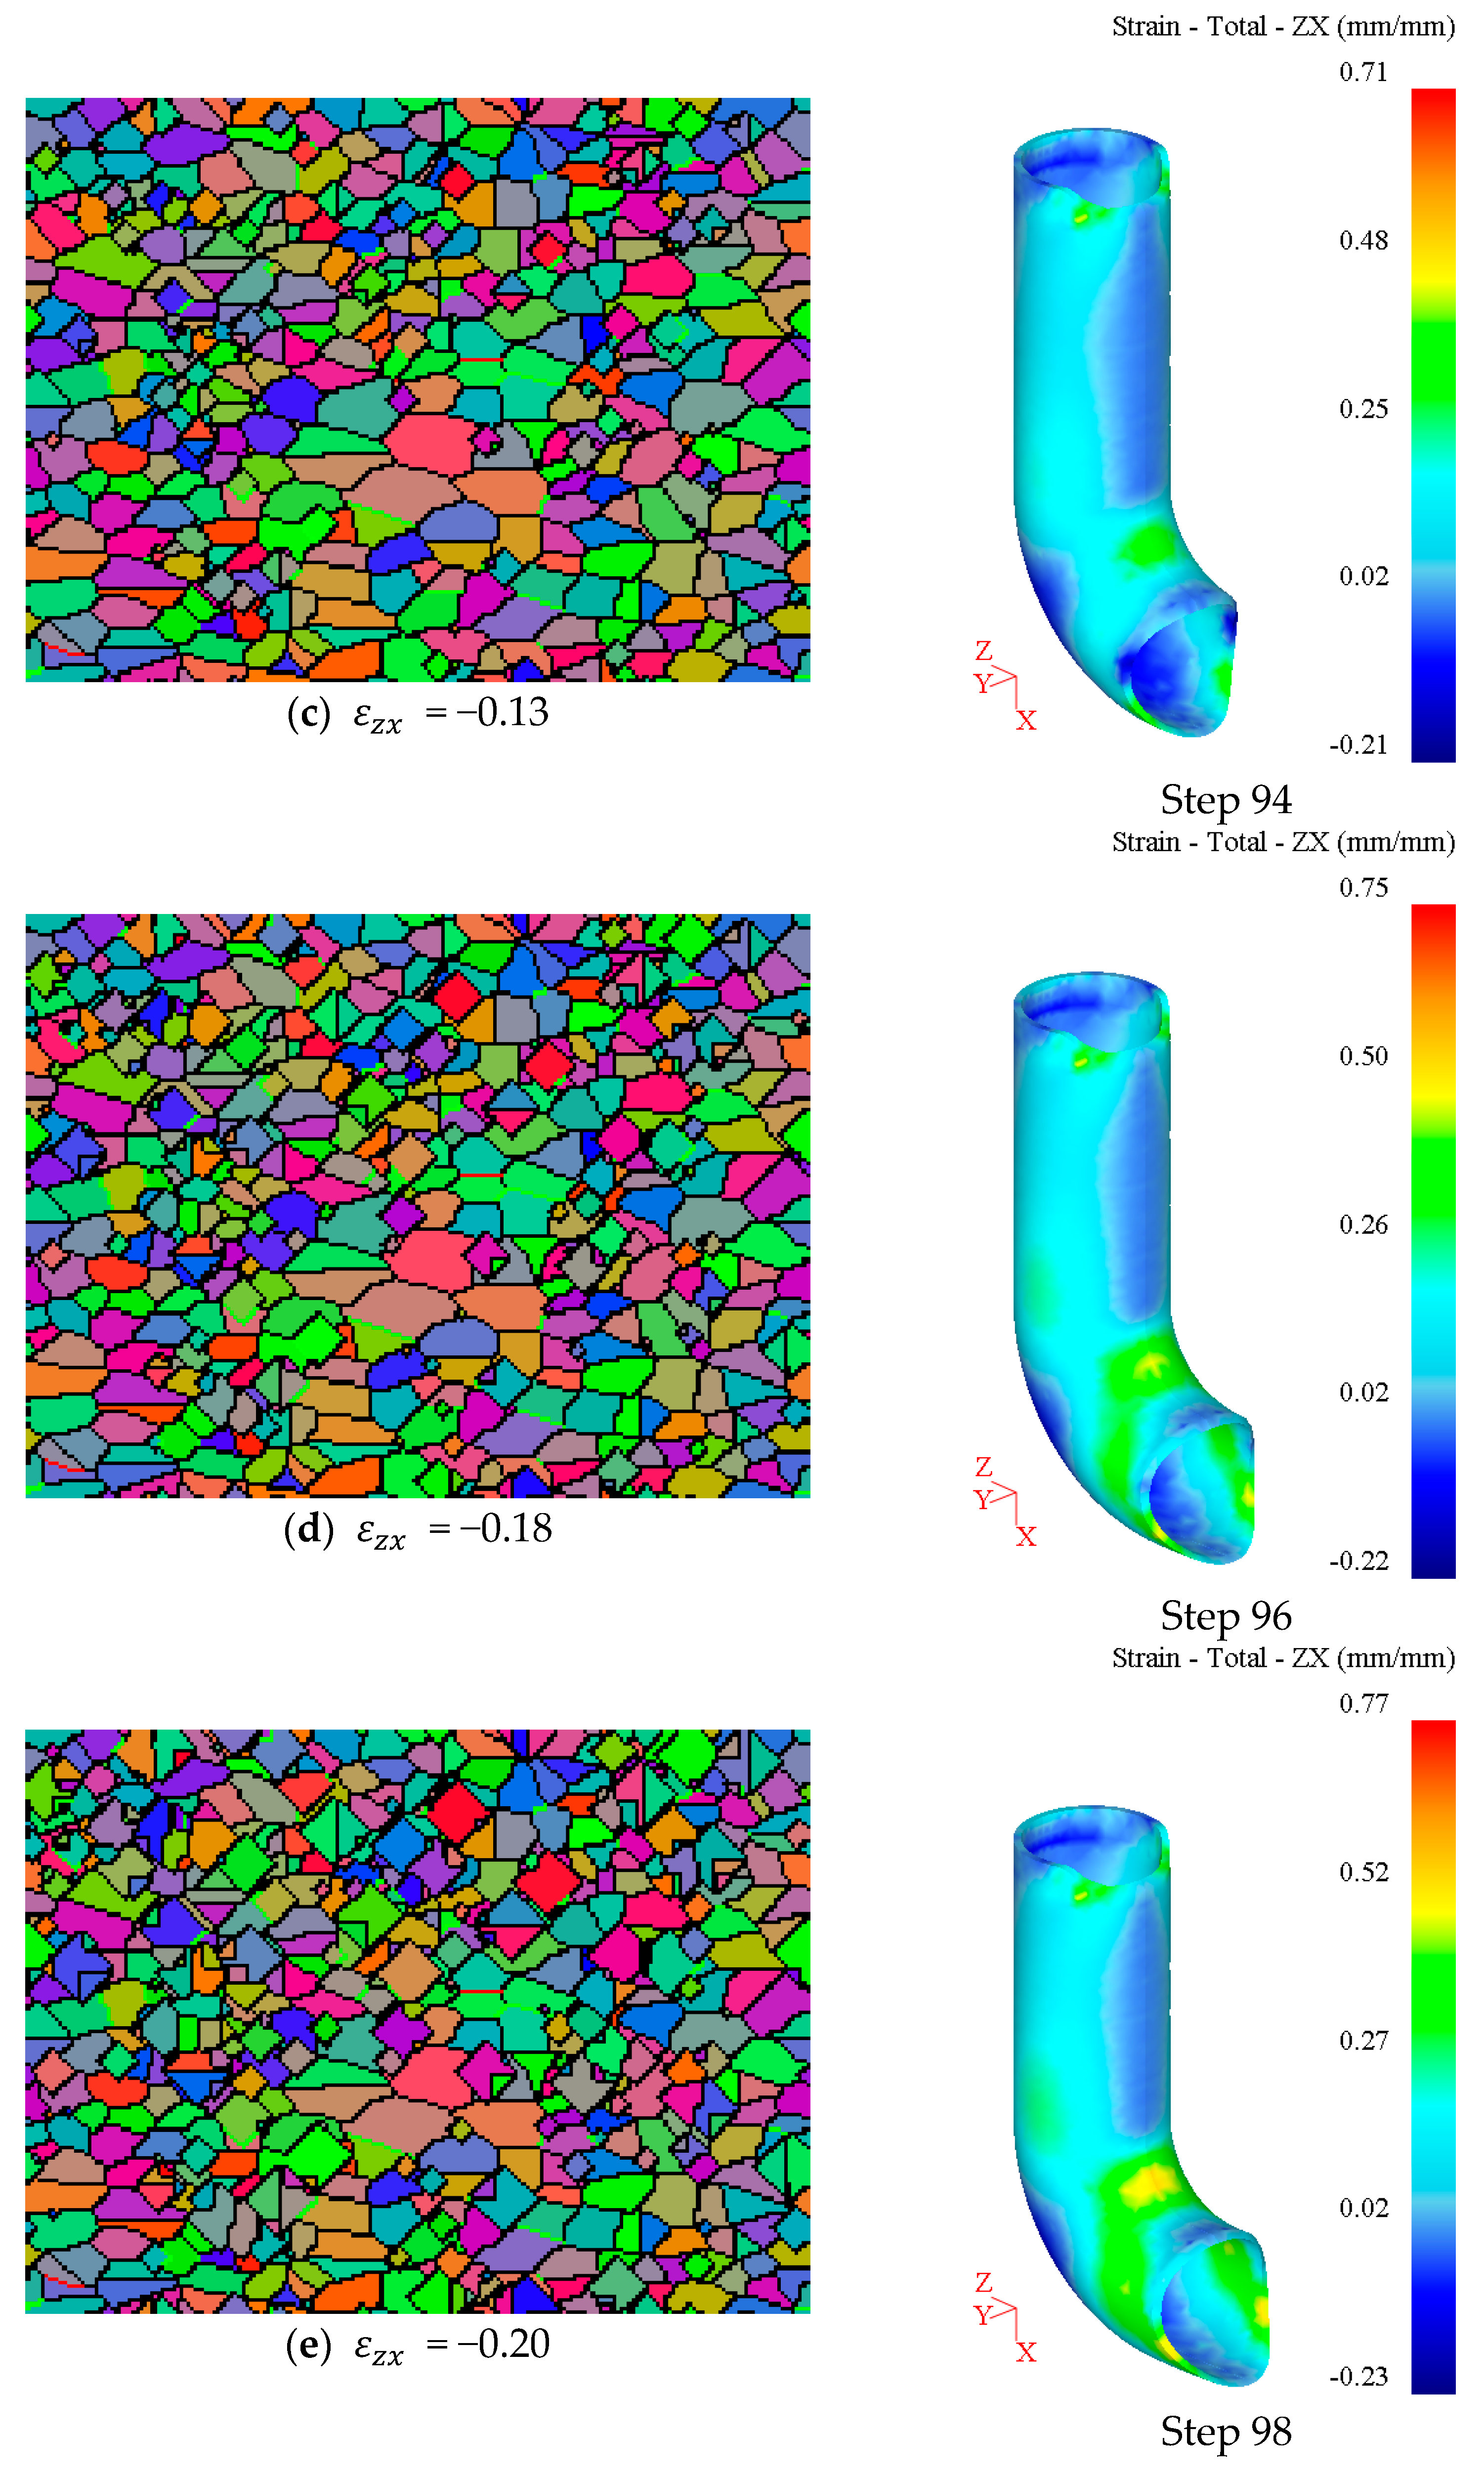
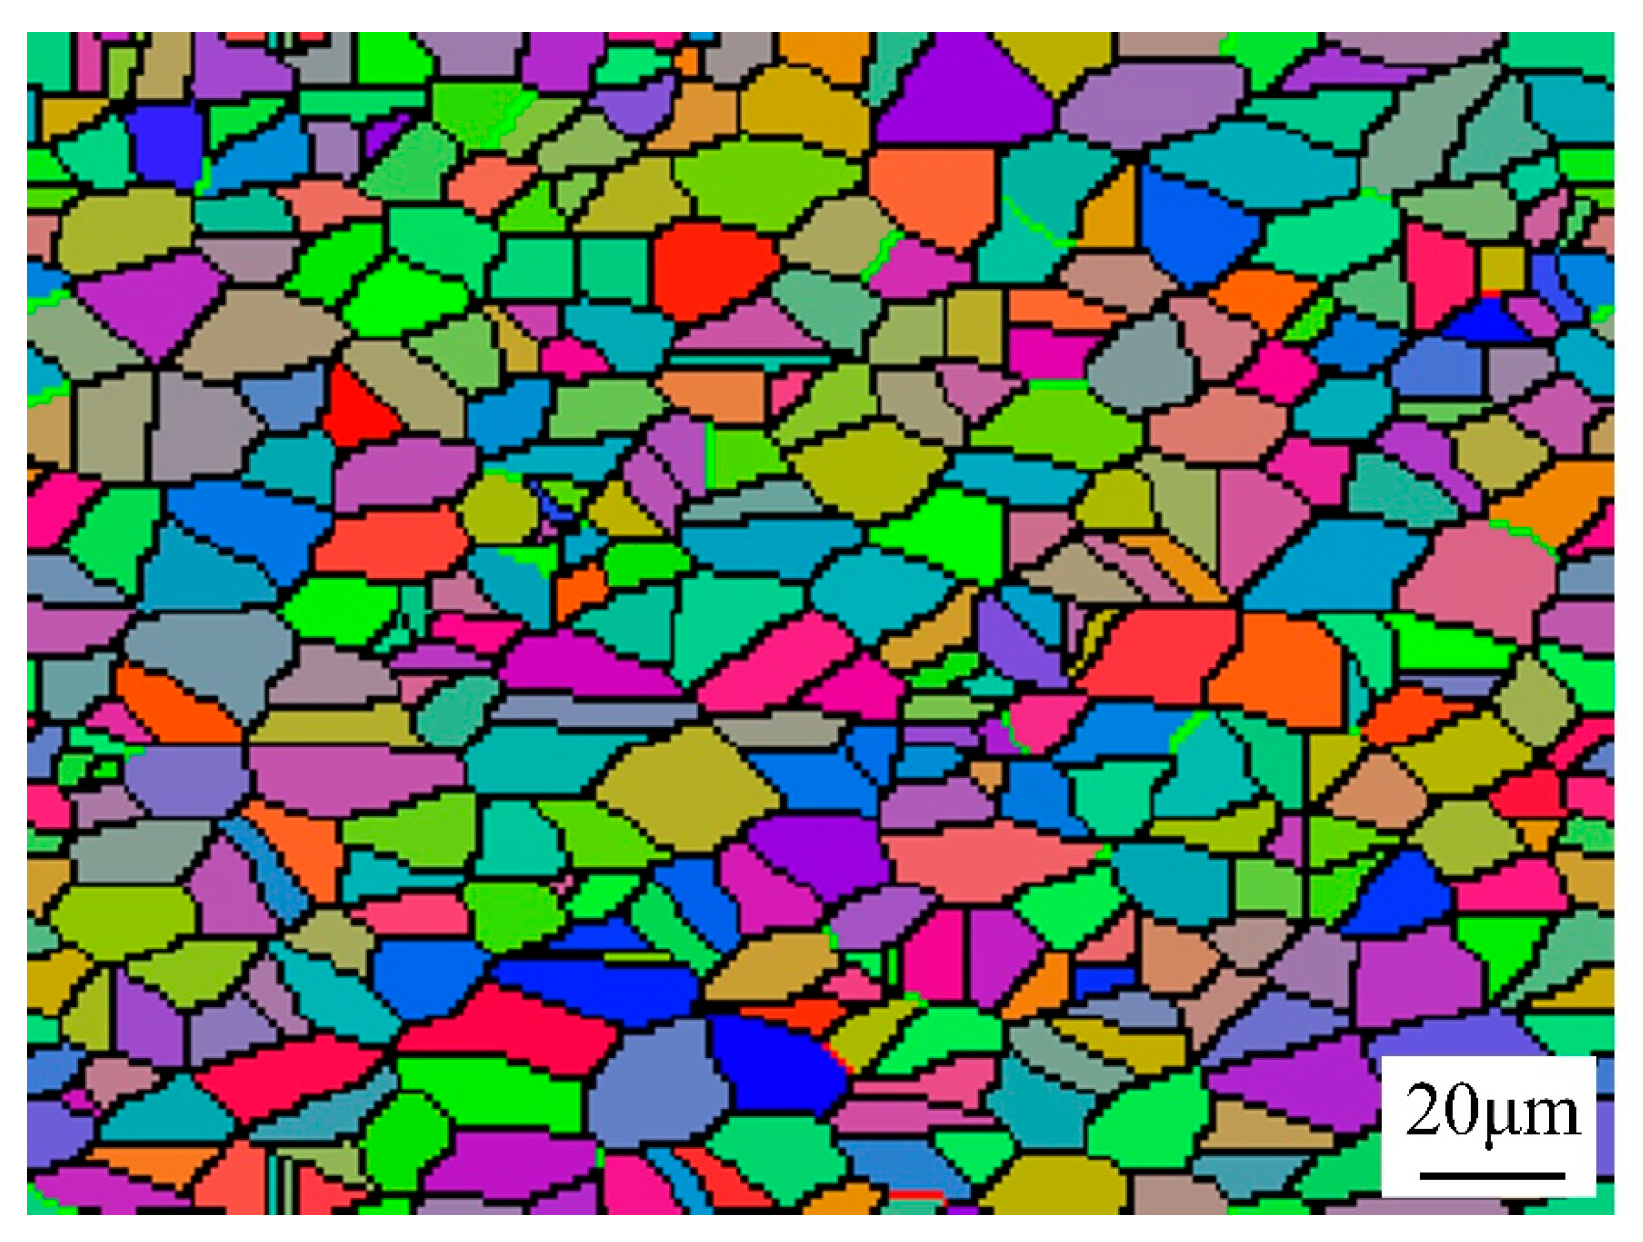
4.1. Microstructure Evolution in the Critical Areas During Differential Heating Push-Bending
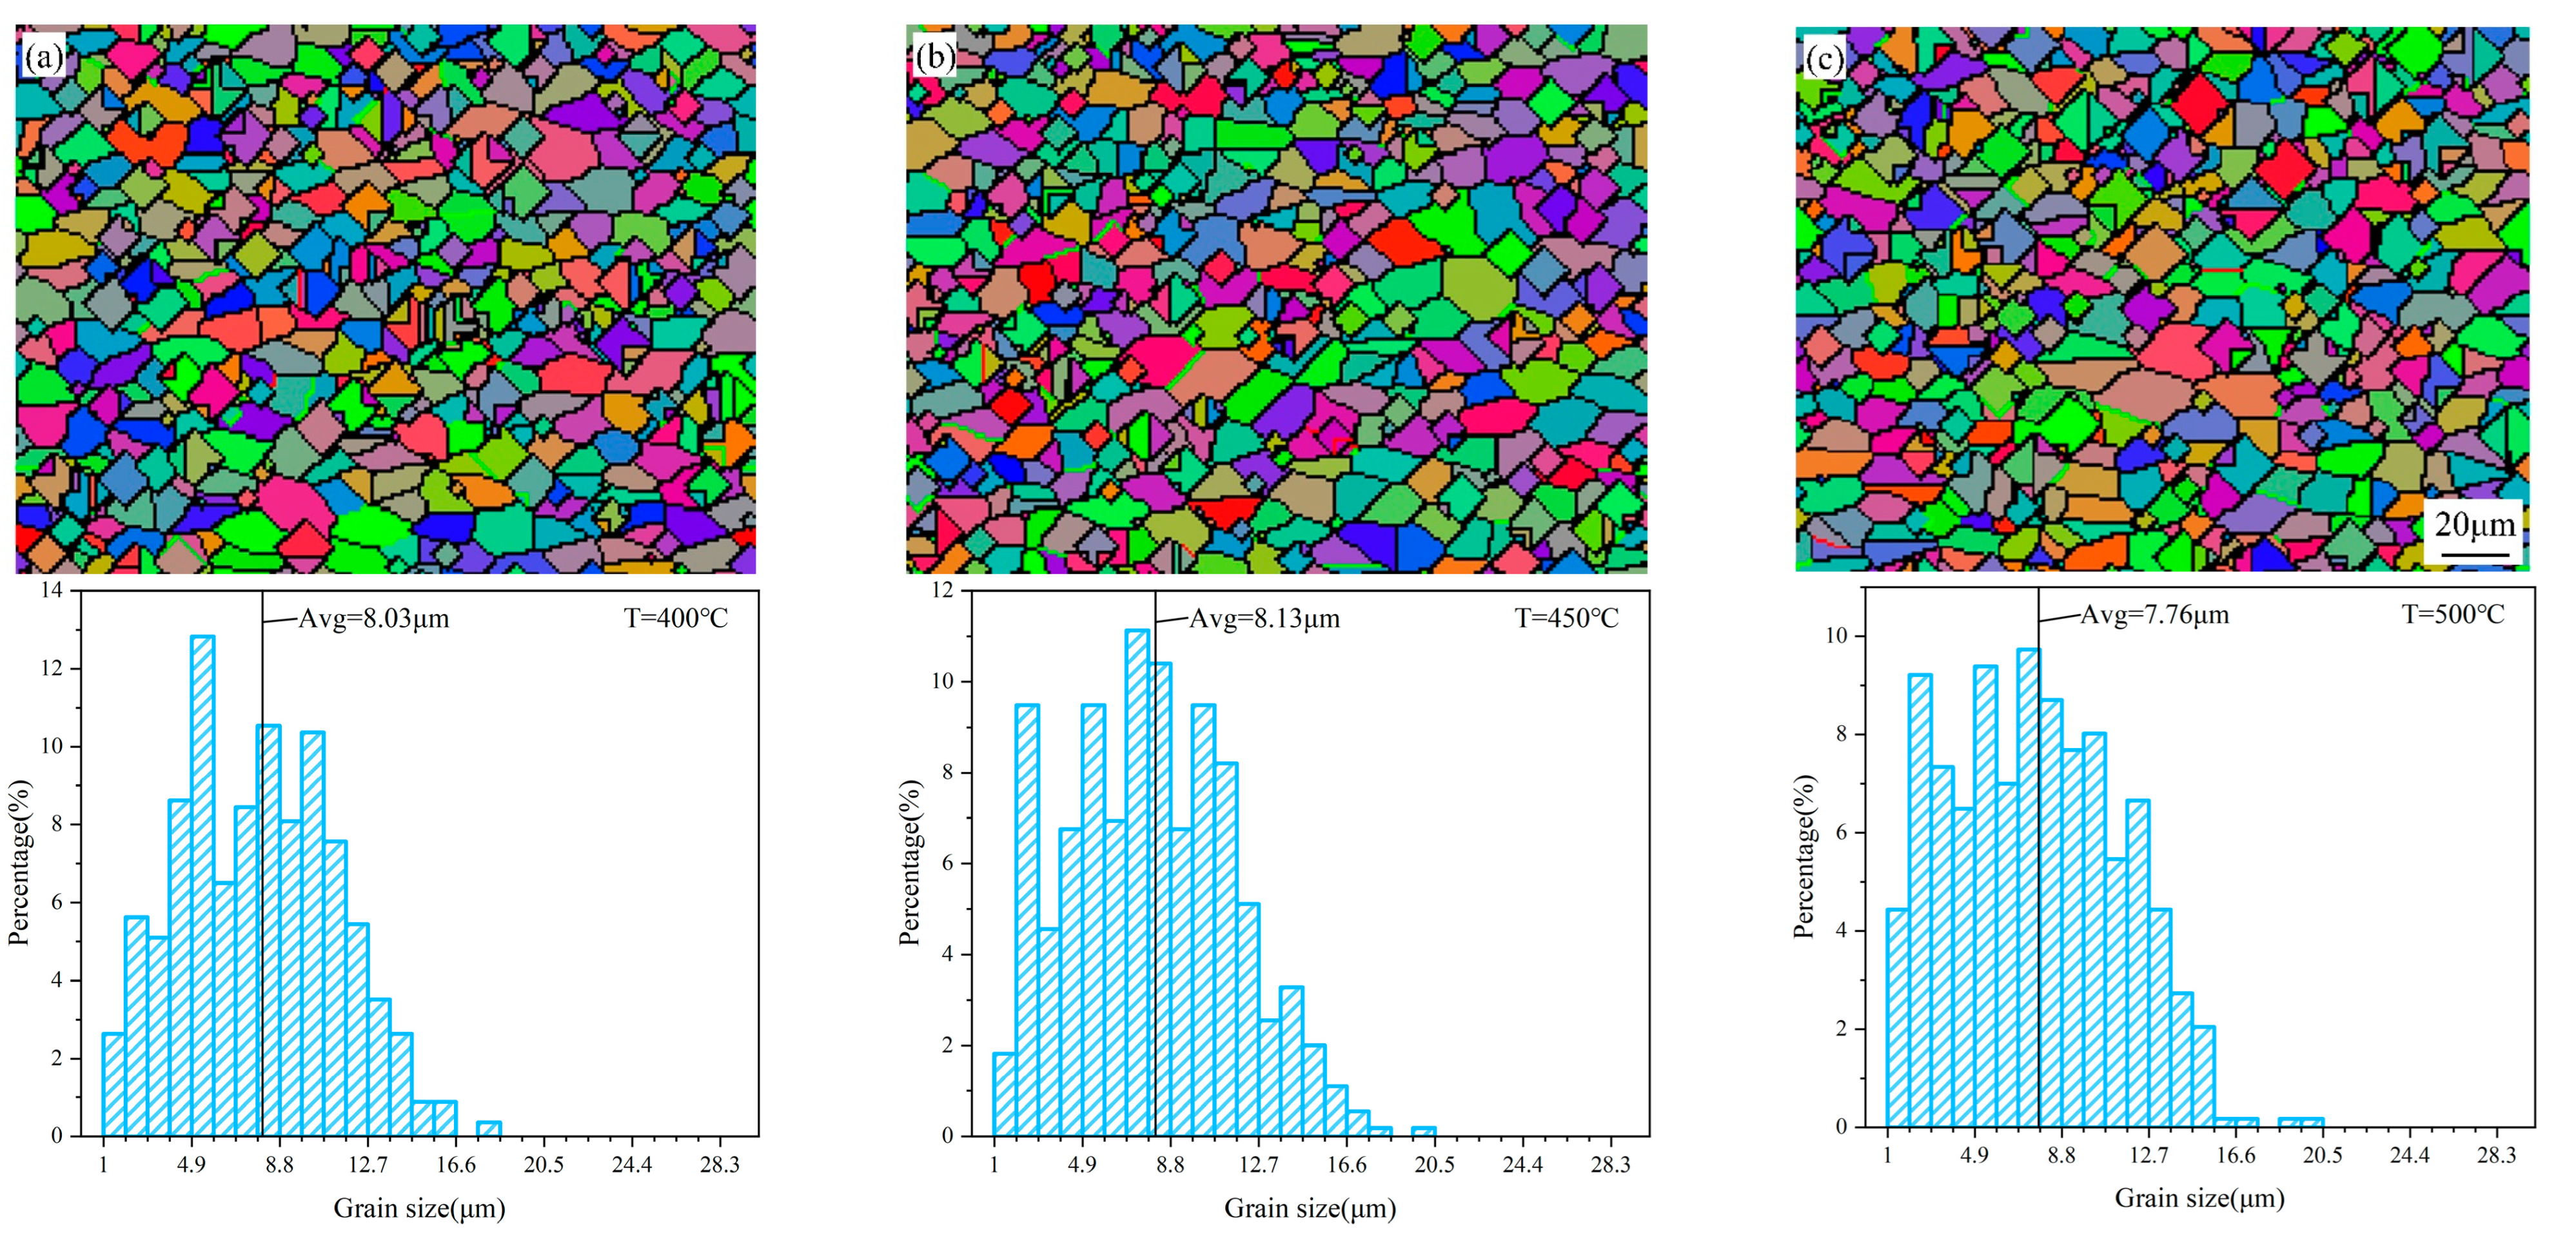
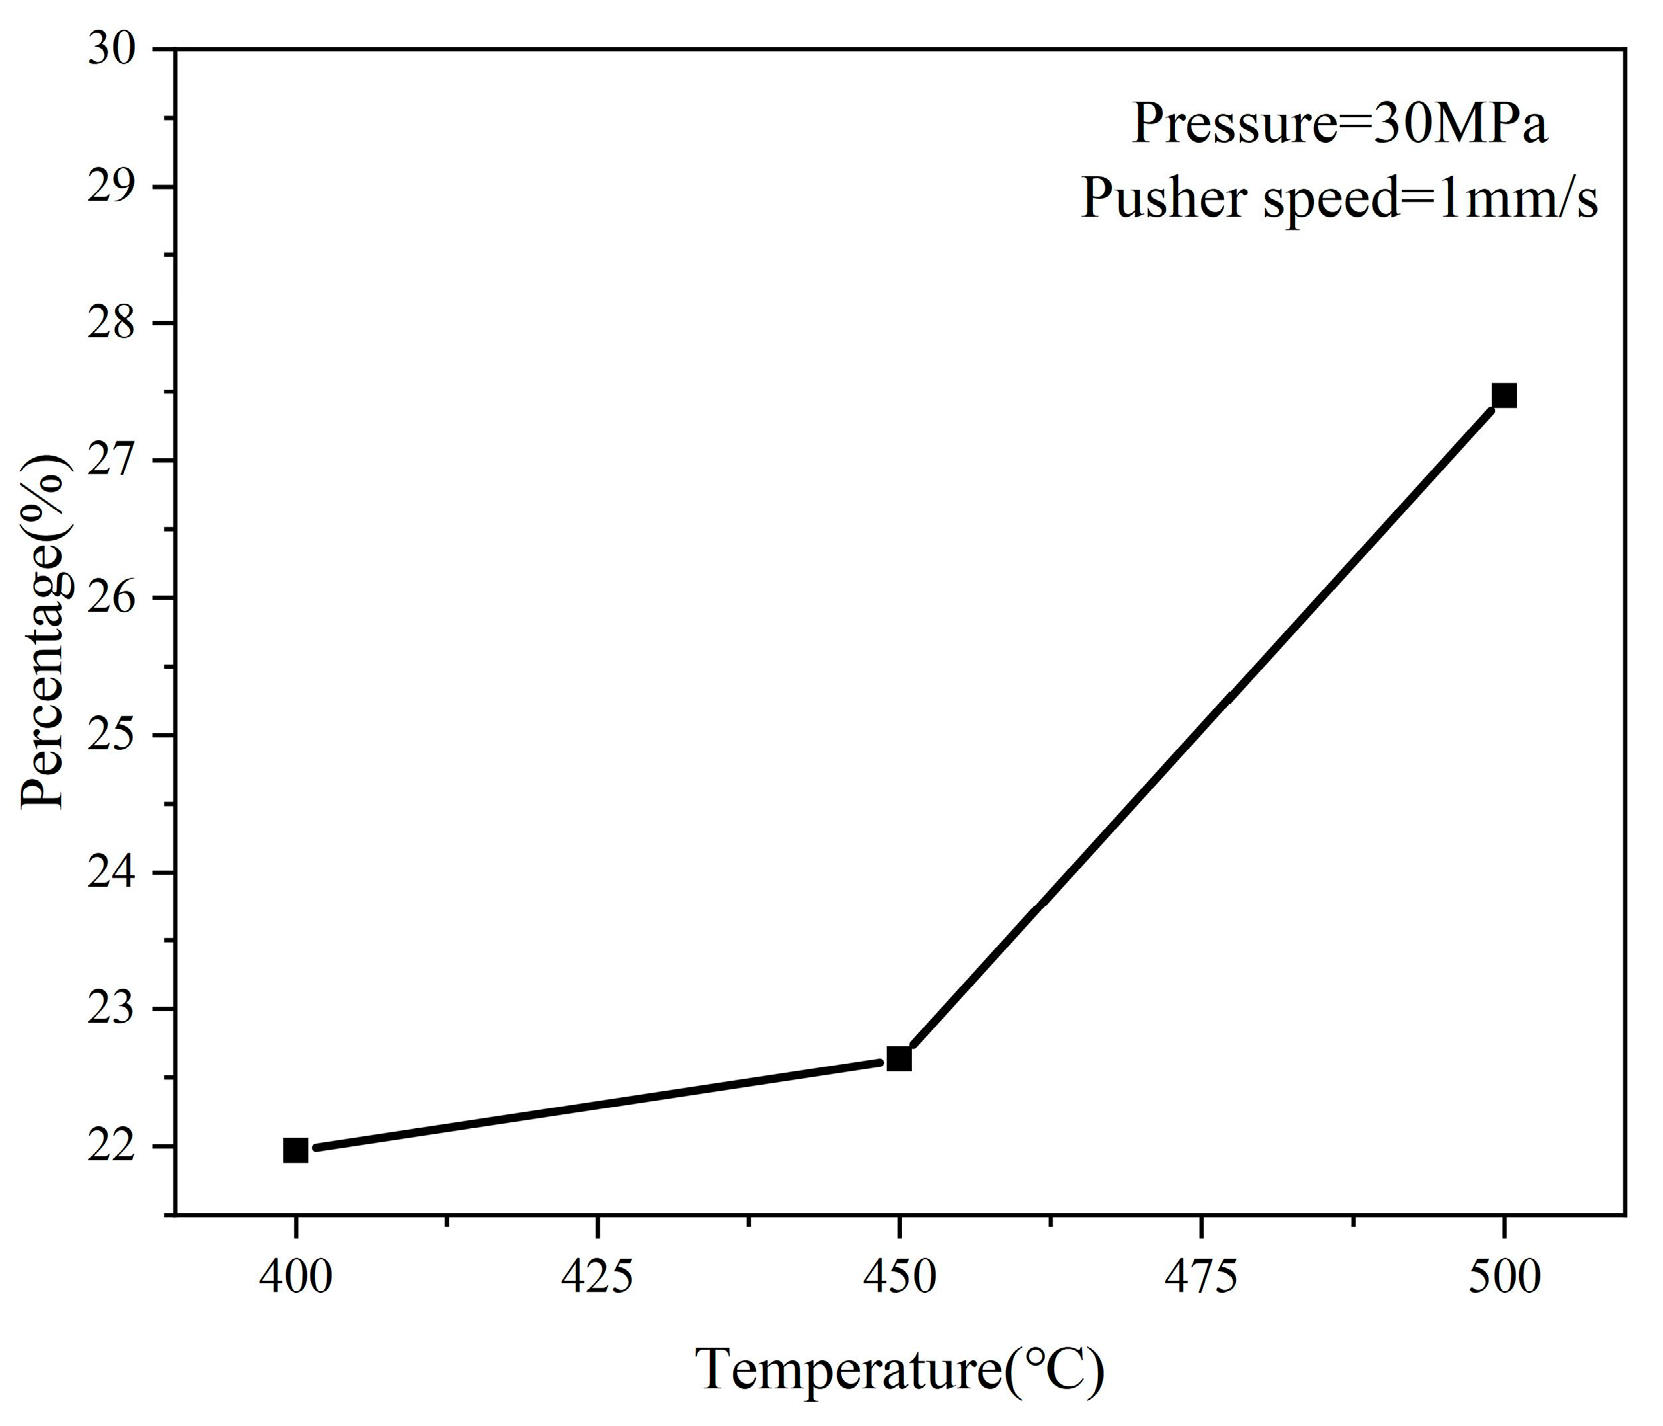
4.2. The Effect of Heating Temperature on the Evolution of Microstructure
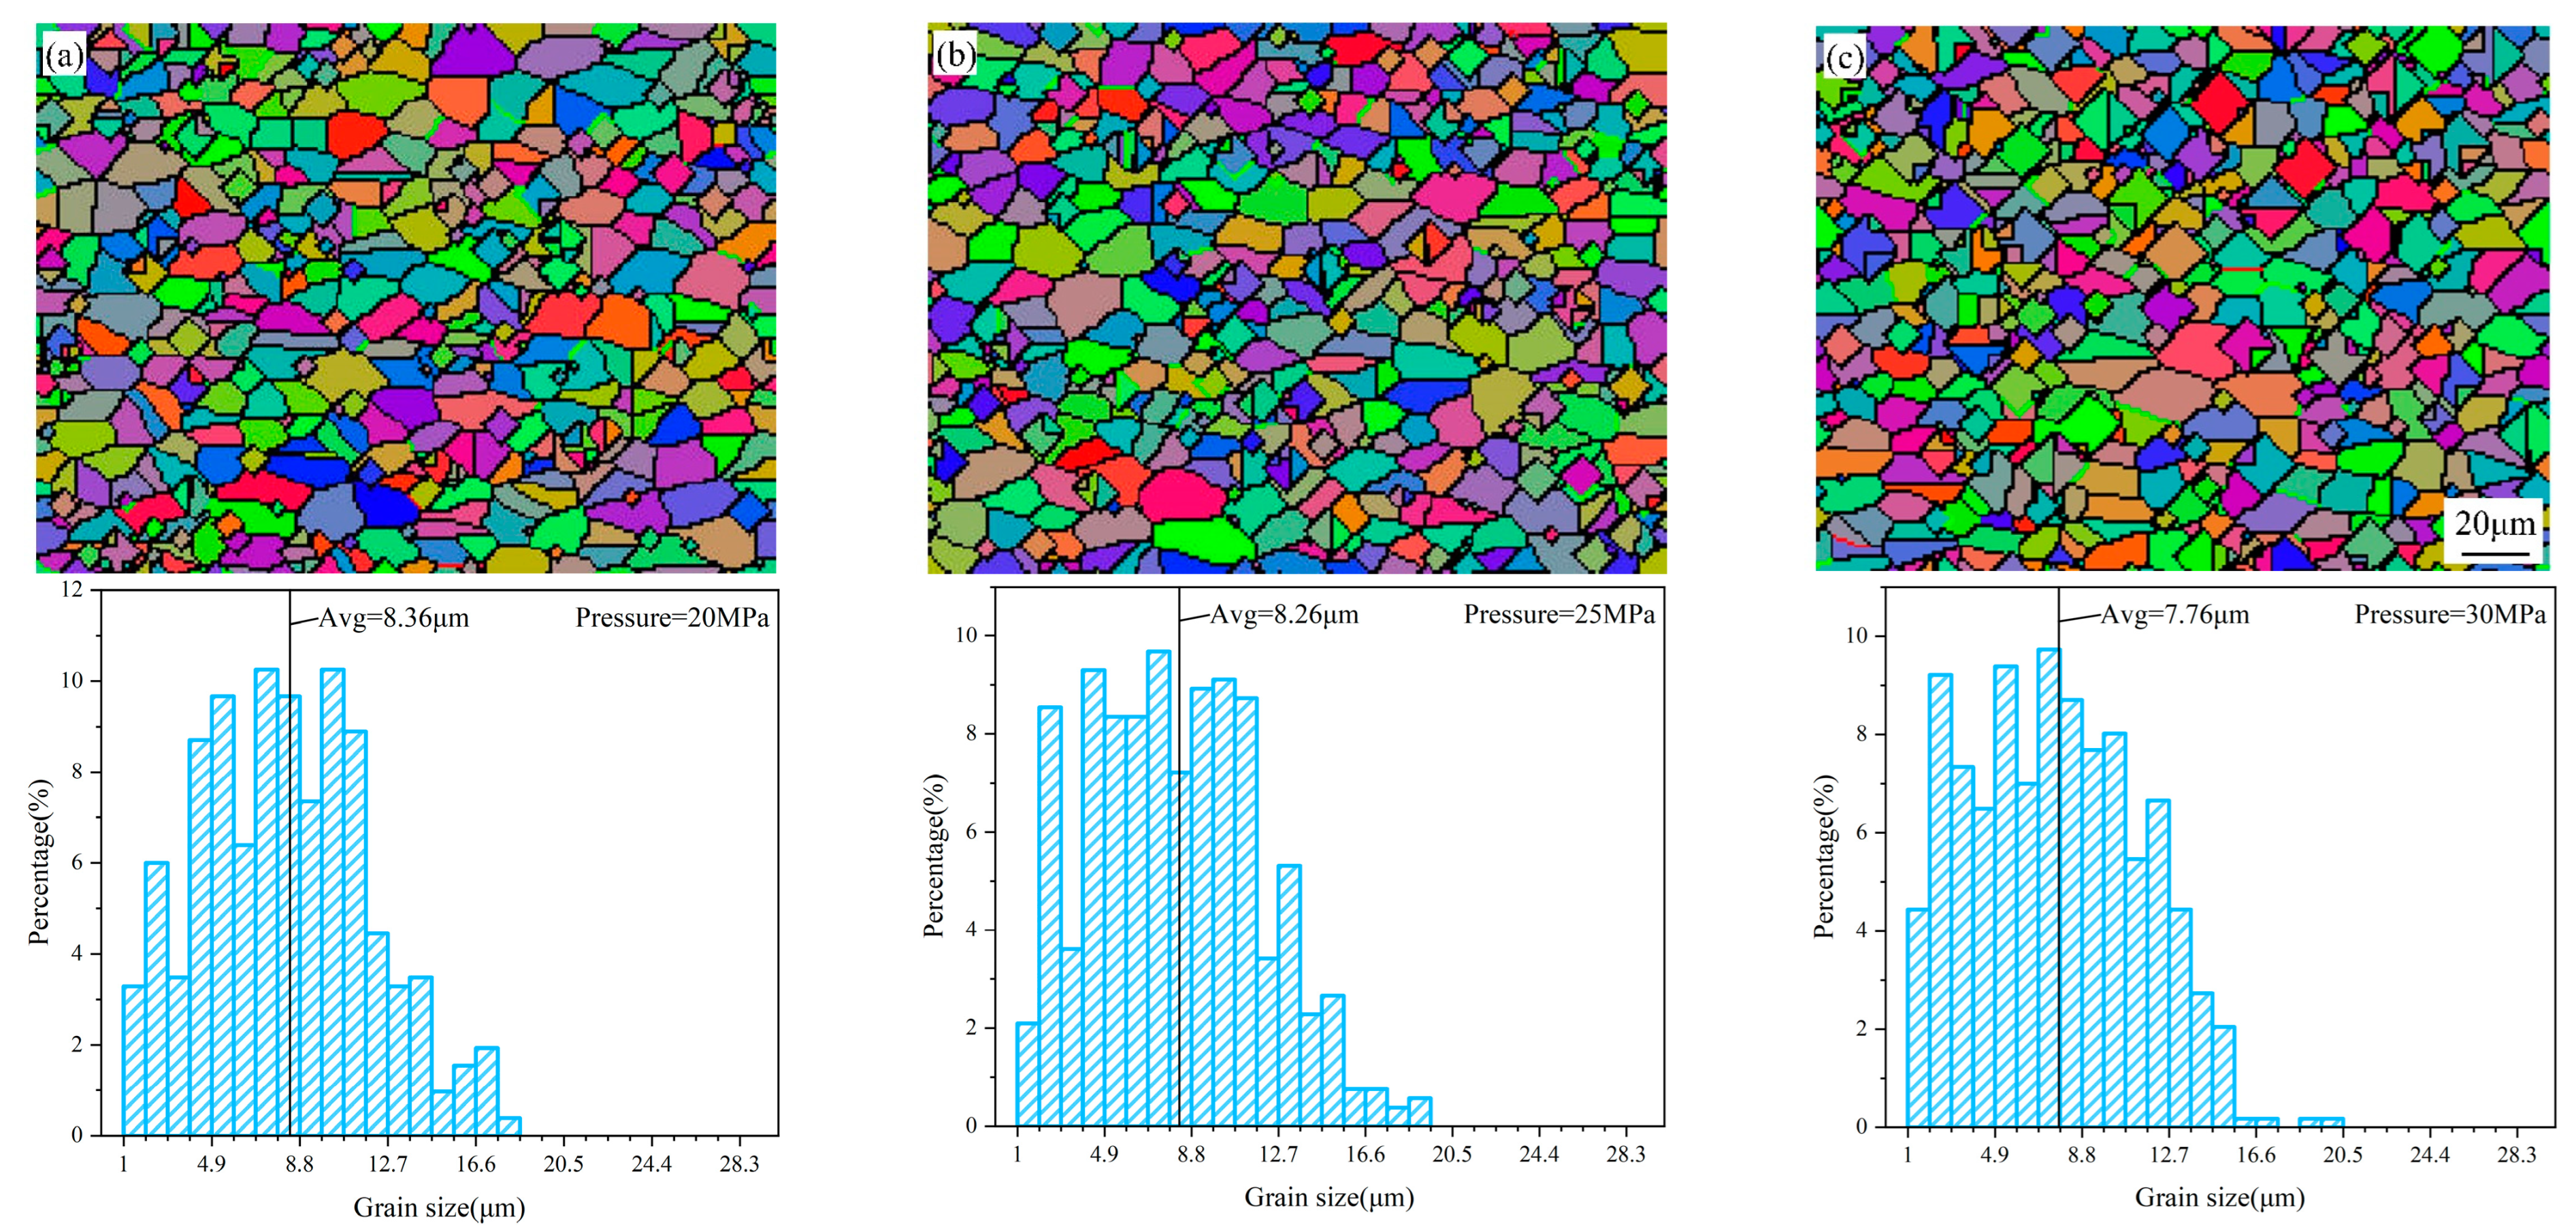
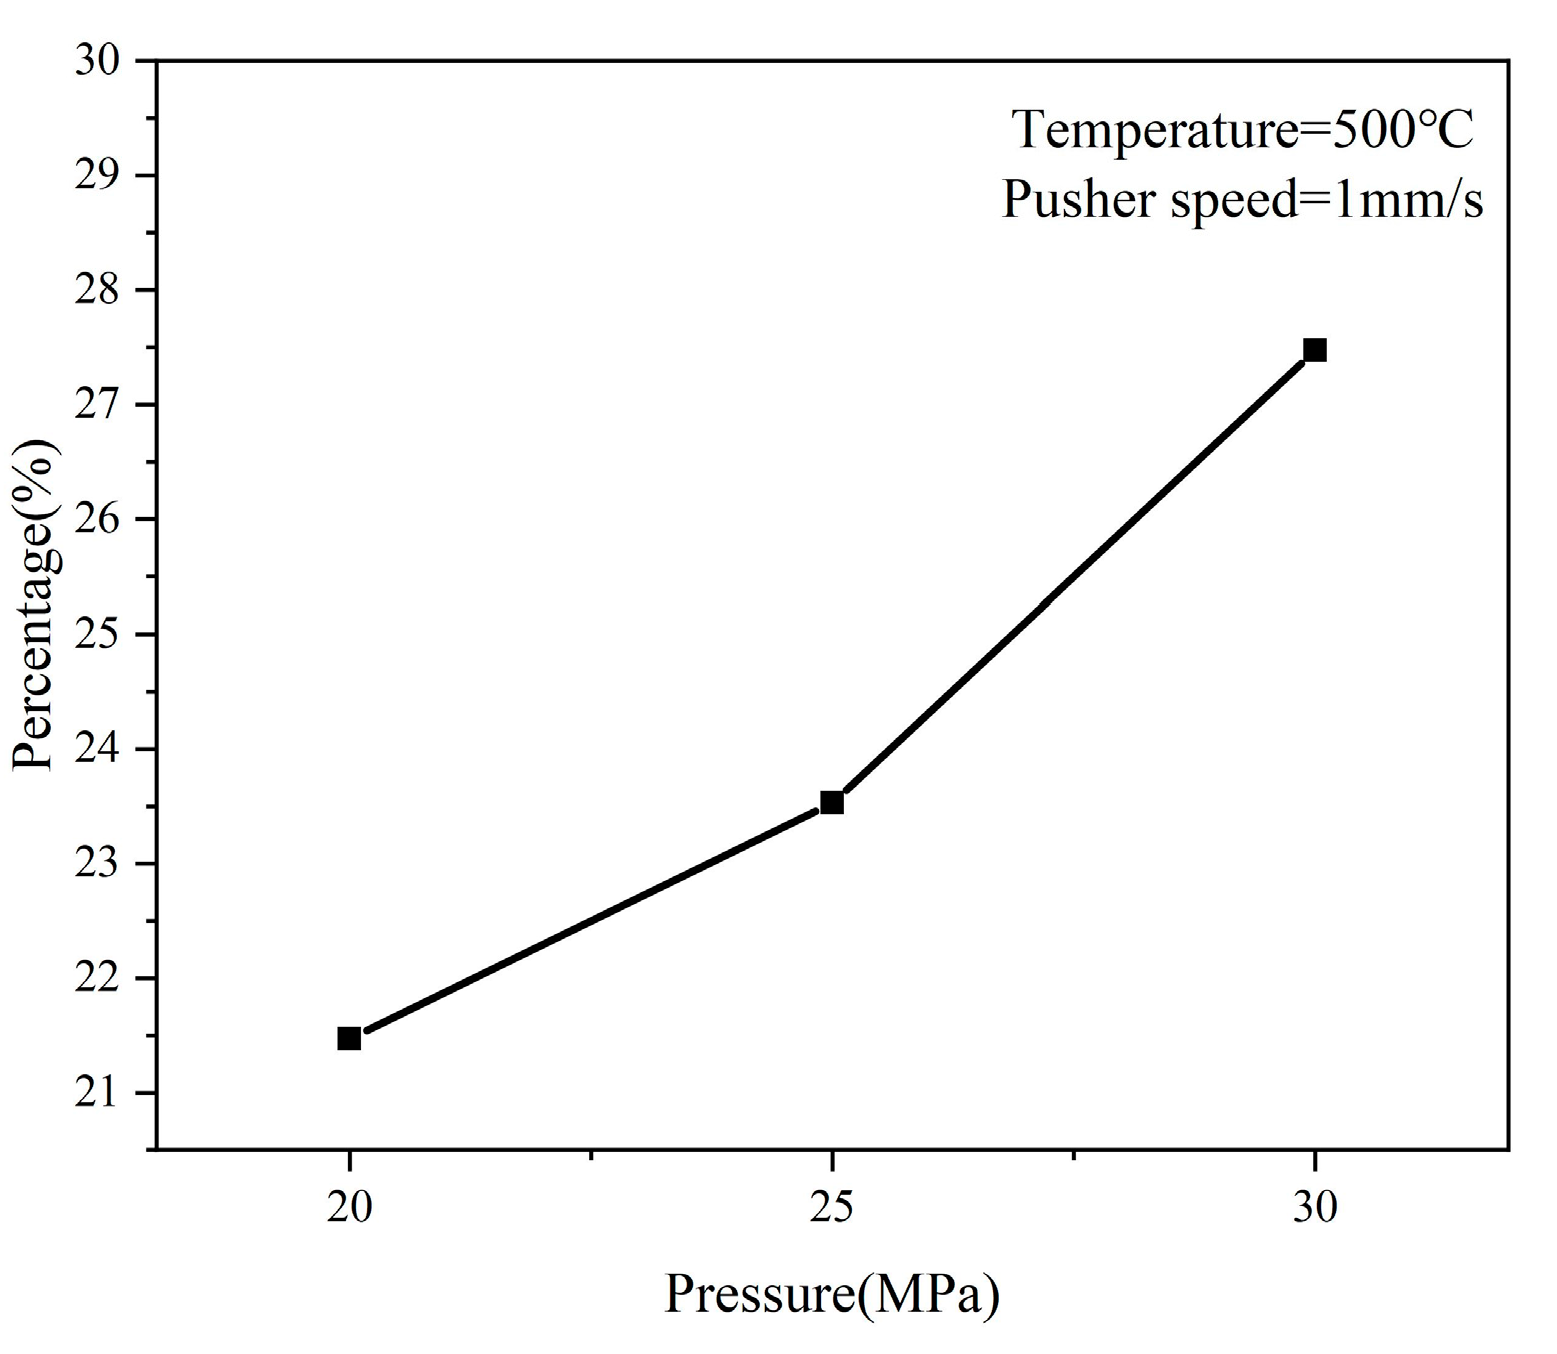
4.3. The Effect of Internal Pressure on the Evolution of Microstructure
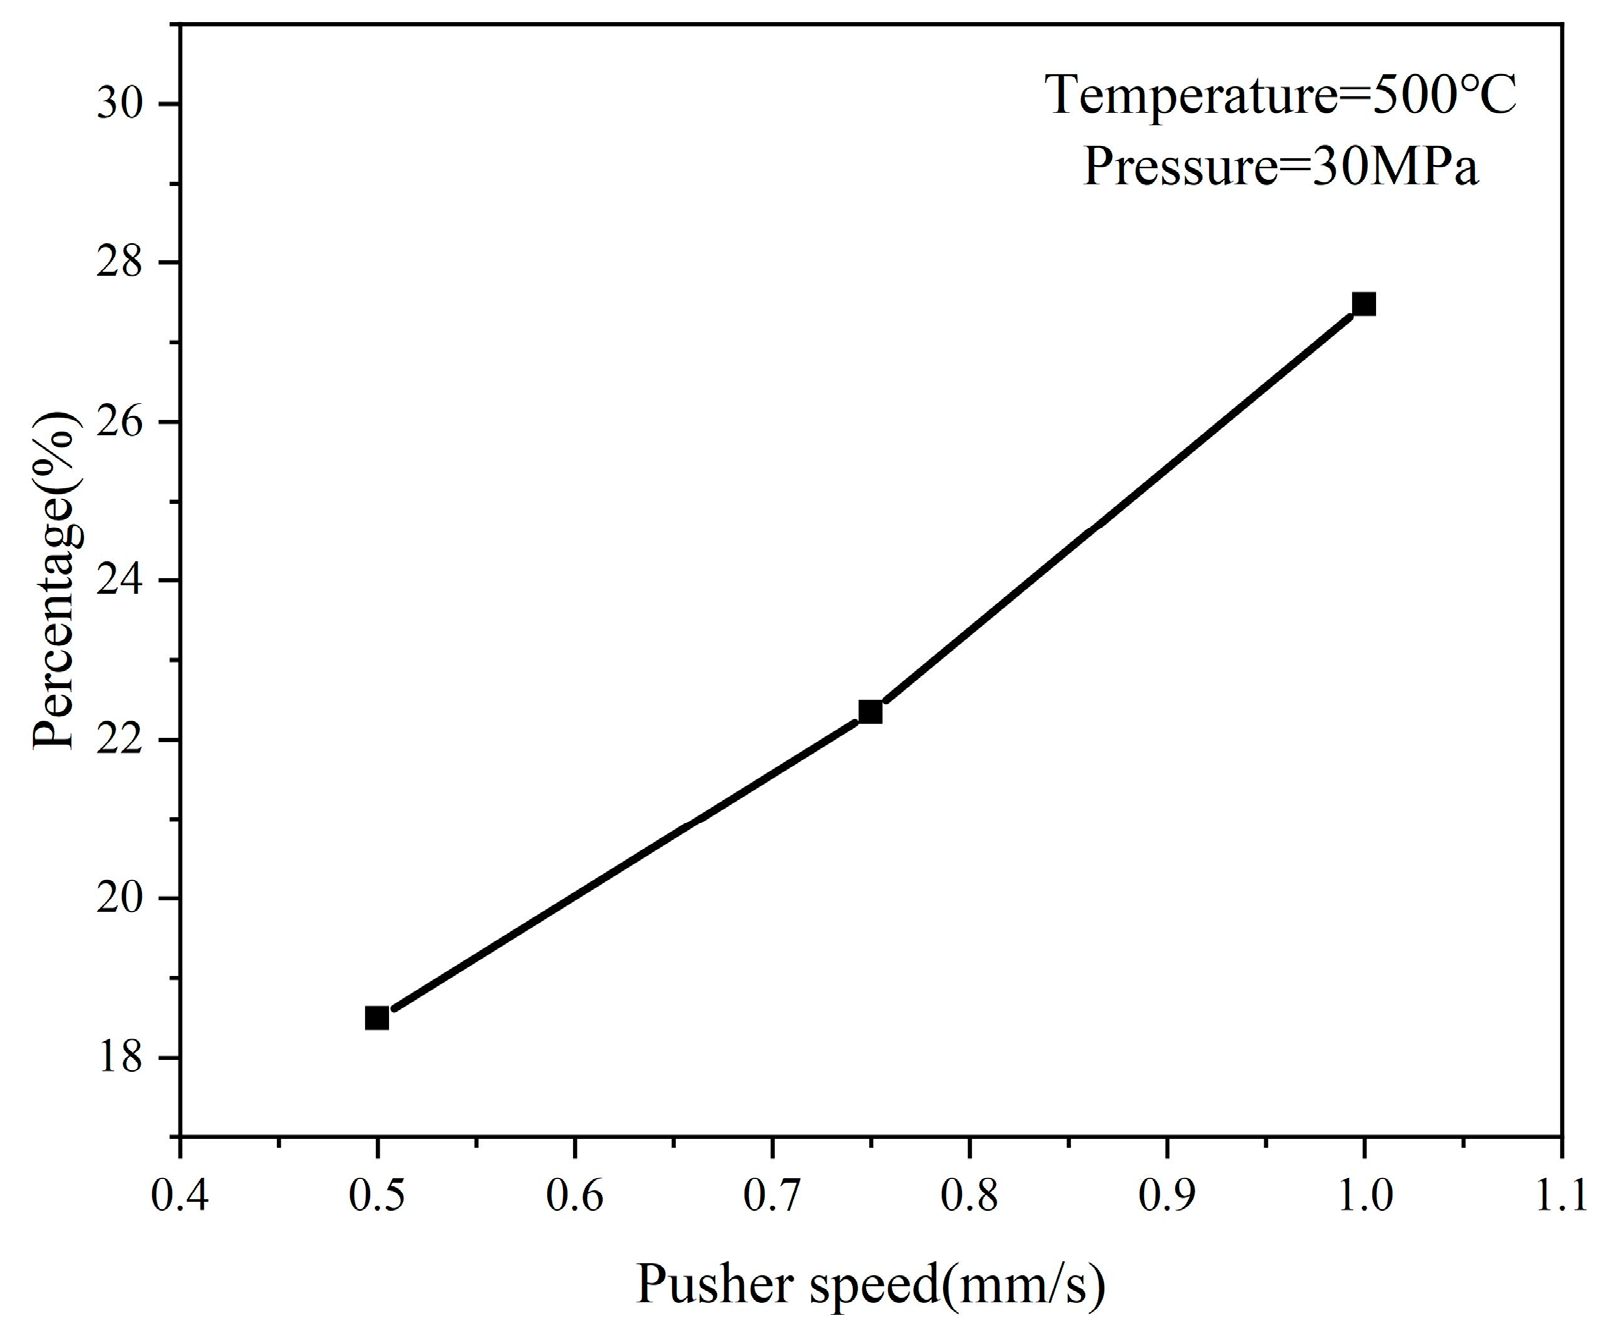
4.4. The Effect of Feed Speed on the Evolution of Microstructure
5. Conclusions
- (1)
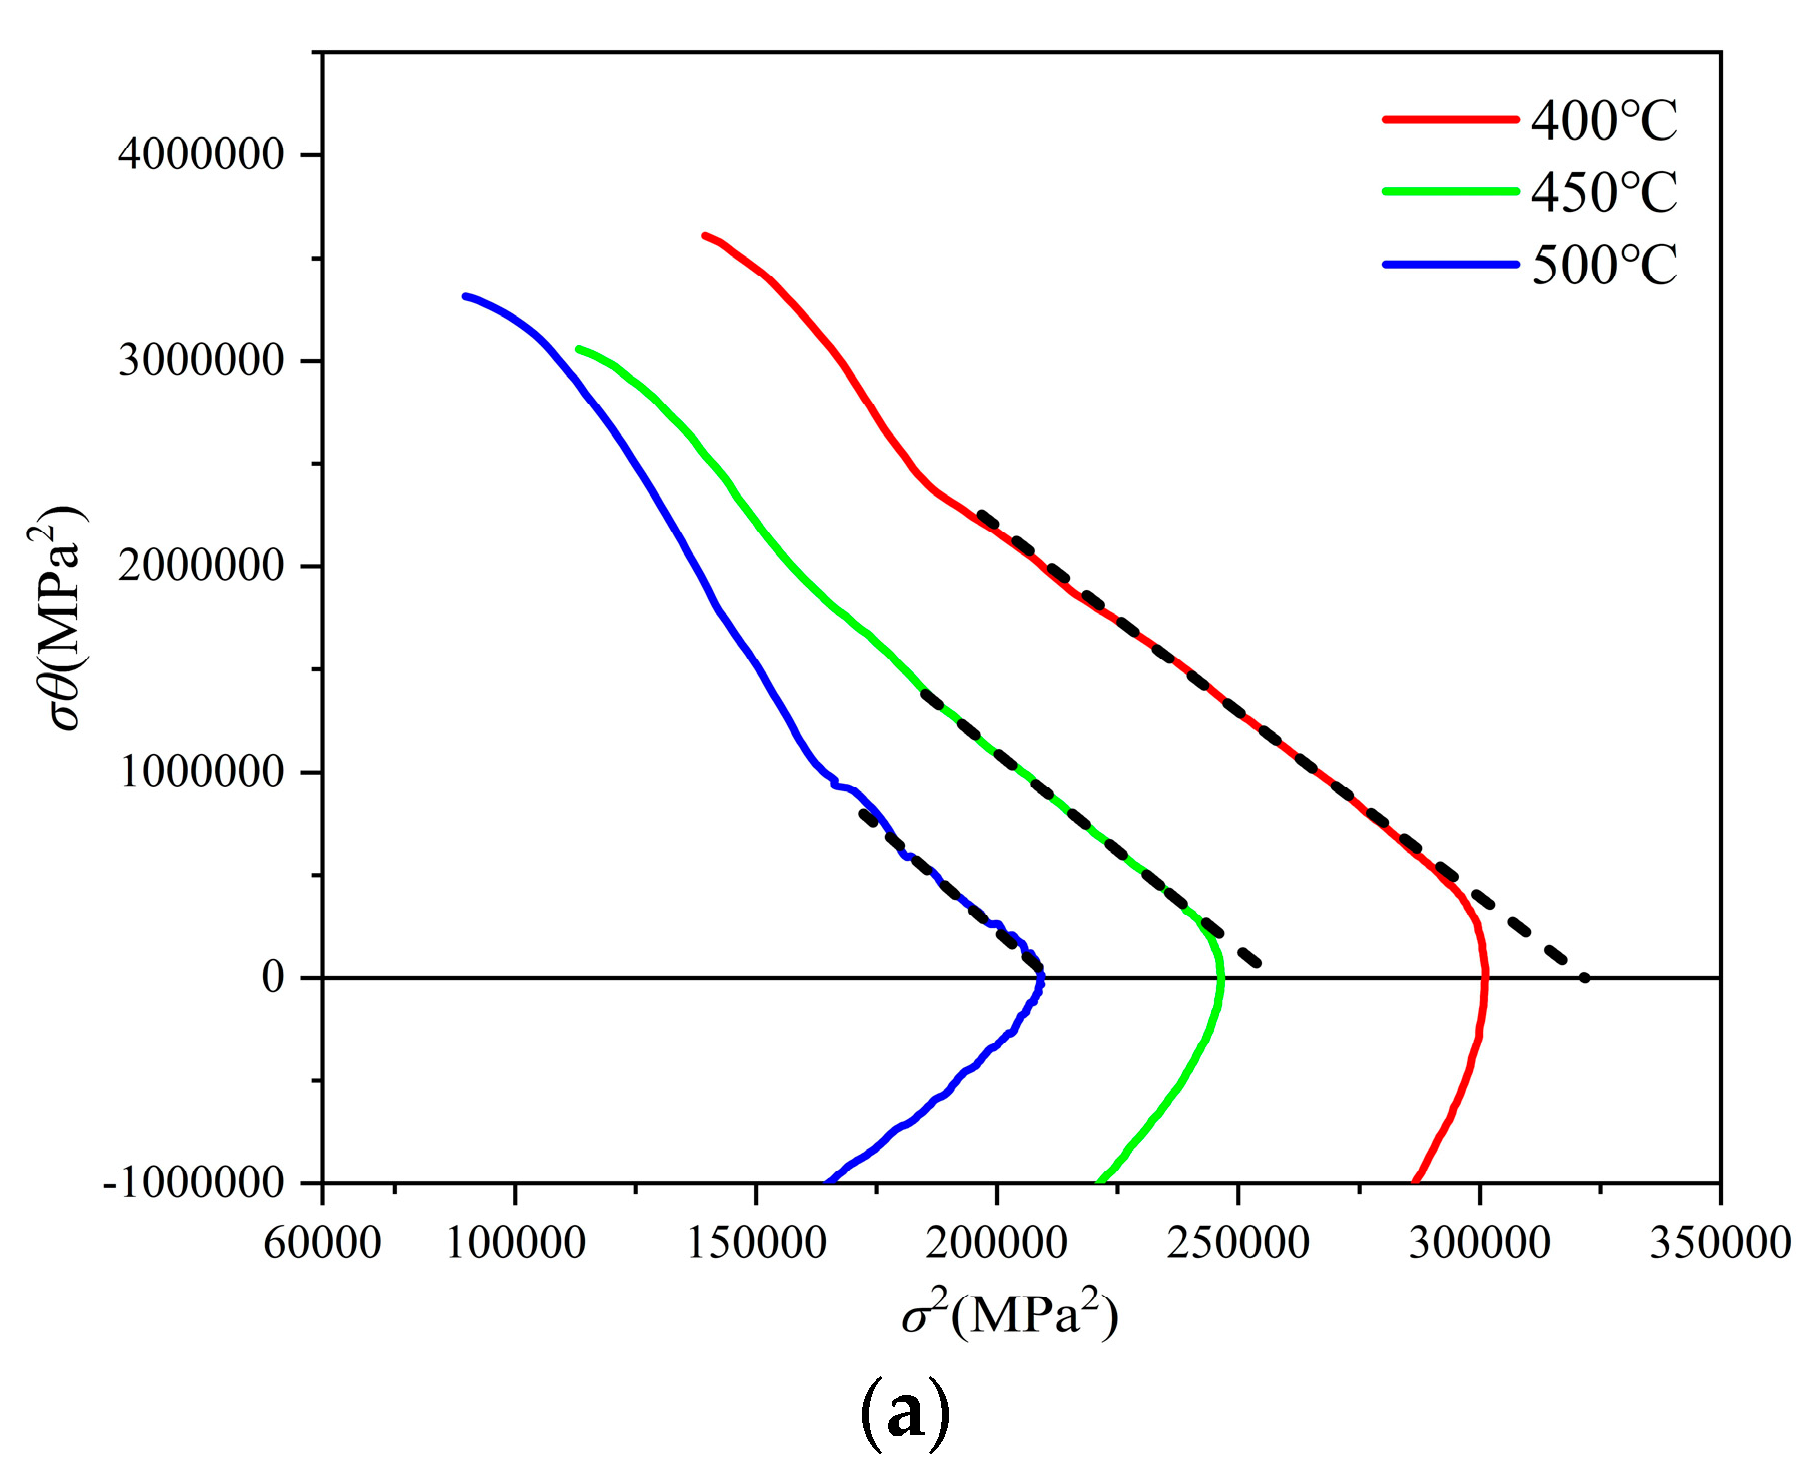
- Integrating the mesoscale simulation method into the study of the microstructure evolution of TA18 titanium alloy tubes in the differential heating push-bending forming process, key parameters of the CA model were determined based on a high-temperature tensile test as follows: self-diffusion activation energy = 227,132 J·mol−1, hardening constant = 0.07412, recovery constant = 66.2889, and strain-rate sensitivity coefficient = 0.01735.
- (2)
- Combining simulation with experimentation, a finite element model for differential heating push-bending of TA18 titanium alloy tubes was established, and microstructure simulation based on the CA method was conducted. Concurrently, experiments yielded qualified tubes with a small bending radius of 0.9D, and the average grain size of the microstructure in key areas of the formed tubes was measured. The deviation between these measurements and the CA simulation results was within 6%.
- (3)
- During the differential heating push-bending process of TA18 titanium alloy tubes, the average grain size on the outer side of the bend gradually decreases with the increase of plastic deformation, indicating dynamic recrystallization. On the inner side of the bend, no recrystallization phenomenon occurs due to the lower temperature. Different process parameters have a significant impact on the microstructure on the outer side of the bend. Fine grain strengthening effects, which are beneficial for enhancing the comprehensive mechanical properties of the material on the outer side of the bend, can be achieved under the conditions of a heating temperature of 500 °C, internal pressure of 30 MPa, and pusher feed speed of 1 mm/s.
Author Contributions
Funding
Institutional Review Board Statement
Informed Consent Statement
Data Availability Statement
Conflicts of Interest
References
- Yang, Z.; Wu, J.; Wang, M.; Zhang, Z.; Yan, J.; Wu, W.; Liu, L.; Wang, H.; Wang, W. Tensile deformation behavior of high-strength TA18 titanium alloy tube under warm forming conditions and constitutive model based on dislocation density. Mater. Today Commun. 2023, 37, 107336. [Google Scholar] [CrossRef]
- Zhang, Z.; Yang, J.; Huang, W.; Ma, J.; Li, H. Uncertainty analysis and robust design optimization for the heat-assisted bending of high-strength titanium tube. Sci. China Technol. Sci. 2021, 64, 2174–2185. [Google Scholar] [CrossRef]
- Li, Z.; Zhan, M.; Guo, K.; Huang, T. Texture development of Ti-3Al-2.5V titanium alloy tubes. Rare Mat. Mat. Eng. 2017, 46, 3169–3175. [Google Scholar] [CrossRef]
- Yang, H.; Li, H.; Ma, J.; Li, G.; Huang, D. Breaking bending limit of difficult-to-form titanium tubes by differential heating-based reconstruction of neutral layer shifting. Int. J. Mach. Tool. Manu. 2021, 166, 103742. [Google Scholar] [CrossRef]
- Han, D.; Zhao, Y.; Zeng, W.; Li, L.; Zhang, Y. Cellular automata based microstructure prediction in accumulative roll-bonding of TA15 sheets. Rare Metal. Mat. Eng. 2021, 50, 3437–3445. [Google Scholar] [CrossRef]
- Fang, J.; Liang, C.; Lu, S.; Wang, K. Effect of geometrical parameters on forming quality of high-strength TA18 titanium alloy tube in numerical control bending. Trans. Nonferrous Met. Soc. China 2018, 28, 309–318. [Google Scholar] [CrossRef]
- Tao, R.; Xu, X.; Fan, Y.; Xiao, J.; Wang, Y.; Wei, L. Differential flow velocities control method for push-bending of the thin-walled tube with a 0.9D bending radius by differential lubrication. Int. J. Adv. Manuf. Technol. 2023, 124, 3359–3369. [Google Scholar] [CrossRef]
- Huang, L.; Zhang, X.; Lu, X.; Zhong, Q. Technological parameters optimization and numerical simulation of hot pushing pipe bending process. Int. J. Adv. Manuf. Technol. 2023, 126, 4439–4451. [Google Scholar] [CrossRef]
- Cheng, Z.; Abd El-Aty, A.; Zhang, R.; Cheng, C.; Guo, X.; Tao, J. Finite element modeling and experimental investigation on manufacturing TA18 alloy pipes via hot free bending forming technology: Forming characteristics and process optimization. J. Mater. Res. Technol. 2024, 29, 5225–5240. [Google Scholar] [CrossRef]
- Zhang, T.; Chen, J.; Gong, H.; Wu, Y.; Hao, T.; He, X. Microstructure simulation of AA2219 alloy in hot/warm forming and heat treatment using cellular automata methods. J. Mater. Sci. 2023, 58, 7968–7985. [Google Scholar] [CrossRef]
- Cao, Z.; Sun, Y.; Zhou, C.; Wan, Z.; Yang, W.; Ren, L.; Hu, L. Cellular automaton simulation of dynamic recrystallization behavior in V-10Cr-5Ti alloy under hot deformation conditions. Trans. Nonferrous Met. Soc. China 2019, 29, 98–111. [Google Scholar] [CrossRef]
- Ji, H.; Peng, Z.; Huang, X.; Wang, B.; Xiao, W.; Wang, S. Dynamic recrystallization of Ti-6Al-4V titanium alloy based on cellular automata. Proc. Inst. Mech. Eng. Part E 2023, 237, 1442–1459. [Google Scholar] [CrossRef]
- Li, W.; Li, S.; Li, X.; Xu, D.; Shao, Y.; Attallah, M.M.; Essa, K. Crystal plasticity model of induction heating-assisted incremental sheet forming with recrystallisation simulation in cellular automata. Int. J. Adv. Manuf. Technol. 2022, 123, 903–925. [Google Scholar] [CrossRef]
- Asgharzadeh, A.; Nazari Tiji, S.; Park, T.; Kim, J.; Pourboghrat, F. Cellular automata modeling of the kinetics of static recrystallization during the post-hydroforming annealing of steel tube. J. Mater. Sci. 2020, 55, 7938–7957. [Google Scholar] [CrossRef]
- Yu, Z.; Peng, W.; Zhang, X.; Oleksandr, M.; Titov, V. Evolution of microstructure of aluminum alloy hollow shaft in cross wedge rolling without mandrel. J. Cent. South Univ. 2022, 29, 807–820. [Google Scholar] [CrossRef]
- Majta, J.; Madej, L.; Svyetlichnyy, D.; Perzynski, K.; Kwiecien, M.; Muszka, K. Modeling of the inhomogeneity of grain refinement during combined metal forming process by finite element and cellular automata methods. Mat. Sci. Eng. A 2016, 671, 204–213. [Google Scholar] [CrossRef]
- Yao, Y. Research on Microstructure Evolution Law of TA18 Titanium Alloy During Isothermal Hot Shear Bending Deformation. Master’s Thesis, Harbin Institute of Technology, Harbin, China, 2020. (In Chinese). [Google Scholar]
- ISO 6892-2:2011; Metallic Materials—Tensile Testing—Part 2: Method of Test at Elevated Temperature. International Organization for Standardization: Geneva, Switzerland, 2011.
- Wei, L. Study on Necking and Thickening Process of TA18 Titanium Alloy Thin-Walled Tube. Master’s Thesis, Nanchang Hangkong University, Nanchang, China, 2022. (In Chinese). [Google Scholar]
- Li, H.; Sun, X.; Yang, H. A three-dimensional cellular automata-crystal plasticity finite element model for predicting the multiscale interaction among heterogeneous deformation, DRX microstructural evolution and mechanical responses in titanium alloys. Int. J. Plast. 2016, 87, 154–180. [Google Scholar] [CrossRef]
- Zhang, Y.; Quan, G.; Lei, S.; Zhao, J.; Xiong, W. Description of dynamic recrystallization behaviors and grain evolution mechanisms during the hot forming process for SAE 5137H steel. Materials 2022, 15, 5593. [Google Scholar] [CrossRef]
- Liu, L.; Wu, Y.; Ahmad, A. A novel simulation of continuous dynamic recrystallization process for 2219 aluminium alloy using cellular automata technique. Mater. Sci. Eng. A 2021, 815, 141256. [Google Scholar] [CrossRef]
- Mecking, H.; Kocks, U. Kinetics of flow and strain-hardening. Acta Metall. 1981, 29, 1865–1875. [Google Scholar] [CrossRef]
- He, Y.; Pan, Q.; Qin, Y.; Liu, X.; Li, W.; Chiu, Y.; Chen, J. Dynamic recrystallization kinetics of ZK60 magnesium alloy during hot deformation. Chin. J. Nonferrous Met. 2011, 21, 205–1213. [Google Scholar] [CrossRef]
- Cui, C.; He, J.; Wang, W.; Chen, W.; Zhang, W. Microstructure, texture and mechanical properties of extruded AZ31 Mg alloy during small strain multi-directional forging with gradient cooling. J. Alloys Compd. 2022, 909, 164795. [Google Scholar] [CrossRef]


| Al | V | Fe | O | C | N | H | Ti |
|---|---|---|---|---|---|---|---|
| 2.0~3.5 | 1.5~3.0 | 0.25 | 0.12 | 0.08 | 0.05 | 0.015 | Bal. |
| Parameters | Value |
|---|---|
| Ambient temperature/°C | 20 |
| Convective heat transfer coefficient/(W·m−2·K−1) | 20 |
| Heat capacity of tube/(N·mm−2·K−1) | 3.84 |
| Interface heat transfer coefficient of tube and die/(W·m−2·K−1) | 1.1 × 10⁴ |
| Thermal radiation rate | 0.7 |
| Parameters | Value |
|---|---|
| Cell space/μm2 | 160 × 215 |
| Self-diffusion activation energy /(J·mol−1) | 227,132 |
| Hardening constant | 0.07412 |
| Recovery constant | 66.2889 |
| Strain-rate sensitivity coefficient | 0.01735 |
| Critical dislocation density/μm2 | 0.02 |
| Nucleation rate | 0.001 |
| Grain boundary migration velocity/μm·s−1 | 1 × 10⁻⁵ |
| Shear modulus/Pa | 4.7 × 10⁻¹⁰ |
| Burgers vector/m | 3.7 × 10⁻¹⁰ |
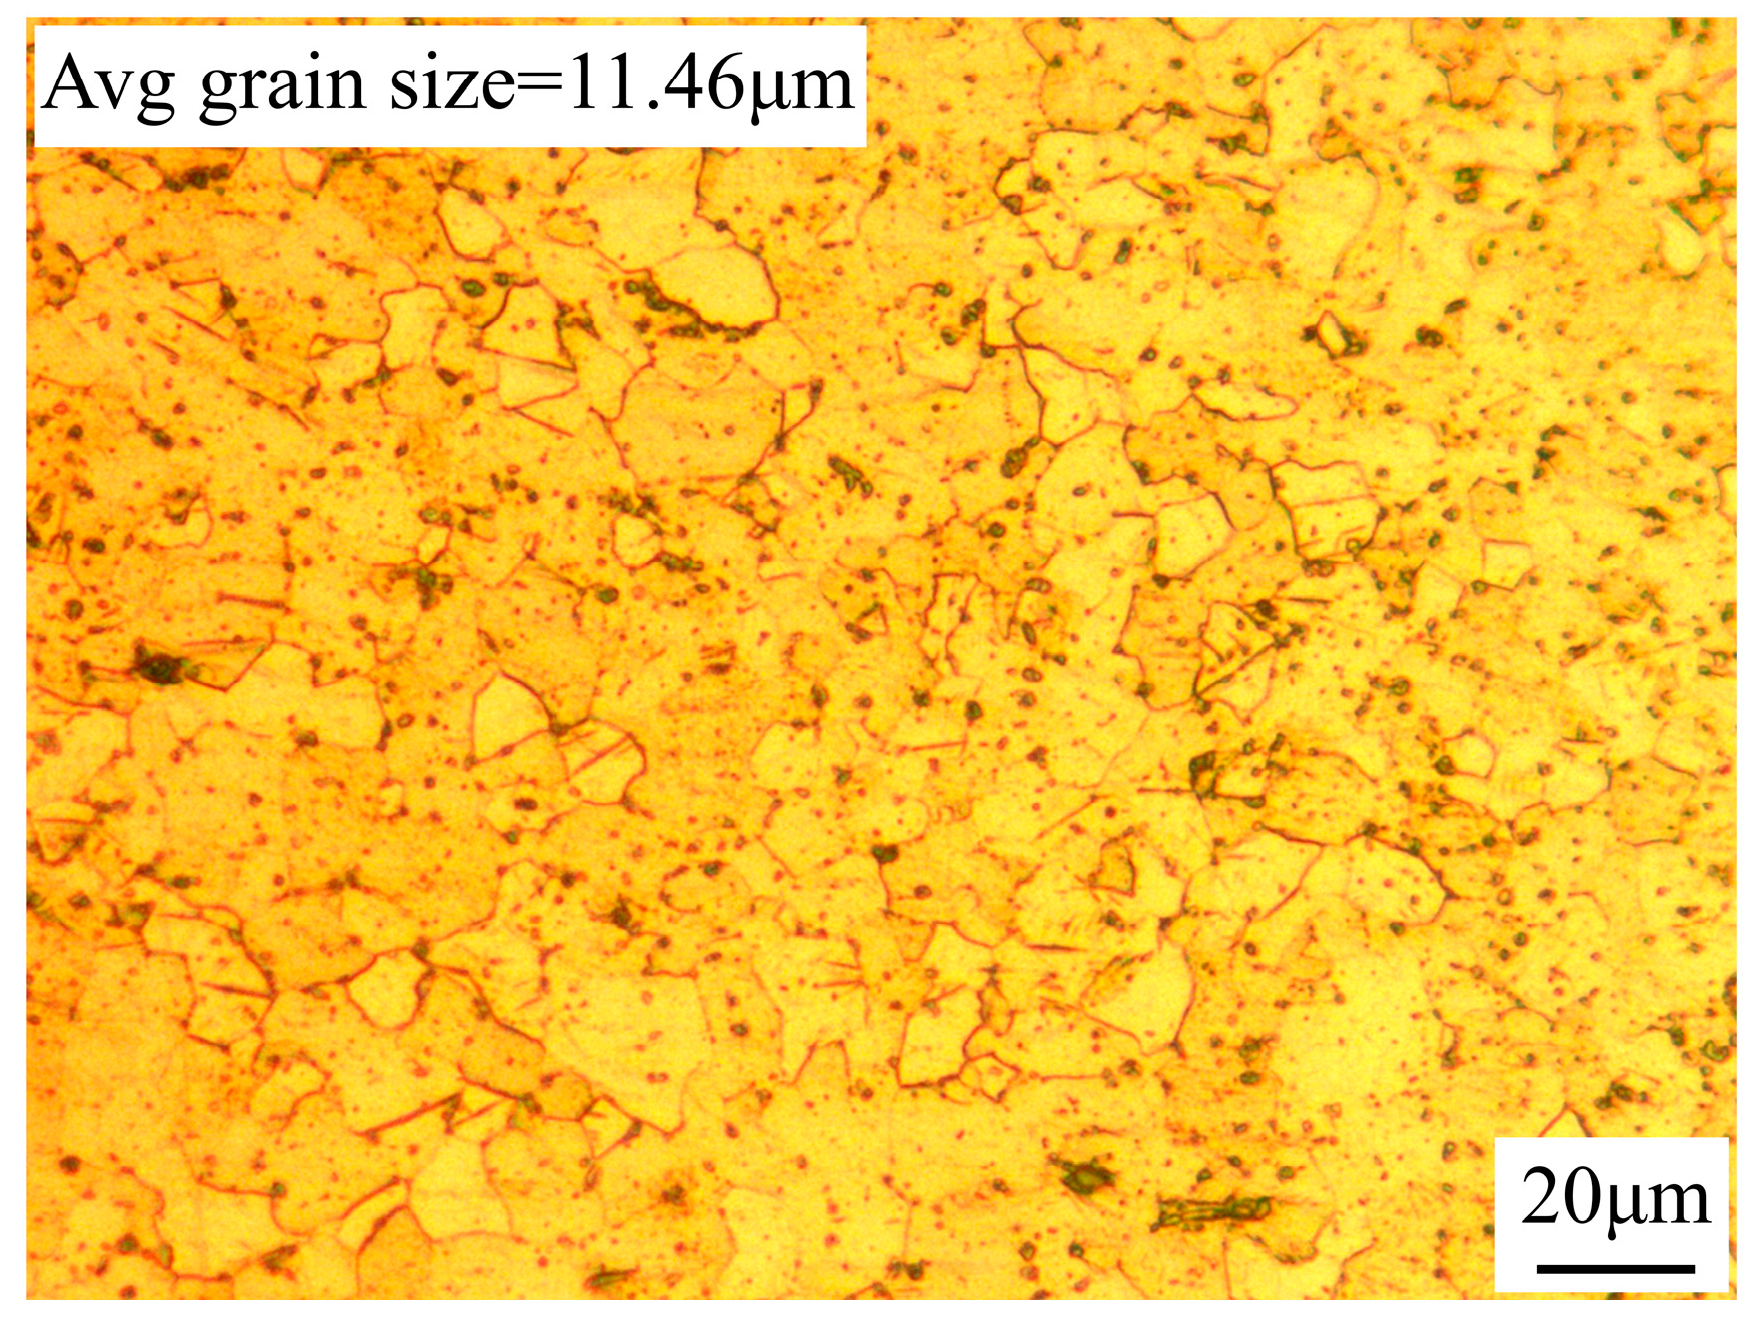
| Initial average grain size/μm | 11.46 |
| Initial dislocation density/μm2 | 0.01 |
| Temperature on Outer Side of Bent Tube/°C | Simulated Average Grain Size/μm | Actual Average Grain Size/μm | Deviation/% |
|---|---|---|---|
| 400 | 8.03 | 8.47 | 5.48 |
| 450 | 8.13 | 8.26 | 1.60 |
| 500 | 7.76 | 7.88 | 1.55 |
Disclaimer/Publisher’s Note: The statements, opinions and data contained in all publications are solely those of the individual author(s) and contributor(s) and not of MDPI and/or the editor(s). MDPI and/or the editor(s) disclaim responsibility for any injury to people or property resulting from any ideas, methods, instructions or products referred to in the content. |
© 2025 by the authors. Licensee MDPI, Basel, Switzerland. This article is an open access article distributed under the terms and conditions of the Creative Commons Attribution (CC BY) license (https://creativecommons.org/licenses/by/4.0/).
Share and Cite
Li, Y.; Xu, X.; Wei, L.; Fan, Y.; Xie, J.; Luo, S.; Zeng, X. Research on Microstructure Evolution Rules of TA18 Titanium Alloy Tube During the Differential Heating Push-Bending Forming Process. Coatings 2025, 15, 256. https://doi.org/10.3390/coatings15030256
Li Y, Xu X, Wei L, Fan Y, Xie J, Luo S, Zeng X. Research on Microstructure Evolution Rules of TA18 Titanium Alloy Tube During the Differential Heating Push-Bending Forming Process. Coatings. 2025; 15(3):256. https://doi.org/10.3390/coatings15030256
Chicago/Turabian StyleLi, Yanfang, Xuefeng Xu, Liming Wei, Yubin Fan, Jun Xie, Shijian Luo, and Xiang Zeng. 2025. "Research on Microstructure Evolution Rules of TA18 Titanium Alloy Tube During the Differential Heating Push-Bending Forming Process" Coatings 15, no. 3: 256. https://doi.org/10.3390/coatings15030256
APA StyleLi, Y., Xu, X., Wei, L., Fan, Y., Xie, J., Luo, S., & Zeng, X. (2025). Research on Microstructure Evolution Rules of TA18 Titanium Alloy Tube During the Differential Heating Push-Bending Forming Process. Coatings, 15(3), 256. https://doi.org/10.3390/coatings15030256