Abstract
Bi2O2Se, as the n-type counterpart of p-type BiCuSeO, has garnered considerable attention. The lower carrier concentration leads to reduced electrical conductivity, prompting extensive research efforts aimed at enhancing its electrical performance. This study prepared Bi2−3x(CeTiSn)xO2Se (x = 0, 0.02, 0.03, and 0.04) ceramics using a combination of high-energy ball milling and cold isostatic pressing techniques. Results demonstrated that the incorporation of multiple elements led to an increase in the carrier concentration within the Bi2O2Se system, thereby improving electrical conductivity. The electrical conductivity increased from 5.1 S/cm for Bi2O2Se to 154.1 S/cm for Bi1.88(CeTiSn)0.04O2Se at 323 K. Furthermore, the maximum power factor value of Bi1.88(CeTiSn)0.04O2Se was 112 μW m−1 K−2 at 763 K. Doping led to a slight increase in thermal conductivity. The figure of merit ZTmax value of Bi1.88(CeTiSn)0.04O2Se was ~0.16, marking a significant enhancement of about 1.45 times compared to that of the pure sample (~0.11).
1. Introduction
The utilization of thermoelectric (TE) materials for industrial waste heat and thermal management has attracted considerable attention in response to increasing energy crises and environmental degradation [1,2]. The key to the application of thermoelectric technology is the thermoelectric module, composed of p- and n-type thermoelectric legs, which are horizontally and alternately arranged. Recent research has concentrated on p-type layered oxides BiCuSeO, known for their inherently low thermal conductivity [3], achieving a maximum ZT of 1.5 in double-doped samples [4]. Despite significant progress in related research on this system, practical applications still face numerous challenges. The low thermoelectric performance of the matched n-type oxide particularly limits the conversion efficiency. Thus, it is crucial to identify and thoroughly investigate layered structured n-type oxide thermoelectric materials with low thermal conductivity. The figure of merit, ZT (ZT = S2σT/κ), is a comprehensive metric for assessing the performance of thermoelectric (TE) materials, where S denotes the Seebeck coefficient, σ is the electrical conductivity, T represents the absolute temperature, and κ denotes the thermal conductivity. These parameters exhibit strong coupling [5,6]. Layered materials, inspired by the phonon glass electronic crystal concept, can independently control electrical and thermal conductivities, leading to thermoelectric materials with superior performance [7].
Bi2O2Se, noted for its low thermal conductivity of 1.1 Wm−1 K−1 at room temperature, has garnered significant research interest. This interest stems from its unique natural superlattice structure (shown in Figure 1a), which consists of alternating insulating [Bi2O2]2+ layers and conductive [Se]2− layers along the c-axis direction [8]. Bi2O2Se serves as the n-type equivalent to the p-type BiCuSeO. However, its carrier concentration is relatively low (~1015 cm−3), leading to electrical transport properties that markedly differ from those of high-performance thermoelectric materials [9]. The primary obstacle to enhancing thermoelectric performance is the low carrier concentration [10]. Various strategies have been employed to enhance carrier concentration, including doping with elements like Zr [11], Sb [12], W [13], Nb [14], Ta [15], La [16], Ce [17], Ti [18], Sn [19], Ge [9], and I [20]; alloying with other materials such as MoS2 [21], AgSnSe2 [22], and CuI [23]; as well as vacancy engineering [24,25,26]. Among these, Ce4+, Ti4+, and Sn4+ ions are utilized to substitute for Bi3+ in order to enhance the carrier concentration, thereby improving both conductivity and thermoelectric performance. For instance, the ZT values of Bi1.9Ce0.1O2Se, Bi1.99Ti0.01O2Se, and Bi1.9Sn0.1O2Se are 0.26, 0.56, and 0.20, respectively. Zhou et al. [23] enhanced the ZT value of Bi2O2Se to approximately 0.45 through CuI doping. Furthermore, the ZT value of the Bi2O2Se system reached approximately 0.73 when a co-exfoliated nanostructure was fabricated using graphite nanosheets and Bi2O2Se nanosheets [27]. These findings suggest that single-element doping at either the Bi or Se sites can effectively improve the thermoelectric performance of the Bi2O2Se system. In the BiCuSeO system, multi-element co-doping has been shown to significantly enhance its thermoelectric performance [28,29]. Thus, examining the potential of multi-element co-doping to enhance the thermoelectric performance of the Bi2O2Se system is crucial.
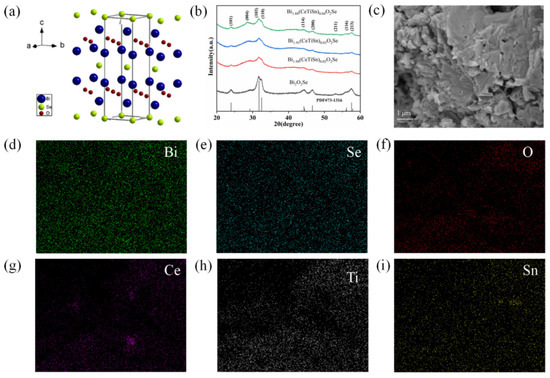
Figure 1.
(a) Crystal structure of Bi2O2Se, (b) XRD patterns of Bi2−3x(CeTiSn)xO2Se (x = 0, 0.02, 0.03, and 0.04) ceramics, (c–i) SEM and EDS elemental mapping images of Bi1.88(CeTiSn)0.04O2Se ceramic.
Previous studies have investigated the doping of the Bi site in the Bi2O2Se system with tetravalent ions such as Ce4+, Ti4+, and Sn4+ to improve the thermoelectric performance. However, few studies have been conducted on the co-doping of these elements. In this study, Ce, Ti, and Sn elements are selected for co-doping at the Bi site to enhance the electrical conductivity of the Bi2O2Se system. Bi2−3x(CeTiSn)xO2Se (x = 0, 0.02, 0.03, and 0.04) ceramics were synthesized using high-energy ball milling followed by cold isostatic pressing techniques. The effects of Ce/Ti/Sn co-doping on the microstructure and thermoelectric properties of the Bi2O2Se system are comprehensively evaluated.
2. Experimental Section
2.1. Material Preparation
A combination of high-energy ball milling and cold isostatic pressing techniques was employed to prepare Bi2−3x(CeTiSn)xO2Se (x = 0, 0.02, 0.03, 0.04) ceramics. Bi2O3 (99.999%), Bi (99.99%), Se (99.99%), CeO2 (99.99%), TiO2 (99.8%), and SnO2 (99.99%) powders were used as raw materials. The powders (~30 g) were weighed according to the stoichiometric ratios and transferred into a 250 mL tungsten carbide vial under an argon atmosphere. Subsequently, they were milled using a single-tank planetary high-energy ball mill (Pulverisette 6, FRITSCH Instruments, Idar-Oberstein, Germany) for a total duration of 2 h at room temperature (300 K). The milling was conducted with a ball-to-powder weight ratio of 20:1, utilizing grinding balls made of GCr15 steel in three different sizes: large (∅10 mm), medium (∅6 mm), and small (∅2 mm). The dimensions of the vial are as follows: an outer diameter of 98 mm, an inner diameter of 73 mm, and a height of 98 mm. The occupation coefficient of a vial was 60%. The rotation speed was set at 490 rpm, and the cooling type was air cooling. The ball milling procedure involved milling intervals of 10 min, each followed by a 5 min pause. The synthesized single-phase powders were packed into a long rubber balloon, molded into shapes with 10 and 15 mm diameters, and subjected to cold isostatic pressing, which transmits pressure to the sample through water for 30 min at 200 MPa. Cold-pressed samples were then placed in a vacuum quartz tube (∅25 mm) with a pressure of approximately 5 × 10⁻³ Pa and heated in a muffle furnace at a rate of 5 K/min to 873 K held for 2 h to synthesize Bi2−3x(CeTiSn)xO2Se (x = 0, 0.02, 0.03, and 0.04) ceramics. The prepared ceramics were then sectioned into specimens with dimensions of 12 mm × 4 mm × 4 mm for electrical performance tests, ∅12.5 mm × 2 mm for thermal performance tests, and 10 mm × 10 mm × 1 mm for carrier concentration tests.
2.2. Characterization
The Bi2−3x(CeTiSn)xO2Se (x = 0, 0.02, 0.03, and 0.04) ceramics were analyzed using X-ray diffraction (XRD) on a Bruker D8 Advance, with scans performed from 20° to 70° employing Cu Kα radiation. The microstructures were analyzed using a field-emission scanning electron microscope (FE-SEM, Merlin Compact, Carl Zeiss, Germany), and X-ray photoelectron spectroscopy (XPS; Thermo Scientific K-Alpha, Waltham, MA, USA) was utilized to identify the valence states of elements. The Seebeck coefficient (S) and resistivity were measured between 323 and 763 K using a ZEM-3 thermoelectric performance tester. The elastic modulus (E) of ceramics (dimensions: 6 × 6 × 1 mm3) was assessed using a nanoindentation tester (NHT3, Anton-Paar.cn, Graz, Austria), and the average sound velocity and phonon mean free path were calculated from the obtained elastic modulus. The thermal diffusivity coefficient (D) was measured using an LFA-457 laser flash apparatus, and the specific heat capacity (Cp) was assessed through differential scanning calorimetry (DSC8000, PE, Waltham, MA, USA). The volume density (ρ) was determined using the buoyancy method. The total thermal conductivity (k) was calculated using the formula k = CpρD. Hall-effect measurements were performed with a quantum physical property measurement system to calculate carrier concentration n and carrier mobility (μ) using the equations n = 1/(eRH) and μ = σRH, where RH is the Hall coefficient.
3. Results and Discussion
Figure 1b presents the XRD patterns of Bi2−3x(CeTiSn)xO2Se ceramics with x = 0, 0.02, 0.03, and 0.04. Compared with the standard card PDF#73−1316 (Bi2O2Se), all diffraction peaks are in agreement with those in the standard card, and no obvious impurity peaks are found, indicating that single-phase Bi2−3x(CeTiSn)xO2Se ceramics have been successfully prepared. With the increase in the doping amount of Ce, Ti, and Sn, the diffraction peaks slightly shift to the right. The smaller ionic radii of the doping elements Ce4+ (92 pm), Ti4+ (68 pm), and Sn4+ (71 pm) are smaller compared to Bi3+ (103 pm), leading to lattice distortion. Table 1 summarizes the lattice parameters derived from the Bragg formula and the relationship between lattice parameters. Table 1 includes the average block size determined using the Debye–Scherrer formula: Dc = 0.89λ/(Bcosθ). The table data indicate that as the doping amount increases, the average block size of the samples tends to increase; however, all doped samples exhibit smaller average block sizes compared to the undoped Bi2O2Se sample. Figure 1c presents a SEM image of the fracture surface of Bi1.88(CeTiSn)0.04O2Se, revealing its high-density, layered structure. The EDS elemental mapping images of Bi1.88(CeTiSn)0.04O2Se ceramic are shown in Figure 1d–i. The results show a uniform distribution of Bi, Se, O, Ce, Ti, and Sn elements in the sample.

Table 1.
Lattice constants and block sizes of Bi2−3x(CeTiSn)xO2Se (x = 0, 0.02, 0.03, 0.04) ceramics.
The oxidation states and composition of the Bi2−3x(CeTiSn)xO2Se (x = 0, 0.02, 0.03, and 0.04) ceramics were examined by XPS. Figure 2 presents the XPS survey scan. This spectrum confirmed the presence of Bi, Se, O, Ce, Ti, and Sn in the prepared samples.
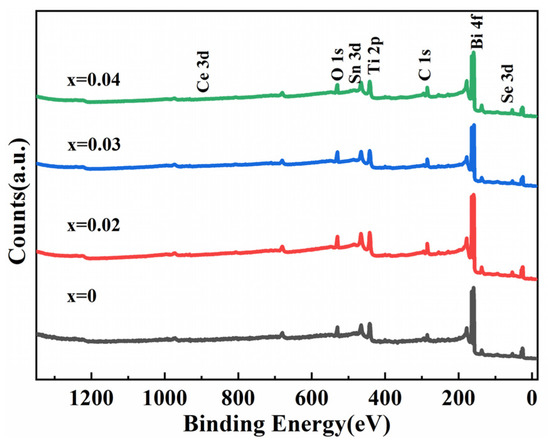
Figure 2.
XPS survey spectrum of Bi2−3x(CeTiSn)xO2Se (x = 0, 0.02, 0.03, and 0.04) ceramics.
Figure 3a displays the high-resolution XPS spectrum for the Bi 4f. The Bi element exhibits two spin-orbit peaks, corresponding to Bi 4 f7/2 and Bi 4f5/2. For the undoped sample, these characteristic peaks are located at 158.47 eV and 163.77 eV, respectively, with a separation of 5.30 eV, indicating that the Bi atoms in the undoped sample primarily exist as Bi3+. In the Bi2−3x(CeTiSn)xO2Se (x = 0.02, 0.03, and 0.04) samples, the spin-orbit peaks of the Bi element remain similar to those of the undoped sample, suggesting that the Ce, Ti, and Sn dopants do not alter the valence state of Bi, which remains as Bi3+ [30,31,32]. In the Bi1.88(CeTiSn)0.04O2Se sample, the Bi 4f7/2 and Bi 4f5/2 peaks appear at 158.40 eV and 163.69 eV, respectively, showing a slight shift to lower binding energies compared to the undoped sample. This shift can be attributed to the lower electronegativities of the dopants Ce (1.12), Ti (1.54), and Sn (1.96) relative to Bi (2.02), leading to an increased electron density around the Bi atoms and consequently reducing the binding energy of the Bi 4f states. This phenomenon is consistent with the findings in the literature [33]. Figure 3b shows the high-resolution XPS spectrum of O 1s. Through fitting, two distinct peaks were identified: one corresponding to the lattice oxygen peak at a lower binding energy (529.32 eV) and the other to the oxygen vacancy peak at a higher binding energy (530.79 eV). The relative content changes in lattice oxygen and oxygen vacancies in the samples were determined by analyzing the area ratio of these two peaks. The area ratios of lattice oxygen to oxygen vacancies for the Bi2−3x(CeTiSn)xO2Se (x = 0, 0.02, 0.03, and 0.04) samples were 0.57, 0.74, 0.96, and 0.69, respectively. These results indicate that the area ratios of lattice oxygen to oxygen vacancies in the doped samples are consistently higher than those in the undoped sample. This suggests that doping with Ce, Ti, and Sn promotes the transformation of oxygen vacancies into lattice oxygen, thereby increasing the lattice oxygen content in the samples. This observation is consistent with previously reported findings [34,35].
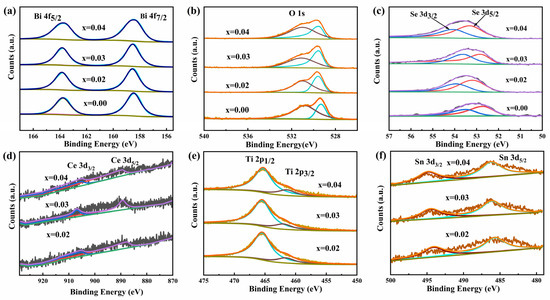
Figure 3.
High-resolution XPS spectra of Bi2−3x(CeTiSn)xO2Se (x = 0, 0.02, 0.03, and 0.04) ceramics: (a) Bi; (b) O; (c) Se; (d) Ce; (e) Ti; and (f) Sn.
Figure 3c presents the high-resolution XPS spectrum of Se 3d. In the undoped sample, the Se element exhibits spin-orbit splitting, producing two distinct peaks: Se 3d5/2 at 52.70 eV and Se 3d3/2 at 53.48 eV, separated by 0.78 eV. The low binding energy peak (Se 3d5/2) indicates that Se primarily exists as Se2− in the sample, while the high binding energy peak (Se 3d3/2) reflects interlayer interactions between Se atoms [14,19,30]. Figure 3d displays the high-resolution XPS spectrum for Ce 3d. The spin-orbit peaks for the 3d5/2 and 3d3/2 states of the Ce element are observed at 889.36 eV and 906.96 eV, respectively, with a spin-orbit splitting energy of 17.6 eV. These findings suggest that the Ce element in the Bi2−3x(CeTiSn)xO2Se sample exhibits a +4 oxidation state [17]. Figure 3e shows the high-resolution XPS spectrum for Ti 2p. The peak positions for the Ti 2p3/2 and Ti 2p1/2 states are observed at 461.58 eV and 465.47 eV, respectively, with a spin-orbit splitting energy of 3.89 eV. These findings suggest that the Ti element in the Bi2−3x(CeTiSn)xO2Se sample exhibits a +4 oxidation state [18]. Figure 3f displays the high-resolution spectrum of Sn 3d. The Sn element exhibits a spin-orbit peak at 486.11 eV for 3d5/2 and at 495.51 eV for 3d3/2, with a peak position difference of 9.4 eV. The findings show that the Sn element in the Bi2−3x(CeTiSn)xO2Se sample has a valence state of +4, consistent with the previously reported literature [19].
Figure 4a shows the electrical conductivity curves of Bi2−3x(CeTiSn)xO2Se (x = 0, 0.02, 0.03, and 0.04) ceramics as a function of temperature. For doping levels of 0.02 and 0.03, the electrical conductivity is consistent with that of the undoped sample, exhibiting an increase with rising temperature, indicative of non-degenerate semiconductor behavior. In contrast, at a doping level of 0.04, the electrical conductivity decreases with increasing temperature, demonstrating degenerate semiconductor characteristics and metal-like behavior [14,19]. All doped samples exhibit markedly higher electrical conductivity compared to the undoped sample. At 323 K, Bi1.88(CeTiSn)0.04O2Se exhibits an electrical conductivity of 154.1 S cm−1, significantly surpassing the value of 5.1 S cm−1 measured in the undoped sample. The significant improvement is mainly due to increased carrier concentration, indicating that doping with Ce, Ti, and Sn enhances electrical conductivity [17,18,19]. Electrical conductivity (σ) is determined by the following formula:, involving carrier concentration (n), electron charge (e), and carrier mobility (μ). It is evident that electrical conductivity is directly proportional to these three parameters. The results of carrier concentration and carrier mobility are summarized in Table 2. The table demonstrates that doping with Ce, Ti, and Sn raised the carrier concentration from 1.05 × 1018 cm−3 in the undoped sample to 1.08 × 1020 cm−3 in Bi1.88(CeTiSn)0.04O2Se, marking a two-order magnitude increase. This substantial enhancement in carrier concentration is primarily attributed to the substitution of Bi3+ by Ce4+, Ti4+, and Sn4+ ions, which increases the number of free electrons in the system, thereby enhancing the carrier concentration. With increasing doping levels of Ce, Ti, and Sn, the elevated carrier concentration further optimizes the electrical conductivity of the material.
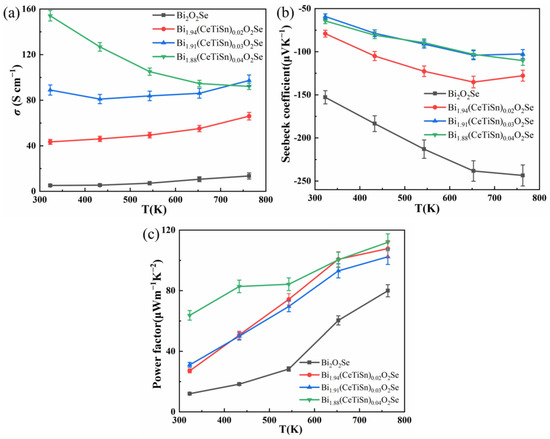
Figure 4.
(a) The temperature-dependent σ curves; (b) the temperature-dependent S curves; (c) the temperature-dependent PF curves for Bi2−3x(CeTiSn)xO2Se (x = 0, 0.02, 0.03, and 0.04) ceramics.
Table 2.
Carrier concentration, Hall mobility, and effective mass m* of Bi2−3x(CeTiSn)xO2Se (x = 0, 0.02, 0.03, and 0.04) ceramics at room temperature.
Figure 4b illustrates the temperature-dependent Seebeck coefficient curves for Bi2−3x(CeTiSn)xO2Se ceramics with x values of 0, 0.02, 0.03, and 0.04. The figure shows that all samples have negative Seebeck coefficients, confirming that electrons are the primary carriers and the samples are n-type semiconductors, aligning with findings in the literature [19]. The absolute value of the Seebeck coefficient of undoped Bi2O2Se is 152.8 μV/K at 323 K and 243.5 μV/K at 763 K, both at a relatively high level. Doping led to a significant decrease in the absolute values of the Seebeck coefficients for all samples. The Seebeck coefficients of Bi1.91(CeTiSn)0.03O2Se and Bi1.88(CeTiSn)0.04O2Se samples showed a significant decrease, with values converging. For Bi1.91(CeTiSn)0.03O2Se, the Seebeck coefficients were 59.1 μV/K at 323 K and 102.6 μV/K at 763 K, while for Bi1.88(CeTiSn)0.04O2Se, they were 64.3 μV/K at 323 K and 110.3 μV/K at 763 K.
Based on the Mahan–Sofo theory, the Seebeck coefficient can be represented using a simplified formula:
where kB denotes the Boltzmann constant, e represents the electron charge, h is the reduced Planck constant, and m* signifies the effective mass of the carrier. The calculation results are summarized in Table 2. From the data in the table, it can be seen that doping significantly increases the carrier concentration. Simultaneously, all doped samples exhibit an effective mass m* increased compared to the undoped samples, especially for the Bi1.88(CeTiSn)0.04O2Se sample, where the effective mass m* has increased from 0.25 m0 of the undoped Bi2O2Se to 0.67 m0 of the doped sample. The substantial rise in carrier concentration n primarily causes the reduction in the absolute value of the Seebeck coefficient.
Figure 4c illustrates the temperature-dependent variation in the power factor for Bi2−3x(CeTiSn)xO2Se (x = 0, 0.02, 0.03, and 0.04) ceramics. As shown in Figure 4c, throughout the entire temperature range, the power factors of all doped samples consistently exceed those of the undoped Bi2O2Se sample and increase with rising temperature. At 763 K, the Bi1.88(CeTiSn)0.04O2Se sample achieves a peak power factor of 112 μWm−1 K−2, which is 1.4 times higher than that of the undoped Bi2O2Se sample (80 μWm−1 K−2). These results demonstrate that co-doping with Ce, Ti, and Sn significantly improves the electrical transport properties of the Bi2O2Se system.
Figure 5 illustrates the temperature-dependent thermal diffusivity curves of Bi2−3x(CeTiSn)xO2Se (x = 0, 0.02, 0.03, and 0.04) ceramics varying with temperature. Throughout the entire temperature measurement range, the thermal diffusivity gradually decreases as the temperature rises. As doping levels rise, the thermal diffusivity of the samples initially decreases before increasing, with all doped samples exhibiting higher thermal diffusivity than that of the undoped Bi2O2Se sample. The thermal diffusivity of the undoped Bi2O2Se sample decreases from 0.39 mm2/s at 323 K to 0.23 mm2/s at 763 K. Doped samples exhibit higher thermal diffusivity, leading to increased total thermal conductivity.
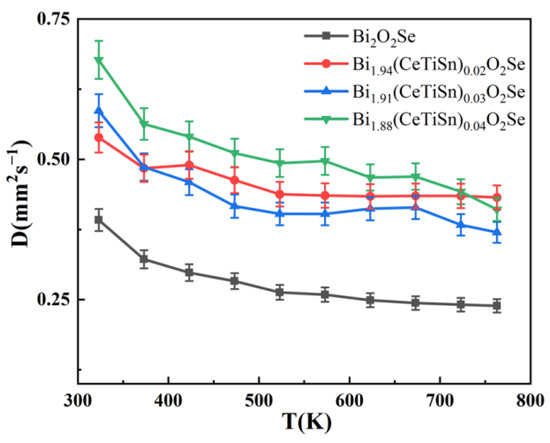
Figure 5.
Thermal diffusivity (D) of Bi2−3x(CeTiSn)xO2Se ceramics as a function of temperature for varying x values (x = 0, 0.02, 0.03, and 0.04).
Figure 6a illustrates the total thermal conductivity curves of Bi2−3x(CeTiSn)xO2Se (x = 0, 0.02, 0.03, and 0.04) ceramics as a function of temperature. The formula for calculating the total thermal conductivity is given by
where ρ denotes the sample density, Cp denotes the specific heat capacity, and D denotes the thermal diffusivity. The total thermal conductivity of the Bi2−3x(CeTiSn)xO2Se ceramics consistently decreases with rising temperature across the entire measurement range. The reduction in thermal conductivity is due to increased phonon scattering at higher temperatures. The thermal conductivity of all doped samples consistently exceeds that of the undoped samples over the majority of the measured temperature range. This is primarily due to the relatively high thermal conductivity of CeO2, whose incorporation has a minimal impact on reducing thermal conductivity. Meanwhile, while the doping of TiO2 and SnO2 significantly enhances electrical conductivity, it contributes little to the reduction in thermal conductivity [17,18,19]. Nevertheless, the doped samples exhibit low thermal conductivity.
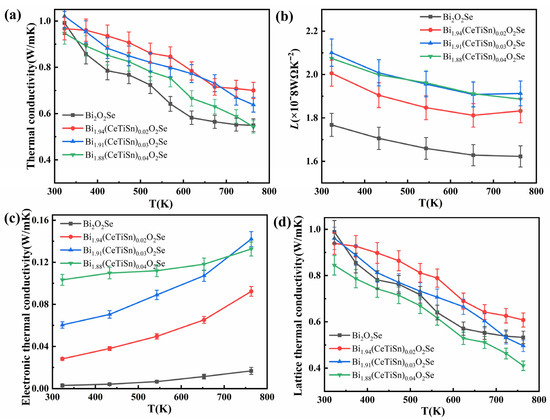
Figure 6.
Temperature-dependent (a) total thermal conductivity κtot, (b) Lorentz number L, (c) electronic thermal conductivity κe, and (d) lattice thermal conductivity κl of Bi2−3x(CeTiSn)xO2Se (x = 0, 0.02, 0.03, and 0.04) ceramics.
Based on the formula for calculating the total thermal conductivity
where ke represents the electronic thermal conductivity, and kl denotes the lattice thermal conductivity. The electronic thermal conductivity can be determined using the Wiedemann–Franz relation:
In this equation, σ represents the electrical conductivity, T is the thermodynamic temperature, and L denotes the Lorentz constant. The expression for the Lorentz constant L is given by
After substituting the Seebeck coefficient values, the relationship between the calculated Lorentz constant L and temperature is illustrated in Figure 6b. At room temperature, the L ranges from 1.6 × 10⁻⁸ to 2.1 × 10⁻⁸ WΩ K−2, positioned between the limits for degenerate semiconductors (2.45 × 10⁻⁸ WΩ K−2) and non-degenerate semiconductors (1.50 × 10⁻⁸ WΩ K−2). This result aligns with the expected behavior of thermoelectric materials.
The temperature-dependent curves of electronic thermal conductivity are presented in Figure 6c. As shown in Figure 6c, the electronic thermal conductivity trend closely parallels the electrical conductivity of the samples. The doped samples exhibit notably higher electronic thermal conductivity compared to the undoped sample, mainly due to the elevated carrier concentration. At 323 K, the electronic thermal conductivity κe rises from 0.002 Wm−1 K−1 for Bi2O2Se to 0.103 Wm−1 K−1 at x = 0.04, and at 763 K, it increases from 0.01 Wm−1 K−1 for Bi2O2Se to 0.132 Wm−1 K−1 at x = 0.04. Lattice thermal conductivity is the primary contributor to the total thermal conductivity, while electronic thermal conductivity plays a minor role. Figure 6d illustrates the temperature-dependent variation in lattice thermal conductivity for Bi2−3x(CeTiSn)xO2Se (x = 0, 0.02, 0.03, and 0.04) ceramics. The observed trend aligns with that of the total thermal conductivity. The lattice thermal conductivity of samples with doping levels of 0.02 and 0.03 exceeds that of the undoped Bi2O2Se sample. This phenomenon can be attributed to the lower atomic weights of the dopants (Ce, Ti, and Sn) compared to Bi, which results in weaker phonon scattering and consequently higher sound velocity and longer phonon mean free path in the doped samples. At a doping level of 0.04, the lattice thermal conductivity of the sample is significantly lower than that of the undoped Bi2O2Se sample. This reduction is attributed to increased lattice distortion from higher doping levels, which enhances phonon scattering and a decrease in lattice thermal conductivity.
According to classical kinetic theory, kl can be expressed as [5]
where Cv represents the specific heat, V denotes the average phonon velocity, and l is the average phonon free path. To further investigate the main factors influencing the lattice thermal conductivity, we conducted a detailed analysis of these three parameters. The minimal variation in the specific heat across the temperature range allows for the exclusion of its influence on the lattice thermal conductivity. The formula for calculating the average phonon velocity is given by [28]
where E is the elastic modulus and ρ is the density. Based on this formula, the calculated average phonon velocities are summarized in Table 3. The ratios of the average phonon velocities for the samples are 1:1.049:1.072:1.086, respectively. In contrast, the ratios of the lattice thermal conductivities for the samples are 1:0.949:0.971:0.854, respectively. This minor variation in phonon velocity is insufficient to account for the observed differences in lattice thermal conductivity. Consequently, the average phonon free path plays a dominant role in determining the lattice thermal conductivity.
Table 3.
The mass density, elastic modulus, and corresponding sound velocity of the Bi2−3x(CeTiSn)xO2Se ceramics.
The phonon mean free path of Bi2−3x(CeTiSn)xO2Se ceramics was calculated using Formula (6), and the results are presented in Figure 7a. As temperature increases, the phonon mean free path decreases, primarily due to enhanced lattice vibrations and increased phonon scattering. The average phonon free path in doped samples exceeds that of the undoped sample and increases with higher doping levels. This trend corresponds with the observed variations in lattice thermal conductivity of the doped samples. Throughout the entire temperature measurement range, doped samples exhibit a substantially longer phonon mean free path compared to the undoped samples. The enhanced thermal conductivity of Bi2−3x(CeTiSn)xO2Se ceramics is primarily attributed to the increase in both thermal diffusivity and phonon mean free path.
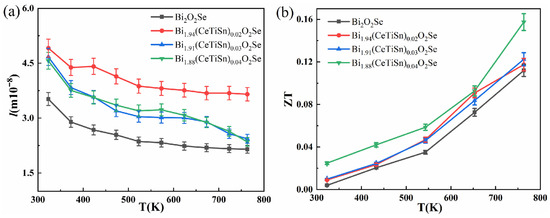
Figure 7.
Temperature-dependent phonon mean free path (a) and temperature-dependent ZT values (b) in Bi2−3x(CeTiSn)xO2Se (x = 0, 0.02, 0.03, and 0.04) ceramics.
The ZT curves of Bi2−3x(CeTiSn)xO2Se (x = 0, 0.02, 0.03, and 0.04) ceramics as a function of temperature are presented in Figure 7b. The ZT values of all samples exhibit an increasing trend with rising temperature. The doped samples consistently demonstrate superior ZT values compared to the undoped sample. This enhancement is primarily due to improved electrical transport properties and decreased thermal conductivity. At 763 K, the Bi1.88(CeTiSn)0.04O2Se sample reached a peak ZT value of approximately 0.16, which is 1.45 times higher than that of the undoped Bi2O2Se sample (~0.11). These experimental results indicate that Ce, Ti, and Sn elements can synergistically optimize thermoelectric parameters, thereby significantly enhancing the overall thermoelectric performance of the Bi2O2Se system.
4. Conclusions
Bi2−3x(CeTiSn)xO2Se (x = 0, 0.02, 0.03, and 0.04) ceramics were successfully prepared by combining high-energy ball milling followed by cold isostatic pressing. Co-doping with Ce, Ti, and Sn elements significantly decreased the block size and increased electrical conductivity, leading to an improved power factor. Specifically, at 763 K, the power factor of the Bi1.88(CeTiSn)0.04O2Se sample reached 112 μWm−1K−2, approximately 1.2 times that of the undoped Bi2O2Se sample (80 μWm−1K−2). Additionally, the maximum ZT value of this sample was about 0.16, which was 1.45 times that of the undoped Bi2O2Se sample (~0.11). These findings suggest that multi-element doping effectively enhances the thermoelectric performance of oxide thermoelectric materials.
Author Contributions
Methodology, data curation, H.Z.; formal analysis, L.D.; investigation, Y.X. and Z.Z.; writing—original draft, H.Z.; writing—review and editing, S.D. All authors have read and agreed to the published version of the manuscript.
Funding
This research was funded by the National Natural Science Foundation of China (Grant No. 51702132).
Institutional Review Board Statement
Not applicable.
Informed Consent Statement
Not applicable.
Data Availability Statement
The data presented in this study are available in this article.
Acknowledgments
The authors acknowledge financial support from the National Natural Science Foundation of China (51702132), and Songtao Dong acknowledges the open project of the National Laboratory of Solid-State Microstructures, Nanjing University.
Conflicts of Interest
The authors declare no conflicts of interest.
References
- Tang, W.X.; Qian, W.Y.; Jia, S.L.; Li, K.; Zhou, Z.F.; Lan, J.L.; Lin, Y.H.; Yang, X.P. BiCuSeO based thermoelectric materials: Innovations and challenges. Mater. Today Phys. 2023, 35, 10110. [Google Scholar] [CrossRef]
- Zhang, H.; Yin, Z.; Wang, Y.; Wu, Y.; Xing, Y.; Guo, X. High pressure coupled with Cu deficiency boosts thermoelectric performance in BiCuSeO oxides. J. Alloys Compd. 2024, 1002, 175502. [Google Scholar] [CrossRef]
- Hong, H.Y.; Kim, D.H.; Park, K. Enhanced thermoelectric properties of Na and Mg co-doped BiCuSeO. Ceram. Int. 2022, 48, 19618–19625. [Google Scholar] [CrossRef]
- Pei, Y.L.; He, J.; Li, J.F.; Li, F.; Liu, Q.; Pan, W.; Barreteau, C.; Berardan, D.; Zhao, L.D. High thermoelectric performance of oxyselenides: Intrinsically low thermal conductivity of Ca-doped BiCuSeO. NPG Asia Mater. 2013, 5, e47. [Google Scholar] [CrossRef]
- Dong, S.T.; Zhang, B.B.; Xiong, Y.; Lv, Y.Y.; Yao, S.H.; Chen, Y.B.; Zhou, J.; Zhang, S.T.; Chen, Y.F. Anisotropic electrical and thermal conductivity in Bi2AE2Co2O8+δ [AE = Ca, Sr1−xBax (x = 0.0, 0.25, 0.5, 0.75, 1.0)] single crystals. J. Appl. Phys. 2015, 118, 125108. [Google Scholar] [CrossRef]
- Dong, S.T.; Yu, M.C.; Fu, Z.; Lv, Y.Y.; Yao, S.H.; Chen, Y.B. High thermoelectric performance of NaF-doped Bi2Ca2Co2Oy ceramic samples. J. Mater. Res. Technol. 2022, 17, 1598–1604. [Google Scholar] [CrossRef]
- Beekman, M.; Morelli, D.T.; Nolas, G.S. Better thermoelectrics through glass-like crystals. Nat. Mater. 2015, 14, 1182–1185. [Google Scholar] [CrossRef] [PubMed]
- Ruleova, P.; Drasar, C.; Lostak, P.; Li, C.-P.; Ballikaya, S.; Uher, C. Thermoelectric properties of Bi2O2Se. Mater. Chem. Phys. 2010, 119, 299–302. [Google Scholar] [CrossRef]
- Liu, R.; Tan, X.; Liu, Y.; Ren, G.; Liu, C.; Zhou, Z.; Nan, C.; Lin, Y. Carrier concentration optimization for thermoelectric performance enhancement in n-type Bi2O2Se. J. Eur. Ceram. Soc. 2018, 38, 2742–2746. [Google Scholar] [CrossRef]
- Tan, X.; Liu, Y.C.; Liu, R.; Zhou, Z.F.; Liu, C.; Lan, J.L.; Zhang, Q.H.; Lin, Y.H.; Nan, C.W. Synergistical enhancement of thermoelectric properties in n-type Bi2O2Se by carrier engineering and hierarchical microstructure. Adv. Energy Mater. 2019, 9, 1900354. [Google Scholar] [CrossRef]
- Fu, Z.; Jiang, J.-L.; Dong, S.-T.; Yu, M.-C.; Zhao, L.; Wang, L.; Yao, S.-H. Effects of Zr substitution on structure and thermoelectric properties of Bi2O2Se. J. Mater. Res. Technol. 2022, 21, 640–647. [Google Scholar] [CrossRef]
- Yang, N.; Pan, L.; Chen, C.; Wang, Y. Effects of Sb−doping on the electron−phonon transport properties of Bi2O2Se. J. Alloys Compd. 2021, 858, 157748. [Google Scholar] [CrossRef]
- Gao, Y.; Wang, Y.; Pan, L.; Chen, C.; Zong, P.; Wang, Y. Enhancing thermoelectric performance of Bi2O2Se by W-doping with the shear exfoliation- restacking process. Mater. Lett. 2022, 308, 131291. [Google Scholar] [CrossRef]
- Kim, M.; Park, D.; Kim, J. Enhancement of Bi2O2Se thermoelectric power factor via Nb doping. J. Alloys Compd. 2021, 851, 156905. [Google Scholar] [CrossRef]
- Jiang, J.L.; Dong, S.T.; Fu, Z.; Yu, M.C.; Zhao, L.; Wang, L. Effect of Ta Doping on the Microstructure and Thermoelectric Properties of Bi2O2Se. Metals 2022, 12, 1881. [Google Scholar] [CrossRef]
- Tan, X.; Lan, J.L.; Hu, K.; Xu, B.; Liu, Y.; Zhang, P.; Cao, X.Z.; Zhu, Y.; Xu, W.; Lin, Y.H.; et al. Boosting the thermoelectric performance of Bi2O2Se by isovalent doping. J. Am. Ceram. Soc. 2018, 101, 4634. [Google Scholar] [CrossRef]
- Hong, H.Y.; Kim, D.H.; Won, S.O.; Park, K. Enhancement of the thermoelectric performance of n−type Bi2O2Se by Ce4+ doping. J. Mater. Res. Technol. 2021, 15, 4161–4172. [Google Scholar] [CrossRef]
- Song, C.C.; Song, Y.L.; Pan, L.; Chen, C.C.; Zong, P.G.; Wang, Y.F. Thermoelectric properties of Bi2−xTixO2Se with the shear exfoliation-restacking process. J. Alloys Compd. 2022, 892, 162147. [Google Scholar] [CrossRef]
- Zhan, B.; Butt, S.; Liu, Y.; Lan, J.-L.; Nan, C.-W.; Lin, Y.-H. High-temperature thermoelectric behaviors of Sn-doped n-type Bi2O2Se ceramics. J. Electroceram. 2015, 34, 175–179. [Google Scholar] [CrossRef]
- Bae, S.Y.; Kim, H.-S.; Lee, S.W.; Park, O.; Park, H.; Kim, S.-I. Enhanced thermoelectric properties of I-doped polycrystalline Bi2O2Se oxyselenide. J. Mater. Res. Technol. 2022, 19, 2831–2836. [Google Scholar] [CrossRef]
- Gao, Y.; Niu, X.; Pan, L.; Lang, Y.; Chen, C.; Wang, Y. Effects of MoS2 addition on the thermoelectric properties of Bi2O2Se. Solid State Sci. 2023, 138, 107147. [Google Scholar] [CrossRef]
- Niu, X.; Gao, Y.H.; Pan, L.; Chen, C.C.; Wang, Y.F. Thermoelectric properties of Bi2O2Se-x%AgSnSe2 composites via liquid assisted shear exfoliation- restacking process. J. Alloys Compd. 2022, 921, 166087. [Google Scholar] [CrossRef]
- Zhou, Z.F.; Liu, R.; Yang, Y.Y.; Zheng, Y.P.; Wei, B.; Zhang, W.Y.; Zou, M.C.; Han, J.; Liu, Y.Q.; Lan, J.L.; et al. Synergistic effects of CuI doping on enhancing thermoelectric performance for n-type Bi2O2Se fabricated by mechanical alloying. Scr. Mater. 2023, 225, 115163. [Google Scholar] [CrossRef]
- Zhan, B.; Liu, Y.; Tan, X.; Lan, J.L.; Lin, Y.H.; Nan, C.W. Enhanced Thermoelectric Properties of Bi2O2Se Ceramics by Bi Deficiencies. J. Am. Ceram. Soc. 2015, 98, 2465. [Google Scholar] [CrossRef]
- Pan, L.; Zhang, J.; Chen, C.; Wang, Y. Enhanced thermoelectric properties of highly textured Bi2O2−xSe1+x with liquid-phase mechanical exfoliation. Scr. Mater. 2020, 178, 376. [Google Scholar] [CrossRef]
- Zheng, Z.H.; Wang, T.; Jabar, B.; Ao, D.w.; Li, F.; Chen, Y.x.; Liang, G.x.; Luo, J.t.; Fan, P. Enhanced Thermoelectric Performance in n-Type Bi2O2Se by an Exquisite Grain Boundary Engineering Approach. ACS Appl. Energy Mater. 2021, 4, 10290. [Google Scholar] [CrossRef]
- Pan, L.; Shi, X.L.; Song, C.; Liu, W.D.; Sun, Q.; Lu, C.; Liu, Q.; Wang, Y.; Chen, Z.G. Graphite nanosheets as multifunctional nanoinclusions to boost the thermoelectric performance of the shear−exfoliated Bi2O2Se. Adv. Funct. Mater. 2022, 32, 2202927. [Google Scholar] [CrossRef]
- Xu, Z.; Wang, H.; Jiang, J.-L.; Fu, Z.; Dong, S.; Zhang, B.; Ju, H. Realizing synergistic optimization of electrical and thermal transport properties in BiCuSeO ceramics via multi-element doping. J. Alloys Compd. 2025, 1010, 177471. [Google Scholar] [CrossRef]
- Liang, X.; Xu, R.; Kong, M.; Wan, H.; Bai, W.; Dong, D.; Li, Q.; Xu, H.; Li, Z.; Ge, B.; et al. Raising the thermoelectric performance in Pb/In-codoped BiCuSeO by alleviating the contradiction between carrier mobility and lattice thermal conductivity. Mater. Today Phys. 2023, 34, 101084. [Google Scholar] [CrossRef]
- Hsiao, C.-L.; Qi, X. The oxidation states of elements in pure and Ca-doped BiCuSeO thermoelectric oxides. Acta Mater. 2016, 102, 88–96. [Google Scholar] [CrossRef]
- Liu, Y.; Lan, J.L.; Zhan, B.; Ding, J.; Liu, Y.; Lin, Y.H.; Zhang, B.; Nan, C. Thermoelectric properties of Pb-doped BiCuSeO ceramics. J. Am. Ceram. Soc. 2013, 96, 2710–2713. [Google Scholar] [CrossRef]
- Sun, Y.; Zhang, C.; Cao, C.; Fu, J.; Peng, L. Co-doping for significantly improved thermoelectric figure of merit in p-type Bi1−2xMgxPbxCuSeO oxyselenides. Ceram. Int. 2017, 43, 17186–17193. [Google Scholar] [CrossRef]
- Ren, J.; Zhang, X.; Zhang, X.; Cheng, R.; Guo, J.; Zhang, X.; Yu, F.; Huang, B.; Guo, S. Crystal growth, experimental and theoretical studies on the electronic structure of CNGS and Nd: CNGS. CrystEngComm 2016, 18, 3481–3487. [Google Scholar] [CrossRef]
- Lei, J.; Guan, W.; Zhang, D.; Ma, Z.; Yang, X.; Wang, C.; Wang, Y. Isoelectronic indium doping for thermoelectric enhancements in BiCuSeO. Appl. Surf. Sci. 2019, 473, 985–991. [Google Scholar] [CrossRef]
- Kim, D.; Hong, H.; Lee, J.; Park, S.; Park, K. Crystal structure and thermoelectric transport properties of Cu-deficient BiCuSeO oxyselenides. J. Mater. Res. Technol. 2020, 9, 16202–16213. [Google Scholar] [CrossRef]
Disclaimer/Publisher’s Note: The statements, opinions and data contained in all publications are solely those of the individual author(s) and contributor(s) and not of MDPI and/or the editor(s). MDPI and/or the editor(s) disclaim responsibility for any injury to people or property resulting from any ideas, methods, instructions or products referred to in the content. |
© 2025 by the authors. Licensee MDPI, Basel, Switzerland. This article is an open access article distributed under the terms and conditions of the Creative Commons Attribution (CC BY) license (https://creativecommons.org/licenses/by/4.0/).