Article

Cobalt-Based Ceramic Wear-Resistant Cutting Pick Laser Cladding Process and Its Law Analysis

School of Mechanical Engineering, Liaoning Technical University, Fuxin 123000, China
*
Author to whom correspondence should be addressed.
Coatings 2025, 15(11), 1289; https://doi.org/10.3390/coatings15111289
Submission received: 25 September 2025 / Revised: 16 October 2025 / Accepted: 25 October 2025 / Published: 4 November 2025
(This article belongs to the Section Surface Characterization, Deposition and Modification)

Abstract

As a core wear-prone component of coal mining equipment, the wear resistance of cutting picks directly affects mining efficiency and operating costs. This study addresses the premature failure of traditional hard alloy cutting picks caused by impact fatigue and abrasive wear under complex geological conditions. By introducing WC powder, the research aims to enhance the quality of the laser cladding coating on cobalt-based reinforced cutting picks and to investigate the variation in optimal process parameters with an increasing WC ratio. Five sets of L9 orthogonal experiments were conducted using the Taguchi method. Combined with the analysis of the signal-to-noise ratio (SNR), the optimal parameters under each material ratio were obtained and experimentally verified. The errors were all within 10%, which proves the reliability and repeatability of the optimization results. Subsequently, the effects of laser power, powder feeding rate and scanning speed on coating quality were systematically evaluated. Scanning speed had the most significant effect on microhardness, while laser power predominantly influenced dilution rate. For low WC content, powder feeding rate had a greater impact on porosity; as WC content increased, laser power became the main factor affecting porosity. Grey Relational Analysis (GRA) was subsequently applied to integrate the three response targets into a single grey relational grade (GRG), optimizing the parameters for each WC ratio. And the law of mutual influence between different material ratios and their process parameters was found. Wear tests on the optimized cladding layer showed that, compared with the original and pure cobalt-based picks, wear resistance increased by 45% and 80%, respectively. These results indicate a clear correlation between WC content, process parameter optimization, and improved coating performance.

1. Introduction

In the fields of coal mining, resource extraction, and tunneling, the cut-off cutting pick as the core cutting tool faces serious high-stress wear, impact load, high-temperature corrosion and other working conditions, resulting in serious wear in the process of cutting coal and breaking rock [1,2]. The wear of the cutting pick not only leads to a sharp increase in cutting resistance and energy consumption, but also triggers increased vibration of the cutting head, the risk of equipment failure, and in serious cases, even the need to stop the machine for replacement, resulting in a serious waste of resources and time. Therefore, the wear problem of cut-off cutting picks is always a key issue that restricts the mining efficiency and equipment life, and the key to solving this problem is to improve the wear resistance of cut-off cutting picks through various surface strengthening means [3,4,5].
Surface technologies include thermal spraying, vapor deposition, and chemical treatment. Thermal spraying melts the spray material through a high-temperature heat source and sprays it on the surface of the part to form a protective layer; vapor deposition forms a variety of functional film layers on the surface of the object through a chemical reaction in a gas; and chemical treatment involves placing the object in a special medium under appropriate activation conditions to promote a chemical reaction between the object and the medium, thereby forming a modified layer on the surface of the object. Chemical treatment technology involves placing the object in a special medium under suitable activation conditions to promote chemical reactions between the object and the medium, it also forming a modified layer on the surface of the object [6,7,8]. However, with the advancement of manufacturing technology, some methods have gradually developed limitations, such as the adhesion problem between the deposited layer and the substrate in spraying technology, the bottleneck in the processing rate in chemical treatment technology, and the optimization of the performance in gas-phase deposition technology. It is for this reason that innovative surface modification methods such as laser surface modification technology have emerged. As one of the advanced new surface strengthening technologies, laser cladding technology is based on the principle of using a high-energy laser beam to rapidly melt and solidify the cladding powder to form a high-performance coating on the surface of the substrate [9,10,11]. It is widely used in construction machinery, energy mining and other fields by virtue of its low dilution rate, high automation, adjustable material and other characteristics [12]. In recent years, scholars have used laser cladding technology to prepare wear-resistant coatings to improve the service life of mining equipment research. Eshaghian et al. [13] used laser cladding technology to prepare Ni/WC composite coatings for the enhancement of the wear resistance of cut-off gears, through the application of the composite coatings in the long-wall mines showed that the wear rate of the composite coating has been reduced by about 50%. Yue et al. [14] used laser cladding technology to prepare Fe-TiC composite coating to enhance the wear resistance of a coal mining machine spiral blade. The results show that when the TiC content is 30%, the wear resistance of the composite coating is increased by 9 times compared with that of the substrate. Therefore, the related research shows the feasibility of using laser cladding technology to prepare wear-resistant coatings to improve the wear resistance of mining machinery and equipment.
The performance of composite coatings is closely related to the process and materials. Therefore, both domestic and international scholars have conducted extensive research on the process optimization and material design of laser cladding composite coatings. Akintunde et al. [15] prepared AISI-4340/TiC/SiC composite coatings using laser cladding, systematically studied the effects of powder feeding speed, scanning speed, nozzle tilt angle, and yttrium addition on coating quality, and optimized the process parameters. Luo et al. [16] optimized the laser power, scanning speed, powder feeding speed, and overlap rate of multi-layer laser cladding based on the NSGA-II-MOPSO algorithm, obtained the optimal process parameters, and conducted experimental verification. Hu et al. [17] used laser cladding technology to prepare Ni/WC composite coatings with different WC contents, systematically studying the effects of WC content on the microstructure, microhardness, and tribological properties of the composite coatings. However, the interaction between process parameters and ceramic particle ratios during laser cladding has an undeniable regulatory effect on the wear resistance of the coating. Existing studies mostly focus on optimizing a single process or regulating ceramic particles, without considering the interaction between process parameters and the ratio of ceramic particles [18,19,20]. Therefore, this study takes process parameter optimization as a starting point to systematically investigate the interaction between varying WC content and laser cladding process parameters, aiming to reveal their combined effects on coating quality and wear resistance.
This paper designed and prepared five groups of Co-(0%, 20%, 40%, 60%, 80%) WC using laser cladding technology and used signal-to-noise ratio and grey relational analysis methods to analyze the interaction between process parameters and ceramic particle ratios on the microhardness, dilution rate, and porosity [21,22,23]. The optimal process parameters and ceramic particle ratio were obtained. Subsequently, experimental verification was conducted, and the optimal composite coating was prepared on the cutting pick body of the cutter bit, followed by wear resistance tests on the cutter bit. This revealed the wear mechanism of the cutter bit’s wear-resistant coating, providing a theoretical foundation and technical guidance for preparing high-performance metal–ceramic wear-resistant coatings using laser cladding.

2. The Failure Mechanism of Cutting Pick and Testing Methods

2.1. The Failure Mechanism of the Cutting Pick

During the operation of the cutter cutting pick, the tip of the cutting pick is pushed forward at speed Vj to contact the coal or rock and apply pressure. As the compressive force increases, the front end of the cutting pick tip will press against the coal body, forming small hard coal cores, causing the cutting resistance to gradually rise, and the volume of the coal core also increases. When the pressure on the coal or rock exceeds its compressive strength, the conical cutting pick tip will penetrate into the coal body, starting to generate frictional force and lateral pressure. At this point, the spiral drum continues to rotate, driving the cutter cutting pick to continue advancing at the cutting speed. The inclined angle of the cutter edge contacts the coal or rock and begins to compress it, causing tensile stress to develop within the coal or rock. When this tensile stress exceeds the tensile limit of the coal or rock, brittle cracks will form at the front part of the coal or rock, rapidly extending along the direction of the force, thus forming coal blocks of different sizes.
During the process of cutting coal and rock, the cutter bits encounter wear and impact from the coal and rock, causing the surface of the cutter bits to bear high stress. Sharp abrasive particles of coal and rock frequently cut against the cutter bits, causing minor cutting effects on the bit head and bit body, which leads to severe plastic deformation. However, the material of the cutter bit head is hard alloy, which can effectively resist wear and impact from coal and rock, while the material of the bit body is 42CrMo alloy steel, which is prone to large-scale wear and failure (see Figure 1).

2.2. Experimental Materials

Select commonly used 42CrMo material as the base material (150 mm × 50 mm × 15 mm). Cobalt-based alloys have good wear resistance, corrosion resistance, and high-temperature performance and are used for surface repair and wear strengthening of components [24,25,26]. WC ceramic particles, with their high hardness (≥1800 HV) and wear resistance, can effectively resist abrasive wear from coal and rock. Therefore, Stellite6/ WC spherical hybrid powder (particle size 75–150 μm) is chosen as the cladding material. Before the experiment, use a milling machine to mill the surface of the prepared base steel plate flat, and remove surface contaminants using anhydrous ethanol. Figure 2. shows the morphology of the cladding powder. Table 1 lists the chemical compositions of 42CrMo steel and Stellite 6 cladding powders.

2.3. Experimental Plan

To investigate the mapping relationship between the processing technology and forming quality of laser cladding Stellite6/WC composite coatings, as well as the interaction between the processing technology and the proportion of ceramic phase, this paper uses laser cladding technology to prepare five groups of Stellite6-(0%, 20%, 40%, 60%, 80%) WC composite coatings on the surface of 42CrMo substrate using orthogonal experiments. Laser power, scanning speed, and powder feeding speed are used as independent variables, while hardness, dilution rate, and crack area are used as response variables. The determination of each parameter range in Table 2 comprehensively considers the results of the previous pre-experiments and the recommended values in relevant literature. Referring to the existing research results on WC-enhanced cobalt-based coatings, it is ensured that the selected parameters are scientifically reasonable. Different WC proportions (0%–80%) are represented by groups (A–E). Table 2 shows the Taguchi experimental parameters table.

2.4. Experimental Preparation and Performance Testing

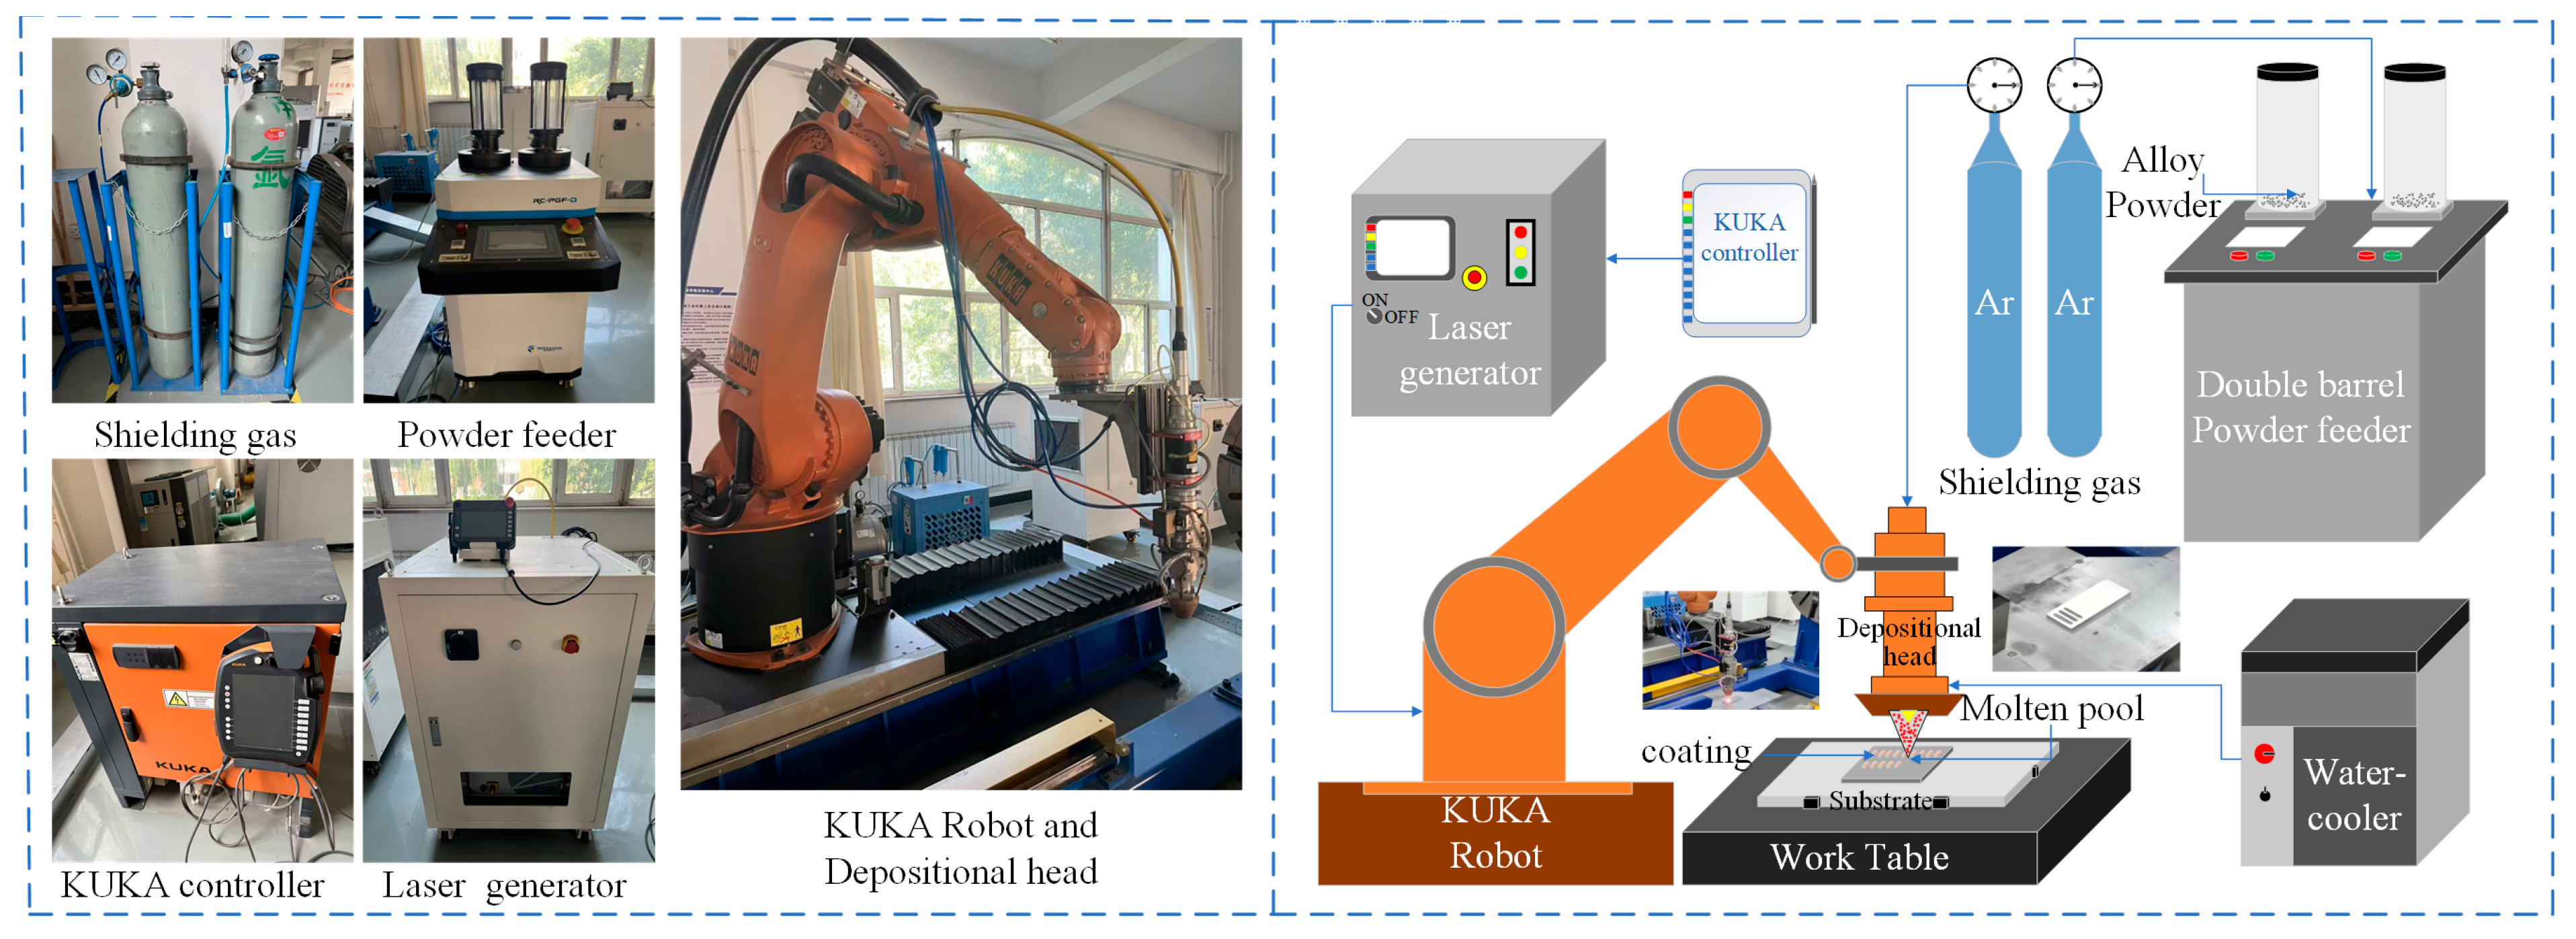
We conducted a laser cladding experiment using the laser cladding system shown in Figure 3. This laser cladding system adopts the Laserline LDM-3000 laser from Koblenz, Germany, and the cladding path is executed by the KUKA Aktiengesellschaft KR30HA robot from Bavaria, Germany. The RC-PGF-D2 dual-bin coaxial powder feeder from the Institute of Optics and Electronics, Chinese Academy of Sciences (CAS Lightech) in Nanjing, China, provides powder supply for the cladding process. High-purity argon gas is used as the powder conveying gas and protective gas to prevent oxidation during the cladding process. The laser cladding experiment was carried out in accordance with the designed implementation plan. After the experiment, the coating was cut into samples of 20 mm × 20 mm × 15 mm using a wire-cutting machine tool. The macroscopic morphology of the coating was measured by the VHX-5000 ultra-deep depth-of-field microscope of KEYENCE Corporation in Osaka, Japan, and its porosity was measured by the chromatic aberration method using ImageJ 1.54p software. The microhardness of the cross-section of the coating was measured by using the HYHV-1000 Vickers hardness tester from Shanghai Hualong Testing Co., LTD., Shanghai, China. The microhardness of the coating was evaluated under a 500 g load applied for 10 s using a superhard alloy indenter, and the hardness value was calculated based on the measured diagonal length of the indentation observed under an optical microscope. From the top to the bottom of the coating, a test point was selected at every 0.1 mm horizontal position, and each position was tested three times. Finally, the average value of all test points was calculated as the average microhardness of each coating. Table 3 shows the experimental results (Abbreviations: MH stands for microhardness; DR stands for dilution rate; PO stands for porosity; CS stands for cross-sectional photograph of the cladding layer).

3. Results and Discussion

Signal-to-noise ratio is an important metric for measuring signal quality, representing the ratio of signal strength to noise strength. In data analysis, we can consider data as signals, while data fluctuations or noise can be seen as interference. The signal-to-noise ratio not only reflects the average level of the data but also its variability. A higher signal-to-noise ratio indicates lower data variability, whereas a lower signal-to-noise ratio indicates higher data variability. The aim of this study is to obtain coatings with the highest microhardness, lowest dilution rate, and minimal porosity. Therefore, the calculation results aim for higher hardness, while the dilution rate and porosity aim for lower values. The specific calculation formulas are as follows:
The signal-to-noise ratio of small feature expectations (STB):
S N R = 10 log 10 1 n i = 1 n y i 2
The signal-to-noise ratio of large features expectations (LTB):
S N R = 10 log 10 1 n i = 1 n 1 y i 2
The results of the signal-to-noise ratio for each group, after calculation, are shown in Table 4.

3.1. Microhardness Signal-to-Noise Ratio Analysis

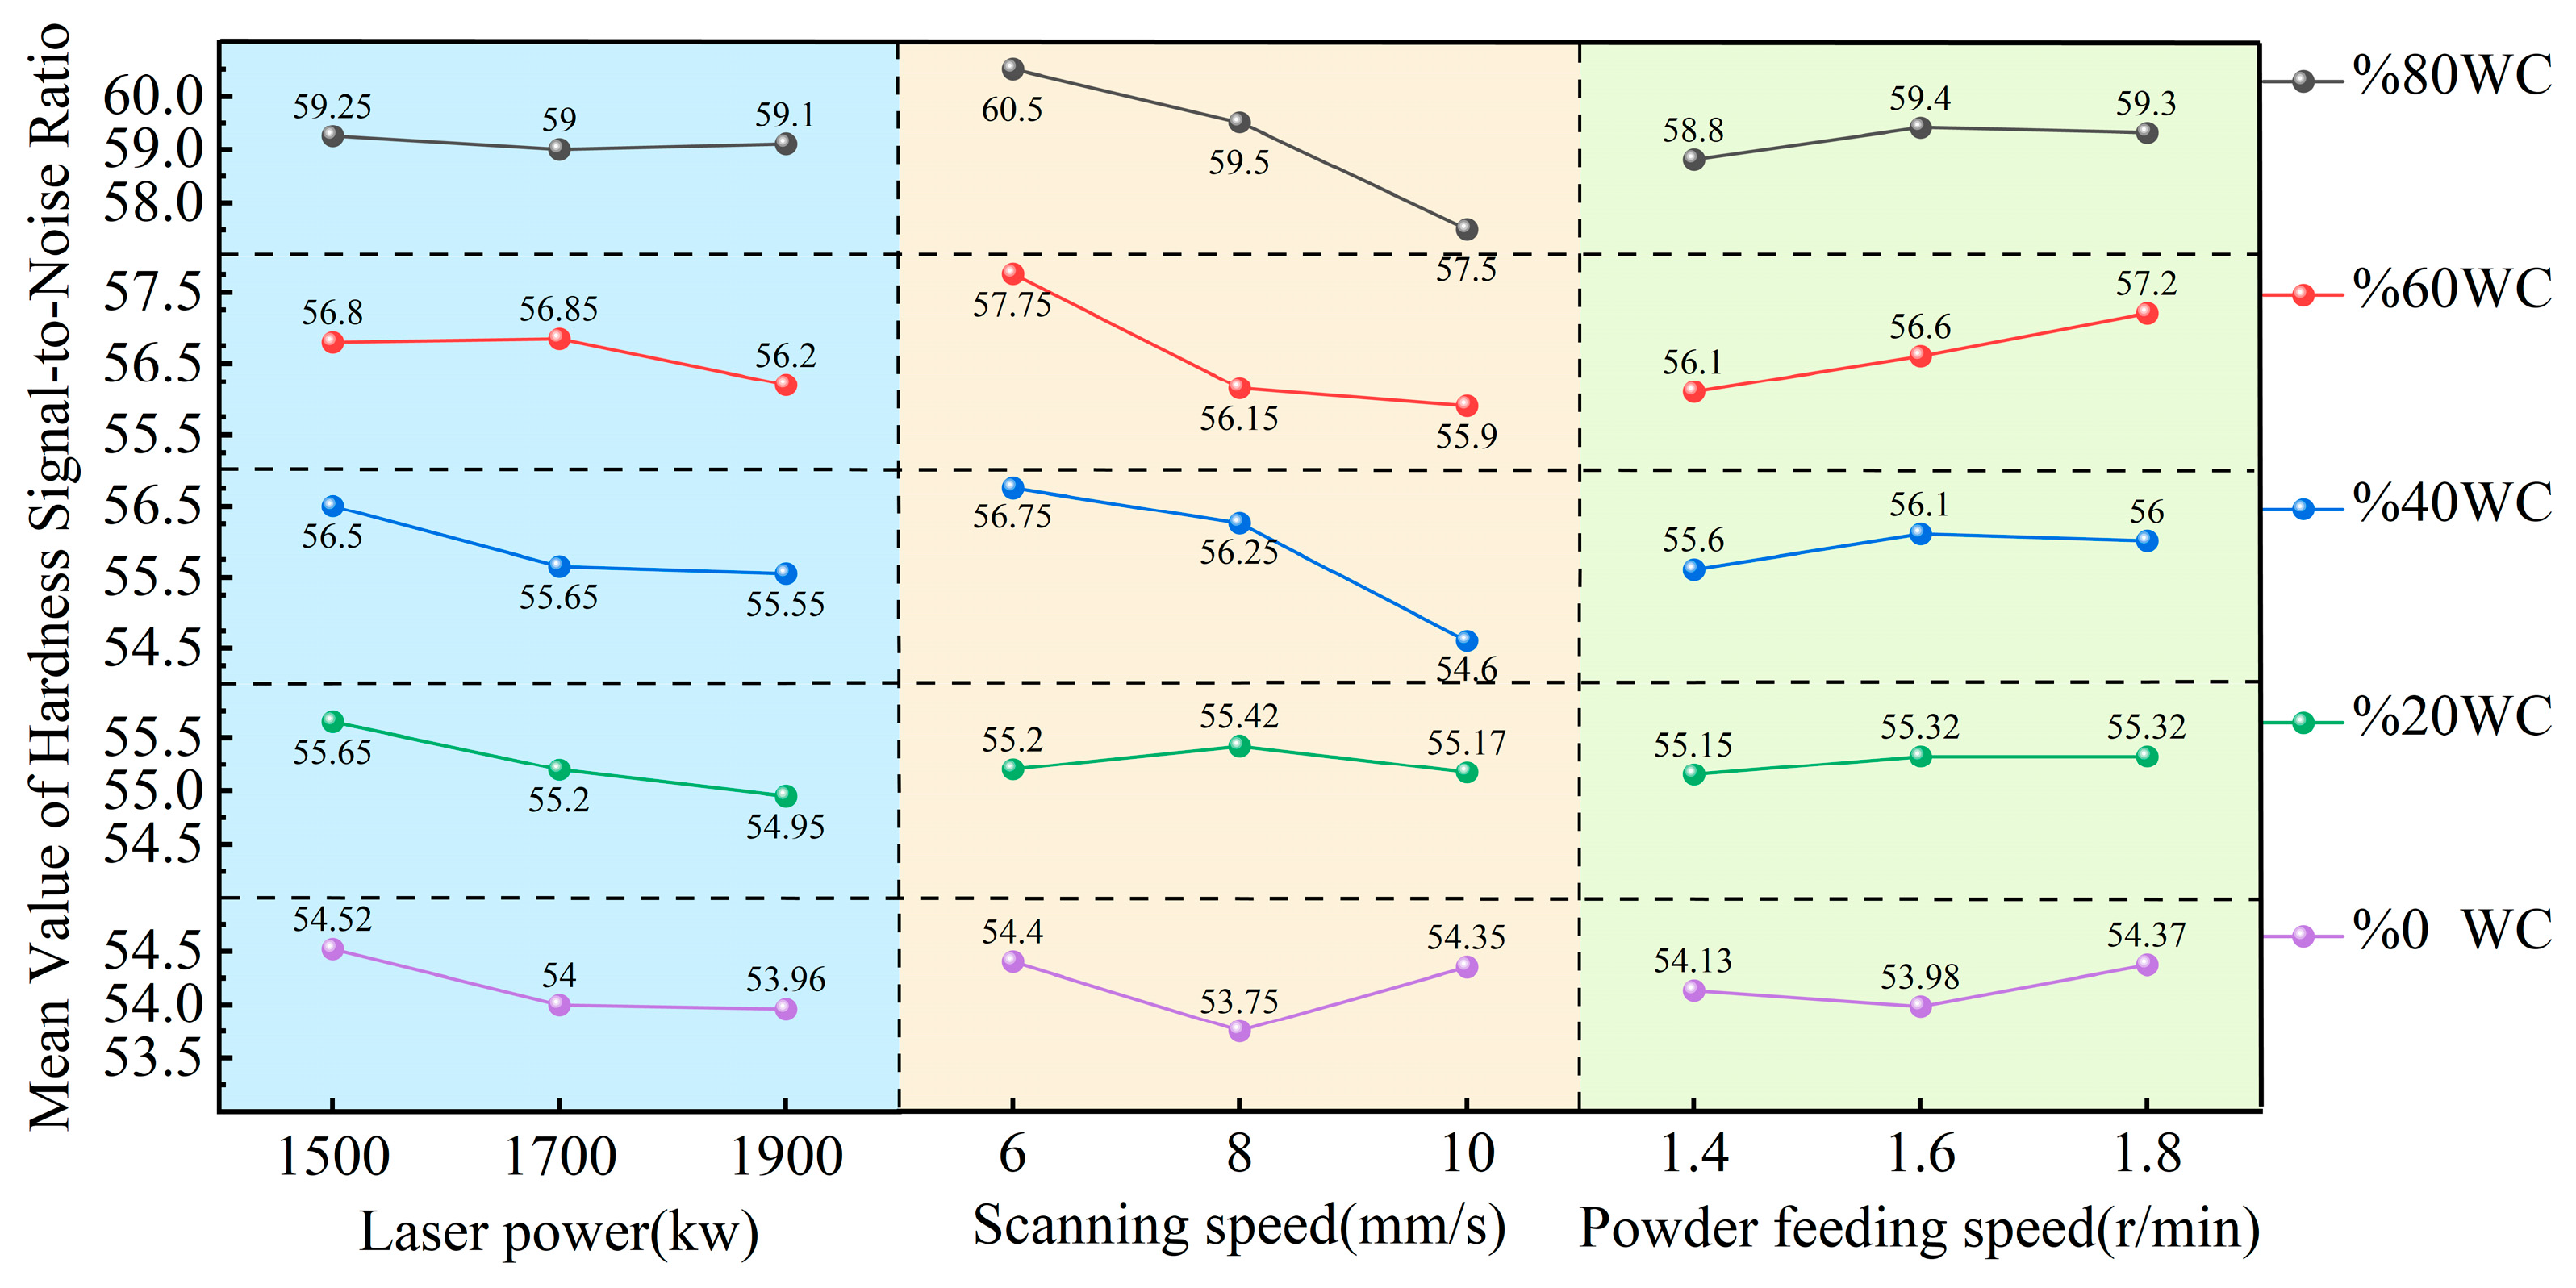
Figure 4 shows the mean signal-to-noise ratio of various parameters under different material ratios. The greater the change in signal-to-noise ratio, the more significant the impact of that parameter on the index. For composite coatings with 0% WC, increasing laser power (P) continuously reduces the signal-to-noise ratio, while scanning speed (V) and powder feeding speed (F) first decrease and then increase. According to the principle of optimal signal-to-noise ratio, the parameters corresponding to the highest microhardness are P1F1S3. For coatings with 20% WC, increasing P gradually decreases the signal-to-noise ratio, while V and F first decrease and then increase; the optimal parameters are P1F2S2 or P1F2S3. Similarly, the optimal parameters for 40% WC, 60% WC, and 80% WC are P1F1S2, P2F1S3, and P1F1S2, respectively. Longitudinal analysis of the same parameters with different WC contents shows that when the WC content is low, the scanning speed has the greatest impact on microhardness, and this impact decreases as the WC content increases, while the influence of laser power and powder feeding speed increases. The increase in WC content and the quality of the fusion between cobalt-based powder and WC are key factors for hardness improvement, so laser power remains the core influencing factor. As the WC content increases, the impact of powder feeding speed and scanning speed on fusion quality becomes more significant [27].

3.2. Dilution Rate Signal-to-Noise Ratio Analysis

The dilution rate is a core indicator for evaluating the forming quality of cladding layers: the smaller the dilution rate, the lower the degree of fusion between the substrate material and the reinforcement phase material, and the better the reinforcement performance of the cladding layer. Its calculation formula is usually expressed as D = h / ( h + H ) . Here, h represents the melt pool depth (mm), and H represents the melt height (mm). Figure 5 shows the distribution of mean signal-to-noise ratios corresponding to various process parameters under different WC contents. When the WC content is 0%, with the increase in laser power (P) and powder feeding speed, the signal-to-noise ratio decreases, while the scanning speed (V) affects the signal-to-noise ratio by first increasing and then decreasing. Based on the principle of maximizing the signal-to-noise ratio, the optimal process parameters for this composition can be determined as P1F1S3. Similarly, parameter optimization is conducted for other WC contents, yielding the following results: for 20% WC content, the optimal parameters are P1F2S2; for 40% WC content, P1F2S2; for 60% WC content, P1F3S3; and for 80% WC content, P1F2S1. Comparative analysis of the same parameters with different WC contents shows that for the dilution rate, which characterizes the cladding quality, laser power is always the primary influencing factor; however, as WC content gradually increases, the influence weight of powder feeding speed gradually exceeds that of scanning speed. To facilitate the quantitative analysis of the combined effect of laser power and scanning speed, the key variable of line energy (E) is introduced, with its calculation formula being E = P / V . Here, E represents line energy (W·min/mm), P represents laser power (W), and V represents scanning speed (mm/s). Therefore, by reasonably controlling the powder feeding speed and laser power, it can effectively prevent excessive accumulation of line energy and reduce the volume of base material melting, thereby decreasing the dilution rate and optimizing the cladding layer performance [28].

3.3. Porosity Signal-to-Noise Ratio Analysis

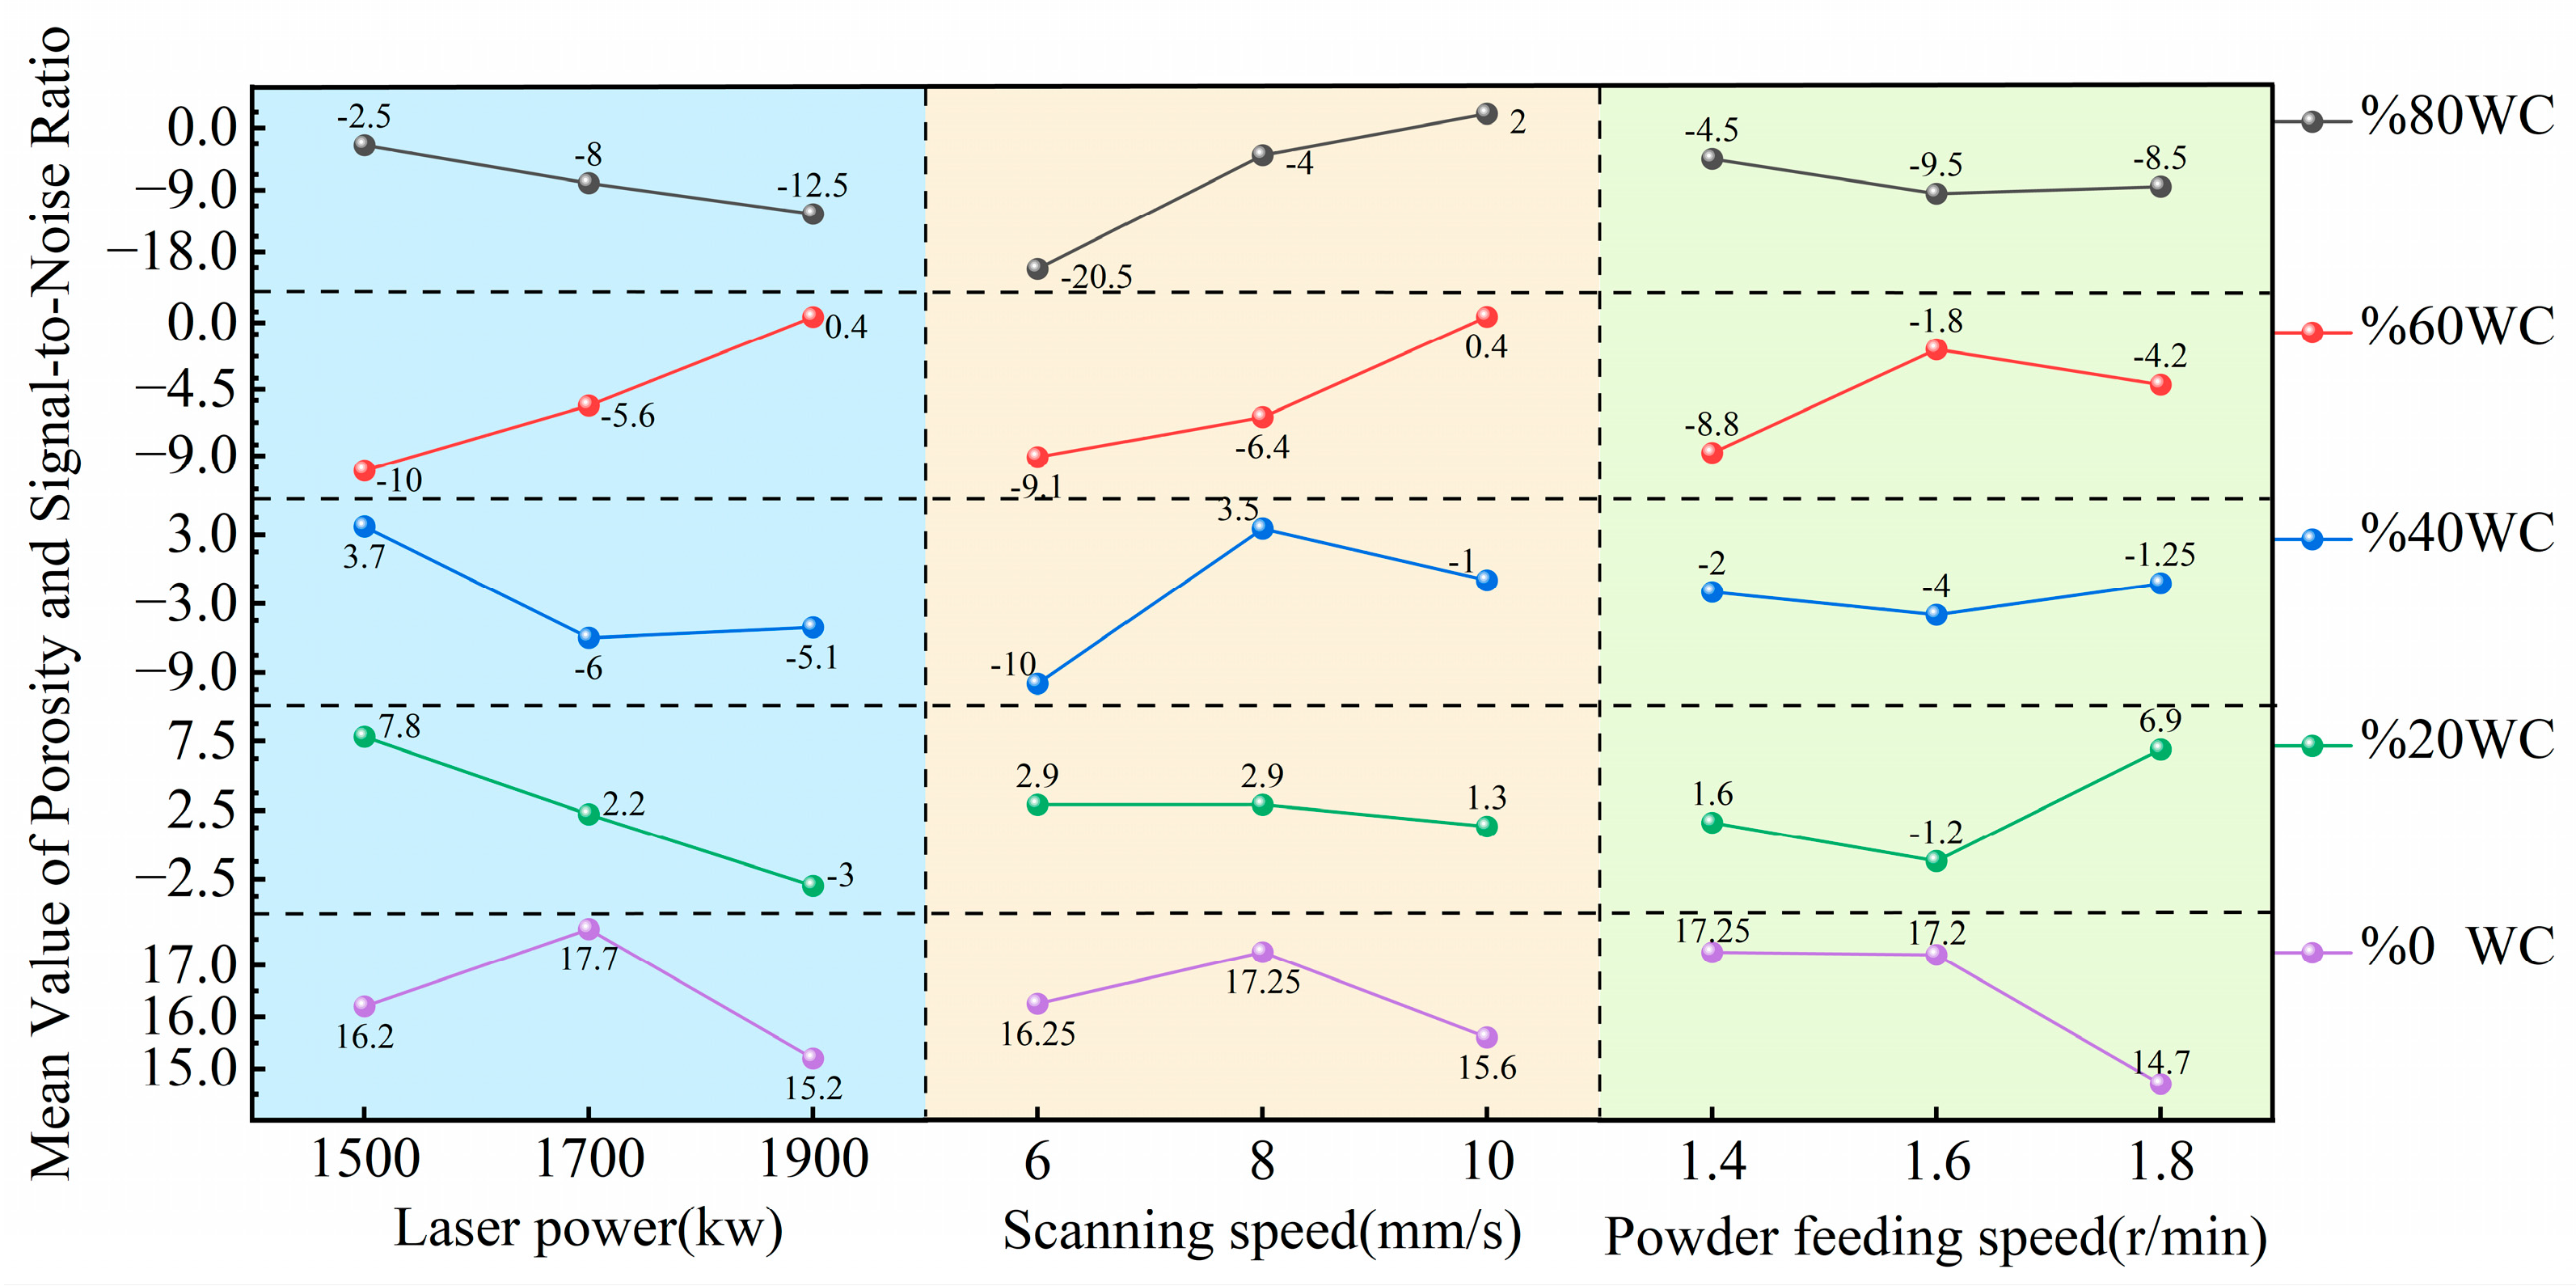
Figure 6 presents the distribution characteristics of the mean signal-to-noise ratio of porosity corresponding to different process parameters under various WC contents. Porosity is a core indicator for evaluating the density of the cladding layer, and its signal-to-noise ratio analysis can provide a quantitative basis for optimizing process parameters. A horizontal analysis of the porosity signal-to-noise ratio changes in the 0% WC cladding layer in Figure 5 shows that as laser power (P) and scanning speed (V) increase, the signal-to-noise ratio first rises and then falls, while an increase in powder feeding speed (F) leads to a continuous decrease in the signal-to-noise ratio. Based on the numerical gradient of the signal-to-noise ratio in the figure, the impact of each parameter on the porosity of the 0% WC cladding layer can be quantified. According to the principle of maximizing the signal-to-noise ratio, the optimal process parameters for optimizing porosity alone are P2F2S1. Further analysis of the porosity signal-to-noise ratio characteristics of the 20% WC cladding layer indicates that as laser power (P) and scanning speed (V) increase, the signal-to-noise ratio gradually decreases; the effect of powder feeding speed (F) on the signal-to-noise ratio first decreases and then increases. Based on the principle of the best signal-to-noise ratio, the optimal parameters for porosity under this ratio can be selected as P1F1S3 or P1F2S3. Similarly, the optimal porosity parameters for other WC contents are as follows: 40% WC is P1F2S3; 60% WC is P3F3S2; 80% WC is P1F3S1. Comparing the range characteristics of each curve with different WC contents under the same parameters can further reveal the dynamic changes in the influence of process parameters on porosity: In the stage of lower WC content, the impact weight of powder feeding speed on porosity is significantly higher than other parameters; as the WC content gradually increases, the influence degree of scanning speed and laser power shows an increasing trend, among which the importance of laser power becomes particularly prominent with the increase in proportion, eventually becoming the dominant factor in regulating porosity. The presence of pores in reinforced coatings has a certain inevitability, and their number and size usually increase with the rise in WC content, but through systematic optimization of process parameters, effective suppression of porosity can be achieved. Reasonable control of line energy is the core prerequisite for reducing porosity, and inputting sufficient and suitable line energy can ensure stable metallurgical bonding between the cladding layer and the substrate, while reducing the accumulation of thermal stress and the generation of micro-defects. Since laser power and scanning speed are key control variables for line energy, their dominant role in porosity is more significant under high WC ratio conditions [29].

3.4. Multi-Objective Optimization Based on Grey Relational Theory

In most experimental scenarios, response variable data obtained through different measurement methods are often difficult to directly compare and analyze due to differences in dimensions and numerical scales. Therefore, normalization processing is introduced, which uses standardization formulas to uniformly convert response variables from various measurement methods into the numerical interval of [0, 1], effectively eliminating the issue of data incomparability caused by differences in measurement methods. For different optimization objectives, differentiated normalization strategies need to be adopted. Analogous to the classification logic of signal-to-noise ratio in loss functions, some scholars have named these targeted methods “Minimize Normalization,” “Maximize Normalization,” and “Target Normalization,” with their specific formulas as follows:
x i ( k ) = y i ( k ) min y i ( k ) max y i ( k ) min y i ( k ) , L T B max y i ( k ) y i ( k ) max y i ( k ) min y i ( k ) , S T B max y i ( k ) a ( k ) y i ( k ) a ( k ) max y i ( k ) a ( k ) min y i ( k ) a ( k ) , N T B
In the formula, xi(k) represents the normalized value of the k-th response variable obtained from the i-th experiment, yi(k) represents the actual value of the k-th response variable corresponding to the i-th experiment, max yi(k) and min yi(k) represent the maximum and minimum values of the k-th response variable across all experiments, respectively, and a(k) represents the target value. Table 5 shows the specific calculation results.
The grey correlation coefficient represents the degree of correlation between different response variable experimental data and the optimization target value. The specific formula is as follows:
G R C i ( k ) = min i x i 0 x i ( k ) + ξ max i x i 0 x i ( k ) x i 0 x i ( k ) + ξ max i x i 0 x i ( k )
In the formula, GRCi(k) represents the value of the grey relational coefficient corresponding to the k-th response variable under the i-th experiment; xi(k) represents the normalized value calculated for the k-th response variable under the i-th experiment. x i 0 represent ideal experimental data values. In this work, we take x i 0   = 1; ξ represents the resolution coefficient, with a value range from 0 to 1. In this paper, the principal component analysis (PCA) invented by Pearson and Hottling is adopted to process the ξ value. Let the sample size be n = 45 and the index number be p = 3 in the order of columns (MH, DR, PO). The original normalized matrix is denoted as X = [xik]∈Rn×p. To perform PCA, first standardize the columns with Z-score to obtain Z = [zik]. Among them:
z i k =   x i k -   m k s k
μ k   = 1 n i = 1 n   x i k
σ k   = 1 n 1 i = 1 n ( x i k   μ k   ) 2
Based on this, construct the correlation matrix:
R = 1 n 1 Z Z
Eigendecomposition and load matrix are used to perform eigendecomposition on R = VΛV: Λ = (2.057524, 0.546459, 0.396017); V.
Among them, the column of V is the main component direction. The load matrix is defined as:
L = V Λ 1 / 2
The dominance rate of the first principal component (PC1) was 68.58%, and the weights of the three indicators on PC1 were (0.828, 0.794, 0.861), respectively, indicating that their contributions to the potential comprehensive quality characteristics were approximately equal and there were no significant dominant variables. Based on this statistical evidence, in order to achieve a neutral balance between discrimination and numerical stability in the grey correlation coefficient and ensure the comparable consistency of the results of groups A–E, this paper fixed ξ at 0.5. To reflect the relative contributions of each indicator to the dominant variance. This value has been widely adopted in previous optimization studies and has been proven to maintain a relatively stable correlation under different process conditions [30]. The coefficients vary depending on the different response quantity data, so the number of response quantities corresponds to the number of grey correlation coefficients. Multiple response quantities mean there are multiple grey correlation coefficients. Therefore, it is necessary to aggregate the grey correlation coefficients of each response quantity into one value. The average of the grey correlation coefficients of different response quantities is taken as a comprehensive indicator to represent the correlation between the response quantity and the target value (the grey correlation degree). The specific formula is as follows:
G R G I = 1 n k = 1 n G R C i ( k )
In the formula, GRCi represents the grey relational degree value corresponding to the i-th experiment, GRCi(k) represents the numerical value of the grey relational coefficient corresponding to the kth response variable under the i-th experiment, and n represents the total number of response variables. After substituting the above data, Figure 7 is obtained.
This section focuses on enhancing the 42CrMo cutting pick using laser cladding technology. By preparing a cobalt-based tungsten carbide physical performance reinforcement coating on the 42CrMo substrate, the study deeply analyzes the impact of process parameters on the performance of the coating layer and completes multi-objective optimization. The specific conclusions are as follows: Using signal-to-noise ratio analysis, the study systematically explores the influence of three key process parameters laser power, scanning speed, and powder feeding speed on the core performance indicators of the coating layer (micro-hardness, dilution rate and porosity). Combining grey relational analysis and multi-objective optimization of laser directed energy deposition process parameters was performed (aiming to improve microhardness, reduce dilution rate, and porosity). The optimal parameter combination was chosen as the level with the highest average response. In this study, 40% WC content, a laser power of 1900 W, a scanning speed of 6 mm/s, and a powder feeding speed of 1.8 r/min were selected as the optimal process parameters for 42CrMo picks laser cladding strengthening. This combination maximizes the microhardness of the deposited layer while minimizing the dilution rate and porosity.

3.5. Comparison and Analysis of Optimal Parameters Under Different Ratios

By comparing the different grey relational coefficient (GRCi) values within the group, the optimal process parameter combinations for WC ratios from 0% to 80% were determined as follows: For 0% WC ratio: laser power 1700 W, scanning speed 10 mm/s, powder feeding speed 1.8 r/min; for 20% WC ratio: laser power 1900 W, scanning speed 10 mm/s, powder feeding speed 1.4 r/min; for 40%, 60%, and 80% WC ratios: all use the third set of parameters, laser power 1900 W, scanning speed 6 mm/s, powder feeding speed 1.8 r/min. The above optimal parameter data were integrated and plotted as Figure 8. From the parameter distribution characteristics in Figure 7, it can be clearly observed that as the WC content gradually increases, the energy demand for the cladding layer shows an increasing trend. Specifically, under high WC ratio conditions, higher laser power (1900 W) and lower scanning speed (6 mm/s) become the optimal choice. This parameter combination can provide greater linear energy input through the linear energy formula (E). Adequate and well-matched linear energy can effectively improve the fluidity of the melt pool and the metallurgical bonding effect and reduce defects such as unfused areas and porosity, thereby significantly enhancing the forming quality of the cladding layer. This rule further verifies the core role of linear energy control in cladding processes with high hard phase ratios. By optimizing the synergistic relationship between laser power and scanning speed, the energy requirements of the reinforcing phase (WC) can be met, achieving stable performance improvements in the cladding layer.

3.6. Verification Experiment

To verify the reliability and repeatability of the optimization results, we conducted additional verification experiments. The experimental data from multiple repeated measurements were compared with the corresponding optimized calculated values. The results show that all the experimental data are within the acceptable error range, and the consistency between the experimental results and the calculated results is good. The average relative error between the experimental results and the optimization results is less than 10%, indicating that the adopted optimization method can produce stable and accurate results. These verification results prove the robustness of the proposed optimization method and confirm that it can reliably reproduce the target performance under different conditions. The detailed data and comparison results of the verification experiment are shown in Table 6.

3.7. Friction and Wear Testing

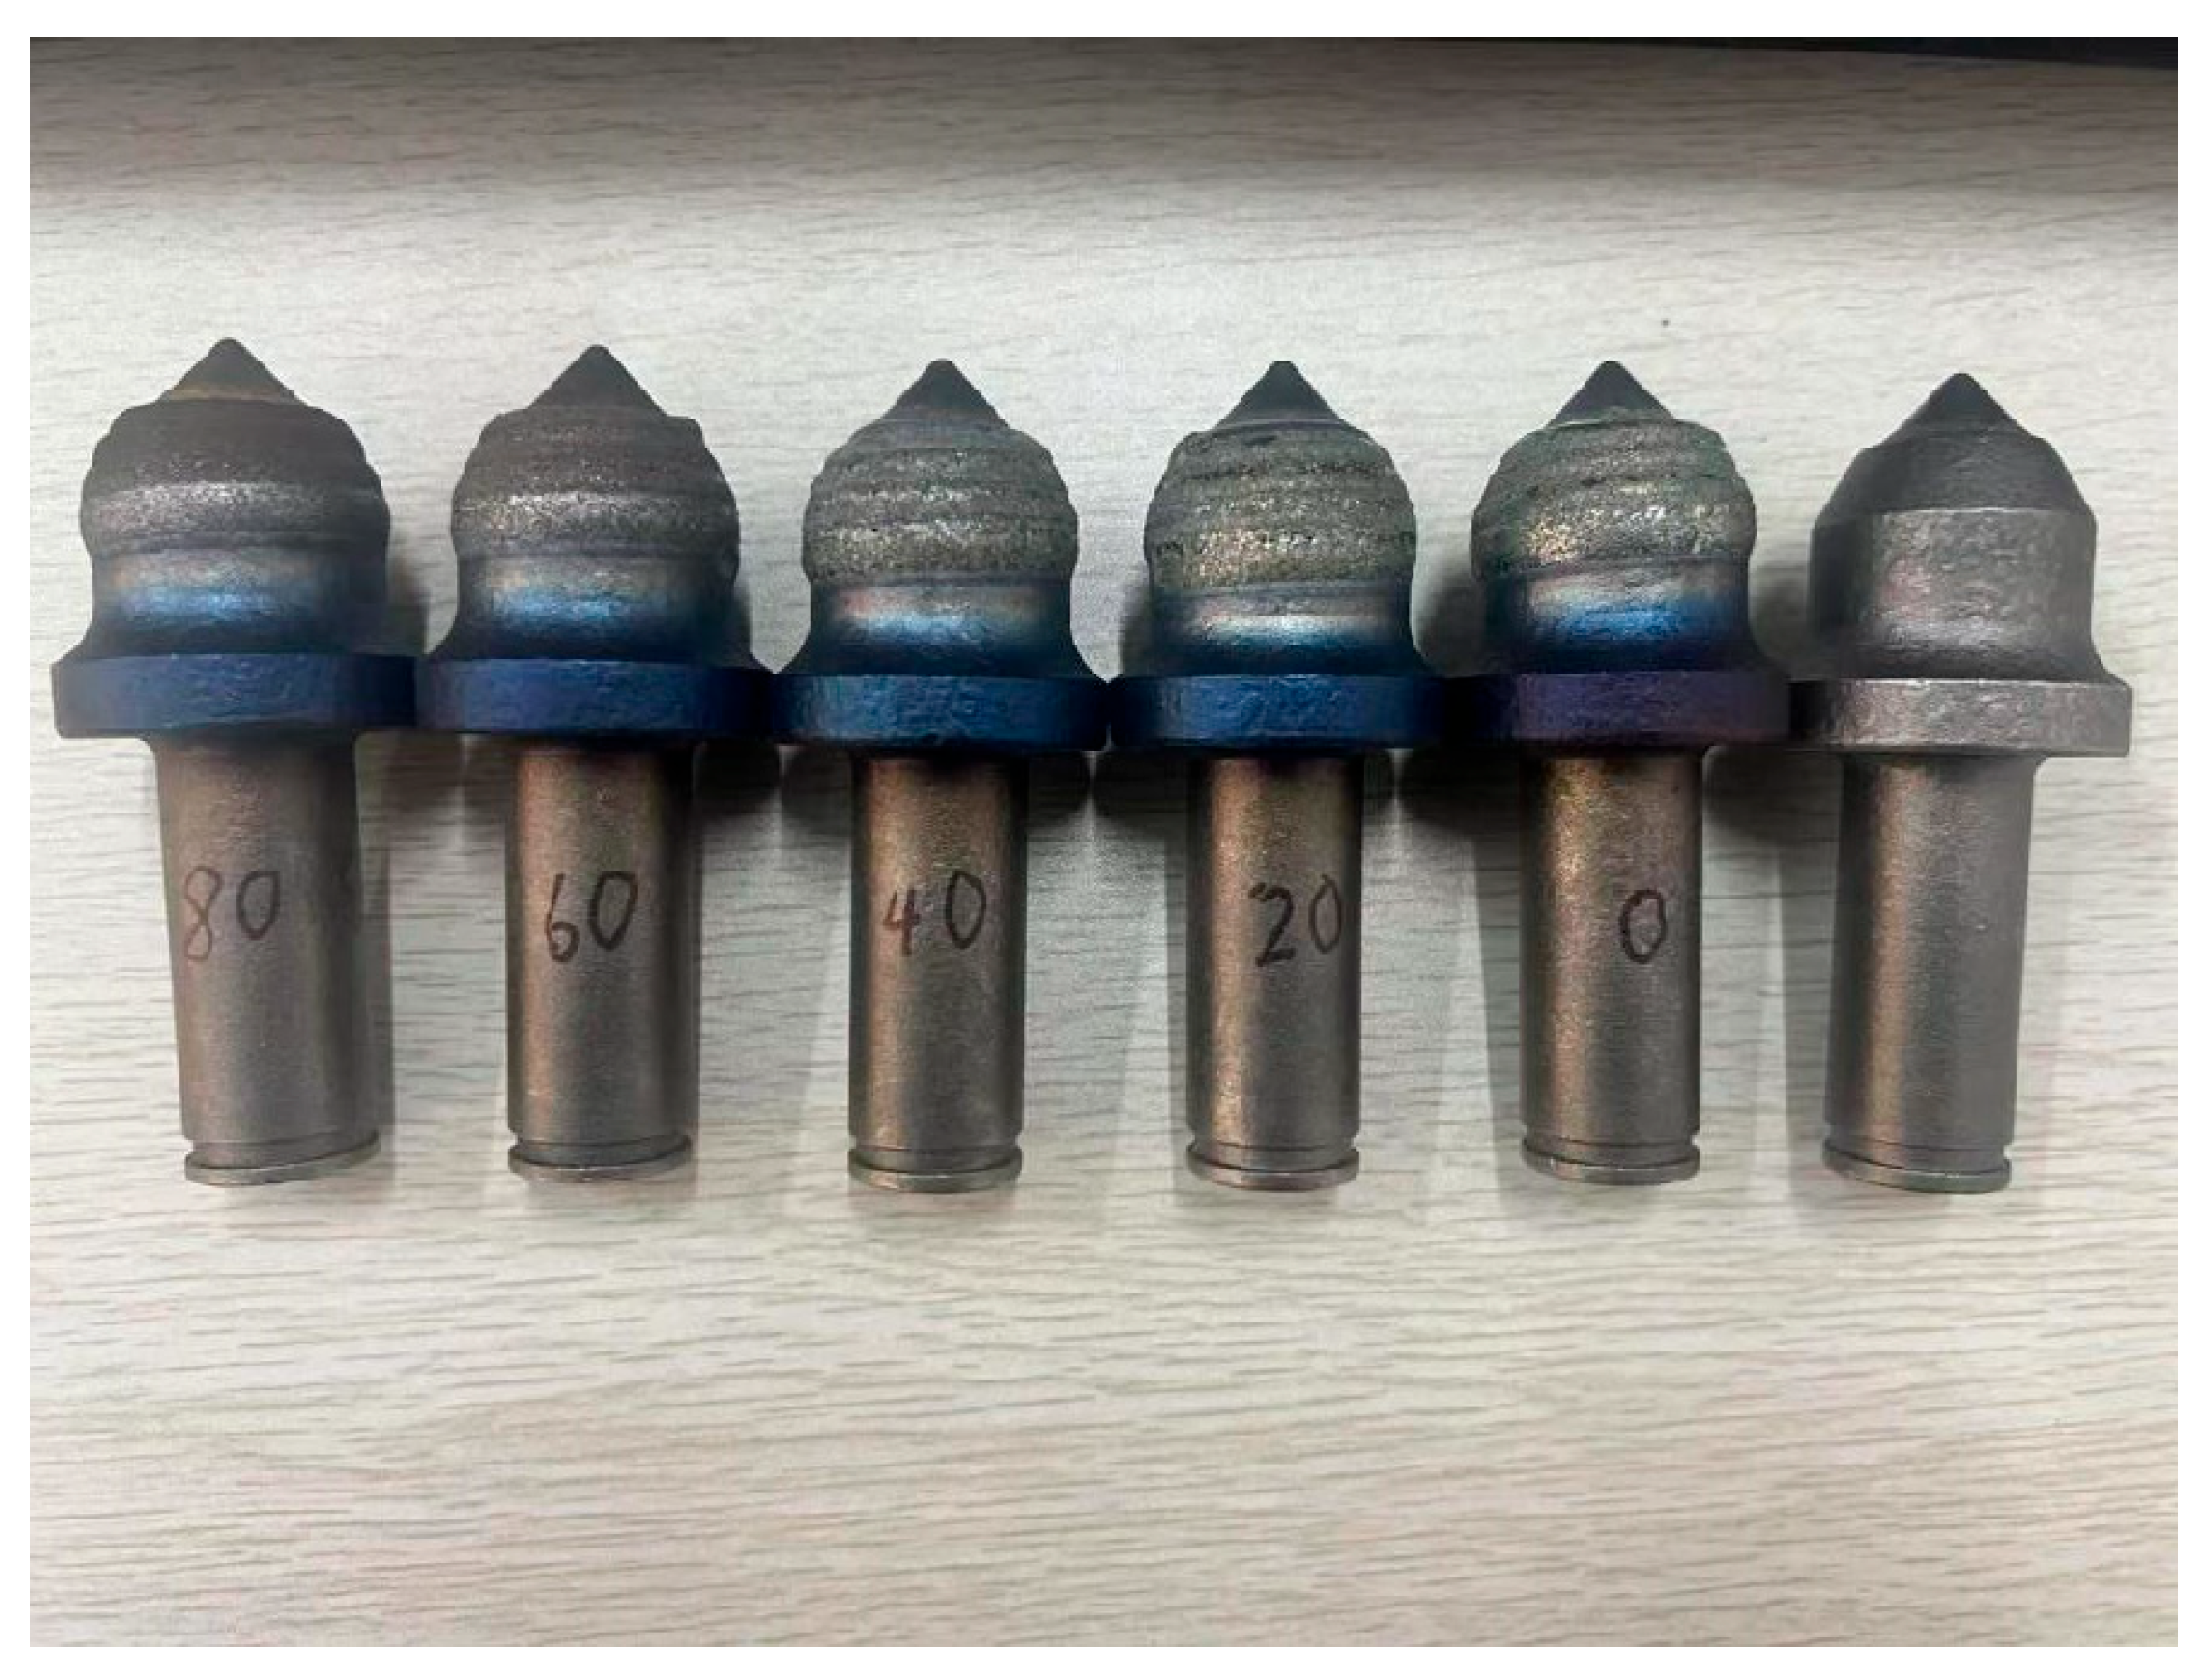
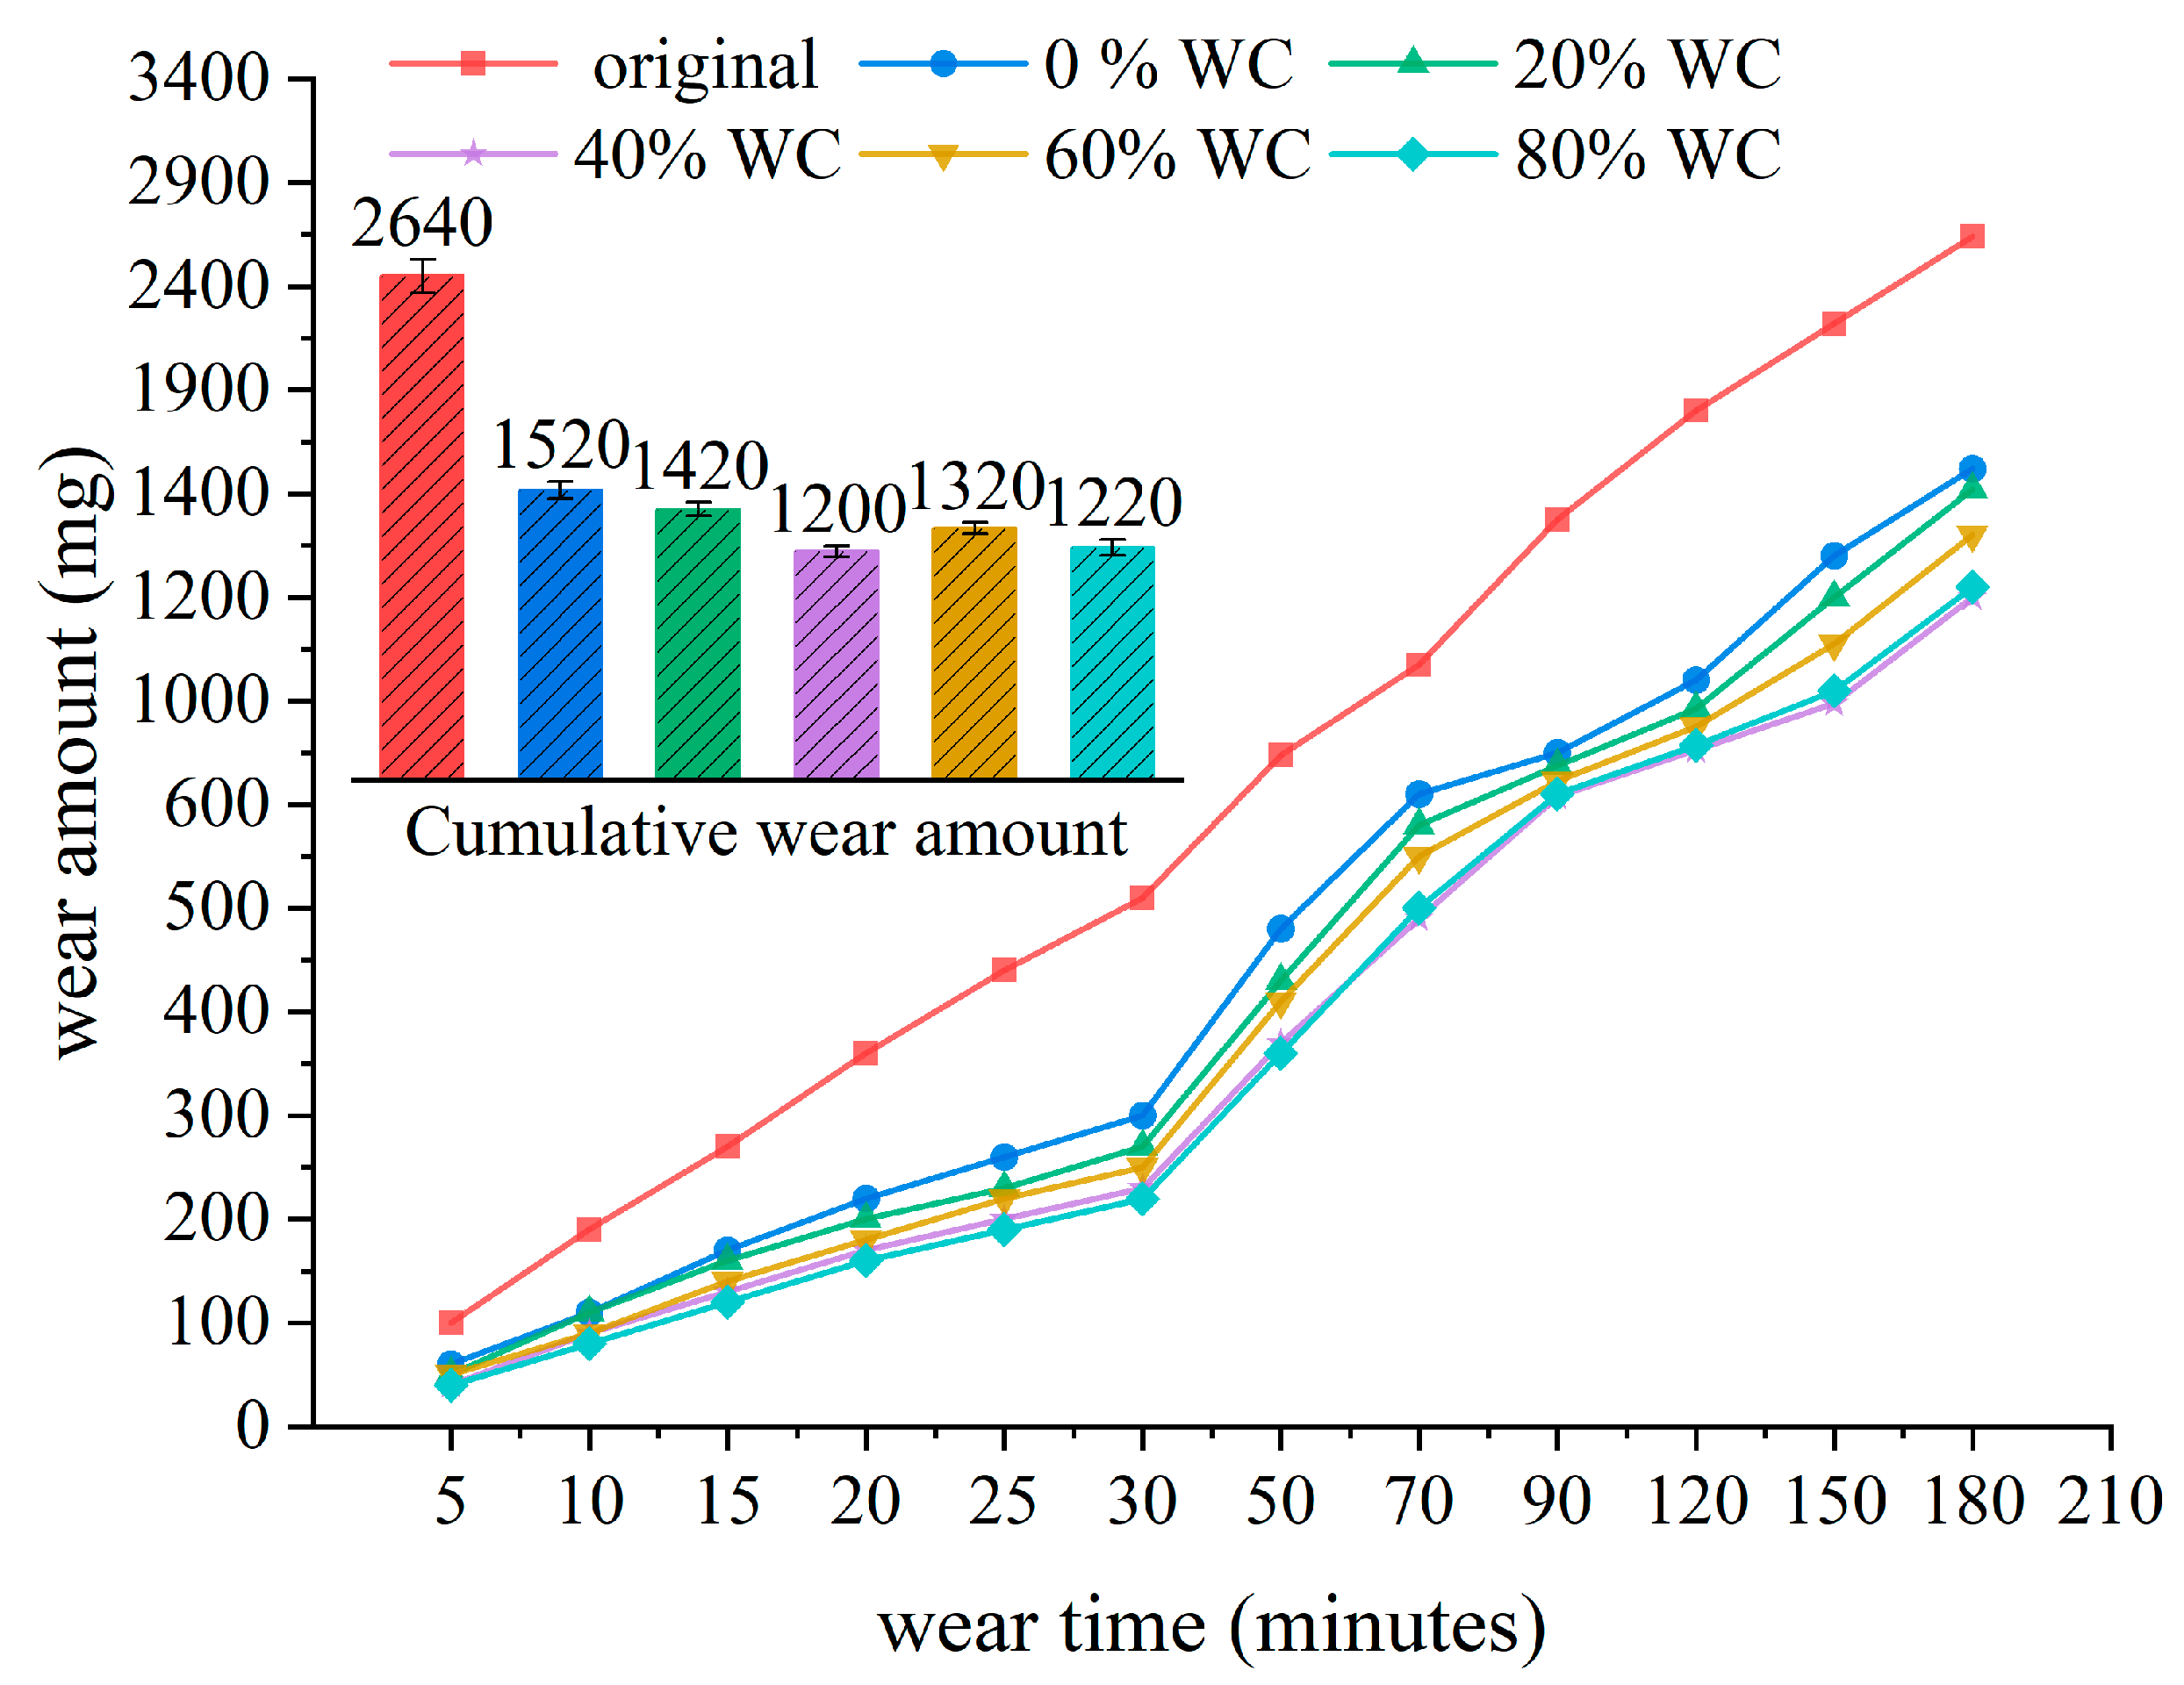
During the experiment, five different mix ratios of cutter samples were prepared based on the LDM3000-100 six-axis industrial robot and its accompanying experimental equipment. All samples were processed under optimized best process parameters, and their physical appearances are shown in Figure 9. Friction and wear performance tests were conducted on the aforementioned cutter samples, resulting in wear characteristic curves as shown in Figure 10. The wear test is conducted by the friction and wear testing machine under dry friction conditions. The loading force is 30 N, the sliding speed is 150 rad/min, and the counterpart material is cylindrical marble to simulate the friction environment at the interface between the cutting teeth and the rock. The experiment was conducted at room temperature (25 ± 2 °C). A segmented recording strategy was used during the experiment: the weight change of the cutters was measured every 5 min initially, then adjusted to every 20 min after 30 min, and finally changed to every 30 min after 90 min. Three sets of picks were used three times under the same experimental method, and the average value was finally obtained. The friction and wear test results showed that the cutters exhibited a high wear rate at the beginning of the test, which gradually slowed down after 10 min and stabilized after 30 min. Among them, cutter C (containing 40% WC) had a total wear amount of 1200 mg over a 180 min test period, making it the group with the lowest wear amount among the five samples. This result is consistent with the previous performance test conclusions, indicating that compared to the unenhanced reference cutters, its wear resistance has increased by 45%.
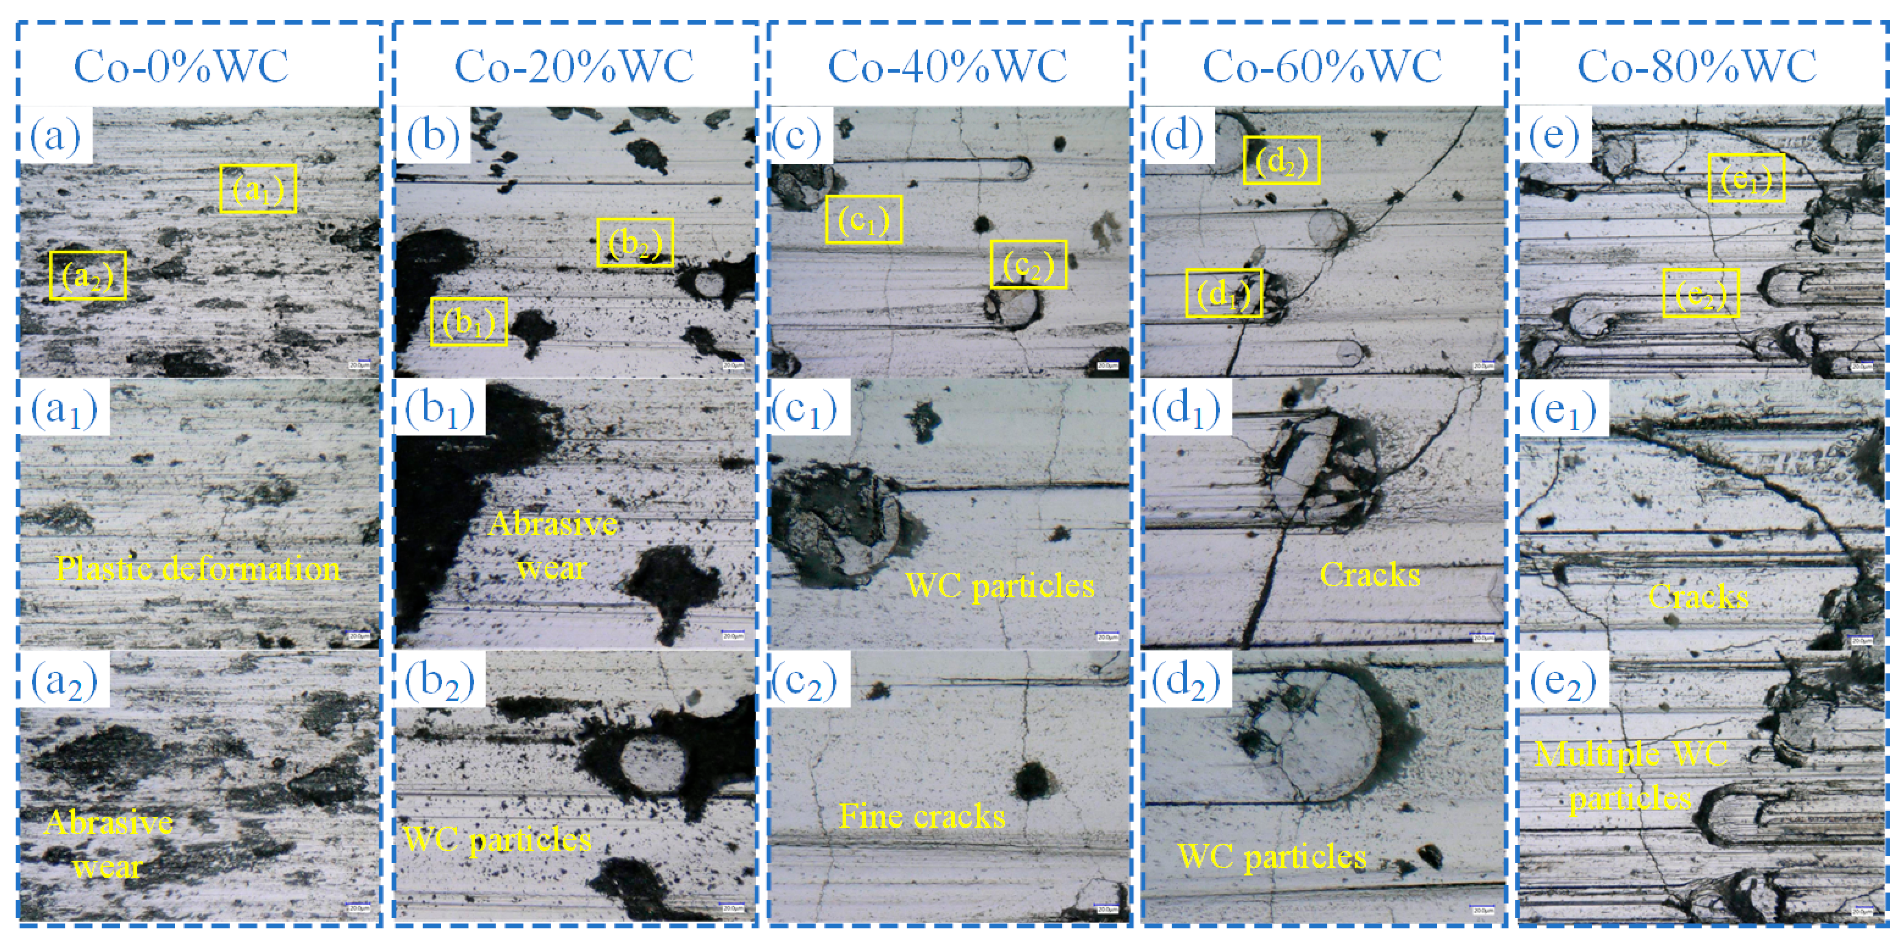
As shown in Figure 11, from left to right are the wear morphology diagrams of the coating with 0%–80% WC content captured under an ultra-deep field microscope. For coatings with WC content ranging from 0% to 20%, relatively obvious parallel furrows and grinding swarf accumulation appear on the surface, which is a typical abrasive wear. This is because the content of the hard phase in the coating is insufficient. When the cladding layer is rubbed, it is easily cut by hard micro-protrusions and cannot effectively resist the scratching of microscopic abrasive particles. Meanwhile, under the repeated action of frictional stress, local areas experience work hardening and embrittlement, forming fine cracks that spread along the furrow direction. This wear state indicates that although cobalt-based coatings with low WC content have certain toughness, their hardness is relatively low, and their wear resistance is limited. When the WC content increases to 40%, the worn surface is smooth and dense, with only fine shallow scratches and crack marks visible without obvious spalling, showing typical characteristics of slight abrasive wear. At this point, WC particles are uniformly distributed in the matrix and form a continuous load-bearing framework with the cobalt-based alloy bonding phase, effectively suppressing abrasive cutting and stress concentration. The hard phase enhances the surface’s resistance to cutting, while the plastic cobalt-based phase can absorb loads and prevent crack propagation through microscopic deformation. The synergistic effect of the two enables the coating to achieve the optimal balance between hardness and toughness, with a smooth and controllable wear process, demonstrating the best wear resistance. When the WC content is further increased to 60%–80%, the wear morphology undergoes significant changes. Radial cracks and local spalling pits can be seen on the surface, indicating that brittle fracture and fatigue spalling are the main wear mechanisms of the coating under high-stress cycles. An excessively high WC ratio reduces the continuity of the metal bonding phase, making it difficult for the internal stress of the coating to be effectively transmitted and released. Meanwhile, unmelted WC particles and pores become stress concentration points, causing cracks to rapidly initiate and interpenetrate between carbides. Although the hardness of the coating is relatively high at this time, due to insufficient toughness and weakened interfacial bonding, its wear resistance actually decreases.
In conclusion, the WC content has a significant impact on the wear behavior of cobalt-based coatings. When the WC is low, abrasive wear is dominant, and the hardness is insufficient. At high WC, brittle spalling is predominant, and the toughness is insufficient. At 40%, the hard phase and the bonding phase form a reasonably matched composite structure, achieving a harmonious unity of load-bearing capacity and fracture toughness, thereby obtaining the best comprehensive wear resistance. In addition, as the proportion of WC increases, the cost of coating preparation also rises significantly because the price of carbide materials is relatively high. Therefore, from the comprehensive perspective of mechanical properties and economic benefits, the 40% WC coating achieves the best balance among wear resistance, structural stability, and cost control and has high engineering application value.

4. Conclusions

This paper used laser cladding technology to prepare cobalt-based alloy/WC composite reinforcement coatings on 42CrMo substrate for cutting pick bits. By using signal-to-noise ratio analysis, the effects of laser power, scanning speed, and powder feeding speed on the microhardness, dilution rate, and aspect ratio of the coating were investigated. Combining Taguchi design and grey relational analysis, multi-objective optimization of process parameters was completed, and the optimal combination is as follows:
(1)
The impact of process parameters on coating performance is related to the ratio: in terms of microhardness, when the WC content is low, the scanning speed is the main influencing factor; as the WC ratio increases, its influence decreases, while the influence of laser power and powder feeding speed increases. In terms of dilution rate, laser power is always the core factor; under high WC content, powder feeding speed has a greater influence than scanning speed. For porosity, at low WC ratios, powder feeding speed is the dominant factor; at high WC ratios, laser power becomes the most significant influencing factor.
(2)
Comparative display shows that as the WC ratio increases, the optimal parameter line energy increases, manifested by an increase in laser power and a decrease in scanning speed, with little change in powder feeding speed.
(3)
The optimal process parameters are cobalt-based alloy paired with 40% WC, laser power of 1900 W, scanning speed of 6 mm/s, and powder feeding rate of 1.8 r/min. Under these parameters, the coating has high microhardness and low dilution rate and porosity, and improves the wear resistance of the cutting pick by 45% compared to the standard cutting pick.
(4)
Future work will include SEM, EDS, and XRD analyses to examine WC particle distribution, interfacial bonding, and phase formation in the cladding layer. These investigations will help clarify the mechanisms behind improved wear resistance and guide further optimization of laser cladding parameters.

Author Contributions

Y.Z.: conceptualization, methodology, data curation, writing the original draft. C.G.: supervision, funding acquisition. S.X.: review and editing, software development, validation. H.Y.: investigation. J.D.: software development, validation. All authors have read and agreed to the published version of the manuscript.

Funding

This study was supported by the Liaoning Provincial Department of Education’s Science and Technology Innovation Team Project (LJ222410147020).

Institutional Review Board Statement

Not applicable.

Informed Consent Statement

Not applicable.

Data Availability Statement

The original contributions presented in this study are included in the article. Further inquiries can be directed to the corresponding author.

Conflicts of Interest

The author declares no conflicts of interest.

References

  1. Lin, B.; Shi, F. Coal price economic growth and electricity consumption in China under the background of energy transition. Energy Policy 2024, 195, 114400. [Google Scholar] [CrossRef]
  2. Che, L.; Sun, W.; Huang, Y.; Chao, Y. Laser cladding technology in the repair of shearer picks. Comput. Model. New Technol. 2014, 18, 563–565. [Google Scholar]
  3. Singh, S.; Goyal, D.K.; Kumar, P.; Bansal, A. Influence of laser cladding parameters on slurry erosion performance of NiCrSiBC+ 50WC claddings. Int. J. Refract. Hard Met. 2022, 105, 105825. [Google Scholar] [CrossRef]
  4. Liu, H.; Qin, X.; Huang, S.; Hu, Z.; Ni, M. Geometry modeling of single track cladding deposited by high power diode laser with rectangular beam spot. Opt. Lasers Eng. 2018, 100, 38–46. [Google Scholar] [CrossRef]
  5. Aghili, S.E.; Shamanian, M. Technology, Investigation of powder fed laser cladding of NiCr-chromium carbides single-tracks on titanium aluminide substrate. Opt. Laser Technol. 2019, 119, 105652. [Google Scholar] [CrossRef]
  6. Alphonsa, J.; Raja, V.; Mukherjee, S. Development of highly hard and corrosion resistant A286 stainless steel through plasma nitrocarburizing process. Surf. Coat. Technol. 2015, 280, 268–276. [Google Scholar] [CrossRef]
  7. Shi, X.; Wen, D.; Wang, S.; Wang, G.; Zhang, M.; Li, J.; Xue, C. Investigation on friction and wear performance of laser cladding Ni-based alloy coating on brake disc. Optik 2021, 242, 167227. [Google Scholar] [CrossRef]
  8. Yuan, L.; Gu, D.; Lin, K.; Dai, D.; Yang, J.; Huang, G.; Xiong, K. Laser-Directed Energy Deposition Additive Manufac turing of Nickel-Titanium Coatings: Deposition Morphology, Microstructures, and Mechanical Properties. Adv. Eng. Mater. 2022, 25, 2200965. [Google Scholar] [CrossRef]
  9. Wang, Z.; Zhang, S. Research progress of laser cladding coating on titanium alloy surface. Coatings 2024, 14, 1495. [Google Scholar] [CrossRef]
  10. Wang, G.; Huang, L.; Liu, Z.; Qin, Z.; He, W.; Liu, F.; Chen, C.; Nie, Y. Process optimization and mechanical properties of oxide dispersion strengthened nickel-based superalloy by selec tive laser melting. Mater. Des. 2020, 188, 108418. [Google Scholar] [CrossRef]
  11. Lin, Y.; Yao, J.; Lei, Y.; Fu, H.; Wang, L. Microstructure and properties of TiB2–TiB reinforced titanium matrix composite coating by laser cladding. Opt. Lasers Eng. 2016, 86, 216–227. [Google Scholar] [CrossRef]
  12. Yang, P.; Lu, N.; Liang, J.; Guo, Y.; Zhang, G.; Song, X.; Zhou, Y.; Sun, X.; Li, J. Hot crack formation mechanism and inhibition of a novel cobalt-based alloy coating during laser cladding. Materials 2024, 17, 3914. [Google Scholar] [CrossRef]
  13. Eshaghian, O.; Seyed, H.H.; Hamidreza, S.J. Effects of Ni-based composite coatings on failure mechanism and wear resistance of cutting picks on coal shearer machine. Eng. Fail. Anal. 2023, 151, 107342. [Google Scholar] [CrossRef]
  14. Yue, H.; Lv, N.; Guo, C.; Zhao, L.; Li, Q.; Zhang, J.; Zhang, Y. Microstructure and mechanical properties of TiC/FeCrSiB coating by laser additive remanufacturing on shearer spiral blade. Surf. Coat. Technol. 2022, 431, 128043. [Google Scholar] [CrossRef]
  15. Akintunde, I.B.; Lindsay, E.E.; Eyitayo, O.O.; Raghupatruni, V.S.P.; Annelize, B.; Sisa, L.P.; Samuel, S.; Tshephang, M. Optimised consolidation and characterisation of TiC-SiC-reinforced AISI-4340 composite coatings for conical pick remanufacture. Int. J. Adv. Manuf. Technol. 2025, 1, 21. [Google Scholar] [CrossRef]
  16. Luo, D.; Liu, C.; Wang, C.; Wang, Y.; Wang, X.; Zhao, J.; Jiang, S. Optimization of multilayer laser cladding process parameters based on NSGA-II-MOPSO algorithm. Opt. Laser Technol. 2024, 176, 111025. [Google Scholar] [CrossRef]
  17. Hu, D.; Liu, Y.; Chen, H.; Wang, M. Microstructure and wear resistance of Ni-based tungsten carbide coating by laser cladding on tunnel boring machine cutter ring. Surf. Coat. Technol. 2020, 404, 126432. [Google Scholar] [CrossRef]
  18. Guo, C.; Chen, J.; Zhou, J.; Zhao, J. Effects of WC–Ni content on microstructure and wear resistance of laser cladding Ni-based alloys coating. Surf. Coat. Technol. 2012, 206, 2064–2071. [Google Scholar] [CrossRef]
  19. Tosun, G. Ni–WC coating on AISI 1010 steel using TIG: Microstructure and microhardness. Arab. Sci. Eng. 2014, 39, 2097–2106. [Google Scholar] [CrossRef]
  20. Bartkowski, D.; Mynarczak, A.; Piasecki, A.; Dudziak, B.; Goscianski, M.; Bartkowska, A. Microstructure, microhardness and corrosion resistance of Stellite-6 coatings reinforced with WC particles using laser cladding. Opt. Laser Technol. 2015, 68, 191–201. [Google Scholar] [CrossRef]
  21. Eghlimi, A.; Shamanian, M.; Raeissi, K. Dilution and ferrite number prediction in pulsed current cladding of super-duplex stainless steel using RSM. J. Mater. Eng. Perform. 2013, 22, 3657–3664. [Google Scholar] [CrossRef]
  22. Madadi, F.; Ashrafizadeh, F.; Shamanian, M. Optimization of pulsed TIG cladding process of stellite alloy on carbon steel using RSM. Alloys Compd. 2012, 510, 71–77. [Google Scholar] [CrossRef]
  23. Moi, S.C.; Bandyopadhyay, A.; Pal, P.K. Parametric optimization of TIG welding process on mechanical properties of 316L stainless steel using RSM. Adv. Mater. Mech. Ind. Eng. 2018, 21, 315–336. [Google Scholar]
  24. Wang, K.; Liu, W.; Hong, Y.; Sohan, H.; Tong, Y.; Hu, Y.; Zhang, M.; Zhang, J.; Zhang, D.; Fu, H.; et al. An overview of technological parameter optimization in the case of laser cladding. Coatings 2023, 13, 496. [Google Scholar] [CrossRef]
  25. Erfanmanesh, M.; Shoja-Razavi, R.; Barekat, M.; Hashemi, S.Y.; Borhani, M.R.; Naderi-Samani, H.; Lanlou, M.; Nourollahi, A. High-temperature wear behavior of HVOF sprayed, laser glazed, and laser cladded Stellite 6 coatings on stainless steel substrate. J. Adhes. Sci. Technol. 2023, 37, 2440–2460. [Google Scholar] [CrossRef]
  26. Wang, H.; Zhang, X.; Cheng, M.; Ren, L.; Li, J. Research on the influence of laser power on the microstructure and performance of Fe-based coating. J. Therm. Spray Technol. 2025, 34, 316–336. [Google Scholar] [CrossRef]
  27. Wei, A.; Tang, Y.; Tong, T. Effect of WC on microstructure and wear resistance of Fe-based coating fabricated by laser cladding. Coatings 2022, 12, 1209. [Google Scholar] [CrossRef]
  28. Wang, S.; Shi, W.; Cheng, C. Effect of process parameters on microstructure and properties of laser cladding Ni60+30% WC coating on Q235 steel. Materials 2023, 16, 7070. [Google Scholar] [CrossRef]
  29. Škamat, J.; Černašėjus, O.; Zhetessova, G. Effect of laser processing parameters on microstructure, hardness and tribology of NiCrCoFeCBSi/WC coatings. Materials 2021, 14, 6034. [Google Scholar] [CrossRef]
  30. Sefene, E.M.; Tsegaw, A.A. Temperature-based optimization of friction stir welding of AA 6061 using GRA synchronous with Taguchi method. Int. J. Adv. Manuf. Technol. 2022, 119, 1479–1490. [Google Scholar] [CrossRef]
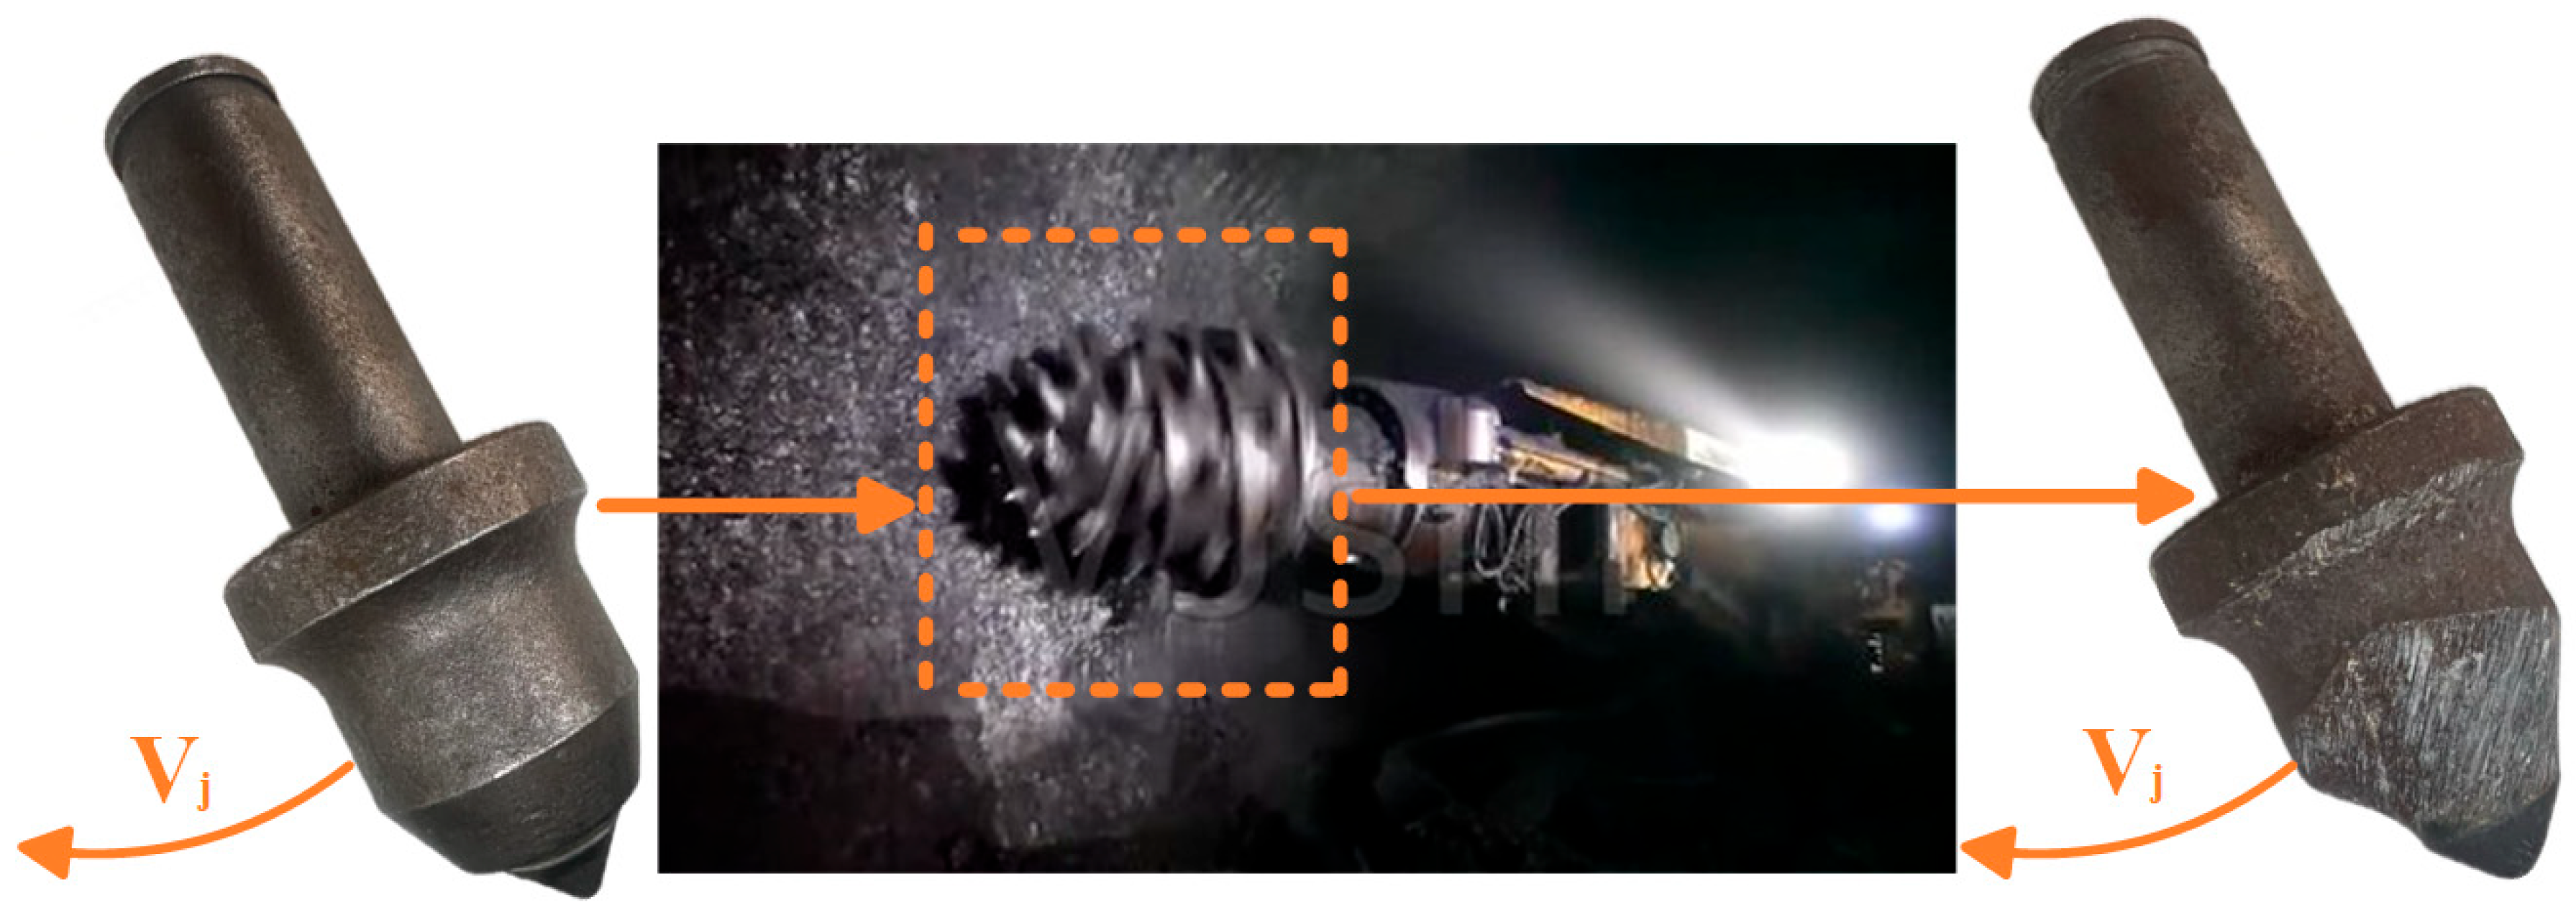
Figure 1. Coal cutter bit working schematic diagram.
Coatings 15 01289 g001
Figure 2. Morphology of the powder: (a) Stellite6 powder; (b) WC powder.
Coatings 15 01289 g002
Figure 3. Schematic diagram of laser cladding system.
Coatings 15 01289 g003
Figure 4. Mean Signal-to-Noise Ratio of Microhardness.
Coatings 15 01289 g004
Figure 5. Mean Signal-to-Noise Ratio Diagram of Dilution Rate.
Coatings 15 01289 g005
Figure 6. Porosity Signal-to-Noise Ratio Mean Value Diagram.
Coatings 15 01289 g006
Figure 7. Calculation results of grey correlation degree for each parameter.
Coatings 15 01289 g007
Figure 8. Comparison diagram of optimal parameters under different WC ratios.
Coatings 15 01289 g008
Figure 9. Cobalt-based WC-reinforced cutting pick and control cutting pick (80% WC–0% WC).
Coatings 15 01289 g009
Figure 10. Graph of friction and wear test data.
Coatings 15 01289 g010
Figure 11. Wear diagrams of cladding layers with different WC contents: (a) Co-0%WC; (b) Co-20%WC; (c) Co-40%WC; (d) Co-60%WC; (e) Co-80%WC.
Coatings 15 01289 g011
Table 1. Chemical composition of 42CrMo steel and Stellite6 alloy powder (wt%).
CSiMnCrMoPSWNiCoFe
42CrMo0.420.250.651.000.200.010.01---Bal.
Stellite61.154.000.5029.001.00--4.003.00Bal.3.00
Table 2. Taguchi Experiment Parameter Table.
NumberLaser Power (W)Powder Feeding Speed (r/min)Scanning Speed (mm/s)
115001.46
217001.66
319001.86
417001.48
519001.68
615001.88
719001.410
815001.610
917001.810
Table 3. Orthogonal experimental results of five groups.
No.MH
(HV)
DRPO
(%)
CSNo.MH
(HV)
DRPO
(%)
CS
A1547.940.130.17Coatings 15 01289 i001B1579.850.152.75Coatings 15 01289 i002
A2519.970.150.12Coatings 15 01289 i003B2597.060.150.79Coatings 15 01289 i004
A3505.570.130.18Coatings 15 01289 i005B3550.410.300.17Coatings 15 01289 i006
A4458.340.190.09Coatings 15 01289 i007B4570.770.130.17Coatings 15 01289 i008
A5468.550.200.17Coatings 15 01289 i009B5559.490.1812.68Coatings 15 01289 i010
A6534.580.120.17Coatings 15 01289 i011B6644.740.110.17Coatings 15 01289 i012
A7524.350.150.17Coatings 15 01289 i013B7566.170.300.87Coatings 15 01289 i014
A8513.030.130.13Coatings 15 01289 i015B8594.860.190.15Coatings 15 01289 i016
A9528.520.230.21Coatings 15 01289 i017B9559.660.173.22Coatings 15 01289 i018
C1693.130.280.52Coatings 15 01289 i019D1760.360.277.99Coatings 15 01289 i020
C2701.530.314.02Coatings 15 01289 i021D2765.460.352.58Coatings 15 01289 i022
C3678.490.420.78Coatings 15 01289 i023D3799.340.411.41Coatings 15 01289 i024
C4615.780.313.63Coatings 15 01289 i025D4630.240.362.58Coatings 15 01289 i026
C5623.160.383.41Coatings 15 01289 i027D5623.430.420.79Coatings 15 01289 i028
C6713.650.200.21Coatings 15 01289 i029D6673.630.244.52Coatings 15 01289 i030
C7512.540.331.00Coatings 15 01289 i031D7537.740.431.00Coatings 15 01289 i032
C8593.460.232.58Coatings 15 01289 i033D8651.650.300.89Coatings 15 01289 i034
C9513.780.350.51Coatings 15 01289 i035D9696.780.261.00Coatings 15 01289 i036
E11044.600.3927.15Coatings 15 01289 i037E6985.820.291.00Coatings 15 01289 i038
E21087.710.3813.95Coatings 15 01289 i039E7722.260.410.99Coatings 15 01289 i040
E31077.340.263.16Coatings 15 01289 i041E8743.880.260.76Coatings 15 01289 i042
E4867.860.291.55Coatings 15 01289 i043E9747.940.361.26Coatings 15 01289 i044
E5992.040.382.61Coatings 15 01289 i045 Coatings 15 01289 i046
Table 4. Signal-to-noise ratio conversion results.
No.MH
(HV)
DRPO
(%)
No.MH
(HV)
DRPO
(%)
No.MH
(HV)
DRPO
(%)
A154.7717.7215.39B155.2716.48−8.79C156.8211.065.68
A254.3216.4818.42B255.5216.482.05C256.9210.17−12.08
A354.0817.7214.89B354.8110.4615.39C356.637.54−23.32
A453.2214.4220.92B455.1317.7215.39C455.7910.17−11.20
A553.4213.9815.39B554.9614.89−22.06C555.898.407.74
A654.5618.4215.39B656.1919.1715.39C657.0713.9813.56
A754.3916.4815.39B755.0610.46−2.21C754.199.630.00
A854.2017.7217.72B855.4914.4216.48C855.4712.77−8.23
A954.4612.7713.56B954.9615.39−10.16C954.229.125.85
D157.6211.37−18.05E160.6511.70−9.99
D257.689.12−8.23E260.738.40−22.89
D358.057.740.00E360.388.18−28.68
D455.998.87−8.23E458.7710.75−3.81
D555.907.542.05E559.938.40−8.33
D656.5712.40−13.10E659.8810.750.00
D754.617.330.00E757.177.740.09
D856.2810.461.01E857.4311.702.38
D956.8611.700.00E954.778.872.38
Table 5. Normalized Signal-to-Noise Ratio Results for Each Indicator.
No.MH
(HV)
DRPO
(%)
No.MH
(HV)
DRPO
(%)
No.MH
(HV)
DRPO
(%)
A10.210.120.11B10.270.230.6C10.480.690.31
A20.150.230.05B20.310.230.38C20.490.760.67
A30.110.120.12B30.210.740.11C30.450.980.89
A400.40B40.250.120.11C40.340.760.65
A50.030.440.11B50.230.360.87C50.360.910.27
A60.180.060.11B60.3900.11C60.510.440.15
A70.160.230.11B70.240.740.47C70.130.810.42
A80.130.120.06B80.30.40.09C80.30.540.59
A90.160.540.15B90.230.320.63C90.130.850.3
D10.590.660.79E10.990.630.62
D20.590.850.59E210.910.88
D30.640.970.42E30.950.931
D40.370.870.59E40.740.710.5
D50.360.980.38E50.890.910.59
D60.450.570.69E60.890.710.42
D70.1810.42E70.530.970.42
D80.410.740.4E80.560.630.37
D90.480.630.42E90.210.870.37
Table 6. Verification experiment table of each optimal parameter cladding layer.
No.MH (HV)Error RangeDRError RangePO (%)Error RangeCS
A9526.140.4%0.228.4%0.199.5%Coatings 15 01289 i047
B7580.892.5%0.293.3%0.912.2%Coatings 15 01289 i048
C3694.312.4%0.420%0.859.0%Coatings 15 01289 i049
D3792.600.9%0.402.4%1.289.2%Coatings 15 01289 i050
E31058.231.8%0.273.8%2.947.0%Coatings 15 01289 i051
Disclaimer/Publisher’s Note: The statements, opinions and data contained in all publications are solely those of the individual author(s) and contributor(s) and not of MDPI and/or the editor(s). MDPI and/or the editor(s) disclaim responsibility for any injury to people or property resulting from any ideas, methods, instructions or products referred to in the content.