Abstract
To enhance the efficient utilization of industrial solid waste and support the low-carbon transition of cementitious materials, this study used steel slag, coal-fired slag, and desulfurization gypsum as the primary raw materials. A high-performance composite cementitious material system was developed based on the synergistic effects of physical activation (mechanical grinding) and chemical activation (alkali stimulation). This study systematically investigates the raw material characteristics, mix proportion optimization, mechanical behavior, and durability of composite cementitious materials through the integration of response surface optimization design and multi-scale analysis methods. The results indicate that the optimal mix proportions of the composite cementitious material are: 37.2% steel slag, 33.2% coal-fired slag, 9.6% desulfurized gypsum, 20% cement, 4% sodium silicate, and 0.1% superplasticizer. At this mix proportion, the measured 28-day average compressive strength of the composite cementitious material was 40.8 MPa, which closely matched the predicted value of 41.2 MPa from the response surface regression model, thereby confirming the model’s accuracy and applicability. The composite cementitious material demonstrated superior volume stability compared to ordinary cement under both water-curing and drying conditions. However, its freeze–thaw resistance and carbonation resistance were lower than those of cement. Therefore, considering these factors comprehensively, the composite cementitious material is recommended for application in road base and subbase layers.
1. Introduction
In recent years, the rapid expansion of industrial production and urban development in China has generated approximately 10 billion tons of solid waste annually, with the cumulative historical stock reaching an estimated 60 to 70 billion tons [1,2,3]. These wastes arise from diverse sources, including coal-fired slag, steel slag, blast furnace slag, construction debris, shield tunneling muck, engineering slurry, alkali slag, and red mud, as shown in Figure 1. At present, the majority of solid waste in China is still managed primarily through traditional landfilling and dumping [4]. Owing to the high volume of solid waste production and the limited efficiency of comprehensive resource utilization, the environmental problems arising from solid waste accumulation encompass multiple aspects: 1. Solid waste accumulation occupies large areas of land and contributes to the inefficient utilization of land resources; 2. Solid waste can accumulate certain heavy metals, which may transform from insoluble hydroxides into soluble carbonates or even hydrated carbonates under the influence of acidic soils, acid rain, and other environmental factors, thereby causing severe pollution of soil and water bodies; 3. Solid waste stored outdoors can release substantial amounts of dust (PM10 and PM2.5) under the influence of wind, leading to severe air pollution and posing risks to the respiratory health of nearby residents. Therefore, addressing the issues of land occupation and environmental pollution caused by solid waste, as well as enhancing the efficient and comprehensive utilization of solid waste resources to achieve the goal of “turning waste into treasure,” has become an urgent technical challenge in China’s ongoing development and construction. This issue also poses a challenge in the pursuit of constructing an environmentally friendly and resource-efficient society.
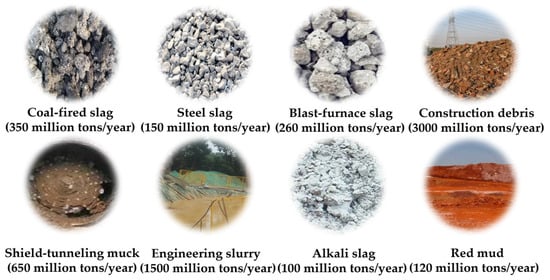
Figure 1.
Some solid wastes in China.
Cement, the most widely used inorganic cementitious material, consumes significant energy during its production process of “two grindings and one burning.” According to calculations, the production of one ton of cement consumes approximately 115 kg of standard coal and 1.2 tons of limestone, while emitting about 0.73 tons of CO2 [5,6]. CO2 emissions from cement production account for approximately 7% of total anthropogenic CO2 emissions [7,8]. Based on the above calculations of cement energy consumption, it can be concluded that cement production is not only highly energy-intensive but also a major source of pollution, posing serious threats to the ecological environment. Therefore, it is imperative to develop green and low-carbon cementitious materials to reduce the environmental impact of cement production.
Coal-fired slag (CFS) primarily refers to the bottom ash produced from coal combustion in thermal power plants, as well as in industrial, residential, and other types of boilers [9]. The primary components of CFS are silicon dioxide, aluminum oxide, iron oxide, calcium oxide, and magnesium oxide, with trace amounts of heavy metals and other impurities [10,11]. Owing to its low calcium content, CFS exhibits limited hydration activity and is often combined with other calcium-rich solid wastes to produce cementitious materials [12,13]. Studies have shown that CFS enhances the stability of cementitious materials and promotes their long-term strength development [9,10]. Desulfurized gypsum (DG) is an industrial solid waste generated from the reaction of sulfur dioxide gas with lime slurry under strong oxidation conditions during wet flue gas desulfurization [14,15]. It is one of the three principal solid waste products from coal-fired power plants, together with CFS and fly ash. The primary component of DG is CaSO4·2H2O (≥90%), accompanied by small amounts of carbonates, soluble salts, and inert minerals [16]. By mixing DG with other solid waste materials in appropriate proportions and activating the mixture with an activator, composite solid waste cementitious materials can be produced, exhibiting excellent properties such as high strength and strong water resistance [17,18]. Steel slag (SS) is an industrial by-product generated during the steelmaking process in steel plants (approximately 1600 °C), formed through the oxidation and removal of impurities such as carbon, silicon, sulfur, phosphorus, and manganese from molten steel [19]. Both SS and cement are formed through high-temperature calcination, share similar mineral compositions [20], and contain high levels of calcium, thus often referred to as “low-grade cement.” However, the low stability of SS results in limited utilization efficiency.
Traditional cement-based materials, characterized by high energy consumption and carbon emissions, are inadequate to meet the requirements of the current “dual carbon” strategy and green development goals [21]. At the same time, the large-scale accumulation of industrial solid waste has led to issues such as resource wastage and environmental pollution. To promote the efficient utilization of industrial solid waste and the low-carbon transformation of cementitious materials, this study employs CFS, DG, and SS as the primary raw materials and develops a high-performance composite cementitious material system through the synergistic effects of physical activation and chemical excitation. By integrating response surface optimization design with multi-scale analysis methods, this study systematically investigates the raw material properties, mix proportion optimization, mechanical performance, and durability of composite cementitious materials, thereby providing theoretical support and an engineering basis for the development of low-carbon, sustainable cementitious materials.
2. Methods and Materials
2.1. Test Methods
2.1.1. X-Ray Fluorescence (XRF)
The composition of the sample was tested using an X-ray fluorescence spectrometer (model EDX-2800B, Shipu, Suzhou, China). The sample needs to be ground to below 200 mesh before detection, using a Cu target with a testing range of F~U and a measurement time of 8 min. Finally, the different element contents of the sample were obtained.
2.1.2. X-Ray Diffraction (XRD)
The phase composition of the sample was analyzed using an X-ray diffractometer (model D8-QUEST, Brook, Beijing, China). The sample needs to be ground to below 200 mesh before detection. A Cu target was used, and the tube current and voltage were 30 mA and 40 kV, respectively. The sample was prepared by pressing method, with a scanning range of 5~80°, a scanning speed of 2°/min, and a step size of 0.02°. The XRD patterns of each sample were compared by phase retrieval using JADE9.0 software, and the comparison standard card used was the PDF-4+2009 standard card in the ICDD database.
2.1.3. Scanning Electron Microscope (SEM)
The microstructures of the samples were examined using an SEM (model EVO, Zeiss, Oberkochen, Germany) with an accelerating voltage ranging from 0.3 kV to 30 kV and a working distance of 10 mm. To improve conductivity, minimize charge accumulation, and enhance the imaging quality, all test samples were coated with gold prior to analysis.
2.1.4. Compressive Strength
According to “Test method of cement mortar strength (ISO method)” (GB/T 17671-2021) [22], 40 × 40 × 160 mm mortar specimens were prepared. A total of 450 ± 2 g of cementitious material and 1350 ± 5 g of ISO (International Organization for Standardization) standard sand were placed in a mortar mixer (model JJ-5, Xinhengyue, Shijiazhuang, China), followed by the addition of 225 ± 1 g of water (water-to-cement ratio, w/c = 0.5). The mixture was thoroughly mixed, molded, and compacted. After molding, the mortar specimens, together with their molds, were cured in a chamber maintained at 20 ± 1 °C and 95% relative humidity for 24 h. The specimens were then demolded and continuously cured under the same conditions for 28 days. Upon reaching the designated curing age, compressive strength tests were performed. The compressive strength was calculated using Equation (1), with a loading area of 1600 mm2.
Rc = Fc/A
Rc denotes the compressive strength, measured in megapascals (MPa); Fc represents the maximum load at failure, measured in newtons (N); and A denotes the loading area, measured in square millimeters (mm2).
2.1.5. Durability
Following “Test method for determining expansive ratio of expansive cement” (JC/T 313-2009) and “Standard for test methods of long-term performance and durability of ordinary concrete” (GB/T 50082-2009) [23], a series of tests were conducted to evaluate the volume stability, freeze–thaw resistance, and carbonation resistance of the composite cementitious material, using ordinary Portland cement as the control group.
2.2. Raw Materials
2.2.1. Steel Slag
The SS sample was collected from Chongqing Iron and Steel Co., Ltd (Chongqing, China). After discharge from the converter, the SS undergoes rapid cooling with high-pressure water. Although the majority of surface free water is mechanically removed through centrifugal rotation of the drum and high-frequency vibration of the vibrating screen, the bound water content within the SS remains relatively high, resulting in a moisture content typically ranging from 8% to 12%. Given the significant impact of moisture content on the hydration activity and subsequent gelling performance of SS, the SS sample was dried at 105 °C to a constant weight, then sealed and stored for future use. After drying, the SS exhibits a grayish-black appearance, characterized by a uniform color and a fine, consistent particle size distribution, as shown in Figure 2.
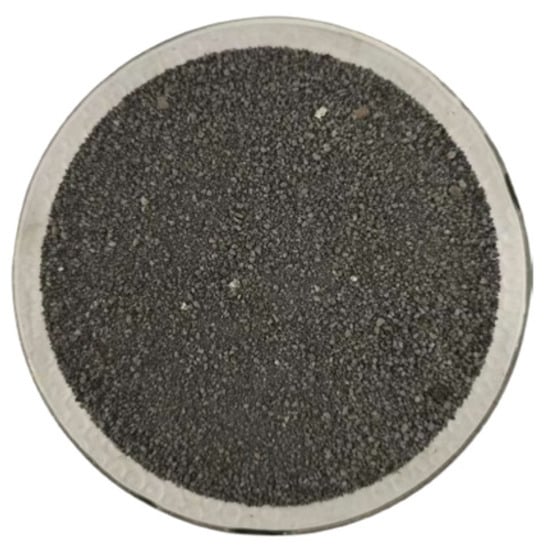
Figure 2.
Steel slag.
This study systematically analyzed the chemical composition of the collected SS samples using XRF, with the test results provided in Table 1. The data indicate that CaO, the most critical active component in SS, accounts for up to 42.05%, with a CaO/SiO2 mass ratio (alkalinity ratio) as high as 3.58. The high alkalinity ratio dictates that the cementitious minerals in SS are primarily highly active tricalcium silicate (C3S), which exhibits stronger early hydration activity and cementitious properties compared to low-calcium materials. Additionally, the Al2O3 content is 6.69%, which facilitates the formation of an amorphous glass phase in SS. The presence of a glass phase provides a solid physical foundation for the ball milling refinement and activation treatment of SS, thereby enhancing its reactivity and gelling performance. The MgO content is 5.63%, with free magnesium oxide (f-MgO) in SS accounting for approximately 4.29%, which is below the specified critical value of 5%. The magnetic separation process effectively removes a significant amount of magnetic metal particles, reducing the Fe2O3 content in SS to 5.56% and subsequently lowering the proportion of the inert RO phase (solid solution rich in FeO and MgO). The reduction in the RO phase enhances the hydration activity of SS, as the RO phase typically consists of a dense mineral structure with low reactivity. A decrease in its content results in greater exposure of active components to the hydration environment, thereby improving overall reaction efficiency. The MnO content is 2.14%, primarily existing as a solid solution within the RO phase (FeO-MnO). The P2O5 content is 2.01%, and it is speculated that it primarily exists as Nagasmectite (7CaO·P2O5·2SiO2), which exerts a regulatory effect on the cementitious properties and hydration behavior of SS. The total content of heavy metals, including zinc (Zn), chromium (Cr), and copper (Cu), is approximately 0.09%, well below the relevant environmental safety threshold. This suggests that SS exhibits good environmental adaptability and safety. Other minor components, including TiO2, K2O, and SrO, account for approximately 1.30%. These components have relatively low concentrations and do not significantly affect the hydration activity and gelling properties of SS.

Table 1.
XRF test results of SS.
This study systematically analyzed the phase composition of SS using XRD, and the resulting diffraction pattern is presented in Figure 3. The results indicated that the primary cementitious mineral phases in SS were calcium disilicate (C2S) and calcium trisilicate (C3S), which, through their synergistic interaction, enhanced the material’s hydraulic properties during hydration, thereby promoting the development of both early and late strength. Additionally, characteristic diffraction peaks of pyrite (Fe3O4) and calcium iron aluminum oxide (C4AF) are observed in the spectrum, corresponding to the approximately 5.56% Fe2O3 content detected in XRF analysis. The diffraction peaks of magnesia (MgO) and quicklime (CaO) indicate the presence of free magnesium oxide and calcium oxide in the sample. Notably, a distinct dispersion-broadening peak is observed in the XRD pattern baseline of SS, a typical characteristic of the amorphous glass phase. It is speculated that the amorphous phase primarily consists of the CaO-Al2O3-SiO2 system, consistent with the chemical composition revealed by the XRF analysis. The presence of an amorphous glass phase imparts high chemical activity and reactive potential to SS, facilitating the release of active ions in alkaline excitation or hydration environments, thereby promoting the formation of hydration products.
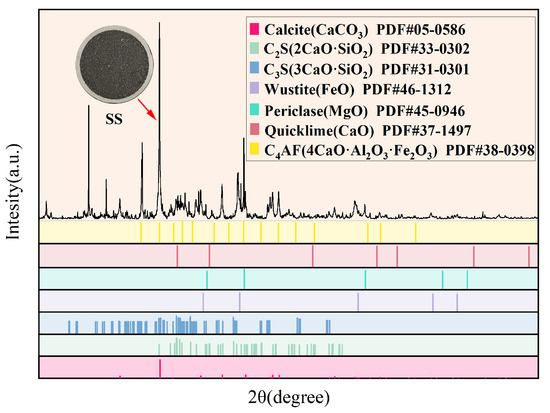
Figure 3.
XRD test results of SS.
2.2.2. Coal-Fired Slag
The CFS samples were collected from Tianjin Beijiang Power Plant (Tianjin, China), and the entire production process did not include specialized dehydration treatment, resulting in a high moisture content typically ranging between 15% and 20%. To prevent adverse effects on its hydration activity, the CFS sample was dried at 105 °C to a constant weight, then sealed and stored for future use. After drying, the CFS appeared predominantly gray-brown, with a small proportion of red-brown or gray-white particles intermixed. The overall appearance of CFS exhibits a pronounced glassy luster, while its cross-section predominantly displays a typical conchoidal fracture, indicative of the structural characteristics of its amorphous glass phase, as shown in Figure 4.
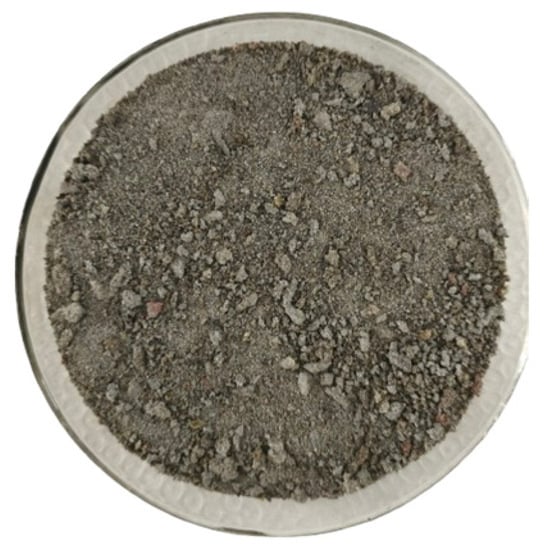
Figure 4.
Coal-fired slag.
This study performed an elemental composition analysis of the selected CFS samples using XRF, with the results for the main chemical compositions and their respective contents detailed in Table 2. The results indicate that CFS primarily consists of oxides, including silicon, aluminum, calcium, and magnesium, with the total content of glass-forming oxides (mainly SiO2, Al2O3, CaO, and MgO) approximately 85%, exhibiting distinct amorphous structural characteristics. Among these components, SiO2 accounts for 45.78% and Al2O3 for 34.28%, together representing nearly 80% of the total CFS mass, which indicates that the material possesses typical high-silicon–aluminum characteristics. The silicon–aluminum component plays a decisive role in determining the reactivity and the structure of gel products during hydration. A high Si/Al ratio generally promotes the formation of aluminosilicate reaction products with a compact structure and high stability (e.g., N-A-S-H or C-(A)-S-H gels), thereby conferring excellent pozzolanic activity to the material. However, the CaO content in CFS is only 5.97%, significantly lower than that in high-calcium solid wastes (e.g., blast furnace slag and SS). This low CaO content limits the formation of large amounts of C-S-H gel during hydration, thereby partially inhibiting its reactivity. The Fe2O3 and TiO2 contents in CFS are 9.66% and 1.46%, respectively. These metal oxides not only impart a gray-brown to reddish-brown appearance to CFS but also influence its hydration behavior and the formation of its final microstructure to some extent. The total content of trace heavy metals, including manganese (Mn), zirconium (Zr), and copper (Cu), is approximately 0.19%, with the concentration of each element remaining below environmental safety thresholds, suggesting that CFS holds strong potential for sustainable utilization.
Table 2.
XRF test results of CFS.
This study employed XRD to analyze the phase composition of CFS samples, and the resulting diffraction pattern is presented in Figure 5. The analysis indicates that the primary crystalline mineral phases in CFS are mullite (3Al2O3·2SiO2), quartz (SiO2), hematite (Fe2O3), and plagioclase (CaAl2Si2O8). These minerals exhibit distinct diffraction peaks, indicating their presence in a stable crystalline form within CFS and suggesting that certain high-temperature mineral components did not fully vitrify during cooling. At the same time, the XRD pattern of CFS exhibits a pronounced baseline hump, particularly in the 20~35° (2θ) range, indicating the presence of a distinct amorphous dispersion band. This phenomenon is a typical diffraction feature of amorphous or glassy minerals. The presence of this amorphous peak indicates that CFS contains a substantial glassy phase formed by the rapid cooling of the high-temperature molten state. These amorphous phase minerals mainly originate from coal-derived components (e.g., silicates and aluminates) that do not undergo crystalline restructuring during water quenching but instead transform directly into a randomly arranged structure. Based on the combined analysis of XRF and XRD, it can be inferred that CFS is characterized by a structure in which the glassy phase is the primary component and the crystalline phase is secondary.
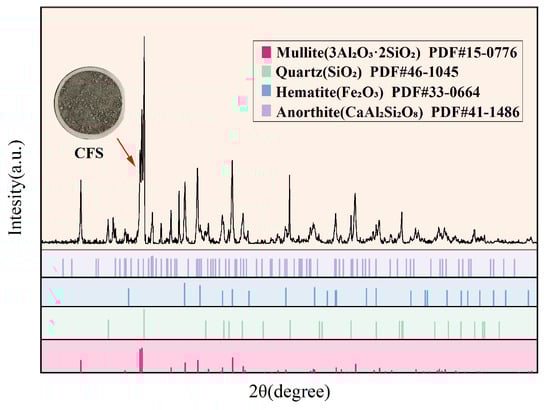
Figure 5.
XRD test results of CFS.
2.2.3. Desulfurization Gypsum
The DG sample was also collected from the Tianjin Beijiang Power Plant. Both DG and CFS are industrial solid wastes produced during coal-fired power generation. Due to the bound water in its crystal structure and its large surface area, DG exhibits strong hygroscopicity and a tendency to agglomerate. When exposed to atmospheric moisture for an extended period, DG is prone to physical agglomeration and even hydration reactions, which lead to the degradation of its particle structure, reduced fluidity, and diminished reactivity, thereby seriously compromising its hydration behavior and experimental repeatability. Therefore, in this study, all DG samples were immediately subjected to low-temperature drying after collection and then stored in sealed containers once cooled to room temperature in a drying oven. After drying, DG appears predominantly gray-white, occasionally displaying light yellow streaks or fine black specks. Its morphology is characterized by a uniform, fine powdery aggregate, as shown in Figure 6.
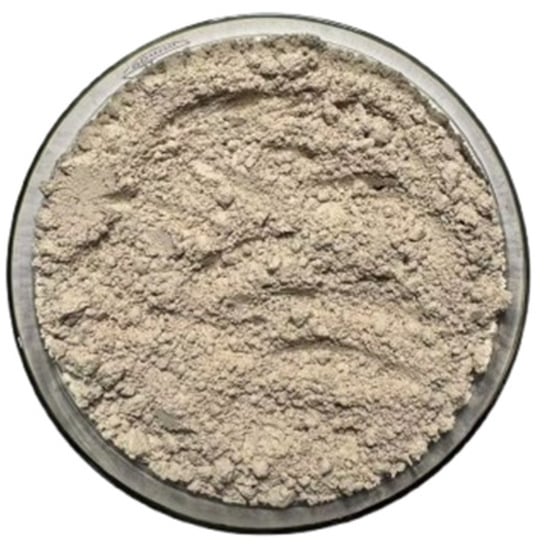
Figure 6.
Desulfurization gypsum.
This study quantitatively analyzed the chemical composition of the selected DG samples using XRF, and the main oxide contents are presented in Table 3. The results show that the molar ratio of CaO (32.32%) to SO3 (19.96%) in DG is close to the ideal 1:1 ratio (theoretical value: 1.62). It can be inferred that the purity of dihydrate gypsum in the sample reached approximately 93.5%, indicating the high efficiency of the desulfurization reaction and subsequent crystallization process. DG exhibits high crystallinity and can function as a stable cementitious material for composition regulation. In terms of impurity composition, the Fe2O3 content is 0.32%, which is the primary cause of the light yellow streaks in DG. However, the Fe2O3 concentration is significantly below the safety limit set by the building materials industry (typically < 0.5%), and its effect on DG whiteness is manageable, without causing significant disruption to the aesthetics or stability of subsequent cementitious systems. At the same time, the total content of SiO2 and Al2O3 is only 0.39%, indicating that the DG sample contains minimal clay impurities. This contributes to its good particle dispersion and low adhesion, thereby ensuring looseness and fluidity during preparation and transportation. In terms of heavy metal content, the total concentration of harmful elements such as lead (Pb), zinc (Zn), copper (Cu), and selenium (Se) is approximately 0.12%, and the concentration of each element does not exceed the national limits for hazardous substances in building materials. From the perspective of environmental protection and safety, DG exhibits good environmental compatibility and sustainable application potential. In addition, the total amount of other minor impurity components, such as K2O, Na2O, MgO, TiO2, and SrO, is less than 0.5%, which will not significantly affect the setting time, hydration reaction, or stability of DG.
Table 3.
XRF test results of DG.
This study analyzed the phase composition of the selected DG samples using XRD, and the corresponding diffraction pattern is presented in Figure 7. The results indicate that the main phase of desulfurization gypsum is dihydrate gypsum (CaSO4·2H2O), characterized by sharp and intense diffraction peaks, reflecting its high crystallinity and structural stability. In addition to dihydrate gypsum, XRD detected minor diffraction peaks of quartz (SiO2) and hematite (Fe2O3) in DG, which are presumed to originate from the incomplete reaction of silicate impurities in limestone and from iron oxidation products generated during the flue gas desulfurization process. At the same time, the baseline of the XRD pattern is relatively flat, with no obvious diffuse broad peaks, and the signals of amorphous phases are extremely weak, indicating that the amorphous content in the sample is very low. This observation is consistent with the XRF results showing SiO2 + Al2O3 + Fe2O3 < 1%, further confirming that the DG sample possesses high purity and good crystalline integrity.
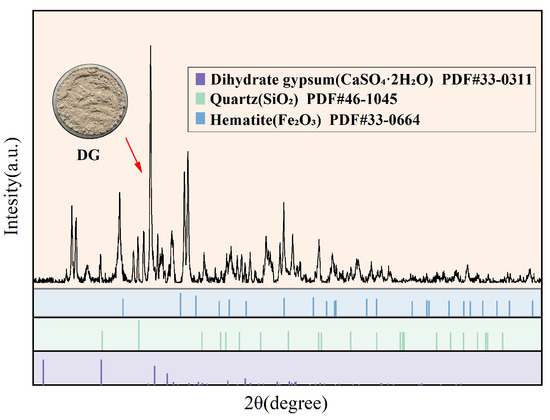
Figure 7.
XRD test results of DG.
2.2.4. Cement
The cement used was Conch-brand ordinary Portland cement (PO 42.5), produced by Anhui Conch Cement Co., Ltd (Hefei, China). The cement sample exhibits a uniform, fine appearance, presenting as a gray powder with consistent texture and no visible agglomerates, as shown in Figure 8. According to “Common Portland Cement” (GB/T 175-2023) [24], the main physical and chemical performance indicators of the cement sample were systematically tested and evaluated. The technical indicators are presented in Table 4, which shows that all values meet the requirements of the PO 42.5 cement specifications.
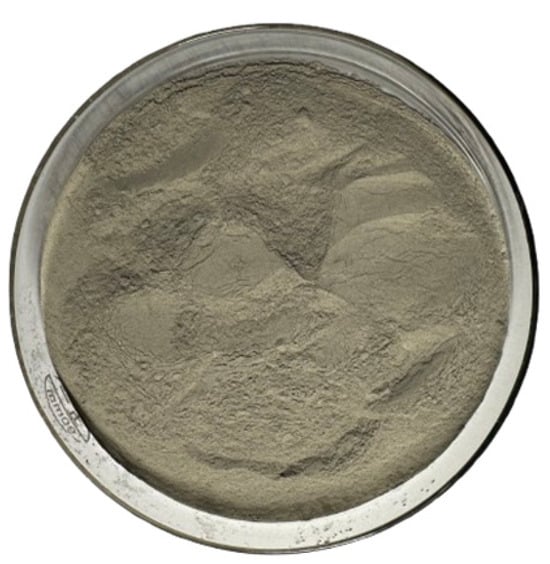
Figure 8.
Cement.
Table 4.
The results of cement related performance testing.
2.2.5. Chemical Reagent
With the exception of SS, CFS, DG, and cement, the chemical reagents and auxiliary materials used in this study are listed in Table 5. Sodium silicate (Na2SiO3) was employed as an alkali activator in the SS–CFS–DG composite cementitious system to enhance the activation and hydration of solid waste components. Sodium hydroxide (NaOH) was employed to modify the modulus of the sodium silicate solution (SiO2/Na2O ratio) to optimize the alkalinity and reactivity of the activator, thereby enhancing the performance of the cementitious material. To enhance the workability of the composite cementitious material and to prevent the loss of flowability during mixing caused by the high water absorption of CFS, a polymer-based superplasticizer was incorporated in this study. The superplasticizer enhances the flowability of the cementitious mixture and ensures adequate workability of the material during construction. ISO standard sand was employed in the preparation of mortar specimens to ensure consistency and comparability while minimizing the influence of aggregate property variations on mechanical performance.
Table 5.
Chemical reagents and auxiliary materials used in the research institute.
2.3. Mix Design of Composite Cementitious Materials
SS and CFS were ground in a planetary ball mill (model YXQM-16L, Mitr, Changsha, China) to enhance their latent hydraulic reactivity through physical activation. After ball milling, the particle size distribution of SS and CFS was determined using a laser particle size analyzer (model Bettersize2600, Better, Shenyang, China), and the median particle size (D50) was used as the evaluation index of the refinement effect. Based on literature reports and preliminary experimental results, the reactivity of both steel slag and coal-fired slag was effectively activated when D50 reached 15 μm. Accordingly, in this study, both materials were refined to a D50 of approximately 15 μm. In the optimized mix design of this study, the cement content was maintained at 20%, while SS, CFS, and DG together constituted the remaining 80%. The alkali activator was a sodium silicate solution (modulus: 1.2) with a dosage equivalent to 4% Na2O by mass. A superplasticizer at a dosage of 0.1% was added to enhance the workability of the cementitious material, thereby ensuring consistency in specimen preparation and adaptability during construction. The experimental procedure is illustrated in Figure 9.
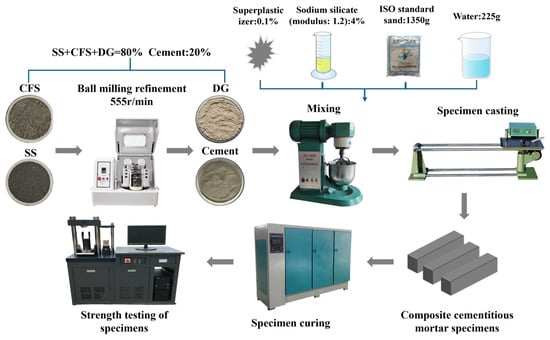
Figure 9.
Preparation process of composite cementitious materials.
The Mixture module in Design-Expert 13 software was applied for optimal experimental design [25,26], with SS content (A), CFS content (B), and DG content (C) set as control variables, and the 28-day compressive strength of mortar specimens (Y) specified as the response variable. A regression model was developed to investigate the relationship between the mix proportions of solid waste materials and their mechanical properties. This model was further used to analyze the effects of mix ratios on the mechanical performance of composite cementitious materials and to determine the optimal mix proportion for the SS–CFS–DG system. Table 6 presents the optimized mix design scheme, and Table 7 provides the corresponding actual quantities.
Table 6.
Optimized mix design of composite cementitious materials.
Table 7.
Actual mix proportions of composite cementitious materials.
3. Results and Discussion
3.1. Development and Analysis of the Regression Model
The experimental results for the actual mix proportions of the composite cementitious material are presented in Table 8. The corresponding data from Table 8 were input into Design-Expert software, which processed and analyzed the experimental data using the least squares method. The regression analysis produced the response surface equation, as shown in Equation (2).
Y = 39.39A + 35.8B + 21C + 6.36AB + 37.56AC + 37.92BC
Table 8.
Experimental results of the actual mix proportions of the composite cementitious materials.
An analysis of variance (ANOVA) was conducted to examine the sources of error in the regression model and to evaluate its overall significance. The results are presented in Table 9. As shown in the table, the overall F-value of the constructed response surface regression model was 8.48, and the corresponding p-value was 0.0175, which is well below the significance level (p < 0.05). These results indicate that the model is highly statistically significant, with only a 1.75% probability that the observed effects are due to random noise. This indicates that the model demonstrates a strong fitting ability for the response values within the range of the experimental data and effectively captures the regular variation in the dependent variables with respect to the independent variables. Meanwhile, the model’s lack of fit F-value was 0.2626, and the corresponding p-value was 0.8498, which is considerably higher than 0.1. This suggests that the lack of fit term is not statistically significant, indicating that the deviation from pure error can be attributed to random variation rather than model underfitting. In summary, the regression equation developed in this study demonstrated strong statistical significance, and its lack-of-fit term was insignificant. These results indicate that the model exhibits high fitting accuracy and reliability within the current design space and can be effectively used for subsequent response prediction and parameter optimization.
Table 9.
ANOVA table of the model.
The error analysis results of the fitted model are shown in Table 10. A correlation coefficient (R2) closer to 1 indicates a stronger correlation and higher model reliability. When the adjusted R2 is ≥0.85, the fitted equation can be regarded as effectively representing the relationship between factors and variables. To ensure experimental precision, the coefficient of variation (C.V.) should be less than 10%, and the signal-to-noise ratio should exceed 4. As shown in Table 10, the R2, adjusted R2, and predicted R2 are 0.9521, 0.9042, and 0.8153, respectively. The C.V. is 1.89%, and the signal-to-noise ratio is 11.5515, indicating that the regression model possesses high accuracy and strong reliability. By integrating the analysis of variance results in Table 9 with the error analysis in Table 10, it can be concluded that the response surface regression model demonstrates strong statistical significance, excellent fitting performance, and robust predictive capability within the current range of factor levels. Therefore, this model can serve as a theoretical foundation and analytical tool for optimizing the mix design of composite cementitious materials, providing reliable support for subsequent strength regulation, parameter optimization, and performance prediction.
Table 10.
Error analysis table.
By generating three-dimensional response surface plots and two-dimensional contour maps, the effects of various factors on the 28-day compressive strength of the composite cementitious material, as well as their interactions, can be visually illustrated. As shown in Figure 10, the interaction effects among the different components on the 28-day compressive strength exhibit the following trend: In the region with low SS content, the compressive strength decreases slightly as the CFS content increases (and the DG content decreases), but the overall increasing trend is not pronounced. This indicates that the interaction between CFS and DG has a relatively weak effect on strength in this region, mainly because CFS possesses low hydration activity and the calcium ion concentration in the system is limited. Therefore, although the CFS dosage increases, the improvement in specimen strength remains negligible. In the region with high SS content, the compressive strength of the specimens increases markedly with increasing CFS content, and the response surface displays a steep slope. This suggests that as the CFS content rises, the specimen strength progressively improves. This behavior is primarily attributed to the high SS dosage, which supplies sufficient calcium ions to promote the reaction between the sulfate ions in DG and the active silica and alumina in CFS, leading to the formation of ettringite. The formation of ettringite activates the cementitious properties of CFS, thereby effectively enhancing the specimen strength. In the region with low DG content, as the SS content decreases (and the CFS content increases), the response surface exhibits slight fluctuations, but the overall trend in specimen strength is downward. This suggests that the reduction in high-calcium SS content is the primary reason the cementitious activity of CFS cannot be effectively activated. In the region with high DG content, the response surface displays an arch-shaped pattern, with specimen strength initially increasing and then decreasing as SS content rises. This behavior is primarily attributed to the excess sulfate ions supplied by high DG content, which, under conditions of elevated SS content, promote the formation of excessive ettringite, thereby reducing the specimen strength. Across the full range of CFS content, the response surface exhibits minor fluctuations in some regions but shows an overall downward trend. In summary, SS plays a dominant role in the activity of the composite cementitious system, while SS and CFS demonstrate a strong synergistic contribution to strength development. However, the dosage of DG should be carefully controlled to avoid excessive use.
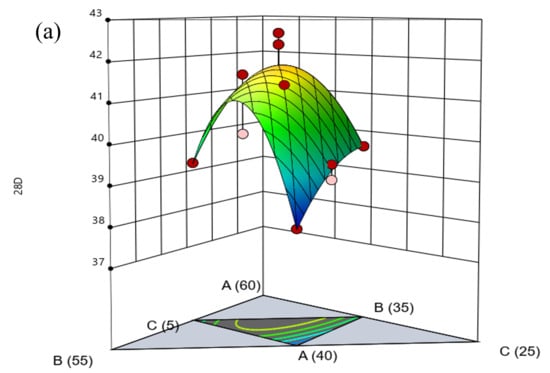
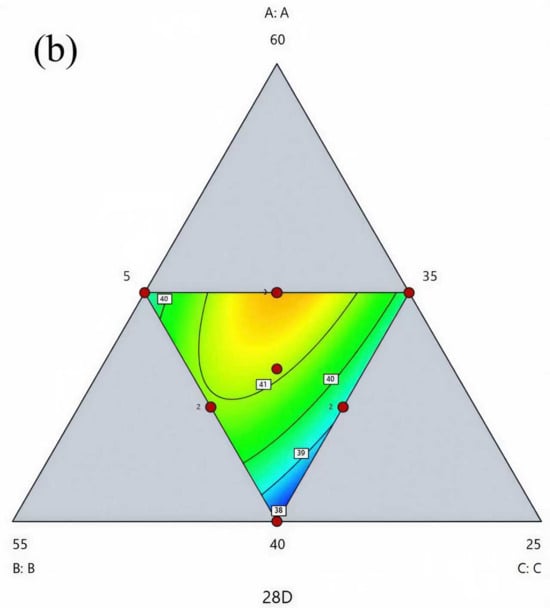
Figure 10.
Response surface plots and contour maps of the effects of various factors on the evaluation indices: (a) response surface plot and (b) contour map.
Using Design-Expert software and regression equation predictions, the optimal mix proportion of the composite cementitious material was determined as 46.5% SS, 41.5% CFS, and 12% DG. When converted to the practical mix proportion, this corresponds to 37.2% SS, 33.2% CFS, 9.6% DG, 20% cement, 4% sodium silicate, and 0.1% superplasticizer. At this mix proportion, the predicted 28-day compressive strength reaches 41.2 MPa, indicating that the composite cementitious material possesses excellent mechanical properties.
To further validate the predictive accuracy and applicability of the regression model, composite cementitious mortar specimens were prepared according to the optimal mix proportion obtained from the optimization design (37.2% SS, 33.2% CFS, 9.6% DG, 20% cement, 4% sodium silicate, and 0.1% superplasticizer). After 28 days of curing in accordance with standard procedures, compressive strength tests were conducted. To minimize the influence of random errors on the results, three parallel tests were carried out. The test results are presented in Table 11. The compressive strengths of the three specimens were 40.3 MPa, 39.6 MPa, and 42.6 MPa, yielding an average value of 40.8 MPa. The measured strength of the composite cementitious material exhibits only a slight deviation from the predicted value of the response surface regression model (41.2 MPa), demonstrating that the model developed in this study has strong predictive accuracy and practical engineering applicability.
Table 11.
Comparison between predicted value and measured value.
3.2. Durability of Composite Cementitious Materials
3.2.1. Basic Performance
In accordance with the “Common Portland Cement” (GB/T 175-2023), the fundamental properties of the composite cementitious material were systematically assessed. The corresponding technical indicators are summarized in Table 12, with Portland cement (PO 42.5) serving as the control. As shown in Table 12, all indicators of the composite cementitious material satisfy the standard technical requirements; however, its performance demonstrates distinct characteristics that set it apart from conventional cement. First, in terms of setting characteristics, the composite cementitious material has an initial setting time of 367 min and a final setting time of 575 min, both significantly longer than those of ordinary cement (233 min and 293 min, respectively). This suggests that the hydration process of the composite system is slower, likely due to the unique hydration kinetics of its supplementary cementitious components. Such delayed setting is advantageous for temperature control during mass concrete construction. Second, regarding strength development, the two materials display distinctly different trends. The 3-day compressive strength of the composite cementitious material is only 5.6 MPa, substantially lower than that of ordinary cement (26.6 MPa), indicating a marked delay in early strength gain. However, its subsequent strength development is significant, reaching 40.8 MPa at 28 days, approaching the strength requirement of P.O 42.5 cement. This pattern of “low early strength followed by steady late-age growth” is a typical feature of the composite cementitious system. This behavior arises because the pozzolanic reaction of the composite cementitious material generally lags behind the hydration of cement clinker, with C-S-H gel forming predominantly at later ages, thereby contributing to strength. Finally, regarding chemical composition, although the composite cementitious material shows higher contents of loss on ignition, magnesium oxide, and sulfur trioxide compared to the control cement, all values remain strictly within the limits set by national standards, ensuring the material’s fundamental volumetric stability and long-term durability. In summary, the composite cementitious material exhibits prolonged setting times, low hydration heat, and high late-age strength—properties that are precisely those desired for high-quality road base materials. Although its early strength is relatively low, this can be effectively mitigated in road construction by extending the curing period. Furthermore, the resulting ease of compaction is advantageous for achieving optimal base layer density.
Table 12.
Test results of basic properties of composite cementitious materials and cement.
3.2.2. Volume Stability
Figure 11a illustrates the volume change curves of SS–CFS–DG composite cementitious mortar (with the optimal mix proportion) and ordinary Portland cement mortar during 180 days of water curing. As shown in the figure, the composite cementitious material exhibits slight volume expansion under water curing, whereas the cement shows pronounced shrinkage. The observed difference is mainly attributed to inherent variations in composition and hydration behavior between the two cementitious systems. Cement primarily consists of minerals such as C3S, C2S, C3A, and C4AF. Its hydration reactions occur relatively quickly, releasing substantial hydration heat and consuming significant internal water, which can lead to autogenous shrinkage under water curing conditions. In addition, cement hydration primarily generates C–S–H gel and Ca(OH)2, while only a limited amount of ettringite (AFt) is produced. Consequently, its role in compensating for volume expansion is minimal, and the material tends to undergo overall shrinkage. In contrast, DG in the composite cementitious material can react with aluminum sources in the system under alkaline conditions during the early stages of hydration to produce AFt. During formation, AFt absorbs numerous water molecules and associated ions, causing rapid pore expansion. Moreover, spatial constraints among AFt crystals generate mutual repulsion, which further contributes to structural expansion. These combined factors lead the composite cementitious material to undergo slight volumetric expansion during water curing, which helps mitigate shrinkage strain and improve its volume stability.
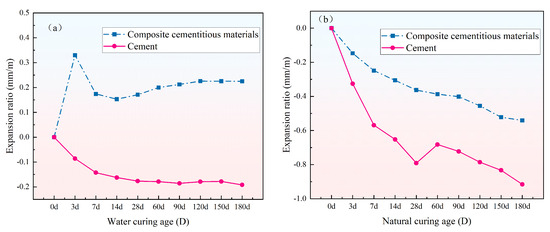
Figure 11.
The volume change curve of mortar specimens over 180 days: (a) water curing and (b) natural curing.
Figure 11b illustrates the volume change behavior of the composite cementitious mortar (with the optimal mix proportion) and the cement mortar under natural curing for 180 days. As shown in the figure, both specimens exhibit different degrees of drying shrinkage in air; however, the composite cementitious material displays a markedly lower shrinkage rate and cumulative shrinkage than the cement mortar. This difference is primarily attributed to variations in the hydration behavior and products of the two cementitious systems. Cement hydrates rapidly, releasing considerable heat at early ages and producing large quantities of C–S–H gel and Ca(OH)2. The formation of these products is generally accompanied by pronounced chemical and drying shrinkage, resulting in volume contraction of the system. In contrast, the hydration of the composite cementitious material occurs more slowly, with a reduced rate of product formation, and thus the development of early-age autogenous shrinkage is comparatively moderate. More importantly, the AFt formed during the early stage of hydration in the composite cementitious system produces an expansion effect by absorbing significant amounts of water and filling pores. This mechanism effectively mitigates capillary tension changes induced by water loss, thereby alleviating and partially compensating for drying shrinkage strain.
3.2.3. Freeze–Thaw Resistance
Figure 12 presents the mass loss rate of the composite cementitious mortar with the optimal mix ratio and the reference cement mortar after 30 freeze–thaw cycles. As shown in the figure, the composite cementitious material exhibits a mass loss rate of 1.19% and a compressive strength loss rate of 4.1% after 30 freeze–thaw cycles, both of which are significantly higher than those of the cement (0.30% and 1.8%, respectively). Meanwhile, the mass loss trend throughout the freeze–thaw cycle demonstrates that the composite cementitious material consistently undergoes a higher mass loss rate than the cement mortar, indicating comparatively lower structural stability and resistance to damage under freeze–thaw conditions. The underlying causes of this phenomenon can be summarized in two aspects: (1) the gel structure of the composite cementitious material is less dense than that of cement, rendering it more vulnerable to microcrack propagation and surface spalling induced by the freezing and expansion of pore water during freeze–thaw cycles; and (2) hydration products such as AFt and C-(A)-S-H in the composite system exhibit greater sensitivity to freeze–thaw stress under low-temperature conditions and are prone to damage, which further reduces its frost resistance. In summary, although the composite cementitious material demonstrates excellent mechanical properties under normal temperature conditions, its frost resistance is still inferior to that of conventional cementitious materials. Consequently, further refinement of its microstructure and densification is necessary for applications in severe cold climates or environments subjected to frequent freeze–thaw cycles.
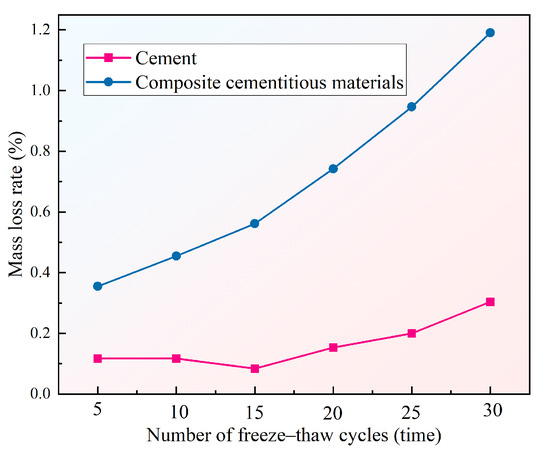
Figure 12.
Mass loss rate of mortar specimens after freeze–thaw cycles.
To gain deeper insight into the performance evolution mechanisms of the composite cementitious material and cement before and after freeze–thaw cycles, this study performed a comparative analysis of their microstructural morphologies using SEM. Figure 13a,b illustrate that a large number of pores formed within the composite cementitious material as a result of freeze–thaw cycles, leading to an overall loosening of its microstructure. In stark contrast, the cement specimens shown in Figure 13c,d maintained a relatively intact and compact microstructure even after 30 freeze–thaw cycles, indicating that cement has a greater capacity to resist freeze–thaw-induced expansion stress and thus exhibits superior frost resistance and durability.
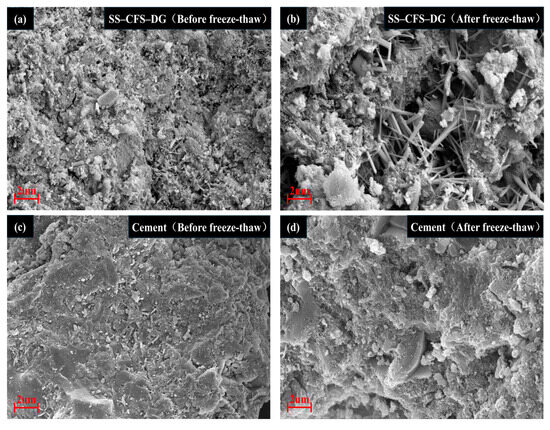
Figure 13.
SEM images of SS–CFS–DG and cement before and after freeze–thaw cycles: (a) before freeze–thaw of SS–CFS–DG, (b) after freeze–thaw of SS–CFS–DG, (c) before freeze–thaw of cement and (d) after freeze–thaw of cement.
3.2.4. Carbonation Resistance
Figure 14 presents the carbonation depth and compressive strength of composite cementitious mortar with the optimal mix ratio and cement mortar specimens at various curing ages. As shown in Figure 14a, the composite cementitious material exhibits a markedly greater carbonation depth than the cement mortar at all curing ages. After 28 days of carbonation, the cement shows a carbonation depth of only 7.7 mm, whereas the composite cementitious material reaches 6.7 mm after just 3 days, which is nearly equal to the depth of cement at 28 days. After 28 days of carbonation, the composite cementitious material shows a carbonation depth of 14 mm, nearly twice that of the cement mortar. This phenomenon is mainly attributed to the high content of Ca(OH)2 generated during cement hydration. During carbonation, CO2 reacts with Ca(OH)2 to produce CaCO3, which blocks pores, enhances the density of the cement mortar specimens, and ultimately suppresses further carbonation. In contrast, after 28 days of hydration, most of the Ca(OH)2 in the composite cementitious material has been consumed, preventing further reaction with CO2 to generate CaCO3 and thereby increasing its susceptibility to carbonation.
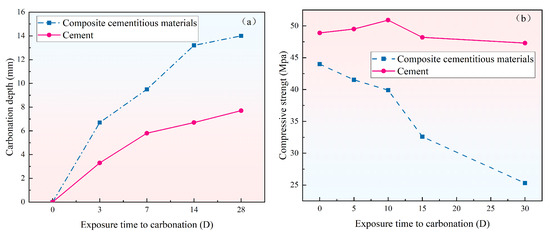
Figure 14.
Carbonation depth and compressive strength of mortar specimens at different ages: (a) carbonation depth and (b) compressive strength.
Figure 14b illustrates the compressive strength development of the composite cementitious material and cement at various carbonation ages. As shown in the figure, the compressive strength of cement increases at the early stage of carbonation and subsequently decreases, whereas the composite cementitious material exhibits a gradual decline in strength with increasing carbonation time. This phenomenon can be explained as follows: (1) the hydration product Ca(OH)2 in cement reacts with CO2 to form CaCO3, which has inherent strength and fills the internal pores of the cement mortar specimens, thereby increasing their density and enhancing compressive strength. However, at the later stage of carbonation, the C–S–H phase in cement also reacts with CO2, resulting in its decalcification and decomposition, which ultimately leads to a reduction in the compressive strength of the cement mortar specimens. (2) The composite cementitious material possesses a limited neutralization capacity against CO2. Moreover, CO2 can decompose AFt into gypsum and calcite, thereby damaging the skeleton structure of the cementitious matrix and causing a gradual decline in strength. In summary, the composite cementitious material demonstrates inferior carbonation resistance compared with ordinary cement and is thus more appropriate for applications in road base or subgrade layers.
To gain deeper insight into the performance evolution mechanisms of the composite cementitious material and cement before and after carbonation, this study performed a comparative analysis of their microstructural morphologies using SEM. By comparing the SEM images before and after carbonation (Figure 15a–d), it is evident that the composite cementitious material initially exhibits a dense microstructure, where well-defined needle-like AFt and flocculent C–S–H gels interlace to form a robust framework. After carbonation, however, the alkaline environment of the system becomes neutralized, leading to the decomposition and disappearance of the AFt phase. Concurrently, the carbonation reaction produces a large number of columnar gypsum crystals. These gypsum crystals not only exhibit poor cementitious properties, but the volume changes occurring during their formation may also induce internal stresses, ultimately causing the microstructure to transform from dense to porous. In sharp contrast, the cement specimens retained a relatively intact and dense microstructure after carbonation, demonstrating superior resistance to carbonation.
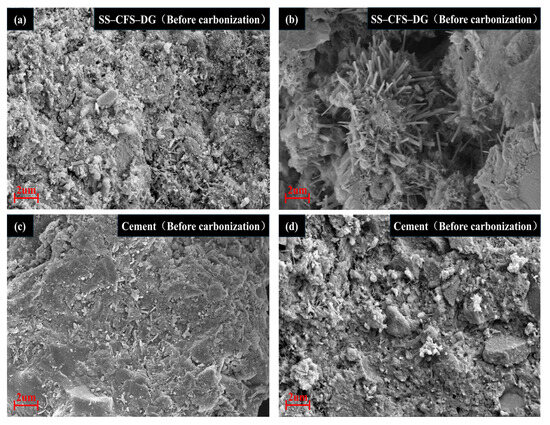
Figure 15.
SEM images of SS–CFS–DG and cement before and after carbonization: (a) before carbonization of SS–CFS–DG, (b) after carbonization of SS–CFS–DG, (c) before carbonization of cement and (d) after carbonization of cement.
4. Conclusions
In this study, the physicochemical properties of solid waste raw materials were first analyzed, and a combination of physical and chemical methods was then employed to activate their hydration activity, thereby producing a composite cementitious material. The mix design of the composite cementitious material was optimized using RSM, and its durability was systematically evaluated. The main conclusions obtained were as follows:
(1) The chemical composition and mineral phases of SS, CFS, and DG were analyzed by XRF and XRD. The results indicate that SS exhibits excellent early hydration activity, strong cementitious properties, and good volumetric stability. CFS is characterized by a high-silicon and aluminum, low-calcium and iron composition, and a dominant glassy phase, making it suitable for alkali-activated systems. DG shows high purity and good crystallinity and can act as a stable sulfur source in cementitious material systems.
(2) The mix proportions of the composite cementitious material were optimized using RSM, and the resulting model demonstrated strong statistical significance, good fitting accuracy, and reliable predictive capability. The optimization results showed that the optimal mix design consisted of 37.2% SS, 33.2% CFS, 9.6% DG, 20% cement, 4% sodium silicate, and 0.1% superplasticizer. At this mix ratio, the composite cementitious material attained an average 28-day compressive strength of 40.8 MPa, which was consistent with the predicted value, confirming the model’s accuracy and applicability.
(3) Durability tests, including volume stability, freeze–thaw resistance, and carbonation resistance, demonstrated that the composite cementitious material possessed greater volumetric stability than cement under both water-curing and drying conditions. Under freeze–thaw conditions, the composite cementitious material showed greater mass and strength losses than cement, indicating insufficient resistance to damage at low temperatures or under frequent freeze–thaw cycles. This highlights the need to further enhance the material’s compactness and microstructural stability. Additionally, the composite cementitious material exhibited lower carbonation resistance than cement. Based on the overall performance, the composite cementitious material is recommended for use in road base and subbase layers.
Author Contributions
Conceptualization, Z.L. and X.C.; methodology, X.C.; software, J.L.; validation, J.L. and Y.Y.; formal analysis, Y.Z.; investigation, J.L. and Y.Y.; resources, X.C.; data curation, Z.L.; writing—original draft preparation, Z.L., Y.Z. and Y.Y.; writing—review and editing, X.C.; visualization, J.L.; supervision, Y.Z.; project administration, Z.L.; funding acquisition, Z.L. All authors have read and agreed to the published version of the manuscript.
Funding
This research did not receive any specific grant from funding agencies in the public, commercial, or not-for-profit sectors.
Institutional Review Board Statement
Not applicable.
Informed Consent Statement
Not applicable.
Data Availability Statement
Data are contained within the article.
Conflicts of Interest
Author Yunchun Zhang was employed by the company Chongqing Jiaotong University Construction Engineering Quality Testing Center Co., Ltd. The remaining authors declare that the research was conducted in the absence of any commercial or financial relationships that could be construed as a potential conflict of interest.
References
- Zhu, Y.; Zhang, Y.; Luo, D.; Chong, Z.; Li, E.; Kong, X. A review of municipal solid waste in China: Characteristics, compositions, influential factors and treatment technologies. Environ. Dev. Sustain. 2021, 23, 6603. [Google Scholar] [CrossRef]
- Gu, B.; Jiang, S.; Wang, H.; Wang, Z.; Jia, R.; Yang, J.; He, S.; Cheng, R. Characterization, quantification and management of China’s municipal solid waste in spatiotemporal distributions: A review. Waste Manag. 2017, 61, 67–77. [Google Scholar] [CrossRef]
- Qi, S.; Chen, Y.; Wang, X.; Yang, Y.; Teng, J.; Wang, Y. Exploration and practice of “zero-waste city” in China. Circ. Econ. 2024, 3, 100079. [Google Scholar] [CrossRef]
- Guo, D.; Zhang, S.; Hou, H.; Zhang, Y.; Xu, H. Synergistic evaluation methodology for pollution and carbon reduction in the field of solid waste resource utilization. Environ. Impact Assess. Rev. 2024, 108, 107604. [Google Scholar] [CrossRef]
- Terán-Cuadrado, G.; Tahir, F.; Nurdiawati, A.; Almarshoud, M.A.; Al-Ghamdi, S.G. Current and potential materials for the low-carbon cement production: Life cycle assessment perspective. J. Build. Eng. 2024, 96, 110528. [Google Scholar] [CrossRef]
- Xiang, Q.; Pan, H.; Ma, X.; Yang, M.; Lyu, Y.; Zhang, X.; Shui, W.; Liao, W.; Xiao, Y.; Wu, J.; et al. Impacts of energy-saving and emission-reduction on sustainability of cement production. Renew. Sustain. Energy Rev. 2024, 191, 114089. [Google Scholar] [CrossRef]
- Salaripoor, H.; Yousefi, H.; Abdoos, M. Life cycle environmental assessment of Refuse-Derived Fuel (RDF) as an alternative to fossil fuels in cement production: A sustainable approach for mitigating carbon emissions. Fuel Commun. 2025, 22, 100135. [Google Scholar] [CrossRef]
- Inweer, M.-I.; Nassar, Y. Carbon Emissions Life Cycle Assessment of Cement Industry in Libya. Wadi Alshatti Univ. J. Pure Appl. Sci. 2025, 3, 162–173. [Google Scholar] [CrossRef] [PubMed]
- Miao, C.; Cao, X.; Tang, B.; Rao, S.; Yuan, Y. Development of a sustainable cementitious material using phosphogypsum and coal-fired slag for enhanced environmental safety and performance. Constr. Build. Mater. 2025, 458, 139705. [Google Scholar] [CrossRef]
- Sun, W.-j.; Liu, L.; Zhao, Y.-y.; Fang, Z.-y.; Lyu, Y.-z.; Xie, G.; Shao, C.-c. Hydration mechanism and microstructure characteristics of modified magnesium slag alkali-activated coal-fired slag based cementitious materials. J. Cent. South Univ. 2025, 32, 2148–2169. [Google Scholar] [CrossRef]
- Delitsyn, L.; Kulumbegov, R.; Popel’, O.; Borisov, Y.A.; Gadzhiev, S.A. Processing of Ash and Slag Waste from Coal-Fired Thermal Power Plants and Extraction of Commercial Products from the Waste. Therm. Eng. 2025, 72, 203–220. [Google Scholar] [CrossRef]
- Sun, W.; Liu, L.; Zhou, J.; Zhao, Y.; Shao, C.; Lyu, Y. Effect of inorganic salt composition on strength, microstructure and leaching toxicity of coal-based solid waste backfill materials. Process Saf. Environ. Prot. 2024, 192, 1110–1126. [Google Scholar] [CrossRef]
- Wu, J.; Deng, X.; Jiao, F.; Lyu, B.; Fang, C. Resource utilization status and development trend of bulk solid waste of coal-based ash/slag. Coal Sci. Technol. 2024, 52, 238–252. [Google Scholar]
- Liu, S.; Liu, W.; Jiao, F.; Qin, W.; Yang, C. Production and resource utilization of flue gas desulfurized gypsum in China—A review. Environ. Pollut. 2021, 288, 117799. [Google Scholar] [CrossRef]
- Zhou, Y.; Xie, L.; Kong, D.; Peng, D.; Zheng, T. Research on optimizing performance of desulfurization-gypsum-based composite cementitious materials based on response surface method. Constr. Build. Mater. 2022, 341, 127874. [Google Scholar] [CrossRef]
- Xia, X.; Zhang, L.; Yuan, X.; Ma, C.; Song, Z.; Zhao, X. Integrated assessment of the environmental and economic effects of resource utilization process for lime/gypsum flue gas desulfurization collaborative desulfurized gypsum. Environ. Eng. Sci. 2021, 38, 886–898. [Google Scholar] [CrossRef]
- Wang, Y.; Liu, X.; Zhu, X.; Zhu, W.; Yue, J. Synergistic effect of red mud, desulfurized gypsum and fly ash in cementitious materials: Mechanical performances and microstructure. Constr. Build. Mater. 2023, 404, 133302. [Google Scholar] [CrossRef]
- Feng, S.; Zhang, G.; Ren, Y. Properties and microstructure of soil solidified by titanium slag-flue gas desulfurized gypsum-Portland cement composites as solidifiers. Constr. Build. Mater. 2024, 438, 137061. [Google Scholar] [CrossRef]
- Gao, W.; Zhou, W.; Lyu, X.; Liu, X.; Su, H.; Li, C.; Wang, H. Comprehensive utilization of steel slag: A review. Powder Technol. 2023, 422, 118449. [Google Scholar] [CrossRef]
- Sun, X.; Liu, J.; Zhao, Y.; Zhao, J.; Li, Z.; Sun, Y.; Qiu, J.; Zheng, P. Mechanical activation of steel slag to prepare supplementary cementitious materials: A comparative research based on the particle size distribution, hydration, toxicity assessment and carbon dioxide emission. J. Build. Eng. 2022, 60, 105200. [Google Scholar] [CrossRef]
- Bouzar, B.; Benzerzour, M.; Abriak, N.E. Evaluation of mineral eco-binders from secondary raw materials: Environmental assessments. J. Mater. Cycles Waste Manag. 2024, 26, 2546–2566. [Google Scholar] [CrossRef]
- GB/T 17671-2021; Test Method of Cement Mortar Strength (ISO Method). China Standardization Management Committee: Beijing, China, 2021.
- GB/T 50082-2009; Standard for Test Methods of Long-Term Performance and Durability of Ordinary Concrete. Ministry of Housing and Urban Rural Development of the People’s Republic of China: Beijing, China, 2009.
- GB/T 175-2023; Common Portland Cement. China Standardization Management Committee: Beijing, China, 2023.
- Aghajanzadeh, I.; Ramezanianpour, A.M.; Amani, A.; Habibi, A. Mixture optimization of alkali activated slag concrete containing recycled concrete aggregates and silica fume using response surface method. Constr. Build. Mater. 2024, 425, 135928. [Google Scholar] [CrossRef]
- Habibi, A.; Ramezanianpour, A.M.; Mahdikhani, M. RSM-based optimized mix design of recycled aggregate concrete containing supplementary cementitious materials based on waste generation and global warming potential. Resour. Conserv. Recycl. 2021, 167, 105420. [Google Scholar] [CrossRef]
Disclaimer/Publisher’s Note: The statements, opinions and data contained in all publications are solely those of the individual author(s) and contributor(s) and not of MDPI and/or the editor(s). MDPI and/or the editor(s) disclaim responsibility for any injury to people or property resulting from any ideas, methods, instructions or products referred to in the content. |
© 2025 by the authors. Licensee MDPI, Basel, Switzerland. This article is an open access article distributed under the terms and conditions of the Creative Commons Attribution (CC BY) license (https://creativecommons.org/licenses/by/4.0/).