Abstract
Under the “dual carbon” goals, offshore oil and gas development requires efficient CO2 reduction solutions. This study investigates a membrane–cryogenic distillation-coupled process for treating high-CO2-associated gas (40%–70% CO2). The experimental results demonstrate that the membrane unit enriches CO2 to over 80% under optimized pressure and temperature conditions. Subsequent cryogenic distillation further purifies CO2 to ≥95% with a recovery rate of 80%. The integrated system improves the overall recovery to 80%, reduces energy consumption, and decreases the equipment footprint by approximately 30% compared to conventional methods. This process demonstrates technical feasibility, along with economic and environmental benefits, for decarbonizing offshore gas production, supporting green development in the energy sector.
1. Introduction
In the context of the global acceleration of carbon neutrality, global warming caused by carbon dioxide emissions and a series of environmental problems caused by them have attracted great attention [1]. In response to this, China’s “3060” dual carbon goal has proposed the dual carbon goal and put forward strict carbon emission constraints on the energy industry [2,3]. It is estimated that by 2025, our country’s oil and gas demand will still account for more than 70.0% of primary energy consumption [4]. As an important pillar of the national energy supply system, oil and gas resources have a long way to go in energy conservation and emission reduction [5]. It is worth noting that the associated gas generated in the offshore exploitation process is the main source of CO2 emissions, and the CO2 concentration in associated gas is generally as high as 40~70%, accounting for one-third or more of the total emissions in the production process [6,7].
In the process of production and life, natural gas with too high a concentration of carbon dioxide will bring many problems: high concentrations of CO2 will greatly reduce the calorific value of natural gas and affect energy efficiency [8]; the strong corrosiveness of CO2 seriously threatens the transportation safety of submarine pipelines [9]. Most importantly, current treatment methods lead to direct emissions of tens of millions of tons of carbon resources each year, which not only wastes resources but also exacerbates climate change [10,11].
Therefore, a large amount of CO2 not only keeps the carbon emissions of offshore gas fields high but also limits the production and production efficiency of natural gas in gas [12]. Carbon emission reduction and natural gas production increase through corresponding carbon dioxide capture, utilization, and storage (CCUS) technologies, which have become the main research issues in this field [13]. At present, the technical methods for carbon capture of natural gas mainly include the solvent absorption method [14,15], the physical adsorption and separation method [16,17], the low-temperature fractionation method [18,19], and the membrane separation method [20,21,22].
Among them, the chemical absorption method directly removes chemical solvents such as alcohol amines from the acid gas component CO2 in natural gas through efficient chemical reactions, so it has high selectivity, but the disadvantage is that it consumes more energy in the process of heating desorption [23]. Although the adsorption separation method can be directly adsorbed by individual adsorbents through physical means and consumes less energy, its application is limited, and the recovery rate is relatively low due to the limited adsorption capacity and material tolerance [24]. Although the low-temperature fractionation method has good separation results, its process is complex, the equipment cost is high, and the environmental conditions are high [25]. Relatively speaking, the membrane separation method has the advantages of low energy consumption and good compactness, and it is more suitable for working environments with limited space conditions, such as offshore platforms. However, the membrane is limited by the separation efficiency affected by the concentration of gas components and operating pressure; especially under the condition of high CO2 concentrations, it is difficult for the purity of the gas on the seepage side to break through the bottleneck of 95%. This also means that the separation efficiency of the membrane separation method is limited [26].
In the process of offshore oilfield exploitation, the space of the offshore platform is small, the working conditions are complex, and it is difficult for the above single traditional decarburization technology to adapt to the special offshore environment, so the low-temperature separation method can be combined with other processes [27]. Through experimental comparison and analysis, membrane separation can be combined with low-temperature fractionation technology to overcome the limitations of a single separation technology and improve the separation efficiency and product purity. The membrane separation method relies on the pressure difference between the two sides of the membrane as the driving force and uses a specific membrane to achieve the purpose of separating each component by using the different permeation rates of different gases in the membrane [28]. Based on the difference in the permeation rate of different gas components in the membrane, the preliminary separation of carbon dioxide can be realized, and carbon dioxide can be effectively separated from natural gas. Cryogenic fractionation uses the different boiling points of each component for precise separation, and the combination of the two can improve the separation purity and yield of carbon dioxide [29].
According to research, the coupling system model of the two has the following advantages: (1) Good adaptability; suitability for offshore oil and gas fields of different scales; and can be flexibly designed and adjusted according to actual production conditions, whether it is a small marginal oil field or a large offshore oil and gas field. (2) High energy utilization efficiency: the cooling gas needs to be cooled to a low temperature state in the process of low-temperature fractionation, and the pressure change in the process of membrane separation will also produce energy changes. (3) Compact equipment and small footprint: membrane separation equipment has a relatively compact structure and a small footprint, which is suitable for the conditions of limited space on an offshore platform. After optimized design, the cryogenic fractionation equipment can also reduce the floor space to a certain extent, which is very beneficial to the space utilization of offshore oil and gas fields and helps to reduce the construction and operating costs of the platform.
In general, membrane separation and low-temperature fractionation technology have great application advantages in offshore oilfield decarburization, and the separation effect of a single membrane separation method is affected by many factors. Therefore, based on the above background, the membrane separation + low-temperature fractionation method was used to separate the high concentrations of CO2 in the associated gases of oil and gas on offshore platforms to verify the feasibility of this membrane + low-temperature fractionation scheme. Starting with the optimization of process parameters, the influence of process parameters on the experiment is analyzed, and finally, the optimal process parameters are obtained. The research of this experimental report can provide a reference for the coarse separation of CO2 in the development and production of offshore oil and gas fields.
2. Experiment
2.1. Experimental Device
Test instruments: Membrane module (a hollow fiber membrane made of polyimide with an effective area of a single membrane of 0.6 m2) (Figure 1); gas mixing tank (volume 3 L, pressure resistance 10 MPa); gas storage tank (volume 20 L, withstand pressure 10 MPa); compressor (compression ratio 10); cryogenic circulation pump (−40 °C, volume 40 L); distillation equipment (pressure resistance 8 MPa); gas flow meter (withstand pressure 10 MPa, flow rate 0–30 L/min, accuracy ±0.5 L/min); back pressure valve (0–3 MPa, accuracy ±0.1 MPa; 0–9 MPa, accuracy ±0.5 MPa); pressure sensor (accuracy ±0.1 MPa); and gas chromatograph (accuracy ±2% for CO2 and CH4 concentration analysis).
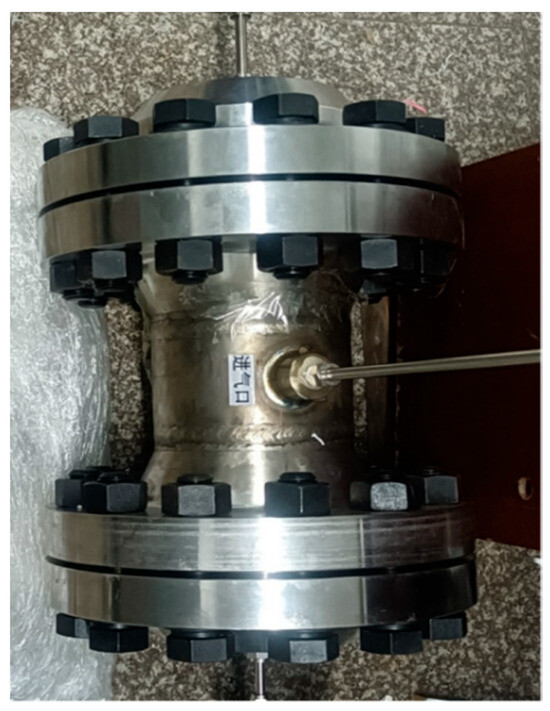
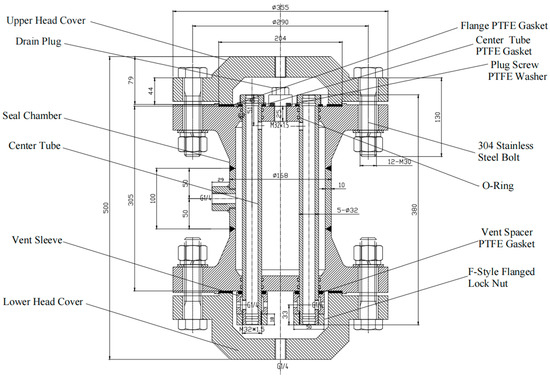
Figure 1.
High-pressure membrane group (Schematic diagram assembly and dimensions).
2.2. Experimental Principle
The membrane separation process relies on the solution–diffusion mechanism of gas components in the membrane material. The difference in the permeation rate of different gases in the membrane is mainly determined by their solubility and diffusion coefficient.
CO2, despite being a nonpolar molecule similar to hydrocarbon gases like CH4, has a significant quadrupole moment and higher condensability, which generally lead to higher solubility in many polymer membranes. However, its diffusivity may be lower than that of CH4 due to its larger kinetic diameter. Therefore, while CO2 often exhibits higher permeability in many polymeric membranes, this is not universal and depends on the specific membrane material and operating conditions.
According to Fick’s first law, the flux of gas components, n, through the membrane, , can be expressed as
: The diffusion flux of component n (the mass of matter passing through a unit area per unit of time), usually in mol/(m2·s). : The diffusion coefficient of component n reflects the diffusion capacity of the substance in the medium, in units of m2/s. : Concentration gradient of component n in direction z.
The negative sign (−) indicates that the direction of diffusion is opposite to the direction of the concentration gradient; that is, the substance diffuses from high concentration to low concentration.
Under steady-state conditions, the flux can be simplified to
where are the dissolved concentrations of gases in the membrane at the interface of the feed side and the permeation side of the membrane, respectively, and l is the thickness of the film.
The following permeation rate formula (solution–diffusion model) is often used to describe this process:
: Osmotic flux of gas component II (mol/m2·s). : Permeability coefficient of gas component II (mol/m·s·Pa). : Partial pressure difference (Pa) of component II on both sides of the membrane. : Membrane thickness (m).
The actual separation process is also affected by factors such as raw gas composition, operating pressure, and temperature, and there are competitive adsorption and plasticization effects.
Cryogenic fractionation is based on the difference in volatility (i.e., boiling point) of each component in the gas mixture, and it is separated by cooling liquefaction and distillation. The boiling point of CO2 (−78.5 °C at 1 atm) is significantly higher than that of CH4 (−161.5 °C) and N2 (−195.8 °C), so it can be preferentially liquefied and separated from light components under appropriate low-temperature and -pressure conditions.
The distillation process realizes mass transfer and heat transfer through gas–liquid two-phase multi-stage contact in the tower, enriches the light components at the top of the tower, and concentrates the recomposed components (CO2) in the tower pot. Its separation efficiency is determined by the relative volatility α and the number of plates (or mass transfer units):
where are the molar fractions of component i in the gas and liquid phases, respectively.
The system uses the membrane separation unit as the pretreatment stage to quickly increase the CO2 concentration to more than 80% and reduce the load of the subsequent cryogenic unit. The low-temperature fractionation unit carries out deep liquefaction and distillation of membrane permeate gas to obtain high-purity CO2 products. The two units achieve energy integration through pressure and cold energy coupling, such as using the high pressure of membrane seepage gas to drive the turbine or provide cold recovery, significantly reducing the total energy consumption of the system.
CO2 recovery rate, :
System energy consumption, Q:
where
: Mass flow rate (kg/s).
: Specific heat capacity (kJ/kg·K).
: Temperature change (K).
: Latent heat of vaporization (kJ/kg).
In this experiment, the performance of the above principles in the actual coupling process is systematically studied by adjusting parameters, such as temperature, pressure, and gas composition, and provides a theoretical basis for process optimization.
To further quantify the membrane separation performance, the permeation rates of CO2 and CH4 and their selectivity were calculated based on the experimentally measured gas compositions and flow rates on the permeate and retentate sides. Under typical operating conditions (temperature: 30 °C, pressure: 3 MPa, feed CO2 concentration: 50%), the CO2 permeation rate was approximately , and the CH4 permeation rate was approximately . The calculated CO2/CH4 selectivity was about 20.8, indicating that the membrane material exhibits favorable CO2-selective permeation characteristics, making it suitable for the preliminary enrichment of high-carbon-associated gas.
2.3. Experimental Procedure
After all the equipment was connected according to a flow chart (Figure 2), the entire process system was first evacuated using nitrogen to remove air. After the emptying is completed, the nitrogen pressure is increased to the pressure required for the experiment, and a tightness test is carried out on the whole process to ensure that the pressure gauge readings remain stable and unchanged for half an hour, indicating that the system’s tightness meets the requirements. Next, the gas mixture is configured according to the gas ratio required for the experiment (Table 1), its composition is tested by sampling, and the gas composition is repeatedly adjusted until it meets the experimental requirements.
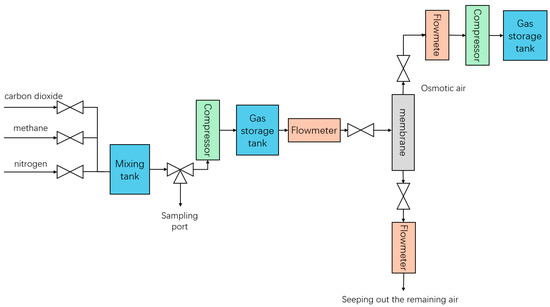
Figure 2.
Membrane + low-temperature fractionation experiment (membrane part).

Table 1.
Experimental raw gas parameters.
Once the gas sample is ready, it is adjusted to the desired flow rate and passed into the mixing tank. After the gas mixture tank reaches a certain pressure, we start the compressor to push the mixture into the gas storage tank, and in the process, the pump is turned on to cool the gas. Subsequently, the gas pressure and flow rate are adjusted to the experimental setpoint so that the gas mixture enters the membrane separator for separation. The separation pressure is controlled by the pressure gauge on the permeation side and the residual side. The flow rate on both sides is detected separately by the flow meter, and the composition of the gas outflow from both sides is detected (Figure 2).
The gas on the permeable side after membrane separation enters the compressor for compression, and after compression, it is sent to the gas storage tank. We precisely control the flow and pressure of gas entering the liquefier by adjusting the back pressure valve and flow meter behind the gas tank. Next, the temperature and flow rate of the cooling circulation pump are adjusted to cool the gas deeply, and the pressure in the liquefier is adjusted to promote the liquefaction of the target gas (carbon dioxide). The liquefied material enters the distillation column, and by adjusting the operating parameters (mainly pressure) of the top condenser and the bottom reboiler, the normal flow of gas and liquid phases in the tower can be ensured so that the top gas phase and the bottom liquid phase products can be recovered smoothly. Finally, the flow rate of the top and bottom products is detected, and samples are taken separately to detect their composition (Figure 3).
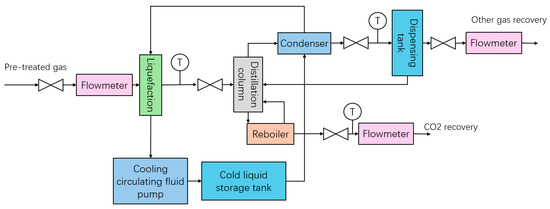
Figure 3.
Membrane + low-temperature fractionation experiment (low-temperature part).
By employing different parameter combinations, the entire experimental procedure—from introducing gas into the membrane separator to product detection—was repeated for multiple tests (Table 1).
3. Experimental Results
3.1. Experimental Results and Analysis of Decarburization by Membrane
3.1.1. Effect of Temperature on Membrane Separation Method
The effect of temperature on the membrane separation results is shown in Figure 4. It can be seen from the figure that the CO2 concentration on the osmotic side decreases slowly with the increase in temperature, while the CH4 concentration on the osmotic side increases gradually. The CO2 concentration on the seepage side decreased slowly from 30 °C to 45 °C, and the CH4 concentration gradually decreased from 30 °C to 40 °C.
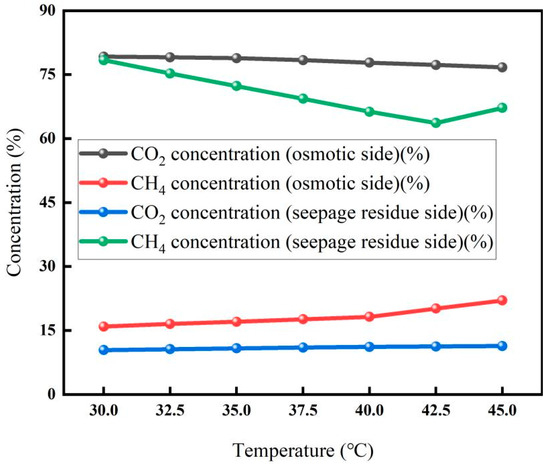
Figure 4.
Membrane separation effect at different temperatures (Test conditions: pressure: 5 MPa, flow rate: 5 L/min, carbon concentration: 30%).
These trends indicate that elevated temperature is unfavorable for the separation of CO2 and CH4. Although the diffusion coefficients of both CO2 and CH4 generally increase with temperature, the permeability—determined by the product of solubility and diffusion coefficient—is dominated in this case by the decrease in CO2 solubility [30]. This solubility reduction leads to a decline in CO2 permeability and, thus, a lower separation coefficient, with no significant physical aging effect observed. Under the combined influence of these factors, the highest CO2 concentration on the seepage side was 79.2%, and the lowest CO2 concentration on the retentate side was 10.4%, both recorded at 30 °C.
3.1.2. Effect of Carbon Dioxide Concentration on Membrane Separation
The experimental results for carbon concentration on membrane properties are shown in Figure 5. With the increase in carbon concentration, the CO2 concentration on the osmotic side showed an upward trend, while the CH4 concentration on the osmotic side decreased slowly. This is because increasing the concentration of inlet CO2 raises its partial pressure, enhancing the driving force for permeation according to the solution–diffusion model. However, at high CO2 concentrations, membrane swelling or plasticization may occur, which could alter permeation behavior. In this study, the membrane material was selected for its resistance to plasticization under the tested conditions, though long-term exposure was not evaluated. On the other hand, the increased concentration of imported CO2 also weakens the adsorption competition effect in the separation membrane, which also promotes the osmotic process of CO2 to a certain extent and increases the concentration of CO2 in the osmotic gas. The slow decrease in CH4 concentration is due to the low concentration of CH4 in feedstock gas, and the other is the high concentration of CO2, which weakens the competitive adsorption effect of CH4 [31].
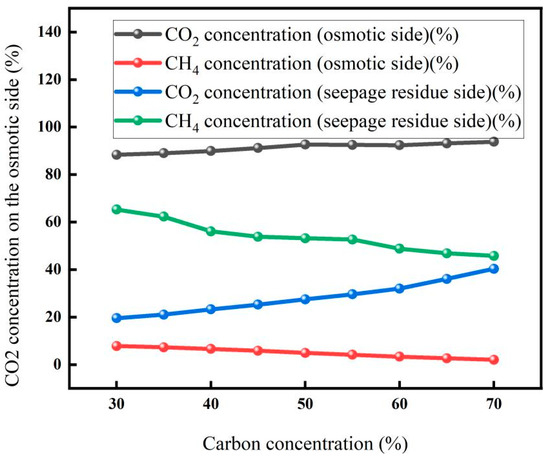
Figure 5.
Membrane separation effect under different carbon concentrations (Test conditions: pressure: 3 MPa, temperature: 30 °C, flow rate: 5 L/min).
In addition, with the increase in CO2 concentration in the feedstock, the flow rate of the permeate gas increases, indicating that more CO2 gas is separated through the membrane, which will increase the recovery rate of CO2. The results showed that the CO2 product gas with higher purity and higher recovery rate could be obtained after increasing the CO2 concentration of the feedstock gas and separating it through the membrane.
3.1.3. Effect of Pressure on Membrane Separation
The effect of pressure on membrane separation is shown in Figure 6. The results showed that the CO2 concentration on the osmotic side showed a downward trend with the increase in pressure, while the CH4 concentration on the osmotic side gradually increased with the increase in pressure. With the increase in pressure, the CO2 concentration on the seepage side decreased significantly, and the CH4 concentration on the seepage side increased significantly. This is because when the gas penetrates into the membrane, it will go through the process of dissolution and diffusion; that is, the gas first dissolves on the surface of the membrane, and the dissolved gas diffuses under the action of concentration difference and completes the entire osmosis process through desorption after reaching the other surface of the membrane. When the CO2 mixture penetrates into the membrane, there will be an adsorption competition effect, resulting in slow gas (gas with a small permeability rate, i.e., CH4) slowing down the fast gas (gas with a large permeability rate, i.e., CO2), and the fast gas will also make the slow gas faster. As the inlet pressure increases, the adsorption competition effect intensifies. While this leads to more CO2 transmission through the membrane, it also results in more CH4 permeation, ultimately causing a decrease in CO2 concentration on the permeation side. Therefore, when the pressure is 2.5 Mpa, the CO2 concentration on the seepage side can reach up to 87.5%, and the lowest CO2 concentration on the leachate side is 10.25%.
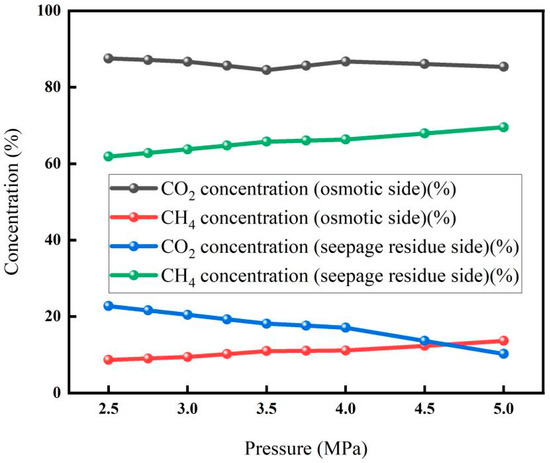
Figure 6.
Membrane separation effect under different pressures (Test conditions: temperature: 30 °C, flow rate: 5 L/min, carbon concentration: 30%).
In the membrane decarburization experiment, the operating parameters have a significant impact on the separation effect, and they need to be regulated according to the treatment needs of associated gas on the offshore platform. Although the increase in temperature had little effect on the change in gas concentration on both sides of the membrane, it was not conducive to efficient separation. Pressure regulation needs to be performed particularly cautiously: the CO2 concentration on the permeable side decreases with the increase in pressure, while the CH4 concentration on the permeable side increases, so it is necessary to maintain a low osmotic pressure. Increasing the permeate pressure also reduces the CO2 concentration on the seepage side and increases CH4 penetration, so a lower value should also be chosen to ensure the separation efficiency. The CO2 concentration in the feed gas showed a positive effect, and the increase in the concentration could significantly improve the purity of CO2 in the permeable gas. The increase in raw gas flow rate will increase the CO2 concentration of permeate gas, but most of the gas will be trapped on the seepage side, resulting in insufficient separation, so the flow rate needs to be controlled within a moderate range.
In summary, in order to achieve efficient separation of CO2 and CH4 in offshore oil and gas associated gas, that is, to obtain high-CO2-purity permeable gas and high-CH4-purity permeable gas, it is necessary to use a lower operating temperature, lower osmotic side pressure, and appropriate feedstock gas flow and pressure parameters under the condition of fixed-feed gas composition. At the same time, given the above limiting factors, especially in the environment of high CO2 concentration (40~70%), it is difficult for membrane separation to stably break through the bottleneck of 95% permeable gas purity, and the recovery efficiency is limited, highlighting the challenges faced by single-membrane technology in meeting the requirements of offshore platforms for high decarburization efficiency, high product recovery rates, and adaptation to complex working conditions.
3.2. Experimental Results and Analysis of Low-Temperature Fractionation Method
3.2.1. Effect of Temperature on Cryogenic Fractionation
The results of low-temperature fractionation experiments at different temperatures are shown in Figure 7. From the experimental results, it can be seen that when the pressure is 4 MPa, the flow rate is 10 L/min, and the CO2 concentration is 85%; the concentration of CO2 in the gas at the top of the tower gradually increases with the increase in temperature, and the gas flow increases. As the temperature increases, the flow rate of the kettle decreases due to the reduced liquefaction capacity and more gas remaining in the vapor phase [32].
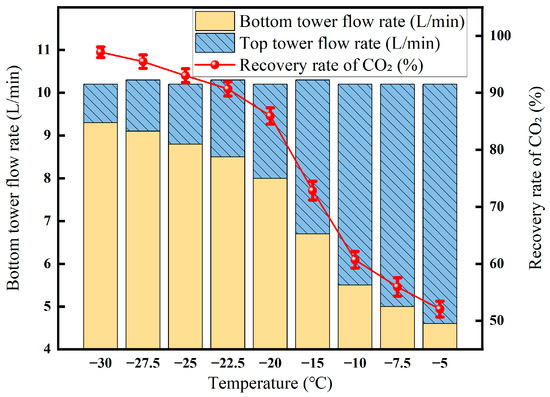
Figure 7.
Low-temperature fractionation effect under different temperature conditions (Test conditions: flow rate: 10 L/min, pressure: 40 MPa, carbon dioxide concentration: 85%).
Given that the operating pressure (4 MPa) is below the critical pressure of CO2 (7.38 MPa), the system remains in a subcritical state. The concentration of CO2 in the bottom liquid phase increases with temperature, which aligns with the vapor–liquid equilibrium behavior of CO2-rich mixtures under subcritical conditions. This phenomenon can be attributed to the fact that at higher temperatures, the liquefaction of lighter components (e.g., CH4 and N2) is significantly reduced. Consequently, the relative concentration of CO2 in the liquid phase becomes enriched, consistent with the predicted phase behavior on the CO2 phase diagram.
The experiment also found that when the liquefaction pressure is 4 MPa and the temperature is 0 °C, the concentration of CO2 in the tower roof gas remains at 85%, indicating that under this specific combination of pressure and temperature, the mixture does not undergo liquefaction and remains entirely in the gaseous state. This observation is consistent with the phase diagram of CO2, where at 4 MPa, temperatures above approximately −20 °C are required to initiate condensation for high-purity CO2, explaining the absence of liquefaction at 0 °C.
3.2.2. Effect of Pressure on Cryogenic Fractionation
From the experimental results in Figure 8, it can be seen that at a temperature of −30 °C, the flow rate is 10.2 L/min, and the CO2 concentration is 85%. The concentration of CO2 in the gas at the top of the tower gradually decreases with the increase in pressure, and the gas flow rate decreases due to the increase in liquefaction capacity with the increase in pressure [33]. With the increase in liquefaction pressure, the flow rate of the tower kettle increases because the liquefaction capacity is enhanced, and more gas is present in the liquid equivalent. However, the concentration of CO2 in the bottom product of the tower decreases because when the liquefaction pressure is high, some of the other gases are also liquefied, and with the increase in liquefaction pressure, the number of other gases liquefied increases, so the content of carbon dioxide decreases.
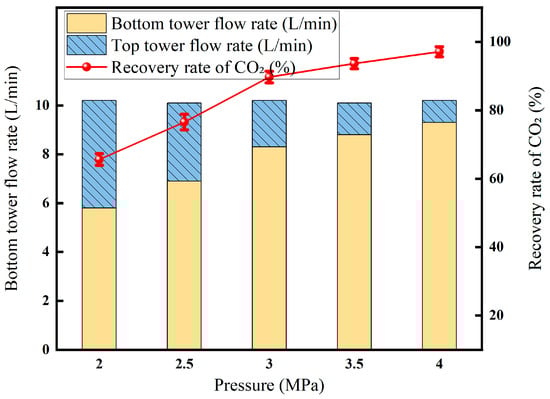
Figure 8.
Low-temperature fractionation effect (−30 °C) under different pressures (Test conditions: flow rate: 10L/min, carbon dioxide concentration: 85%).
From the experimental results in Figure 9, it can be seen that at a temperature of 10 °C (pressure: 7.4 MPa; a temperature of 31.1 °C is the critical point of carbon dioxide—when the temperature and pressure are liquefied, the temperature and pressure should be based on this), the flow rate is 10.2 L/min, and the CO2 concentration is 85%; the experimental results are shown in Figures, which is consistent with the results at low pressure and low temperature, and the concentration of CO2 in the top gas and the tower cauldron products decreases with the increase in pressure.
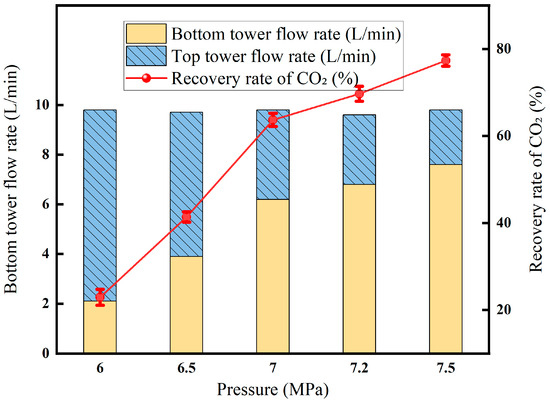
Figure 9.
Low-temperature fractionation effect under different pressures (10 °C) (Test conditions: flow rate: 10 L/min, carbon dioxide concentration: 85%).
3.2.3. Effect of Carbon Dioxide Concentration on Cryogenic Fractionation
The results of the low-temperature fractionation experiments at different carbon dioxide concentrations are shown in Figure 10. The experimental results show that when the temperature is −30 °C, the pressure is 2 MPa, and the flow rate is 10 L/min, the concentration of CO2 in the top gas of the tower remains basically unchanged at about 70%, and the concentration of CO2 in the tower gas remains at about 96%. The results show that when the temperature, pressure, and gas flow rate are determined, the CO2 content in the tower kettle gas and the tower top gas is less affected by the CO2 content in the feed gas. However, the CO2 concentration in the feed gas will affect the flow rate of the tower top gas and the tower kettle gas. When the CO2 content of the feed gas is 75%, the tower top gas flow rate is 8.2 L/min, and the tower kettle gas is 2.0 L/min; when the CO2 content in the feed gas is 90%, the tower top gas flow rate is 2.5 L/min, and the tower kettle gas is 7.7 L/min. The CO2 recovery rate increases with the increase in CO2 content.
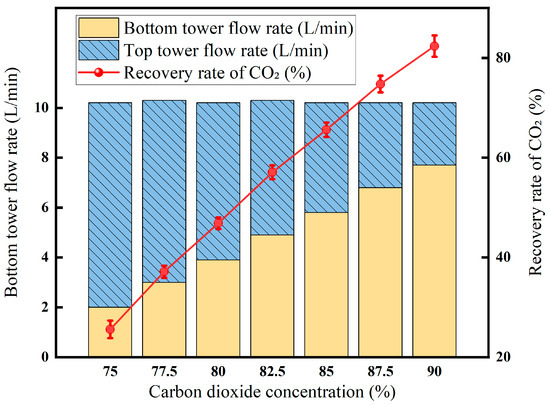
Figure 10.
Low-temperature fractionation effect at different carbon dioxide concentrations (Test conditions: pressure: 2 MPa, temperature: −30 °C, flow rate: 10 L/min).
Our experimental studies of low-temperature fractionation show that the CO2 concentration, operating pressure, and temperature of the feed gas have significant and mutually restrictive effects on the separation efficiency. Within the range of the liquefaction capacity of the equipment, the increase in gas flow will maintain the stability of the CO2 concentration and recovery rate of the tower kettle products, but after exceeding the liquefaction threshold, the increase in flow will lead to a significant decrease in the recovery rate, so the upper limit of flow needs to be strictly controlled. Although the increase in CO2 concentration in the feed gas has a limited impact on the purity of the tower kettle products, it can greatly improve the CO2 recovery rate, highlighting the positive contribution of high-concentration raw materials to energy efficiency. Pressure regulation presents complex effects: high-purity tower kettle products (higher CO2 concentration) can be obtained under low-pressure conditions, but the recovery rate is sacrificed. Although the increase in pressure increases the amount of recovery, the purity of the product is diluted due to the co-condensation of light components. The effect of temperature is also contradictory—low-temperature operation is conducive to maintaining high recovery rates, while increasing temperature can increase the CO2 concentration of the tower kettle at the cost of a sharp decrease in recovery rate.
Overall, it can be seen that the cryogenic fractionation process faces an inherent balance challenge in the pursuit of high purity and high recovery: it is necessary to finely coordinate pressure and temperature parameters on the basis of a higher feed gas CO2 concentration to break through the limitation of a single variable. This explains why the pre-membrane separation unit is crucial in offshore-platform-associated gas treatment—it increases the CO2 concentration to more than 80% through pre-concentration, creating a high-recovery, low-energy operating window for subsequent cryogenic fractionation, allowing the coupled process to push the efficiency boundaries of a single technology.
3.3. Experimental Results and Analysis of Membrane–Cryogenic Distillation Temperature Coupling Decarburization
3.3.1. Effect of Liquefaction Temperature on Membrane–Cryogenic Coupling Decarburization Results
When the liquefaction temperature drops from −19 °C to −29 °C, the CO2 recovery rate jumps from 55% to 80% (Figure 11). The CO2 concentration of the tower kettle is always maintained at about 95%, which ensures the high purity of carbon dioxide and is conducive to subsequent storage or utilization. The CO2 concentration at the top of the tower decreased from 70% to 55%, indicating that the cooling transferred more CO2 to the liquid phase, reducing the residual CO2 in the associated gas and improving the overall removal efficiency. Overall, moderately reducing the liquefaction temperature can significantly increase the amount of system decarburization, while taking into account product purity and recovery.
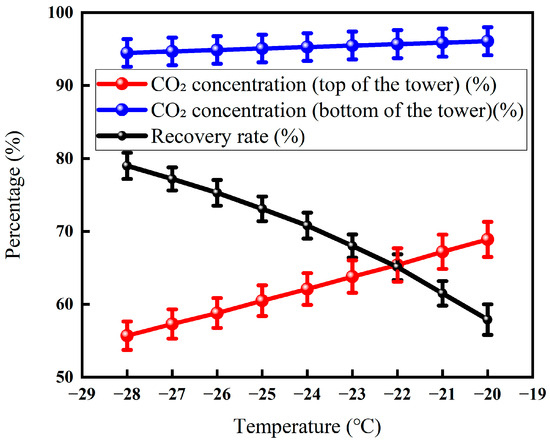
Figure 11.
Effect of liquefaction temperature on CO2 recovery (Test conditions: CO2 concentration: 60%, pressure: 5 MPa, flow rate: 50 L/min, retentate gas pressure: 1.0 MPa, osmotic gas pressure: 0.5 MPa, cryogenic fractionation pressure: 3 MPa).
As can be seen from Figure 12, the flow rate at the bottom of the tower increased from 7.3 L·min−1 to 10.1 L·min−1, and the proportion also increased from 49.7% to nearly 68.7%. After the temperature is below −25 °C, the proportion of flow at the bottom of the tower increases to 68.7%. The reason is that the viscosity of the liquid phase increases at low temperatures, which causes the resistance to flow to increase [34]. At the same time, the cooling demand for the system increases exponentially, resulting in increased compressor power consumption and equipment risk.
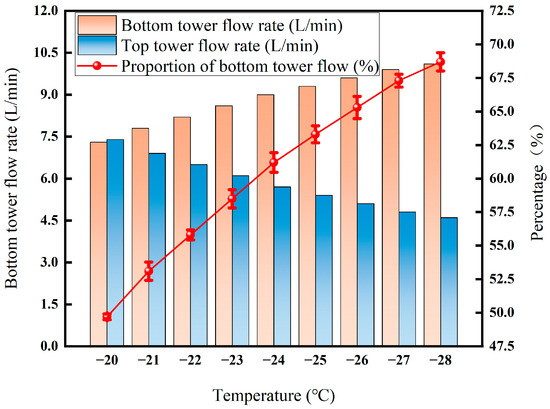
Figure 12.
Effect of liquefaction temperature on flow rate.
The comprehensive results show that the recovery rate can be improved by reducing the temperature, but the energy consumption and safety costs of excessive cooling need to be avoided. Our experiments show that the operating temperature of membrane–cryogenic distillation-coupled decarburization should be controlled around −25 °C to achieve a balance between thermodynamic gain and engineering risk.
3.3.2. Effect of Liquefaction Pressure on Membrane–Cryogenic Coupling Decarburization Results
In Figure 13, the liquefaction pressure rises from 2 MPa to 4.5 MPa, and the recovery rate rises sharply and then stabilizes: the recovery rate is only about 12% due to the low CO2 partial pressure and insufficient liquefaction driving force. Entering the medium-pressure section of 2.5–3.5 MPa, the CO2 pressure exceeded the critical value. The solubility and driving force of the liquid phase increased simultaneously, and the recovery rate quickly rose to about 73% and then increased to the high-pressure section of >3.5 MPa; the light components were accompanied by condensation, the viscosity of the liquid phase increased, and the mass transfer resistance increased, resulting in a slowdown in the recovery rate. Therefore, around 3.5 MPa is the optimal operating point for offshore platforms to ensure high-purity CO2 products while taking into account energy consumption and equipment size.
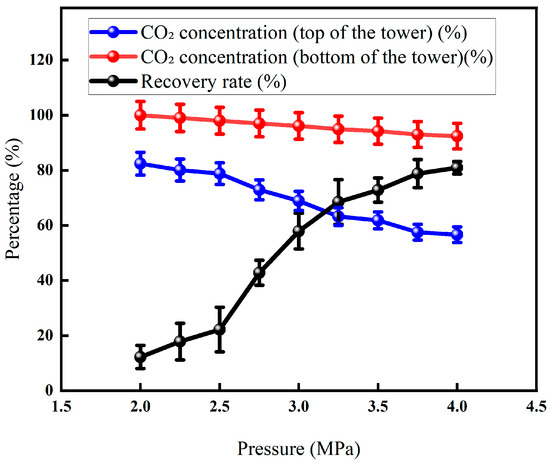
Figure 13.
Effect of liquefaction pressure on CO2 recovery (Test conditions: CO2 concentration: 60%, pressure: 5 MPa, flow rate: 50 L/min, excretion gas pressure: 1.0 MPa, permeable gas pressure: 0.5 MPa, cryogenic fractionation temperature: −20 °C).
Figure 14 shows that the flow rate at the bottom of the tower presents three stages. At 2–2.5 MPa, due to the low partial pressure of CO2 and the small liquefaction volume, only about 18% of the gas converts into the liquid phase; the partial pressure of CO2 in the 2.5–3.5 MPa range crosses the critical liquefaction point, the liquid phase volume increases rapidly to 50% under the synergistic effect of solubility and air pressure inhibition, and the removal efficiency was significantly improved. Upon a further increase to 3.5–4 MPa, elevated condensation of light components and increased liquid-phase viscosity resulted in a flow rate of up to 70%, but with a slowed growth rate and insignificant recovery gain.
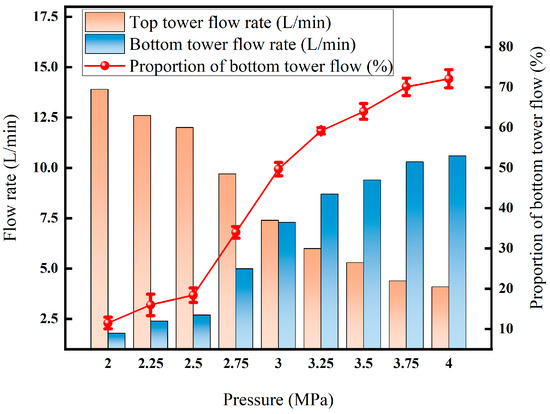
Figure 14.
Effect of liquefaction pressure on flow rate.
Taken together, controlling the liquefaction pressure at about 3.5 MPa can maintain a >72% recovery rate while preventing surges in mass transfer resistance and energy consumption due to concurrent condensation of light components.
3.3.3. Effect of Tower Top Temperature on Membrane-Cryogenic Coupling Decarburization Results
Figure 15 shows that with the gradual increase in the temperature of the tower roof from about −27 °C to −17 °C, the CO2 concentration at the top of the tower rises steadily from 60.1% to about 68.9%, while the CO2 concentration in the tower cauldron remains basically around 95% and remains almost unchanged. At the same time, the recovery rate showed a flat downward trend, with the lowest point at about −20 °C and the lowest recovery rate of about 57.9%, while the recovery rate remained stable thereafter. The overall trend demonstrates that a rise in the top temperature lowers the reflux ratio, which compromises the scrubbing of heavy components and allows more CO2 (the light component) to be carried over into the distillate, thereby raising its concentration. The stability of the reboiler temperature guarantees the high purity of the bottom product. There is a critical temperature point of about −20 °C, and the subsequent recovery loss is no longer significant, which provides a basis for optimizing the operation; the performance of the whole system is constrained by the membrane separation characteristics and the gas–liquid phase balance in the fractionation column.
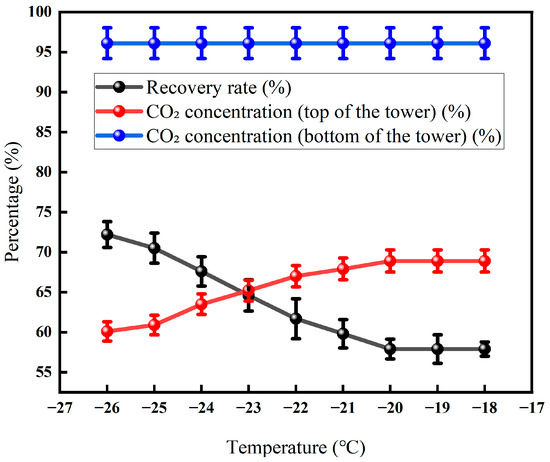
Figure 15.
Effect of tower roof temperature on CO2 recovery (Test conditions: CO2 concentration: 60%, pressure: 5 MPa, flow rate: 50 L/min, seepage gas pressure: 1.0 MPa, permeable gas pressure: 0.5 MPa, low-temperature fractionation liquefaction temperature and tower kettle temperature: −20 °C, pressure: 3 MPa).
In Figure 16, the flow rate at the bottom of the tower decreased from 9.1 L·min−1 to 7.3 L·min−1 with the increase in temperature, while the flow rate at the top of the tower slowly increased from 5.1 L·min−1 to 7.4 L·min−1 with the increase in temperature. The proportion decreased from 61.9% to 49.7% and remained stable at about 49% at temperatures above −20 °C. The increase in temperature leads to a decrease in the reflux ratio; the enrichment of light components in the tower to the top of the tower is enhanced; and more gas-phase light components directly enter the top of the tower product, promoting the flow rate of the top of the tower. The liquid phase at the bottom of the tower decreases due to the reduction in light components and the enrichment of recombinant components, and the flow rate decreases accordingly. After −20 °C, the proportion of flow at the top of the tower remained stable at 49.7%, confirming the equilibrium between light-component escape and recombinant condensation. At this time, the influence of temperature on the gas–liquid phase distribution and component transfer tends to be saturated, and the separation efficiency of the membrane–fractionation coupling process enters a stable range.
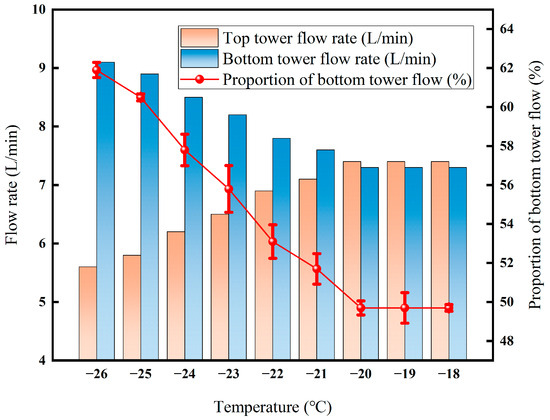
Figure 16.
Effect of tower roof temperature on flow rate.
In general, the increase in temperature weakens the CO2 capture capacity of the condensation section, causing more carbon components that should be enriched in the tower to escape from the top of the tower in the form of the gas phase. In practice, it is necessary to weigh the relationship between the purity improvement of the tower pot and the total recovery rate of the system; the temperature of the top of the tower should be set at the inflection point of −20 °C to avoid irreversible loss of light components caused by heating up, and at the same time maintain the steady-state balance of the membrane–fractionation coupling process.
3.3.4. Effect of Kettle Temperature on Membrane–Cryogenic Distillation Coupling Decarburization Results
It can be seen from Figure 17 that with the increase in the temperature of the tower kettle, the CO2 recovery rate continues to decrease, from 57.9% at −20 °C to 48.8% at −4 °C. Although the CO2 concentration in the exhaust gas at the top of the tower only increased slightly from 68.9% to 70.6%, it intuitively reflected that more CO2 escaped, which should have been captured. Meanwhile, the CO2 concentration in the reboiler liquid approached 100%, causing the product purity to peak. This came at the cost of a higher reboiler heat load. The increased cooling requirement and lower recovery rate ultimately compromised the overall removal efficiency.
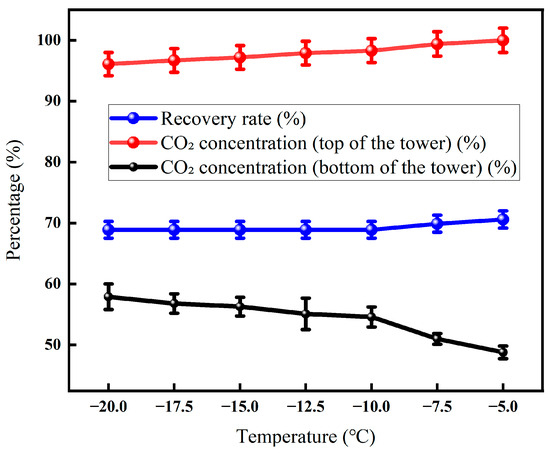
Figure 17.
Effect of the temperature of the tower kettle on CO2 recovery (Test conditions: CO2 concentration: 60%, pressure 5 MPa, flow rate: 50 L/min, seepage gas pressure: 1.0 MPa, osmotic gas pressure: 0.5 MPa, low-temperature fractionation liquefaction temperature and tower top temperature: −20 °C, pressure: 3 MPa).
As shown in Figure 18, when the temperature rises from −20 °C to −5 °C, the flow rate at the top of the tower slowly rises by about 7.4 L/min to 8.8 L/min and remains almost unchanged, while the flow rate at the bottom of the tower decreases rapidly from about 7.3 L/min to 5.9 L/min, and the proportion of the flow at the bottom of the tower drops from nearly 49.7% to about 40%. This indicates that after the temperature rises, the ability of the condensation section to trap reconstitutions in the gas weakens, resulting in more components that should enter the liquid phase at the bottom of the tower escaping from the top of the tower with the uncondensed gas [34]. The sudden drop in the flow rate at the bottom of the tower and the synchronous contraction of the proportion of the bottom of the tower directly reflect the attenuation of the driving force of low-temperature condensation, tilting the recovery load of the system toward the membrane side, which also explains the phenomenon where the decarburization recovery rate decreases significantly with the increase in temperature. This demonstrates that the attenuation of the condensation driving force at a high temperature causes more CO2 to be trapped in the gas phase.
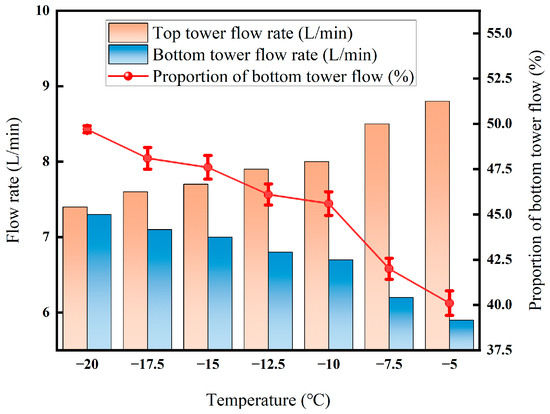
Figure 18.
Effect of temperature on CO2 recovery rate.
Generally, a higher reboiler temperature increases the bottom product concentration but comes at the expense of recovery efficiency. The temperature of the kettle should be maintained at a low temperature of around −20 °C; the temperature should be carefully increased when purity is required, and the recovery rate decay should be monitored simultaneously to avoid excessive loss of light components.
3.3.5. Membrane–Cryogenic Coupling Energy Consumption Analysis
The energy consumption of membrane-coupled low-temperature fractionation experiments under different conditions was preliminarily analyzed. Figure 19 shows that the unit energy consumption of permeate gas liquefaction under different operating parameters is significantly different under the same membrane separation conditions.
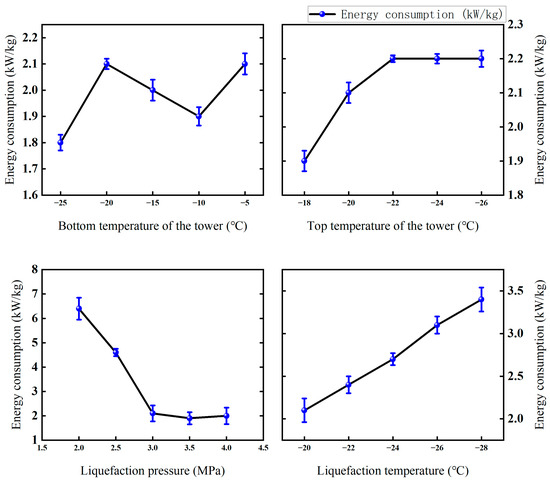
Figure 19.
Effects of different factors on energy consumption of the membrane-coupled low-temperature fractionation test (Test conditions: CO2 concentration: 60%; pressure: 5 MPa; flow rate: 50 L/min; permeable gas pressure: 0.5 MPa; permeable gas flow rate: 14.7 L/min; osmotic CO2 concentration: 82.4%).
Liquefaction temperature is the most significant factor affecting energy consumption. With the decrease in liquefaction temperature from −20 °C to −28 °C, the system energy consumption increased significantly from 2.1 kW/kg to 3.4 kW kg−1, an increase of 61.9%. This is mainly due to the fact that the lower liquefaction temperature significantly increases the cooling load and energy consumption of the system [35].
The effect of liquefaction pressure on energy consumption is non-linear. During the pressure increase from 2.0 MPa to 3.5 MPa, the energy consumption decreased significantly from 6.4 kW/kg CO2 to 1.9 kW/kg CO2. However, when the pressure is further increased to 4.0 MPa, the energy consumption increases slightly to 2.0 kW/kg CO2. This indicates that there is an optimal pressure interval, where the very low product flow leads to extremely high unit energy consumption, while the increase in compressor power consumption at high pressure is the dominant factor.
The temperature change at the top of the tower has a relatively limited impact on energy consumption, and the temperature drop from −18 °C to −26 °C only leads to a slow increase in energy consumption from 1.9 kW/kg CO2 to 2.2 kW/kg CO2. This is mainly due to the increase in cooling energy consumption and the increase in product output.
The effect of temperature change on energy consumption in the tower kettle is not consistent. The lowest energy consumption values occur at −25 °C (1.8 kW/kg CO2) and −10 °C (1.9 kW/kg CO2), and rise to 2.1 kW/kg CO2 at −5 °C. This reflects the complexity of changes in the temperature of the kettle and the inverse change in product purity and yield, resulting in changes in energy consumption.
In summary, liquefaction temperature and pressure are the main factors affecting liquefaction energy consumption, while the temperature of the tower top and tower cauldron has relatively little effect. By optimizing the operating parameters, the liquefaction pressure is controlled at around 3.5 MPa. The temperature of the tower kettle is controlled in the range of −10 °C to −25 °C to avoid excessive reduction in the liquefaction temperature, and the energy consumption of the system can be effectively controlled at a low level.
4. Conclusions
In this study, a membrane separation–low-temperature fractionation coupling process was innovatively proposed to eliminate high-concentration CO2 (40~70%) in associated gas in offshore oil and gas fields, and its technical feasibility was verified by systematic experiments. The conclusions are as follows:
This study demonstrates that the membrane–cryogenic distillation coupling process effectively treats high-CO2-associated gas from offshore platforms. The membrane unit enriches CO2 to >80%, while the cryogenic unit achieves ≥95% purity with a system recovery of 80%. Optimal conditions include a liquefaction pressure of 3.5 MPa and temperatures around −25 °C. The integrated system reduces energy consumption and footprint by 30% compared to conventional methods, offering a viable path for offshore decarburization.
Challenges for system integration and adaptability in extreme conditions include the following: membrane durability under fluctuating CO2 concentrations and pressures; cryogenic unit performance under marine motion and limited space; and energy management under variable feed gas conditions. Future work will focus on modular design and dynamic control strategies to enhance robustness.
Author Contributions
Conceptualization, L.M. and J.L.; methodology, Y.C.; data curation, X.W.; writing—review and editing, P.C.; writing—review and editing, J.L. and Z.P.; supervision and funding acquisition, J.L. All authors have read and agreed to the published version of the manuscript.
Funding
This work was supported by the Vertical Project of the State-owned Assets Supervision and Administration Commission of Shaanxi Province [Grant Number ZXZJ-2024-012], “Research and Development of Room Temperature Decarburization Technology and Equipment”.
Data Availability Statement
The raw data supporting the conclusions of this article will be made available by the authors upon request.
Conflicts of Interest
Author Xuanzhang Wu was employed by Liaohe Oilfield Environmental Engineering Company, PetroChina. The remaining authors declare that the research was conducted in the absence of any commercial or financial relationships that could be construed as a potential conflict of interest.
References
- Tetley, M.J.; Braulik, G.T.; Lanfredi, C.; Minton, G.; Panigada, S.; Politi, E.; Zanardelli, M.; di Sciara, G.N.; Hoyt, E. The important marine mammal area network: A tool for systematic spatial planning in response to the marine mammal habitat conservation crisis. Front. Mar. Sci. 2022, 9, 841789. [Google Scholar] [CrossRef]
- Yang, Y.; Yan, F.; Yang, Y.; Chen, Y. Evaluating provincial carbon emission characteristics under China’s carbon peaking and carbon neutrality goals. Ecol. Indic. 2023, 156, 111146. [Google Scholar] [CrossRef]
- Lin, B. China’s high-quality economic growth in the process of carbon neutrality. China Finance Econ. Rev. 2022, 11, 3–22. [Google Scholar] [CrossRef]
- International Energy Agency. CO2 Emissions in 2022 [Report]; IEA: Paris, France, 2023; Available online: https://www.iea.org/reports/CO2-emissions-in-2022 (accessed on 9 May 2025).
- Li, B.; Guo, Z.; Zheng, L.; Du, M.; Han, J.; Yang, C. Effect of modified EVA-GMX bionic nanocomposite pour point depressants on the rheological properties of waxy crude oil. Fuel 2026, 403, 136025. [Google Scholar] [CrossRef]
- Acevedo Blanco, V.L.; Gallo, W.L.R. Diagnosis of GHG Emissions in an Offshore Oil and Gas Production Facili-ty. Gases 2024, 4, 351–370. [Google Scholar] [CrossRef]
- Zhang, C.; Sheng, M.; Hu, Y.; Yuan, Y.; Kang, Y.; Sun, X.; Wang, T.; Li, Q.; Zhao, X.; Wang, Z. Efficient facilitated transport polymer membrane for CO2/CH4 separation from oilfield associated gas. Membranes 2021, 11, 118. [Google Scholar] [CrossRef]
- Liu, Z.; Sun, G.; Chen, Z.; Ma, Y.; Qiu, K.; Li, M.; Ni, B.-J. Anchoring Cu-N active sites on functionalized polyacrylonitrile fibers for highly selective H2S/CO2 separation. J. Hazard. Mater. 2023, 450, 131084. [Google Scholar] [CrossRef]
- Wang, S.; Li, X.; Wu, H.; Tian, Z.; Xin, Q.; He, G.; Peng, D.; Chen, S.; Yin, Y.; Jiang, Z.; et al. Advances in high permeability polymer-based mem-brane materials for CO2 separations. Energy Environ. Sci. 2016, 9, 1863–1890. [Google Scholar] [CrossRef]
- Burkett, V. Global climate change implications for coastal and offshore oil and gas development. Energy Policy 2011, 39, 7719–7725. [Google Scholar] [CrossRef]
- Dong, J.; Asif, Z.; Shi, Y.; Zhu, Y.; Chen, Z. Climate change impacts on coastal and offshore petroleum infrastructure and the associated oil spill risk: A review. J. Mar. Sci. Eng. 2022, 10, 849. [Google Scholar] [CrossRef]
- Grainger, D.; Bindingsbø, A.; Brekke, O.; De Koeijer, G.; Nilssen, O.; Pettersen, J. Reducing CO2 Emissions from Offshore Oil and Gas Production. In Proceedings of the 15th Greenhouse Gas Control Technologies Conference, Abu Dhabi, United Arab Emirates, 15–18 March 2021; pp. 15–18. [Google Scholar]
- Dou, L.; Sun, L.; Lyu, W.; Wang, M.; Gao, F.; Gao, M.; Jiang, H. Trend of global carbon dioxide capture, utilization and storage industry and challenges and countermeasures in China. Pet. Explor. Dev. 2023, 50, 1246–1260. [Google Scholar] [CrossRef]
- Tao, M.; Xu, N.; Gao, J.; Zhang, W.; Li, Y.; Bernards, M.T.; Shi, Y.; He, Y.; Pan, H. Phase-change mechanism for capturing CO2 into an environmentally benign nonaqueous solution: A combined NMR and molecular dynamics simulation study. Energy Fuels 2018, 33, 474–483. [Google Scholar] [CrossRef]
- Kothandaraman, A. Carbon Dioxide Capture by Chemical Absorption: A Solvent Comparison Study. Ph.D. Thesis, Massachusetts Institute of Technology, Cambridge, MA, USA, 2010. [Google Scholar]
- Li, S.; Wu, N.; Gong, Y.; Wang, L. Progress of research on purification of CH4 from a CH4/CO2/N2 mixture by pressure swing adsorption. Sustain. Energy Fuels 2024, 8, 5077–5090. [Google Scholar] [CrossRef]
- Hasan, H.F.; Al-Sudani, F.T.; Albayati, T.M.; Salih, I.K.; Hharah, H.N.; Majdi, H.S.; Saady, N.M.C.; Zendehboudi, S.; Amari, A.; Gheni, S.A. Solid adsorbent material: A review on trends of post-combustion CO2 capture. Process Saf. Environ. Prot. 2024, 182, 975–988. [Google Scholar] [CrossRef]
- Yin, N.-H.; Louvat, P.; Thibault-De-Chanvalon, A.; Sebilo, M.; Amouroux, D. Iron isotopic fractionation driven by low-temperature biogeochemical processes. Chemosphere 2023, 316, 137802. [Google Scholar] [CrossRef] [PubMed]
- Wang, H.; Song, S.; Zhang, Z.; Xin, L.; Wang, T.; Wang, L. A novel process of low-temperature fractionation combined with extractive distillation for H2S removal from natural gas. Sep. Purif. Technol. 2022, 302, 122102. [Google Scholar] [CrossRef]
- Kotowicz, J.; Chmielniak, T.; Janusz-Szymańska, K. The influence of membrane CO2 separation on the efficiency of a coal-fired power plant. Energy 2010, 35, 841–850. [Google Scholar] [CrossRef]
- Li, B.; Qi, B.; Han, J.; Qian, X.; Yang, C.; Cai, S. Separation of oil–water emulsion by biomimetic polycaprolactone tannic acid hydrophilic modified membranes. Fuel 2025, 386, 134242. [Google Scholar] [CrossRef]
- Li, B.; Qian, X.; Han, J.; Qi, B.; Yang, C.; Jiao, T. A mussel bionic-inspired membrane based on modified waste masks for oily wastewater treatment. Colloids Surf. A Physicochem. Eng. Asp. 2024, 708, 136066. [Google Scholar] [CrossRef]
- Zheng, Y.; He, S.; Gao, L.; Li, S. Analysis and evaluation of the energy saving potential of the CO2 chemical absorption process. Int. J. Greenh. Gas Control 2021, 112, 103486. [Google Scholar] [CrossRef]
- Kopac, T. Emerging applications of process intensification for enhanced separation and energy efficiency, environmentally friendly sustainable adsorptive separations: A review. Int. J. Energy Res. 2021, 45, 15839–15856. [Google Scholar] [CrossRef]
- Song, C.; Liu, Q.; Deng, S.; Li, H.; Kitamura, Y. Cryogenic-based CO2 capture technologies: State-of-the-art developments and current challenges. Renew. Sustain. Energy Rev. 2019, 101, 265–278. [Google Scholar] [CrossRef]
- Liang, B.; He, X.; Hou, J.; Li, L.; Tang, Z. Membrane separation in organic liquid: Technologies, achievements, and opportunities. Adv. Mater. 2019, 31, e1806090. [Google Scholar] [CrossRef] [PubMed]
- Belaissaoui, B.; Le Moullec, Y.; Willson, D.; Favre, E. Hybrid membrane cryogenic process for post-combustion CO2 capture. J. Membr. Sci. 2012, 415, 424–434. [Google Scholar] [CrossRef]
- Zeng, L.; Liu, Q.; Luo, L.; Liu, L.; Tang, K. Enhancement mechanism of an improved liquid membrane using selective permeation retardant for heavy metal ions separation. Chem. Eng. Sci. 2019, 201, 1–14. [Google Scholar] [CrossRef]
- Berstad, D.; Anantharaman, R.; Nekså, P. Low-temperature CO2 capture technologies–Applications and potential. Int. J. Refrig. 2013, 36, 1403–1416. [Google Scholar] [CrossRef]
- Kalmykov, D.; Balynin, A.; Yushkin, A.; Grushevenko, E.; Sokolov, S.; Malakhov, A.; Volkov, A.; Bazhenov, S. Membranes based on PTMSP/PVTMS blends for membrane contactor applications. Membranes 2022, 12, 1160. [Google Scholar] [CrossRef]
- Scholes, C.A.; Kanehashi, S.; Stevens, G.W.; Kentish, S.E. Water permeability and competitive permeation with CO2 and CH4 in perfluorinated polymeric membranes. Sep. Purif. Technol. 2015, 147, 203–209. [Google Scholar] [CrossRef]
- Bi, Y.; Ju, Y. Review on cryogenic technologies for CO2 removal from natural gas. Front. Energy 2022, 16, 793–811. [Google Scholar] [CrossRef]
- Yang, W.; Li, S.; Li, X.; Liang, Y.; Zhang, X. Analysis of a new liquefaction combined with desublimation system for CO2 separation based on N2/CO2 phase equilibrium. Energies 2015, 8, 9495–9508. [Google Scholar] [CrossRef]
- Wang, K.; Xia, M.; Yao, Q.-F.; Xie, Y.-X.; Zhong, L.; Li, Y.-Z.; Yang, W.; Luo, Y.-J. Low-temperature rheological properties and viscosity equation of Al/HTPB suspension system. Energetic Mater. Front. 2024, 5, 96–104. [Google Scholar] [CrossRef]
- Baik, W.; Yun, R. In-tube condensation heat transfer characteristics of CO2 with N2 at near critical pressure. Int. J. Heat Mass Transf. 2019, 144, 118628. [Google Scholar] [CrossRef]
Disclaimer/Publisher’s Note: The statements, opinions and data contained in all publications are solely those of the individual author(s) and contributor(s) and not of MDPI and/or the editor(s). MDPI and/or the editor(s) disclaim responsibility for any injury to people or property resulting from any ideas, methods, instructions or products referred to in the content. |
© 2025 by the authors. Licensee MDPI, Basel, Switzerland. This article is an open access article distributed under the terms and conditions of the Creative Commons Attribution (CC BY) license (https://creativecommons.org/licenses/by/4.0/).