Abstract
Graphene can effectively enhance the impedance matching and dielectric loss capability in dielectric loss/magnetic loss dual-mechanism absorbers, and influences the overall magnetic loss capability of the material through various mechanisms. In this study, carbonyl iron/graphene composite absorbers with different graphene contents were prepared using the solution blending method. An absorbing honeycomb structure was fabricated using aramid honeycomb as the substrate via an impregnation process. The complex permittivity and complex permeability of the materials were tested within the 2–18 GHz frequency band. The absorption capability and mechanism were comprehensively analyzed alongside the reflection loss curves. Furthermore, the influence of graphene on the magnetic loss capability of the dual-mechanism absorbing material was investigated through VSM tests. Research indicates that the content and distribution of graphene can enhance the dispersion of CIP. In addition to a significant improvement in dielectric loss, it also exerts an influence on magnetic loss through a synergistic mechanism.
1. Introduction
With the development of modern warfare towards informatization and intelligence, military aircraft will face more complex airspace detection environments [1,2,3,4]. It is particularly difficult to avoid large-scale, multi-band, and all-directional high-precision radar searches, significantly reducing survivability. Existing aircraft often use various stealth materials or devices to counter radar detection, such as designing absorbing coatings or structures based on the principles of dielectric loss and magnetic loss of electromagnetic waves by materials, which have been verified in some third and fourth-generation aircraft. Among them, ferromagnetic materials such as carbonyl iron (CIP) [5,6], Co [7,8], Ni [9], Fe3O4 [10,11], and nanomagnetite particles [12] have been widely reported as magnetic loss absorbing materials. CIP is widely used due to its high saturation magnetization and high permeability, especially exhibiting good absorption performance in the low-frequency band.
As research on CIP has deepened in recent years, researchers have further improved its magnetic loss performance through methods like pressing and ball milling [13]. However, single magnetic loss materials still have significant limitations. Firstly, CIP exhibits a low complex permittivity. Although magnetic loss is the main absorption mechanism, its low complex permittivity results in poor impedance matching performance, severely limiting its absorption bandwidth [14]. Secondly, overly single ferromagnetic materials are also not conducive to the lightweight design and practical application of absorbing materials and structures. Based on this, researchers have proposed using composite absorbing materials containing dielectric materials for balance and have achieved significant improvements in existing studies [15,16,17].
Graphene possesses excellent dielectric properties and a unique spatial structure, making it a typical representative of dielectric loss materials. It also has very low density and can be composited with organic polymers, metals and their oxides, demonstrating outstanding performance in recent research [18,19]. When composited with CIP, graphene can compensate for the lack of dielectric properties and enhance the impedance matching performance of the material. Furthermore, studies have indicated that the addition of graphene also affects the magnetic properties of the material. By controlling the size, shape, and distribution of the two materials and optimizing the interfacial connection between them, the electromagnetic properties of the composite material can be greatly altered [20]. Among the reported materials, the core–shell structure formed by graphene coating CIP particles has a unique electromagnetic effect, beneficial for adjusting the impedance matching and absorption performance of the material [21].
To further enhance the absorption performance of the material and amplify the mutual influence between graphene and CIP, an impregnation process can be used to prepare absorbing honeycomb structures. Honeycomb structures possess the mechanical characteristics of being lightweight and high-strength. Meanwhile, multiple internal structural interface reflections and absorptions enhance the utilization efficiency of the absorbent [22]. This paper uses aramid honeycomb as the substrate and epoxy resin as the filler to prepare a CIP/Graphene dual-mechanism absorbing material with a honeycomb absorbing structure. Through characterization of morphology, electromagnetic properties, and absorption performance, the influence of graphene on the electromagnetic properties of the composite absorbing material was studied, and the coupling mechanism between graphene and CIP was investigated.
2. Experiments and Simulations
2.1. Experimental Materials
Carbonyl iron powder (CIP, d50 = 5.000 μm) was purchased from Suzhou Youyan New Material Industry Co., Ltd., Suzhou, China. Graphene (monolayer rate > 90%, diameter/thickness ≈ 15,000) was purchased from Shenzhen Suiheng Technology Co., Ltd., Shenzhen, China. Aramid honeycomb (cell size 2.75 mm, density 48 kg/m3, 100 × 100 × 5 mm) was purchased from Nanjing Bohaosheng New Materials Co., Ltd., Nanjing, China. E-51 epoxy resin (epoxy value 0.48–0.54, viscosity 11,000–14,000 mPa·s) was purchased from Kunshan Jiulimei Electronic Materials Co., Ltd., Kunshan, China. Polyetheramine curing agent (D400) was purchased from Guangzhou Jinrui Chemical Co., Ltd., Guangzhou, China.
2.2. Preparation of CIP/Graphene Dual-Mechanism Absorbing Honeycomb
The solution blending method was used. Epoxy resin, CIP, and graphene in certain proportions were mixed. Stirring was performed at 900 rpm for 1 h at room temperature using an overhead stirrer. After the sample was uniformly mixed, it was transferred and subjected to 15 min of ultrasonic treatment. Subsequently, the D400 curing agent was added at an epoxy-to-curing agent mass ratio of 6:10, followed by mechanical stirring for 30 min. After uniform mixing, another 15 min ultrasonic treatment was performed. The mixture was transferred to a Petri dish with a radius of 15 cm. The aramid honeycomb was placed in the dish and immersed for 30 min, during which it was flipped to ensure uniform impregnation. After draining on a wire mesh, it was placed in a 100 °C oven for curing, again flipping it periodically to ensure uniformity. The experimental flowchart is shown in Figure 1, and the actual quantities of chemicals used are listed in Table 1.
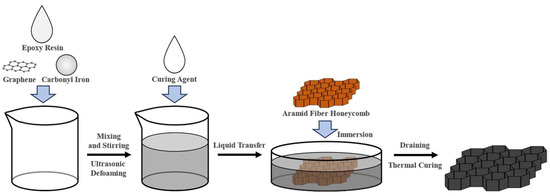
Figure 1.
Schematic diagram of the sample preparation process.

Table 1.
Chemical Usage in the Experiment.
In addition to the samples shown in Table 1, an additional plane plate sample with a graphene content of 1.5 wt.% and a 150 × 150 × 5 mm specification was prepared in the experiment to characterize the necessity of honeycomb structure.
2.3. Testing and Characterization
The cross-sectional morphology of the samples was observed using a Scanning Electron Microscope (SEM, FEI Scios 2 HiVac, USA). Elemental distribution at different positions was detected by combining Energy Dispersive X-ray Spectroscopy line scanning (EDS Line Scan). Raman mapping (Horiba LabRAM HR Evolution, Japan) was used to assist in judging the uniformity of the distribution of absorbing components. The thermal stability and oxidation resistance of the material were detected by thermogravimetric analysis (TG, NetzschTGA209F1, Germany). The absorbing performance of the composite structure was analyzed using a Vector Network Analyzer (VNA, Agilent 8363A). The complex permittivity and complex permeability of the materials were further analyzed within the test frequency range of 2–18 GHz, and the plane plate sample was 8–18 GHz. The magnetic induction of the composite absorbers was tested using a Vibrating Sample Magnetometer (VSM, LakeShore 7404, USA). Changes in hysteresis loss for different samples were analyzed via hysteresis loops, with a test range of ±20 kOe, step size of 1 Oe, and rate of 10 Oe/s.
3. Results and Analysis
3.1. Characterization and Analysis of Absorbing Honeycomb Materials
3.1.1. Morphological and Structural Characterization
Figure 2 shows cross-sectional SEM images of the CIP/Graphene dual-mechanism honeycomb composite structures with different graphene contents. The bright white spheres are CIP spheres embedded in the epoxy resin. Areas without CIP attachment are the aramid fiber honeycomb walls. In the sample with low graphene content (0.5 wt.%), significant aggregation and accumulation of CIP particles are clearly observed, and the particle size after accumulation is notably larger than in other samples. When the graphene content increases to 1.5 wt.%, influenced by factors such as interfacial polarity matching and resin inhibiting sedimentation, graphene adsorbs extensively onto the surfaces of CIP spheres, forming an outer coating and establishing a large-scale conductive network [23]. The elemental intensity curves obtained via EDS line scanning in Figure 3 also indicate a high distribution of carbon elements near the CIP spheres. This coating effect reduces the agglomeration attraction between CIP spheres, improves their dispersion within the resin matrix, effectively ensures the uniform distribution of the absorbing medium, prolongs the effective electromagnetic wave loss path, and enhances the absorption effect. Furthermore, the formation of the graphene conductive network may also influence the transformation or movement modes of magnetic domains and electrons in CIP, facilitating the adjustment of electromagnetic absorption performance.
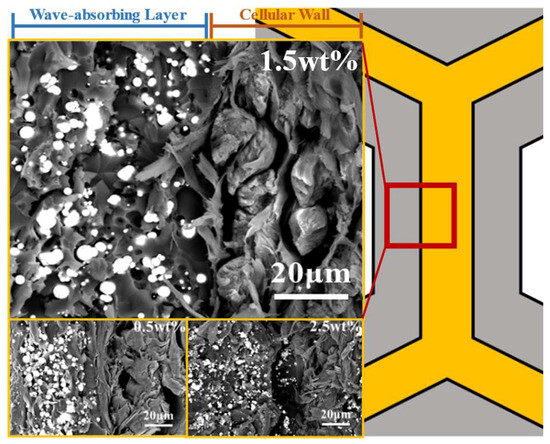
Figure 2.
SEM images of the cross-section of the CIP/Graphene composite absorbing honeycomb structure.
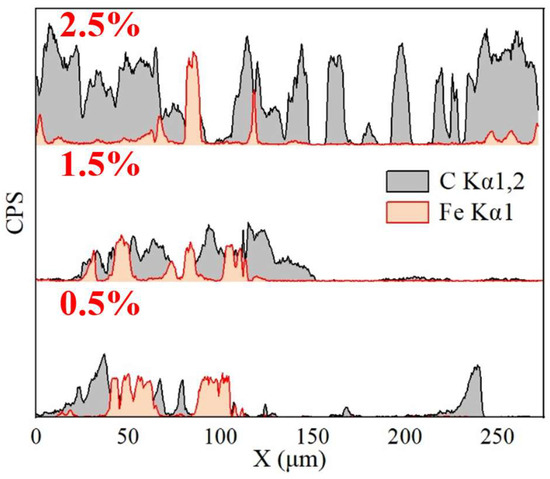
Figure 3.
Intensity curves of C and Fe elements in samples with different graphene contents.
When the graphene content further increases to 2.5 wt.%, although the elemental intensity curves still show an outer coating structure on the CIP spheres, the carbon content within the resin matrix increases sharply, the overall distribution becomes disordered, and some graphene penetrates into the inner walls of the aramid honeycomb. Excessive graphene distribution leads to a significant increase in agglomeration, manifested as abnormal peaks in the carbon elemental intensity curve. This, in turn, weakens the spatial connection between CIP and graphene, potentially leading to a reduction in the effective absorption bandwidth and absorption performance.
Additionally, Raman mapping tests were performed on samples with graphene contents of 0.5 wt.%, 1.5 wt.%, and 2.5 wt.%. The tests covered an area of 20 × 20 μm with a step size of 1 μm. The peak intensity distribution, based on the G-band intensity at each measurement point, is shown in Figure 4. In the map, brighter areas represent graphene-rich regions, while darker areas indicate regions with sparse or absent graphene. Comparison reveals that in the 0.5 wt.% sample with lower graphene content, there are large areas lacking graphene coverage, and no particularly bright spots are observed. This indicates that the graphene content is insufficient to achieve complete distribution throughout the sample, suggesting that the conductive network is only established in limited regions, resulting in a relatively minor enhancement in dielectric and absorption performance. In contrast, the 1.5 wt.% sample exhibits a more uniform graphene distribution. However, the 2.5 wt.% sample shows numerous bright spots and dark patches, indicating significant graphene agglomeration within the material.
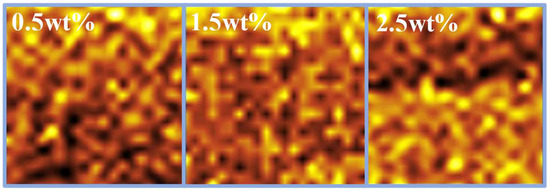
Figure 4.
G-band peak intensity distribution of samples with different graphene contents.
3.1.2. Stability and Oxidation Resistance Characterization
The stability of the absorbing material was evaluated via thermogravimetric analysis. The experiment was conducted under an air atmosphere, with the temperature raised from room temperature to 900 °C at a heating rate of 10 °C/min. The results are shown in Figure 5.
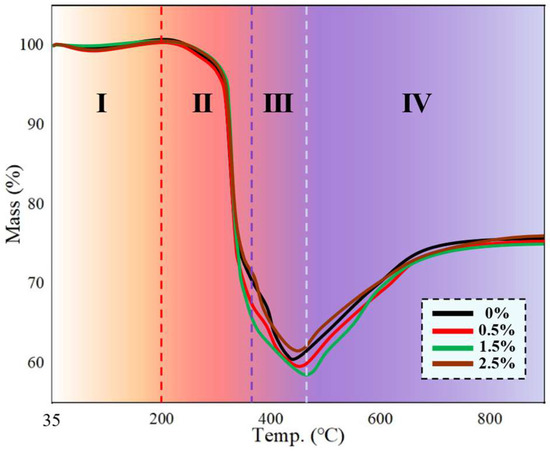
Figure 5.
Thermogravimetric analysis curves of samples with different graphene contents, and divided into four stages based on the degree and rate of weight loss.
The heating process of the carbonyl iron/graphene/epoxy resin composite can be broadly divided into four stages. In the first stage (35–200 °C), the mass loss of the material is primarily caused by the evaporation of surface-adsorbed water molecules and oil contaminants. In the second stage (200–350 °C), the epoxy resin begins to undergo thermal oxidative decomposition, leading to a rapid decline in the overall mass of the material. In the third stage (350–550 °C), oxidation of carbonyl iron gradually starts, forming ferrite that remains within the material. During this phase, resin decomposition continues, resulting in an overall mass decrease, though the mass loss rate slows, as seen in the figure. In the fourth stage (550–900 °C), the resin is almost completely decomposed, while the carbonyl iron is further oxidized by oxygen in the air, causing the total sample mass to increase until the mass gain rate levels off around 750 °C. Comparing different samples, it is evident that the incorporation of graphene significantly increases the onset oxidation temperature of carbonyl iron. This indicates that the graphene coating effectively reduces the direct contact area between the carbonyl iron spheres and the resin, thereby enhancing the oxidation resistance and stability of the absorber—an important factor in testing and application. Furthermore, graphene itself exhibits good thermal conductivity, allowing effective transfer of localized heat to the graphene network, which also contributes to the thermal stability of the material.
3.2. Analysis of Honeycomb Structure Absorbing Performance
3.2.1. Absorption Mechanism of Honeycomb Structure and Composite Absorbent
In the absorbing honeycomb structure, both sides of the aramid honeycomb walls are coated with the composite absorbent. Its structure and absorption mechanism are shown in Figure 6a. Due to the periodicity and complexity inside the honeycomb structure, incident electromagnetic waves are inevitably dispersed by the honeycomb walls. Some electromagnetic waves transmit through the honeycomb wall and continue to illuminate the next layer, while others are reflected onto surrounding honeycomb walls. Whether transmitted or reflected, the electromagnetic waves lose part of their energy when passing through the absorbent. After multiple transmission and reflection processes, the original electromagnetic wave is dispersed and absorbed within the honeycomb structure, greatly improving the utilization efficiency of the absorbent, while the overall structure benefits from being lightweight due to its structural characteristics.
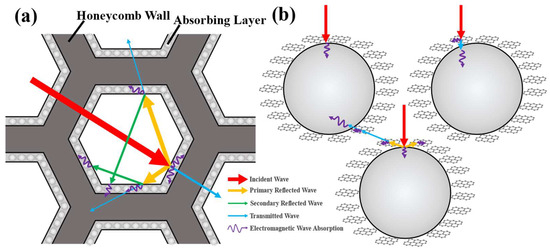
Figure 6.
(a) Schematic diagram of the honeycomb structure absorption principle. (b) Schematic diagram of the graphene-coated structure absorption principle.
Regarding the absorption mechanism of the composite absorbent, electromagnetic wave absorption can be summarized into three modes, as shown in Figure 6b. When electromagnetic waves enter the absorbing layer, a portion directly contacts the CIP surface and is absorbed by CIP through magnetic loss. Another portion first contacts the surface graphene structure, undergoing dielectric loss through interface polarization. The remaining electromagnetic waves then penetrate to the graphene–CIP interface and are absorbed again by CIP. For electromagnetic waves with impedance mismatch, upon contact with the graphene–CIP interface, besides a small amount of transmission, they also emit reflected waves into the surroundings. Most of these reflected waves are captured and absorbed by the surface graphene or absorbed by other adjacent coated structures in a similar manner.
3.2.2. Electromagnetic Performance Analysis
In the performance analysis of absorbing materials, the complex permittivity (εr = ε′ − jε″) and complex permeability (μr = μ′ − jμ″) are often used to characterize the dielectric loss and magnetic loss capabilities of the material, respectively, and to jointly analyze the impedance matching performance. In the experiment, the Nicolson-Ross-Weir (NRW) method was used to invert the transmission and reflection coefficients of the material to obtain the complex permittivity and complex permeability. The specific derivation process is as follows:
Let Γ represent the reflection coefficient at the material interface, and T represent the transmission coefficient of the material. When the incident voltage is 1, S11 and S21 correspond to the total reflected voltage and total transmitted voltage, respectively. Thus:
Set . Solving Equations (1) and (2) simultaneously gives:
The selection of the “±” sign in Equation (4) is determined based on whether is less than 1. Since the reflected power of a wave-absorbing material cannot exceed the incident power, the “-” sign is used in the vast majority of cases. Furthermore, according to the equivalent two-port theory and the definition of the propagation constant:
where represents the relative impedance of the material, γ is the propagation constant, is the electromagnetic wave frequency, and are the complex permittivity and complex permeability of the material, respectively. According to the definition of relative impedance:
where is the intrinsic impedance of the material, and is the free space impedance. Using the reflection constant , Equations (5), (7) and (8) can be rearranged to give:
Solving gives:
where represents the free space propagation constant. Substituting Equations (3) and (6) yields the numerical expressions for complex permittivity and complex permeability:
Based on the above derivation process, the measured S-parameters were inverted using data software to obtain the relevant electromagnetic parameter curves shown below.
Figure 7a shows the complex permittivity values of the honeycomb absorbing structure at different frequencies. The real part (ε′) characterizes the polarization capability of the material and is related to the overall impedance matching. The imaginary part (ε″) characterizes the loss characteristics of the material and is an important basis for evaluating the dielectric loss capability. The most direct addition of graphene is to increase the conductive loss of the material. At the same time, the addition of graphene introduces three types of interfaces into the composite material: the graphene–resin interface, the CIP–graphene interface, and the CIP–resin interface. Among these, the graphene–resin interface and the CIP–resin interface are conductor–insulator interfaces. Due to the significant difference in electrical conductivity between the two materials, electrons accumulate at the interface on the side of the conductive material under an alternating electromagnetic field, forming dipoles at the interface and ultimately leading to interface polarization, as illustrated in Figure 7b. Overall, after adding graphene, the permittivity values of the absorbing material increased significantly. The real part increased to around 4.5–6, and the imaginary part remained around 1, compensating for the deficiency of pure CIP material in dielectric loss. Gradually increasing the graphene content in the absorbing material resulted in an initial increase followed by a decrease in both the real and imaginary parts of the complex permittivity. Notably, Sample No. 7 with 3 wt.% graphene content exhibited an abnormal increase in the real part and a decrease in the imaginary part. This is attributed to the extensive graphene coverage enhancing the coating effect on CIP spheres, which reduced the polarization at the CIP–resin contact interfaces. Additionally, all samples exhibited peaks within the frequency range of 5–7 GHz. The real part showed a slow increasing trend after the peak, while the imaginary part was relatively flatter. In general, the increase in complex dielectric constant can be attributed to the increase in conductive loss and interfacial polarization effect after the addition of graphene, and the microwave absorption performance of the material is optimized under the condition of good magnetic loss performance [24,25].
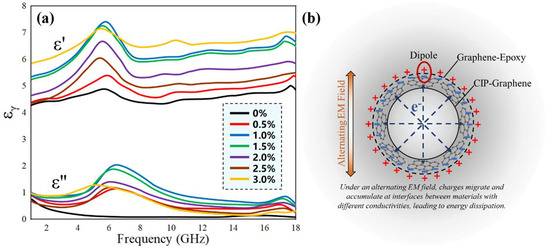
Figure 7.
(a) Complex permittivity curves of samples with different graphene contents; (b) Schematic diagram of interface polarization.
Figure 8a shows the complex permeability values of the honeycomb absorbing structure at different frequencies. The real part (μ′) characterizes the magnetization capability of the material in a magnetic field, while the imaginary part (μ″) characterizes the ability to dissipate magnetic field energy through eddy current loss, hysteresis loss, etc. [13]. Since graphene itself is non-magnetic, its influence on the permeability and magnetic loss capability of the samples is relatively small, as shown by almost identical magnetic performance across different samples in the figure. However, it can still produce some indirect effects through the dual-mechanism synergistic effect. Overall, the real part of complex permeability showed a slow decreasing trend with increasing frequency, with values remaining around 0.8–1.5. The imaginary part remained almost stable around 0.5, with a small peak in the 5–8 GHz band. In the mid-frequency range (6–12 GHz), the imaginary part of permeability initially increased and then decreased with increasing graphene content. When a small amount of graphene was added, it reduced the agglomeration and sedimentation of CIP, improving the orderliness of magnetic moment arrangement and indirectly enhancing the hysteresis loss capability. However, as the graphene content further increased, as illustrated in Figure 8b, graphene accumulated extensively on the surface of CIP spheres, forming a conductive network throughout the material. This network induced eddy currents and created an electromagnetic shielding effect on the CIP, further hindering the coupling between magnetic domains. Ultimately, this led to the occurrence of the skin effect, reducing the overall magnetic loss capability of the material.
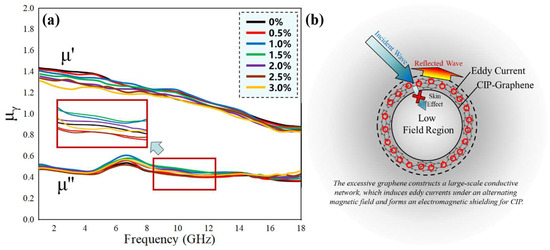
Figure 8.
(a) Complex permeability curves of samples with different graphene contents; (b) Skin effect induced by excessive graphene.
In addition to the above factors, the quality and density of the absorbing structure also have a non-negligible effect on the loss of electromagnetic waves. Table 2 records the honeycomb wall thickness and quality of each group of samples. Due to the difficulty in precisely controlling identical structural specifications during the impregnation process and the challenges associated with calculating density accurately, the average wall thickness and mass/average wall thickness ratio are used to equivalently replace the actual wall thickness and density. Comparing the data in the table, it is obvious that the addition of graphene enhances the adhesion of the absorbing agent on the honeycomb wall, and its average wall thickness and quality are significantly higher than those of the graphene-free samples. In addition, with the increase in graphene content, the density of the sample increases continuously, which means the increase in the effective absorbing component, and directly leads to the increase in the complex dielectric constant of the material. However, too high dielectric constant will cause the wave impedance of the material to be much lower than the spatial free impedance, causing serious impedance mismatch. At this time, most of the electromagnetic waves are reflected on the surface of the material and cannot enter the interior to be dissipated. Therefore, although the intrinsic loss ability of the material is very strong, its macroscopic wave absorption performance deteriorates, which is also reflected in the wave absorption performance in the next section.
Table 2.
Quality and Density Parameters of Impregnated Honeycombs with Different Graphene Contents.
3.2.3. Absorbing Performance Analysis
The microwave absorption performance of the materials was tested using the free-space method. When electromagnetic waves are incident on the surface of an absorbing material, a portion is reflected from the surface, while another portion penetrates into the material and is partially dissipated. This can be expressed by the formula:
where A represents the absorption rate of the material, R represents the reflectivity of the electromagnetic waves, and T represents the transmissivity. In practical applications, stealth absorbing materials often have a metal back-reflector plate added at the bottom. Therefore, the transmissivity of the material can be considered as 0, and the formula is modified to:
Under this model, the absorption rate of the material depends only on the reflection of electromagnetic waves. Therefore, the electromagnetic absorbing performance can be measured by the reflection loss (RL). Substituting the reflectivity with S-parameters and comparing with the reflection loss formula:
where S11 is the reflection parameter, and RL represents Reflection Loss. Generally, an absorbing material is considered to have excellent stealth performance when its electromagnetic absorption rate exceeds 90%, corresponding to a reflection loss value below −10 dB. Figure 9a shows the reflection loss curves of samples with different graphene contents.
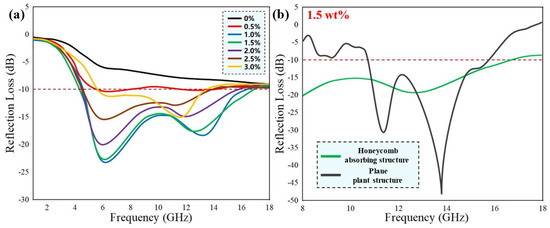
Figure 9.
(a) Reflection loss curves of samples with different graphene contents; (b) Reflection loss curves of honeycomb structure and plane plate structure when graphene accounts for 1.5 wt.%.
According to the test results, it is evident that when only CIP is used as the absorber filler, although it possesses some absorbing capability, it falls far short of the requirements for stealth absorption. After adding graphene, the composite material gains additional dielectric loss capability, and the absorption performance improves significantly. Two distinct absorption peaks appear, one around 5–6 GHz and another around 12–14 GHz [26]. The first absorption peak is dominated by the magnetic hysteresis loss of CIP. The MWS (Maxwell–Wagner–Sillars) effect generated by the addition of graphene further amplifies the influence of magnetic loss in this frequency band. The second absorption peak is not present in the sample without graphene, indicating that it is a new absorption peak dominated by dielectric loss. The conductive network formed by graphene facilitates free electron migration and dipole orientation polarization. In addition, it is not difficult to see from Figure 9b that the absorption bandwidth of the honeycomb absorbing structure is much wider than that of the plane plate structure. This is because the honeycomb structure effectively prolongs the propagation path of the incident wave by making multiple internal reflection and scattering of the incident wave in the cell, thereby significantly enhancing the absorption effect. In contrast, the plane plate structure can only have outstanding absorbing ability in the frequency band close to the quarter-wavelength theory (11.18–15.87 GHz) according to its own thickness. Since the graphene content significantly affects the impedance matching performance of the material, the reflection loss first increases and then decreases as the graphene content increases. When the graphene addition is 1 wt.%, the sample exhibits the best absorption intensity, with a reflection loss of −23.14 dB at 6.35 GHz (corresponding to an absorption rate of approximately 99.51%). When the graphene addition is 1.5 wt.%, the sample exhibits the widest absorption bandwidth, achieving effective absorption exceeding 90% over a broad bandwidth of 12.41 GHz (4.825–17.235 GHz), with the overall absorption intensity only slightly lower than the previous group. With further increases in graphene content, on one hand, agglomeration occurs, leading to the formation of localized high-conductivity regions. On the other hand, it exerts a higher degree of electromagnetic shielding on the internal CIP spheres. Ultimately, this leads to a deterioration in the impedance matching performance of the material, resulting in a gradual decrease in absorption intensity and effective absorption bandwidth.
3.2.4. Magnetic Loss Variation Analysis
To more investigate the influence of graphene content on the magnetic loss capability of the absorbing material, VSM tests were performed on the samples, resulting in the hysteresis loops shown in Figure 10. It is worth mentioning that the VSM test cannot directly characterize the dynamic magnetic loss capability at GHz frequency, but the results can reveal the change in the microstructure of ferromagnetic materials under the external field, which enables us to correlate the static magnetic parameters with the dynamic absorbing ability.
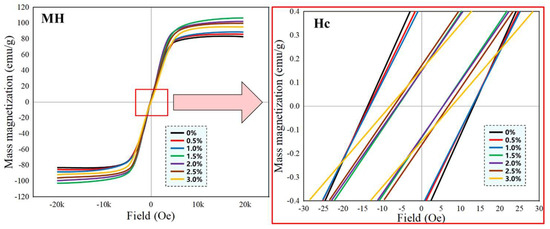
Figure 10.
Hysteresis loops of samples with different graphene contents.
Although the overall magnetic properties of the material are still dominated by CIP, the test results indicate that the graphene content has a noticeable influence on the magnetic properties. The specific mechanism is illustrated in Figure 11. Due to the high content of CIP, the hysteresis loops of all samples exhibit high saturation magnetization and low coercivity, characteristic of soft magnetic materials. According to the M-H curves, the graphene content significantly affects the saturation magnetization (Ms) of the samples. Without graphene, the saturation magnetization was relatively low, only 84.56 emu/g. When the graphene content increased to 1.5 wt.%, the saturation magnetization reached its maximum value of 99.94 emu/g. Further increasing the graphene content led to a decrease in saturation magnetization. When the graphene content was low (0–1.5 wt.%), it adsorbed onto and dispersed the CIP surface, resulting in a more uniform distribution of CIP. This increased the effective volume fraction of magnetic particles and improved the orderliness of magnetic domain arrangement, thereby enhancing the overall magnetic response. This means that more small-sized CIP particles can be excited by the inherent natural resonance and exhibit stronger magnetic loss at the macro level. Simultaneously, the interface polarization generated between graphene and CIP promoted the concentration of the local magnetic field, indirectly improving magnetization efficiency, ultimately manifested as an increase in saturation magnetization. When the graphene content was high (2–3 wt.%), excessive graphene began to form larger conductive networks, directly hindering the transmission and cooperative arrangement of magnetic moments between CIP particles. This reduced the continuity of magnetic domains. Alternating magnetic fields also began to induce eddy currents within the conductive networks, generating opposing magnetic fields inside the CIP particles. This skin effect confined magnetization mainly to the surface of the magnetic particles, while internal magnetization was significantly disturbed. The eddy current distributed around the CIP particles will obviously affect its high-frequency magnetic response, and the different magnetization rates of each sample in the Hc image also indirectly support the existence of this interface coupling.
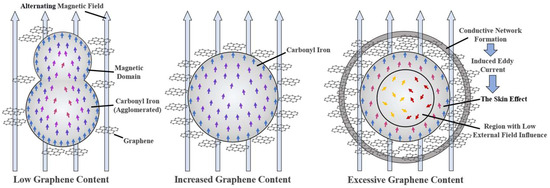
Figure 11.
Microscopic performance of coating structure in electromagnetic field under different graphene content.
Regarding coercivity (Hc), the graphene content roughly divided the coercivity of the materials into two groups. At low graphene content (0–1 wt.%), due to more significant agglomeration and sedimentation of CIP, the mutual influence between magnetic particles was greater, resulting in relatively higher coercivity. When the graphene content was further increased (1.5–3 wt.%), the required coercivity decreased significantly and exhibited a trend of first decreasing and then increasing. The sample with 1.5 wt.% graphene showed the lowest coercivity (approximately 6.51 Oe). Additionally, it was noted that the magnetization rate of samples with high graphene content was significantly slower, manifested as a reduced slope in the magnetization curve. The higher the graphene content, the slower the magnetization rate. The reasons for the change in coercivity are similar to those for saturation magnetization, both resulting from the dynamic competition between the dispersive effect caused by the graphene conductive network formation and the skin effect. In summary, VSM results show that graphene optimizes the microstructure of the magnetic phase by improving CIP dispersion and reducing the resistance of magnetic domain motion. This structural optimization creates favorable conditions for achieving more efficient natural resonance magnetic loss in the GHz band. This potential magnetic loss enhancement, combined with the dielectric loss directly contributed by graphene, is maximized by the honeycomb structure, and finally achieves the observed excellent microwave absorption performance.
4. Conclusions
This paper prepared CIP/Graphene composite absorbers with different graphene contents using the solution blending method and fabricated dielectric loss/magnetic loss dual-mechanism composite absorbing honeycombs using the impregnation method. Through a series of characterization and performance testing methods, the excellent absorbing capability of the composite structure was verified, and the dual-mechanism synergistic principle was analyzed. Emphasis was placed on investigating the influence of graphene on magnetic properties under synergy. The specific achievements are as follows:
- (1)
- Through combined SEM testing and EDS line scanning, the distribution of graphene and CIP in the epoxy resin was analyzed. It was found that graphene significantly alleviated the agglomeration and sedimentation of CIP particles. Under the effect of interfacial phenomena, it formed an outer coating on the CIP spheres, thereby constructing an internal conductive network and enhancing the dielectric loss capability.
- (2)
- Utilizing a Vector Network Analyzer via the free-space method, the absorbing performance of the materials was tested. The complex permittivity and complex permeability were derived by inverting the S-parameters. The absorbing structure incorporating graphene achieved the highest reflection loss of −23.14 dB, corresponding to an absorption rate of 99.51%, and exhibited the broadest bandwidth stealth absorbing capability of 12.41 GHz. The addition of graphene compensated for the material’s dielectric loss capability and slightly enhanced the hysteresis loss capability of CIP through the interfacial polarization effect. However, excessive graphene weakened the magnetic connection between CIP particles, and the resulting electromagnetic shielding effect further reduced the hysteresis loss effect.
- (3)
- VSM testing was used to further characterize the magnetic properties of the materials and analyze the role of graphene in the synergy. Through the dispersion of CIP particles and the formation of its own conductive network, graphene increased the saturation magnetization and reduced the coercivity and magnetization rate within a certain range. On one hand, graphene effectively dispersed CIP particles, making the magnetic domain distribution more uniform and increasing the effective proportion of magnetic particles, thereby enhancing the overall hysteresis capability. On the other hand, the formation of the conductive network progressively enhanced the skin effect of CIP particles, confining magnetization more to the interface between graphene and CIP. This resulted in incomplete magnetization of the core of CIP particles, reducing their magnetization effectiveness. These two effects jointly influenced the magnetic properties of the material, ultimately leading to an initial increase followed by a decrease in hysteresis loss capability.
Author Contributions
Conceptualization, Y.S.; methodology, C.S.; validation, C.S., X.F., Y.W., H.W., J.H. and Z.Z.; writing—original draft preparation, C.S.; writing—review and editing, Y.S.; funding acquisition, Y.S. All authors have read and agreed to the published version of the manuscript.
Funding
The authors acknowledge financial support from the National Key Research and Development Program of China (2024YFE0212500), National Natural Science Foundation of China (U2341264, 52405199), Natural Science Foundation of Jiangsu Province (No. BK20241428), Project Funded by China National Postdoctoral Program for Innovative Talents (BX20240482), Project Funded by China Postdoctoral Science Foundation (2024M754127), Research Fund of State Key Laboratory of Mechanics and Control for Aerospace Structures (Nanjing University of Aeronautics and Astronautics) (MCAS-I-0324G03), Foundation of State Key Laboratory of Aerodynamics (SKLA-2024-FKFT-4-002).
Institutional Review Board Statement
Not applicable.
Informed Consent Statement
Not applicable.
Data Availability Statement
The data presented in this study are available within the article.
Conflicts of Interest
The authors declare no conflicts of interest.
References
- Majdzadeh-Ardakani, K.; Holl, M. Nanostructured materials for microwave receptors. Prog. Mater. Sci. 2017, 87, 221–245. [Google Scholar] [CrossRef]
- Meng, F.; Wang, H.; Huang, F.; Guo, Y.; Wang, Z.; Hui, D.; Zhou, Z. Graphene-based microwave absorbing composites: A review and prospective. Compos. Part B Eng. 2018, 137, 260–277. [Google Scholar] [CrossRef]
- Quan, L.; Qin, F.; Estevez, D.; Wang, H.; Peng, H. Magnetic graphene for microwave absorbing application: Towards the lightest graphene-based absorber. Carbon 2017, 125, 630–639. [Google Scholar] [CrossRef]
- Jing, X.; Su, H.; Shen, L.; Mao, Z.; Jia, C. Adaptive Radar Detection in the Clutter and Noise Cover Pulse Jamming Environment. Signal Process. 2023, 205, 108852. [Google Scholar] [CrossRef]
- Yang, R.; Xiao, X.; Liao, W.; Liu, T. A wide-angle broadband dual-polarization electromagnetic absorbing structure based on the carbonyl iron powder/polydimethylsiloxane composites. J. Magn. Magn. Mater. 2024, 598, 172058. [Google Scholar] [CrossRef]
- Li, C.; Wang, X.; Liu, X.; Zhang, J.; Bi, S.; Hou, Z. Broadband and strong microwave absorption combining excellent EMI shielding of VGCF/carbonyl iron composites derived from synergistic magnetic and dielectric losses. Carbon 2023, 214, 118383. [Google Scholar] [CrossRef]
- Liu, C.; Feng, Y.; Sun, H.; Hu, Q.; Xiao, H.; Guo, X.; Zhang, H. High-performance SiBCN/Fe-Co-Ni fibers: From broadband absorption to stealth antenna design. Compos. Part B Eng. 2025, 307, 112853. [Google Scholar] [CrossRef]
- He, Y.; Wen, F.; Bai, Y.; Wang, Y.; Chen, R.; Ma, J.; Tian, H.; Gu, Y.; Lian, P.; Yang, H.; et al. Heterostructured MWCNTs@Co-NC@MoSe2/PEEK composites with excellent radar-infrared compatible camouflage. J. Alloys Compd. 2025, 1031, 181120. [Google Scholar] [CrossRef]
- Wei, J.; Zhang, Y.; Li, X.; Hui, J.; Zhang, H.; Lei, W. Multifunctional flower-like Ni particles/silicon carbide nanowires for infrared radar compatible stealth performance. J. Colloid Interface Sci. 2023, 641, 414–427. [Google Scholar] [CrossRef]
- Qiao, M.; Tian, Y.; Li, J.; He, X.; Lei, X.; Zhang, Q.; Ma, M.; Meng, X. Core-shell Fe3O4@SnO2 nanochains toward the application of radar-infrared-visible compatible stealth. J. Colloid Interface Sci. 2022, 609, 330–340. [Google Scholar] [CrossRef]
- Zhu, M.; Li, W.; Yang, S.; Zou, P.; Zhang, Y.; Xu, M.; Li, S.; Tang, X.; Lu, Y.; Lai, K.; et al. Ambient pressure dried polyimide/silica aerogels for efficient radar stealth at high temperature. Compos. Commun. 2025, 56, 102338. [Google Scholar] [CrossRef]
- Qiu, J.; Qiu, T. Fabrication and microwave absorption properties of magnetite nanoparticle-carbon nanotube-hollow carbon fiber composites. Carbon 2015, 81, 20–28. [Google Scholar] [CrossRef]
- Khani, O.; Shoushtaria, M.; Ackland, K.; Stamenov, P. The structural, magnetic and microwave properties of spherical and flake shaped carbonyl iron particles as thin multilayer microwave absorbers. J. Magn. Magn. Mater. 2017, 428, 28–35. [Google Scholar] [CrossRef]
- Dong, J.; Zhou, W.; Wang, C.; Lu, L.; Luo, F.; Zhu, D. Anisotropic particle geometry effect on magnetism and microwave absorption of carbonyl iron/polyimide composites. J. Magn. Magn. Mater. 2019, 491, 165643. [Google Scholar] [CrossRef]
- Zhou, Y.; Xie, H.; Zhou, W.; Ren, Z. Enhanced antioxidation and microwave absorbing properties of SiO2-coated flaky carbonyl iron particles. J. Mater. Sci.-Mater. Electron. 2018, 446, 143–149. [Google Scholar]
- Liu, Y.; Liu, X.; He, C.; Fei, Z.; Zhang, Z.; Yang, Z. Progress of Core Shell Structured Magnetic Composite Wave Absorbing Materials. Surf. Technol. 2018, 4, 72–78. [Google Scholar]
- Tian, H.; Wang, J.; Xia, L.; Wang, B.; Wu, L.; Ning, L.; Wang, X. Research Progress on the Corrosion Resistance and Oxidation Resistance Surface Modification Technology of Carbonyl Iron Absorbent. Mater. Prot. 2024, 57, 82–92+155. [Google Scholar]
- Zou, Y.; Liu, H.; Yang, L.; Chen, Z. The influence of temperature on magnetic and microwave absorption properties of Fe/graphite oxide nanocomposites. J. Magn. Magn. Mater. 2006, 302, 343–347. [Google Scholar] [CrossRef]
- Ye, X.; Ouyang, B.; Yang, C.; Hu, Z.; He, E.; Wu, H. Preparation of graphene-carbonyl iron powder wire and analysis of its wave absorption performance. Acta Mater. Compos. Sin. 2022, 39, 3292–3302. [Google Scholar]
- Zhu, Z.; Sun, X.; Xue, H.; Guo, H.; Fan, X.; Pan, X.; He, J. Graphene-carbonyl iron cross-linked composites with excellent electromagnetic wave absorption properties. J. Mater. Chenistry C 2014, 2, 6582–6591. [Google Scholar] [CrossRef]
- Tang, J.; Ma, L.; Tian, N.; Gan, M.; Xu, F.; Zeng, J.; Tu, Y. Synthesis and electromagnetic properties of PANI/PVP/CIP core-shell composites. Mater. Sci. Eng. B 2014, 186, 26–32. [Google Scholar] [CrossRef]
- Sun, H.; Chen, L.; Gu, Z. Characterization and Design of Honeycomb Absorbing Materials. Solid State Phenom. 2019, 294, 51–56. [Google Scholar] [CrossRef]
- Chen, Y.; Zhang, H.; Huang, Y.; Jiang, Y.; Zheng, W.; Yu, Z. Magnetic and electrically conductive epoxy/graphene/carbonyl iron nanocomposites for efficient electromagnetic interference shielding. Compos. Sci. Technol. 2015, 118, 178–185. [Google Scholar] [CrossRef]
- Wang, T.; Hu, J.; Yang, H.; Jin, L.; Wei, X.; Li, C.; Yan, F.; Lin, Y. Dielectric relaxation and Maxwell-Wagner interface polarization in Nb2O5 doped 0.65BiFeO3–0.35BaTiO3 ceramics. J. Appl. Phys. 2017, 121, 084103. [Google Scholar] [CrossRef]
- Xia, X.; Zhong, Z.; Weng, G. Maxwell–Wagner–Sillars mechanism in the frequency dependence of electrical conductivity and dielectric permittivity of graphene-polymer nanocomposites. Mech. Mater. 2017, 109, 42–50. [Google Scholar] [CrossRef]
- Zhang, Z.; Chen, X.; Wang, Z.; Heng, L.; Wang, S.; Tang, Z.; Zou, Y. Carbonyl iron/graphite microspheres with good impedance matching for ultra-broadband and highly efficient electromagnetic absorption. Opt. Mater. Express 2018, 8, 3319–3331. [Google Scholar] [CrossRef]
Disclaimer/Publisher’s Note: The statements, opinions and data contained in all publications are solely those of the individual author(s) and contributor(s) and not of MDPI and/or the editor(s). MDPI and/or the editor(s) disclaim responsibility for any injury to people or property resulting from any ideas, methods, instructions or products referred to in the content. |
© 2025 by the authors. Licensee MDPI, Basel, Switzerland. This article is an open access article distributed under the terms and conditions of the Creative Commons Attribution (CC BY) license (https://creativecommons.org/licenses/by/4.0/).