Abstract
Growth kinetics and the irreversible deformation of thermally growth oxide (TGO) critically affect the delamination and cracking at the interface of thermal barrier coatings (TBCs). In this study, TGO dynamic growth during furnace cycles is simulated using three different approaches. The stress evolution and damage characteristics near the interface are compared in various TGO growth modes. Furthermore, the influences of TGO creep at high temperatures on the interface delamination and coating failure are also investigated. The results reveal that TGO growth achieved through material transformation (growth mode III) leads to earlier interface delamination compared to element swelling methods (growth mode I and II). Although the stress value in growth mode II is higher than that in growth mode I after all cycles, earlier delamination and spallation occur in mode I due to faster stress accumulation in the initial stage of thermal cycle. Moreover, rapid TGO creep is found to reduce the accumulated stress within the ceramic layer and delay the onset of interface delamination. These findings provide important theoretical insights for the development and life assessment of advanced TBCs.
1. Introduction
Thermal barrier coatings (TBCs) are mainly employed in extreme thermal environments to reduce the erosion of hot components via high-temperature gases [1,2,3]. The traditional structure of TBCs typically consists of the following two layers: (a) thermal insulation top coat (TC), and (b) anti-oxidation bond coat (BC). A thermally grown oxide (TGO) appears between the TC and BC due to BC oxidation at high temperatures. Before the TBC failure, the TGO thickness is usually only a few micrometers [4,5]. Due to the enormous stress brought by the TGO growth, it is crucial for the delamination and cracking near the TC/BC interface to take place.
The atmosphere plasma spraying (APS) is widely used in the aerospace industry due to its higher efficiency and lower cost. In the APS ceramic layer, the lamellae are stacked on top of each other, and different defects are interconnected to form the complex pore network [6,7]. The inter-lamella crack plays a major role in insulation. In addition, the APS coating requires that the TC/BC interface must be rough in order to provide enough bonding strength. During the service, the TGO layer on the rough interface will continue to grow with the thermal cycle, causing a significant growth stress [8,9,10]. Due to the ineffective release of stress, it will accumulate continuously with the TGO growth, ultimately leading to the interface cracking and the coating failure. The morphology changes and interface cracking induced by TGO growth before and after service are shown in Figure 1 [11].
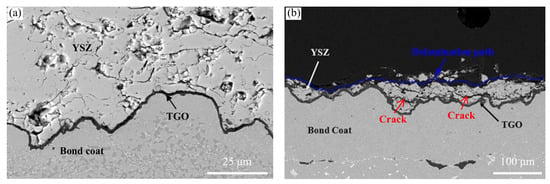
Figure 1.
TGO morphology at the interface in APS-TBC before or after the furnace cycle [11]: (a) initial TGO in a preparation state, and (b) thickening TGO and ceramic spallation after thermal cycle.
TGO thickening usually conforms to the parabolic growth rule. The growth strain is decomposed into two types, one is the thickening growth strain, perpendicular to the interface, and the other is the lateral growth strain, parallel to the interface [12,13]. If the coating is subjected to a gradient thermal cycling test, as the oxide thickens, the coating cracking position gradually shifts from inside the ceramic layer to the vicinity of the interface [11,14]. However, when the coating undergoes an isothermal cycling test, the coating failure always occurs near the interface [11,15]. Therefore, regardless of the type of thermal cycling test, when TGO grows thicker, the delamination and cracking at the interface will occur, which is attributed to the accumulation of the interface stress caused by TGO growth.
In order to elucidate the stress evolution near the interface and the coating failure mechanism caused by TGO growth during thermal cycling, different TGO growth models have been developed. Firstly, without considering its dynamic growth, different TGO thickness models were employed and compared [16,17]. Researchers found that the stress state at the peak and valley began to reverse with the increase in TGO thickness. This method requires the establishment of many computational models during the thermal cycling. Importantly, TGO growth strain is forgotten in the model. Secondly, TGO dynamic growth is simulated by all-element expansion, which is referred to as TGO growth mode I in this study. The stress state and crack propagation behavior near the interface have been widely studied. Different thermal cycle life assessment models have also been established [18,19,20,21,22]. The lateral growth of TGO is recognized as an important factor leading to the coating failure. Thirdly, TGO dynamic growth is simulated by the expansion from only the lowest element row, which is referenced as TGO growth mode II in this paper. In this model, researchers consider that the stress transfer of newly formed oxides will be hindered by previous oxides. The stress distribution and damage in the ceramic layer and at the interface during thermal cycling have been revealed [23,24,25]. Both growth mode I and II can be realized through the development of creep subroutine CREEP or thermal expansion subroutine UEXPAN in ABAQUS [26]. Fourthly, TGO growth is achieved through layer-by-layer material transformation, which is referenced as growth mode III in this study. In this model, the dynamic process of the bonding layer continuously being oxidized to form new oxides is considered. The crack propagation near the TGO layer and coating life have been evaluated [27,28,29,30,31,32]. However, this method has difficulty simulating the BC/TGO interface cracking. Currently, different scholars also choose different TGO growth models based on the convenience of implementation.
TBCs are subjected to high-temperature thermal shock during the service, which results in the coating staying in the high-temperature stage for a long time. At high temperatures, in addition to the ceramic sintering, each layer of the TBC may also undergo an irreversible deformation caused by plasticity or creep [33,34,35,36]. TGO growth in high temperatures brings huge growth stress. When TGO creep occurs simultaneously, the influence of stress changes on the coating failure needs to be systematically investigated. The influence of TGO creep on the internal stress characteristics and crack driving force in ceramic layers has been investigated [37,38,39,40].
TGO growth between the TC and BC causes significant stress accumulation near the interface. Different TGO growth methods lead to differences in stress amplitude and distribution, which may affect the accuracy of coating life prediction. However, the effects of different TGO growth modes on the stress evolution and interface damage of coatings have not been compared and studied. In addition, irreversible deformations of TGO also seriously affect the stress distribution in the coating. However, the influences of TGO creep on the evolution of interface damage in different TGO growth modes have not been systematically analyzed. In this study, three different TGO growth modes are employed and compared to investigate the stress characteristics and damage distribution near the interface. The influences of the TGO creep on the stress evolution and interface delamination are also further explored. The relevant results will provide important support for the development of advanced coatings and precise life assessment in future.
2. Numerical Model Development
2.1. Geometry, Constraint, and Mesh
In this paper, 0020 the yttria partially stabilized zirconia (YSZ) ceramic layer is prepared using the APS method, and the MCrAlY (M = Co, Ni, Co and Ni) bonding layer is prepared using cold spraying (CS). A representative volume element (RVE) is extracted from the TBC sample, as shown in Figure 2. The thicknesses of the ceramic layer, bonding layer, and substrate are 250 μm, 150 μm, and 3 mm, respectively. The TGO layer between the TC and BC is considered to be a uniform, dense, defect-free, and pure α-Al2O3. The complex influence of mixed oxides on the coating failure is ignored in this study. The initial thickness of the TGO is 1 μm. The interface morphology is approximated using a cosine curve, which has been adopted by many scholars [12,13,16,28,33]. Its wavelength and amplitude are 60 μm and 15 μm, respectively. The left boundary of the model is constrained in the x direction to restrict the movement of nodes. The bottom is constrained in the y direction to prevent rigid body displacement. A periodic boundary condition, implemented using multiple constraints (MPC), is applied to the right boundary (see Figure 2a). This can ensure that all nodes on the right boundary have the same displacement in the x direction, while nodes in the y direction can move freely. The cohesive surface method in ABAQUS software (2023 version) is used to simulate the damage and delamination of the TC/TGO interface. The damage variable CSDMG is used to characterize the cracking state, with 0.0 representing no cracking and 1.0 representing a complete cracking [37,41]. Surface-to-surface contact behavior is used. The contact properties involve normal hard contact and tangential frictionless.
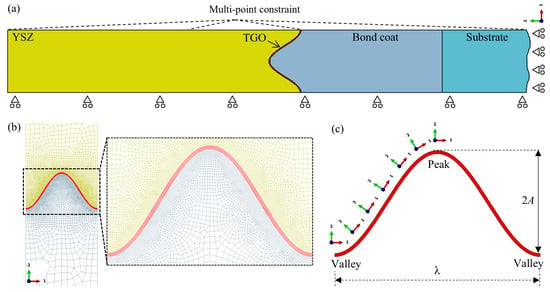
Figure 2.
Periodic computing model extracted from the TBC specimen: (a) overall state and constraint conditions, (b) mesh refinement region near the interface, and (c) TGO growth directions.
The entire model is meshed with pure quadrilateral mesh. The interface is refined with a typical grid size of 0.15 μm (see Figure 2b). The stress distribution based on the generalized plane strain element (CPEG4R) is consistent with the three-dimensional model [22]. Therefore, this type of element has been widely used to simulate the stress distribution and failure in TBCs [19,23,25], and is adopted in this study. The initial TGO is divided into six element layers along the thickness direction. TGO growth is characterized by two directions, one is thickening growth perpendicular to the interface, and the other is lateral growth parallel to the interface. Because the cosine curve is y-axis symmetric, the growth direction of the TGO is only marked on the left half wave (see Figure 2c).
In this study, it is believed that the TGO growth only occurs at the high-temperature holding stage during the thermal cycle. Although TGO growth usually follows the parabolic growth rule, it can be considered as linear growth in a relatively short time period [11,14]. The thermal expansion subroutine UEXPAN is used to apply growth strain. In order to compare the effects of the TGO growth modes on stress evolution and interface delamination, three different growth modes are adopted, as shown in Figure 3. The mesh changes before and after the TGO growth are given. Growth modes I and II are achieved through the element swelling of the initial TGO. Growth mode III uses the field variable subroutine USDFLD to control the transformation of the BC material to the TGO, and has been used in previous work [32,42]. The geometric large deformation is turned on. Logarithmic strain is used to calculate the TGO growth strain. In order to ensure that the TGO layer has the same thickness after all cycles, the TGO thickening strain in three modes is calculated theoretically. The thickening growth strain in growth mode III refers to the previous work [32]. Therefore, the thickening growth strain is as follows: 1.83 × 10⁻² in growth mode I, 4.6 × 10⁻² in growth mode II, and 4.3 × 10⁻³ in growth mode III. The lateral growth of the TGO is an extremely important factor affecting the TBC failure in thermal–mechanical conditions, usually taken as 1/10 of the thickening growth strain. The purpose of this study is to compare the effects of three growth modes. Therefore, the lateral growth strain of the TGO is set to 1.83 × 10⁻³ in all models.
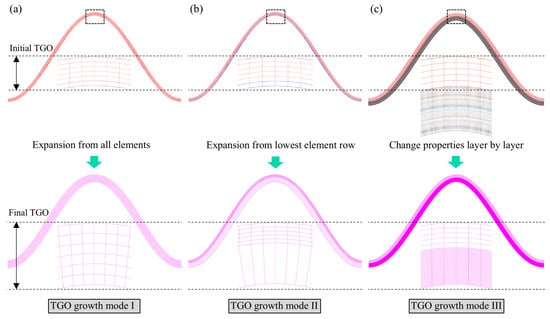
Figure 3.
Three different TGO growth modes and element swelling states: (a) growth mode I, (b) growth mode II, and (c) growth mode III.
2.2. Material Property
All materials are regarded as homogeneous and isotropic. Due to its brittle nature, the ceramic layer is considered an elastic material. The bond layer is treated as an elastic–plastic–viscous material. The substrate has a minor influence on the ceramic layer and interface stress and is thus considered as an elastic–viscous material. TGO growth stress is limited by the high-temperature yield deformation. Moreover, the influence of the TGO creep on the coating failure will be investigated in this study. Therefore, the TGO layer is also regarded as an elastic–plastic–viscous material. The material parameters of each layer are temperature-dependent [43,44], and the basic parameters are displayed in Table 1. The bond layer adopts an ideal plastic model with high-temperature yield strength of 100 MPa. The yield strength of TGO is set to 1 GPa at high temperatures, to limit the TGO growth stress to a reasonable range [19,34]. The yield strengths of the bond layer and ceramic layer are presented in Table 2. The creep behavior of each layer follows the Norton equation, which is as follows:
= A·σn. To study the effect of the TGO creep on the stress and crack evolution, its creep factor is changed within a certain range. However, the creep of the bonding layer and substrate remains unchanged in all models. The simulation of creep behavior is achieved through the creep subroutine CREEP. The creep parameters of each layer are also temperature-dependent [36,45], as shown in Table 3.

Table 1.
Young modulus E, Poisson’s ratio ν, and thermal expansion coefficient α related to temperature [43,44].

Table 2.
Yield strength with temperature variation [19,34].

Table 3.
Creep factor and exponent [36,45].
2.3. Thermal Loading History
The thermal cycling experiment is an important reference indicator for inspecting the service life of TBCs. The samples in this study are subjected to a furnace cycle test, which means that the entire sample is in a uniform temperature environment during service. The temperature changes during the thermal cycling are shown in Figure 4. The model first undergoes a cooling stage, then is subjected to multiple thermal cycles, and finally returns to high temperature. Each thermal cycle consists of the following three stages: the heating, holding, and cooling stages. The holding time is 2 h. This study does not consider the influence of the heating and cooling rates on the stress state in the coating. A total of 50 cycles are examined. The cycle number is represented by N.
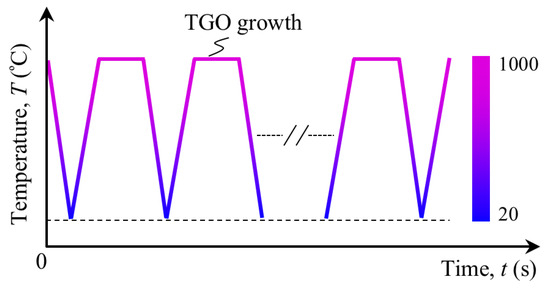
Figure 4.
Temperature change vs. time in the furnace test.
2.4. Dynamic Crack Growth Modeling
The evaluation of the crack evolution behavior at the interface or in the ceramic layer during service is an important means of assessing the coating’s lifespan. The delamination and cracking state at the TC/TGO interface are investigated in this study. The cohesive surface method is an important tool commonly used for analyzing interface engineering [26,37], and it is adopted in this study. This method is based on damage mechanics and can investigate the onset and propagation of interface cracks. A maximum nominal stress criterion is used to estimate the initiation of interface damage. It can be expressed using the following formula:
where
and
represent the critical contact stresses for damage initiation in the normal and tangential directions, respectively. When the contact stress in a direction exceeds the corresponding critical value, crack initiation will occur. In ABQUS software, the damage initiation is evaluated using the variable CSMAXSCRT. As the thermal cycle continues, the energy at the crack tip accumulates further. When the energy satisfies the power–law equation, shown below, crack propagation will occur.
where
and
represent the critical fracture energies in the normal and tangential directions, respectively. Variable α represents the exponent. Here it is equal to 1.0 [23,37]. The crack propagation at the interface is evaluated using the damage degree variable CSDMG. When this value is equal to 0.0, it represents that the initiated crack will not further propagate. As this value increases, the trend of the crack propagation enhances. When this value is equal to 1.0, crack propagation occurs.
In this study, the critical stresses in the normal and tangential directions used for evaluating delamination cracking at the TC/TGO interface are 100 MPa and 200 MPa, respectively [41,46]. The critical fracture energies are 20 J/m2 and 40 J/m2, respectively [47,48]. In addition, the calculated cohesive stiffness in the two directions is 5.0 × 10⁶ MP/mm and 1.0 × 10⁷ MP/mm, respectively. A viscosity coefficient of 1.0 × 10⁻⁵ is used to improve the convergence of crack propagation simulation.
3. Result and Discussion
3.1. Validation of TGO Growth Mode
Given that non-planar interfaces may undergo a local deformation due to the occurrence of growth strain, a plane model is used to validate the effectiveness of the three TGO growth modes. In addition, each layer is considered as a purely elastic material in this section. The final thickness and mesh changes in the TGO after all cycles are displayed in Figure 5. The TGO thickness can be calculated using the coordinate difference in the y direction. It can be observed that the final thickness of the TGO in these three growth modes is 2.5 μm, which proves that the growth model and thickening growth strain used in the calculation are reasonable measures for comparing the effects of the TGO growth modes on the coating failure.
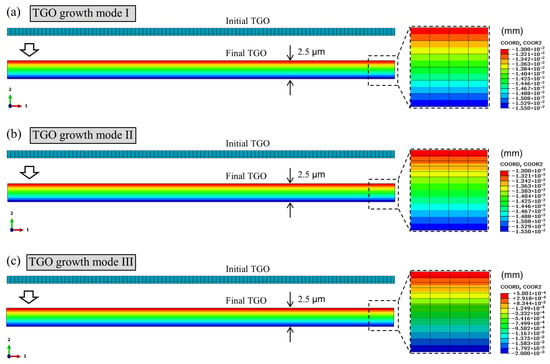
Figure 5.
TGO thickness after 50 cycles in different growth modes in a plane model (only TGO thickening growth and pure-elastic materials): (a) growth mode I, (b) growth mode II, and (c) growth mode III.
Subsequently, a pure-elastic cosine model is used to evaluate the thickness variation in the TGO after the TBC service (see Figure 6). Due to the accumulation of strain caused by the thickening growth, the geometric deformation of the interface increases, especially at the peak and valley positions. It can be observed that the thickness of the entire TGO layer is slightly less than 2.5 μm, especially the peak position is more obvious. In addition, in the same growth mode, the thickness at the peak is smaller than that at the valley, mainly due to the interface geometric deformation caused by the thickening growth strain. By comparison, it can be found that TGO thickness at different positions in the three growth modes is basically the same, with a maximum error of no more than 0.8%. These results indicate that the accumulation of the TGO growth strain results in an increasing deformation of interface structure, which will induce changes in stress distribution and magnitude at the interface.
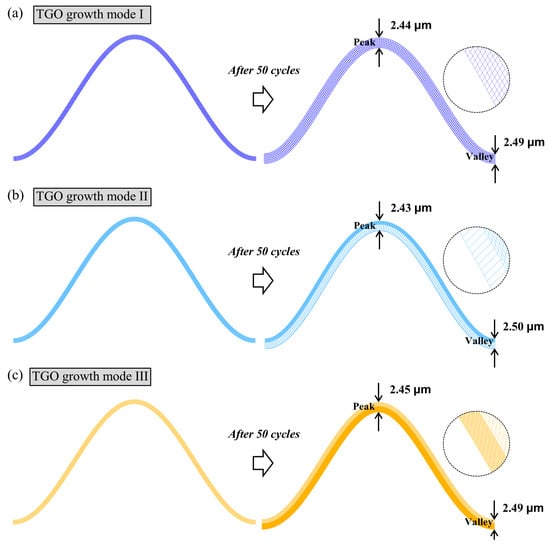
Figure 6.
Comparison of TGO thickness in a cosine model in different TGO growth modes (only TGO thickening growth and pure-elastic materials): (a) growth mode I, (b) growth mode II, and (c) growth mode III.
3.2. Stress State and Evolution in TBC
3.2.1. General Trend of Stress Evolution
The failure of coatings is usually manifested as local peeling caused by the accumulation of stress inside the coating. In this study, the main focus is on the normal and shear stress variations at the interface and inside the ceramic layer.
The variation in normal stress σ22 during thermal cycle is demonstrated in Figure 7. During the stress evolution, the following three main characteristics within the ceramic layer are of concern: the stress state at the peak, stress state at the valley, and the maximum stress position. It can be observed that in these three growth modes, the valley quickly transitions from compressive stress to tensile stress as the TGO grows at the initial stage of thermal cycling. This is mainly attributed to the accumulation of the TGO lateral growth strain. The stress state inside the ceramic layer no longer changes during the subsequent cycles. For the growth modes I and II, the maximum normal tensile stress is located near the valley, while it is always located near the valley in growth mode III. The stress distribution is consistent with previous research results [23,32,36], which validate the mechanical accuracy of the model. In addition, as the thermal cycle progresses, the stress amplitude continues to increase. The normal stress in growth mode III is always the highest. This means that due to the continuous accumulation of stress caused by the TGO growth, interface damage may occur, and intrinsic cracks within the ceramic layer may also propagate. Moreover, the TBC in growth mode III is more prone to early failure. Additionally, an interesting thing needs to be noted: although the maximum normal stress in growth mode I after all cycles is greater than that in growth mode II, the magnitude at the bottom of valley in the early stage of thermal cycling in growth mode II is greater. This indicates that when considering interface delamination and cracking, the coating in growth mode I may be more prone to early failure.
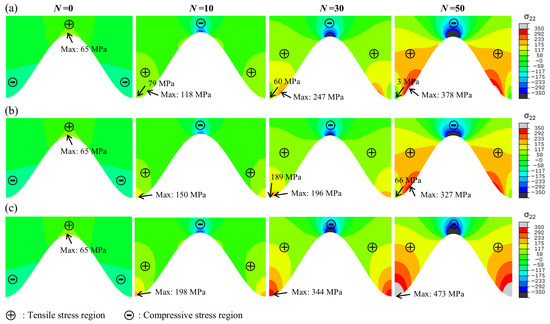
Figure 7.
Variation in normal stress σ22 in YSZ near the interface during furnace cycle (at room temperature): (a) growth mode I, (b) growth mode II, and (c) growth mode III.
The changes in shear stress σ12 during the thermal cycle in different growth modes are shown in Figure 8. As the cycle proceeds, shear stress continues to accumulate. During the thermal cycle, the shear stress in growth mode I is always the highest. After the thermal cycle, the shear stress in growth mode II is greater than that in growth mode III. However, it should be noted that in the early stage of thermal cycling, the shear stress in growth mode III is greater than that in growth mode II. This indicates that the changing amplitude of shear stress in growth mode III is smaller. However, it is found that shear stress is always distributed on both sides of the peak. Therefore, shear stress only has a great impact on the delamination or cracking near the peak.
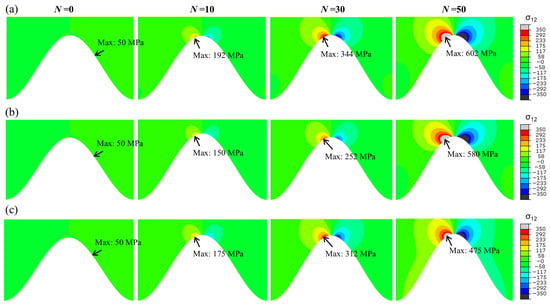
Figure 8.
Variation in shear stress σ12 in YSZ near the interface during furnace test (at room temperature): (a) growth mode I, (b) growth mode II, and (c) growth mode III.
To reveal the reason for the stress difference near the interface in these three modes, the morphology changes in TGO before and after the thermal cycling are demonstrated in Figure 9. It can be observed that the geometric deformations at the peaks and valleys in growth modes I and II are similar. But the growth stress in growth mode II is obscured by the initial TGO layer. Therefore, the stress in TGO growth mode II is always smaller than that in mode I. Compared to the growth mode I, the TGO deformation near the peak is smaller in growth mode III, and the displacement of the valley moving downwards is larger. Therefore, the normal tensile stress σ22 is greater in growth mode III, while the shear stress σ12 at the peak is smaller.
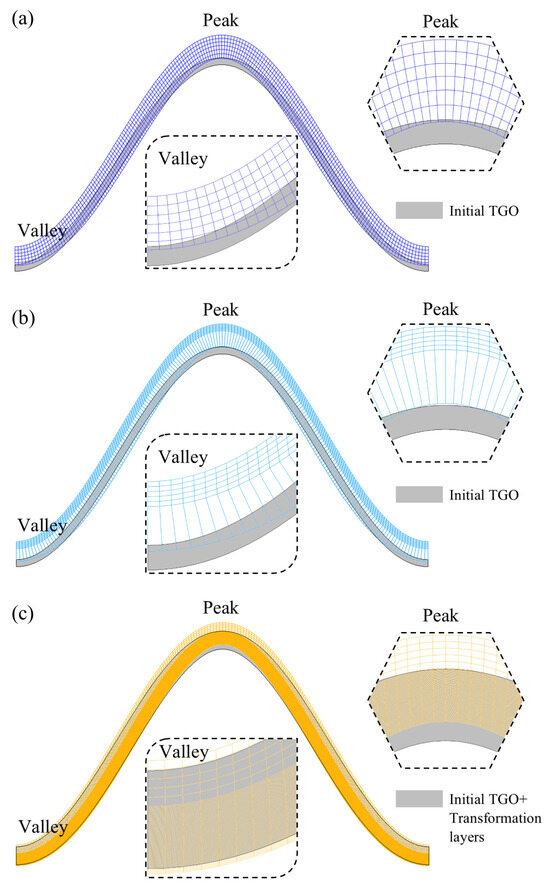
Figure 9.
Interfacial geometry deformation in different TGO growth modes after 50 cycles: (a) growth mode I, (b) growth mode II, and (c) growth modes III.
3.2.2. Effects of the TGO Creep Strength on Stress State
Irreversible deformation caused by creep behavior can significantly alter the local stress distribution and magnitude. Because the TGO layer is located between TC and BC, its creep is crucial for interface delamination and cracking.
The influences of the TGO creep strength in different growth modes on the distribution and amplitude of normal stress near the interface are presented in Figure 10. It is found that as the creep strength increases, the maximum normal tensile stress begins to shift from the valley to the vicinity of the peak in the three growth modes. At the same time, the tensile stress area at the valley also shifts to the regions between the peak and valley, and finally to the vicinity of peak. That is to say, the growth mode of the TGO does not change the distribution and variation in stress caused by creep.
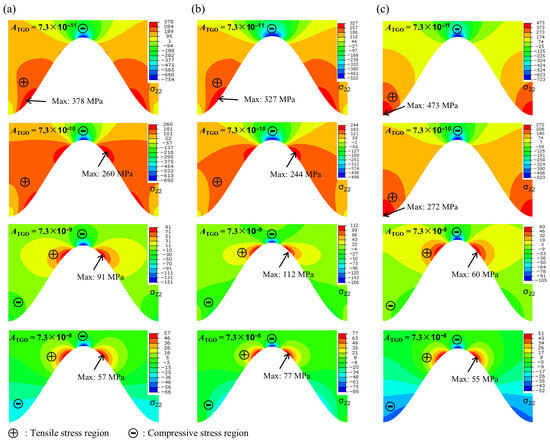
Figure 10.
Distribution of normal stress σ22 in YSZ with TGO creep strengths in different growth modes (at room temperature after 50 cycles): (a) growth mode I, (b) growth mode II, and (c) growth mode III.
The influence of the creep strength on the maximum tensile stress within the ceramic layer is extracted and shown in Figure 11. As the creep strength increases, the stress magnitudes in all three modes show a significant decrease. In addition, in the early stage of increasing creep strength, the stress magnitude presents an obvious decrease. As the creep rate further increases, the reduction amplitude of stress decreases. That is to say, an appropriate increase in the TGO creep rate can greatly reduce the stress within the coating.
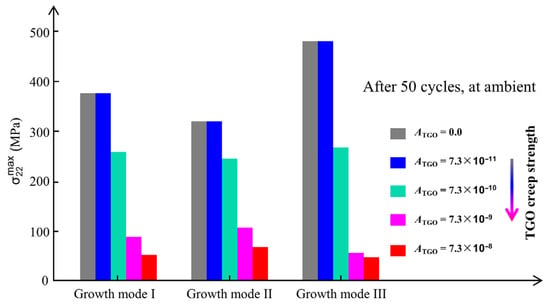
Figure 11.
Maximum normal stress σ22 at different TGO creep strengths and in different growth modes.
3.3. Interface Delamination and Failure in TBC
3.3.1. General Trend of Interface Damage Evolution
Crack propagation is a manifestation of the combined action of normal stress and shear stress at the corresponding location. In this study, an energy-accumulation-based crack propagation criterion is used to evaluate the interface delamination, which comprehensively reflects the actions of stress at the crack tip and the opening displacement behind it.
The evolution of the TC/TGO interface damage during the thermal cycle in the three growth modes is revealed in Figure 12. As the thermal cycle increases, the damage degree CSDMG at the valley continues to increase. Before the first cracking, the damage degree in growth mode III is always the highest. When the cycle number reaches 25, the interface delamination in growth modes II and III appears, firstly, at the valley position. This is mainly attributed to the normal tensile stress region at the valley. As the number of cycles increase, the delamination at the valley begins to expand towards the peak. Moreover, due to the flat area between the peak and valley resembling a plane interface, cracks quickly pass through this area and then reach the vicinity of the peak. After 45 cycles, the interface delamination degree in growth modes II and III is similar. The delamination cracks in the growth mode I are relatively smaller.
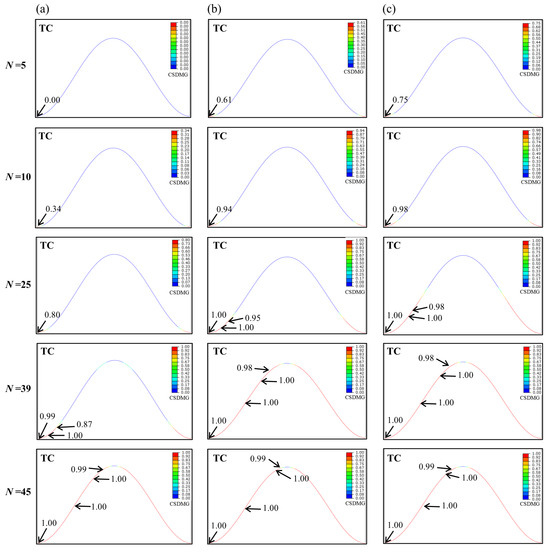
Figure 12.
Distribution of interface damage degree CSDMG in the furnace cycle in different TGO growth modes: (a) growth mode I, (b) growth mode II, and (c) growth mode III.
The variations in the damage degree CSDMG on the interface during the thermal cycle in different growth modes are exhibited in Figure 13. During the thermal cycle, the degree of damage in growth mode III is always the most severe, while it is the smallest in growth mode I. The maximum CSDMG always appears in the valley on the interface, and the damage in the flat area between the peak and valley is always minimal. When the number of thermal cycles is equal to ten, the delamination at the valley in growth mode II and III are close to beginning, while the damage degree in growth mode I is very small. When the thermal cycle number reaches 25, the interface delamination has already occurred in growth mode II and III, while it has not yet occurred in growth mode I. When the cycle number is equal to 39, the interface delamination in growth modes II and III has reached the near-peak position, and the degree of cracking is similar. In growth mode I, cracking only occurs at the valley. Note that, in growth mode I, the peak is under significant shear stress, resulting in the increased interface damage on both sides of the peak.
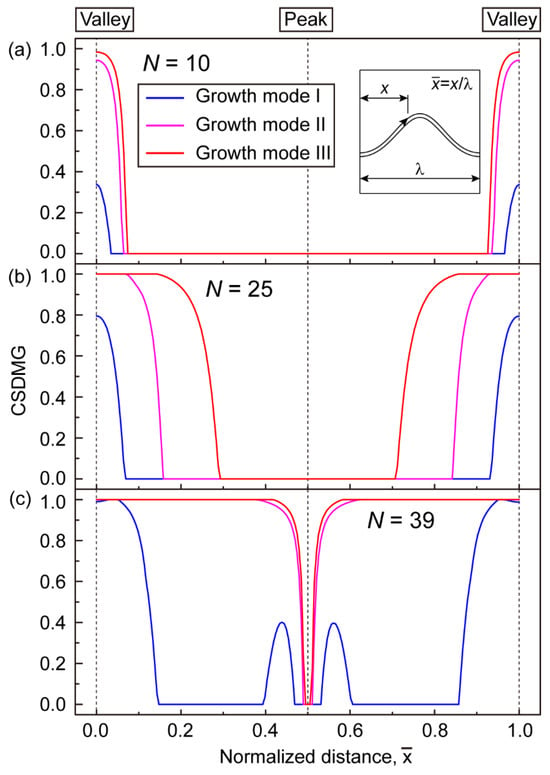
Figure 13.
Variation in CSDMG on the interface path in different TGO growth modes during thermal cycle: (a) N = 10, (b) N = 25, and (c) N = 39.
The variations in the interface damage degree in different growth modes indicate that interface delamination occurs first in growth mode III, and the final delamination area is the largest. In fact, after all cycles, the normal stress and shear stress in growth mode II are smaller than those in growth mode I (see Figure 7 and Figure 8). However, the interface delamination in growth mode II is more severe than in growth mode I (see Figure 12 and Figure 13). This is mainly attributed to the stress distribution and accumulation degree in the early stage of the thermal cycling. The normal stress distribution within the ceramic layer during the first 15 cycles is presented in Figure 14. The maximum stress in growth mode II and III is located at the bottom of valley, while it is located near the valley in growth mode I. The normal tensile stress in growth mode III is always the highest. The maximum stress in growth mode II is higher than that in growth mode I.
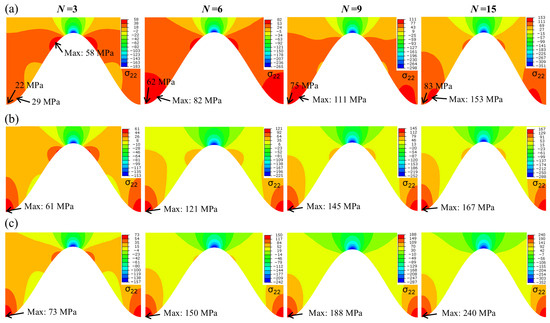
Figure 14.
Variation in normal stress σ22 in YSZ at the initial stage of thermal cycle in different TGO growth modes: (a) growth mode I, (b) growth mode II, and (c) growth mode III.
In order to further elucidate the influence of the growth mode on the extent of interface stress, the interface stress distributions during the thermal cycle are extracted and displayed in Figure 15. It can be observed that the stress at the valley in growth mode III is always the highest during the thermal cycle, indicating that the earliest interface delamination occurred at the valley position in growth mode III (see Figure 12). During the first 20 thermal cycles, the maximum stress in growth mode II is located at the valley and is always greater than the stress in growth mode I. When the number of cycles exceeds 20, the maximum stress in growth mode II begins to shift from the valley to the near-valley, and the stress amplitude begins to be smaller than that in growth mode II.
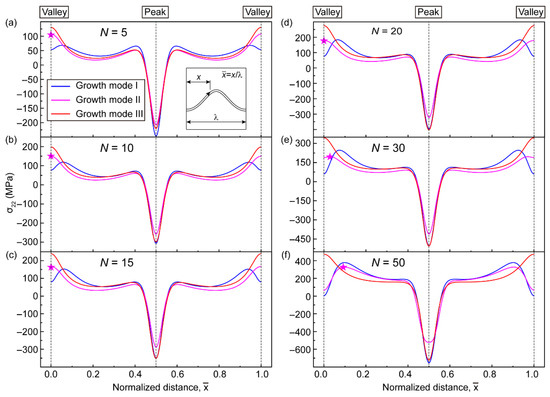
Figure 15.
Change in normal stress σ22 at the interface in different TGO growth modes during furnace cycle (★ indicates the maximum stress location in TGO growth mode II): (a) N = 5, (b) N = 10, (c) N = 15, (d) N = 20, (e) N = 30, and (f) N = 50.
3.3.2. Influences of TGO Creep on the Interface Delamination
The change in stress usually only reflects the initiation of cracks. In order to investigate the effect of the TGO creep on the coating failure, three different TGO creep strengths are selected to explore the damage and delamination at the TC/TGO interface. The initial cracking location and damage evolution trends on the interface in different growth modes are basically the same. Among the three growth modes, the interface damage in growth mode II is always moderate. Therefore, only TGO growth mode II is considered here.
The interface damage distributions during thermal cycling at different creep strengths are demonstrated in Figure 16. As the thermal cycle progresses, the degree of interface damage shows a continuous increasing trend. When the creep rate of the TGO is very low (ATGO = 7.3 × 10⁻¹¹), the damage degree CSDMG of all positions on the interface reaches 1.0 after 50 cycles. As the creep degree of the TGO increases (ATGO = 7.3 × 10⁻¹⁰), the valley is at the maximum damage position before 40 thermal cycles. As the cycle continues, the maximum tensile stress begins to shift from the valley to the near-peak. Meanwhile, shear stress is also located on both sides of the peak. Therefore, the damage degree CSDMG on both sides of the peak begins to increase. After 50 cycles, the maximum damage of 0.91 is located on both sides of the peak, but no interface delamination occurs. When the creep strength further increases (ATGO = 7.3 × 10⁻⁹), the stress inside the coating is further released. When the number of cycles is equal to 40, there is still no damage on the interface. After all cycles, the maximum damage near the peak only reaches 0.32.
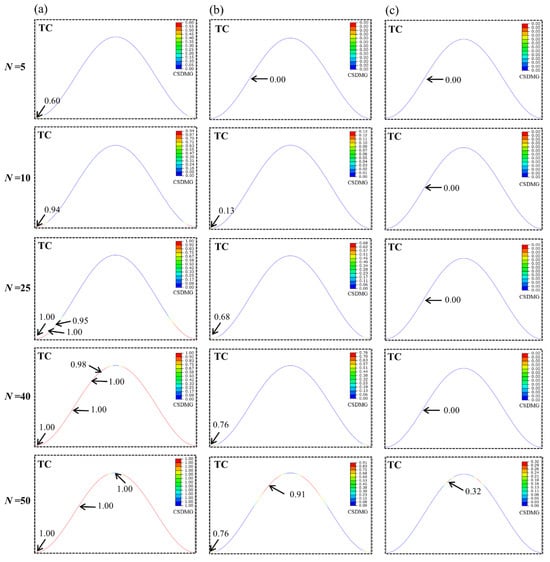
Figure 16.
CSDMG distribution at the interface during thermal cycling at different TGO creep strengths (using TGO growth mode II): (a) ATGO = 7.3 × 10⁻¹¹, (b) ATGO = 7.3 × 10⁻¹⁰, and (c) ATGO = 7.3 × 10⁻⁹.
The interface damages at different TGO creep rates during thermal cycle are extracted and displayed in Figure 17. It is observed that when the creep of the TGO is weak (ATGO = 7.3 × 10⁻¹¹), a complete interface delamination and peeling occur after 50 thermal cycles. When the TGO exhibits a moderate creep (ATGO = 7.3 × 10⁻¹⁰), no interface delamination appears after all cycles. When the TGO exhibits a strong creep (ATGO = 7.3 × 10⁻⁹), the damage degree CSDMG on the interface is very small. Regardless of the stage in the thermal cycle, the interface damage at the strong creep rate is always the smallest. In addition, before the TGO creep rate reaches the moderate creep rate (ATGO = 7.3 × 10⁻¹⁰), the degree of damage on the interface decreases very quickly, and the distribution of damage also changes greatly. When the creep rate of the TGO exceeds the moderate creep (ATGO = 7.3 × 10⁻¹⁰), the change in the damage degree remains basically unchanged, and the influence of the creep on the damage degree also begins to decrease accordingly. Therefore, as the creep degree of the TGO increases, the damage degree on the interface continues to decrease. However, in the early stage of the increasing creep rate, the degree of damage decreases faster.
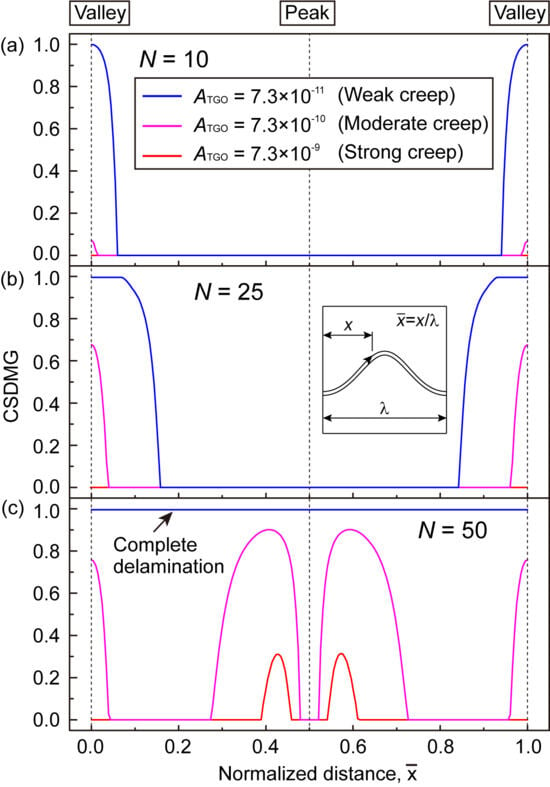
Figure 17.
CSDMG on the interface path at different TGO creep strengths during furnace cycle (using TGO growth mode II): (a) N = 10, (b) N = 25, and (c) N = 50.
The results of this study indicate that with the increase in thermal cycling, the growth strain of the TGO is accumulated, which leads to a continuous increase in stress near the interface. In addition, although the different TGO growth modes result in similar stress distributions, they affect the normal stress distribution and amplitude at the valley. Therefore, the TGO growth is an important factor affecting stress distribution and cracking near the interface. To delay the premature peeling of the coating, it is reported that the growth rate of TGO can be reduced by grain coarsening [49]. It should be noted that a strong TGO creep rate can significantly reduce the stress amplitude in the coating. The previous results indicate that grain refinement can increase the creep rate of TGOs [39]. Therefore, considering the combined effects of the TGO growth and creep, appropriate grain refinement can delay the peeling of the coating and improve its lifespan.
4. Conclusions
In this paper, stress evolution and interface delamination caused by TGOs’ dynamic growth are examined in a furnace cycle test. Three different TGO growth modes are considered and compared. The influences of the TGO creep on the interface delamination and coating failure are also investigated. Some main conclusions can be drawn, which are follows:
- (1)
- For all growth modes, the normal tensile stress region is located above the interface valley after all cycles. However, the maximum stress position during the thermal cycle is different: (a) near the valley in mode I, (b) from the bottom to the nearby area in mode II, and (c) at the bottom of the valley in mode III.
- (2)
- An earliest interface delamination appears in growth mode III. The interface failure in growth mode II occurs earlier compared to in mode I, which is attributed to a faster stress accumulation in the early stage of the thermal cycle.
- (3)
- A strong TGO creep rate severely reduces the stress level near the interface. The maximum normal tensile stress position is transferred to the nearby peak. Properly enhancing the creep rate of TGO can postpone the interface delamination.
Author Contributions
Conceptualization, Z.-Y.W.; methodology, B.-B.L., J.-F.W., Y.-H.Z., and X.-F.Z.; validation, X.-S.Z., Y.C.; investigation, J.-F.F., W.-W.Z., M.-Z.W., Y.-S.J., and X.-F.X.; formal analysis, B.-B.L. and J.-X.S.; data curation, H.-L.W. and Q.-Y.S.; writing—original draft preparation, B.-B.L., and J.-F.F.; writing—review and editing, Z.-Y.W., J.-F.W., M.-Z.W., Y.-S.J., and X.-S.Z.; supervision, Z.-Y.W., Y.-H.Z., and X.-F.Z.; project administration, Z.-Y.W. and X.-F.Z.; and funding acquisition, Z.-Y.W., Y.C., X.-F.X., J.-F.W., J.-X.S., and X.-F.Z. All authors have read and agreed to the published version of the manuscript.
Funding
The present project is financially supported by the Hubei University of Automotive Technology (Grant No. BK202468, No. BK202221, No. BK202310); the National Natural Science Foundation of China (Grant No. 52001248, No. 52322104, No. 52172067, No. 92160202); the Hubei Provincial Department of Education (Grant No. Q20231808); the Department of Science and Technology of Hubei Province (Grant No. 2025AFD233); the Select the Best Candidates to Undertake Key Research Projects (Grant No. 2024JBA04); the Excellent Young and Middle aged Science and Technology Innovation Team of Hubei Provincial Department of Education (Grant No. T2024015); the Hubei Provincial Natural Science Foundation Innovation and Development Joint Fund (Grant No. 2025AFD184); the Hubei Provincial Department of Education Project (Grant No. Q20241804); and the China Postdoctoral Science Foundation (Grant No. 2021M692517).
Institutional Review Board Statement
Not applicable.
Informed Consent Statement
Not applicable.
Data Availability Statement
Data are contained within the article.
Conflicts of Interest
The authors declare that they have no known competing financial interests or personal relationships that could have appeared to influence the work reported in this paper.
References
- Sezavar, A.; Sajjadi, S.A. A review on the performance and lifetime improvement of thermal barrier coatings. J. Eur. Ceram. Soc. 2025, 45, 117274. [Google Scholar] [CrossRef]
- Padture, N.P. Advanced structural ceramics in aerospace propulsion. Nat. Mater. 2016, 15, 804–809. [Google Scholar] [CrossRef] [PubMed]
- Yin, Q.; Shen, K.-H.; Wang, Y.; Xing, Y.-Z. Research progress of rare earth zirconate thermal barrier coating ceramic materials. Mater. Today Commun. 2025, 42, 111579. [Google Scholar] [CrossRef]
- Park, S.J.; Heogh, W.; Yang, J.; Kang, S.; Jeong, W.; Lee, H.; Jang, T.-S.; Jung, H.-D.; Jahazi, M.; Han, S.C.; et al. Meta-structure of amorphous-inspired 65.1Co28.2Cr5.3Mo lattices augmented by artificial intelligence. Adv. Compos. Hybrid Mater. 2024, 7, 224. [Google Scholar] [CrossRef]
- Ashofteh, A.; Rajabzadeh, M. Advances in thermal barrier coatings modeling, simulation, and analysis: A review. J. Eur. Ceram. Soc. 2024, 44, 116693. [Google Scholar] [CrossRef]
- Li, G.R.; Liu, T.; Luo, X.T.; Yang, G.-J.; Li, C.-J. A matching design co-enhancing thermal barrier and thermal cyclic performances of sintering-resistant coatings. Ceram. Int. 2023, 49, 39506–39515. [Google Scholar] [CrossRef]
- Su, X.R.; Zhang, C.Q.; Huang, L.Y.; Li, G.-R.; Yang, G.-J. Region-function-matching design for YSZ-based thermal barrier coatings enables long thermal cyclic lifespan. J. Am. Ceram. Soc. 2024, 107, 8716–8731. [Google Scholar] [CrossRef]
- Xu, B.Q.; Jiang, J.S.; Zou, Z.H.; Wang, W.; Zhao, X.; Liu, Y.; Xiao, P. Time-dependent spalling behavior of thermally grown oxide induced by room temperature interfacial deformation. Surf. Coat. Technol. 2018, 334, 164–172. [Google Scholar] [CrossRef]
- Zhang, L.; Chen, S.T.; Yu, C.T.; Yu, Z.; Jiang, C.; Li, S.; Bao, Z.; Quan, G.; Zhu, S.; Wang, F. Effect of the non-uniformed growth of TGO on dynamic stress evolution in realistic TC/TGO interface of MCrAlY-YSZ TBCs during thermal cycling. Surf. Coat. Technol. 2025, 511, 132319. [Google Scholar] [CrossRef]
- Yang, M.; Wang, X.; Feng, W.; Fu, Y.; Jiang, Y.; Chen, F.; Li, M.; Chen, Y. Effects of TGO growth on the interface stress distribution based on 3D pores in TBC ceramics layer. Mater. Today Commun. 2024, 38, 107878. [Google Scholar] [CrossRef]
- Li, C.J.; Dong, H.; Ding, H.; Yang, G.-J.; Li, C.-X. The Correlation of the TBC lifetimes in burner cycling test with thermal gradient and furnace isothermal cycling test by TGO effects. J. Therm. Spray Technol. 2017, 26, 378–387. [Google Scholar] [CrossRef]
- Wang, L.; Li, Z.D.; Ding, K.Y.; Deng, C.; Zhang, S.; Zheng, R.; Yang, L.; Lin, X. Effects of TGO growth on the stress distribution and evolution of three-dimensional cylindrical thermal barrier coatings based on finite element simulations. Ceram. Int. 2022, 48, 7864–7875. [Google Scholar] [CrossRef]
- Ranjbar-Far, M.; Absi, J.; Mariaux, G.; Smith, D. Crack propagation modeling on the interfaces of thermal barrier coating system with different thickness of the oxide layer and different interface morphologies. Mater. Des. 2011, 32, 4961–4969. [Google Scholar] [CrossRef]
- Dong, H.; Yang, G.J.; Li, C.X.; Luo, X.; Li, C. Effect of TGO thickness on thermal cyclic lifetime and failure mode of plasma-sprayed TBCs. J. Am. Ceram. Soc. 2014, 97, 1226–1232. [Google Scholar] [CrossRef]
- Ahmadian, S.; Jordan, E.H. Explanation of the effect of rapid cycling on oxidation, rumpling, microcracking and lifetime of air plasma sprayed thermal barrier coatings. Surf. Coat. Technol. 2014, 244, 109–116. [Google Scholar] [CrossRef]
- Yu, Q.M.; Zhou, H.L.; Wang, L.B. Influences of interface morphology and thermally grown oxide thickness on residual stress distribution in thermal barrier coating system. Ceram. Int. 2016, 42, 8338–8350. [Google Scholar] [CrossRef]
- Bednarz, P. Finite Element Simulation of Stress Evolution in Thermal Barrier Coating Systems. Ph.D. Thesis, Forschungszntrum Jülich, Jülich, Germany, 2007. [Google Scholar]
- Cen, L.; Qin, W.Y.; Yu, Q.M. Analysis of interface delamination in thermal barrier coating system with axisymmetric structure based on corresponding normal and tangential stresses. Surf. Coat. Technol. 2019, 358, 785–795. [Google Scholar] [CrossRef]
- Cen, L.; Qin, W.Y.; Yu, Q.M. Finite element analysis of interface undulation and interface delamination in the MCrAlY coating system under thermal cycling: Considering oxide thickness and top-coat effects. J. Therm. Spray Technol. 2020, 29, 597–610. [Google Scholar] [CrossRef]
- Chen, D. TGO growth behavior in environmental barrier coatings with modified silicon bond coat. J. Therm. Spray Technol. 2024, 33, 174–180. [Google Scholar] [CrossRef]
- Li, Z.H.; Wei, Z.Y.; Li, X.Y.; Wang, L.-S.; Ma, Z.-Y.; Dong, L.; Dong, H.; Yao, J.-T.; Zhou, Y.; Li, G.-R. Matching design of porous microstructures for double-layered thermal barrier coatings composed of Gd2Zr2O7 and yttria-stabilized zirconia enables long protection. Ceram. Int. 2025, 51, 35092–35103. [Google Scholar] [CrossRef]
- Wei, Z.Y.; Chai, Y.J.; Yi, P.; Meng, G.-H.; Zhang, W.-W. Stress profile and crack evolution in a three-dimensional (3D) thermal barrier coatings during isothermal cyclic test. Ceram. Int. 2022, 48, 30606–30620. [Google Scholar] [CrossRef]
- Wei, Z.Y.; Cai, H.N.; Su, J.Y.; Feng, R.-X. Dynamic crack growth mechanism and lifetime assessment in plasma sprayed thermal barrier system upon temperature cycling. Ceram. Int. 2019, 45, 14896–14907. [Google Scholar] [CrossRef]
- Song, J.N.; Li, S.L.; Yang, X.G.; Qi, H.; Shi, D. Numerical investigation on the cracking behaviors of thermal barrier coating system under different thermal cycle loading waveforms. Surf. Coat. Technol. 2018, 349, 166–176. [Google Scholar] [CrossRef]
- Xu, T.; He, M.Y.; Evans, A.G. A numerical assessment of the durability of thermal barrier systems that fail by ratcheting of the thermally grown oxide. Acta Mater. 2003, 51, 3807–3820. [Google Scholar] [CrossRef]
- ABAQUS. Version 2023 Documentation; Dassault Systemes Simulia Corp.: Providence, RI, USA, 2023. [Google Scholar]
- Chen, Z.; Jia, W.B.; Zhao, K.; Fang, L. Comparison of stress evolution under TGO growth simulated by two different methods in thermal barrier coatings. Ceram. Int. 2020, 46, 2915–2922. [Google Scholar] [CrossRef]
- Rosler, J.; Baker, M.; Volgmann, M. Stress state and failure mechanisms of thermal barrier coatings: Role of creep in thermally grown oxide. Acta Mater. 2001, 49, 3659–3670. [Google Scholar] [CrossRef]
- Ding, J.; Li, F.X.; Kang, K.J. Numerical simulation of displacement instabilities of surface grooves on an alumina forming alloy during thermal cycling oxidation. J. Mech. Sci. Technol. 2009, 23, 2308–2319. [Google Scholar] [CrossRef]
- Ding, J.; Li, F.X.; Kang, K.J. Effects of material creep on displacement instability in a surface groove under thermo-mechanical cycling. Surf. Coat. Technol. 2009, 204, 157–164. [Google Scholar] [CrossRef]
- Lin, C.; Li, Y.M. Interface stress evolution considering the combined creep-plastic behavior in thermal barrier coatings. Mater. Des. 2016, 89, 245–254. [Google Scholar]
- Wei, Z.Y.; Cai, H.N.; Meng, G.H.; Tahir, A.; Zhang, W.-W. An innovative model coupling TGO growth and crack propagation for the failure assessment of lamellar structured thermal barrier coatings. Ceram. Int. 2020, 46, 1532–1544. [Google Scholar] [CrossRef]
- He, M.Y.; Hutchinson, J.W.; Evans, A.G. Simulation of stresses and delamination in a plasma-sprayed thermal barrier system upon thermal cycling. Mater. Sci. Eng. A 2003, 345, 172–178. [Google Scholar] [CrossRef]
- He, M.Y.; Mumm, D.R.; Evans, A.G. Criteria for the delamination of thermal barrier coatings: With application to thermal gradients. Surf. Coat. Technol. 2004, 185, 184–193. [Google Scholar] [CrossRef]
- Cen, L.; Qin, W.Y.; Yu, Q.M. On the role of TGO growth in the interface undulation in MCrAlY coating system upon thermal cycling. Ceram. Int. 2019, 45, 22802–22812. [Google Scholar] [CrossRef]
- Wei, Z.Y.; Cai, H.N.; Tahir, A.; Zhang, W.-W.; Li, X.-F.; Zhang, Y.; Huang, Y.-P.; Liu, Y. Stress states in plasma-sprayed thermal barrier coatings upon temperature cycling: Combined effects of creep, plastic deformation, and TGO growth. Ceram. Int. 2019, 45, 19829–19844. [Google Scholar] [CrossRef]
- Huang, Y.P.; Wei, Z.Y.; Cai, H.N.; Liu, Y.; Han, X.-C. The effects of TGO growth stress and creep rate on TC/TGO interface cracking in APS thermal barrier coatings. Ceram. Int. 2021, 47, 24760–24769. [Google Scholar] [CrossRef]
- Rosler, J.; Baker, M.; Aufzug, K. A parametric study of the stress state of thermal barrier coatings: Part I: Creep relaxation. Acta Mater. 2004, 52, 4809–4817. [Google Scholar] [CrossRef]
- Schwarzer, J.; Loehe, D.; Voehringer, O. Influence of the TGO creep behavior on delamination stress development in thermal barrier coating systems. Mater. Sci. Eng. A 2004, 387–389, 692–695. [Google Scholar] [CrossRef]
- Su, L.C.; Zhang, W.X.; Sun, Y.L.; Wang, T.J. Effect of TGO creep on top-coat cracking induced by cyclic displacement instability in a thermal barrier coating system. Surf. Coat. Technol. 2014, 254, 410–417. [Google Scholar] [CrossRef]
- Wei, Z.Y.; Cai, H.N.; Zhao, S.D. Assessment of stress characteristic and interfacial delamination in thermal barrier coatings considering the connected crack network. Surf. Coat. Technol. 2022, 432, 128065. [Google Scholar] [CrossRef]
- Wei, Z.Y.; Cai, H.N. Stress states and crack behavior in plasma sprayed TBCs based on a novel lamellar structure model with real interface morphology. Ceram. Int. 2019, 45, 16948–16962. [Google Scholar] [CrossRef]
- Aktaa, J.; Sfar, K.; Munz, D. Assessment of TBC systems failure mechanisms using a fracture mechanics approach. Acta Mater. 2005, 53, 4399–4413. [Google Scholar] [CrossRef]
- Wei, Z.Y.; Cai, H.N.; Li, C.J. Comprehensive dynamic failure mechanism of thermal barrier coatings based on a novel crack propagation and TGO growth coupling model. Ceram. Int. 2018, 44, 22556–22566. [Google Scholar] [CrossRef]
- Ranjbar-Far, M.; Absi, J.; Mariaux, G.; Dubois, F. Simulation of the effect of material properties and interface roughness on the stress distribution in thermal barrier coatings using finite element method. Mater. Des. 2010, 31, 772–781. [Google Scholar] [CrossRef]
- Ranjbar-Far, M.; Absi, J.; Mariaux, G. Finite element modeling of the different failure mechanisms of a plasma sprayed thermal barrier coatings system. J. Therm. Spray Technol. 2012, 21, 1234–1244. [Google Scholar] [CrossRef]
- Białas, M. Finite element analysis of stress distribution in thermal barrier coatings. Surf. Coat. Technol. 2008, 202, 6002–6010. [Google Scholar] [CrossRef]
- Zhao, P.F.; Sun, C.A.; Zhu, X.Y.; Shang, F.; Li, C. Fracture toughness measurements of plasma-sprayed thermal barrier coatings using a modified four-point bending method. Surf. Coat. Technol. 2010, 204, 4066–4074. [Google Scholar] [CrossRef]
- Zhang, B.Y.; Yang, G.J.; Li, C.X.; Li, C.-J. Non-parabolic isothermal oxidation kinetics of low pressure plasma sprayed MCrAlY bond coat. Appl. Surf. Sci. 2017, 406, 99–109. [Google Scholar] [CrossRef]
Disclaimer/Publisher’s Note: The statements, opinions and data contained in all publications are solely those of the individual author(s) and contributor(s) and not of MDPI and/or the editor(s). MDPI and/or the editor(s) disclaim responsibility for any injury to people or property resulting from any ideas, methods, instructions or products referred to in the content. |
© 2025 by the authors. Licensee MDPI, Basel, Switzerland. This article is an open access article distributed under the terms and conditions of the Creative Commons Attribution (CC BY) license (https://creativecommons.org/licenses/by/4.0/).