Article

An Artificial Intelligence for the Analysis of a DC Magnetron Sputtering System Combined with a Particle-in-Cell Simulation

1
Department of Computer Science and Engineering, Ewha Womans University, Seoul 03760, Republic of Korea
2
Department of Electrical Engineering, Pusan National University, Busan 46241, Republic of Korea
*
Author to whom correspondence should be addressed.
Coatings 2025, 15(11), 1248; https://doi.org/10.3390/coatings15111248
Submission received: 17 September 2025 / Revised: 14 October 2025 / Accepted: 22 October 2025 / Published: 27 October 2025
(This article belongs to the Section Surface Characterization, Deposition and Modification)

Abstract

A numerical method to estimate the plasma characteristics with the variation in control parameters is suggested with an artificial intelligence model using limited finite datasets. A transformer-based regression method was applied to estimate the spatial profiles of plasma characteristics in a DC magnetron sputtering system from limited data obtained by a two-dimensional particle-in-cell simulation under varying pressure. Based on the obtained simulation data, an artificial intelligence method successfully predicts the energy and angular distribution of ions incident on the target. This approach enables the quantitative estimation of the impact of various system parameter changes on plasma characteristics using only a limited number of simulation results. It is beneficial for practical applications, such as process optimization, because the ion energy and angle distributions can be estimated very fast without simulating all the cases.

1. Introduction

Magnetron sputtering systems are widely applied for the deposition of various metal thin films due to their capability of producing dense coatings under low-temperature processing conditions [1,2,3,4,5,6,7]. However, due to the magnetic field distribution in the device, sputtering occurs mainly in specific regions of the target, which reduces the effective utilization of the target material. In addition, the energy and angular distributions of incident ions vary with pressure and power conditions, which often leads to fluctuations in film properties, making predictive modeling necessary.
In the past, the development of plasma equipment and the interpretation of physical phenomena during processing have relied on empirical knowledge accumulated through repeated trial-and-error experiments. However, such approaches have now reached clear limitations. Therefore, rather than relying on costly and time-consuming prototype experiments, computer simulations are required to obtain extensive information within a shorter time. Such simulations improve the understanding of equipment and enhance the ability to analyze processes. Accordingly, it is necessary to establish a fast and accurate magnetron simulation code. In general plasma simulations, fluid models are mainly employed instead of particle-based or kinetic approaches, which are limited by computational cost. However, in magnetron sputtering systems, where magnetic fields strongly confine electrons, fluid simulations cannot capture the gyro-motion of charged particles or their collisions with neutral species. In particular, they have limitations in describing the gyro-motion of charged particles and their collisions with neutral species.
Particle-in-cell (PIC) simulations, which directly compute particle trajectories without relying on the assumptions used in fluid models, have the advantage of higher accuracy [8,9,10]. A known drawback, however, is statistical noise, which arises when the number of computational particles (super-particles) is insufficient. Even with this limitation, PIC remains the most reliable approach for analyzing magnetron sputtering systems [11,12,13]. Previous studies indicate that the distribution of the magnetic field, determined by magnet geometry, strongly influences how effectively the target material is utilized. Under a fixed magnetic configuration, changes in process parameters can still modify the energy and angular distributions of incident ions. These variations affect both the sputtering yield and the properties of the deposited film. In addition, progressive erosion of the target alters local plasma conditions, leading to time-dependent changes in film quality. Even with a fixed magnetic configuration, process parameters can alter the energy and angular distributions of incident ions. Such variations influence the sputtering yield as well as the properties of the deposited film. Furthermore, target erosion during prolonged operation modifies local plasma conditions and causes time-dependent changes in film quality.
Increasing the number of super-particles inevitably raises computational cost. This trade-off has restricted the use of PIC simulations as design tools in industrial applications, where many control parameters must be examined. To overcome this limitation, Artificial Intelligence (AI) can shorten the total computation time by predicting simulation results without exhaustive parameter scans. In this study, a parallelized PIC code developed at Pusan National University was employed to improve numerical accuracy [14,15,16,17]. The generated data were then combined with a transformer-based regression model to estimate results under varying parameter conditions. Section 2 describes the methodology. Section 3 presents the simulation and prediction results. Section 4 provides the conclusions.

2. Methodology

2.1. Two-Dimensional PIC Model for DC Magnetron Sputtering

Magnetron sputtering systems operate based on a mechanism in which magnetic fields confine electrons, thereby enhancing plasma density. However, ions, which are responsible for surface reactions, are not magnetically confined and are instead accelerated toward the target surface to induce sputtering and secondary electron emission. Therefore, accurate simulation of such systems must account for both the transport of electrons within the magnetic field and the interactions between ions and the surface at the target. The most suitable approach for simulating these conditions is the particle-in-cell (PIC) method, in which charged particle dynamics in magnetic fields are computed using the Boris method [8], and collisions with neutral gas species are handled using the Monte Carlo Collision (MCC) technique [9]. Accordingly, in this study, a two-dimensional PIC simulation code is employed to analyze the discharge characteristics of magnetron sputtering systems [11,12,13,14,15,16,17]. The PIC simulation methodology has already been validated through previous theoretical and computational studies [18,19,20,21]. The performance of PIC simulation has been dramatically enhanced with the help of GPU-based parallelization [22].

2.2. Transformer-Based Regression Framework

The Transformer is an architecture that efficiently learns long-range dependencies between sequences without relying on recurrent neural networks (RNNs) or convolutional neural networks (CNNs). Instead, it employs only a self-attention mechanism and a feed-forward network (FFN) [23]. Fundamentally, the Transformer follows an encoder–decoder structure, where each encoder and decoder layer is composed of a multi-head self-attention mechanism, a position-wise feed-forward network, residual connections, and layer normalization [23,24].
In this study, the basic encoder structure of the Transformer was adopted, while the decoder attention components were omitted to suit the regression characteristics of electronic density prediction. Since the input sequence length is fixed to one, the self-attention operation degenerates into an identity mapping that only attends to itself. Nevertheless, the feed-forward network (FFN), residual connections, and layer normalization play crucial roles in enhancing the model’s expressive capability and training stability [23,24,25]. Specifically, the FFN nonlinearly expands and compresses input features, enabling the model to approximate complex interactions among variables effectively. Residual connections prevent gradient vanishing and allow for stable optimization of deeper networks [24]. In addition, layer normalization normalizes the activation distribution at each layer, improving convergence stability and generalization performance during training [25]. This configuration maintains the Transformer’s core advantages—optimization stability and high expressive capacity—even when the self-attention mechanism is not functionally active. Therefore, the proposed model can be regarded as a simplified adaptation of the Transformer architecture, leveraging its structural resilience for regression-oriented problems.
Building upon this encoder-based design, a regression framework was developed to predict three plasma properties: the spatial distribution of electron density, the spatial distribution of electric potential, and the ion energy–angle distribution function (IEADF). The model was designed to handle physical quantities over a wide dynamic range, from tiny to huge values, while preserving spatial relationships among the inputs.
The input layer converts the original feature vector into a latent representation of dimension, d m o d e l , which depends on the physical quantity to be predicted. Since self-attention does not encode order, a fixed sinusoidal positional encoding is added to preserve spatial or angular dependencies. Each encoder layer consists of multi-head self-attention and feed-forward networks, with residual connections, layer normalization, and dropout for training stability. The regression head includes two fully connected layers with GELU (Gaussian Error Linear Unit) activation and dropout, followed by a final linear projection that outputs a single scalar value. The overall workflow of the proposed Pressure-Interpolated Transformer Regression Pipeline is illustrated in Figure 1, which summarizes the data transformation (Step 2), loss design (Step 4), calibration (Step 6), and post-processing (Step 8) procedures described in the following sections.
Among the three regression tasks considered in this study, the model hyperparameters and training setup described below correspond to the electron density prediction experiment, which is presented here as a representative example. The configurations for the other two properties (electric potential and IEADF) follow the same design with minor adjustments. The primary hyperparameters of the Transformer model for electron prediction are summarized in Table 1. The model employs a 64-dimensional embedding space and consists of 7 encoder layers, each equipped with four multi-head attention mechanisms. Each encoder layer has a feed-forward dimension of 512 and a dropout rate of 0.1. The entire dataset was randomly divided into 90% for training and 10% for validation. The model was trained using the AdamW optimizer with a warm-up and ReduceLROnPlateau learning-rate schedule. The input data consist of three features: gas pressure and the spatial coordinates X and Y. The model was trained using data collected at pressure conditions of 5, 10, 15, and 20 mTorr. The trained Transformer-based regression model predicted the electron density at all XY grid points for each pressure condition, and it was also capable of predicting similar spatial distributions of electron density for intermediate pressures within the trained range.

2.3. Data Transformation and Loss Design for Wide-Dynamic-Range Regression

To effectively train the Transformer regression model described in Section 2.2, the input data are preprocessed to handle the wide dynamic range and preserve physical relationships among plasma quantities. The DC magnetron sputtering simulation dataset covers plasma quantities with an extensive dynamic range, including electron density, electric potential, and the argon ion energy–angle distribution (IEADF). Both very high and very low values have important physical meanings. High-density regions in the electron density field determine plasma dynamics, and low-density regions influence boundary conditions and potential formation. To reflect these characteristics during training, variable-specific scale transformations are applied before learning (Step 2: Data Preparation).
For electron density and IEADF, a log-base-10 transformation, log 10 ( x + ε l o g ) , is used to avoid numerical instability near zero. Here, ε l o g is a small positive constant chosen according to the numerical resolution. For electric potential, an inverse hyperbolic sine transformation, asinh(x/c), is employed to preserve the sign of the values while symmetrically compressing the dynamic range. The parameter c is set to the median absolute deviation (MAD) of the dataset. After these transformations, Min–Max scaling is applied to ensure stable optimization (Step 2: Data Preparation).
The loss function combines error measures in both the transformed and original domains so that the model can capture both small and large values (Step 4: Loss Function).
L = α · H u b e r   ( z ,   z ~ ;   δ ) + 1 α   ·   E y ^ y y + ε     ,
where z and z ~ are the predicted and target values in the transformed domain. y ^  and y are the corresponding inverse-transformed values in the linear space. δ is the Huber transition parameter [26].
ε is a small constant that prevents division instability in regions with low magnitude. Weighted by α, the Huber loss reduces sensitivity to outliers while retaining the ability to capture sharp peaks. In addition, the relative MAE term reduces underestimation in high-value regions while still accounting for the low-value domain.
Predictions are constrained in two ways to ensure physical plausibility. In the transformed domain, outputs are clipped to percentile-based limits to avoid numerical divergence. After the inverse transformation, upper limits based on domain knowledge and device specifications are imposed to keep the predictions physically realistic (Step 8: Apply Calibration & Constraints). Loose bounds are used during training to avoid biasing gradient updates. Inference, however, enforces stricter limits to guarantee realistic predictions. During inference, the model also supports pressure-interpolated prediction to evaluate plasma properties at unseen pressures P (Step 7: Pressure-Interpolated Prediction). In post-processing, isotonic regression can be optionally applied to preserve monotonic relationships between predicted and target values. This improves calibration performance in practice (Step 6: Calibration). These procedures ensure that the Transformer regressor produces physically consistent and numerically stable predictions across a wide dynamic range of plasma conditions.

3. Results and Discussion

To investigate the characteristics of the DC magnetron sputtering system, a two-dimensional PIC simulation was carried out. The simulation parameters are summarized in Table 2.
Figure 2 shows the two-dimensional spatial distribution of electrons at steady state for the parameters mentioned in Table 2, and Figure 3 presents the equivalent lines of magnetic field strength and the magnetic field lines at this condition. These results correspond to the simulation under the same conditions as Figure 2 in [14]. The time evolution of electron behavior reveals that electrons move along magnetic field lines and are reflected by the magnetic mirror effect in regions of strong magnetic fields. On time averaging, the location with the highest electron density is observed, as shown in Figure 2 of [14], to be concentrated where the magnetic field lines are distributed parallel to the equivalent lines of magnetic field strength. The mean kinetic energy of electrons is roughly 1.5 times the electron temperature, so the period for an electron to transit back and forth through a region of strong magnetic field is approximately the arc length of the magnetic field divided by the thermal velocity—typically on the order of tens of milliseconds, which is very short. Thus, in DC discharge, the time-averaged value over this interval appears as the electron distribution.
The spatial distributions of plasma density and electric potential at different pressures are recalculated using the Transformer Regression method based on PIC simulation results obtained at the 512 by 140 grid position for four different pressures. Figure 4 presents the spatial distributions of electrons under different pressure conditions. Since the density is higher near the target electrode in the overall structure, the y-direction in the figure represents the region up to 2.5 cm from the target. Similarly, by utilizing the symmetry of the density distribution with respect to the center position of the magnet, only the left region is shown. As the pressure increases, the electron density region expands and shifts upward, indicating enhanced plasma confinement and increased collisionality. As the pressure increases, the plasma density near the target becomes higher. At the same time, the density distribution broadens into regions with stronger magnetic confinement. This behavior indicates that electrons confined by the magnetic field continue to participate in the discharge. The increase in collisionality then produces a corresponding rise in plasma density.
Figure 5 presents the corresponding spatial distributions of electric potential at each pressure condition. The spatial distribution of the electric potential near the target also undergoes significant changes as the pressure increases. As a result, the electric field—defined as the gradient of the potential and oriented perpendicular to the equipotential lines—becomes more vertically aligned toward the target surface. It suggests that both the incident angle and energy of ions are likely to be affected by pressure-dependent sheath dynamics. These effects are indeed confirmed by the simulation results presented below.
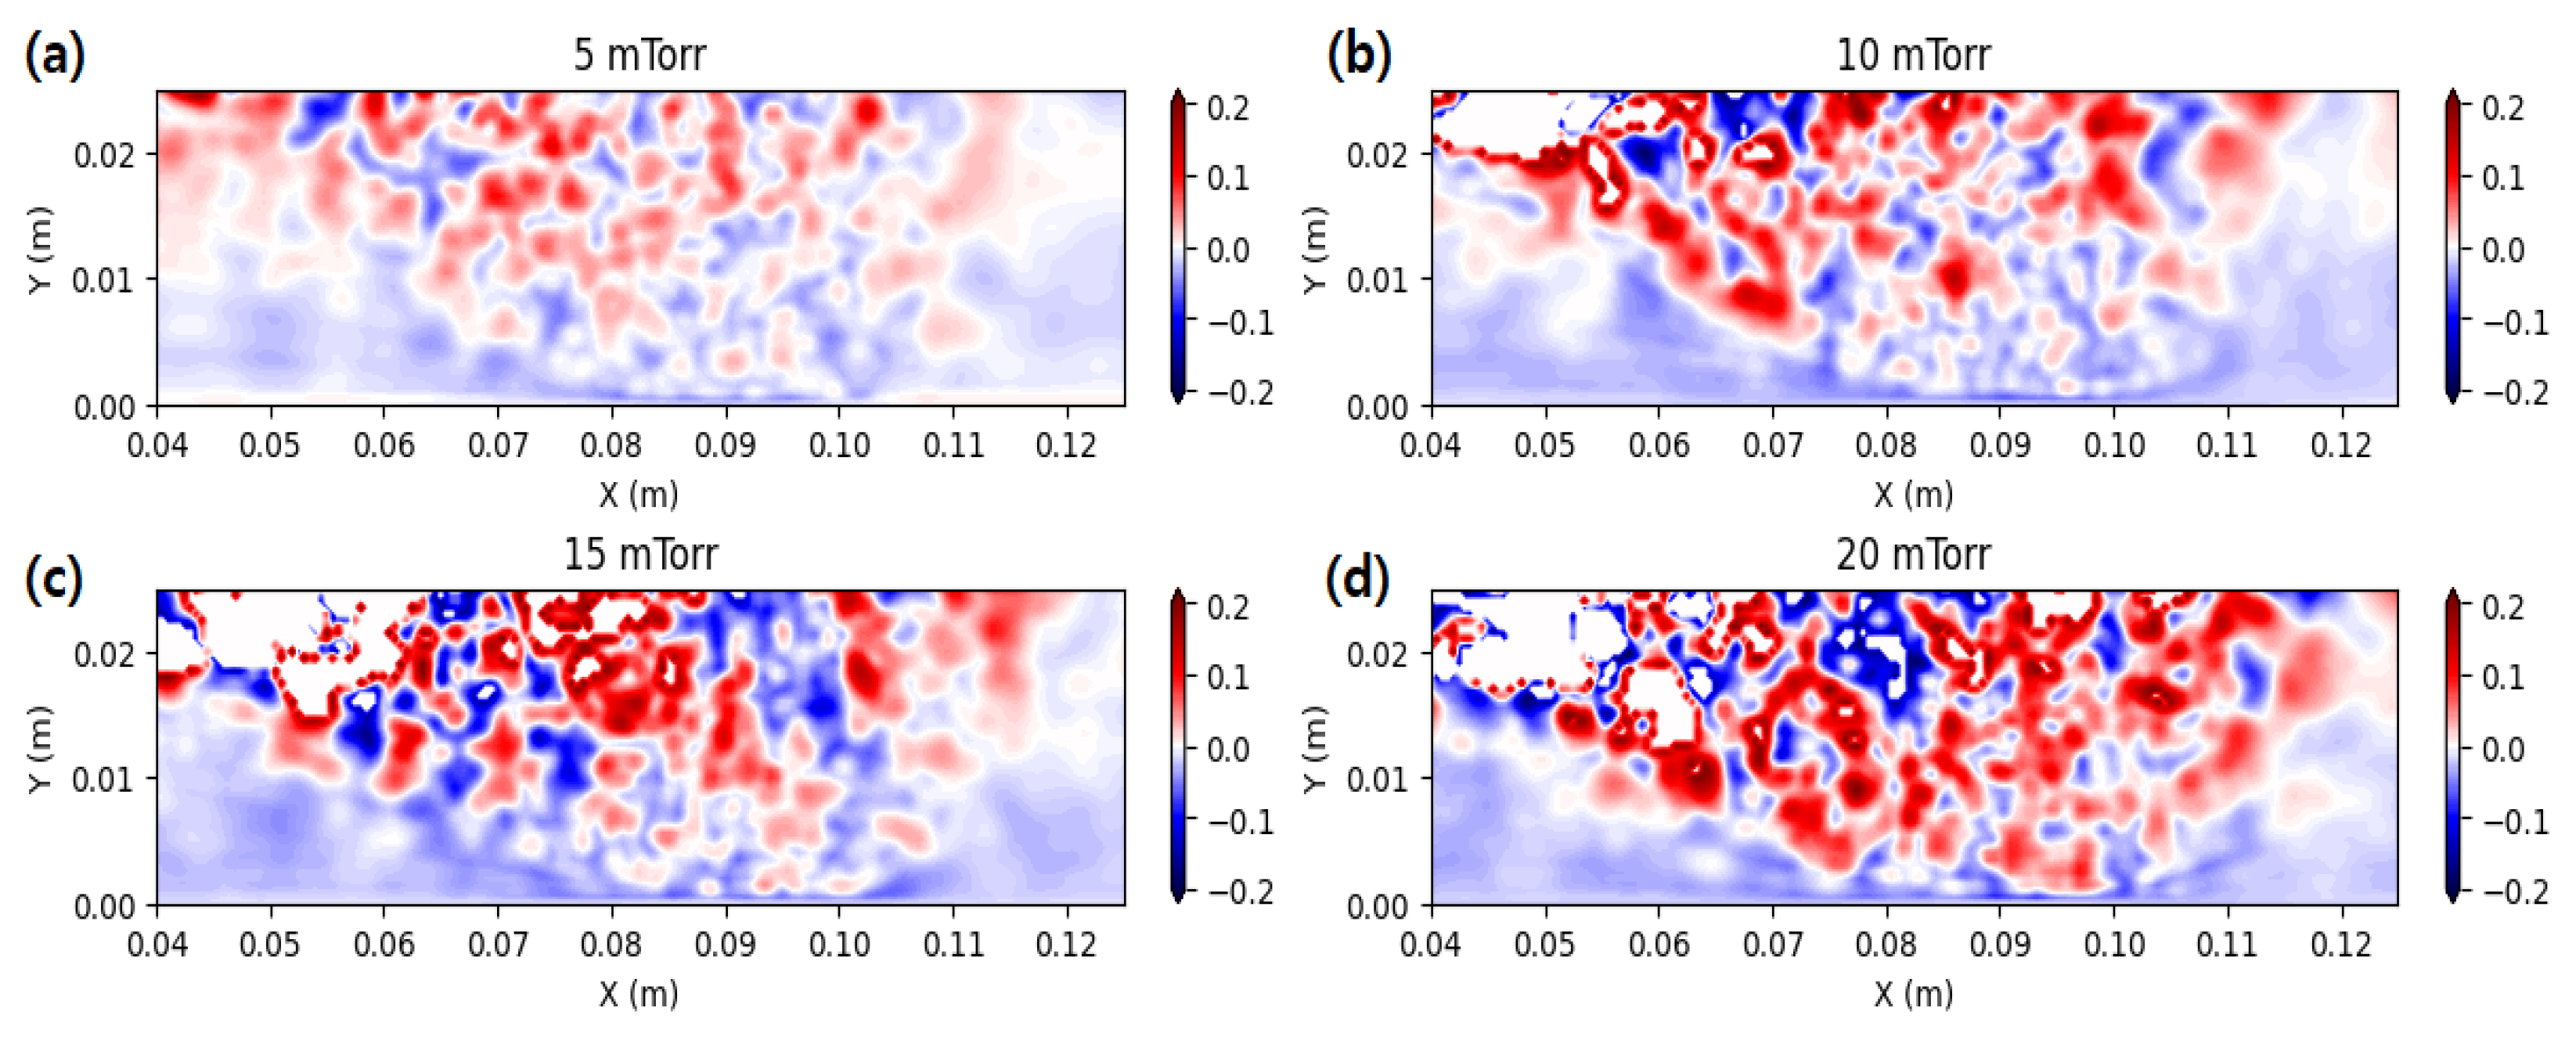
Figure 6 shows the relative errors between the estimated values by the transformer regression and the original PIC simulation results of the electric potential profiles. The relative errors were calculated only at the regions where the relative values of the original data is larger than 10% of the maximum because the relative error becomes large when the denominator becomes small. In general, the relative errors are less than 15%, but the spatial fluctuation seems large in the bulk plasma region. However, the fluctuation is less than 5% inside the sheath, which means that the ion energy information coming through this path is relatively accurate. Basically, the relative errors should be as low as possible. However, it is very difficult to obtain an error-free potential profile using AI, compared with the errors in the density profiles.
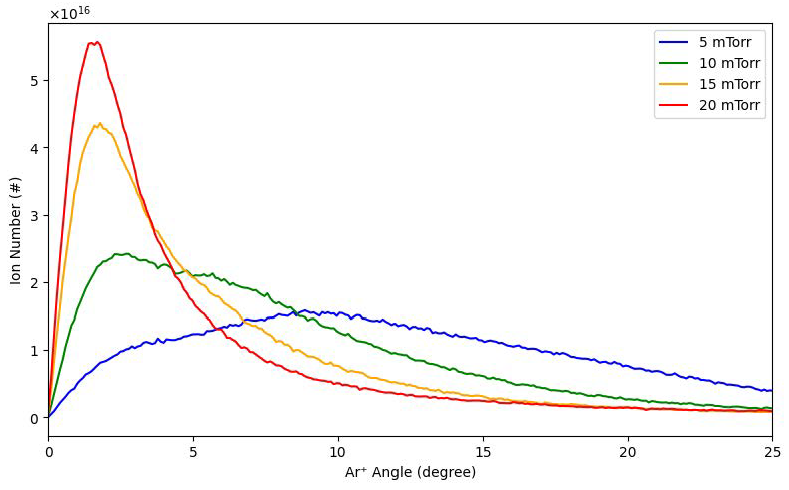
Figure 7 shows that the incident angle of ions near the target decreases with increasing pressure. In other words, ions tend to impinge more perpendicularly on the target surface at higher pressures. This behavior is contrary to that typically observed in capacitively coupled plasma (CCP) systems, where lower pressures result in more perpendicular ion incidence due to reduced collisional effects. In the case of magnetron sputtering, however, the sheath near the target already satisfies the collisionless condition for ions, indicating that the influence of the magnetic field becomes more dominant in determining ion trajectories.
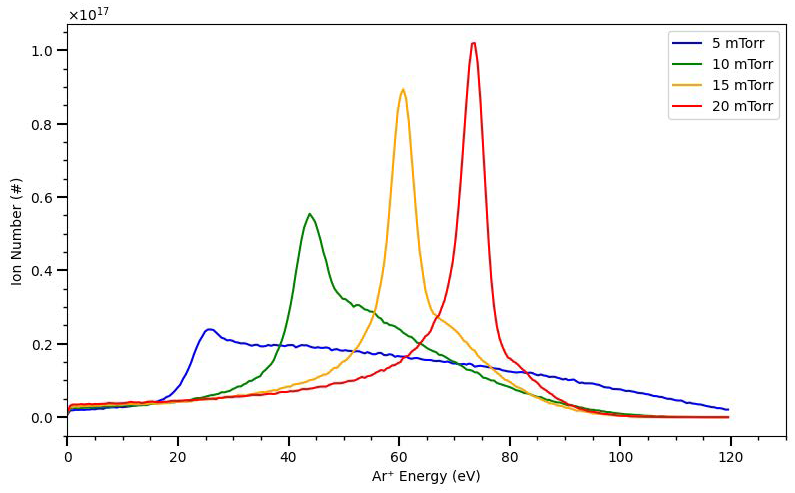
Figure 8 illustrates that the energy of Ar+ ions incident on the target increases with increasing pressure. This trend is a direct consequence of the larger electrical potential drop observed across the plasma sheath near the target, as shown in Figure 8. While the physical thickness of the sheath remains nearly constant, the steeper potential gradient at higher pressures results in a stronger accelerating electric field, allowing ions to gain more energy as they traverse the sheath. This effect is further analyzed through the ion energy-angle distribution function (IEADF), presented below.
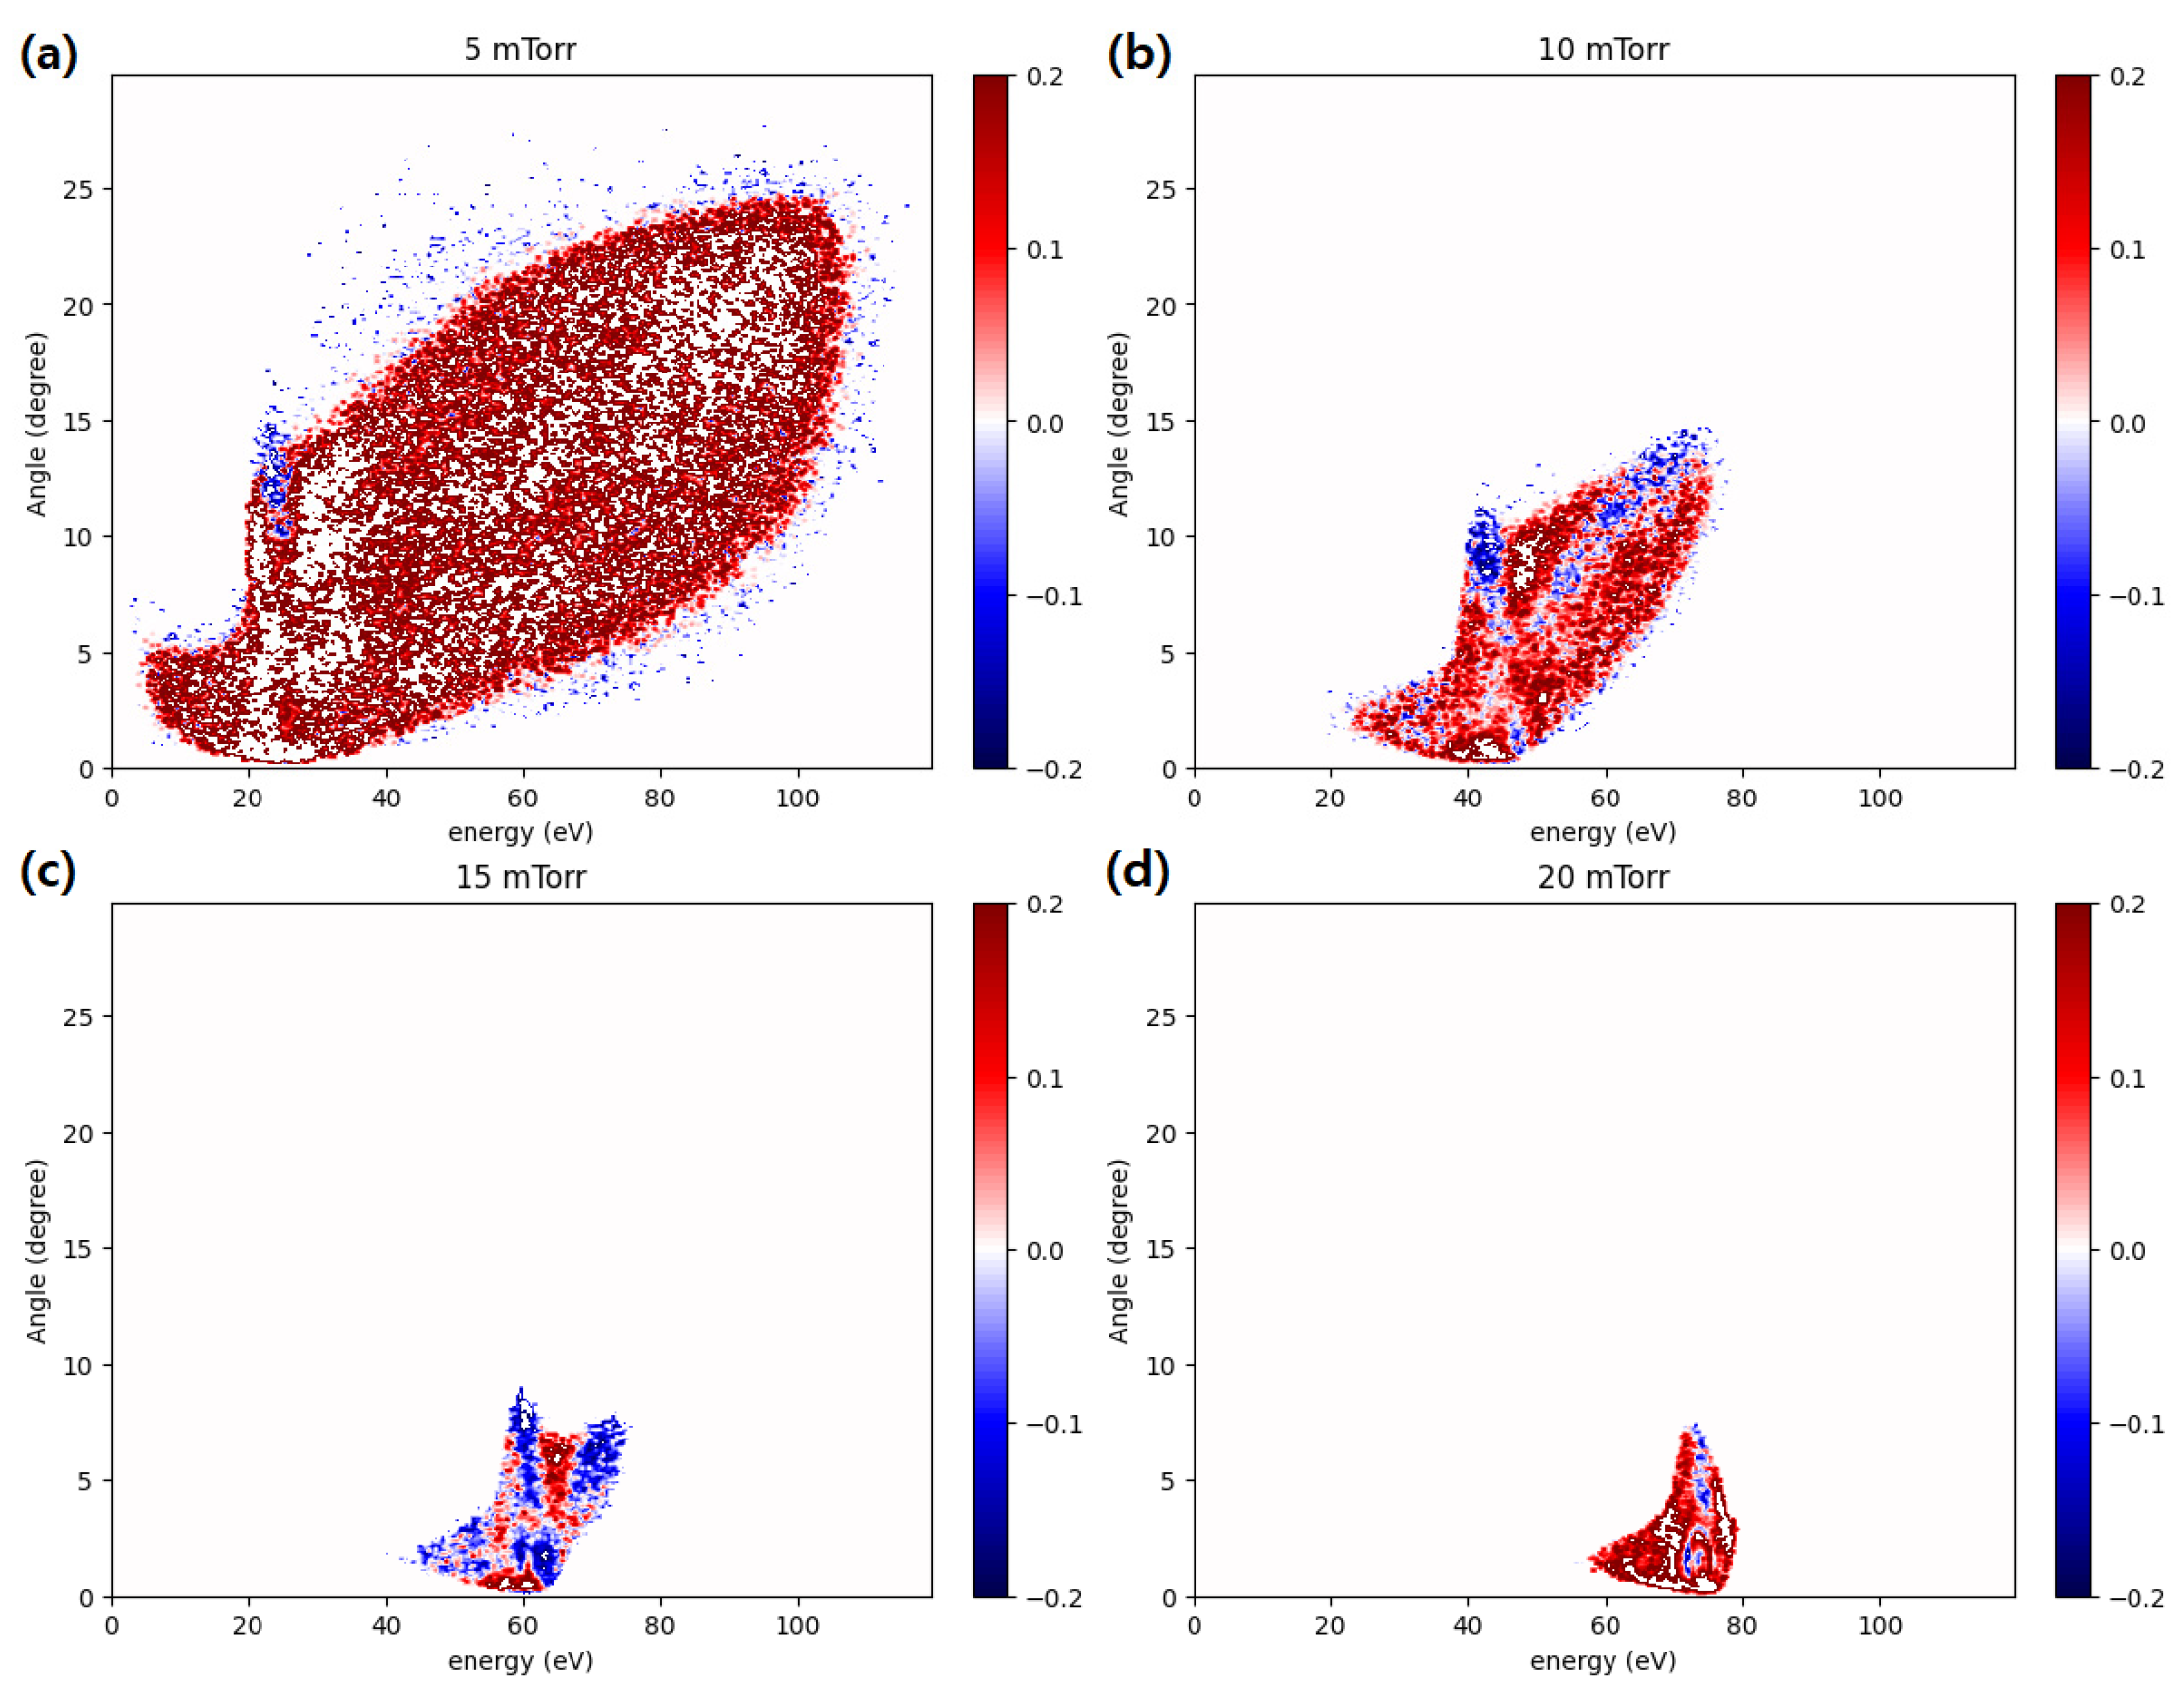
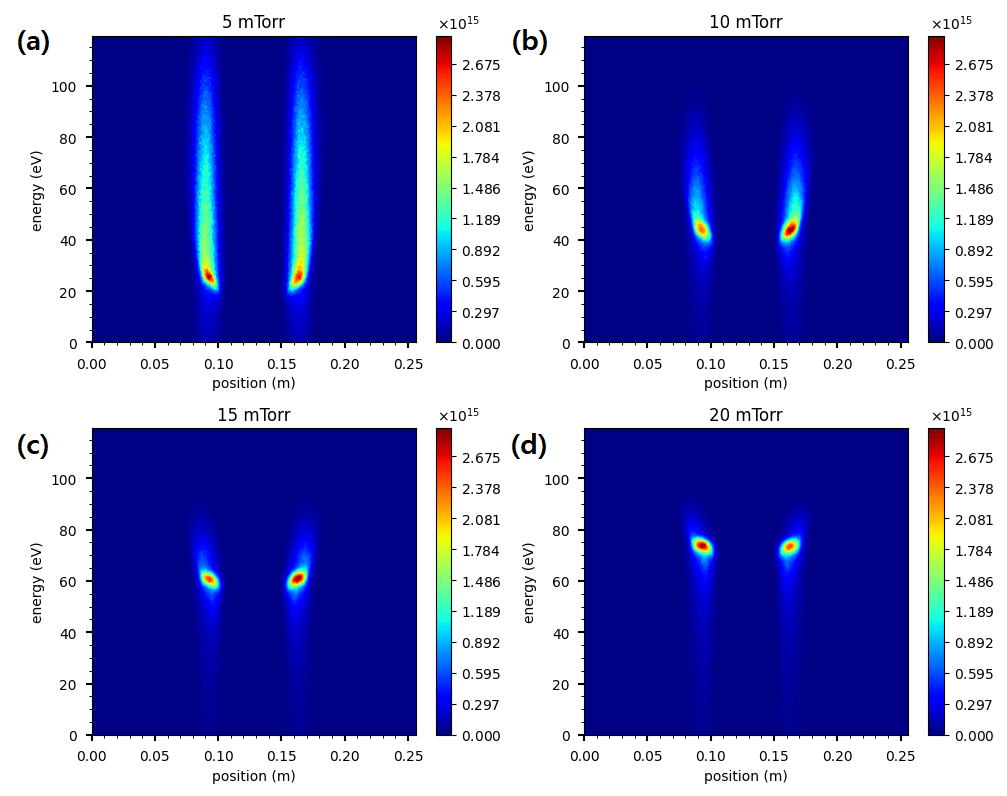
Figure 9 shows the ion energy and angle distribution functions (IEADFs) of the ions incident on the target surface, which are key parameters to calculate the target erosion and the deposition profiles of the thin film at the substrate. The IEADFs reveal how the incident ion energy and angular spread evolve with gas pressure. As the pressure increases, ions tend to strike the target with higher energies and narrower angular distributions, which is attributed to enhanced electric fields in the sheath and more directional ion acceleration toward the target surface. As the sputtering yield increases with the incident ion energy and ion angle [27], the change in gas pressure does not affect the sputtering yield abruptly because high-pressure operation results in high energy and narrow angle distributions. The more critical factor for thin film deposition is the magnet structure, which changes the plasma profile.
Figure 10 shows the relative errors between the estimated values by the transformer regression and the original PIC simulation results of the IEADFs. The relative errors were calculated only at the regions where the relative values of the original data are larger than 10% of the maximum, because the relative error becomes large when the denominator becomes small. Figure 10 shows that the relative errors are always less than 20%.
Figure 11 shows how the incident ion energy varies along the target surface. At all pressures, two distinct energy peaks appear at symmetric positions, corresponding to regions of strong magnetic confinement. The peak energy increases with pressure, while the spatial distribution remains relatively unchanged, indicating that the sheath field and magnetron geometry strongly govern the ion acceleration.
Figure 12 shows that the angular spread of ions at the target surface narrows with increasing pressure, while the spatial distribution remains symmetric. These results indicate that higher-pressure conditions lead to more collimated ion incidence, primarily due to stronger sheath electric fields and reduced scattering effects. The ion energy–angle distribution function (IEADF) in Figure 9 clearly reflects the trends discussed above. Figure 11 and Figure 12 present the spatial distributions of incident ion energy and angle along the target surface. The spatial variation in ion energy and incident angle along the target shows little dependence on pressure, indicating that the magnetic field has a more dominant influence on ion trajectories than pressure-dependent collisional effects.

4. New Prediction Capability

To evaluate the model’s interpolation capability, predictions were performed at intermediate pressures (7.5, 12.5, and 17.5 mTorr) that were not included in the training dataset. The analysis focused on three key plasma characteristics: (i) spatial distributions of electron density, (ii) spatial distributions of electric potential, and (iii) ion energy–angle distribution functions (IEADFs) of Ar ions incident on the target.
Figure 13 shows the interpolated spatial distributions of electron density. At 7.5 mTorr, a localized high-density region appears near the target. At 12.5 mTorr, this region broadens and the distribution becomes more diffuse. At 17.5 mTorr, the overall density decreases while the high-density region expands further. The predicted results reproduced both the spatial distribution and the pressure-dependent variation, and agreed with the experimental data in Figure 4. This level of agreement is typical of plasma behavior. At higher pressures, collisionality increases and electron energy is lost, so the density profile becomes more diffusive.
While the model reproduced the spatial patterns with high fidelity, it slightly underestimated the absolute density values. This underestimation is likely due to the wide dynamic range of the data, the under-representation of high-density regions, and the use of log-scale loss functions. To mitigate this bias, a post-training linear calibration was applied, yielding the relation, y t r u e 0.9912 y p r e d + 0.1425 . This correction reduced the systematic bias and improved the alignment of the predictions with the physical scale.
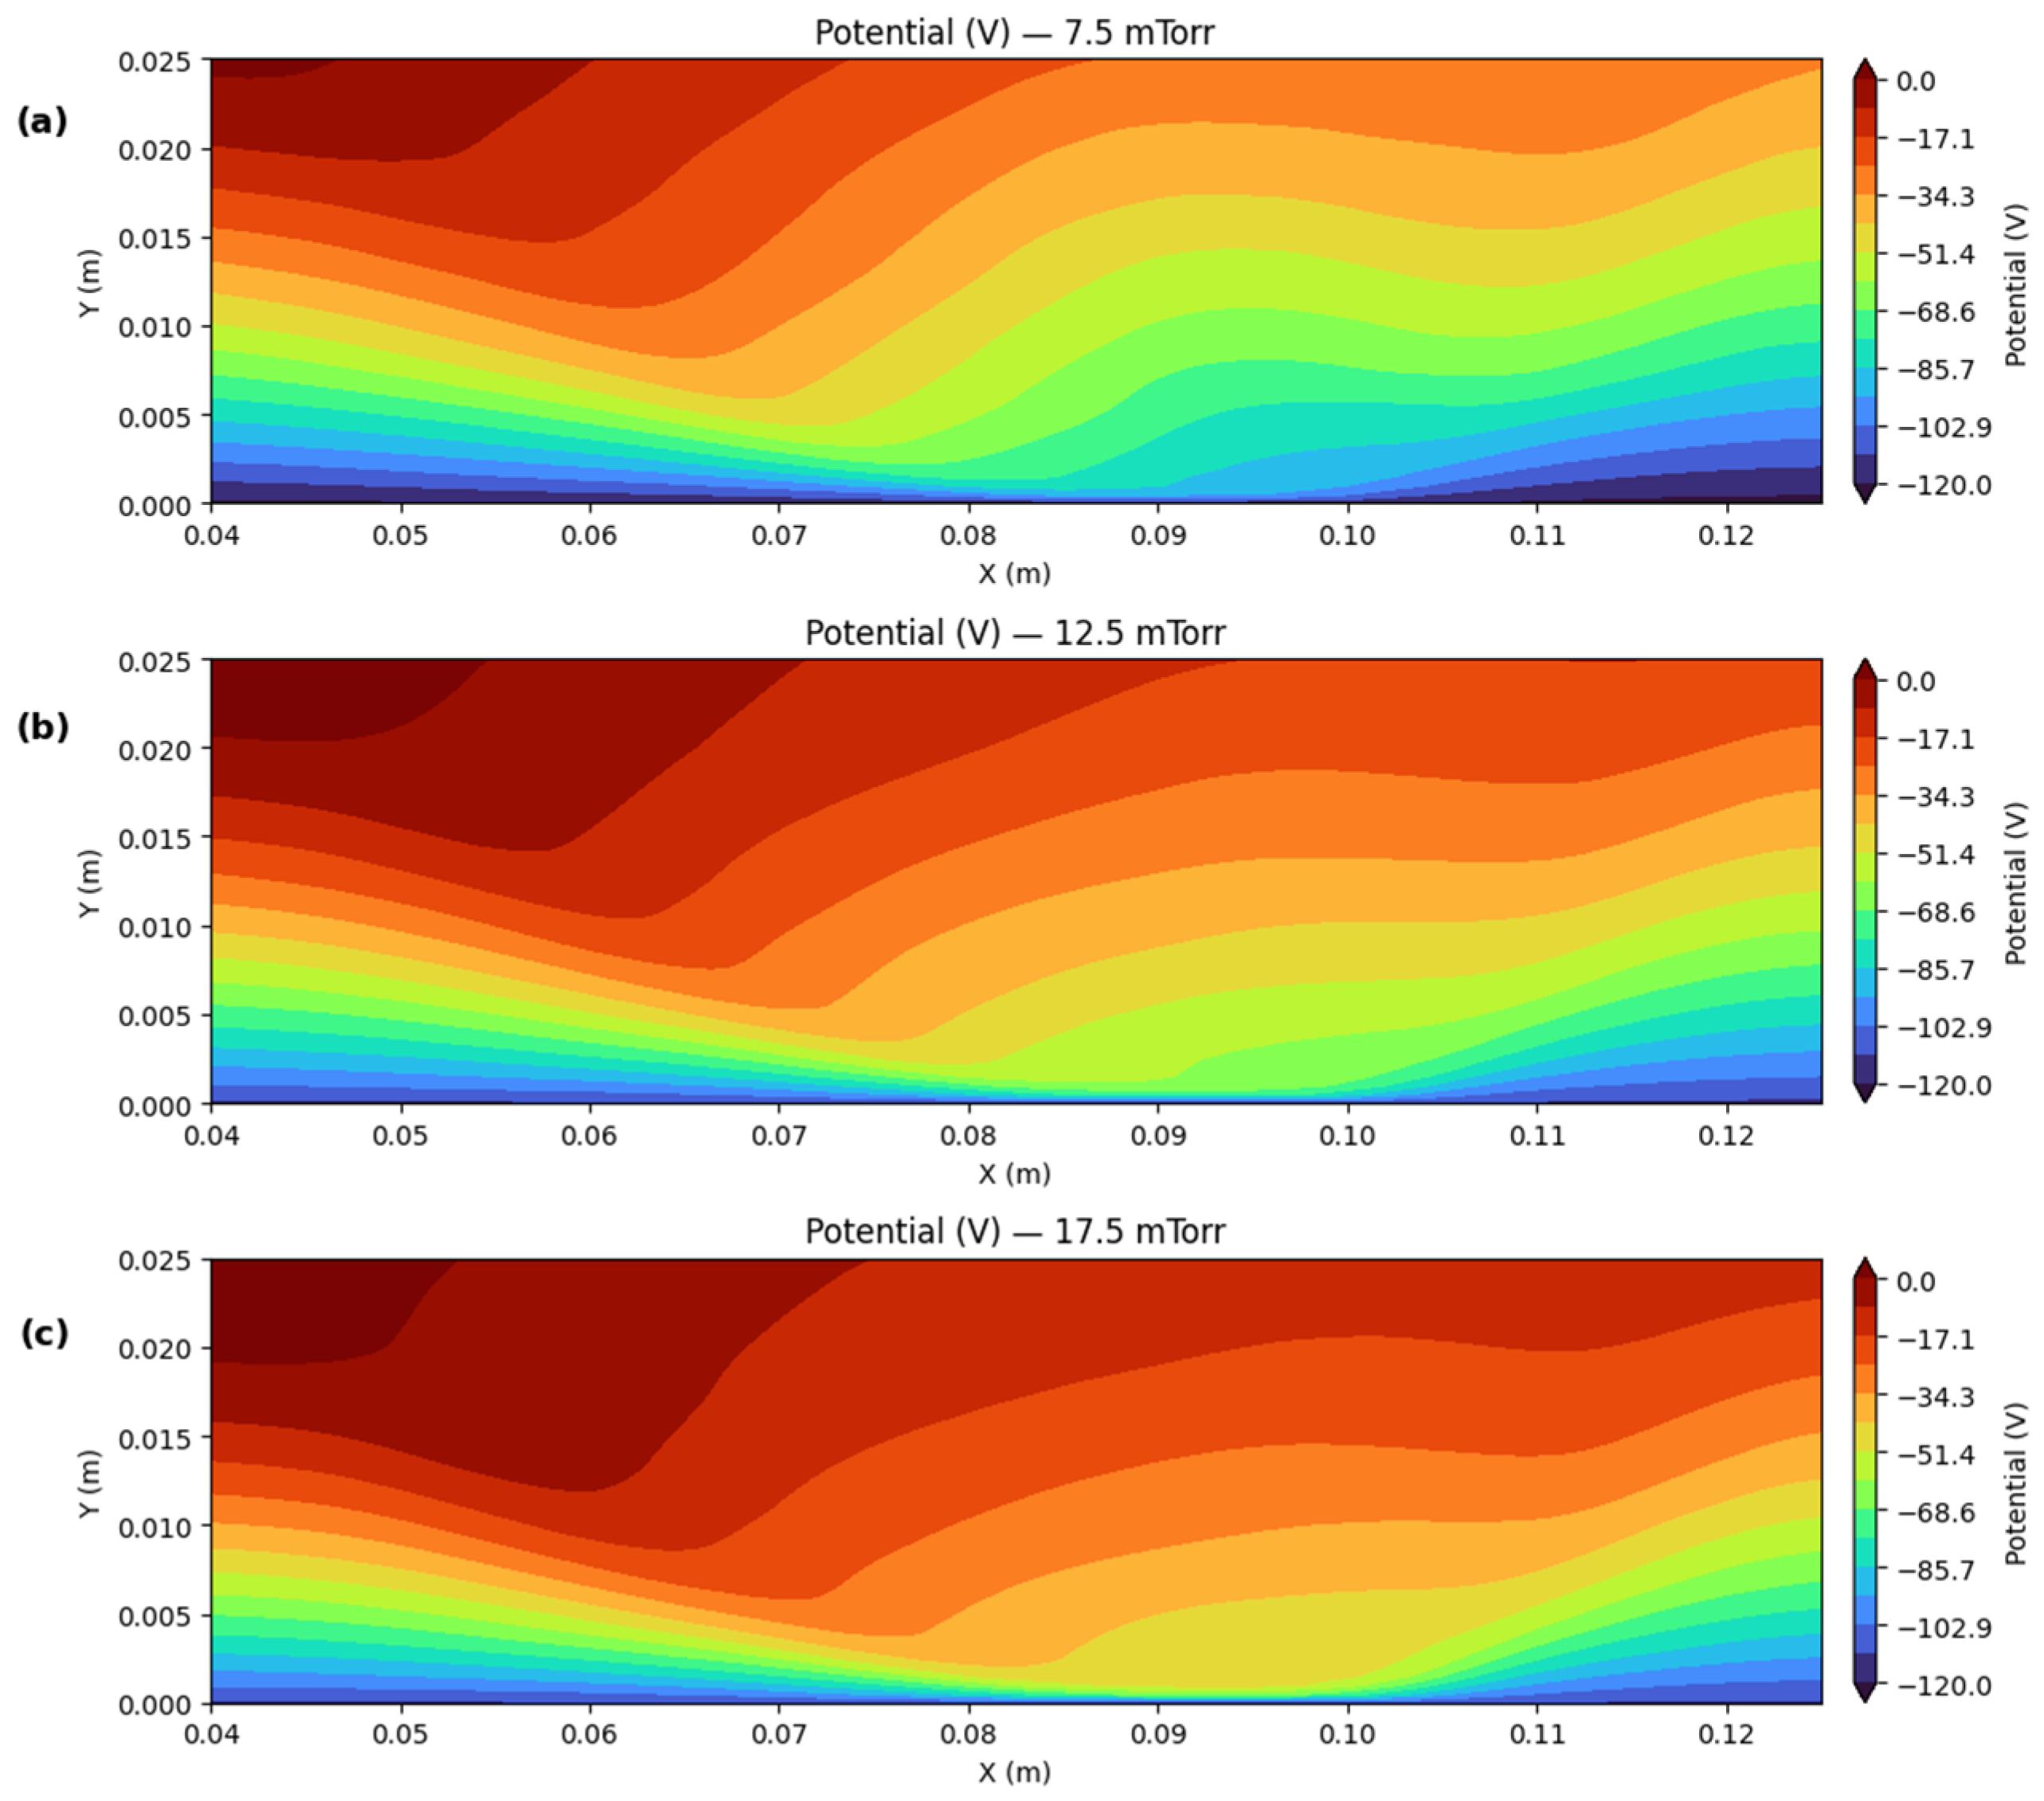
Figure 14 shows the interpolated spatial distributions of electric potential. The model achieved a validation error below 0.006. It reproduced both the sheath potential drop near the target and the flattening of the potential gradient with increasing pressure. At 7.5 mTorr, a steep gradient appeared, indicating strong ion acceleration. At 12.5 mTorr, the gradient became more moderate and the distribution smoother. At 17.5 mTorr, enhanced collisionality caused a marked reduction in the sheath potential drop. The predictions agree well with the experimental data in Figure 5. These results confirm that the model provides high interpolation capability not only for electron density but also for potential distributions.
Figure 15 presents the interpolated ion energy–angle distribution functions (IEADFs) of Ar ions incident on the target. At 7.5 mTorr, ions were concentrated within the 30–50 eV energy range and at narrow incidence angles around 5°. At 12.5 mTorr, collisional effects broadened the distribution and reduced the mean ion energy. At 17.5 mTorr, the ion energy decreased further, and the angular distribution became more uniform, indicating more homogeneous ion incidence across the target surface.
The model achieved an interpolation accuracy of about R 2 0.88 in log space. To reduce the underestimation tendency and improve consistency with the physical scale, isotonic and affine calibration ( y t r u e 1.013 y p r e d 0.188 ) were applied. The predicted IEADFs show good overall agreement with the experimental data in Figure 6. These results confirm that the transformer regression model can reliably interpolate both smooth plasma profiles and complex ion incidence characteristics.
The transformer regression model demonstrated notable interpolation performance by reliably predicting electron density, electric potential, and IEADFs under intermediate conditions not included in the training dataset. The expected results were consistent with established plasma physics, indicating that the proposed method can be used as a practical predictive tool for plasma process analysis and optimization.
In this study, the results obtained from particle-in-cell Monte Carlo collision (PIC-MCC) simulations were selected as input data for the artificial intelligence model owing to their ability to provide extensive datasets derived from detailed particle information. The PIC-MCC approach tracks the trajectories and interactions of all simulated particles, thereby enabling the generation of diverse diagnostic outputs. Likewise, when experimentally measured thin-film properties are available, the same transformer-based regression algorithm proposed in this work can be applied to such data. In the present research, only simulation-derived data were utilized for validation; however, numerous studies have demonstrated that experimental data can also be effectively employed to predict and enhance process quality in semiconductor manufacturing.

5. Conclusions

The combination of PIC simulation and transformer-based regression modeling proved effective for quantitative evaluation and physical interpretation of plasma characteristics in the DC magnetron sputtering system. The performance of magnetron sputtering is strongly influenced by plasma characteristics, whose complex dependencies on system parameters such as pressure and magnetic field configuration make accurate prediction challenging.
A parallelized two-dimensional PIC simulation was employed to compute key plasma quantities—including electron density, electric potential, and the argon ion energy–angle distribution function (IEADF)—at operating pressures of 5, 10, 15, and 20 mTorr. Building upon these data, a Transformer-based regression framework was trained to enable rapid interpolation and prediction of plasma properties without requiring exhaustive simulations for every condition.
Unlike conventional regression models, the proposed Transformer regressor leverages the encoder architecture with multi-head self-attention, feed-forward networks (FFN), residual connections, and layer normalization, ensuring both high expressive capacity and training stability even under wide dynamic range conditions. The model effectively captures nonlinear dependencies among physical variables while preserving spatial continuity and physical plausibility. Furthermore, the hybrid loss formulation—combining Huber and relative error components—enables accurate learning across several orders of magnitude, mitigating underestimation in high-density regions.
Physically reasonable and efficient predictions of plasma density, electric potential, and ion energy–angle distributions were obtained using the Transformer-based regression trained on limited simulation data. Predictions at unseen intermediate pressures (7.5, 12.5, 17.5 mTorr) exhibited strong agreement with physical expectations and reference simulations, achieving an interpolation accuracy of R2 ≈ 0.88 in logarithmic space. Post-processing calibration further reduced systematic bias and enhanced alignment with the physical scale.
In conclusion, integrating PIC simulation with Transformer-based AI modeling provides a powerful and data-efficient framework for predicting plasma characteristics in magnetron sputtering systems. The Transformer’s robust learning capability, stability under sparse data, and scalable generalization across physical regimes make it particularly advantageous when dealing with computationally intensive simulations involving multiple control parameters. The proposed methodology is readily extendable to other plasma processing systems and parameter studies, offering a valuable foundation for data-driven plasma science and industrial process optimization.

Author Contributions

Conceptualization, H.J.L.; Methodology, Y.J.K.; Software, Y.J.K.; Formal analysis, Y.J.K. and H.J.L.; Writing—original draft, Y.J.K. All authors have read and agreed to the published version of the manuscript.

Funding

This work was supported by the National Research Council of Science & Technology (NST) grant by the Korea government (MSIT) (CRC20014-000).

Institutional Review Board Statement

Not applicable.

Informed Consent Statement

Not applicable.

Data Availability Statement

Data are contained within the article.

Conflicts of Interest

The authors declare no conflict of interest.

References

  1. Kelly, P.J.; Arnell, R.D. Magnetron sputtering: A review of recent developments and applications. Vacuum 2000, 56, 159–172. [Google Scholar] [CrossRef]
  2. Safi, I. Recent aspects concerning DC reactive magnetron sputtering of thin films: A review. Surf. Coat. Technol. 2000, 127, 203–219. [Google Scholar] [CrossRef]
  3. Alami, J.; Gudmundsson, J.T.; Bohlmark, J.; Birch, J.; Helmersson, U. Plasma dynamics in a highly ionized pulsed magnetron discharge. Plasma Sources Sci. Technol. 2005, 14, 525–531. [Google Scholar] [CrossRef]
  4. Ellmer, K.; Welzel, T. Reactive magnetron sputtering of transparent conductive oxide thin films: Role of energetic particle bombardment. J. Mater. Res. 2012, 27, 765–779. [Google Scholar] [CrossRef]
  5. Sarakinos, K.; Alami, J.; Konstantinidis, S. High power pulsed magnetron sputtering: A review on scientific and engineering state of the art. Surf. Coat. Technol. 2010, 204, 1661–1684. [Google Scholar] [CrossRef]
  6. Gudmundsson, J. Physics and technology of magnetron sputtering discharges. Plasma Sources Sci. Technol. 2020, 29, 113001. [Google Scholar] [CrossRef]
  7. Berg, S.; Nyberg, T. Fundamental understanding and modeling of reactive sputtering processes. Thin Solid Films 2005, 476, 215–230. [Google Scholar] [CrossRef]
  8. Birdsall, C.K.; Langdon, A.B. Plasma Physics via Computer Simulation; Taylor & Francis Group: New York, NY, USA, 2005. [Google Scholar]
  9. Vahedi, V.; Surendra, M. A Monte Carlo collision model for the particle-in-cell method. Comput. Phys. Commun. 1995, 87, 179–198. [Google Scholar] [CrossRef]
  10. Verboncoeur, J.P. Particle simulation of plasmas: Review and advances. Plasma Phys. Control. Fusion 2005, 47, A231. [Google Scholar] [CrossRef]
  11. Nanbu, K.; Kondo, S. Analysis of Three-Dimensional DC Magnetron Discharge by the Particle-in-Cell/Monte Carlo Method. Jpn. J. Appl. Phys. 1997, 36, 4808–4814. [Google Scholar] [CrossRef]
  12. Ryabinkin, A.N.; Serov, A.O.; Pal, A.F.; Mankelevich, Y.A.; Rakhimov, A.T.; Rakhimova, T.V. Structure of DC magnetron sputtering discharge at various gas pressures: A two-dimensional particle-in-cell Monte Carlo collision study. Plasma Sources Sci. Technol. 2021, 30, 055009. [Google Scholar] [CrossRef]
  13. Zheng, B.; Fu, Y.; Wang, K.; Tran, T.; Schuelke, T.; Fan, Q.H. Comparison of 1D and 2D particle-in-cell simulations for DC magnetron sputtering discharges. Phys. Plasmas 2021, 28, 014504. [Google Scholar] [CrossRef]
  14. Hur, M.Y.; Kim, J.S.; Lee, H.J. The effect of negative ions from the target on thin film deposition in a direct current magnetron sputtering system. Thin Solid Films 2015, 587, 3. [Google Scholar] [CrossRef]
  15. Jo, Y.H.; Park, H.; Hur, M.Y.; Lee, H.J. Curved-boundary particle-in-cell simulation for the investigation of the target erosion effect of DC magnetron sputtering system. AIP Adv. 2020, 10, 125224. [Google Scholar] [CrossRef]
  16. Jo, Y.H.; Cheon, C.; Park, H.; Lee, H.J. Particle-in-Cell Simulations for the Improvement of the Target Erosion Uniformity by the Permanent Magnet Configuration of DC Magnetron Sputtering Systems. Coatings 2023, 13, 749. [Google Scholar] [CrossRef]
  17. Cheon, C.; Hur, M.Y.; Kim, H.J.; Lee, H.J. Multi-Step Simulations of Ionized Metal Physical Vapor Deposition to Enhance the Plasma Formation Uniformity. Coatings 2025, 15, 11. [Google Scholar] [CrossRef]
  18. Sigmund, P. Theory of sputtering. I. Sputtering yield of amorphous and polycrystalline targets. Phys. Rev. 1969, 184, 383–416. [Google Scholar] [CrossRef]
  19. Seah, M.P.; Nunney, T.S. Quantitative AES and XPS: The strength of evidence. J. Phys. D Appl. Phys. 2010, 43, 253001. [Google Scholar] [CrossRef]
  20. Behrisch, R.; Eckstein, W. Sputtering by Particle Bombardment; Springer: Berlin/Heidelberg, Germany, 2007. [Google Scholar]
  21. Vahedi, V.; DiPeso, G. Simultaneous Potential and Circuit Solution for Two-Dimensional Bounded Plasma Simulation Codes. J. Comput. Phys. 1997, 131, 149–163. [Google Scholar] [CrossRef]
  22. Kim, H.H.; Shin, J.H.; Lee, H.J. Control of the ion flux and energy distribution of dual-frequency capacitive RF plasmas by the variation of the driving voltages. J. Vac. Sci. Technol. A 2023, 41, 023004. [Google Scholar] [CrossRef]
  23. Vaswani, A.; Shazeer, N.; Parmar, N.; Uszkoreit, J.; Jones, L.; Gomez, A.N.; Kaiser, L.; Polosukhin, I. Attention is all you need. Adv. Neural Inf. Process. Syst. 2017, 30, 6000–6010. [Google Scholar]
  24. He, K.; Zhang, X.; Ren, S.; Sun, J. Deep residual learning for image recognition. In Proceedings of the IEEE Conference on Computer Vision and Pattern Recognition (CVPR), Las Vegas, NV, USA, 27–30 June 2016; pp. 770–778. [Google Scholar]
  25. Ba, J.L.; Kiros, J.R.; Hinton, G.E. Layer normalization. arXiv 2016, arXiv:1607.06450. [Google Scholar] [CrossRef]
  26. Huber, P.J. Robust Estimation of a Location Parameter. Ann. Math. Stat. 1964, 35, 73–101. [Google Scholar] [CrossRef]
  27. Yamamura, Y.; Tawara, H. Energy dependence of ion-induced sputtering yields from monatomic solids. At. Data Nucl. Data Tables 1996, 62, 149–253. [Google Scholar] [CrossRef]
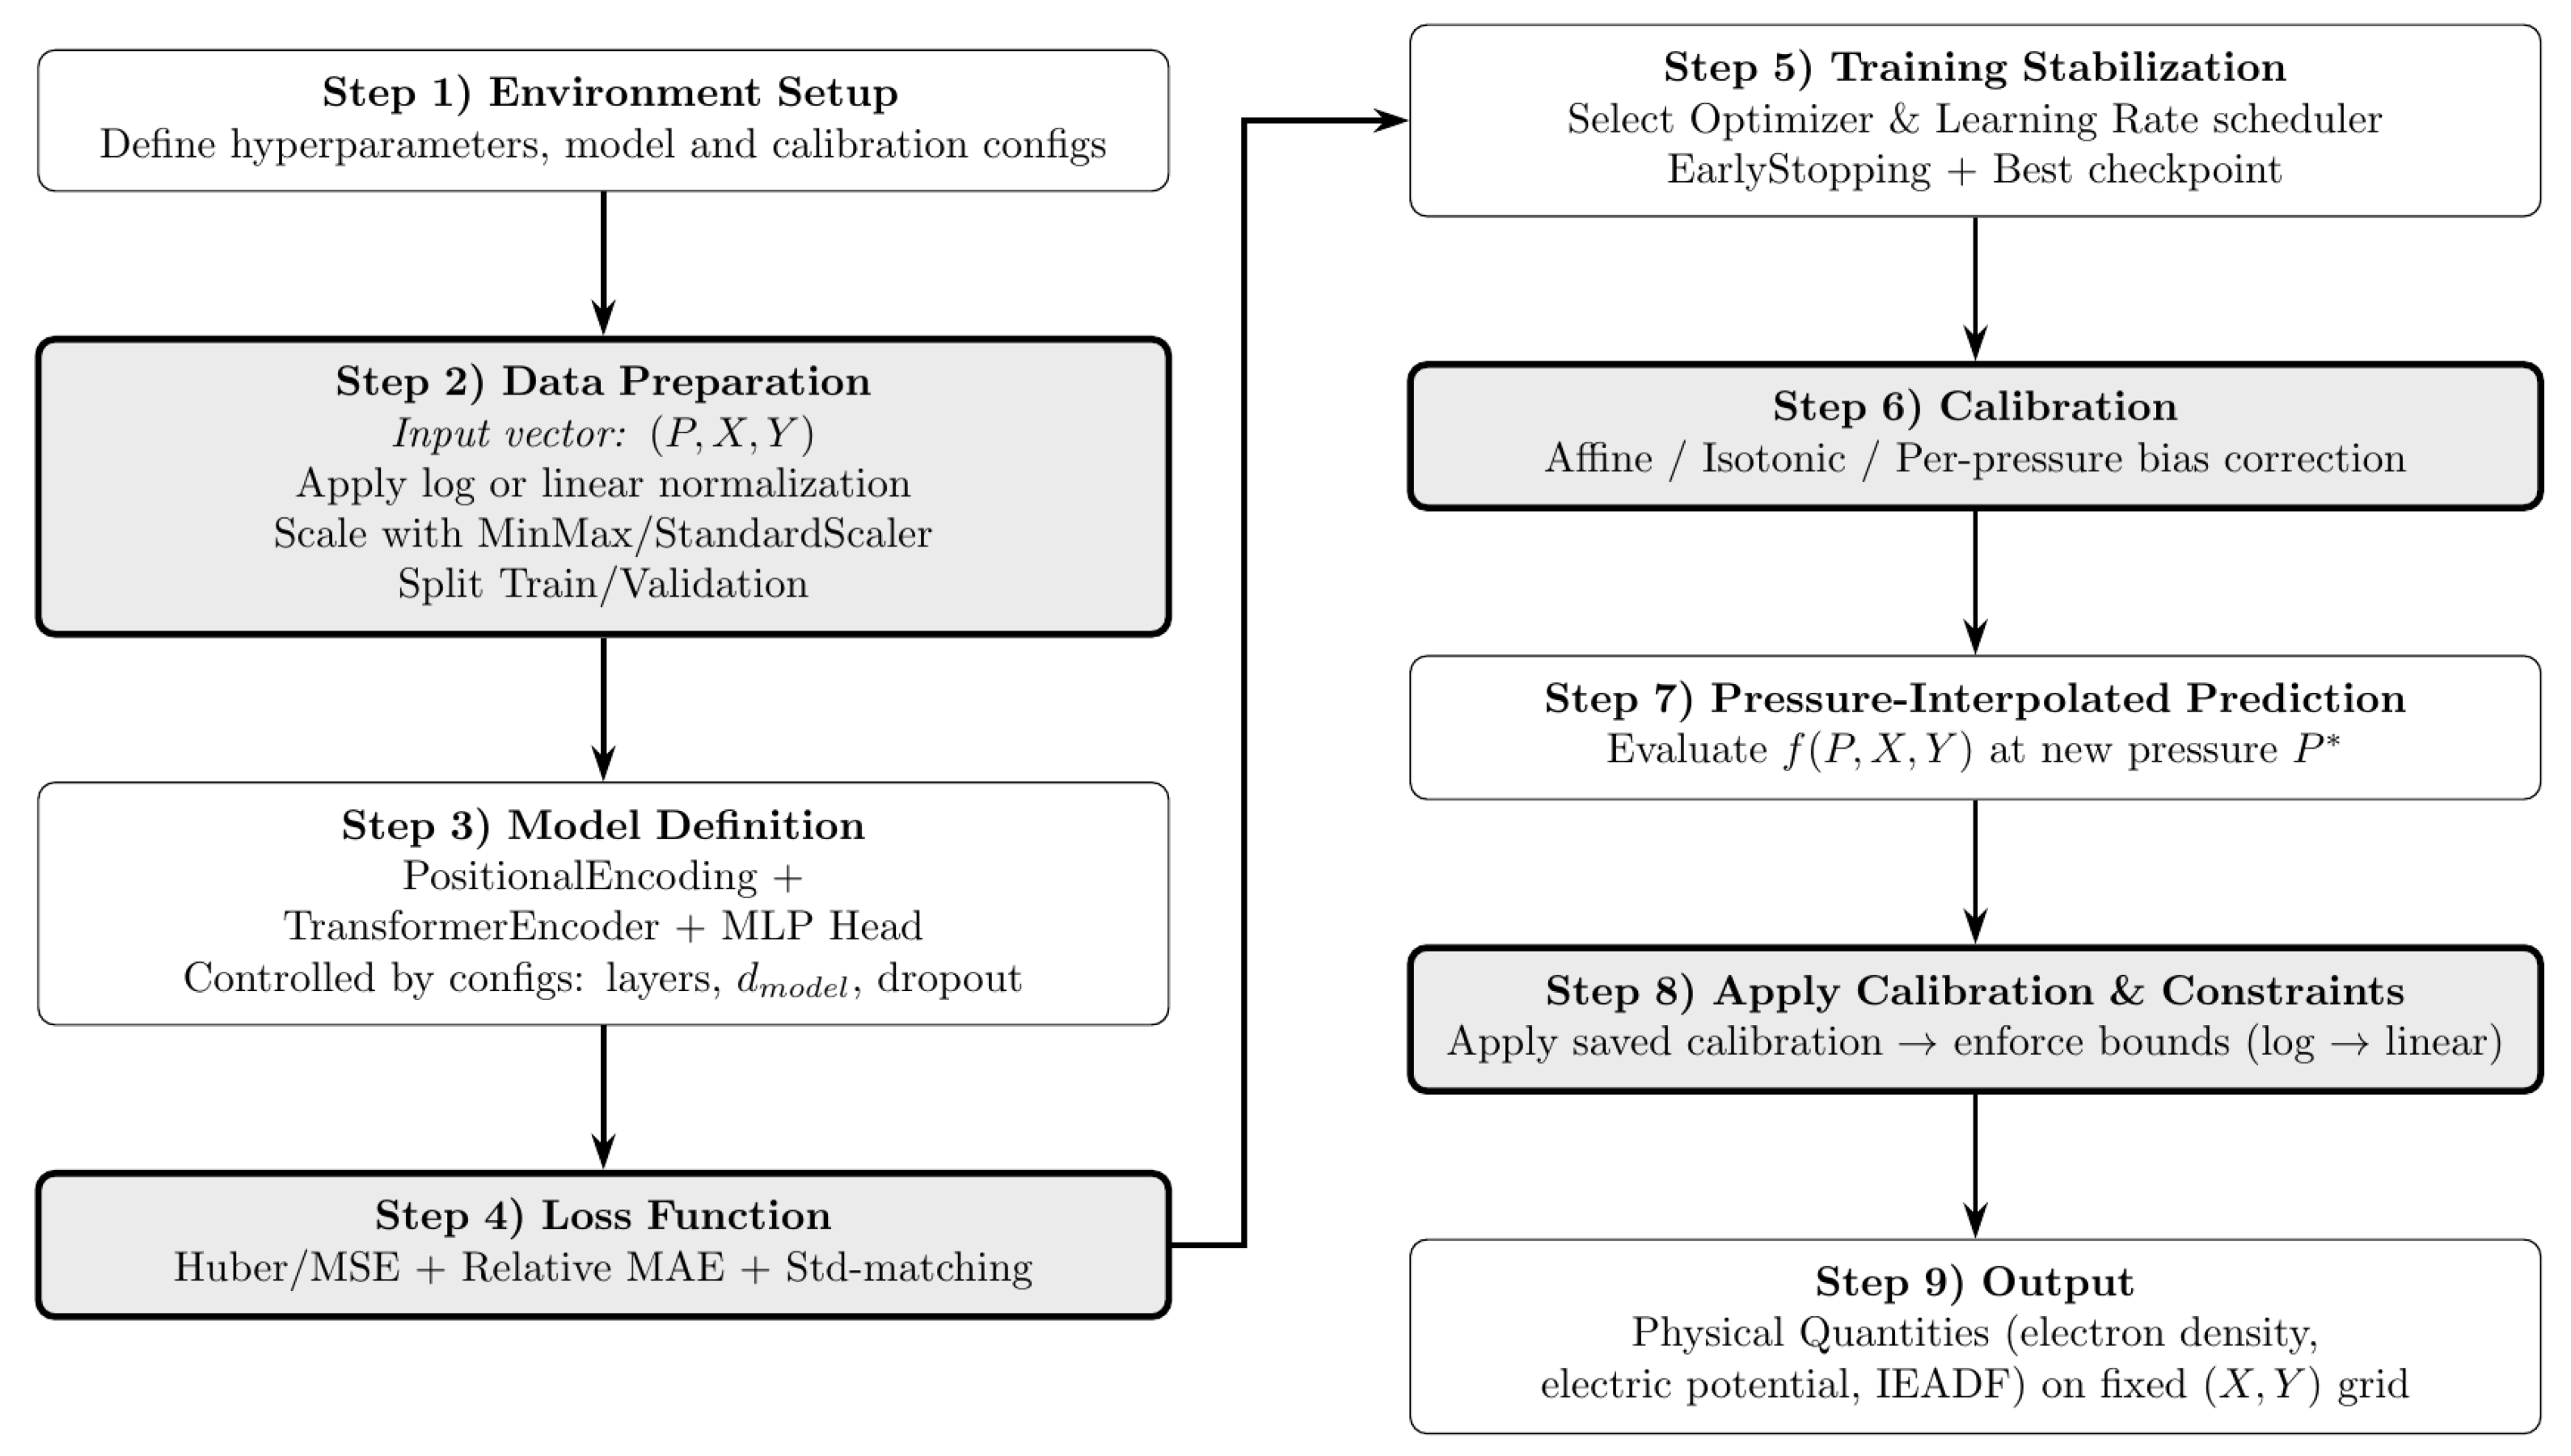
Figure 1. Pressure-Interpolated Transformer Regression Pipeline.
Coatings 15 01248 g001
Figure 2. Spatial distribution of electrons in the DC magnetron sputtering system. The figure shows the positions of individual electrons within the 2D simulation domain. Electrons are magnetically confined near the target surface, forming distinct high-density regions due to the imposed magnetic field configuration.
Coatings 15 01248 g002
Figure 3. Spatial distribution of magnetic field strength and direction in the DC magnetron sputtering system. The color map represents the magnetic field magnitude (in Gauss), and the black streamlines indicate the direction of the magnetic field within the 2D simulation domain. The target is located at the bottom of the domain (x = 0), and the symmetry of the distribution reflects the underlying magnetic field structure.
Coatings 15 01248 g003
Figure 4. Spatial distributions of electron density at different pressures, (a) 5 mTorr, (b) 10 mTorr, (c) 15 mTorr, and (d) 20 mTorr.
Coatings 15 01248 g004
Figure 5. Spatial distributions of electric potential in the vicinity of the target, showing significant changes in spatial distribution with increasing pressure, (a) 5 mTorr, (b) 10 mTorr, (c) 15 mTorr, and (d) 20 mTorr.
Coatings 15 01248 g005
Figure 6. The relative errors of the estimated potential profiles compared with the results obtained by the PIC simulation for the variation in gas pressures of (a) 5 mTorr, (b) 10 mTorr, (c) 15 mTorr, and (d) 20 mTorr.
Coatings 15 01248 g006
Figure 7. Angular distribution of Ar ions incident on the target at different pressures of 5, 10, 15, and 20 mTorr.
Coatings 15 01248 g007
Figure 8. Energy distributions of Ar+ ions incident on the target at different pressures of 5, 10, 15, and 20 mTorr.
Coatings 15 01248 g008
Figure 9. Ion energy–angle distribution functions (IEADFs) of Ar+ ions incident on the target at different pressures, (a) 5 mTorr, (b) 10 mTorr, (c) 15 mTorr, and (d) 20 mTorr.
Coatings 15 01248 g009
Figure 10. The relative errors of the IEADF estimations compared with the results obtained by the PIC simulation for the variation in gas pressure at (a) 5 mTorr, (b) 10 mTorr, (c) 15 mTorr, and (d) 20 mTorr.
Coatings 15 01248 g010
Figure 11. Position-resolved energy distributions of Ar ions incident on the target at different pressures, (a) 5 mTorr, (b) 10 mTorr, (c) 15 mTorr, and (d) 20 mTorr.
Coatings 15 01248 g011
Figure 12. Position-resolved angular distributions of Ar ions incident on the target at different pressures, (a) 5 mTorr, (b) 10 mTorr, (c) 15 mTorr, and (d) 20 mTorr.
Coatings 15 01248 g012
Figure 13. Spatial distributions of electron density predicted by the Transformer regression model at intermediate pressures, (a) 7.5 mTorr, (b) 12.5 mTorr, and (c) 17.5 mTorr.
Coatings 15 01248 g013
Figure 14. Spatial distributions of electric potential predicted by the Transformer regression model at intermediate pressures, (a) 7.5 mTorr, (b) 12.5 mTorr, and (c) 17.5 mTorr. The results show that with increasing pressure, the potential gradient near the target becomes weaker and the plasma potential distribution flattens, in agreement with physical expectations.
Coatings 15 01248 g014
Figure 15. Interpolated ion energy–angle distribution functions (IEADFs) of Ar ions incident on the target at intermediate pressures of (a) 7.5 mTorr, (b) 12.5 mTorr, and (c) 17.5 mTorr.
Coatings 15 01248 g015
Table 1. Transformer-based regression model hyperparameters and training setup.
ComponentValue/Description
d m o d e l 64
n h e a d 4
N l a y e r 7
Feed-forward dim. ( d f f ) 512
Dropout rate0.1
OptimizerAdamW ( l r = 5 × 10 4 , weight decay 5 × 10 5 )
Learning scheduleWarm-up (5 epochs)→ReduceLROnPlateau
Batch size8192
Epochs/Early stopping1200/120 patience
Validation split10% of the total dataset
Table 2. Simulation parameters of the considered DC magnetron sputtering system.
Working gasAr
Target materialCu
Domain size256 mm × 70 mm
Number of cells (grid size)512 × 140 (∆x = ∆y = 0.5 mm)
Number ratio of real particles to a super-particle5 × 107
∆t1.0 × 10−11 s
Discharge current0.5 A
Magnetic field250 Gauss (on target)
Gas pressure5, 10, 15, 20 mTorr
Boundary conditions for the fieldDirichlet on the top and the bottom boundaries
Neumann on the left and the right boundaries
Disclaimer/Publisher’s Note: The statements, opinions and data contained in all publications are solely those of the individual author(s) and contributor(s) and not of MDPI and/or the editor(s). MDPI and/or the editor(s) disclaim responsibility for any injury to people or property resulting from any ideas, methods, instructions or products referred to in the content.