Article

Microfluidic Edible Coatings: Multiphase VOF Modeling, Physicochemical Properties, Image Analysis, and Applications in Fried Foods

by
Cristian Aarón Dávalos-Saucedo
1,
Giovanna Rossi-Márquez
1,*,
Sergio Rodríguez-Miranda
1 and
Carlos E. Castañeda
2,*
1
Tecnológico Nacional de México, Instituto Tecnológico “José Mario Molina Pasquel y Henríquez”, Unidad Académica Lagos de Moreno, Lagos de Moreno C.P. 47480, Jalisco, México
2
Centro Universitario de los Lagos, Universidad de Guadalajara, Lagos de Moreno C.P. 47460, Jalisco, Mexico
*
Authors to whom correspondence should be addressed.
Coatings 2025, 15(11), 1245; https://doi.org/10.3390/coatings15111245 (registering DOI)
Submission received: 30 September 2025 / Revised: 19 October 2025 / Accepted: 22 October 2025 / Published: 26 October 2025
(This article belongs to the Section Coatings for Food Technology and System)

Abstract

Edible coatings are widely used to modulate oil uptake and moisture in fried foods. In this study, we evaluated a microfluid-assisted flow-blurring spray against conventional application by dipping/spraying, focusing on the coating efficiency and preliminary implications for sustainable process. This study combines benchtop experiments with a near-nozzle numerical analysis where the gas–liquid interface and primary breakup are modeled using the Volume of Fluid (VOF) approach implemented in OpenFOAM, configured for a flow-blurring geometry to generate whey protein isolate (WPI) coatings. Viscosity, density, solid content, and contact angle were validated experimentally and used in the simulation setup. An image-based droplet pipeline quantified spray characteristics, yielding a volumetric median diameter D50 = 83.69 µm and confirming process uniformity. Contact angles showed marked substrate dependence: hydrophilic surfaces, 68°–85°; hydrophobic surfaces, 95°–110°. For turkey sausages, sessile-drop contact angles were not determinable (N.D.) due to wicking/roughness; wettability was therefore assessed on smooth surrogates and via performance metrics. Fit-for-purpose simulation procedures are outlined. Microfluidic application (WPI-McF) lowered oil uptake versus uncoated controls. Together, robust modeling, targeted image analytics, and high-precision microfluidics enable rational tuning of coating microstructure and barrier performance, offering a scalable pathway to reduce lipid content and enhance fried food quality.

1. Introduction

The increasing demand for healthier and more sustainable food products has driven significant interest in edible coatings as an alternative to reduce the fat uptake in conventional fried food. One of the most promising aspects of these materials is that they can be made from natural biopolymers—such as proteins, carbohydrates, and lipids—many of which can be sourced from food industry by-products, helping to reduce waste. These coatings are typically applied directly to the food surface using simple methods like dipping, spraying, or brushing, forming a thin protective layer that helps maintain product quality and extend shelf life [1,2]. Deep-fat frying presents another challenge, as it often results in considerable fat uptake due to the loss of water from the food’s interior and the simultaneous absorption of oil [3,4,5]. Since oil uptake is closely related to the moisture content of the product, developing strategies to reduce it is a priority. Edible coatings have shown real potential, helping to limit fat absorption and control moisture migration, which in turn preserves crispness and improves shelf life [6,7,8]. Likewise, coatings are traditionally applied using the immersion method, in which the food is submerged in the coating solution and then allowed to drain. This method is simple but has the disadvantage of wasting a lot of coating solution.
An alternative to solve this problem is the use of microfluidic techniques, which allow efficient control of coating application volumes, thus achieving improved performance. Advances in microfluidic technologies have further revolutionized the generation of uniform, controlled microstructures in food processing. Techniques such as flow focusing and flow blurring allow for the precise generation of monodisperse droplets, which can be deposited as edible coatings with finely tuned physicochemical properties [9,10]. This level of control is vital for achieving optimal barrier performance-parameters such as droplet size, viscosity, and interfacial dynamics strongly influence coating efficacy. The integration of computational fluid dynamics (CFD) methods-particularly those employing the Volume of Fluid (VOF) approach-has enhanced their ability to predict and optimize multiphase flow behavior in microfluidic systems [11,12].
In parallel, image-based droplet analysis methods have emerged as a powerful tool to quantify droplet size, distribution, and morphological features, providing experimental validation for CFD simulations. Recent studies have shown that coupling advanced image preprocessing with automated droplet detection can accurately characterize sprayed droplets on scales from tens to hundreds of micrometers [13]. This hybrid computational-experimental approach is critical for verifying model predictions of spray uniformity and droplet impact behavior on different types of substrates.
Building on these advances, the present work designs a microfluidic system to deposit a whey protein coating onto to-be-fried turkey sausages. Our approach uniquely integrates CFD-VOF modeling, droplet image analysis, and experimental validation-covering the entire pipeline from computational spray design to final product assessment.
The literature [14,15,16] documents that the parameter D 50 can be tuned by Gas–Liquid Ratio (GLR), recess, and nozzle gap; the parameters remained fixed in order to isolate deposition effects across substrates and to quantify droplet statistics at a single point.
In this study, the CFD/VOF module is not intended as a parametric sweep but as a mechanistic complement to the experiments, aimed at on the near-nozzle, sub-millisecond primary breakup that our optical setup cannot fully resolve. The simulations are used to understand the onset and morphology of wave-to-ligament-to-pinch-off and to check first-order consistency against measured droplet statistics (median scale).
This study aims to develop a concentric microfluidic flow-blurring (FB) spray against conventional dipping. The FB pipeline couples a closed deposition chamber with fixed nozzle–sample distance and image-based droplet metrology to tune operating points to measured spray statistics (e.g., D50) and link them to film-level outcomes on food substrates. This enables a process control and material-efficient coatings while remaining comparable in barrier performance to dipping under the same formulation and frying protocol conditions.

2. Materials and Methods

2.1. Reagents and Supplies

Commercial whey protein isolate (WPI) was obtained from Nature’s Best (Hauppauge, NY, USA), sorbitol and all other reagents were purchased from Sigma-Aldrich (Steinheim, Germany), and microbial transglutaminase (mTG, Activa® WM, Ajinomoto Co., Tokyo, Japan), derived from the culture of Streptoverticillium sp., was supplied by Ajinomoto Co. (Tokyo, Japan). Commercial turkey sausages and sunflower oil were purchased from a local market.

2.2. Microfluidic Coating System

The microfluidic system (Figure 1) used compressed air (1). Pressure was stabilized with manual regulators and an air-conditioning unit, providing a constant 0.30–2.0 bar supply. The air was split into two lines: (i) one line fed the outer annulus of the concentric microfluidic device (4); (ii) the second line pressurized a sealed reservoir (2) containing the edible-coating formulation, which then flowed to the inner capillary of the device (4). The two streams met coaxially at the nozzle exit to produce the spray.
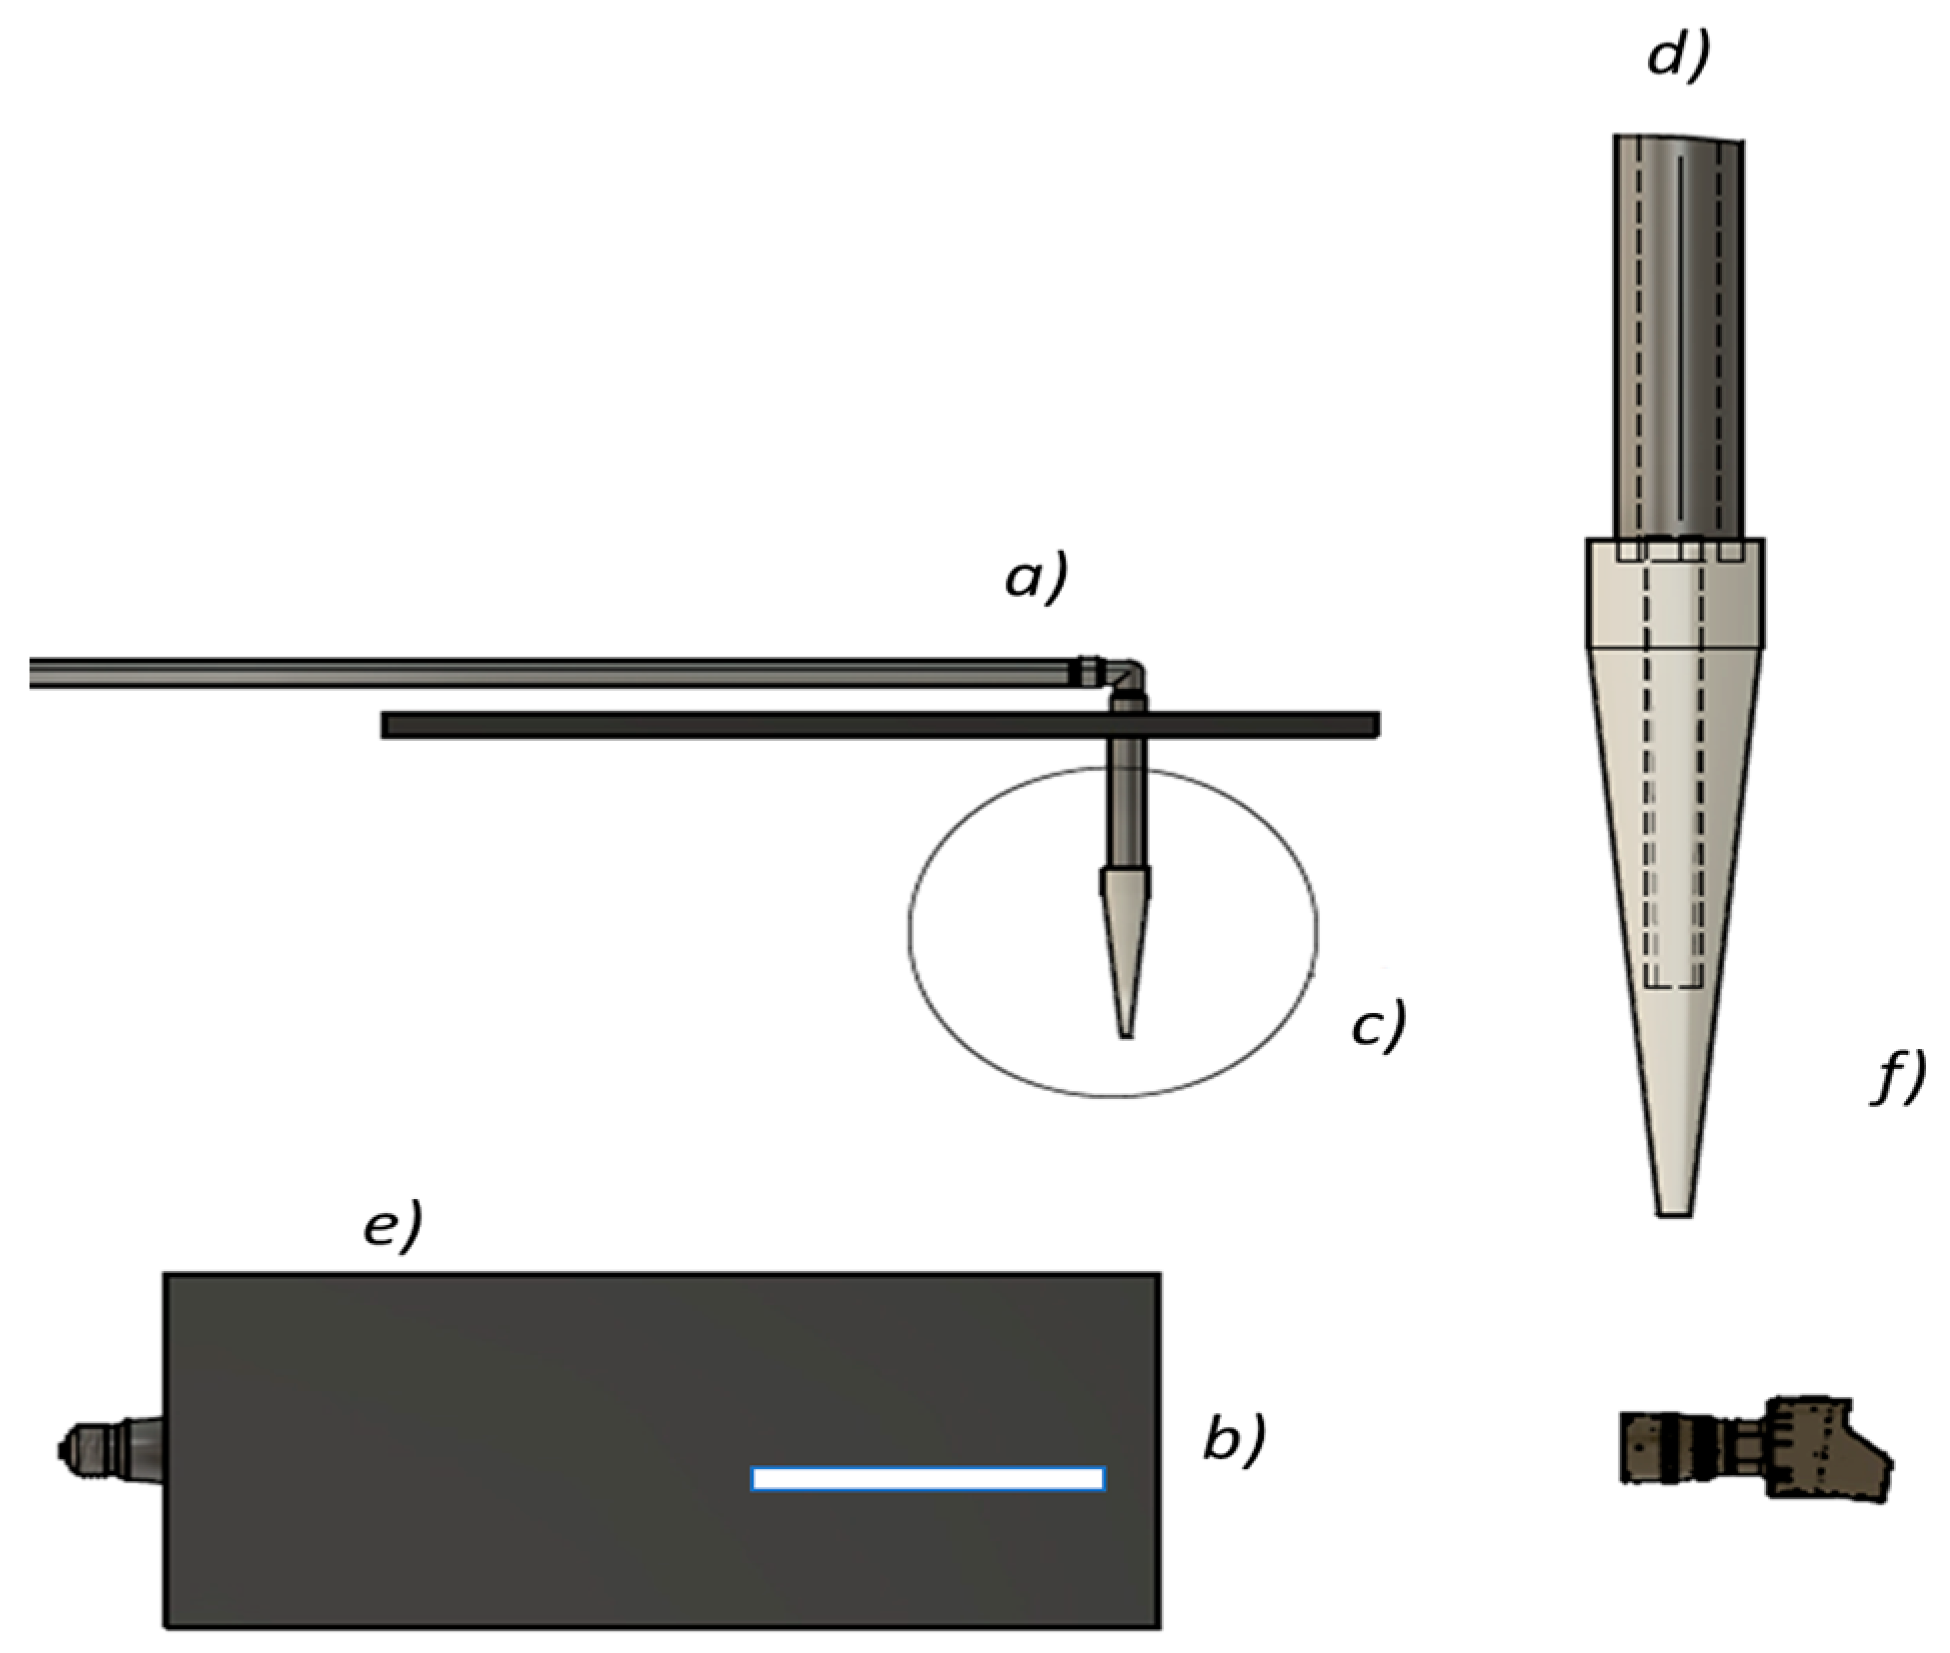
Samples were placed on a wire rack inside the deposition chamber (5); (750 × 480 × 330 mm) and the chamber was closed with a cover (3) to limit drafts during deposition. A white-light source (6) provided uniform illumination for imaging and subsequent image analysis. Figure 2 shows in detail the microfluidic device and the experimental validation system.

2.3. Microfluidic Device and Spray Setup

A microfluidic atomization device based on the flow-blurring principle was fabricated with a custom concentric nozzle (inner capillary) using a borosilicate capillary and outer air annulus from polymer. Couplings and tubing were used to set up the experimental arrangement as shown in Table 1 and Figure 3.
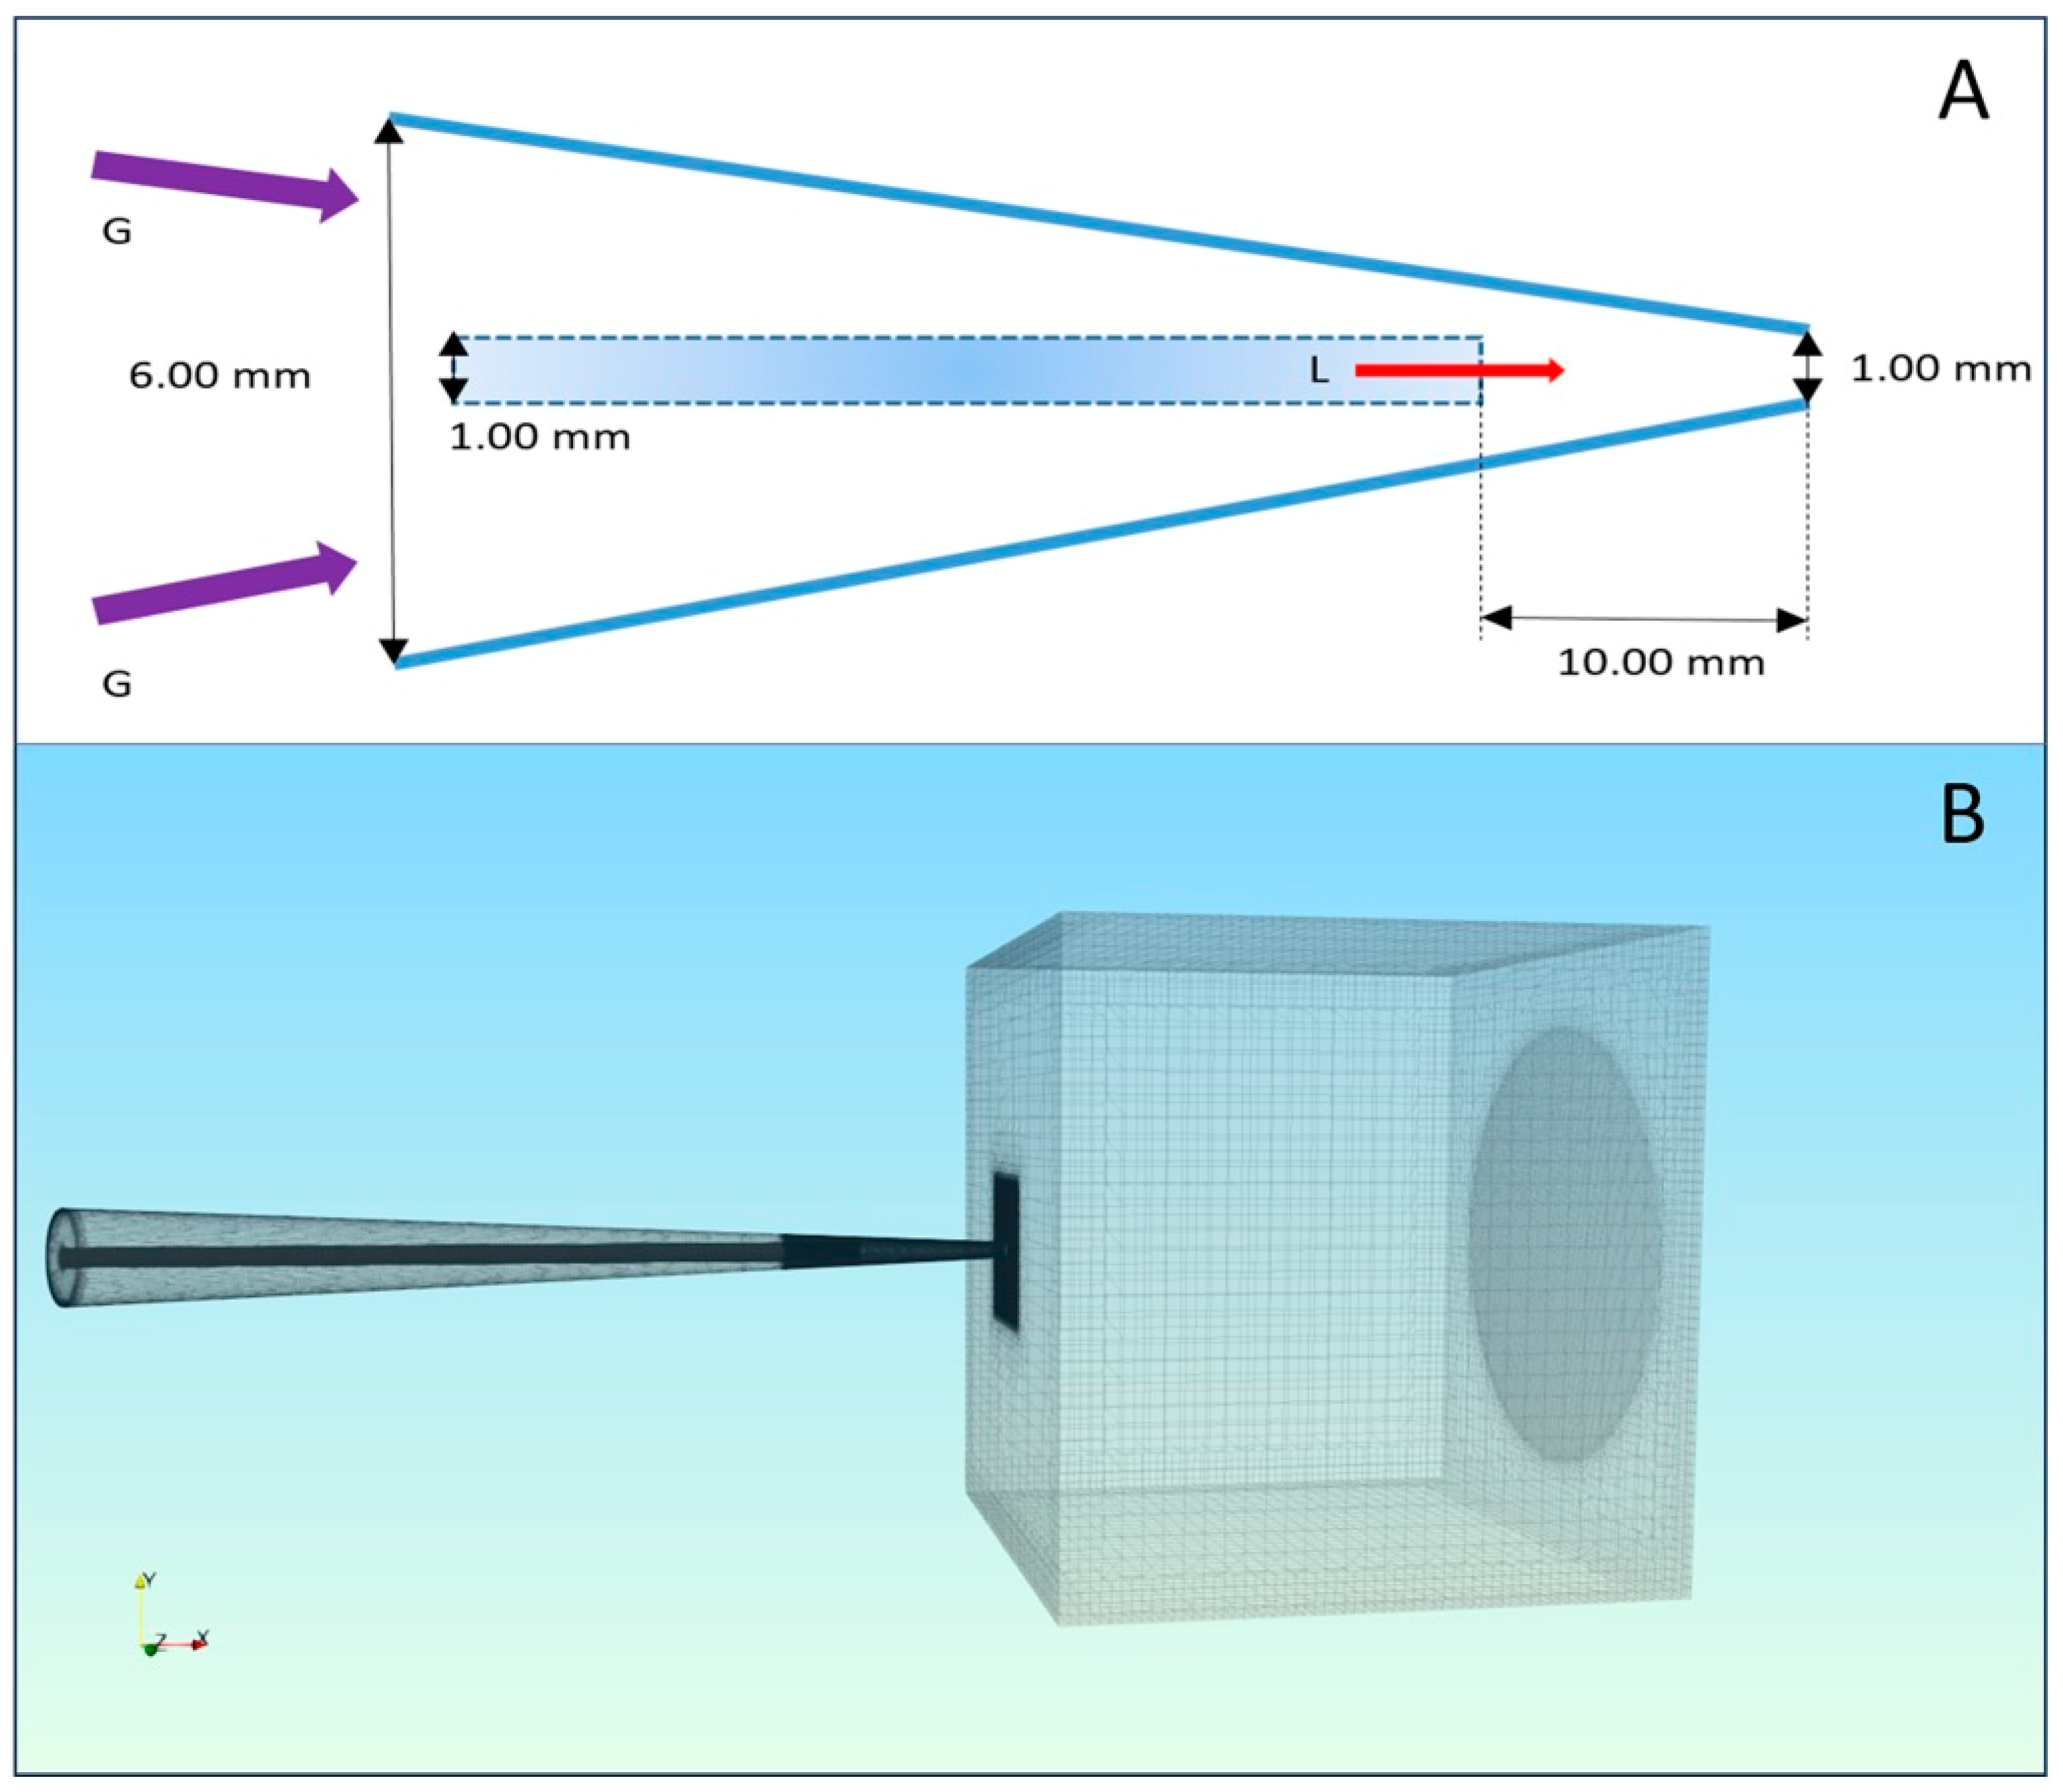
The two capillaries were aligned concentrically under a stereomicroscope and fixed with curable epoxy resin, leaving a 6 mm annular gap for air. Alignment ensures uniform coaxial flow and stable atomization after a preliminary test. Pressurized air and the liquid coating solution were introduced coaxially, and droplets were formed at the nozzle exit. Operating bench conditions (0.0005–0.0010 L⋅min−1) was tuned to target D50 and coverage; however, the CFD input set used to analyze near-nozzle primary breakup employed the calibrated pair (water = 35 mL·min−1; air = 2.5 mL·min−1) to match the observed ligament/jet, confirmed by image-based droplet analysis (Section 3.4).

2.4. Closed Deposition Chamber

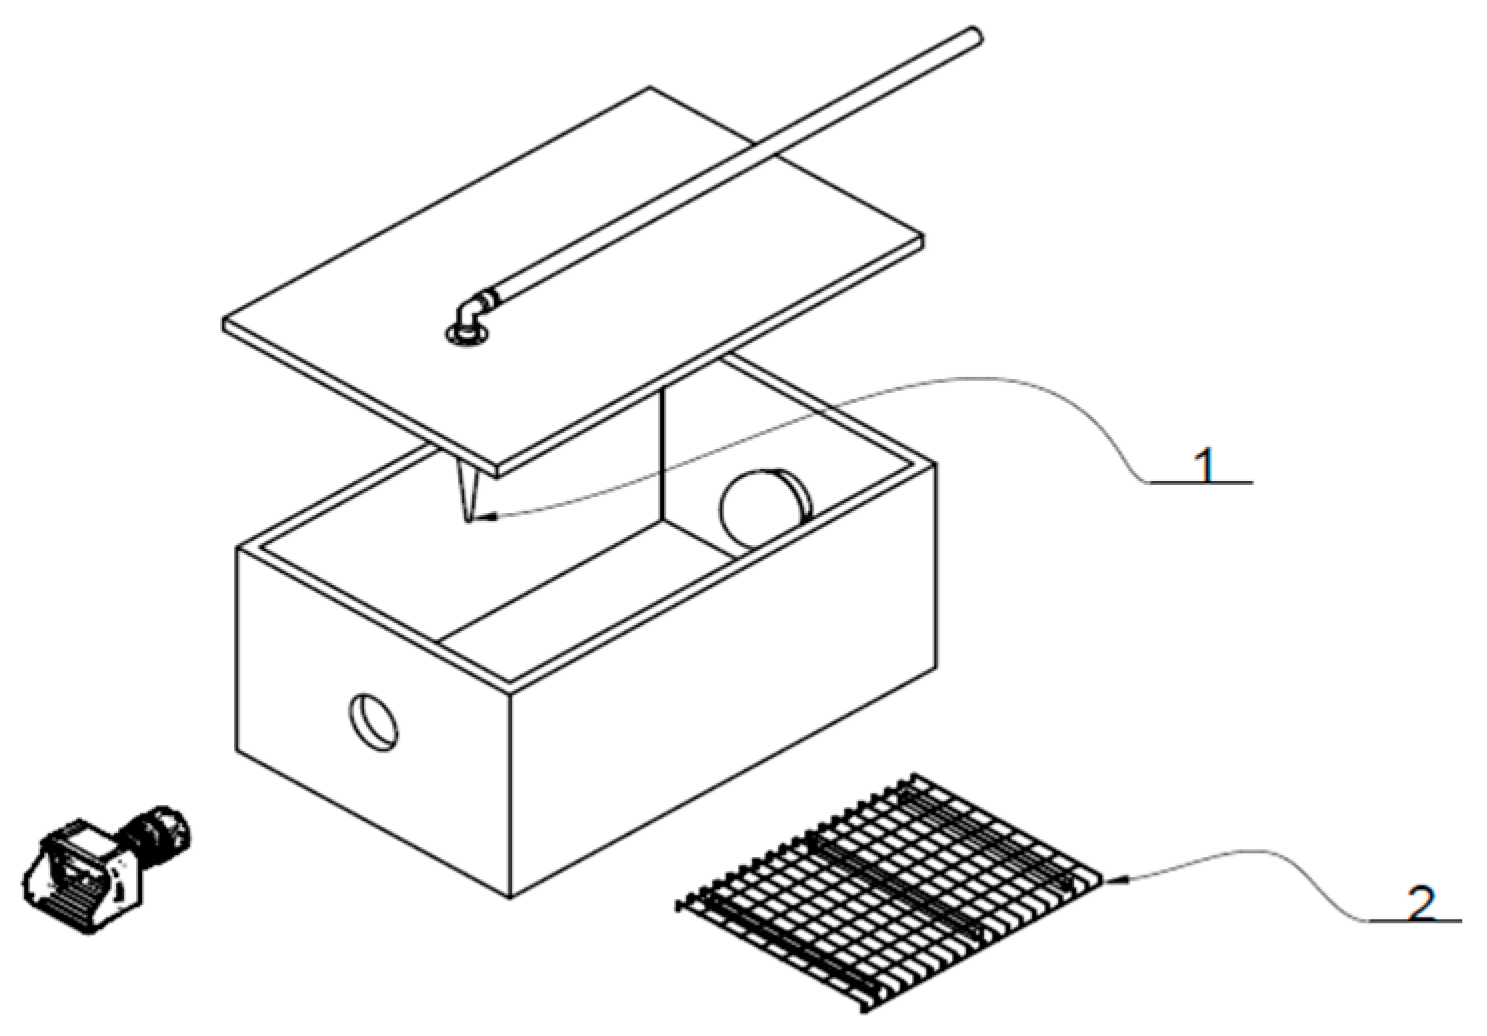
To prevent ambient drafts and minimize coating loss, the nozzle was mounted vertically on the lid of a sealed black opaque plastic chamber (750 mm × 480 mm × 330 mm, 5 mm wall thickness).
The nozzle tip protruded below the lid and adjusted at 150 mm from the sample as shown in Figure 4.
The chamber layout (750 × 480 × 330 mm) and, a fixed 150 mm nozzle–sample distance used to limit drafts and standardize optics; droplet statistics from the image pipeline (volumetric median diameter D50 = 83.69 µm) served as targets for setting operating points.

2.5. Sample Preparation

Turkey sausage was cut into uniform cubes measuring 1 cm × 1 cm × 1 cm (1 cm3). The samples were gently dried with absorbent paper to remove any surface moisture and were left to equilibrate at room temperature (25 °C) for 10 min prior to coating (fresh sample). The samples were then placed in food-grade polyethylene bags and stored under refrigeration until further use.

2.6. Coating Formulation (WPI)

To prepare the coating, a whey protein-based solution was formulated and prepared by dissolving 9 g of whey protein isolate in 125 mL of distilled water; then, 5 g of non-crystallizable sorbitol was added to the mixture as a plasticizer. The solution was then heated to 90 °C for 20 min to promote protein denaturation. After this period, the mixture was allowed to cool to room temperature until use. The coating formulation enzymatically reticulated was prepared adding the transglutaminase (8 U/g of WPI) and stirring for 16 h at room temperature. The resultant coating was used within one hour to coat the samples.

2.7. Conventional Coating Application (WPI-Conv)

Fresh turkey sausages (cut into 1 cm3 cube) served as model fried products. Samples were immersed in the coating solution for 5 min and let drained for 10 min before the frying process. To equate the humidity conditions of the samples prepared with the protein coating, control was made by immersing the samples for 5 min in distilled water (Water-coat) and let drain as described before.

2.8. Microfluidic Coating Application (WPI-McF)

Fresh turkey sausages (cut into 1 cm3 cube) served as model fried products and were fixed horizontally on the wire rack. Each sausage sample was held in position for 1 s while the coating was applied. Subsequently, the sample was rotated 180 °C, and a second application was performed for an additional second to ensure uniform and complete coating coverage. As described before, to equate the humidity conditions of the samples prepared with the protein coating, control was made by applying distilled water (Water-coat) as coating solution.

2.9. Frying Process

Oil was preheated to 180 °C to ensure consistent processing conditions, and fresh oil was used for every replicate. Each sample was fried individually for two minutes, turning it over halfway through to ensure even cooking on both sides. After frying, the samples were placed on paper towels at room temperature for about 10 min to allow excess oil to drain from the surface. This frying process resulted in a light golden-brown color, indicating proper doneness. To avoid bias, the samples were fried in a random sequence.

2.10. Water Content and Oil Content Determination

Once the samples had cooled, their moisture and fat contents were measured. To determine the moisture level, each sample was dried in a convection oven at 105 °C until it reached a constant weight, with the weight loss recorded as moisture content, following AOAC guidelines [14]. The percentage of water present, as well as the amount lost during frying, were then calculated.
w a t e r   c o n t e n t % = w w e t w d r y w w e t × 100
Oil content was assessed using the Soxhlet extraction method, employing hexane as the solvent, in accordance with AOAC (1990) [14]. All reported values for moisture and fat content are based on dry matter, excluding the oil component.

2.11. Determination of the Minimum Required Volume of Coating Solution

2.11.1. Conventional Coating Application (WPI-Conv)

Each cube was individually immersed in the WPI solution for 5 min to ensure full surface coverage. Upon removal, excess coating was allowed to drip off for 10 min. The coating solution was kept in a graduated container, and its volume was recorded before (Vi) and after (Vf) the coating of all samples. The total volume used was calculated as follows:
V u s e d = V i V f
The average volume of coating solution required per cube was calculated using the following:
V s a m p l e = V u s e d x
The results are expressed as the mean ± standard deviation in milliliters per cube (mL/cube).

2.11.2. Microfluidic Coating Application (WPI-McF)

As with the conventional method, the initial and final volumes of the coating solution were recorded, and the volumes were calculated using the same formulas.

2.12. Image Preprocessing and Droplet Analysis

2.12.1. Image Acquisition for Droplet Characterization

A 12 MP CMOS camera (Canon EOS REBEL T3) fitted with a lens (53 mm focal length, f/2.8, Field of view: 100 mm × 100 mm pixel size 5.3 µm, exposure: 1/4000 s, ISO 100, to freeze droplet motion) was mounted outside the chamber, was positioned facing a velvet backdrop through an optical-grade acrylic window (anti-reflection coated).
Images were stored as 8-bit TIFF files and processed with the pipeline in Section 3.4. to extract droplet size and surface-coverage statistics. For deposition studies, static images were recorded after spray cessation to examine droplet footprints on the substrates.
To validate the microfluidic atomization process, an image-based droplet detection procedure was developed that quantifies droplet size distribution (30–400 µm). This pipeline was implemented in Python (v3.9) using the OpenCV library for robust preprocessing, segmentation, and contour-based morphometry. The acquired images were analyzed using ImageJ 1.54g [15] with an open-source plugin drop snake [16] for contact angle measurement.

2.12.2. Image Preprocessing

Image Capture and Grayscale Conversion
Raw spray images were captured with a high-resolution camera (pixel size 5.3 µm) under fixed illumination (5 W LED illumination). The sprayer was spotted inside the deposition chamber where the pictures were taken, as shown in Figure 5. Images were loaded in grayscale to simplify subsequent thresholding and integrity checks.
Image Preprocessing and Segmentation Process
To ensure accurate measurement and identification of individual droplets, a structured image preprocessing pipeline was implemented using Python and OpenCV. All original grayscale images were first subjected to a 3 × 3 median filter, aimed at reducing impulsive noise (salt-and-pepper) while preserving the sharpness of droplet edges, which are necessary for reliable boundary-based measurements [17].
Following denoising, a morphological closing operation was performed using a 5 × 5 elliptical structuring element. The operation effectively filled small voids inside droplets and smoothed their external contours, helping to maintain the morphological integrity of each object. To further enhance the contrast between droplets and background, a Bottom-Hat transformation was applied [18]. We enhanced dark droplet regions by subtracting a morphologically closed version of each image from the original, which increases the contrast of small droplets against the bright background.
Linear contrast stretching was applied by remapping the 2nd and 98th percentile of pixel intensities to the full dynamic range (0–255). This normalization equalized contrast across different images, facilitating robust segmentation regardless of illumination variability. Binarized images whit Otsu’s thresholding method [19,20], which automatically determines an optimal threshold that optimize inter-class variance. Approach appropriate because the given typically bimodal intensity distribution observed in the images.
After thresholding, a morphological opening was applied to remove isolated bright pixels and small clusters. This step removed isolated bright pixels and small clusters not corresponding to true droplets. Internal hole filling was conducted using morphological closing operations with elliptical kernels ranging from 3 × 3 to 5 × 5, ensuring that all droplets were represented as continuous and filled regions [21].
To avoid partial object inclusion in analysis, droplets in contact with any image edge were excluded using connected component analysis. Only fully captured droplets were considered for size estimation. All intermediate processing results-each representing a distinct stage in the pipeline-were saved into separate output folders to allow traceability and offline inspection if needed.
For the final detection and analysis phase, the binarized images were reloaded and optionally smoothed using a Gaussian blur (kernel size: 5 × 5) to suppress any remaining high-frequency noise. Edge detection was applied using the Canny operator, with threshold parameters adjusted through an interactive interface to accommodate image variability. Contour extraction retained only the external contours to prevent multiple detections of the same object [22,23]. Each identified contour was represented by a list of coordinates (x,y) outlining the droplet boundary, which served as the basis for subsequent geometric analysis and diameter computation.
Droplet Detection and Analysis
A minimum enclosing circle was fitted, yielding a diameter in pixels. A calibration factor (µm/pixel) was applied, derived from reference images taken at fixed distance containing disks of known diameters (20, 50, 100, 200, 400–1000 µm). This approach yields validated droplet diameter estimates.
To convert these measurements into physical units (µm), a calibration factor (µm/pixel) was applied. This factor was derived from a set of reference images captured at a fixed distance, containing printed calibration disks with known diameters (20, 50, 100, 200, and 400–1000 µm). Each reference disk was imaged under the same optical and lighting conditions as the droplet images, and their projected pixel diameters were used to construct a linear regression model that yielded a conversion factor. This approach provided a validated means of translating pixel-based measurements into micrometric units with acceptable accuracy for spray characterization applications.
Statistical Analysis
Descriptive statistics (mean, standard deviation, min, max, P25, P50, P75) were computed for droplet diameters, allowing a thorough characterization of the spray distribution. The volume median diameter (D50) was of special interest for correlating with spray uniformity in CFD simulations.
Droplet diameters and centroid positions were saved in structured CSV files, enabling subsequent correlation analyses with the simulated results.

2.13. Contact Angle Measurement

To evaluate the wettability of various surfaces, static contact angles were measured from side-view images of sessile droplets deposited on each substrate. The open-source software ImageJ 1.54g (National Institutes of Health, Bethesda, MD, USA) was used in conjunction with the DropSnake plugin, which allows for semi-automated contour fitting of droplet profiles and precise contact angle estimation. Each droplet profile was manually traced using control points placed along the liquid-solid and liquid-air interfaces, allowing DropSnake to fit a B-spline curve to the droplet contour. The contact angle was then calculated at the three-phase contact point by fitting a tangent to the spline at the liquid-solid interface. For each surface type, a minimum of five droplets were analyzed to obtain representative contact angle values. The measurements were repeated under consistent environmental conditions (temperature, humidity, and lighting) to ensure comparability between surfaces. This approach has been widely validated in the literature for its balance between accuracy and ease of use in laboratory settings involving static droplet analysis [15,16]. For porous and absorbent matrices (e.g., sausage surface), sessile-drop goniometry was not applicable (N.D.) due to uncontrolled imbibition and roughness; quantitative wetting should instead rely on methods tailored to porous solids (e.g., Washburn method), dynamic hysteresis on smooth surrogates (tilting-plate), or captive-bubble in hydrated environments.

2.14. Multiphase Modeling and Volume of Fluid (VOF)

2.14.1. Geometry and Mesh Generation

The computational domain reproduces the microfluidic device employed in the experimental setup. STL surfaces for the inner capillary, outer capillary, water inlet, air inlet and pressure outlet were generated in CAD Fusion 360 Autodesk and imported into OpenFOAM v8. Edges were extracted with surfaceFeatureExtract and the background blockMesh was discretised with a base cell size of 0.01 m. Adaptive refinement with snappyHexMesh was applied up to level 10 (minimum cell size 9.8 × 10⁻³ mm) in regions surrounding the liquid jet and at phase interfaces. The final mesh contained 4.9 × 10⁶ hexa-dominant cells; quality metrics satisfied modeling best-practice (non-orthogonality <65°, aspect ratio <10), as confirmed by checkMesh [24,25]. Mesh-independence was confirmed when ΔD50 < 1% between 4.9 × 10⁶ and 6.2 × 10⁶ cells [26]. Although the nozzle geometry is axisymmetric, all simulations reported in this study were performed in full 3D and without symmetry planes, so that azimuthal instabilities (corrugation–ligament–pinch-off) intrinsic to primary atomization could evolve without artificial constraints. The boundary conditions were volumetric-flow inlets for air and liquid, a pressure outlet, and no-slip on walls.

2.14.2. Governing Equations and Physical Models

A two-phase, incompressible Volume of Fluid (VOF) formulation (Appendix A) was solved with surface tension coupling using the continuum surface force method. The governing equations comprise the conservative transport, the continuity equation and the Navier–Stokes momentum equation augmented by a surface tension term Continuity Equation and considering the physical properties (Table 2), specifically, Equations (4) Phase-fraction transport (VOF), (5) Continuity, (6) Momentum (Navier–Stokes); (7) Surface tension force, (8) Mixture density, and (9) Mixture viscosity [27,28,29,30].
α t + α u + α 1 α u r = 0
u = 0
ρ u t + ρ u u = p + μ u + u T + f σ + ρ g
f σ = σ , κ , α , κ = n , n = α α
ρ = α , ρ water + 1 α , ρ air
μ = α , μ water + 1 α , μ air
where fσ represents the surface tension force. Surface tension at the air–water interface was fixed in this study σ = 0.0721 N m−1.
Surface tension at the air–water interface was set to the IAPWS reference value for pure water σ = 0.0721 N m−1 at 24.00 °C [33], consistent with the isothermal incompressible VOF assumption implemented in interFoam.
In interFoam (VOF, incompressible, isothermal), the energy equation is not solved; therefore, no temperature field is defined within the domain. The solver operates with constant fluid properties specified in constant/transportProperties. For the present simulations, the liquid phase was modeled as water-like at 24.00 °C, using reference values from the International Association for the Properties of Water and Steam (IAPWS). The density (ρ) was taken from IAPWS-95 [31] the dynamic viscosity (η) from IAPWS [32], and the surface tension (σ) from the Revised Release on the Surface Tension of Ordinary Water [33]. The corresponding parameters were as follows:
ρ = 997.30 kg·m−3 η = 0.911 mPa·s ν = η/ρ = 9.14 × 10⁻⁷ m2·s−1 σ = 0.0721 N·m−1
These properties represent the thermophysical state of pure water at the experimental temperature and serve as reliable constants for isothermal CFD benchmarks. To preserve hydrodynamic similarity with experimental conditions while avoiding unverified rheological parameters of the coating, strict water-like tolerances were imposed: |Δρ|/ρH2O ≤ 0.3% and |Δν|/νH2O ≤ 1.0%. Within these limits, the Reynolds, Weber, and Ohnesorge numbers remain within ±2% of the reference case, ensuring that the atomization regime is unchanged. Using σH2O (24 °C) as a constant is justified because, in air-assisted and flow-blurring configurations, the primary breakup is far more sensitive to liquid viscosity and momentum ratio than to minor (1–2 mN·m−1) variations in surface tension. Therefore, this parametrization provides a traceable and reproducible reference for incompressible, isothermal VOF simulations.
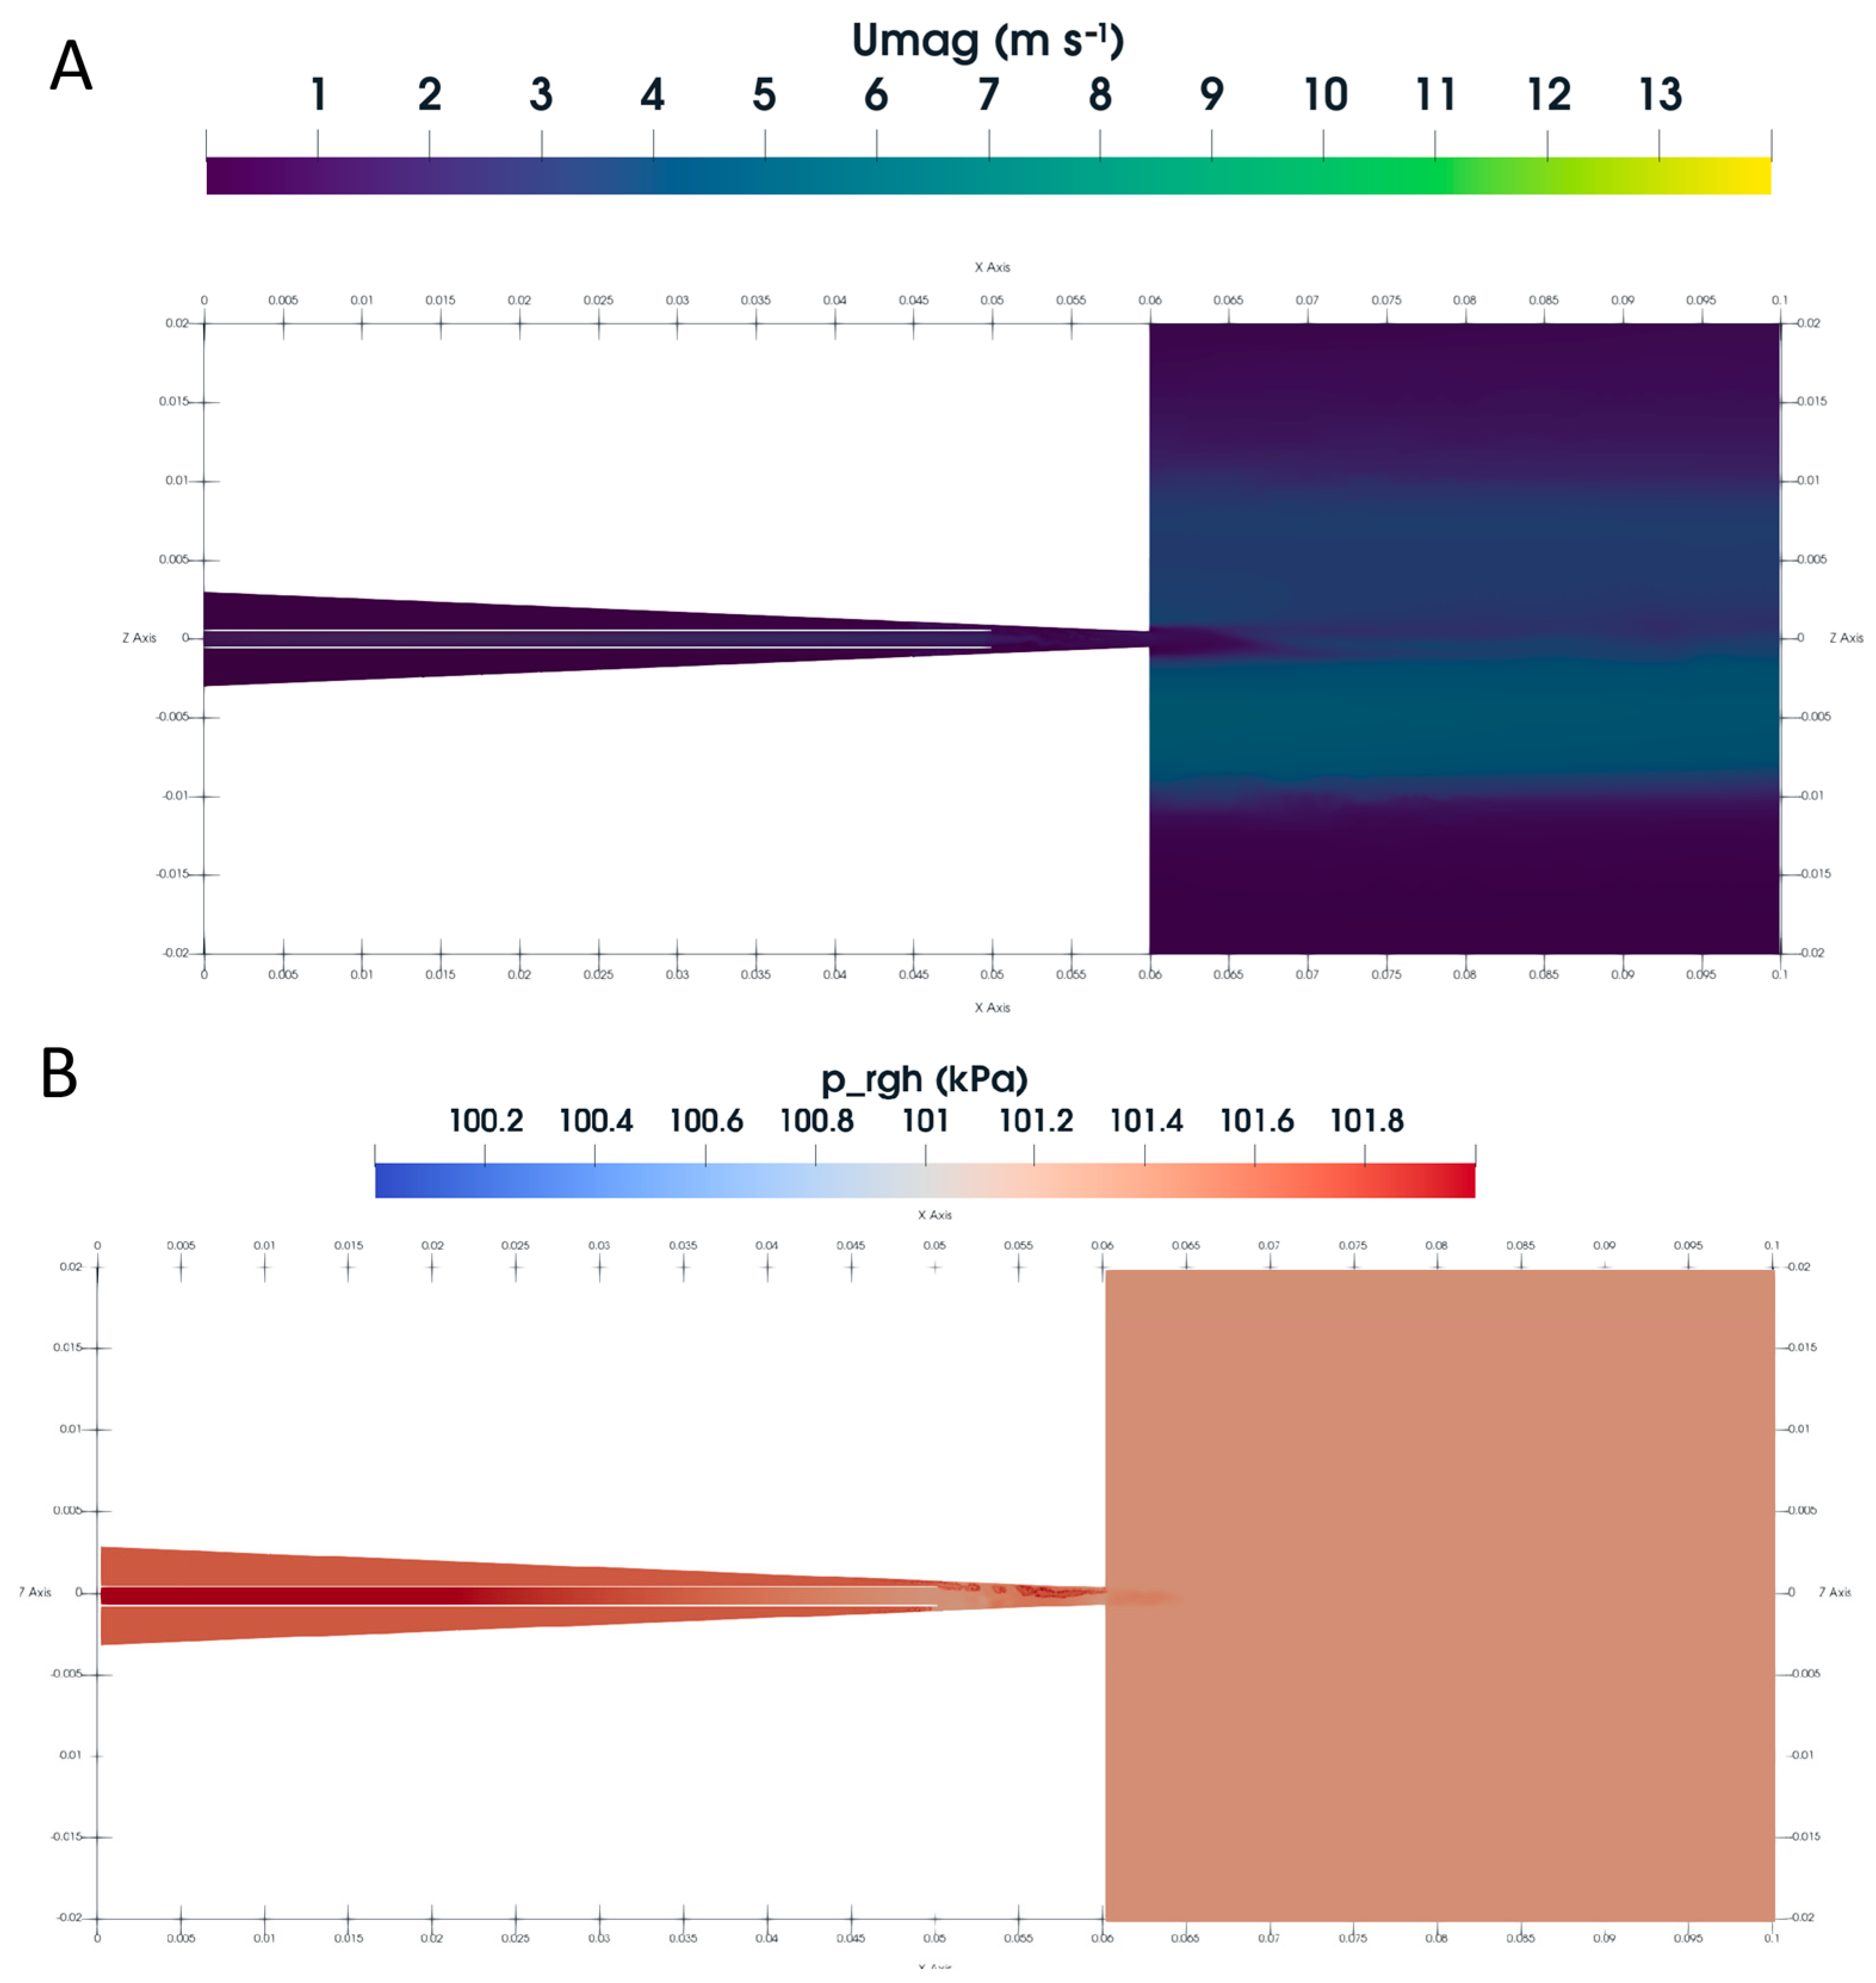
We report static pressure as prgh = p − ρgh, following OpenFOAM conventions for incompressible VOF. All pressure maps shown in the Results use prgh in kPa and all velocity maps use fixed 0–14 m s−1 scale to enable one-to-one comparisons across figures.

2.14.3. Boundary and Initial Conditions

Volumetric flow-rate inlets were imposed at the concentric tubes: air = 0.0025 L min−1 (4.16 × 10⁻⁸ m3 s−1) and water = 0.035 L min−1 (5.83 × 10⁻⁷ m3 s−1) using flowRateInletVelocity. The pressure outlet was set to zero-gradient, while all solid walls were treated as no-slip. Initial fields were quiescent air (α_water = 0) with gravitational acceleration g = (0, –9.81, 0) m s−2 [25,26,34]

2.14.4. Numerical Setup

Simulations were carried out with interFoam (OpenFOAM v8). Second-order time discretisation and limited-linear schemes for spatial derivatives were employed [25]. The PIMPLE algorithm used one outer corrector, three inner correctors and MULES interface compression (cAlpha = 1). The time step was automatically adjusted to maintain a Courant number below 1, starting from Δt = 1 × 10⁻⁴ s. Residual tolerances were 10−7 for pressure and velocity and 10−10 for phase fraction (α). Laminar flow was assumed at the internal feeding sections. Internal Reynolds numbers based on inlet flow rates and hydraulic diameters were Re l = 8.1 × 10 2 (liquid, D = 1 mm) and Re g = 3.6 [35,36]. Two-dimensional axisymmetric screening runs were performed to tune the numerical parameters; however, all characterization and figures reported here are based on 3D simulations. To enable assessment of numerical credibility at a glance, we summarize in mesh-quality metrics (checkMesh), a grid-refinement check showing ΔD50 < 1% between 4.9M and 6.2M cells, second-order time/spatial schemes with Co < 1, and tight solver tolerances.

2.14.5. Parallelisation and Computational Resources

The case was decomposed hierarchically into 576 sub-domains (16 × 6 × 6) and executed on the Leo Atrox cluster (CentOS 7) using 46 compute nodes with 36 Intel® cores and 128 GB RAM each [37,38,39]. It should be noted that the cells-per-core ratio (approximately 8.5k) was selected to reduce wall-clock time. Although parallel efficiency could be improved by using fewer ranks, the numerical solution decomposition.

2.14.6. Post-Processing and Data Availability

Interface iso-surfaces (α = 0.5) were exported every 0.01 s in VTK format; streamlines and field contours were visualized in ParaView 5.12 [25]. Post-processing choices are governed by grid/time-step independence checks and solver tolerances, not by the domain extent.
Mid-plane fields of velocity magnitude ∣U∣ and, static pressure prgh were exported at selected instants. Velocity figures share the same color scale (0–14 m s−1), and all prgh maps are reported in kPa.

2.15. General Statistical Analysis

Each method was tested using three independent replicates (n = 3), each with the same number of turkey sausage cubes (n = 10). Results were analyzed using the JMP 8.0 software (SAS Institute, Cary, NC, USA), applying the Tukey–Kramer test (p < 0.05) to determine the differences.

3. Results and Discussion

3.1. Water Content and Fat Uptake

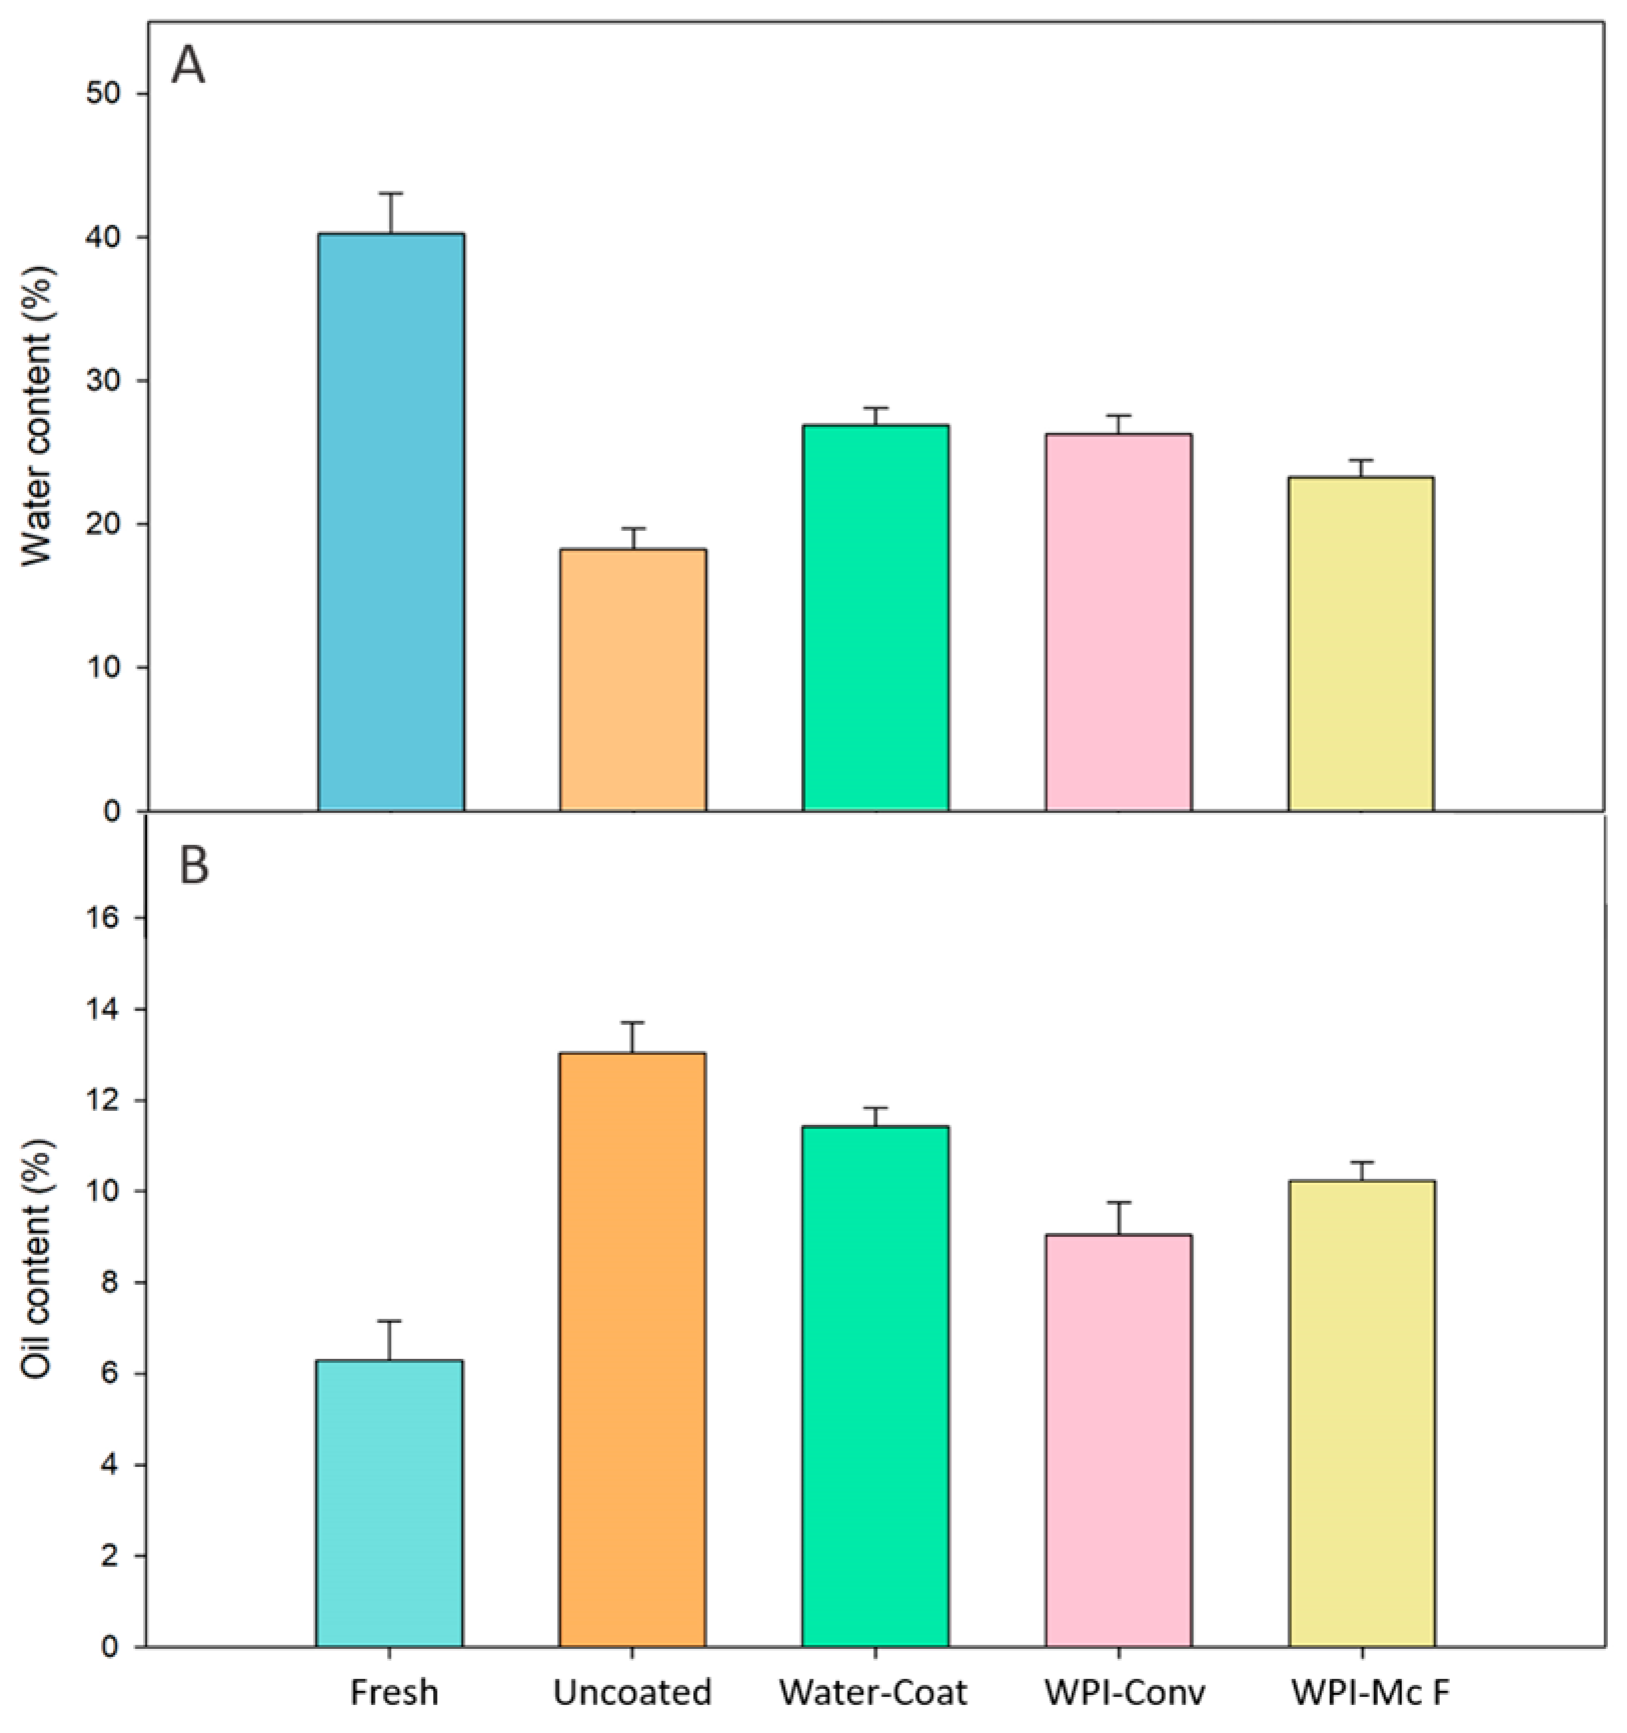
The application of edible coatings proved effective in reducing water loss during frying, as shown in Figure 6A, when compared to uncoated samples. This reduction can be attributed to the formation of a surface barrier by the whey protein isolate coating, which limits water evaporation and minimizes pore formation within the food matrix. These findings are consistent with previous studies by Rossi-Márquez et al. [8] and Nivedita et al. [40], who observed similar reductions in moisture loss when edible coatings were applied to fried products. Moreover, the application of the coating using the microfluidics technique demonstrates good performance, with results similar to those obtained with conventional techniques.
To assess oil absorption, oil content was measured after frying using hexane as the extraction solvent. As illustrated in Figure 6B, samples coated with WPI-Conv showed a 30% reduction in oil uptake compared to the uncoated control while the WPI-McF showed a 21% of reduction indicating the potential of WPI-McF technique for the application of edible coatings. These results demonstrate the ability of edible coatings to form an effective barrier on food surface, leading to a reduction in oil content and resulting in a healthier product made solely with natural ingredients.

3.2. Determination of the Minimum Required Volume of Coating Solution

The volume of coating solution required to cover 10 uniform cubes (1 cm3 each) of turkey sausage was measured using two application methods: dipping and spraying. As shown in Table 3, the conventional method consumed a total of 15 mL of the whey protein-based coating solution, resulting in an average usage of 1.5 mL per cube. In contrast, the microfluidic method required only 8 mL in total, with an average of 0.8 mL per cube.
This difference represents a 46.7% reduction in coating solution usage when applying the coating by spraying instead of dipping. The lower consumption observed with the spray method can be attributed to the more controlled and localized application of the solution, which reduces excess coating and dripping losses commonly associated with immersion techniques.
Although the microfluid-assisted method used a smaller amount of coating solution, its performance regarding oil absorption and moisture retention was slightly lower compared to the conventional one. Still, the results are encouraging because the microfluidic approach was able to lower oil uptake using almost half of the coating material. This suggests that the method is effective and can probably be improved through further adjustments in formulation or processing parameters. Moreover, these findings point out the potential of microfluidics as a sustainable and controllable way to apply edible coatings, opening possibilities for new applications in food systems which remain relatively unexplored.
At the same time, it should be noted that determining the thickness of the coating layer on irregular and deformable food matrices such as sausages remains technically challenging, and future work will aim to develop suitable methods for this purpose.
Under the same WPI formulation and frying protocol, FB spraying reduced coating consumption by 46.7% (8 mL for 10 cubes; 0.8 mL·cube−1) compared with dipping (15 mL; 1.5 mL·cube−1), lowering oil uptake relative to uncoated controls (−21% for FB; −30% for dipping). This indicates an efficiency-performance trade-off: FB attains a comparable barrier effect using about half the material, and the measured spray statistics (D50 = 83.69 µm) provide actionable set-points for further optimization.

3.3. Image Processing and Droplet Segmentation

Characterizing droplet diameters using image processing requires robust segmentation that minimizes imperfections and preserves the droplet’s actual morphology. To this end, a processing workflow was designed that applied filtering, mathematical morphology, and adaptive thresholding techniques.

3.3.1. Out-of-Focus Particle Removal

To enhance segmentation and reduce imperfections, an intensity gradient was applied, which helped suppress out-of-focus particles and diminish visual contamination. As illustrated in Figure 7a, applying the gradient emphasizes the sharpest edges. Figure 7b displays the mask generated after filtering, while the final image, with out-of-focus particles removed, is shown in Figure 7c.

3.3.2. Droplet Segmentation and Contrast Enhancement

In the second stage, various techniques were employed to improve droplet detection and segmentation, optimizing contour identification and diameter measurement. Key steps include the following:
Median Filter: This technique reduces noise without affecting droplet edges, thereby improving segmentation stability (Figure 8a).
Morphological Closing: This step eliminates small internal voids within droplets, preserving the continuity of their edges (Figure 8b).
Bottom-Hat Transform: This method highlights small, dark droplets against a bright background, facilitating their identification (Figure 8c).
Contrast Adjustment: This process expands the dynamic range of intensities, improving the differentiation between droplets and the background (Figure 8d).
Binarization with Otsu Thresholding: This technique enables optimal segmentation based on the bimodal distribution of intensities (Figure 8e).
Edge Droplet Removal and Hole Filling: This step excludes partial droplets that could bias the results (Figure 8f).
By employing this sequence of techniques, droplet characterization can be significantly enhanced, leading to more accurate measurements and analyses.

3.4. Statistical Analysis of Droplet Diameters

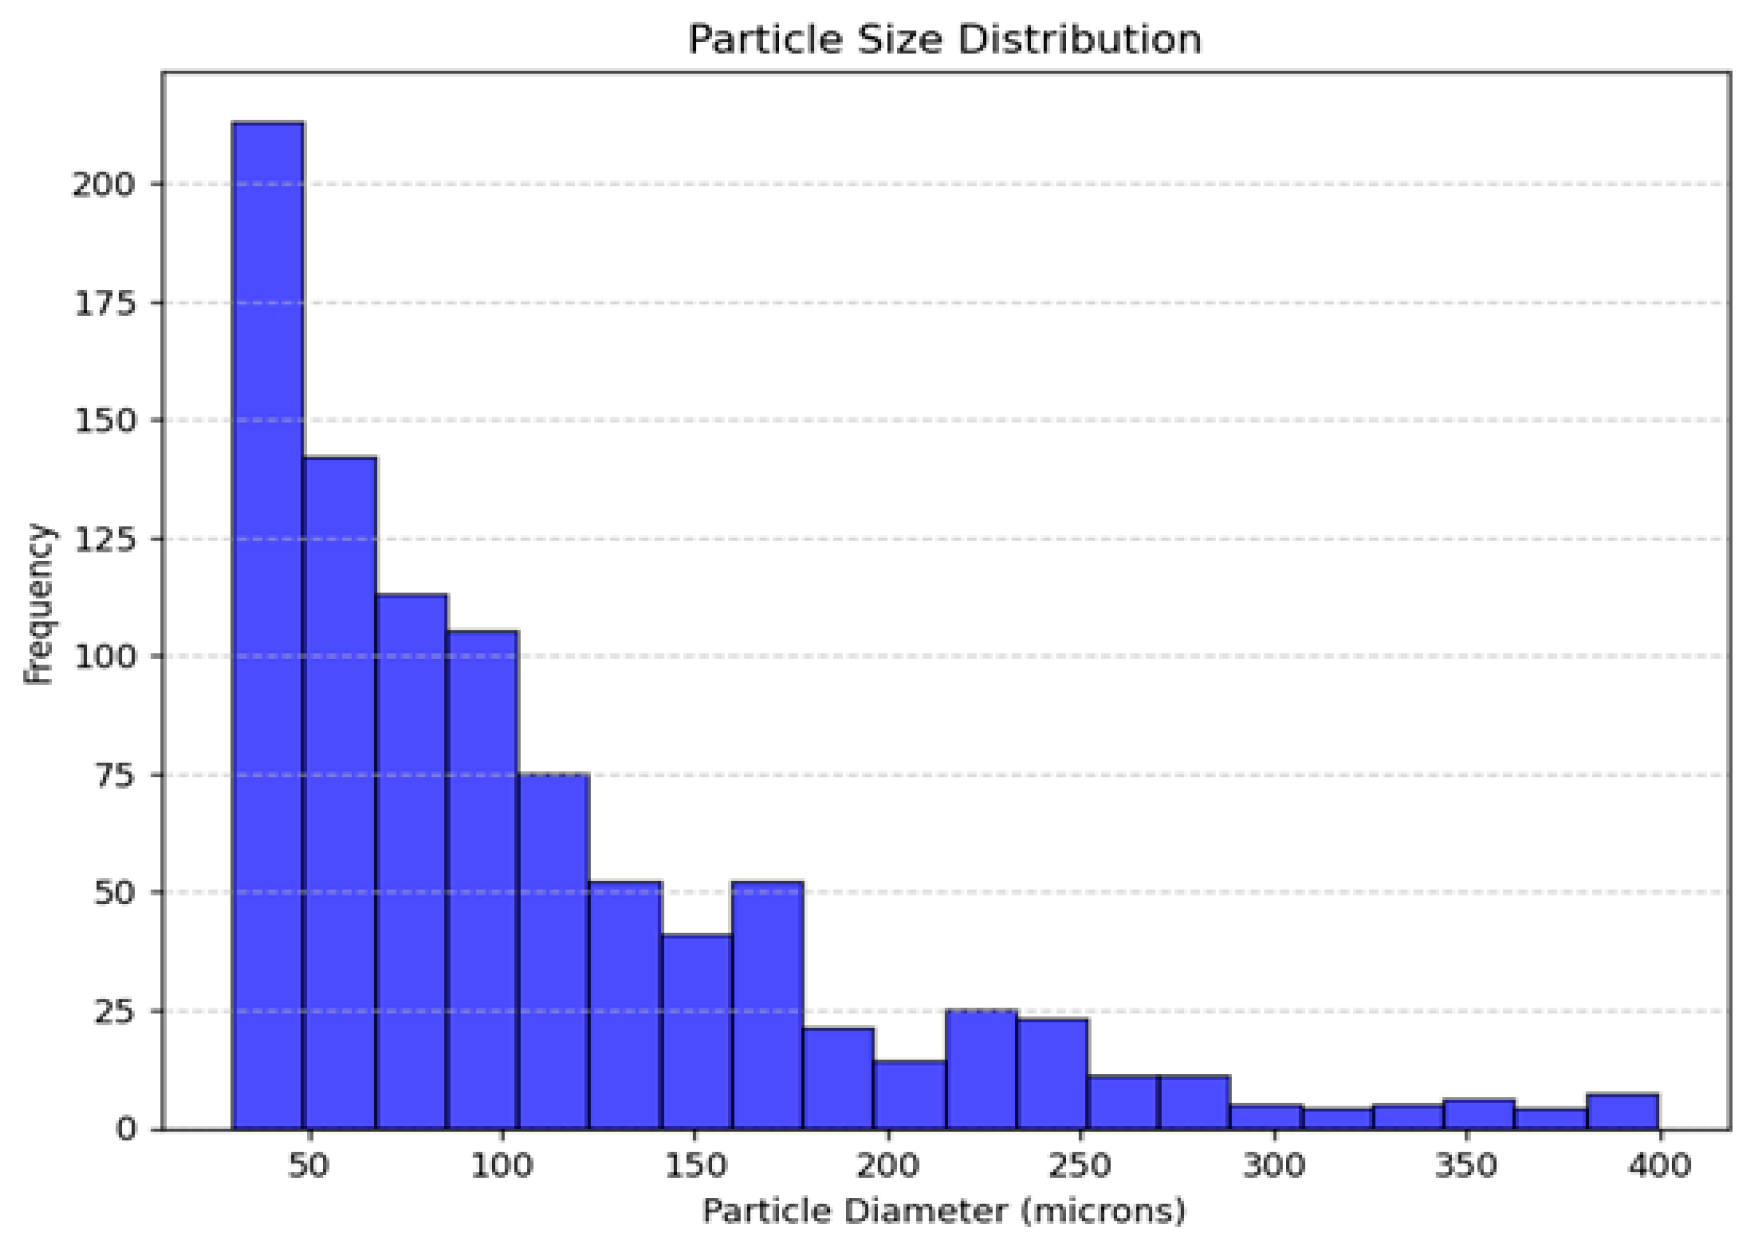
Once the droplets were segmented, their diameters in microns were calculated using the experimentally determined calibration factor (µm/pixel). The statistical values obtained are presented in Table 4 and Figure 9.
The coefficient of variation (CV = σ/μ) demonstrates the relative dispersion of the data relative to the mean. In this case, a CV value of 0.51 was obtained, indicating high variability in droplet diameters, consistent with atomization processes where the size distribution is heterogeneous that confirms a low polydispersion between drops.
The results obtained guarantee the effectiveness of image processing and segmentation in characterizing droplet size distribution. The following key aspects are highlighted: The application of the intensity gradient allowed the elimination of out-of-focus droplets without losing relevant information; the combination of morphological closing and median filtering was key to reducing impulsive noise without compromising edge integrity.
These findings align with previous studies reporting that image-based segmentation methods can accurately characterize droplet populations when appropriate filtering and morphological operations are applied. Similar approaches have demonstrated that gradient-based thresholding effectively suppresses background noise and enhances edge definition, which is essential for reliable droplet size analysis [41].
The observed diameter dispersion is within the expected values for similar atomization systems, suggesting a good representation of the physical reality of the process. The width of the interquartile range (P75–P25 = 85.66 µm) demonstrates heterogeneity in atomization, likely influenced by fluid dynamics and dispersion velocity.
The obtained D50 (µm) is a critical parameter, as it represents the median diameter of the volumetric droplet distribution.
The D50 value obtained here is comparable to those reported for pressure-swirl and twin-fluid atomizers operating under similar conditions, underscoring the robustness of the proposed image-processing workflow in representing the volumetric median diameter. This agreement suggests that the combination of intensity gradient, morphological closing, and median filtering not only minimizes impulsive noise but also preserves the true physical distribution of droplet sizes. Future work may integrate schlieren image velocimetry to couple droplet-size measurements with local velocity fields [42], enabling analysis of how spray flow structures influence droplet breakup and heterogeneity.

3.5. Contact Angle

Representative sessile drops are shown in Figure 10a–c, and the corresponding quantitative metrics are summarized in Table 5. On coating/glass, the surface exhibited a hydrophobic response, with a mean contact angle θ ¯ = 96.38° and minimal left–right asymmetry Δ θ = 0.96°, indicating low in-plane anisotropy (Figure 10a). On water/plastic substrate, wetting was moderately hydrophilic, with θ ¯ = 83.83° and Δ θ = 0.51° (Figure 10b), consistent with a moderate footprint radius and curvature (Figure 10b). In contrast, the coating/plastic combination produced a clearly hydrophilic regime, with θ ¯ = 50.20° and Δ θ = 0.18°, as evidenced by a flattened drop profile and larger basal diameter (Figure 10c). These parameters were determined using Equations (10) and (11).
Mean contact angle:
θ ¯ = θ L + θ R 2
Asymmetry Left–right:
Δ θ = θ L θ R
For coating/sausage, a reliable contact angle could not be determined (N.D.) due to surface roughness and absorption, which caused uncontrolled wicking and invalidated the sessile-drop assumption.
Overall, the ordering θ ¯ coating / glass > θ ¯ water / plastic > θ ¯ coating / plastic demonstrates distinct wettability regimes across substrates, the uniformly small Δ θ (<1°) in the measurable cases supports symmetry of the fits and robustness of the averages.
The results of coating on glass shows a clearly hydrophobic response (θ = 96°); see Figure 10a, which aligns with recent reports for edible films where gelatine and pectin-based matrices show > 90°. These values corroborate our classification on an inert substrate [43]. On the other hand, coating on plastic fell in a hydrophilic regime (θ = 50°) (Figure 10c) (θ = 96°) that matches the hydrophilic behavior recently quantified for hydroxypropyl methylcellulose (HPMC) films θ = 56.49 ± 1.54°; it is consistent with broader evidence for protein/polysaccharide films reporting θ < 90°; those studies validate both our wetting regime and order of magnitude on plastic substrates [43,44]. For water on plastic (Parafilm®), our mean value (θ = 84°) (Figure 10b) lies near the hydrophilic–hydrophobic comportment lower than typical values reported for Parafilm-like hydrophobic polymer surfaces θ = 107 − 109 ± 5°, indicating that protocol-dependent factors (e.g., storage/cleaning, drop volume, evaporation) likely biased measurements near smaller. These results are consistent with a recent study showing that realistic variations in protocol can shift θ by 30%–60% [43,45,46]. As finally point for coating on sausage, no reliable value could be determined due to wicking/absorption and surface roughness, which invalidate the sessile-drop assumption on porous, compliant matrices. That limitation is well documented for soft and porous materials [47]. Moreover, this limitation is consistent with recent guidance on contact-angle metrology for non-ideal substrates and with microflow studies where wall wettability controls interfacial regimes; accordingly, we the Washburn method is suggested for porous food matrices, tilting-plate/hysteresis on smooth surrogates, and captive-bubble for hydrated surfaces [48,49].

3.6. CFD Using VOF Method

Transient VOF simulations revealed that the coaxial air stream collapses the liquid core into a conical thread that breaks into ligaments within 0.8 ms (Figure 11). Reproducing the canonical sequence of primary atomization in air-assisted jets. Subsequent capillary fragmentation generated droplets after the elongated ligaments that undergo capillary pinch-off these events produce a population of daughter droplets whose D50 converges to 85 µm (Figure 11). The mechanism of droplet formation (wave→ligament→pinch-off) pathway is the same morphology reported in recent high-fidelity simulations of coaxial/air-blast configurations, which also validated against back-lit and X-ray/radiographic measurements and the rupture morphology shown in Figure 11A–C is as expected and has been described by various authors, with experimental validation [50,51].

3.7. Jet Break-Up Dynamics

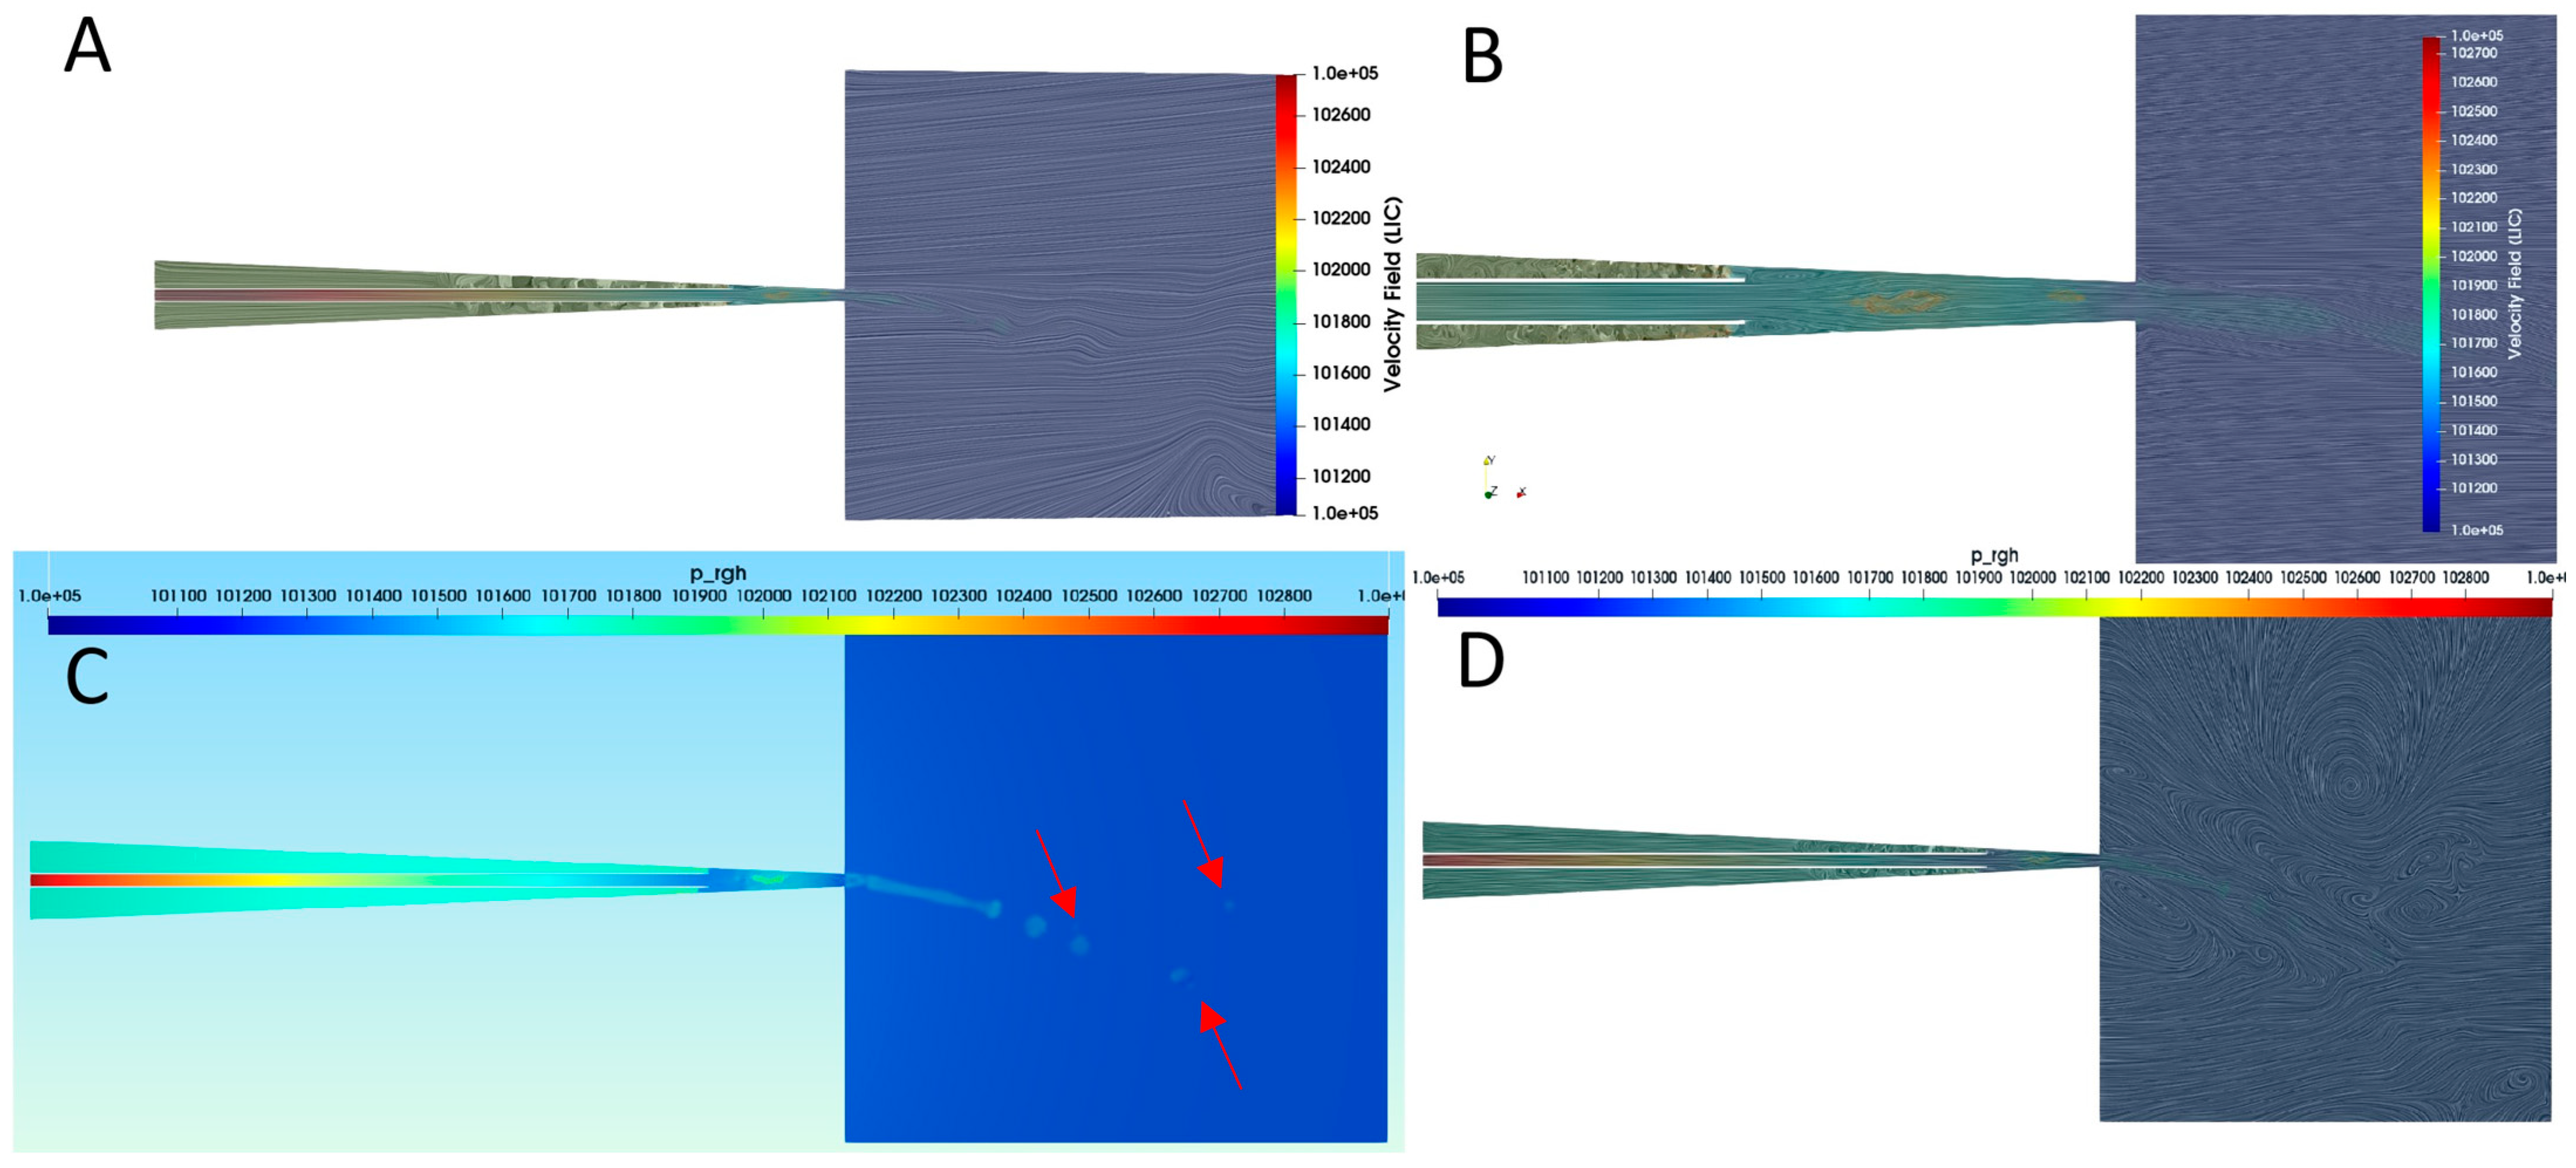
Results further clarify the near-nozzle hydrodynamics. Line-integral-convolution (LIC) visualizations and the dynamic-pressure overlay (Figure 12) reveal streamwise streaks and pockets of over-/under-pressure that accompany ligament stretching and satellite-drop formation—features that are consistent with mechanical of air-blast film breakup (bag inflation, rim thinning, ligament roll-up) recently studied [52].
Comparable droplet-size statistics and coating-thickness profiles have been validated experimentally in recent VOF(-DPM) models of air-assisted sprays [53]. Mesh refinement 4.9 × 10⁶ cells altered D50, <1% confirming grid independence (Figure 12) size metrics under our operating conditions. The importance of such resolution checks in primary atomization problems—and the stabilization of drop/ligament statistics as key non-dimensional groups are respected—has been documented in recent DNS/VOF work on air-blast injectors [51,54].
Figure 13A shows the velocity magnitude ∣U∣ (m s−1) at the mid-plane using a fixed 0–14 m s−1 scale across all velocity panels. Peak speeds are confined to the jet core near the geometric contraction, whereas the plenum remains in the low-velocity range; shear layers delineate the onset of downstream mixing. Figure 13B maps the static pressure prgh (kPa), defined as prgh = p − ρgh, making explicit the upstream-to-downstream pressure drop across the contraction/expansion that accompanies jet acceleration. This kinematic–pressure coupling is consistent with the wave→ligament→pinch-off sequence resolved by the VOF run and with the spray statistics discussed below (D50) [55]. While the static pressure dropped, matching with recent studies [52]. Under the same boundary conditions as previously described, the VOF run reproduces the expected wave–ligament–pinch-off sequence within 1 ms, and its droplet-size statistics are consistent at first order with the experiments: the measured spray reports a median diameter D50 = 83.69 µm, which matches the median scale emerging from the simulated size distribution.
A full parameter sensitivity analysis (e.g., gas-to-liquid ratio, recess) falls beyond the scope of the present work and will be addressed in future studies. In this study, CFD is employed primarily to provide a mechanistic role to interpret near-nozzle breakup, and to check first-order consistency with measured D50.
This work used isothermal, constant “water-like” properties (ρ, ν, σ) for the coating in VOF (interFoam), anchored to IAPWS values at 24.00 °C.

4. Conclusions

A microfluidic–computational workflow was established that integrated a flow-blurring atomizer, multiphase Volume of Fluid (VOF) modeling, and an image-based droplet analysis pipeline to design and deposit whey protein isolate (WPI) coatings on turkey sausages. The spray produced controlled aerosols with a volumetric median diameter D 50 = 83.69 μm, and the segmentation–statistics procedure yielded a coefficient of variation of 0.51, consistent with the expected heterogeneity of atomization processes. On sausage surfaces, sessile-drop contact angles were not detected due to absorption/roughness; wetting improvement is therefore supported by surrogate-surface behavior and by performance outcomes, and reduced oil uptake relative to controls (−30% for conventional dipping, −21% for microfluidic spray), supporting the barrier function of WPI coatings in fried foods.
Process efficiency was also evidenced. To cover ten 1 cm3 sausage cubes, the microfluidic method required 8 mL of coating solution versus 15 mL for dipping—a 46.7% reduction attributable to localized deposition and lower dripping losses—highlighting the potential for cost-effective, scalable application of protein-based edible coatings in food processing.
The present assessment relied on a single WPI formulation and reported broad droplet dispersion (CV = 0.51), which, while typical of atomization, may influence film uniformity; moreover, functional validation during storage and under varied thermal regimes was beyond the current scope.

Author Contributions

Conceptualization, G.R.-M. and C.A.D.-S.; methodology, G.R.-M., C.E.C., C.A.D.-S.; validation, G.R.-M. and S.R.-M., formal analysis, G.R.-M. and C.E.C.; data curation, G.R.-M., C.E.C., C.A.D.-S.; writing—original draft preparation, G.R.-M., C.E.C.; funding acquisition, S.R.-M., C.A.D.-S., G.R.-M.; writing—review and editing G.R.-M., S.R.-M., C.A.D.-S., S.R.-M. All authors have read and agreed to the published version of the manuscript.

Funding

This work was supported by Instituto Tecnológico José Mario Molina Pasquel y Henríquez, Academic Unit of Lagos de Moreno, Mexico. Secretariat of Science, Humanities, Technology and Innovation (Secihti), México, “Estancias Posdoctorales por México”. Project: 5863119. This work was supported by Universidad de Guadalajara through the “Programa de Apoyo a la Mejora en las Condiciones de Producción de las Personas Integrantes del SNII y SNCA, (PROSNII), 2025”.

Institutional Review Board Statement

Not applicable.

Informed Consent Statement

Not applicable.

Data Availability Statement

Data are contained within the article.

Acknowledgments

The LeoAtrox supercomputer located at the facilities of the Centro de Análisis de Datos (CADS), CGSAIT, Universidad de Guadalajara, México.

Conflicts of Interest

The authors declare no conflicts of interest.

Appendix A

Description of the variables used in the equations mentioned in the Section 2 (Table A1). The definitions are provided to help the reader better understand the symbols and parameters used along the text. Some variables may appear with small variations depending on the context of each equation.
Table A1. Definition of terms.
Symbol (Unity)Description
ρ (kg·m−3)Density
u (m·s−1)Velocity vector
ϕConserved scalar (e.g., concentration, temperature, or phase fraction)
Γϕ (m2·s−1)Effective diffusivity of ϕ
Sϕ (unid. de ϕ·s−1)Source/sink of ϕ
p (Pa)Pressure
μ (Pa·s)Dynamic viscosity
g (m·s−2)Gravity
fσ (N·m−3)Surface tension force
In Volume of Fluid (VOF; CSF model): fσ = σ κ ∇α, where σ is the surface tension, κ the curvature, and α the phase fraction.

References

  1. Rossi-Márquez, G.; Dávalos-Saucedo, C.A.; Di Pierro, P. Edible Films and Coatings Applied in the Food Industry. Coatings 2023, 13, 670. [Google Scholar] [CrossRef]
  2. Dhall, R.K. Advances in Edible Coatings for Fresh Fruits and Vegetables: A Review. Crit. Rev. Food Sci. Nutr. 2013, 53, 435–450. [Google Scholar] [CrossRef]
  3. Blumenthal, M.M.; Stier, R.F. Optimization of Deep-Fat Frying Operations. Trends Food Sci. Technol. 1991, 2, 144–148. [Google Scholar] [CrossRef]
  4. Mehta, U.; Swinburn, B. A Review of Factors Affecting Fat Absorption in Hot Chips. Crit. Rev. Food Sci. Nutr. 2001, 41, 133–154. [Google Scholar] [CrossRef]
  5. Saguy, I.-S. Oil Uptake during Deep-Fat Frying: Factors and Mechanism. Food Technol. 1995, 49, 142–145. [Google Scholar]
  6. Falguera, V.; Quintero, J.P.; Jiménez, A.; Muñoz, J.A.; Ibarz, A. Edible Films and Coatings: Structures, Active Functions and Trends in Their Use. Trends Food Sci. Technol. 2011, 22, 292–303. [Google Scholar] [CrossRef]
  7. Talens, P.; Pérez-Masia, R.; Jiménez, A.; Fabra, M.J.; Chiralt, A. Use of Edible Films to Control Moisture Migration in Multicomponent Food Systems. In Proceedings of the International Conference of Food Innovation (FoodInnova 2010), Valencia, Spain, 25–29 October 2010. [Google Scholar]
  8. Rossi Marquez, G.; Di Pierro, P.; Esposito, M.; Mariniello, L.; Porta, R. Application of Transglutaminase-Crosslinked Whey Protein/Pectin Films as Water Barrier Coatings in Fried and Baked Foods. Food Bioproc. Tech. 2014, 7, 447–455. [Google Scholar] [CrossRef]
  9. Gañán-Calvo, A.M.; Montanero, J.M.; Martín-Banderas, L.; Flores-Mosquera, M. Functional Materials for Health Care and Pharmacy from Microfluidic Principles and Flow Focusing. Adv. Drug Deliv. Rev. 2013, 65, 1447–1469. [Google Scholar] [CrossRef] [PubMed]
  10. Maan, A.A.; Nazir, A.; Khan, M.K.I.; Boom, R.; Schroën, K. Microfluidic Emulsification in Food Processing. J. Food Eng. 2015, 147, 1–7. [Google Scholar] [CrossRef]
  11. Norton, T.; Sun, D.-W. Computational Fluid Dynamics (CFD)—An Effective and Efficient Design and Analysis Tool for the Food Industry: A Review. Trends Food Sci. Technol. 2006, 17, 600–620. [Google Scholar] [CrossRef]
  12. Tavares, M.; Josserand, C.; Limare, A.; Lopez-Herrera, J.M.; Popinet, S. A Coupled VOF/Embedded Boundary Method to Model Two-Phase Flows on Arbitrary Solid Surfaces. Comput. Fluids 2024, 278, 106317. [Google Scholar] [CrossRef]
  13. Skurtys, O.; Aguilera, J.M. Applications of Microfluidic Devices in Food Engineering. Food Biophys. 2008, 3, 1–15. [Google Scholar] [CrossRef]
  14. Association of Official Analytical Chemists. AOAC Method 950.46. In Official Methods of Analysis; AOAC International: Rockville, MD, USA, 1990. [Google Scholar]
  15. Schneider, C.A.; Rasband, W.S.; Eliceiri, K.W. NIH Image to ImageJ: 25 Years of Image Analysis. Nat. Methods 2012, 9, 671–675. [Google Scholar] [CrossRef] [PubMed]
  16. Stalder, A.F.; Kulik, G.; Sage, D.; Barbieri, L.; Hoffmann, P. A Snake-Based Approach to Accurate Determination of Both Contact Points and Contact Angles. Colloids Surf. A Physicochem. Eng. Asp. 2006, 286, 92–103. [Google Scholar] [CrossRef]
  17. Zhou, W.; Hu, J.; Feng, M.; Yang, B.; Cai, X. Study on Imaging Method for Measuring Droplet Size in Large Sprays. Particuology 2015, 22, 100–106. [Google Scholar] [CrossRef]
  18. Zhou, H.; Shu, D.; Wu, C.; Wang, Q.; Wang, Q. Image Illumination Adaptive Correction Algorithm Based on a Combined Model of Bottom-Hat and Improved Gamma Transformation. Arab. J. Sci. Eng. 2023, 48, 3947–3960. [Google Scholar] [CrossRef]
  19. Otsu, N. A Threshold Selection Method from Gray-Level Histograms. IEEE Trans. Syst. Man. Cybern. 1979, 9, 62–66. [Google Scholar] [CrossRef]
  20. Ng, H.-F. Automatic Thresholding for Defect Detection. Pattern Recognit. Lett. 2006, 27, 1644–1649. [Google Scholar] [CrossRef]
  21. Roerdink, J.B.T.M. Group Morphology. Pattern Recognit. 2000, 33, 877–895. [Google Scholar] [CrossRef]
  22. Basu, M. Gaussian-Based Edge-Detection Methods-a Survey. IEEE Trans. Syst. Man Cybern. Part C (Appl. Rev.) 2002, 32, 252–260. [Google Scholar] [CrossRef]
  23. Dhar, R.; Gupta, R.; Baishnab, K.L. An Analysis of CANNY and LAPLACIAN of GAUSSIAN Image Filters in Regard to Evaluating Retinal Image. In Proceedings of the 2014 International Conference on Green Computing Communication and Electrical Engineering (ICGCCEE), Coimbatore, India, 6–8 March 2014; pp. 1–6. [Google Scholar]
  24. Kato, S.; Carlson, D.W.; Shen, A.Q.; Guo, Y. Twisted Fiber Microfluidics: A Cutting-Edge Approach to 3D Spiral Devices. Microsyst. Nanoeng. 2024, 10, 14. [Google Scholar] [CrossRef]
  25. Azzini, F.; Pulvirenti, B.; Rossi, M.; Morini, G.L. Squeezing Droplet Formation in a Flow-Focusing Micro Cross-Junction. Micromachines 2024, 15, 339. [Google Scholar] [CrossRef] [PubMed]
  26. Maurya, T.C.K.; Dutta, S. Pinch-off Dynamics of Droplet Formation in Microchannel Flow. Chem. Eng. Sci. 2023, 282, 119296. [Google Scholar] [CrossRef]
  27. Okagaki, Y.; Yonomoto, T.; Ishigaki, M.; Hirose, Y. Numerical Study on an Interface Compression Method for the Volume of Fluid Approach. Fluids 2021, 6, 80. [Google Scholar] [CrossRef]
  28. Ananth, M.; Trujillo, M.F. Breakup of Planar Liquid Sheets Injected at High Speed in a Quiescent Gas Environment. J. Fluid. Mech. 2023, 975, A38. [Google Scholar] [CrossRef]
  29. Zhao, C.; Maarek, J.; Taleghani, S.M.; Zaleski, S. A Hybrid Continuum Surface Tension Force for the Three-Phase VOF Method. J. Comput. Phys. 2024, 504, 112872. [Google Scholar] [CrossRef]
  30. Cimarelli, A.; Romoli, F.; Stalio, E. On Wind–Wave Interaction Phenomena at Low Reynolds Numbers. J. Fluid. Mech. 2023, 956, A13. [Google Scholar] [CrossRef]
  31. Wagner, W.; Pruß, A. The IAPWS Formulation 1995 for the Thermodynamic Properties of Ordinary Water Substance for General and Scientific Use. J. Phys. Chem. Ref. Data 2002, 31, 387–535. [Google Scholar] [CrossRef]
  32. Huber, M.L.; Perkins, R.A.; Laesecke, A.; Friend, D.G.; Sengers, J.V.; Assael, M.J.; Metaxa, I.N.; Vogel, E.; Mareš, R.; Miyagawa, K. New International Formulation for the Viscosity of H2O. J. Phys. Chem. Ref. Data 2009, 38, 101–125. [Google Scholar] [CrossRef]
  33. Petrova, T.; Dooley, R.B. Revised Release on Surface Tension of Ordinary Water Substance. In Proceedings of the International Association for the Properties of Water and Steam, Moscow, Russia, 22–27 June 2014; Volume 63, pp. 23–27. [Google Scholar]
  34. Nath, A.J.; Deka, D.K.; Pati, S. Numerical Investigation of Droplet Generation Within a Microfluidic T-Junction With Semicylindrical Obstacle. J. Fluids Eng. 2023, 145, 011202. [Google Scholar] [CrossRef]
  35. Ierardi, C.; Torre, A.D.; Montenegro, G.; Onorati, A.; Radaelli, F.; Visconti, L.; Miarelli, M. Modeling of Two-Phase Flows at Low Capillary Number with VoF Method. Comput. Fluids 2023, 252, 105772. [Google Scholar] [CrossRef]
  36. Laín, S.; Lozano-Parada, J.H.; Guzmán, J. Computational Characterization of Turbulent Flow in a Microfluidic Actuator. Appl. Sci. 2022, 12, 3589. [Google Scholar] [CrossRef]
  37. Brogi, F.; Bnà, S.; Boga, G.; Amati, G.; Esposti Ongaro, T.; Cerminara, M. On Floating Point Precision in Computational Fluid Dynamics Using OpenFOAM. Future Gener. Comput. Syst. 2024, 152, 1–16. [Google Scholar] [CrossRef]
  38. Olenik, G.; Koch, M.; Boutanios, Z.; Anzt, H. Towards a Platform-Portable Linear Algebra Backend for OpenFOAM. Meccanica 2025, 60, 1659–1672. [Google Scholar] [CrossRef]
  39. Piscaglia, F.; Ghioldi, F. GPU Acceleration of CFD Simulations in OpenFOAM. Aerospace 2023, 10, 792. [Google Scholar] [CrossRef]
  40. Nivedita, V.; Srisowmeya, G.; Chakravarthy, M.; Antony, U.; Nandhini Devi, G. Effects of Microbial Polysaccharides on the Oil Absorption and Quality Characteristics of a Deep-Fried Snack Namkeen. Eur. J. Lipid Sci. Technol. 2022, 124, 2000404. [Google Scholar] [CrossRef]
  41. Muthukrishnan, R.; Radha, M. Edge Detection Techniques For Image Segmentation. Int. J. Comput. Sci. Inf. Technol. 2011, 3, 259–267. [Google Scholar] [CrossRef]
  42. Machado, D.A.; de Souza Costa, F.; de Andrade, J.C.; Dias, G.S.; Fischer, G.A.A. Schlieren Image Velocimetry of Swirl Sprays. Flow. Turbul. Combust. 2023, 110, 489–513. [Google Scholar] [CrossRef]
  43. Athanasopoulou, E.; Bigi, F.; Maurizzi, E.; Karellou, E.I.E.; Pappas, C.S.; Quartieri, A.; Tsironi, T. Synthesis and Characterization of Polysaccharide- and Protein-Based Edible Films and Application as Packaging Materials for Fresh Fish Fillets. Sci. Rep. 2024, 14, 517. [Google Scholar] [CrossRef]
  44. Yashwant, A.S.; Kashyap, P.; Goksen, G. Recent Advances in the Improvement of Protein-Based Edible Films through Non-Thermal and Thermal Techniques. Food Biosci. 2023, 55, 103032. [Google Scholar] [CrossRef]
  45. Dutra, G.; Canning, J.; Padden, W.; Martelli, C.; Dligatch, S. Large Area Optical Mapping of Surface Contact Angle. Opt. Express 2017, 25, 21127. [Google Scholar] [CrossRef] [PubMed]
  46. Lößlein, S.M.; Merz, R.; Müller, D.W.; Kopnarski, M.; Mücklich, F. An In-Depth Evaluation of Sample and Measurement Induced Influences on Static Contact Angle Measurements. Sci. Rep. 2022, 12, 19389. [Google Scholar] [CrossRef] [PubMed]
  47. Ponomar, M.; Krasnyuk, E.; Butylskii, D.; Nikonenko, V.; Wang, Y.; Jiang, C.; Xu, T.; Pismenskaya, N. Sessile Drop Method: Critical Analysis and Optimization for Measuring the Contact Angle of an Ion-Exchange Membrane Surface. Membranes 2022, 12, 765. [Google Scholar] [CrossRef]
  48. Der, O.; Bertola, V. An Experimental Investigation of Oil-Water Flow in a Serpentine Channel. Int. J. Multiph. Flow. 2020, 129, 103327. [Google Scholar] [CrossRef]
  49. Akbari, R.; Antonini, C. Contact Angle Measurements: From Existing Methods to an Open-Source Tool. Adv. Colloid. Interface Sci. 2021, 294, 102470. [Google Scholar] [CrossRef] [PubMed]
  50. Vu, L.; Machicoane, N.; Li, D.; Morgan, T.B.; Heindel, T.J.; Aliseda, A.; Desjardins, O. A Computational Study of a Two-Fluid Atomizing Coaxial Jet: Validation against Experimental Back-Lit Imaging and Radiography and the Influence of Gas Velocity and Contact Line Model. Int. J. Multiph. Flow. 2023, 167, 104520. [Google Scholar] [CrossRef]
  51. Carmona, J.; Odier, N.; Desjardins, O.; Cuenot, B.; Misdariis, A.; Cayre, A. A comparative study of direct numerical simulation and experimental results on a prefilming airblast atomization configuration. At. Sprays 2021, 31, 9–32. [Google Scholar] [CrossRef]
  52. Oshima, I.; Sou, A. Air-Blast Atomization of a Liquid Film. J. Fluid. Mech. 2024, 985, A36. [Google Scholar] [CrossRef]
  53. Chen, S.; Zhang, Y.; Wu, Z.; Fang, G.; Chen, Y.; Duan, J. Near-Nozzle Atomization Characteristics in Air-Assisted Spraying: Integrated VOF-DPM Modeling and Experimental Validation. Coatings 2025, 15, 939. [Google Scholar] [CrossRef]
  54. Payri, R.; Salvador, F.J.; Carreres, M.; Moreno-Montagud, C. A Computational Methodology to Account for the Liquid Film Thickness Evolution in Direct Numerical Simulation of Prefilming Airblast Atomization. Int. J. Multiph. Flow. 2023, 161, 104403. [Google Scholar] [CrossRef]
  55. Wu, W.; Wang, D.; Zhang, Y.; Yu, L.; Han, W. Numerical Analysis of the Airflow Field and Experiments of Fiber Motion for Solution Blowing. ACS Omega 2024, 9, 26941–26950. [Google Scholar] [CrossRef] [PubMed]
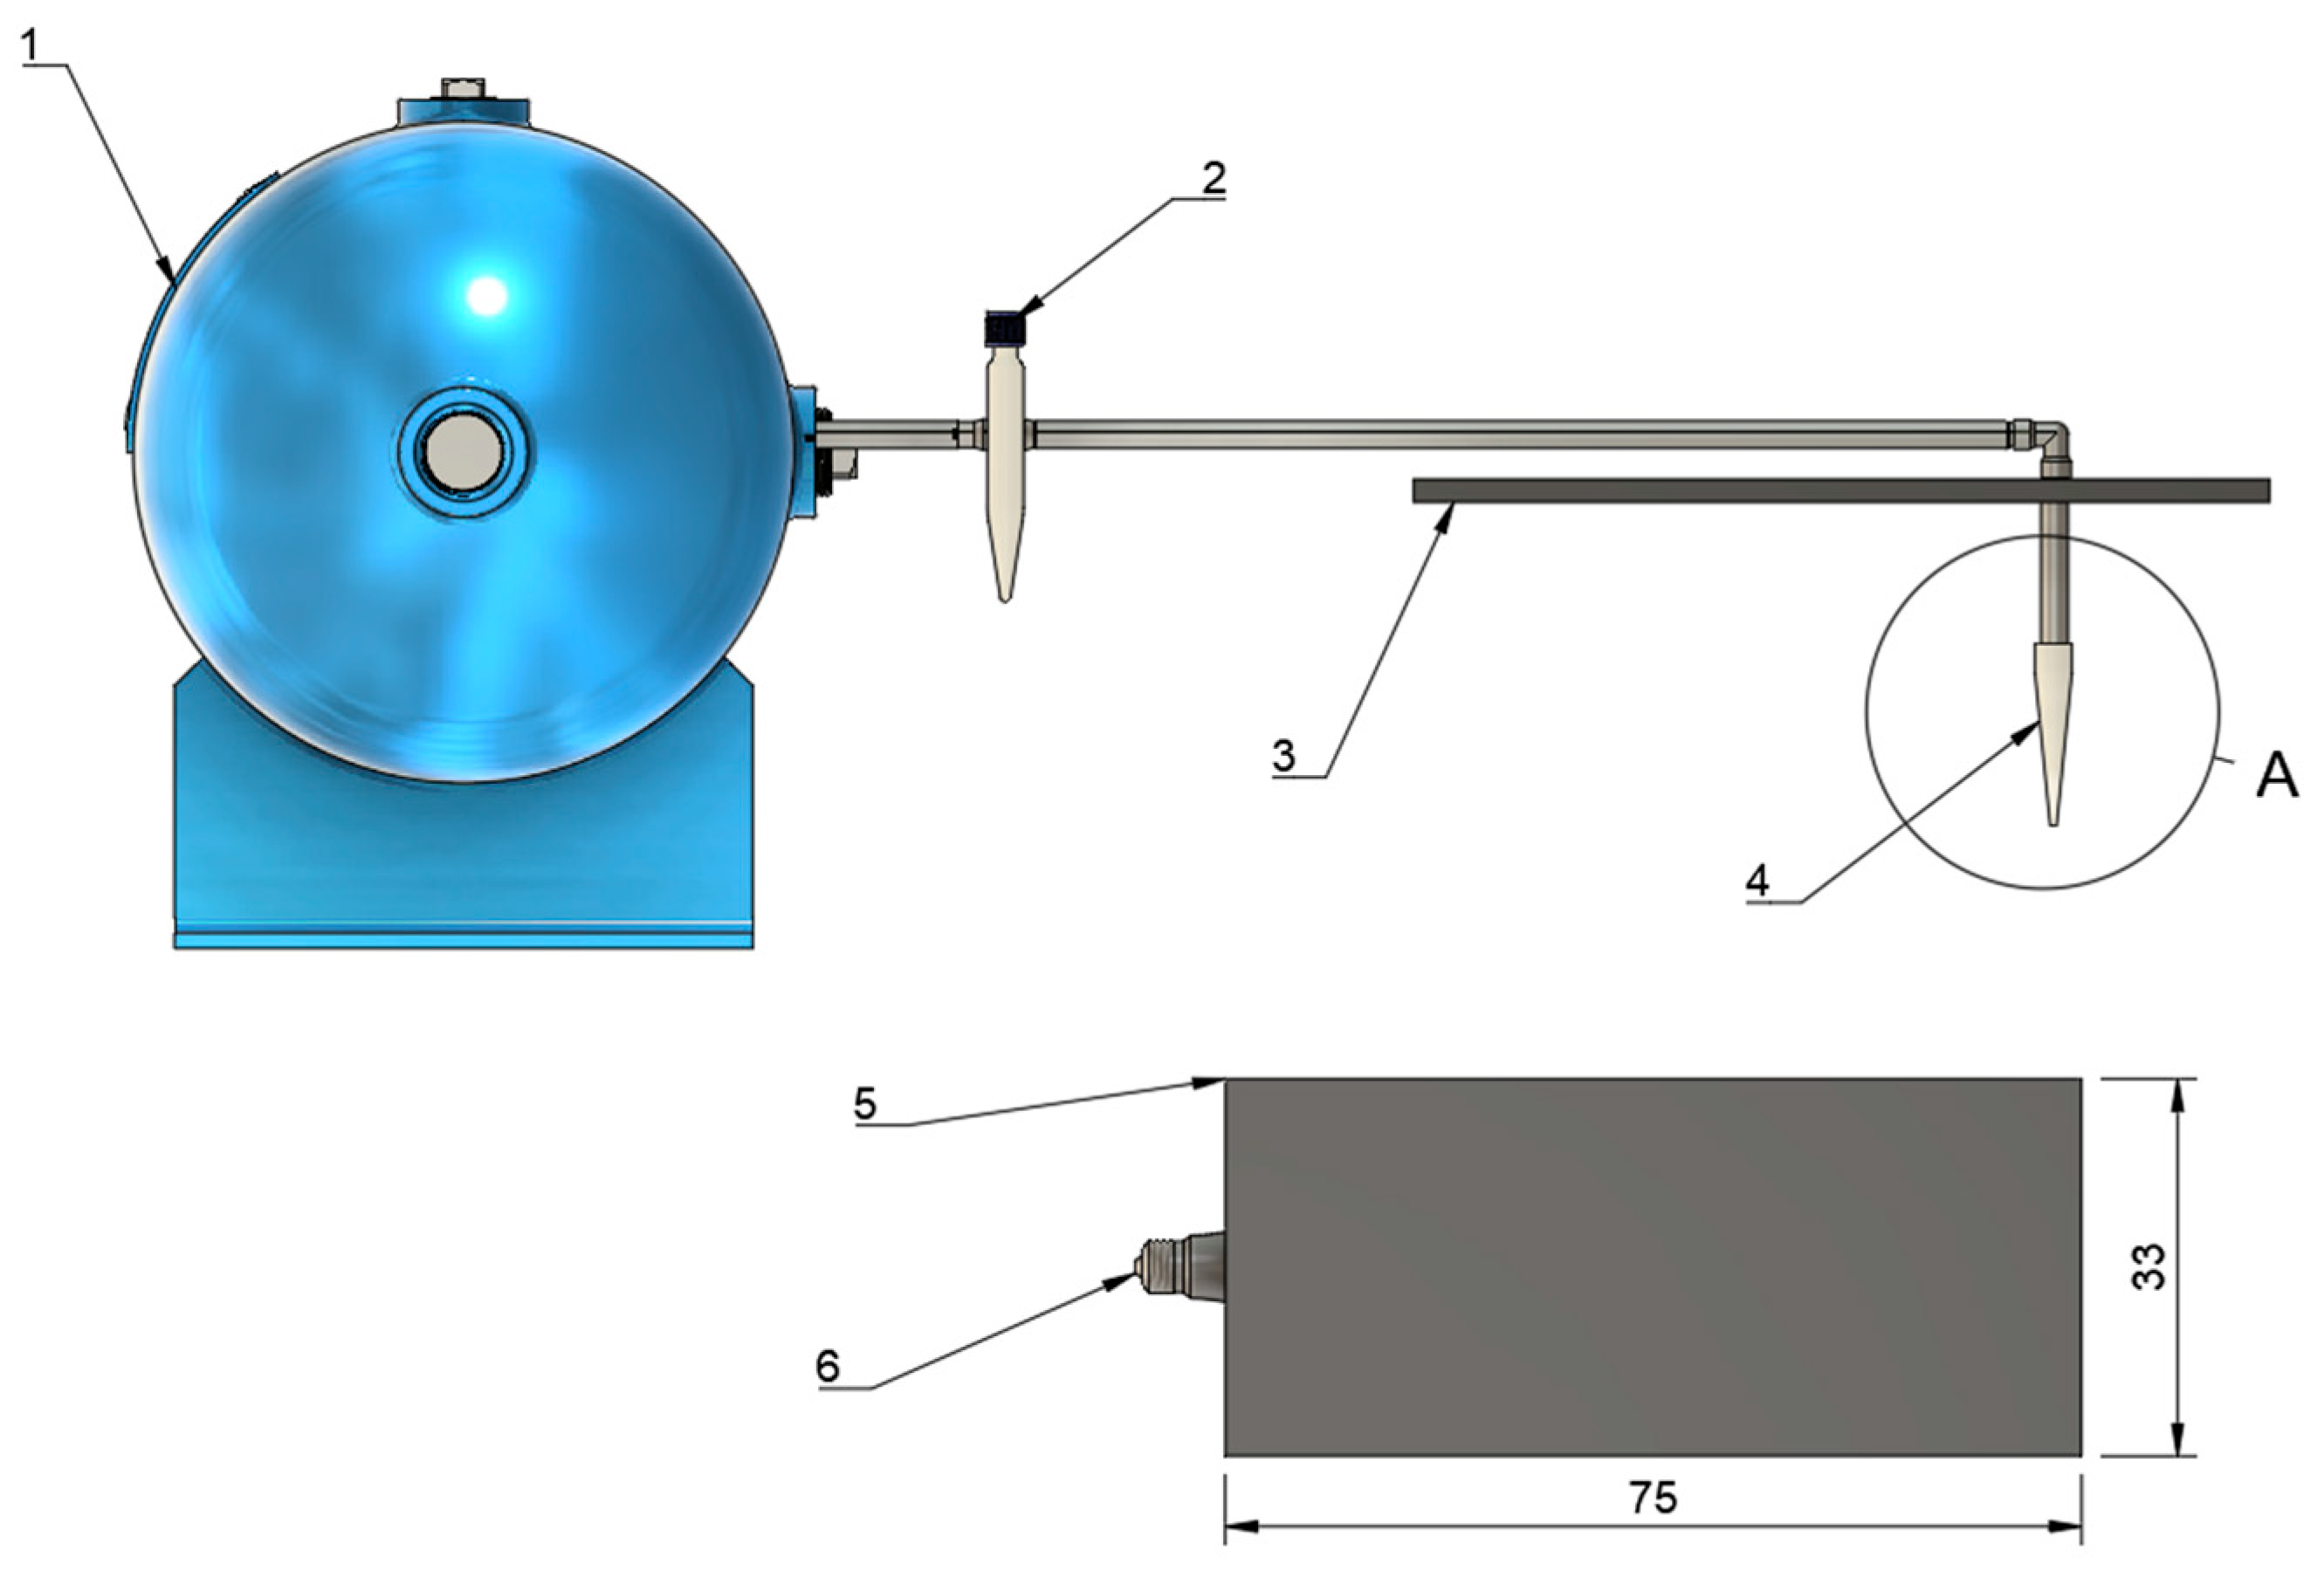
Figure 1. Side view of the microfluidic coating system. (1) Conditioned regulated source supplying a stable air stream; (2) Reservoir that feeds the whey-protein coating formulation; (3) Cover lid to close the deposition chamber; (4) Microfluidic device (concentrical nozzle) the atomization stage final nozzle positioned vertically above the wire rack for uniform deposition over the sample; (5) Deposition chamber (750 × 480 × 330 mm); (6) lighting source a white light bulb.
Coatings 15 01245 g001
Figure 2. Detail of the atomization stage inside the deposition chamber. (a) Lateral view of the horizontal tubing and elbow connector that guide the coating formulation and air each by its own channel from the coating reservoir and the air source to the microfluidic device using a coupling for fast assembly and cleaning; (b) wire rack that holds the food sample below the spray; (c) concentric flow-blurring nozzle responsible for the final atomization; (d) longitudinal section c–c of the nozzle, highlighting the inner capillary handling the liquid (Ø 1 mm) and outer air annulus (Ø 6 mm) that converge to create the flow-blurring regime; (e) deposition chamber (750 × 480 × 330 mm); (f) concentrical capillary arrangement of microfluidic device. The arrangement ensures uniform deposition while keeping the nozzle-sample distance fixed at 150 mm.
Coatings 15 01245 g002
Figure 3. (A) Two-dimensional (2D) scheme of the geometry employed in the Microfluidic Device flow-blurring nozzle. A pressurized gas stream (G, purple arrows) enters symmetrically on both sides of a tapered channel that narrows from 6.00 mm at the inlet to 1.00 mm at the throat over a total length of 60.00 mm. The liquid core (blue shaded region, bore = 1.00 mm) is fed axially along the centerline (red arrow, length L) and meets the converging gas streams to initiate the flow-blurring physical principle before discharge through the 1.00 mm outlet gap. Two-dimensional schematic (not to scale) of the concentric nozzle used to describe the geometry; the reported simulations were run in 3D without symmetry planes. (B) Full 3D computational domain and mesh used in the simulations, including the nozzle solid, the surrounding flow volume and the downstream pressure outlet. All simulations reported in this work were performed in full 3D with no symmetry boundary conditions, allowing azimuthal instabilities (corrugation–ligament–pinch-off) to develop without limitations.
Coatings 15 01245 g003
Figure 4. Deposition chamber assembly used for edible-coating experiments. (1) Microfluidic device positioned vertically to deposit the coating over the sample, (2) stainless-steel wire rack that supports the food samples beneath the concentric microfluidic nozzle (shown mounted on the removable lid). The exploded arrangement illustrates the airflow connector, guide tube, and nozzle alignment relative to the sample holder. Sample holder: an aluminum wire rack (150 mm × 150 mm), allowed precise control of the nozzle-to-substrate distance as shown in Figure 4. A LED bulb (5600 K, 5 W) was mounted parallel to the optic axis of the camera to provide homogeneous front lighting without specular glare. A black velvet backdrop was attached to the rear wall to maximize optical contrast for droplet imaging.
Coatings 15 01245 g004
Figure 5. Schematic diagram of the setup for the image capture process. The illumination and camera optical axes are perpendicular to the spray axis (indicated in the diagram). The arrangement captures droplet images by means of a camera positioned laterally, under preset parameters such as exposure time and frame rate.
Coatings 15 01245 g005
Figure 6. (A) Water and (B) oil content of different fresh sausage samples and after the frying process. Values shown are mean ± standard deviation.
Coatings 15 01245 g006
Figure 7. (a) Image with applied gradient. (b) Resulting mask. (c) Filtered image with out-of-focus particle removal.
Coatings 15 01245 g007
Figure 8. (a) Median-filtered image. (b) Application of morphological closing. (c) Bottom-Hat transform. (d) Contrast adjustment. (e) Binarized image. (f) Edge drop removal and hole filling.
Coatings 15 01245 g008
Figure 9. Histogram of droplet diameter distribution. A prevailing concentration is between 50 and 250 µm, with a D50 of 83.69 µm.
Coatings 15 01245 g009
Figure 10. Steady contact angles (8 µL sessile drop) measured with ImageJ/DropSnake on representative substrates. Panels show paired left/right fits of the contact line for each substrate; mean values and dispersion appear in Table 3. (a) Coating on glass—hydrophobic response (θ = 96.38°). (b) Water on plastic (Parafilm®) intermediate wetting (θ = 83.83°). (c) Coating on plastic-hydrophilic response (θ = 50.20°). Coating on sausage contact angle not determined due to surface roughness/absorption (N.D.).
Coatings 15 01245 g010
Figure 11. The color bar indicates the volume fraction α. Sequence of iso-surfaces at volume fraction α = 0.5 from the VOF simulation of the concentric flow-blurring jet (flow left-to-right). Snapshots at t = 0, 0.5, and 1.0 ms illustrate the onset of primary breakup: initial surface corrugation at the nozzle exit, ligament growth, and droplet pinch off. The jet disintegrates within approximately 0.8 ms, yielding ligament diameters <120 µm. (A) Early, pre-breakup. A continuous jet issues from the exit; the interface is smooth near the discharge and shows shallow streamwise corrugations downstream; no detached fragments are visible.; (B) Wave growth to ligaments. Interfacial waves amplify and stretch into slender ligaments with discernible necks, indicating imminent capillary rupture (minimum ligament diameters < 120 μm).; (C) Pinch-off and droplets. Ligaments have ruptured into parent and smaller satellite droplets; short ligament stubs remain near the exit.
Coatings 15 01245 g011
Figure 12. Instantaneous velocity field visualized through Line-Integral Convolution (LIC) and superimposed on dynamic pressure ( p r g h = p ρ g h ) at (A) the mid-section plane (z = 0.02 m) and (B) the symmetry plane (y = 0 m). Stream-wise streaks reveal vortical structures, whereas the color map highlights over- and under-pressure regions (blue = low, red = high); (C) a dynamic pressure colormap with shapes of satellite drops as a part of the phenomena after the instabilities of the fluid are observed, highlighted by red arrows; (D) Vorticity Details of dynamic pressure.
Coatings 15 01245 g012
Figure 13. Hydrodynamics in the coaxial microfluidic nozzle (VOF, mid-plane). (A) Velocity magnitude |U| (m s−1) at the symmetry mid-plane of the 3D incompressible, isothermal VOF simulation (OpenFOAM, interFoam), showing the inner jet core and the downstream mixing section. In a fixed color scale (0–14 m s−1). (B) Static pressure prgh (kPa) mapped on the same plane. Here p_rgh = p − ρ g h, i.e., static pressure corrected for hydrostatic head, which is the standard OpenFOAM variable reported for incompressible VOF. Consistent with the acceleration observed in panel (A). Together, panels (A,B) document the kinematic–pressure coupling underlying the microfluidic atomization stage.
Coatings 15 01245 g013
Table 1. Microfluidic device description.
ComponentDimensionFunction
Inner capillary1.0 mm ID, 1.5 mm OD (borosilicate glass capillary)Delivers the protein coating solution
Outer air capillaryInternal diameter tapers from 6 mm (inlet) to 1.0 mm (exit) over 60 mm axial lengthGenerates a converging annular air sheath for flow-blurring atomization
Liquid-tip recess10 mm upstream of the cone exitStabilizes the liquid jet and prevents wall impingement
Table 2. Physical properties.
PhaseDensity ρ (kg m−3)Kinematic Viscosity
ν (m2 s−1)
Surface Tension
σ (N m−1)
Air (24 °C)1.1881.48 × 10−5
Coating (24 °C)997.39.14 × 10−70.0721
Values from IAPWS-95 [31], IAPWS-2008 [32] and the IAPWS Revised Release on the Surface Tension of Ordinary Water [33] at 24.00 °C.
Table 3. Total and average volume of whey protein-based coating solution used to cover 10 turkey sausage cubes (1 cm3 each) using conventional and microfluidic methods.
MethodV Used (mL)V Sample (mL)
Conventional coating application (WPI-Conv)15.01.5
Microfluidic coating application (WPI-McF)8.00.8
Table 4. Statistical parameters of droplet diameters (µm).
ParameterValue (µm)
Mean (μm)106.99
Standard deviation (σ)55.88
Minimum (Dmin)30.45
Percentile 25 (P25)51.49
Median (D50)83.69
Percentile 75 (P75)137.15
Maximum (Dmax)399.49
Table 5. Results of measurements of contact angle over diverse surfaces.
ImageSubstrateθL (°)θR (°) θ ¯ (°)∆θ (°)Classification
aCoating/Glass 97.3495.4396.380.96Hydrophobic
bWater/Plastic84.3483.3283.830.51Intermedium
cCoating/Plastic50.3850.0250.200.18Hydrophilic
dCoating/SausageN.D.N.D.N.D.N.D.N.D.
Disclaimer/Publisher’s Note: The statements, opinions and data contained in all publications are solely those of the individual author(s) and contributor(s) and not of MDPI and/or the editor(s). MDPI and/or the editor(s) disclaim responsibility for any injury to people or property resulting from any ideas, methods, instructions or products referred to in the content.