1. Introduction
Rammed earth, a remarkably durable construction material, was widely employed in ancient times for building city walls and palaces [
1]. In China, the mastery of rammed earth techniques can be traced back to the Longshan culture and later became prevalent in residential construction [
2,
3]. Rammed earth walls are formed by compacting moist soil—typically a mixture of clay, sand, and gravel—within wooden molds. Similarly to other unfired earthen construction methods, such as the use of adobe bricks, rammed earth exhibits a long-standing and continuous historical tradition across many regions of the world [
4]. As an important component of geotechnical engineering, rammed earth construction has contributed to the development of structural systems and improvements in load-bearing capacity [
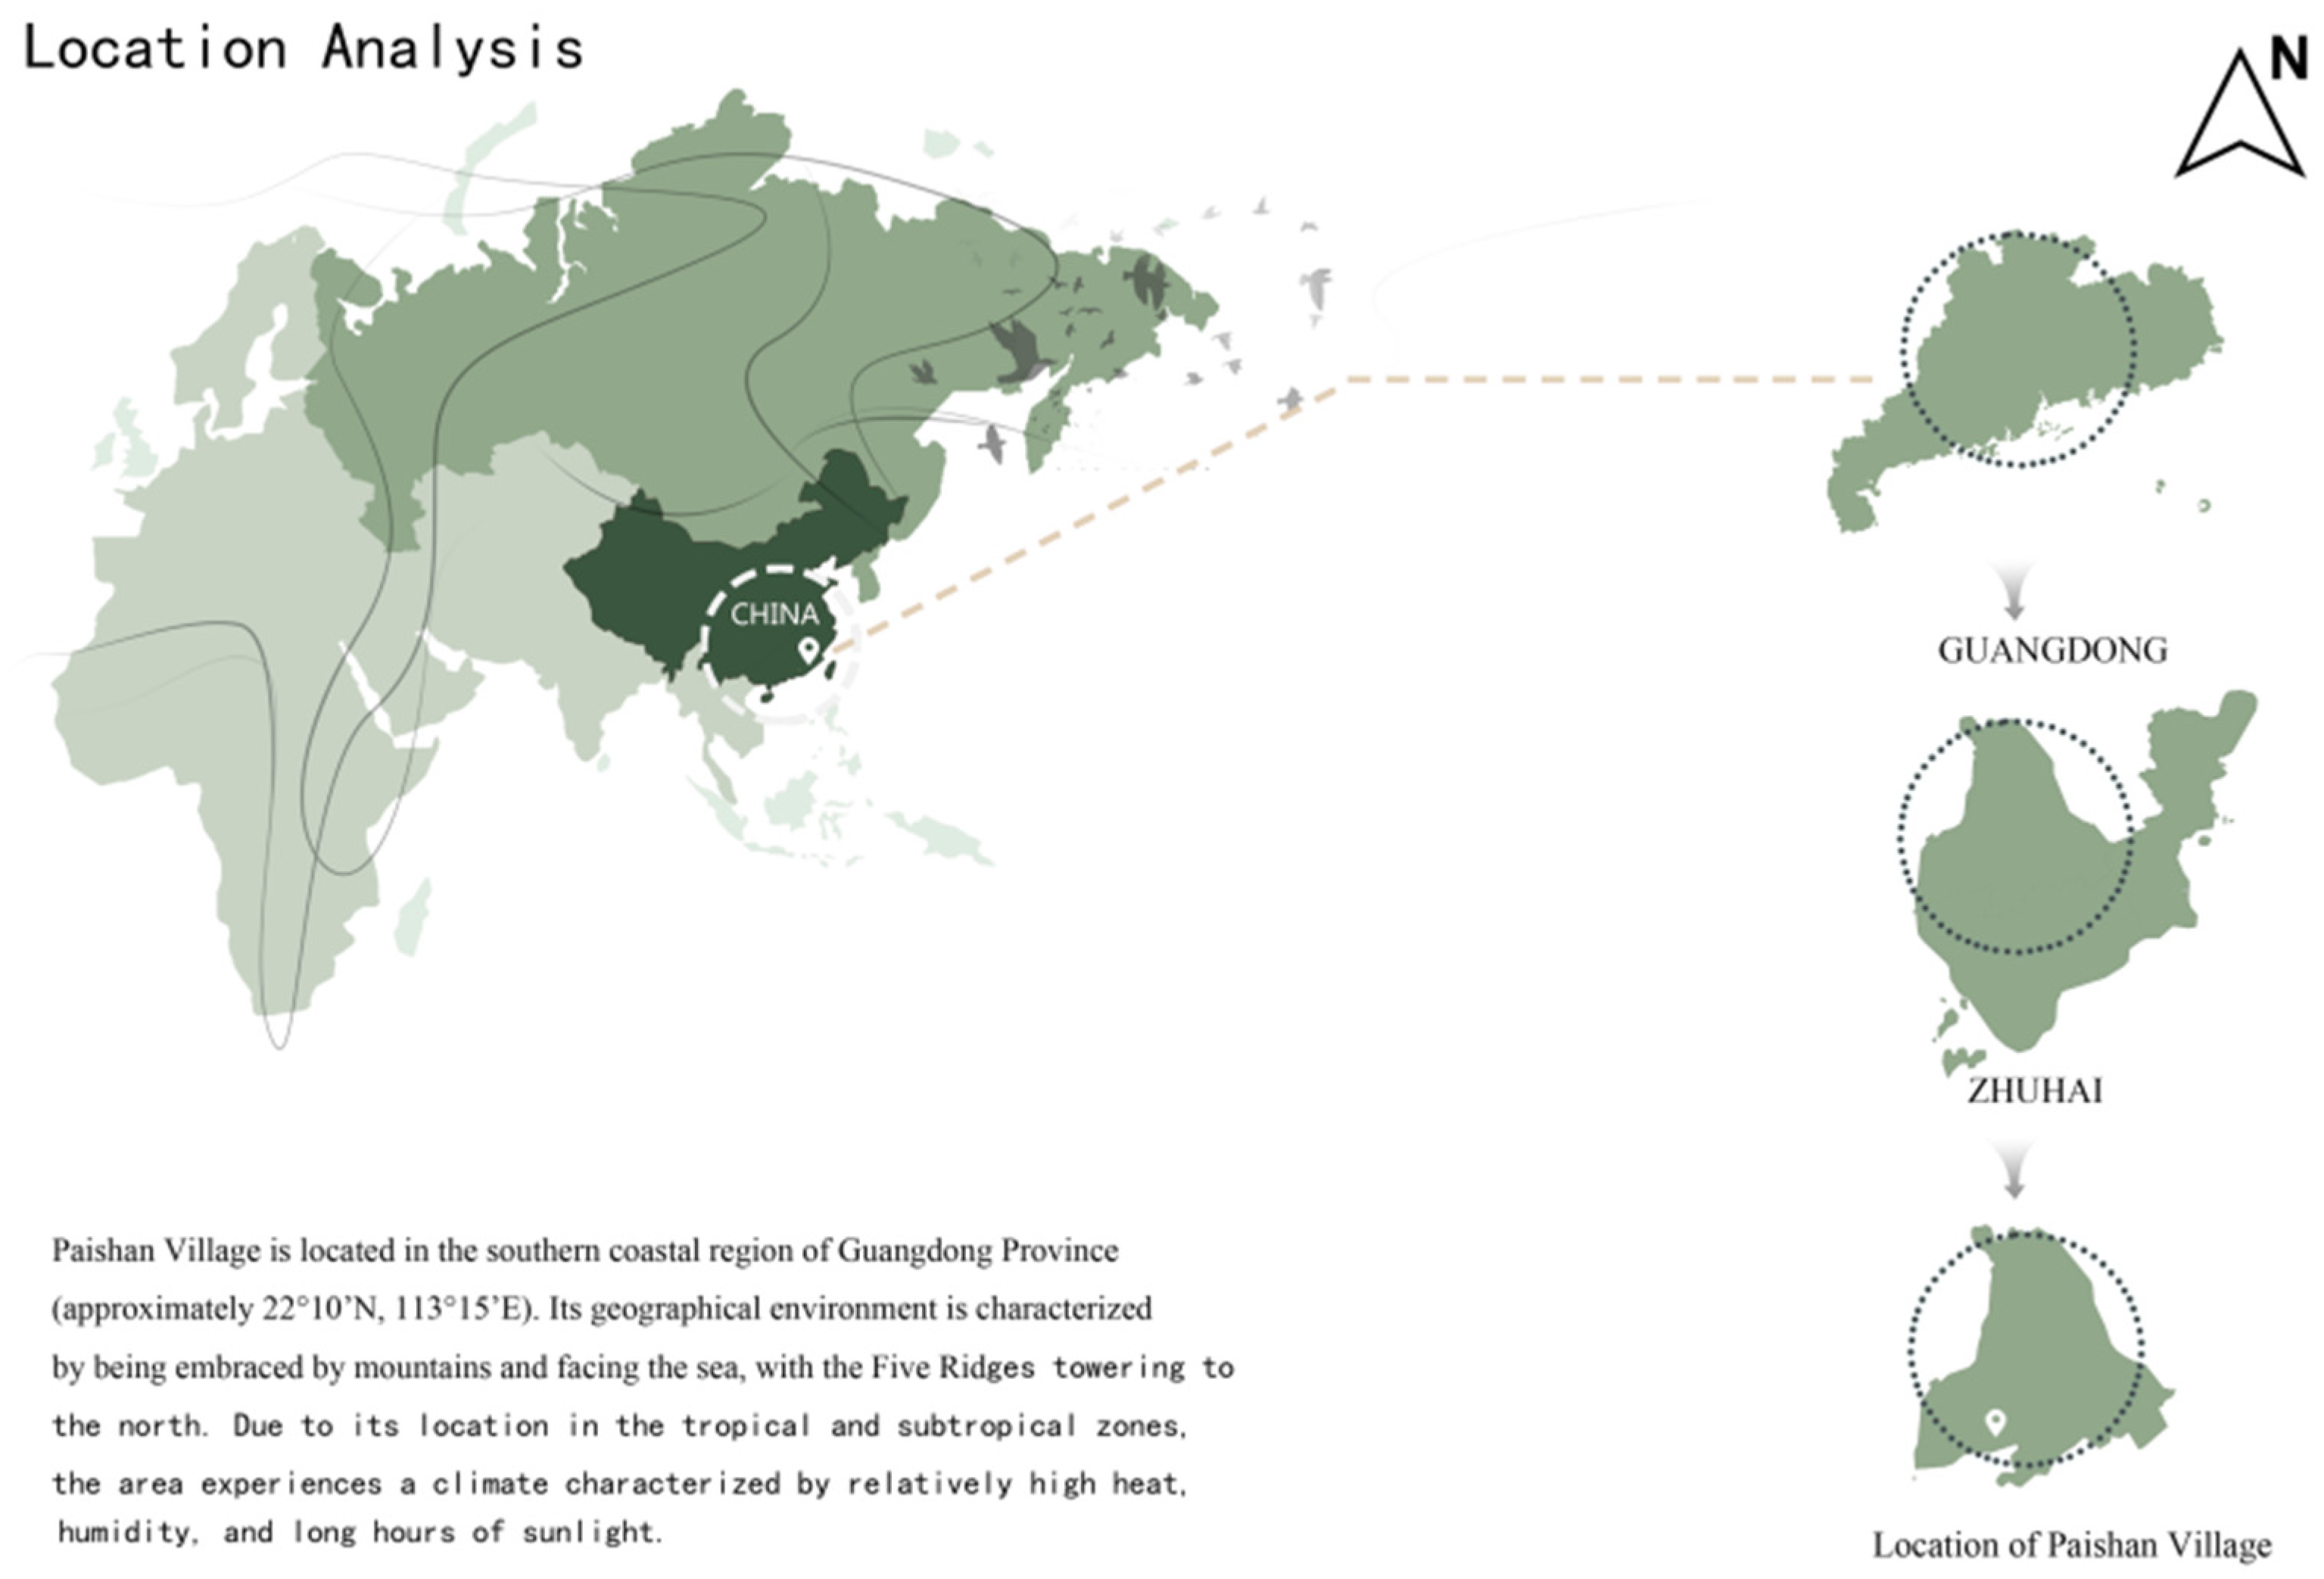
5]. Paishan Village, Zhuhai, was established in 1778 during the reign of Emperor Qianlong (Qing Dynasty), and it represents a quintessential example of traditional Lingnan rural architecture. Nearly one hundred historic houses remain in the village today; they were primarily constructed with rammed earth walls and timber-framed tile roofs and adorned with intricate wooden and stone carvings typical of the Lingnan style. Among them are 70 rammed earth houses, 6 red-brick houses, and 9 blue-brick houses, all demonstrating refined craftsmanship. Over time, the combined effects of humidity and environmental exposure have fostered distinctive microbial communities on the surfaces of these rammed earth walls [
6].
Rammed earth buildings remain common today, with approximately one-third of the global population living in dwellings constructed primarily from earthen materials [
7,
8]. The Paishan Village complex, as the largest existing rammed earth settlement in the Pearl River Delta, provides an important interdisciplinary research case for architecture, materials science, and cultural heritage conservation [
9]. However, the humid subtropical climate of Zhuhai accelerates the deterioration of rammed earth structures. Compared with brick or reinforced concrete walls, rammed earth exhibits relatively low strength and durability, and insufficient maintenance and funding often result in structural safety issues [
10]. Existing microbiological studies on ancient rammed earth structures have mainly focused on microbial community diversity, their effects on soil materials, and the application of detection technologies. Characterizing microbial communities provides essential insights into their distribution and ecological mechanisms within rammed earth materials [
11]. Microorganisms significantly influence the physical and chemical properties of earthen structures and play crucial roles in both their preservation and degradation processes [
12,
13]. Some microbial biofilms can protect surfaces from erosion, while microbial-induced mineralization has been explored as a means to enhance the mechanical stability of earthen materials [
14].
Recent advances in molecular biology and high-throughput sequencing technologies have greatly improved the study of microbial diversity in built heritage materials. Techniques such as 16S rRNA and ITS gene sequencing, metagenomic analysis, and fluorescence microscopy enable the comprehensive profiling of microbial community compositions and their functional potential [
15]. Metagenomic approaches, in particular, facilitate the identification of biodeteriogenic species and the assessment of their metabolic pathways, providing a scientific foundation for conservation and restoration strategies [
16]. Nevertheless, current research often remains confined to a single disciplinary dimension—either materials or microorganisms—without systematic integration. The lack of in-depth investigations into site-specific microbial communities in traditional villages, such as Paishan, limits our understanding of the interactions among environmental factors, microbial metabolism, and the chemical–physical evolution of rammed earth. The rammed earth materials used in Paishan Village primarily rely on locally sourced soil blended with quartz-rich aggregates and natural binders such as glutinous rice slurry and brown sugar syrup, which enhance cohesiveness and strength [
17]. However, Zhuhai’s high temperature and humidity accelerate weathering, microbial degradation, and wall collapse [
18,
19]. Consequently, many historic dwellings have been abandoned or fallen into disrepair. Addressing the challenges of durability and the biodeterioration of traditional rammed earth structures under such climatic conditions is therefore urgently needed for both cultural heritage preservation and sustainable building material research.
3. Results
3.1. Analysis of SEM Images
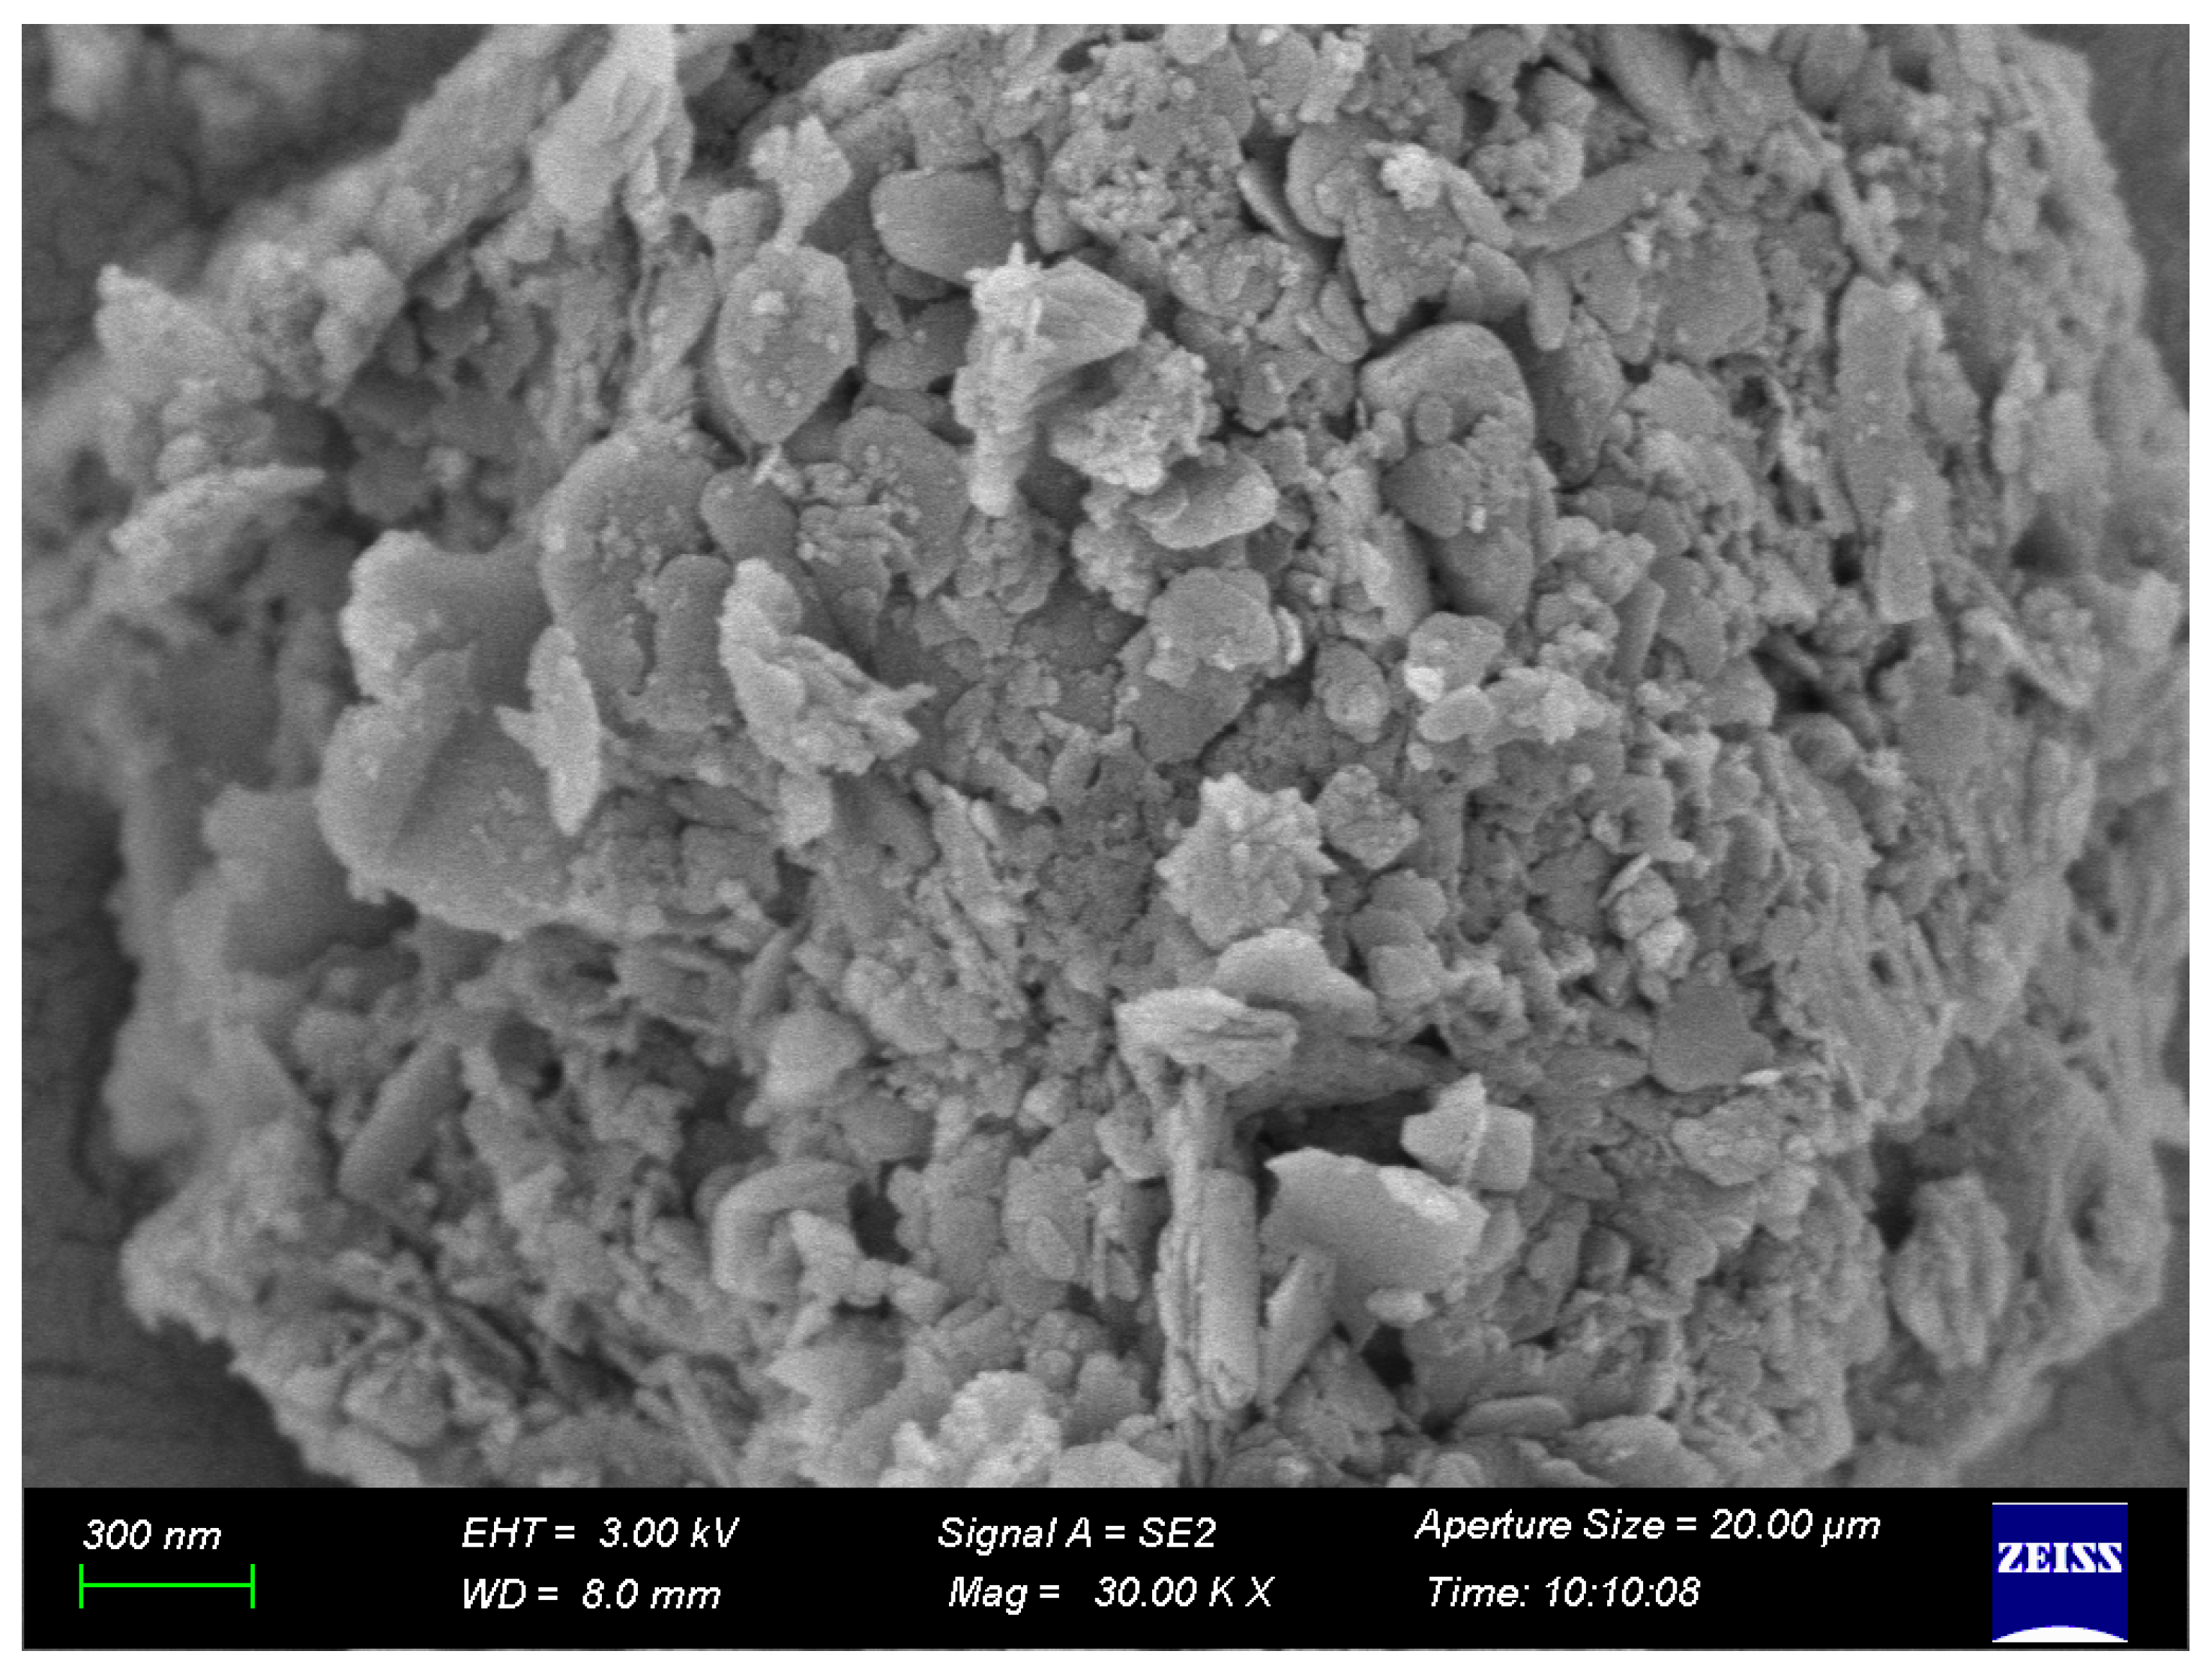
Through SEM imaging analysis of samples from the east, south, west, and north walls of Paishan Village, it was observed that there were obvious differences in their micromorphology and surface characteristics. From the SEM results, the rammed earth particles of the east wall are randomly distributed in the form of agglomerates (
Figure 2). Blocky and flaky particles of different sizes are stacked and bonded to each other, forming a relatively loose aggregate structure; the surface is rough and concave, with widespread pores and depressions. Some pores are “nested” due to particle accumulation, reflecting the heterogeneity of the microstructure and the combined influence of raw material grading, preparation technology, and later environmental erosion. As shown in
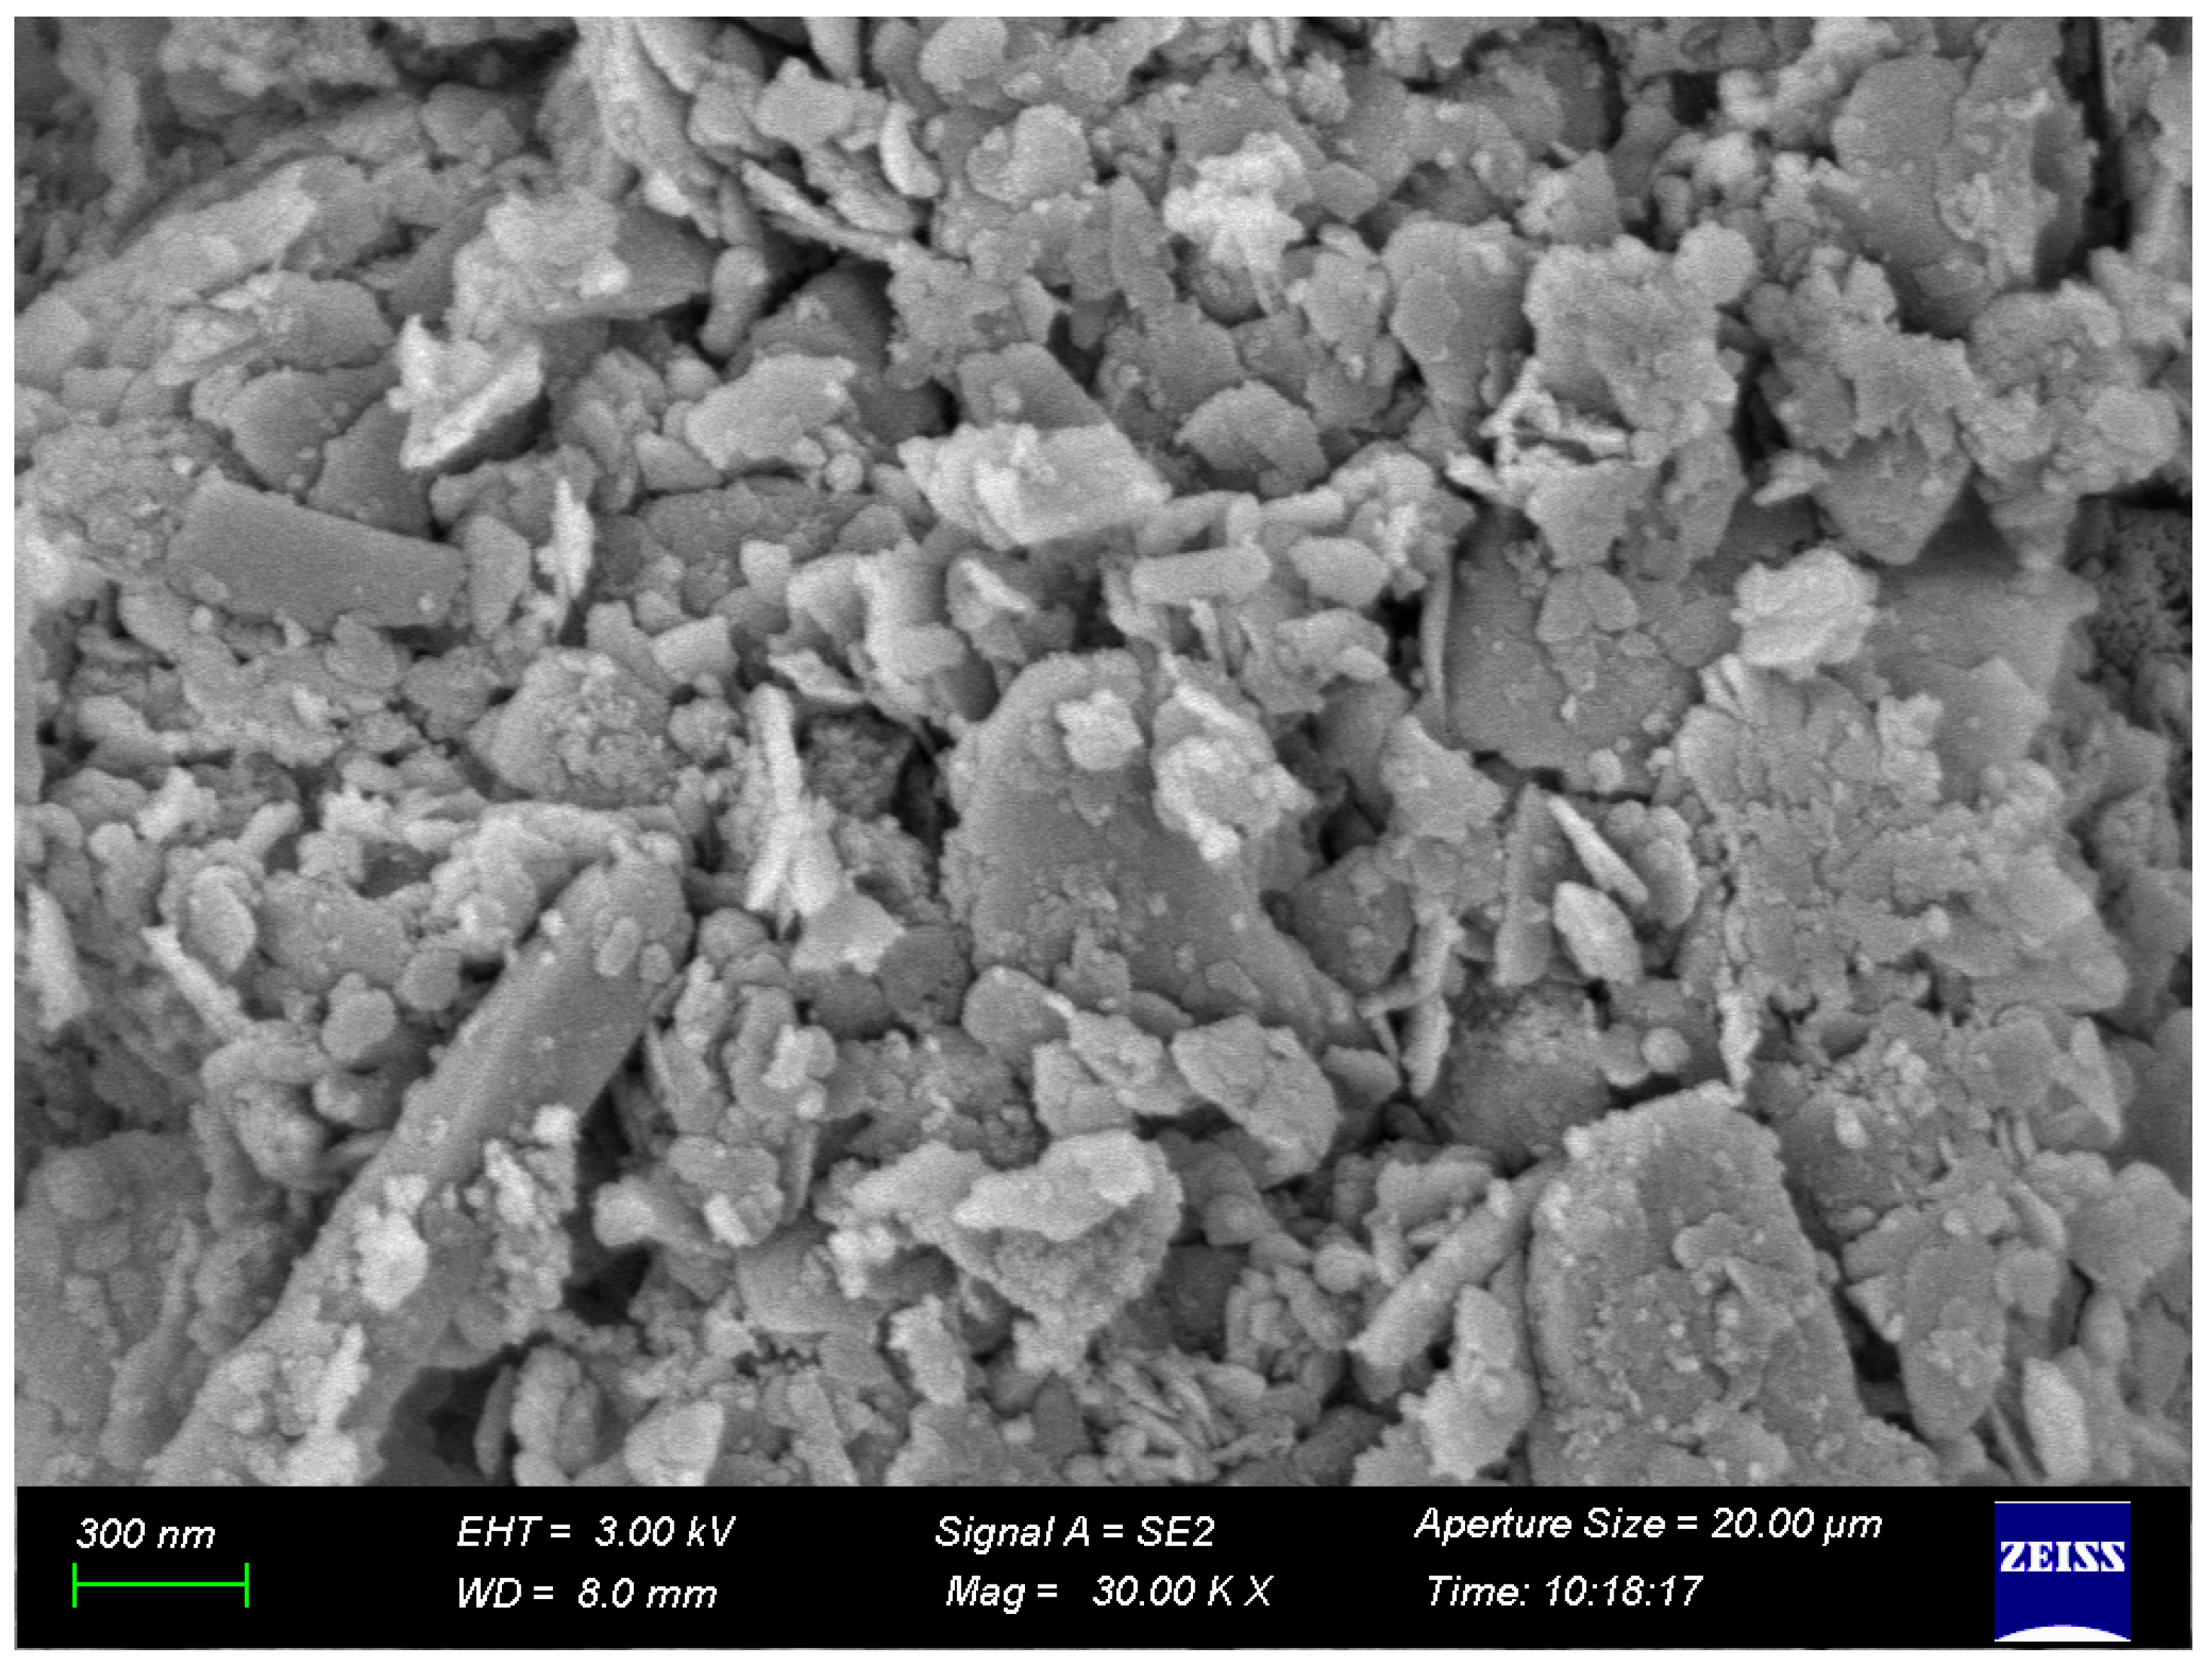
Figure 3, the rammed earth particles of the south wall exist in the form of irregular agglomerates with significant size differences. It can be observed that the long strips and blocky particles are stacked and bonded to each other, forming a relatively loose structure; the surface is rough and uneven, with pores and depressions widely distributed, and some pores are “connected” due to particle accumulation, reflecting the heterogeneity of the microstructure—this feature is a result of both the gradation of the raw materials (such as the ratio of coarse and fine particles and composition differences) and subsequent environmental erosion and transformation. The rammed earth particles of the west wall exhibit an irregular agglomeration state (
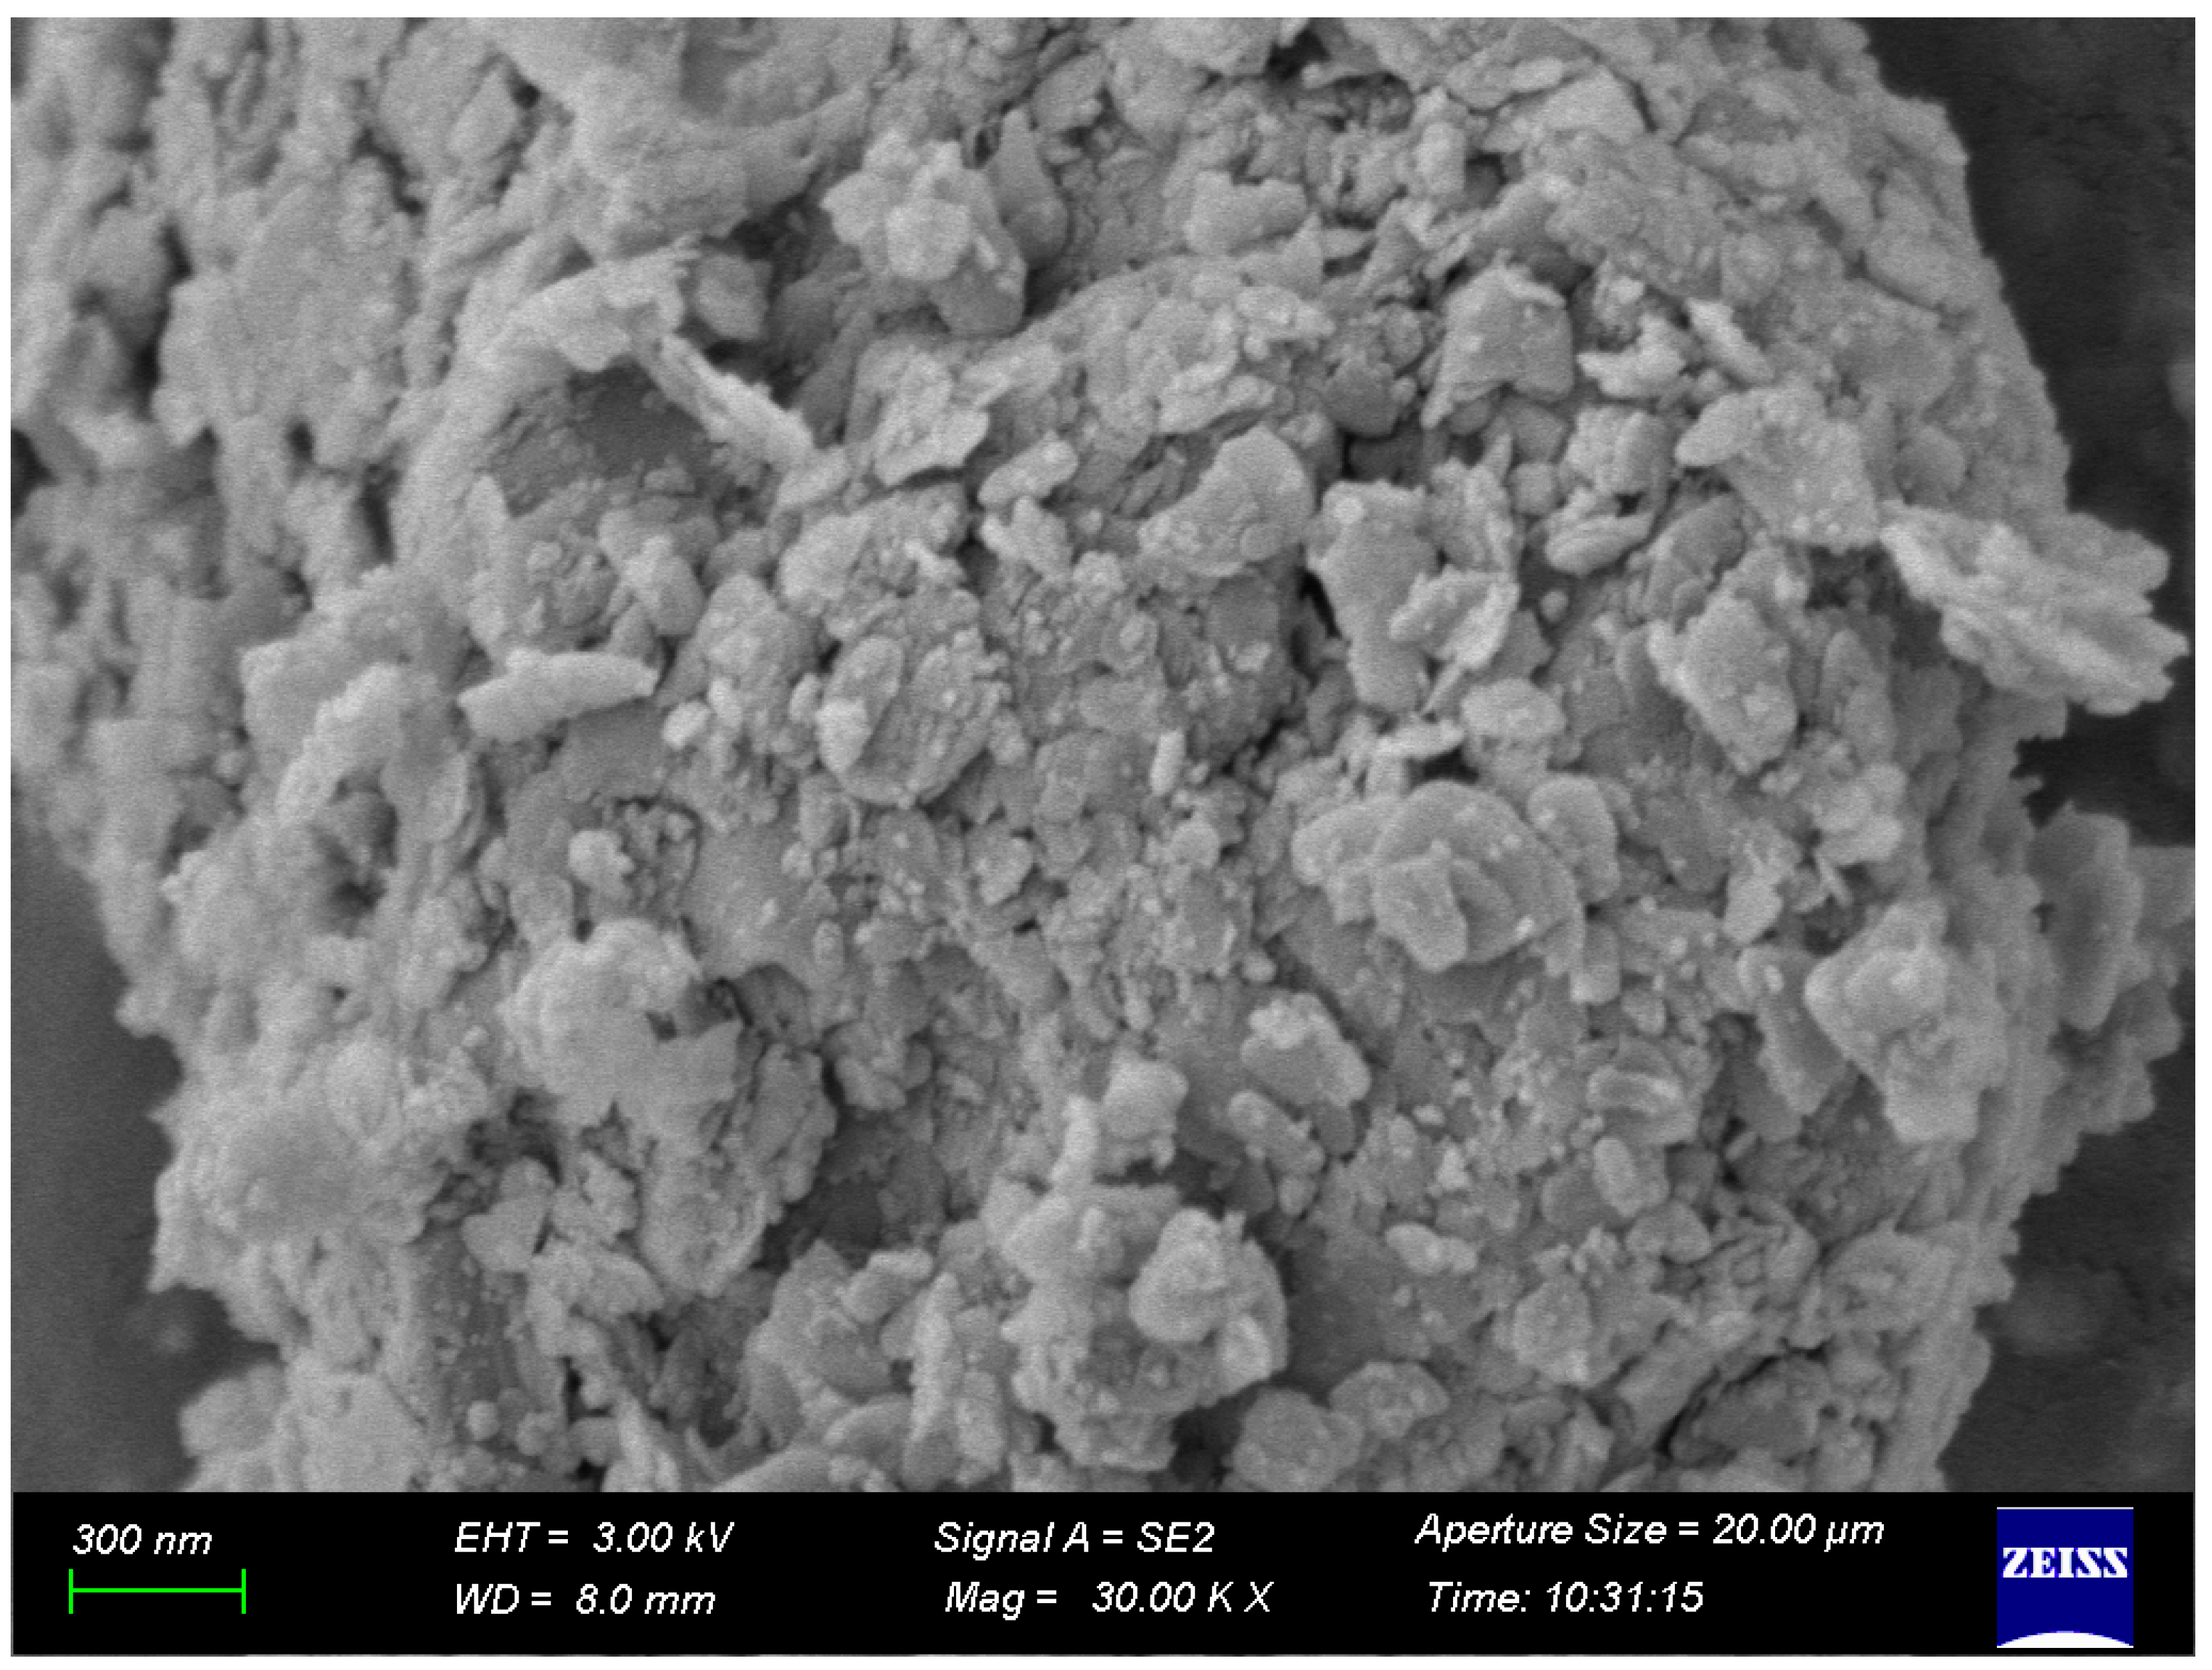
Figure 4). Particles of different sizes adhere to and stack upon each other, forming a relatively loose aggregate structure. The surface exhibits a pronounced rough texture with noticeable bumps, depressions, and numerous pores. If the raw materials are not mixed evenly (for example, with too many large or small particles), the small particles cannot fill the spaces between the larger ones, resulting in gaps; moreover, if pressure, layering, and moisture are not managed well during the ramming process, the particles will not be packed tightly enough, resulting in tiny holes. The west wall is affected by sunlight, temperature, dry–wet cycles, and other environmental effects, which may aggravate the change in the bonding force between particles, causing the surface particles to fall off and the pores to expand, as observed via the concave–convex and pore characteristics in the image. Under a high magnification of 30.00 KX, the rammed earth particles of the north wall present an irregular agglomeration morphology, with obvious differences in particle size (
Figure 5). In addition, the particle sizes of the four rammed earth walls were statistically analyzed (
Table 1). Small particles adhere to each other and pile up to form a relatively loose agglomerate structure. The surface is rough and uneven, with many pores and depressions. Zhuhai has a subtropical marine climate with high air humidity and frequent rainfall. The north-facing wall remains shaded for long periods, receiving little sunlight and maintaining a low temperature. When interacting with hot and humid air, a “cold bridge effect” easily forms (the wall’s temperature is lower than the dew point temperature of the hot and humid indoor and outdoor air), causing moisture to condense and penetrate the wall’s surface. Repeated freezing and thawing of moisture (under low temperatures) or dry–wet cycles weaken the bonding forces between rammed earth particles, causing surface particles to detach and form depressions, while moisture erosion gradually enlarges the pores. This morphology reflects the heterogeneity of rammed earth at the microscopic level, resulting from the combined effects of its composition and formation process.
3.2. Species Taxonomic Annotation Results
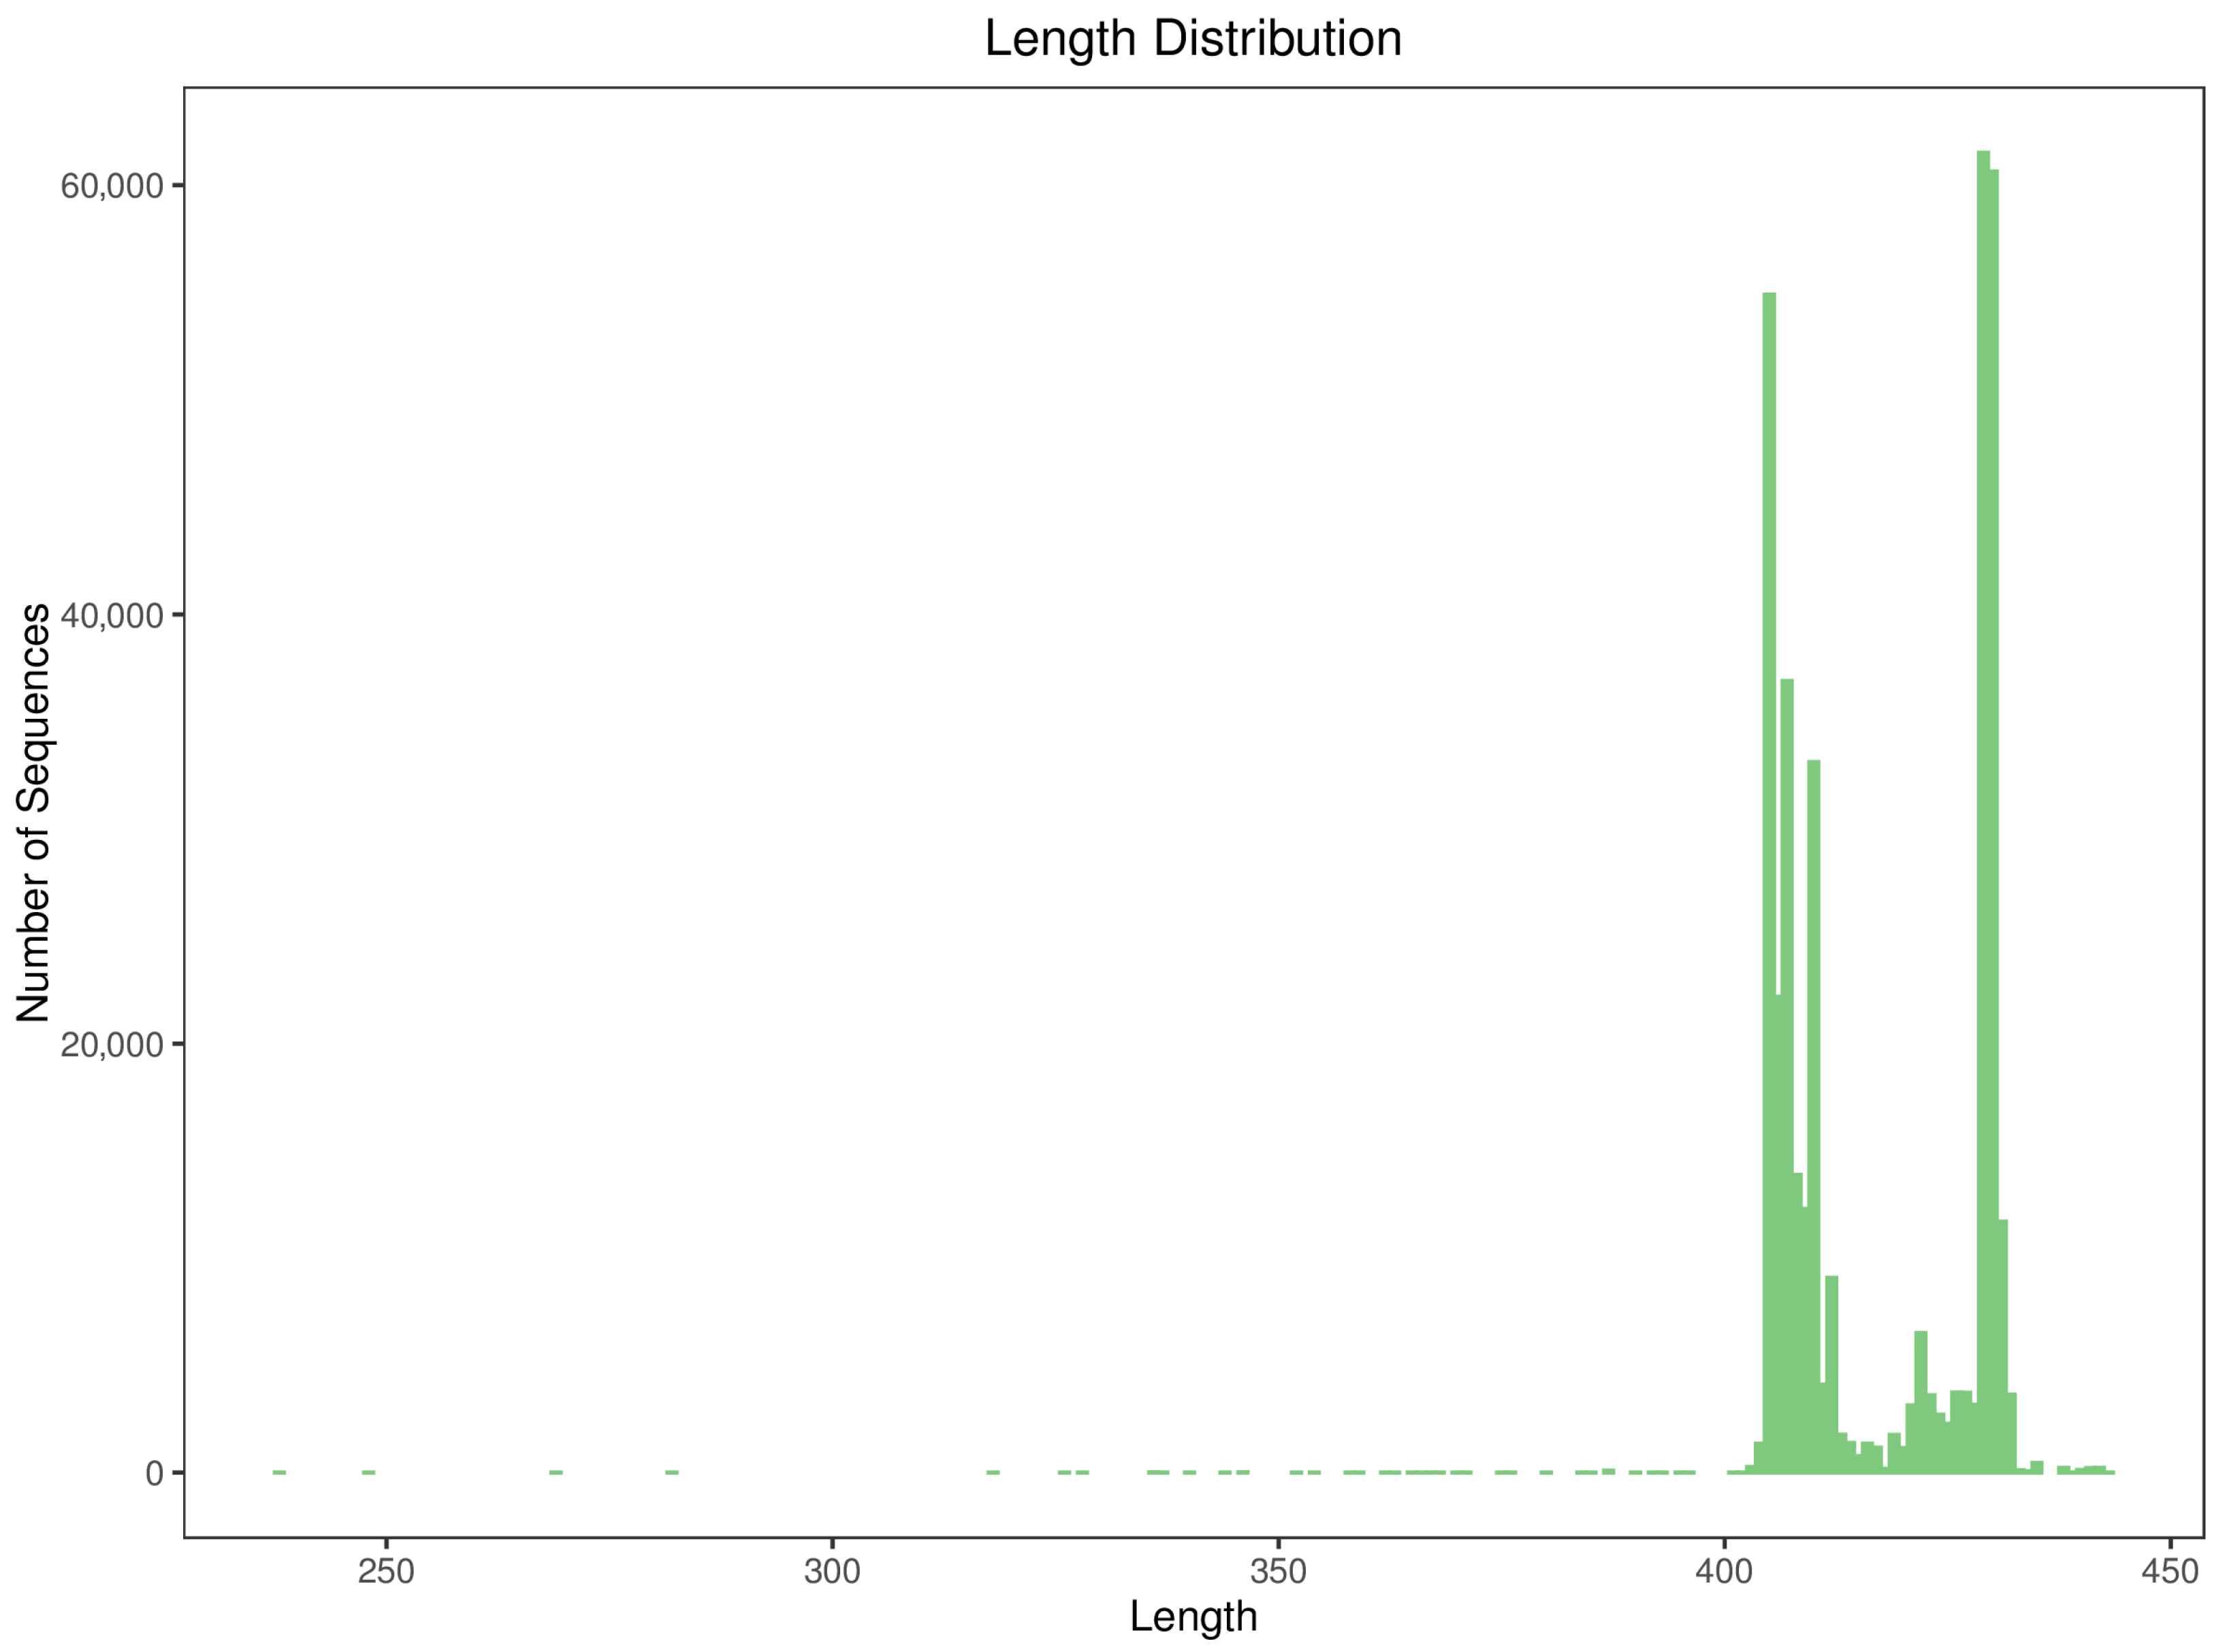
To ensure the correspondence between microstructure and community data, we selected one representative sample from each of the four orientations for SEM imaging. Additionally, we conducted 16S rRNA metabarcoding sequencing and bioinformatics analysis on three replicates per orientation, totaling 12 samples. The sequencing statistics and data quality summaries for each sample are presented in
Table 2 and
Figure 6.
The statistical analysis of species annotation results is summarized in
Table 3.
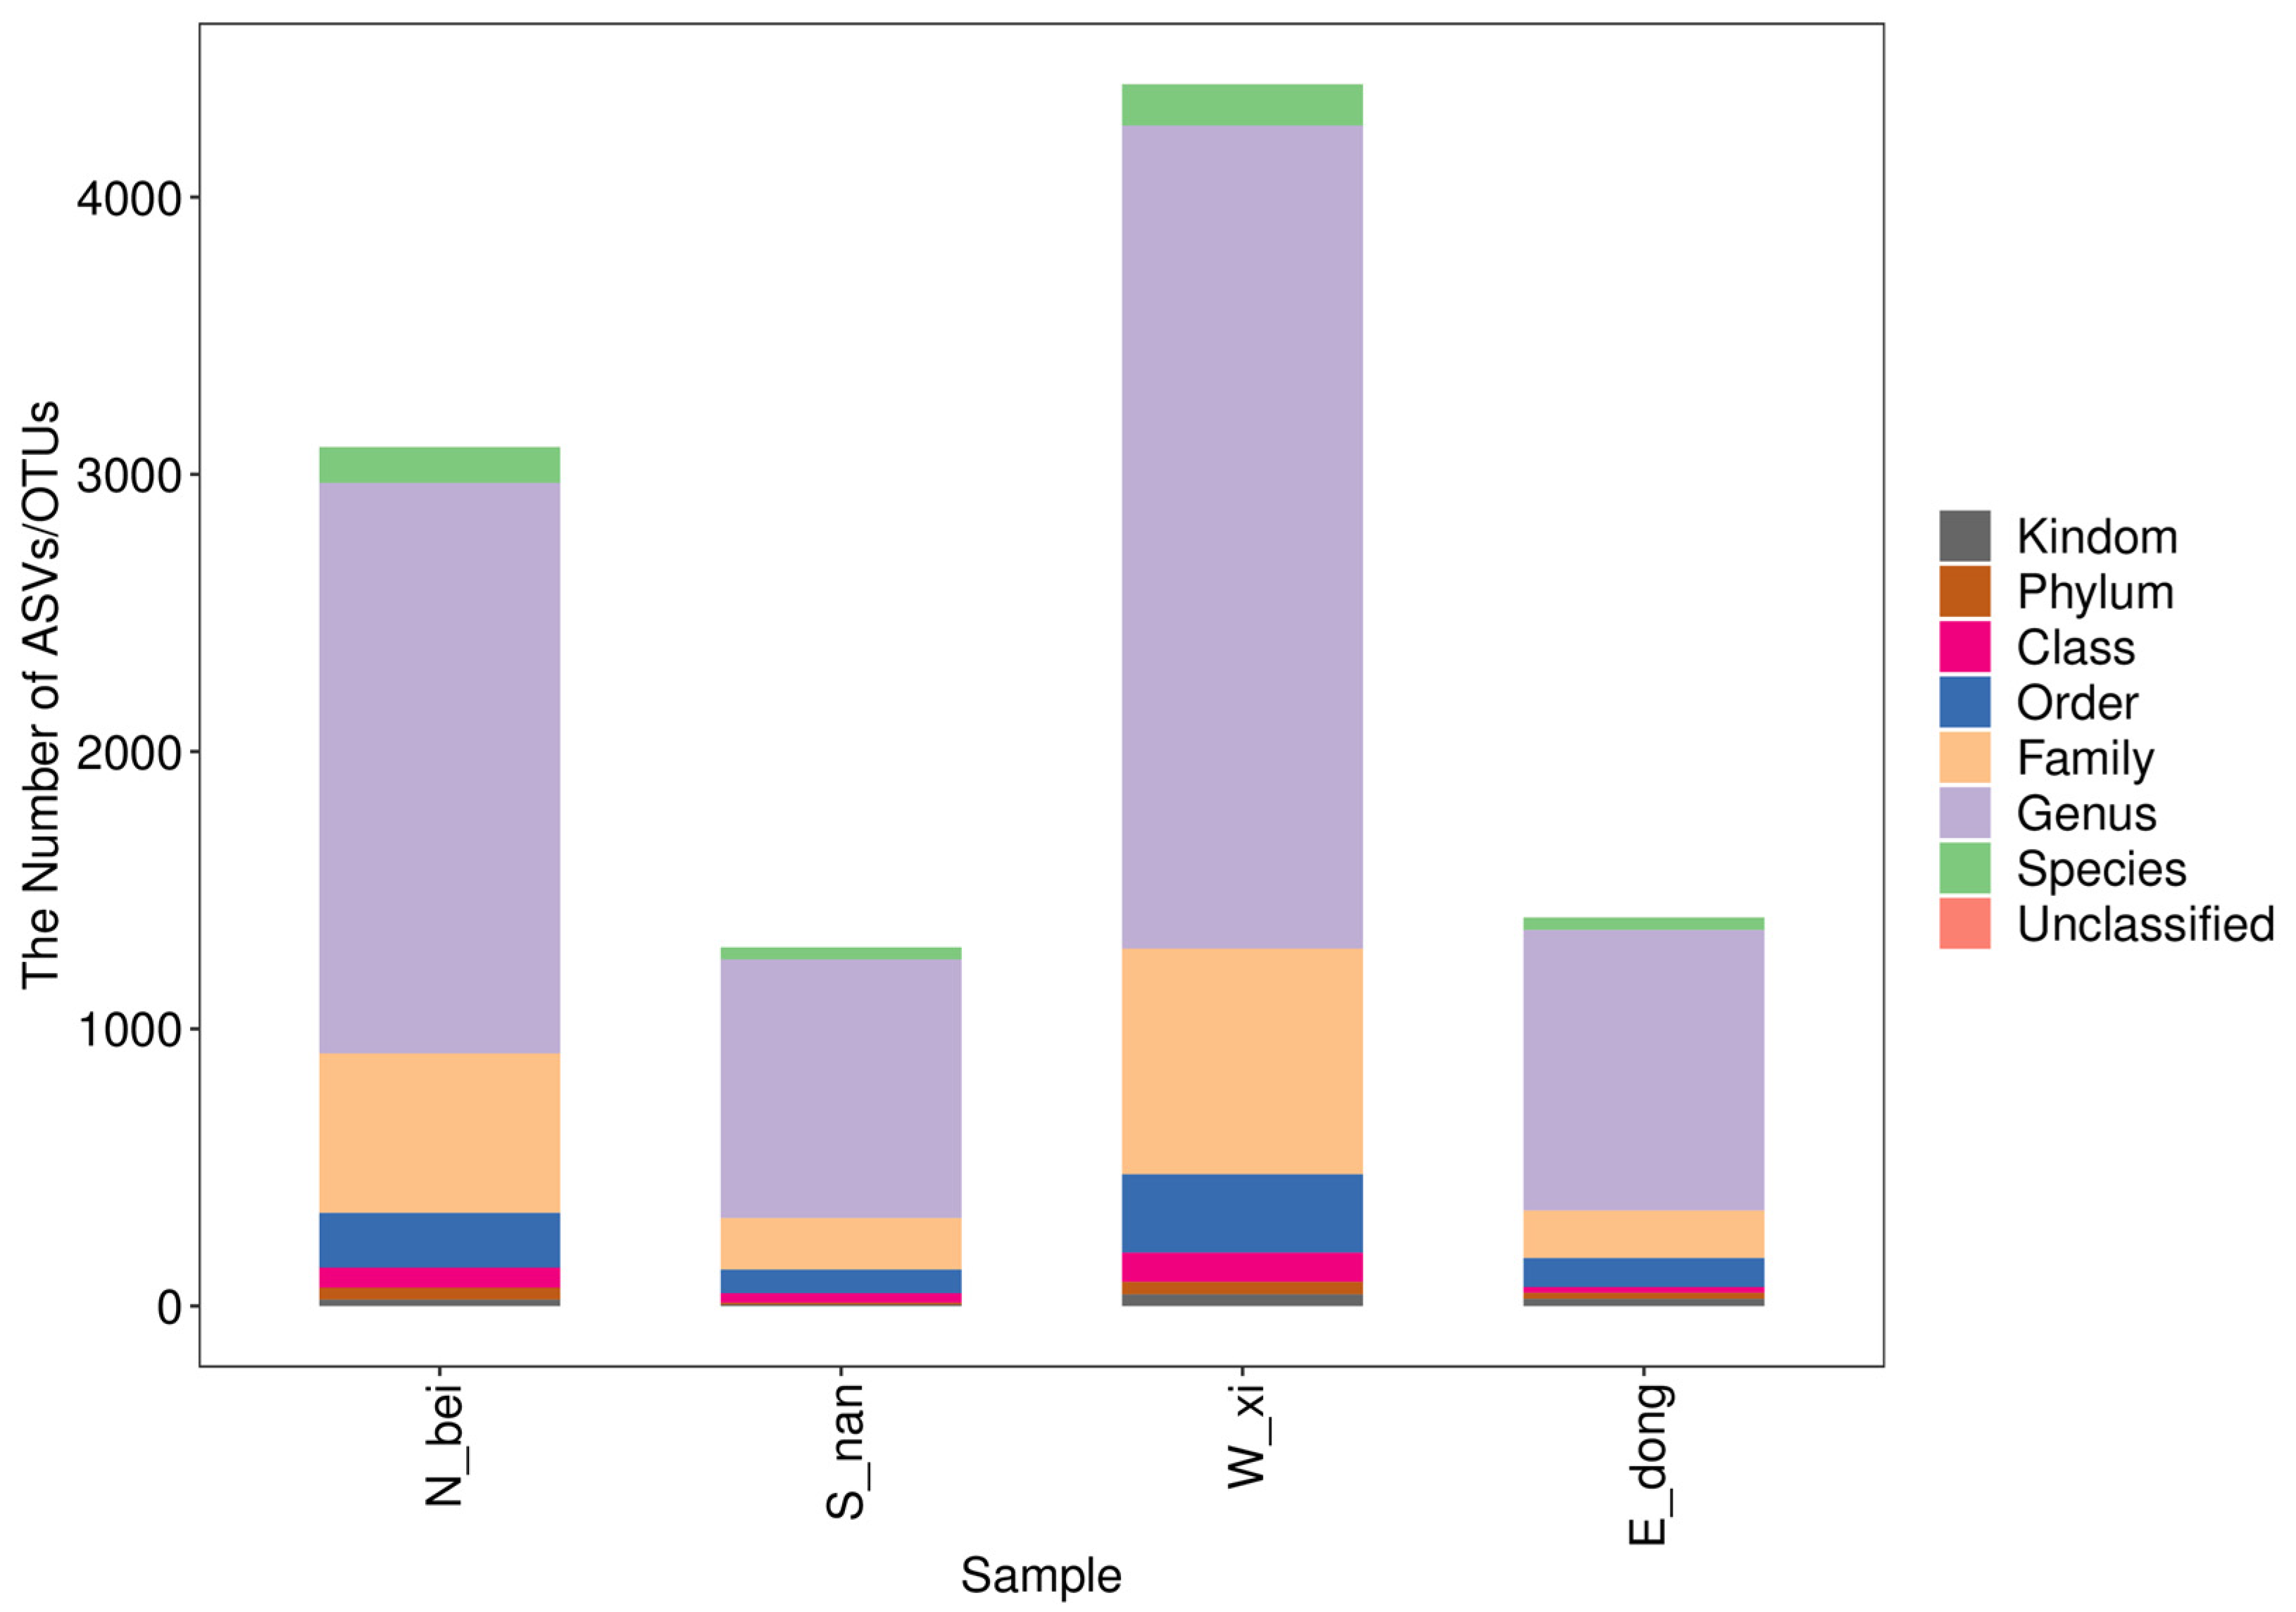
Figure 7 illustrates the taxonomic composition of the microbial communities at different classification levels (from phylum to genus) for samples collected from the east (E_dong), south (S_nan), west (W_xi), and north (N_bei) walls. Significant differences were observed in both the number and relative abundance of microbial taxa among the four orientations. The south-facing wall exhibited a higher proportion of Firmicutes and Actinobacteria, while the north-facing wall showed an increased abundance of Proteobacteria and Bacteroidetes. These findings indicate that environmental conditions, such as sunlight exposure and moisture content, strongly influence microbial diversity and community composition on rammed earth wall surfaces.
- (1)
The west wall (sample W_xi) had the greatest variety of species at every taxonomic level, with no unclassified microorganisms: 42 at the domain level, 45 at the phylum level, 105 at the class level, 283 at the order level, 814 at the family level, 2969 at the genus level, and 149 at the species level. This shows that the microbial community on this wall was very diverse and that the taxonomic classification was largely complete.
- (2)
The microbial richness of the north wall (sample N_bei) ranked second. With the exception of the domain (23) and phylum (43) levels, which were slightly lower than those of the west wall, the number of classes (72), orders (198), families (575), genera (2058), and species (129) was significantly higher than those of the east and south walls. Notably, the genus level was close to 70% of that of the west wall, indicating a more complex community structure.
- (3)
The microbial richness of the east wall (sample E_dong) exhibited a “polarized” characteristic: the number at the domain level was the highest (26), but the number at the class level was the lowest (21). The numbers of phyla (21), orders (105), families (171), genera (1012), and species (45) were all at a medium level, indicating that the microorganisms on the wall exhibited some diversity in high-order taxonomic units (such as domains), but the degree of differentiation in medium-order and low-order units (such as classes and species) was low.
- (4)
The south wall (sample S_nan) had the lowest microbial richness. The number of taxa at each level (domain: 5; phylum: 6; class: 35; order: 85; family: 186; genus: 933; species: 44) was significantly lower than those of other walls, with the genus count only slightly higher than that of the east wall, indicating that the microbial community structure of this wall was relatively simple and the species diversity was low.
It is worth noting that the number of unclassified microorganisms on all walls is 0, indicating that the coverage and accuracy of the taxonomic annotation are high, and this can better reflect the taxonomic characteristics of the microbial communities on walls facing different directions. This difference in microbial richness may be closely related to the microenvironment of the wall (such as light, humidity, temperature, etc.), providing basic data for further exploring the interaction mechanism between the building environment and the microbial community.
3.3. Species Composition Analysis
3.3.1. Statistics of the Number of Taxonomic Units
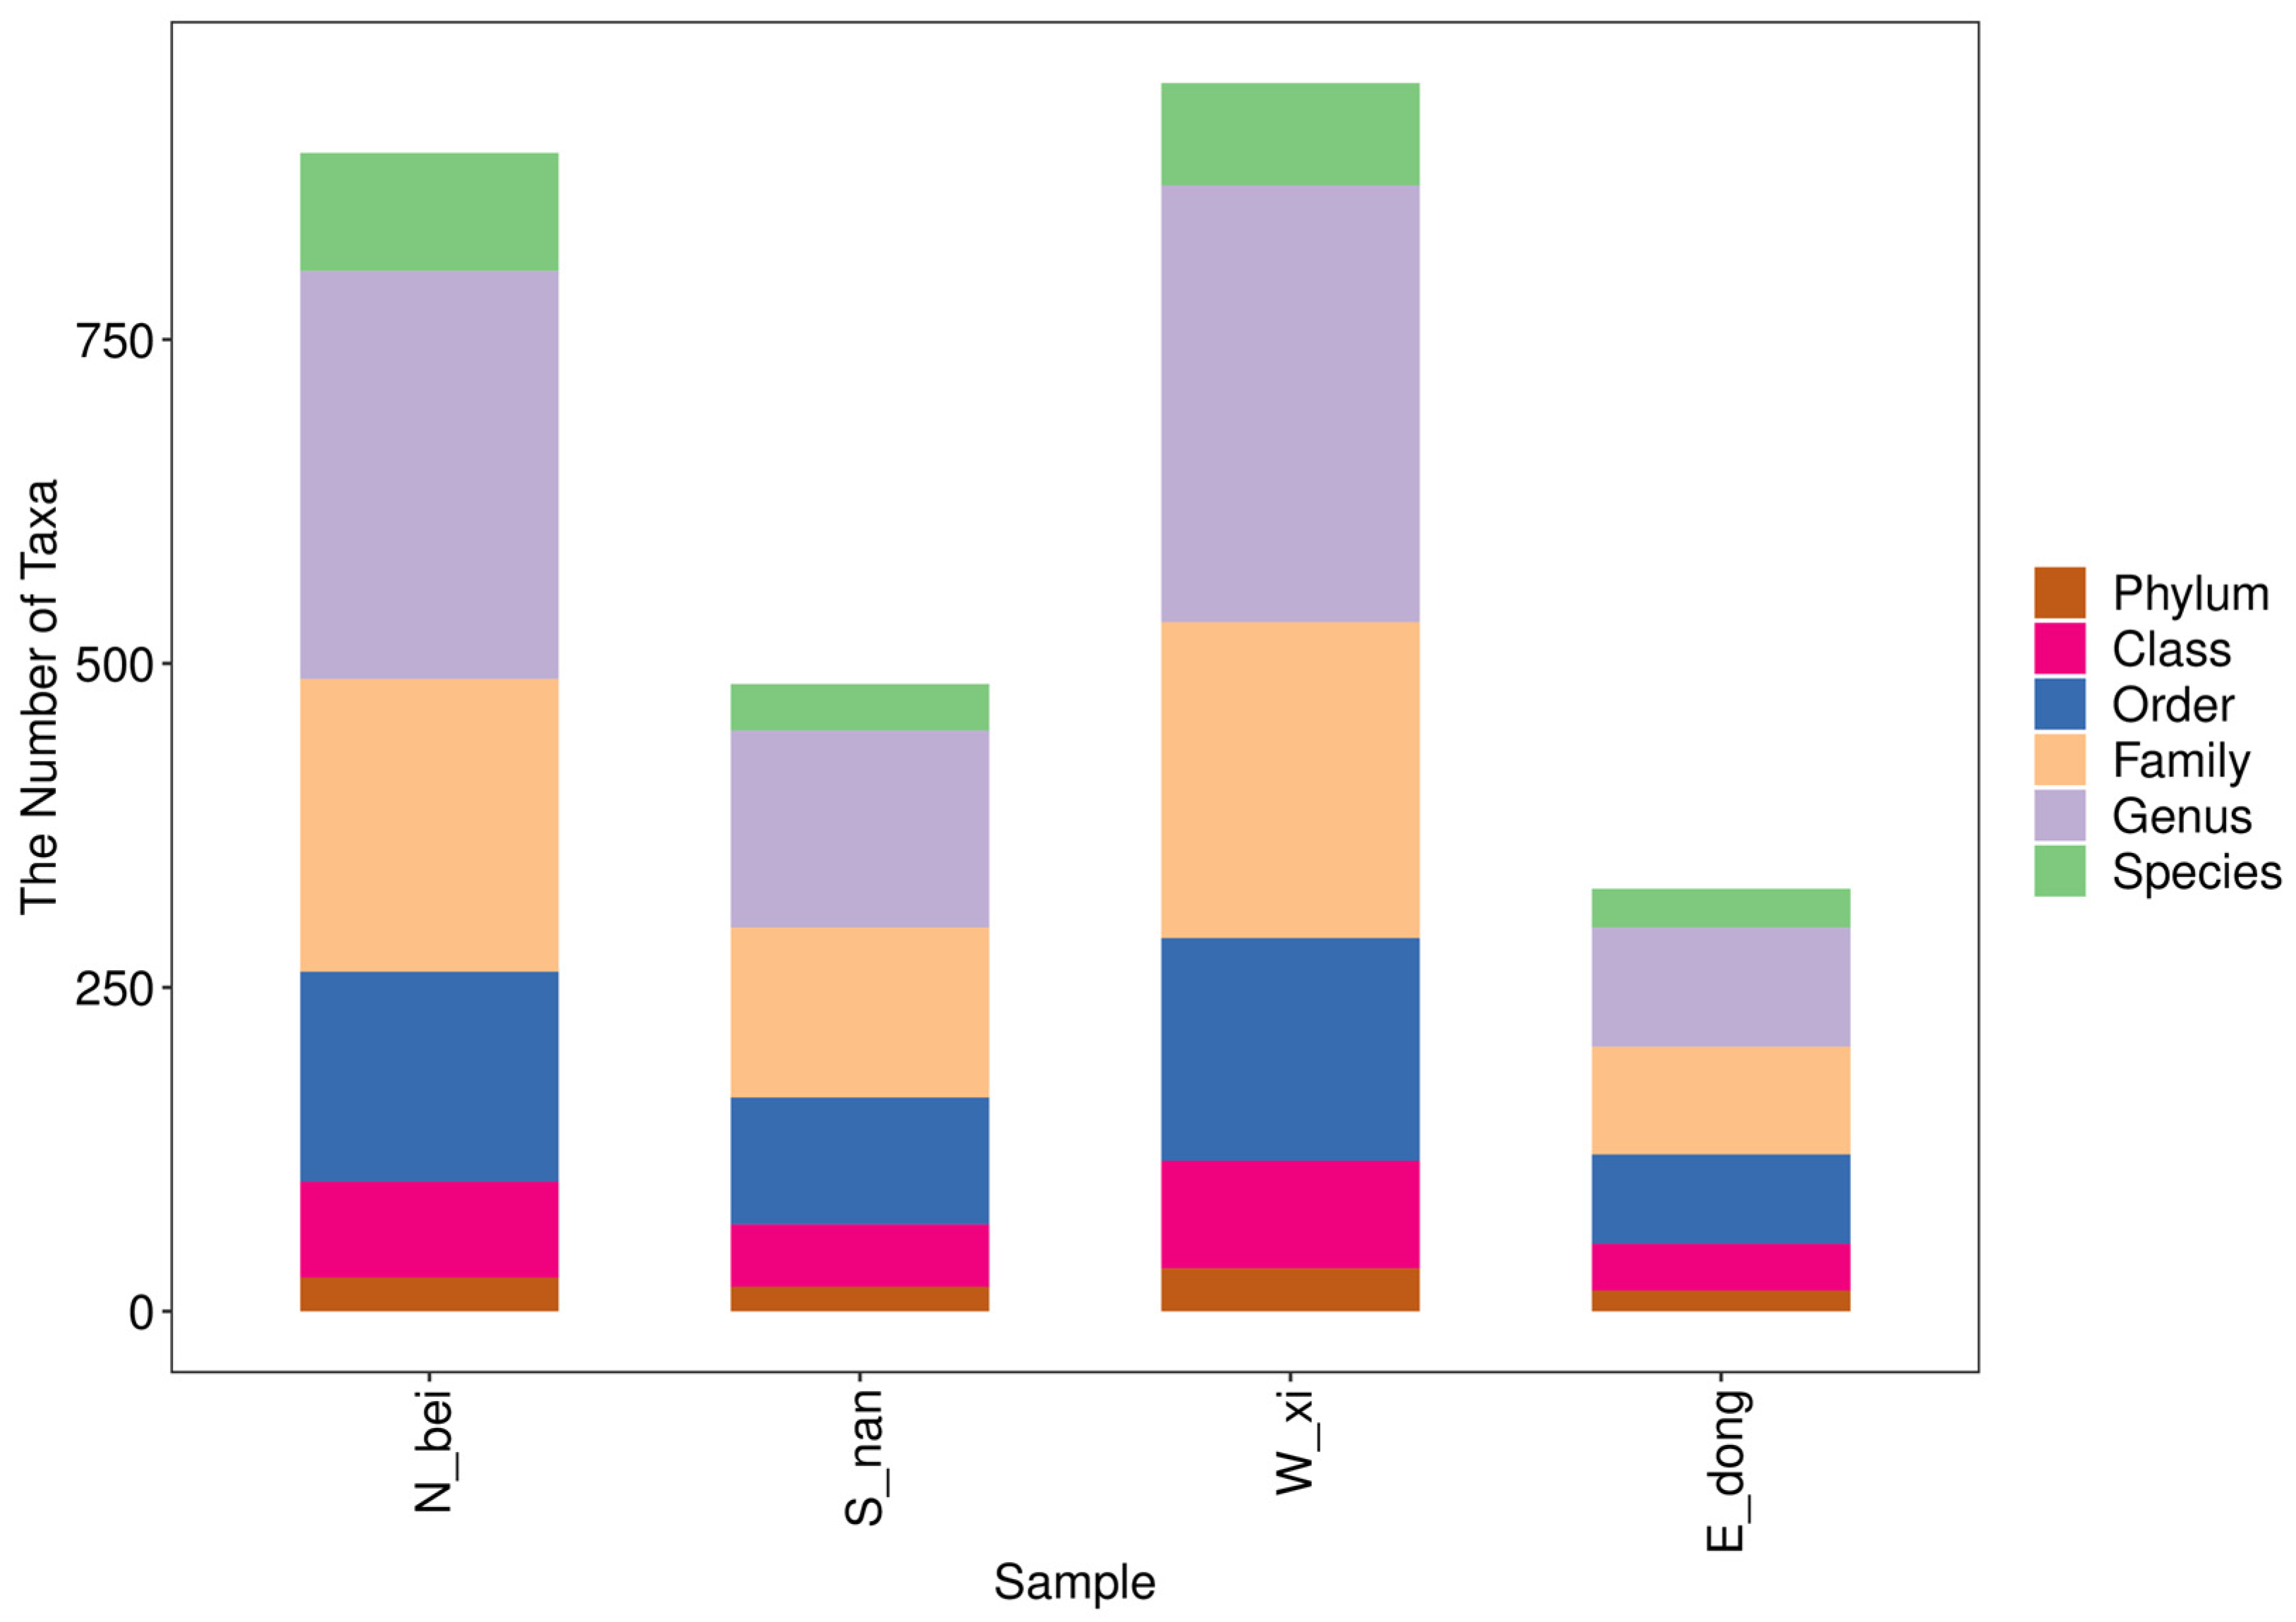
By analyzing the ASV/OTU tables obtained after sequencing and quality control, the taxonomic composition of the microbial communities in each wall sample was determined across multiple classification levels (phylum, class, order, family, and genus). The number of taxonomic units identified in each sample is summarized in
Table 4, while their distribution patterns are visualized in
Figure 8. Rather than simply presenting raw counts, this section highlights the comparative differences among samples and their ecological implications. The south-facing wall (S_nan) exhibited the highest number of taxonomic units across most classification levels, suggesting greater microbial richness, likely influenced by higher temperature, humidity, and sunlight exposure. In contrast, the north-facing wall (N_bei) contained fewer identified taxa, indicating lower microbial diversity; this is possibly a result of reduced light and cooler surface conditions. The east (E_dong) and west (W_xi) walls displayed intermediate values, reflecting moderate environmental variability. These quantitative differences in taxonomic richness correspond well with the compositional trends shown in
Figure 8, providing a clear statistical basis for understanding spatial heterogeneity in microbial diversity across the four wall orientations.
3.3.2. Taxonomic Composition Analysis
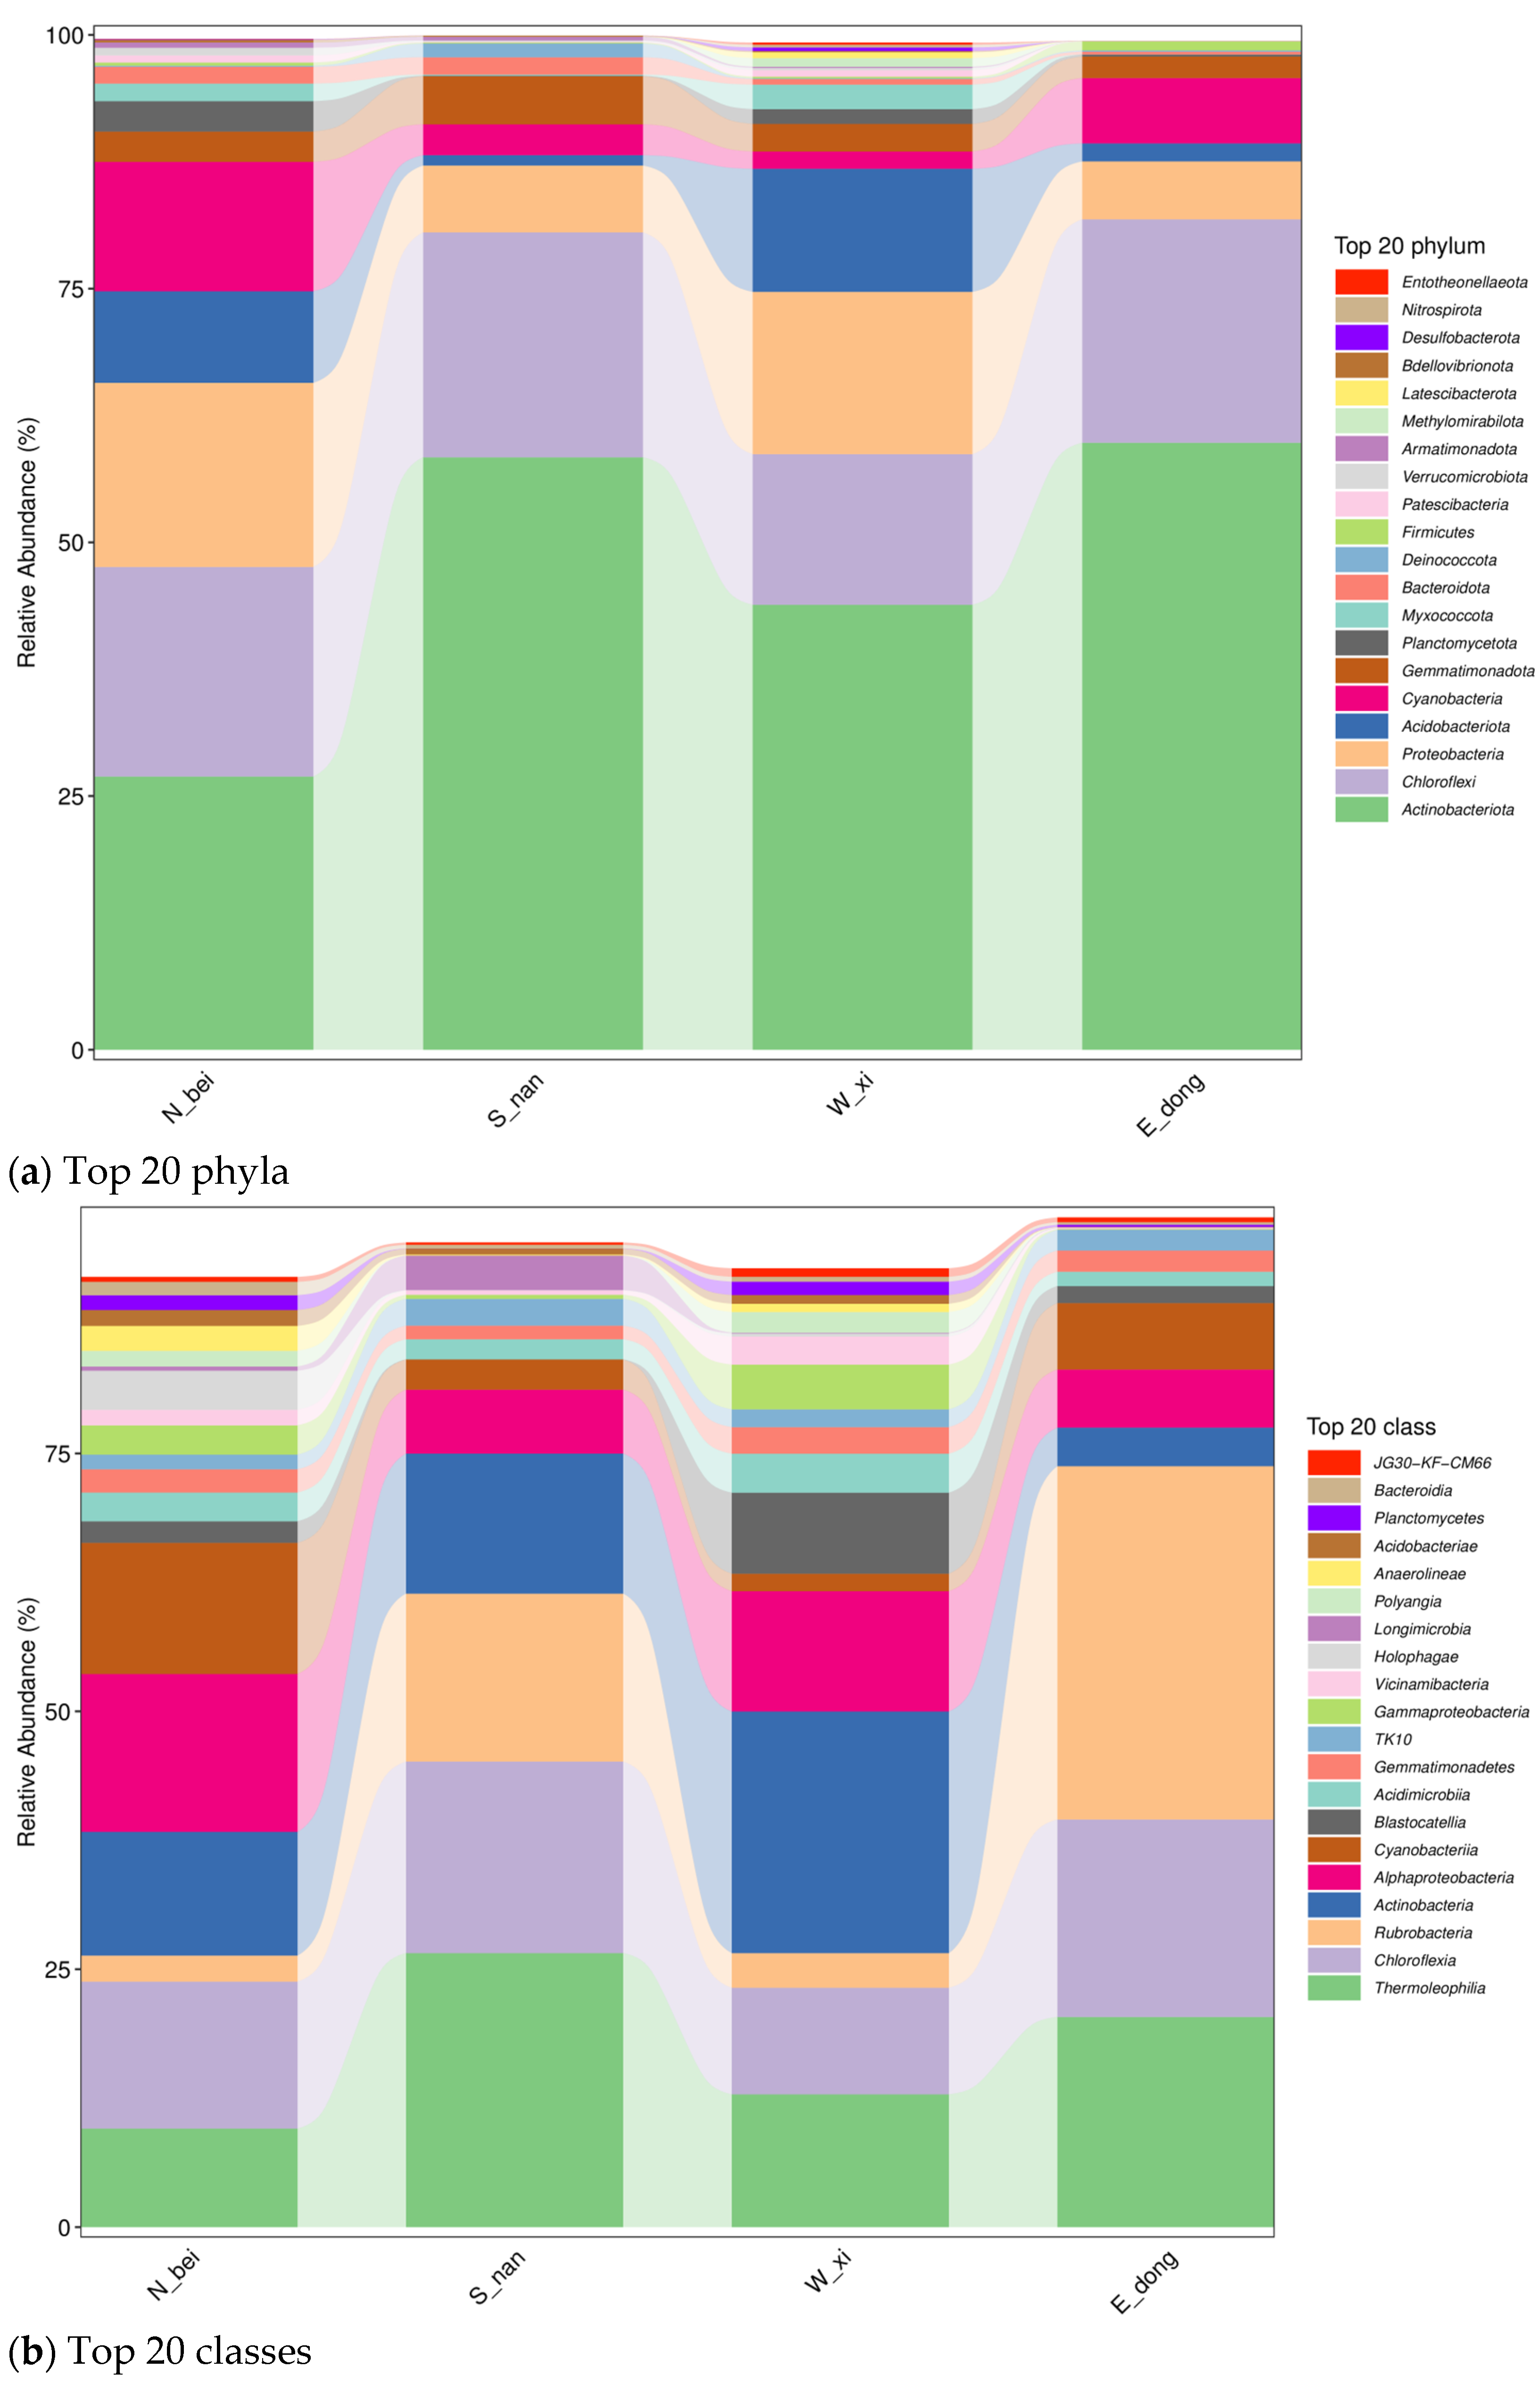
Figure 9 shows the relative abundance of microbial taxa at different classification levels across samples from the four wall orientations. Distinct compositional patterns were observed among the samples. The south-facing wall (S_nan) was dominated by Firmicutes and Actinobacteria, reflecting higher tolerance to heat and desiccation, while the north-facing wall (N_bei) had higher proportions of Proteobacteria and Bacteroidetes, indicating adaptation to cooler and more humid microenvironments. The east (E_dong) and west (W_xi) walls displayed intermediate compositions with a balanced distribution of these phyla. These findings demonstrate that wall orientation and associated environmental factors significantly shape the microbial community structure on rammed earth surfaces.
Figure 9a shows the analysis results of the relative abundance of the top 20 microbial phylum levels in the four rammed earth samples obtained from the north (sample N_bei), south (sample S_nan), west (sample W_xi), and east walls (sample E_dong). (1) In the north wall (sample N_bei), microbial phyla richness is high, and the dominant phyla are scattered.
Firmicutes (pink in
Figure 9a),
Bacteroidota (red in
Figure 9a), and
Proteobacteria (light orange in
Figure 9a) all have a certain proportion, reflecting the community characteristics of multiple microbial phyla coexisting under the low-light and high-humidity environment of the north wall. (2) In the south wall (sample S_nan), the community structure is “dominated by a few phyla”.
Actinobacteriota (green in
Figure 9a),
Proteobacteria (light orange in
Figure 9a), and
Bacteroidota (red in
Figure 9a) comprise a high proportion, suggesting that the strong sunlight and high-temperature environment of the south wall selectively favors these adaptive phyla, which have become dominant. (3) As for the west wall (sample W_xi), the abundance of dominant phyla fluctuates violently; for example, the proportions of
Proteobacteria (light orange in
Figure 9a),
Actinobacteriota (green in
Figure 9a), and
Bacteroidota (red in
Figure 9a) change dramatically, indicating that the west wall’s microbial community may be strongly influenced by environmental pressures such as strong winds and salt deposition. (4) In the east wall (sample E_dong), the microbial community structure is relatively concentrated, with
Actinobacteriota (green in
Figure 9a),
Proteobacteria (light orange in
Figure 9a), and
Bacteroidota (red in
Figure 9a) as the dominant phyla. This reflects the adaptive succession of the microbial community under the moderate light and humidity gradient conditions of the east wall.
Figure 9b presents the relative abundance of the top 20 classes. (1) North Wall (Sample N_bei): The microbial community is rich, and the dominant communities are scattered. The
JG30-KF-CM66 (red in
Figure 9b),
Bacteroidia (purple in
Figure 9b),
Planctomycetes (brown in
Figure 9b), and other communities all have certain proportions, reflecting the community characteristics of multiple microorganisms coexisting under the low-light and high-humidity environment of the north wall. Although
Planctomycetes and other taxa are low in abundance but widespread, they may participate in nutrient cycling (such as nitrogen and carbon transformation) and support the basic ecological processes of the community. (2) South Wall (Sample S_nan): The community structure presents a “dominant minority” model.
Actinobacteria (dark blue in
Figure 9b),
Chloroflexia (light orange in
Figure 9b), and
Thermoleophilia (green in
Figure 9b) comprise high proportions, suggesting that the strong sunlight and high-temperature environment of the south wall have a screening effect on microorganisms, and adaptive communities have become dominant. These microorganisms may be involved in the metabolism of soil cementing substances and potentially contribute to the structural stability of rammed earth structures; their high abundance may be related to the demand for organic matter decomposition in the high-temperature environment of the south wall. (3) West Wall (Sample W_xi): The abundance of dominant communities fluctuates dramatically. The proportions of
Vicinamibacteria (pink in
Figure 9b) and
Gammaproteobacteria (light green in
Figure 9b) change dramatically, reflecting the strong impact of environmental pressures, such as strong winds and salt deposition, on the microbial community. (4) East Wall (Sample E_dong): The community structure is relatively concentrated.
Longimicrobia (light purple in
Figure 9b),
Holophagae (light pink in
Figure 9b), and
Cyanobacteria (dark pink in
Figure 9b) are the main dominant groups, reflecting the adaptive succession of the microbial community under the moderate light and humidity gradient environment of the east wall.
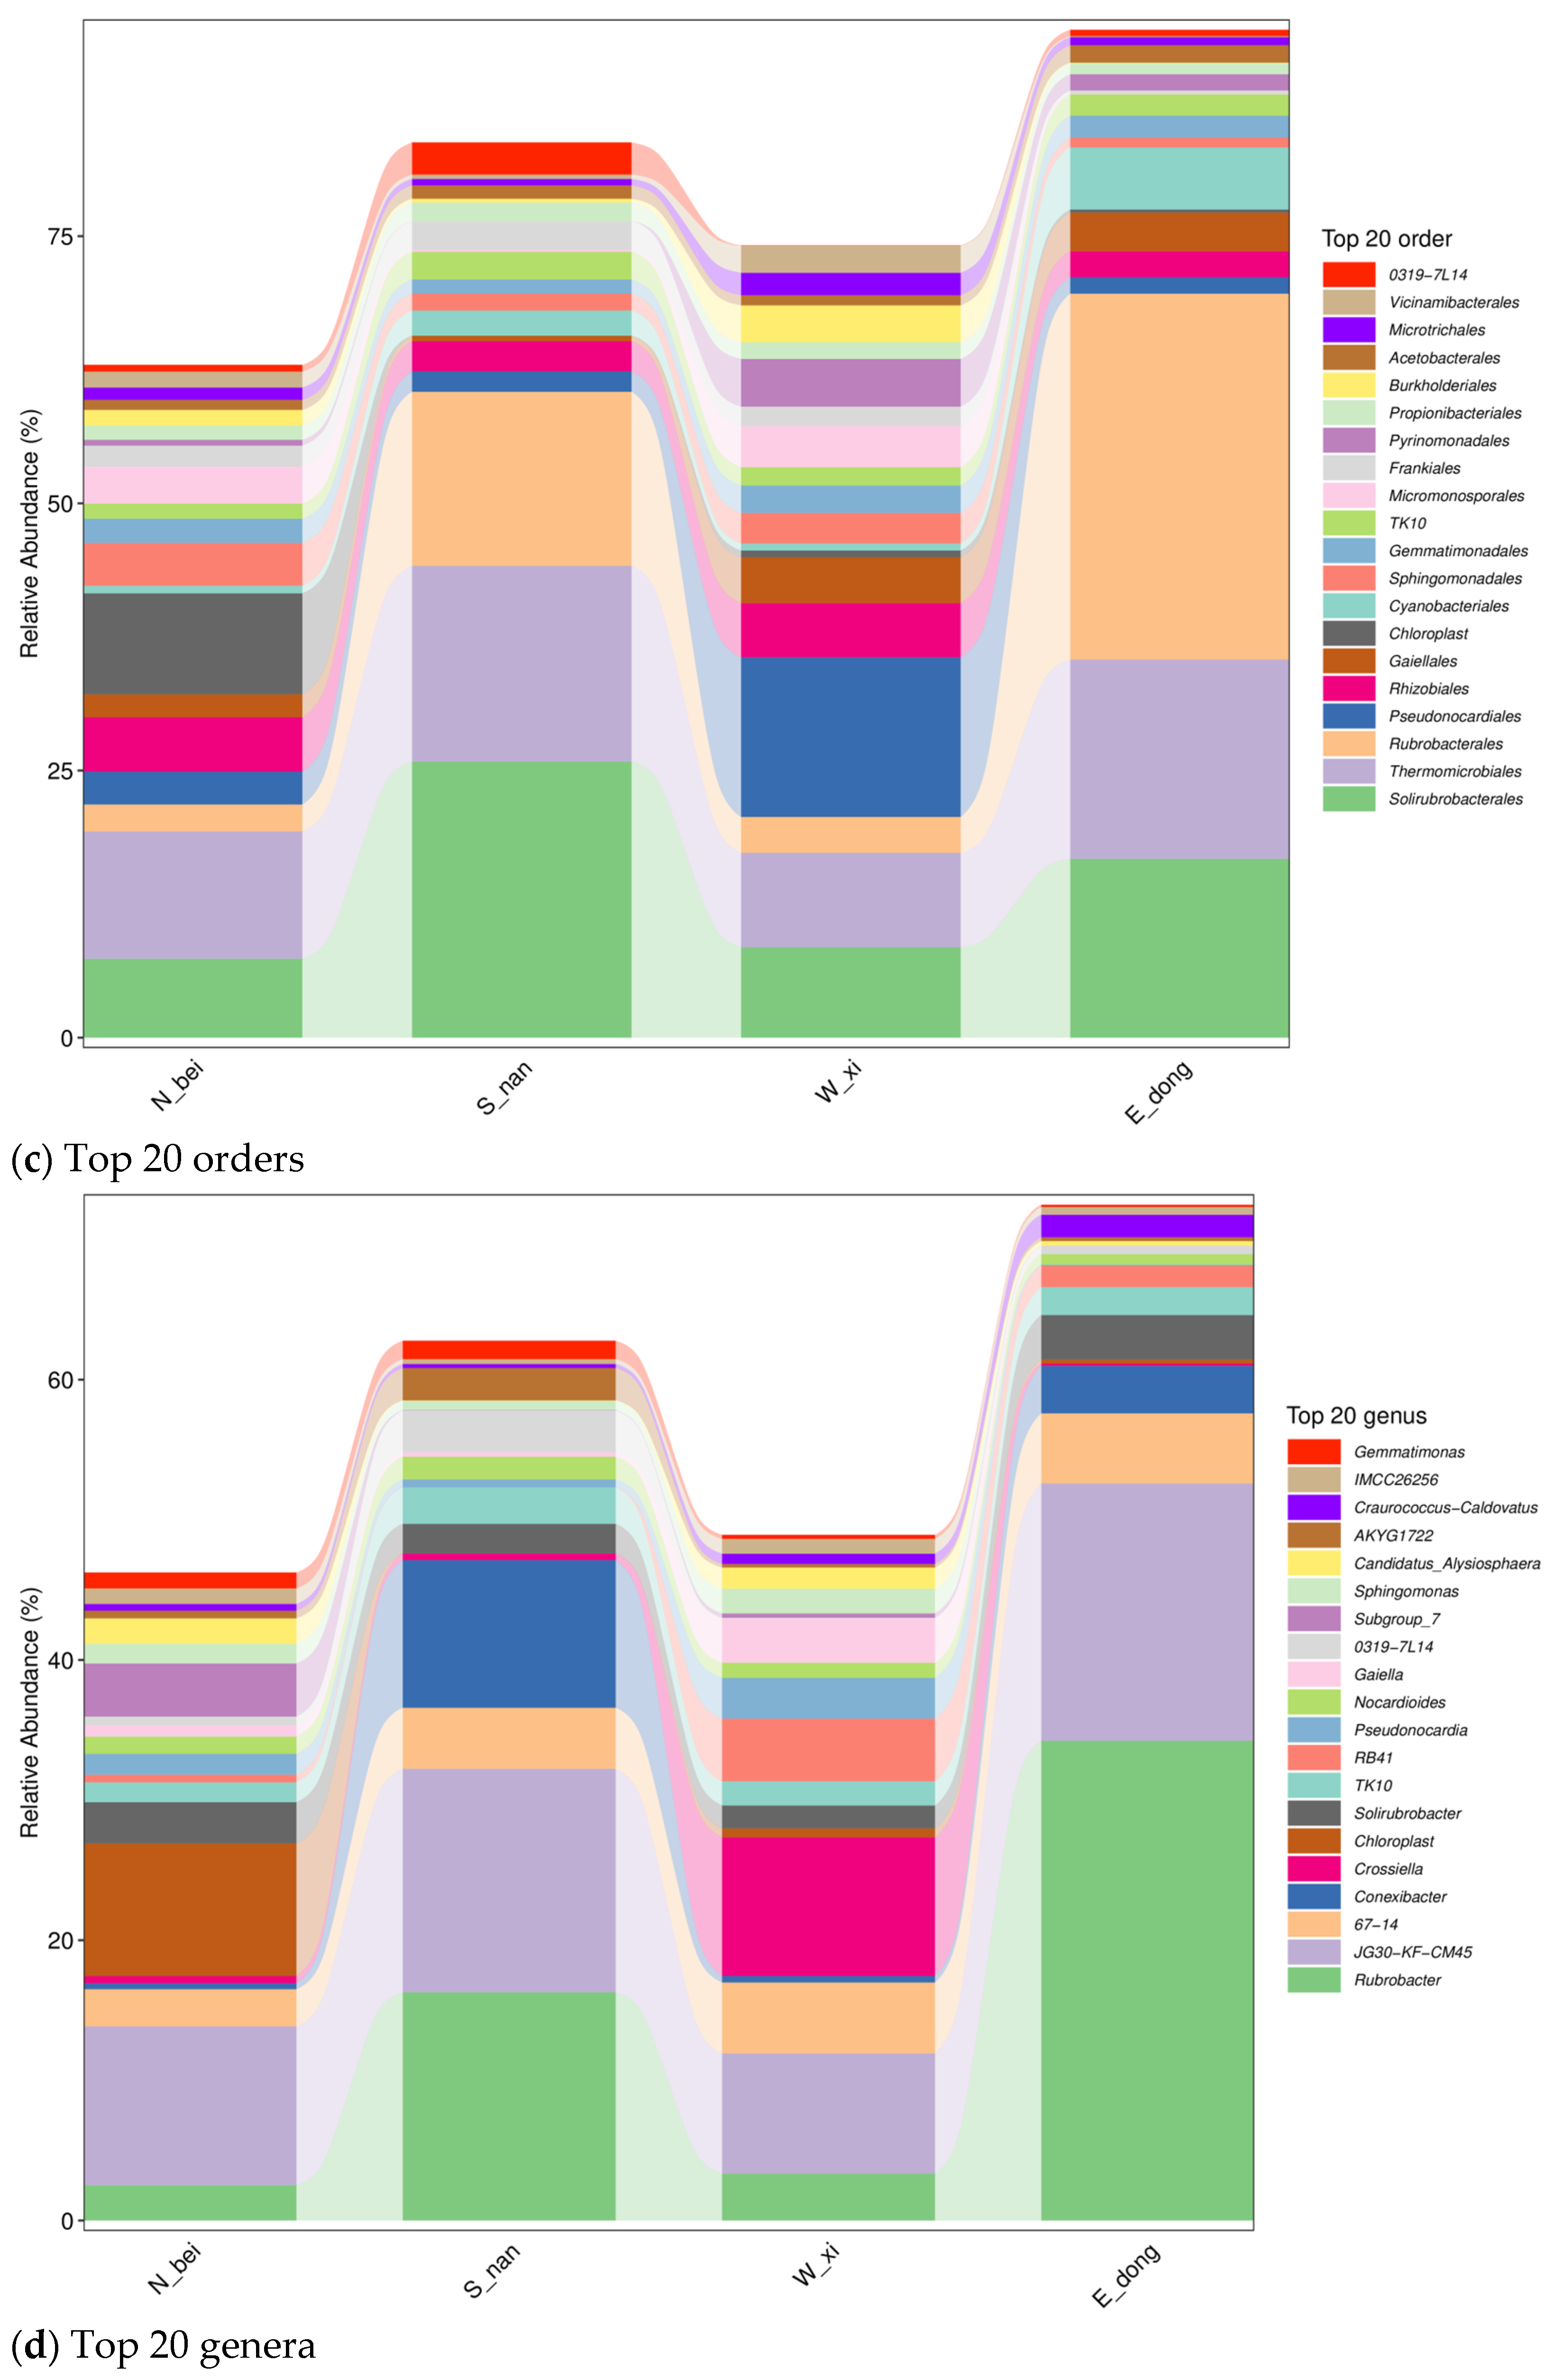
Figure 9c shows the relative abundance distribution of the top 20 microbial groups (order level). Overall, the four sample groups have certain commonalities; for example, some dominant orders (such as
Solirubrobacterales) are distributed in multiple groups.
Figure 9d shows the relative abundance distribution of the top 20 microbial groups (genus level) in the rammed earth samples at four locations. It can be further observed that all four groups of samples show the diversity of microbial genera, and there is a certain overlap in the dominant genera (
Rubrobacter,
Subgroup_7, etc., are dominant in multiple groups), reflecting the common selection of some adaptive microbial genera in different rammed earth microenvironments. However, there are also certain differences between them, such as the fluctuation in distribution patterns and the abundance of dominant genera: The north wall (sample N_bei) exhibits high genus richness and dispersed dominance, reflecting a multi-coexistence feature; the south wall (sample S_nan) is dominated by a few genera (
Rubrobacter,
Pseudonocardia, etc.) and has concentrated dominance; the abundance of dominant genera (
Crossiella,
RB41, etc.) on the west wall (sample W_xi) fluctuates dramatically and is significantly affected by environmental disturbances; the dominant genera (
Rubrobacter,
Gaiella, etc.) on the east wall (sample E_dong) comprise a high proportion and exhibit stable structures, reflecting the results of adaptive succession. These similarities and differences are due to variations in directional microenvironments (light, humidity, salinity, etc.): low light and high humidity on the north wall promote dispersed coexistence; strong sunlight and high temperatures on the south wall select dominant genera; strong winds and salt disturbances on the west wall cause fluctuations in microbial abundance; and the mild, gradual environmental conditions on the east wall drive stable succession. Together, these shape the spatial differentiation patterns observed at the microbial genus level.
Figure 9d displays the top 20 microbial genera in the four wall samples. All samples exhibited high genus-level diversity, with partial overlap in dominant taxa (e.g., Rubrobacter, Subgroup_7). Labels such as Subgroup_7 and TK10 represent placeholder names automatically assigned by the SILVA 138 database to sequences that could not be confidently classified at the genus level (classification confidence ≥ 0.8). These names were retained to preserve community structure visualization but should be interpreted as “unclassified or provisional groups” and not as established genera. The north wall (N_bei) exhibited high genus richness and dispersed dominance, indicating the coexistence of multiple microbial lineages. The south wall (S_nan) was dominated by a few genera (e.g.,
Rubrobacter,
Pseudonocardia), displaying the strong selective effects of heat and light. The west wall (W_xi) exhibited sharp fluctuations in dominant genera (e.g., Crossiella, RB41), reflecting environmental disturbance, while the east wall (E_dong) was dominated by
Rubrobacter and
Gaiella, with a stable structure suggesting adaptive succession. Together, these spatial differences demonstrate that microenvironmental factors—light exposure, humidity, and salinity—strongly influence microbial community compositions and stability at the genus level.
3.3.3. Species Classification Tree
The species classification hierarchy tree presents the phylogenetic relationship and inter-group distribution characteristics of the microbial groups of the four rammed earth samples. The pie charts (threshold 0.5%) at each branch node of the taxonomic hierarchy tree show the composition ratio of the taxonomic unit in each sample/group.
Figure 10 shows the phylogenetic tree of the dominant microbial genera detected in rammed earth samples from the four wall orientations. The sector size represents the relative abundance of each taxonomic unit in the corresponding sample or group, and the sector colors indicate the sampling sites (north, south, west, and east walls). As shown in the figure, several genera, such as
Crossiella and
Rubrobacter, appear on multiple colored branches, indicating cross-clustering among different wall orientations and suggesting shared community components. In contrast, branches dominated by a single color correspond to site-specific taxa that are unique to particular environments—such as the north or east wall—and these are likely influenced by local microclimatic factors (light, humidity, and salinity). Overall, the phylogenetic distribution illustrates both the overlap and differentiation of microbial communities among wall orientations, highlighting the spatial heterogeneity of the microbial assemblages on the rammed earth surfaces.
3.3.4. GraPhlAn Evolutionary Tree
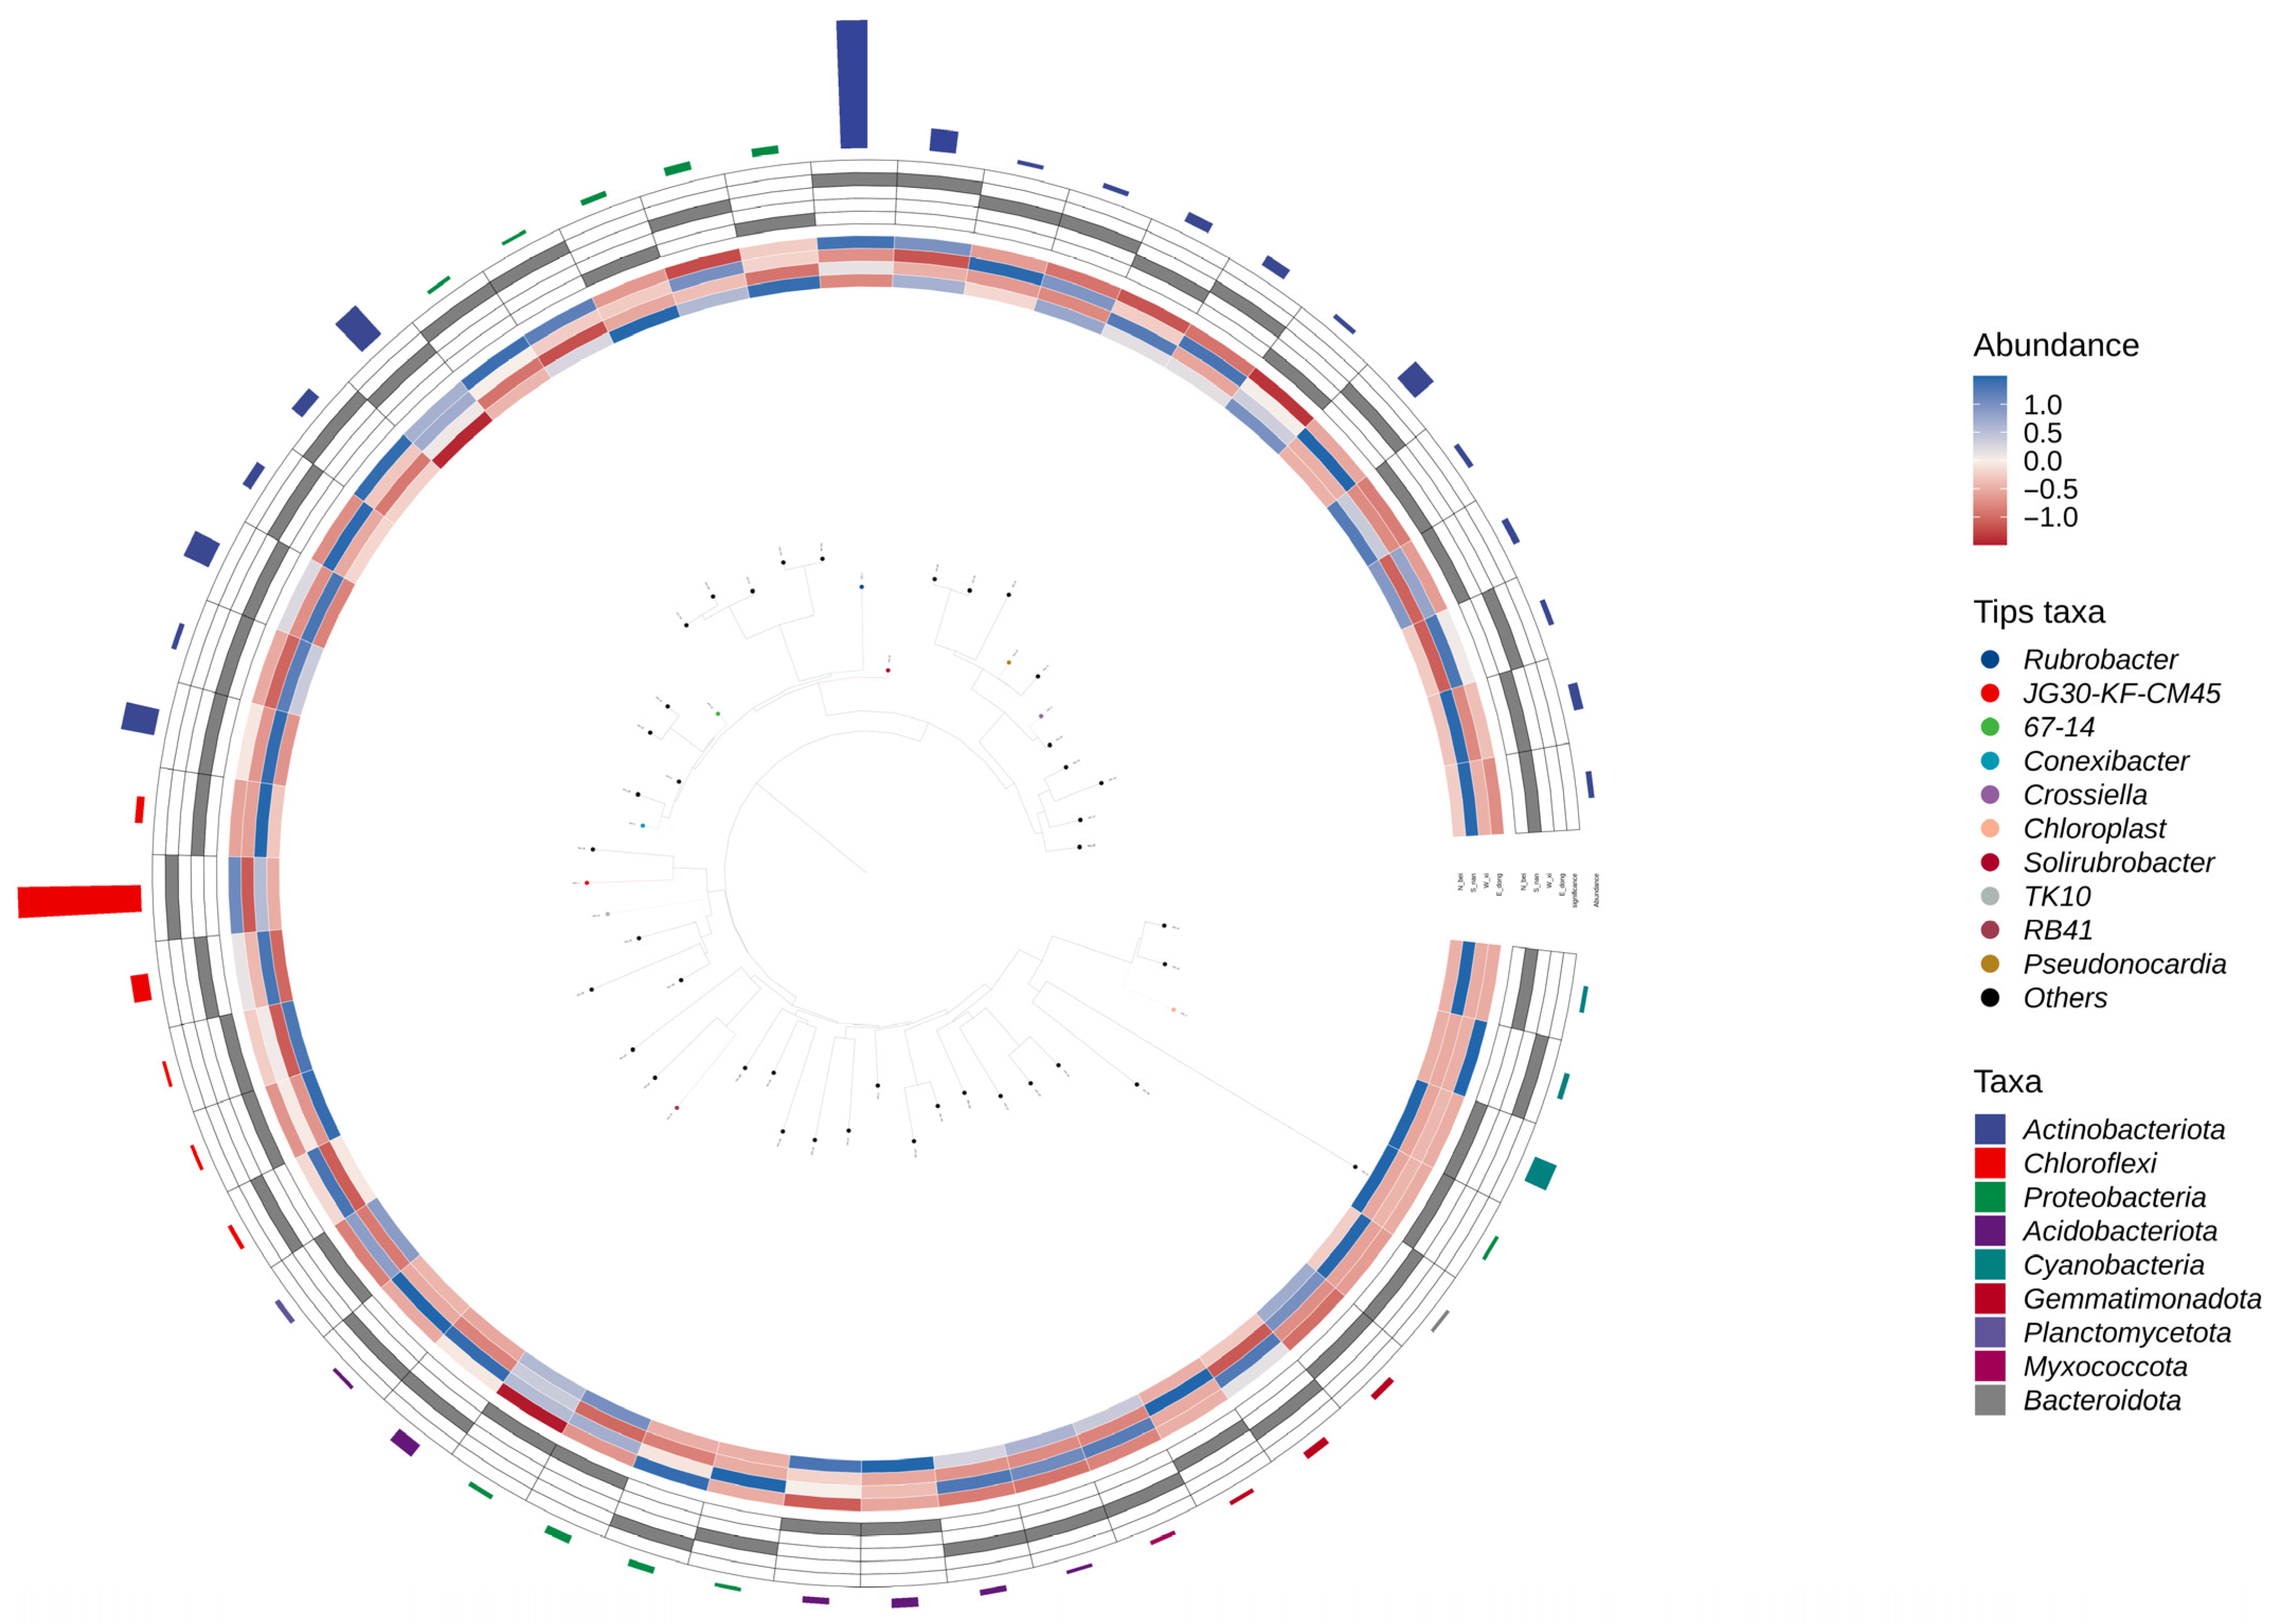
Figure 11 displays the circular GraPhlAn evolutionary tree, which integrates both the phylogenetic relationships and relative abundance of microbial taxa within the rammed earth community. Unlike
Figure 10—which emphasizes the spatial clustering and overlap of microbial genera among different wall orientations—
Figure 11 focuses on the hierarchical organization of taxa within the overall microbial community. In the GraPhlAn tree, the outer colored rings correspond to genus-level groups (e.g.,
Rubrobacter, JG30-KF-CM45), and the color gradient indicates relative abundance (blue for higher abundance and red for lower abundance). The inner rings represent higher taxonomic ranks (e.g.,
Actinobacteriota,
Chloroflexi), illustrating their phylogenetic positions and clustering patterns. The figure shows that dominant phyla such as
Actinobacteriota contain highly abundant genera such as
Rubrobacter, while certain taxa (e.g.,
Solirubrobacter) display abundance differentiation along evolutionary branches, likely influenced by local environmental conditions such as light and humidity.
3.4. Alpha Diversity Analysis
Alpha diversity refers to the richness, diversity, and evenness of species in a locally uniform habitat, and it is also known as within-habitat diversity [
30].
Table 5 shows the microbial diversity index of the bacterial community.
The analysis results show that the species richness-related indicators have the following characteristics: (1) Chao1 index: This index is used to estimate the total number of species in the community. The Chao1 index is highest in the west (W_xi) (4469.27), followed by the north (N_bei) (3139.7), the east (E_dong) (1404.39), and the south (S_nan) (1315.24). This indicates that the species richness of the west rammed earth wall’s microbial community is the highest, and the north wall also exhibits relatively high richness, while the east and south walls demonstrate relatively low richness. (2) Observed_species: The number of observed species in the west (4407.1) and north (3099.4) walls is substantially higher than that in the east (1403.2) and south (1287.7) walls, which is consistent with the Chao1 index trend, further indicating that the species richness of the west and north walls’ microbial community is higher.
Secondly, from the perspective of indicators related to diversity and evenness, there are also three significant characteristics: (1) The Shannon index reflects the diversity of the community, showing the following trend: west (10.3129) > north (9.50049) > south (7.73356) > east (7.39641). The highest diversity was observed in the west wall, and the lowest was observed in the east. (2) For the Simpson index, a value closer to 1 indicates higher community diversity; the analysis indicated west (0.994199) > north (0.989159) > south (0.981772) > east (0.958144). This trend is consistent with the Shannon index. (3) The Pielou_e index reflects the evenness of species in the community: west (0.851907) > north (0.819165) > south (0.748609) > east (0.707485). The most even distribution of bacterial species was observed in the west wall, and the lowest evenness was observed in the east.
The results of phylogenetic diversity and sequencing coverage analysis also revealed two significant characteristics. (1) Faith_pd represents phylogenetic diversity. The west (189.049) and north (171.202) values are much higher than the east (66.0369) and south (80.7529), indicating that the microbial communities on the west and north rammed earth walls are more diverse in terms of evolutionary relationships. (2) Goods_coverage: This index is close to 1 for all samples (all above 0.995), indicating that the sequencing depth is sufficient, which can more comprehensively reflect the diversity of microbial communities, and data reliability is high.
In summary, the microbial communities of the west and north rammed earth walls of Paishan Village’s residential buildings are generally superior to those of the east and south walls in terms of species richness, diversity, uniformity, and phylogenetic diversity; the microbial diversity of the microbial communities of the east and south rammed earth walls is relatively low.
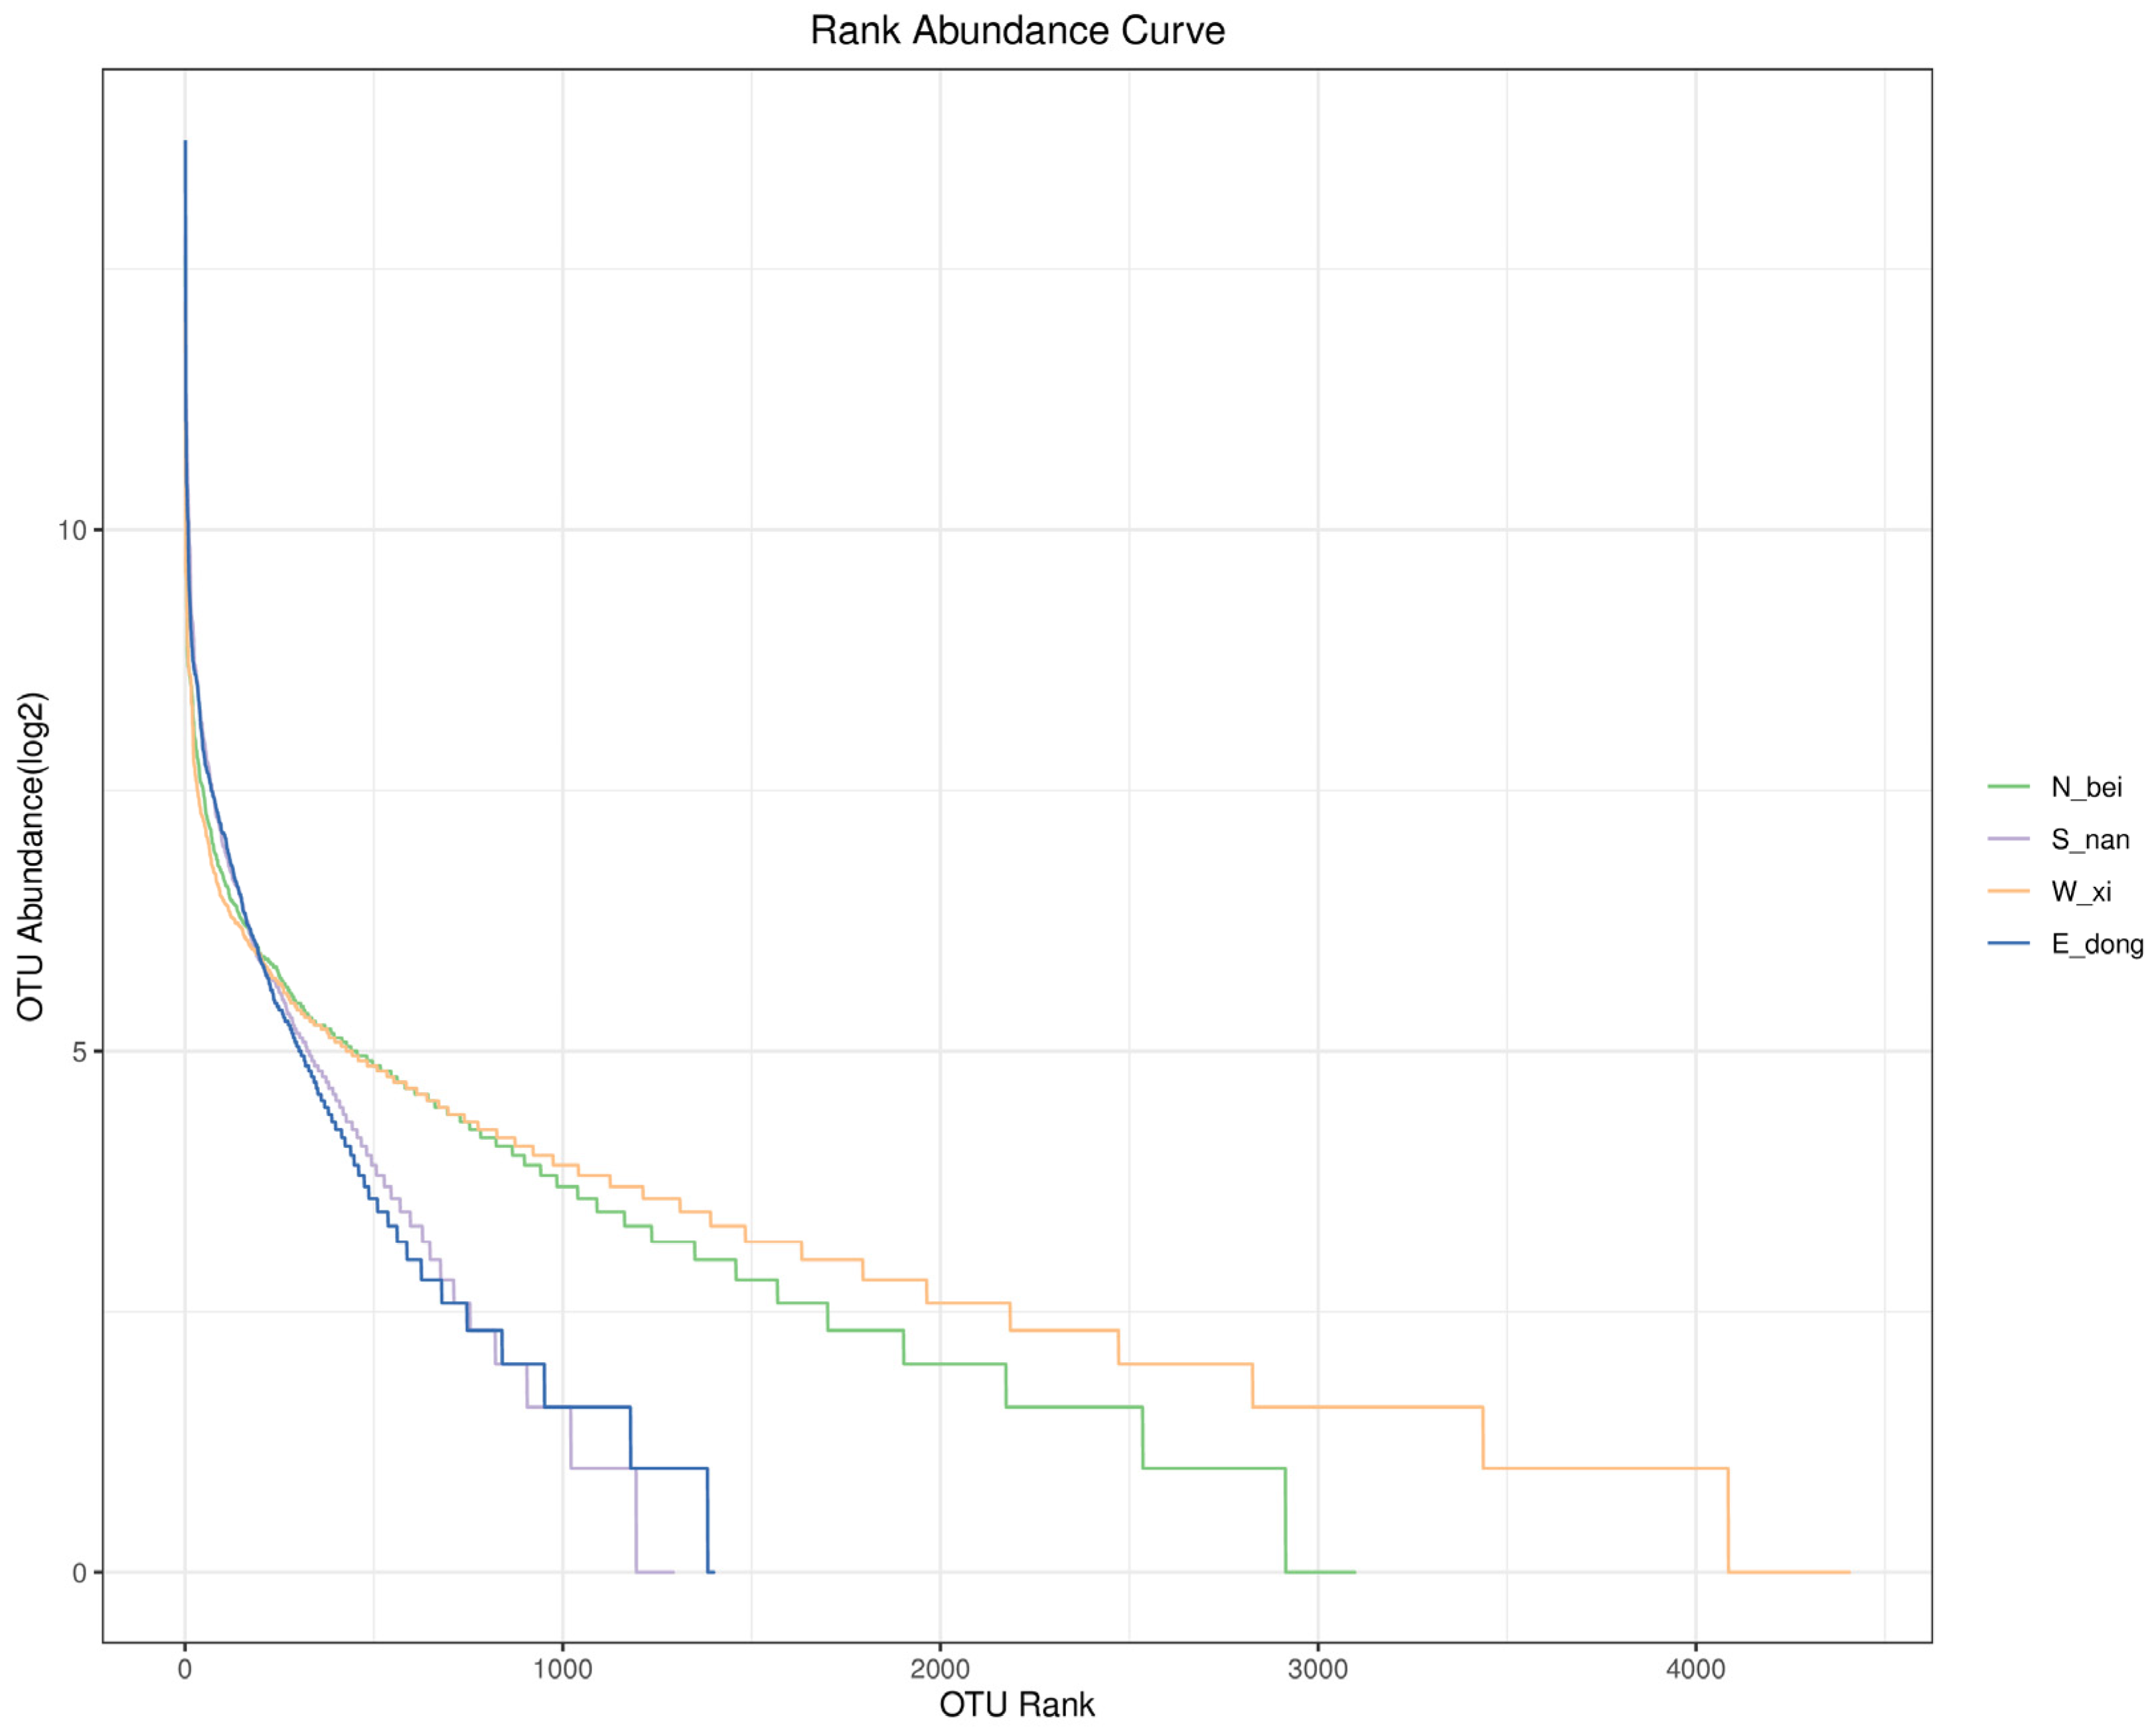
From the rank abundance curve in
Figure 12, the bacterial community structure of the rammed earth walls in different directions of Zhuhai Paishan Village shows the following characteristics: (1) The broken lines corresponding to the west (W_xi) and north (N_bei) extend longer on the horizontal axis (the broken line in the west extends to an OTU rank of about 4000, and the broken line in the north extends to an OTU rank of about 3000), indicating that the bacterial communities of the walls in these two directions contain more ASVs/OTUs and higher species richness. (2) The broken lines corresponding to the east (E_dong) and south (S_nan) walls extend less along the horizontal axis (with the east ending at an OTU rank of more than 1000 and the south even shorter), indicating that the bacterial communities have fewer ASVs/OTUs and relatively lower species richness. This is consistent with the conclusion that species are richer in the west and north walls (based on Chao1, Observed_species, and other indices). However, in terms of community evenness, the curve for the west wall (W_xi) is the flattest, indicating minimal abundance differences among ASVs/OTUs in the rammed earth wall microbiome there and further reflecting the most even community composition.
The curve for the north (N_bei) wall is the second flattest, also indicating high evenness, although it is slightly lower than that of the west wall. The curves for the east (E_dong) and south (S_nan) walls are relatively steep, with the east wall being the steepest. This indicates that the abundance differences among ASVs/OTUs in the rammed earth wall microbiome in these two walls are large, and the community composition is less even, with the east wall exhibiting lower evenness than the south wall.
Overall, the microbial community on the west (W_xi) rammed earth wall exhibited high species richness, low variability in abundance among species, and high uniformity. The north (N_bei) microbial community also exhibited high species richness and good uniformity but was slightly lower than the west. The east (E_dong) and south (S_nan) microbial communities exhibited low species richness, large variabilities in species abundance, and low uniformity, with the east exhibiting the worst uniformity. These differences may be related to the microenvironmental conditions of the rammed earth walls (such as light, humidity, and material exchange with the surrounding environment), which in turn influenced the microbial community’s structure and diversity.
3.5. Beta Diversity Analysis
The results of the beta diversity index revealed differences among the four rammed earth wall samples.
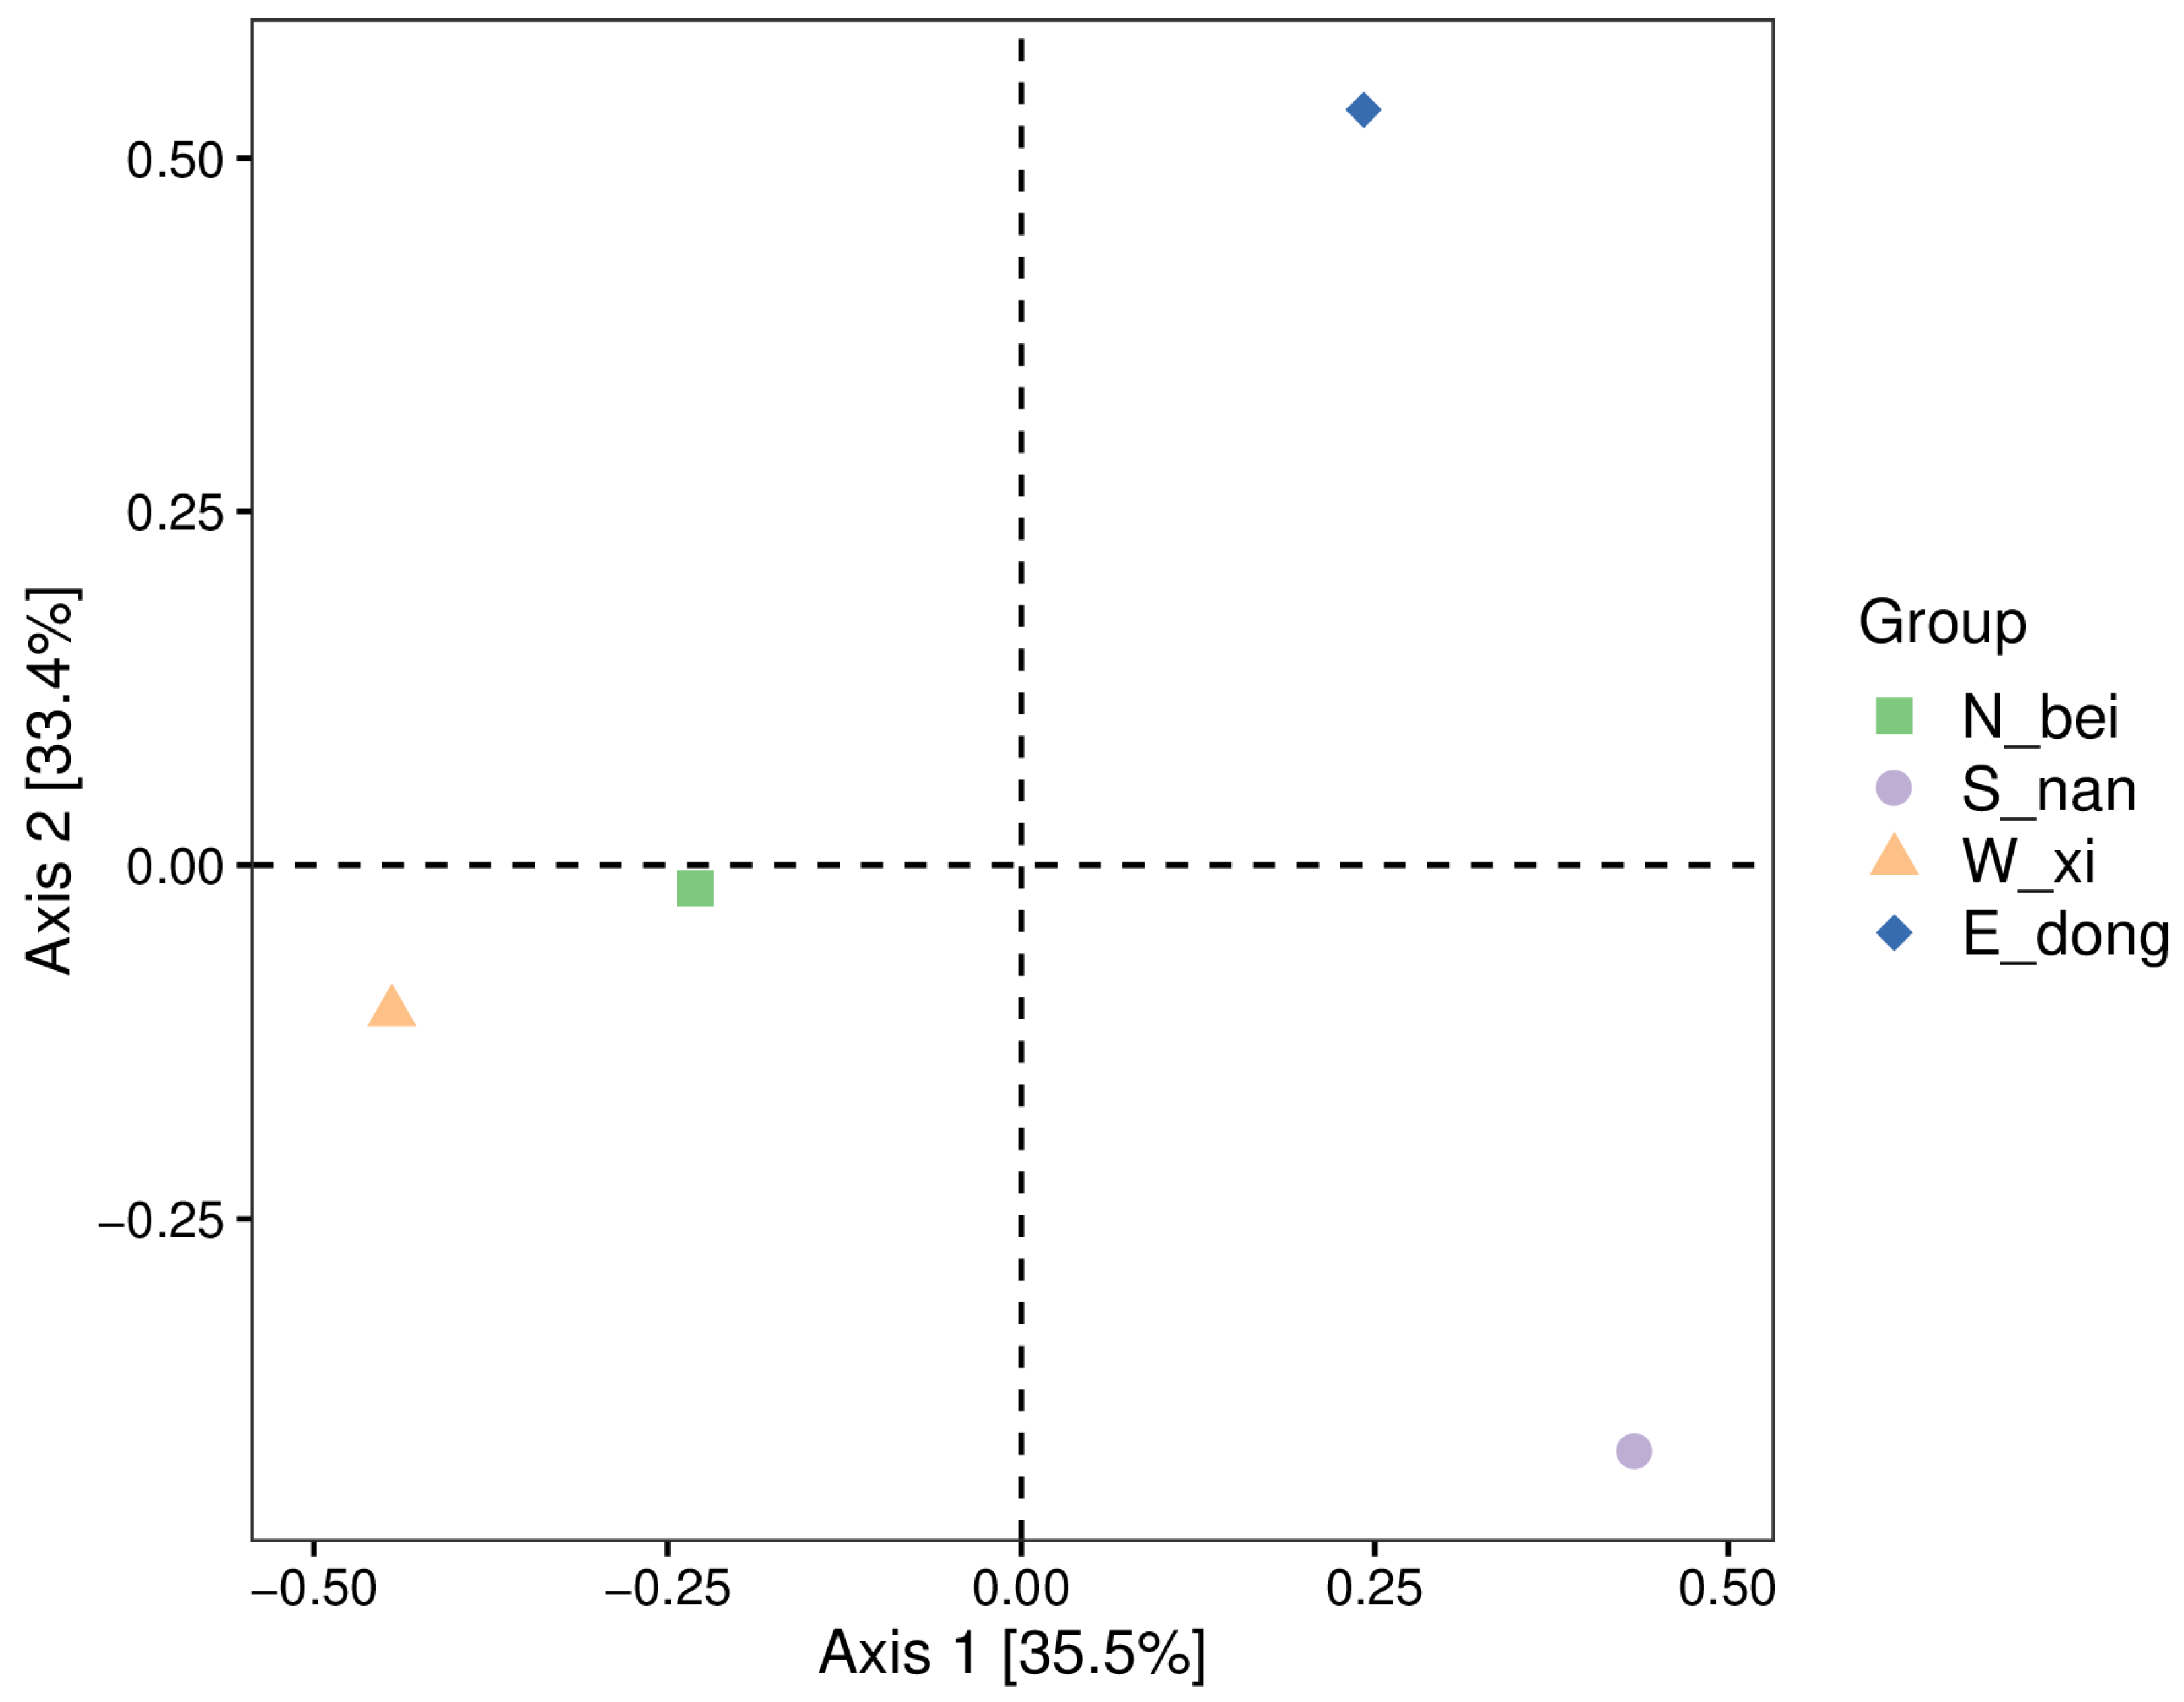
Figure 13 shows a two-dimensional PCoA (principal coordinate analysis) ordination diagram based on Jaccard distance, illustrating the similarities and differences in the composition of bacterial communities.
In the figure, Axis 1 (horizontal axis) explains 35.5% of the variation in community composition, and Axis 2 (vertical axis) explains 33.4% of the variation. The two axes together explain approximately 68.9% of the differences in community composition, reflecting the changes in the composition of the bacterial community to a large extent. Three notable features also emerge in terms of sample distribution and community similarity.
East (E_dong): The sample point (blue diamond) is in the upper right corner of the image, relatively far from the sample points in the other three directions. This indicates that the microbial community composition of the east rammed earth wall is substantially different from that of the other directions, and it is highly unique.
South (S_nan): The sample point (purple dot) is in the lower right corner of the image, and it is also somewhat distant from the sample points in the other directions. This indicates that the microbial community composition of the south rammed earth wall is also unique, differing significantly from the microbial communities in the east, west, and north walls.
West (W_xi): The sample point (orange triangle) is located in the lower left corner of the image.
North (N_bei): The sample point (green square) is located slightly at the center of the left side of the image. The relatively close proximity of the west and north sample points indicates that the microbial community composition of the west and north rammed earth walls is highly similar, and their microbial structures are more similar in terms of species composition.
Overall, the microbial community compositions of the east and south rammed earth walls in Paishan Village, Zhuhai, are highly unique and differ significantly from those in other locations. In contrast, the microbial community compositions of the west and north rammed earth walls are highly similar. This difference in community composition may be related to the varying microenvironments in different locations (such as light, humidity, surrounding vegetation, or human influence), which in turn shape the unique microbial community structures in each location.
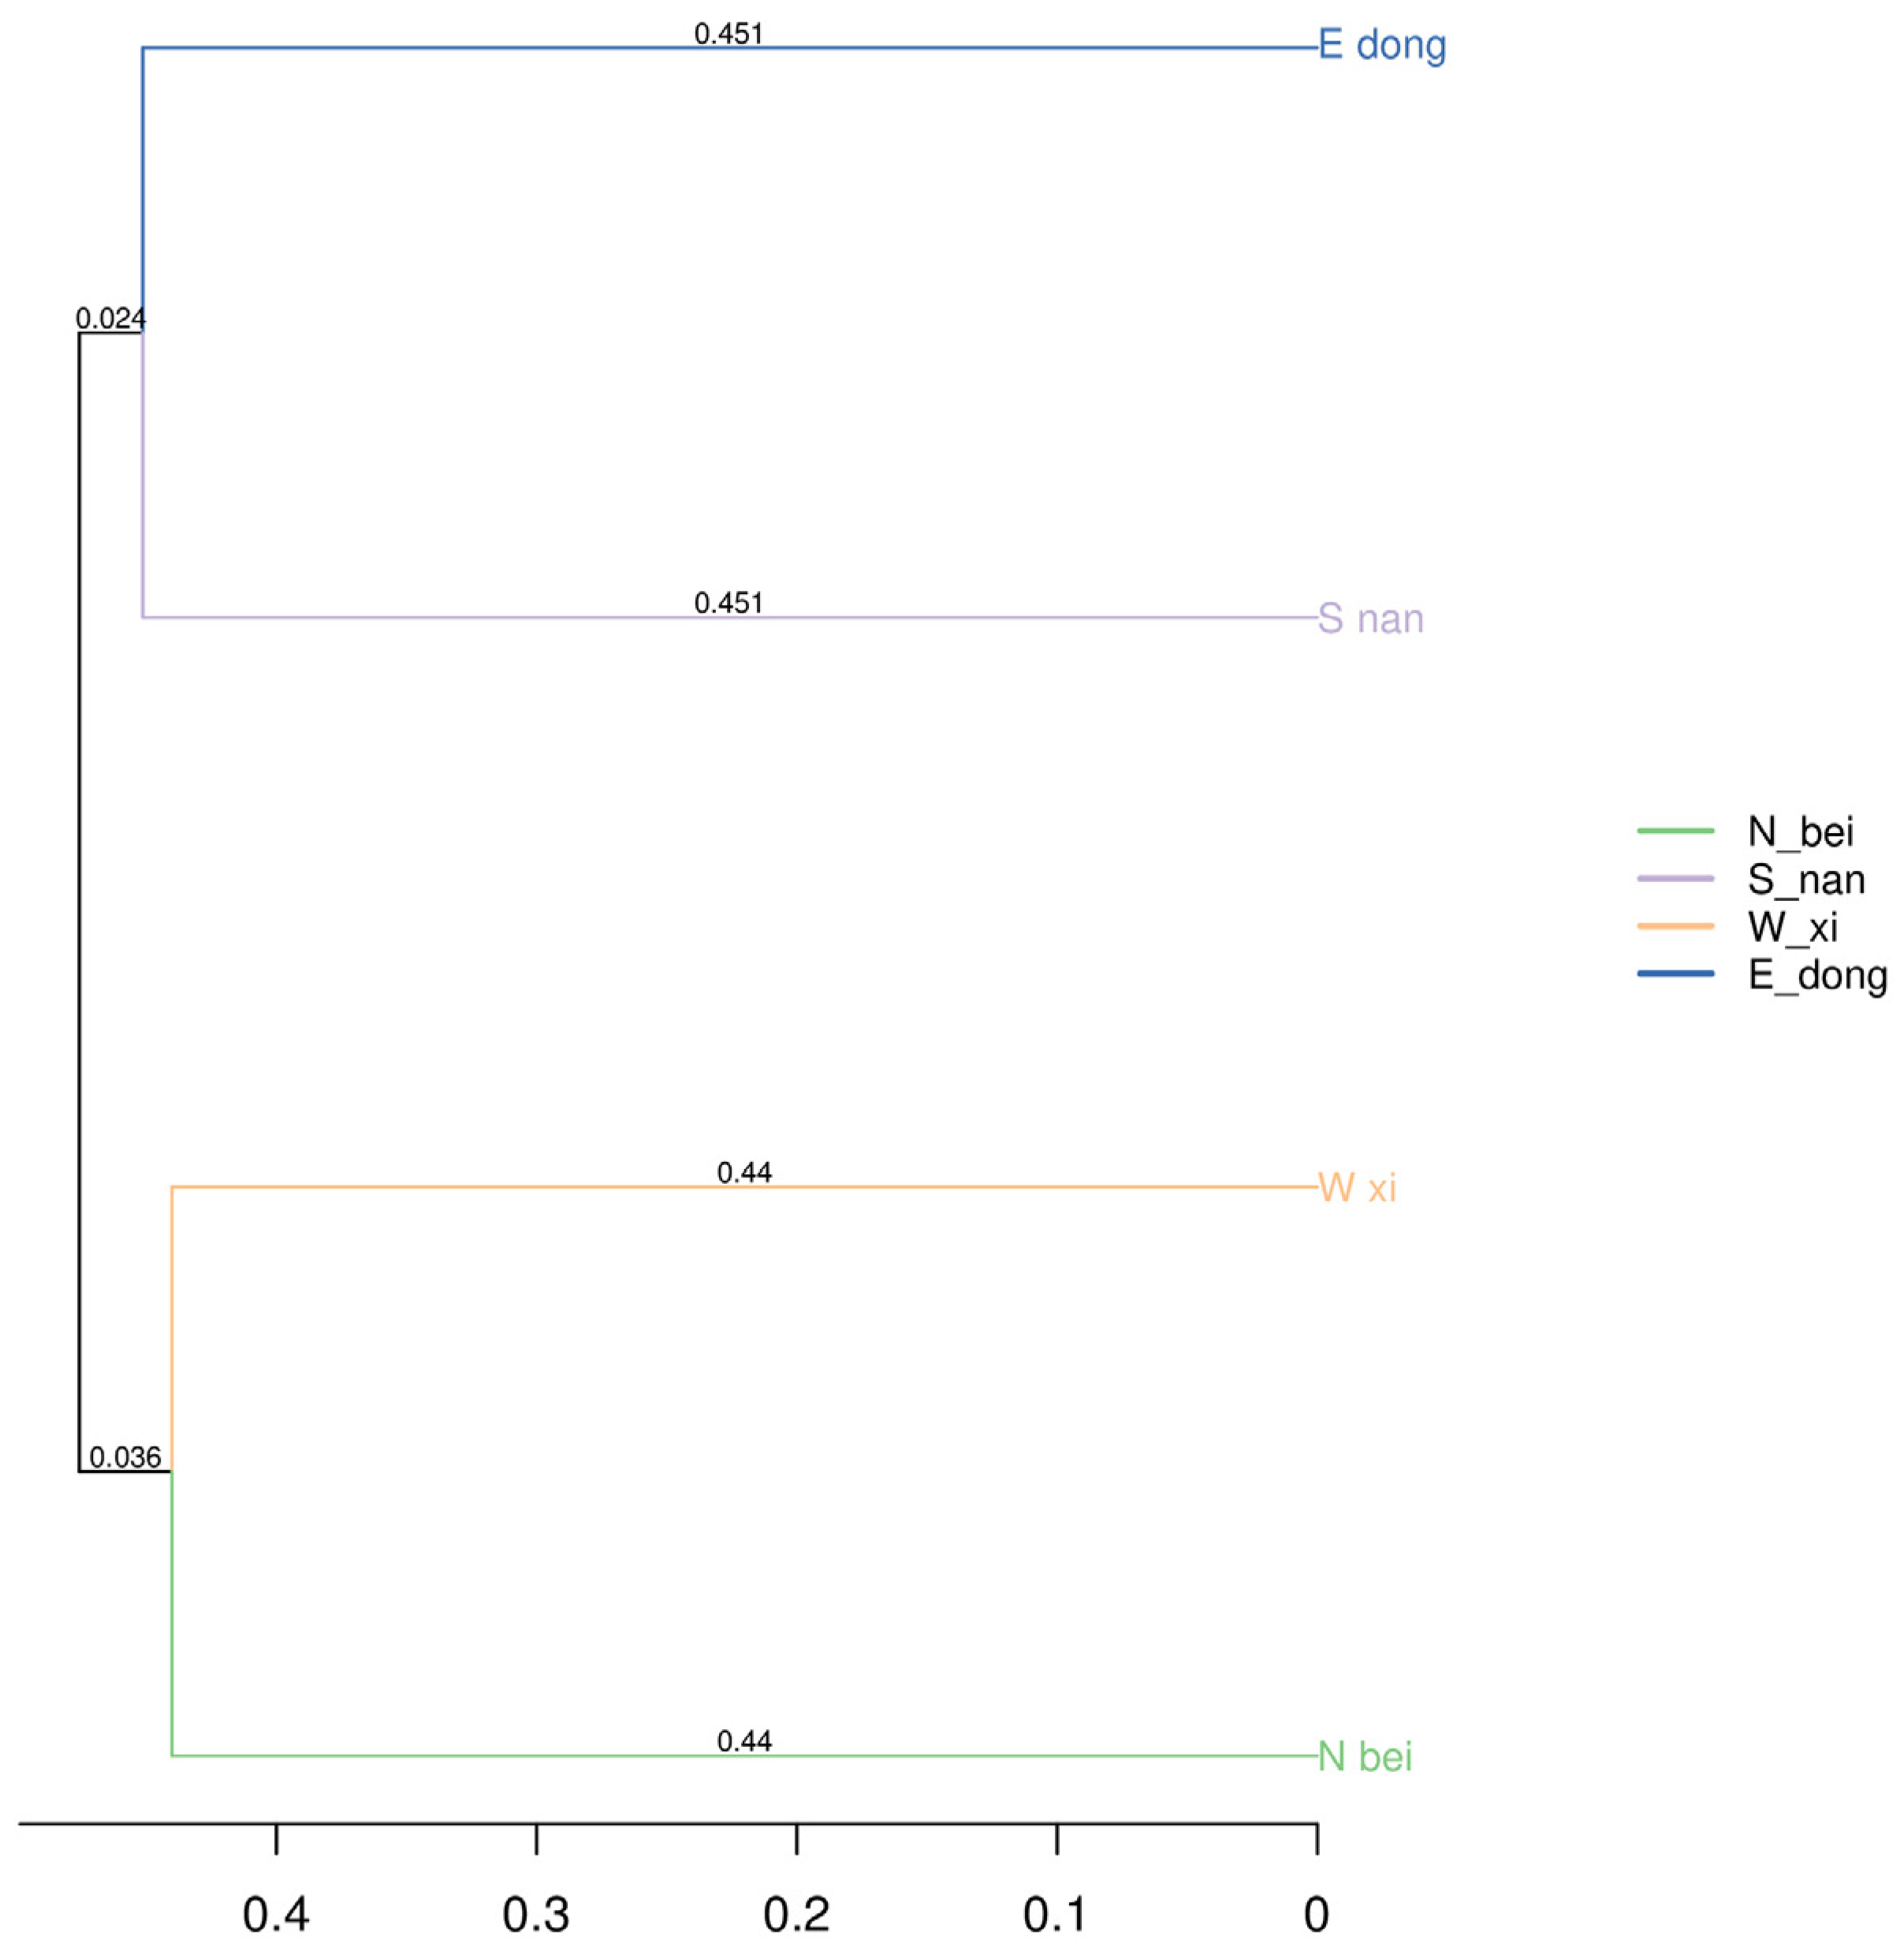
Based on the UPGMA (unweighted group average method) clustering tree of the sample distance matrix (
Figure 14), the microbial communities of the rammed earth walls in different directions in Paishan Village, Zhuhai, exhibited two characteristics with respect to sample clustering and similarity. (1) West (W_xi) and North (N_bei): The branch length of the two was 0.44, which was relatively short among all sample pairs, indicating that the microbial community composition of the rammed earth walls on the west and north sides was highly similar, and they were closer in species composition. (2) East (E_dong) and South (S_nan): The branch length of the two was 0.451, which is classified as a relatively short branch length, indicating that the microbial community composition of the rammed earth walls on the east and south sides also had certain similarities, and the differences in community structure between them were relatively small.
However, there were also differences between groups on different wall surfaces. For example, branch lengths differed between the west (W_xi) and north (N_bei) directions and between the east (E_dong) and south (S_nan) directions (0.44 for the west–north direction and 0.451 for the east–south direction). Additional branch lengths were observed between other pairs, such as between west and east and between north and south. This suggests that the bacterial communities in the west and north directions differed significantly from those in the east and south directions, forming relatively independent clusters.
This clustering result further verified the similarities and differences in the composition of bacterial communities in different directions obtained through PCoA analysis, reflecting that the rammed earth walls in different directions in Paishan Village have shaped the bacterial community structure with certain grouping characteristics due to differences in microenvironments and other factors.
3.6. Species Difference Analysis and Endemic Species
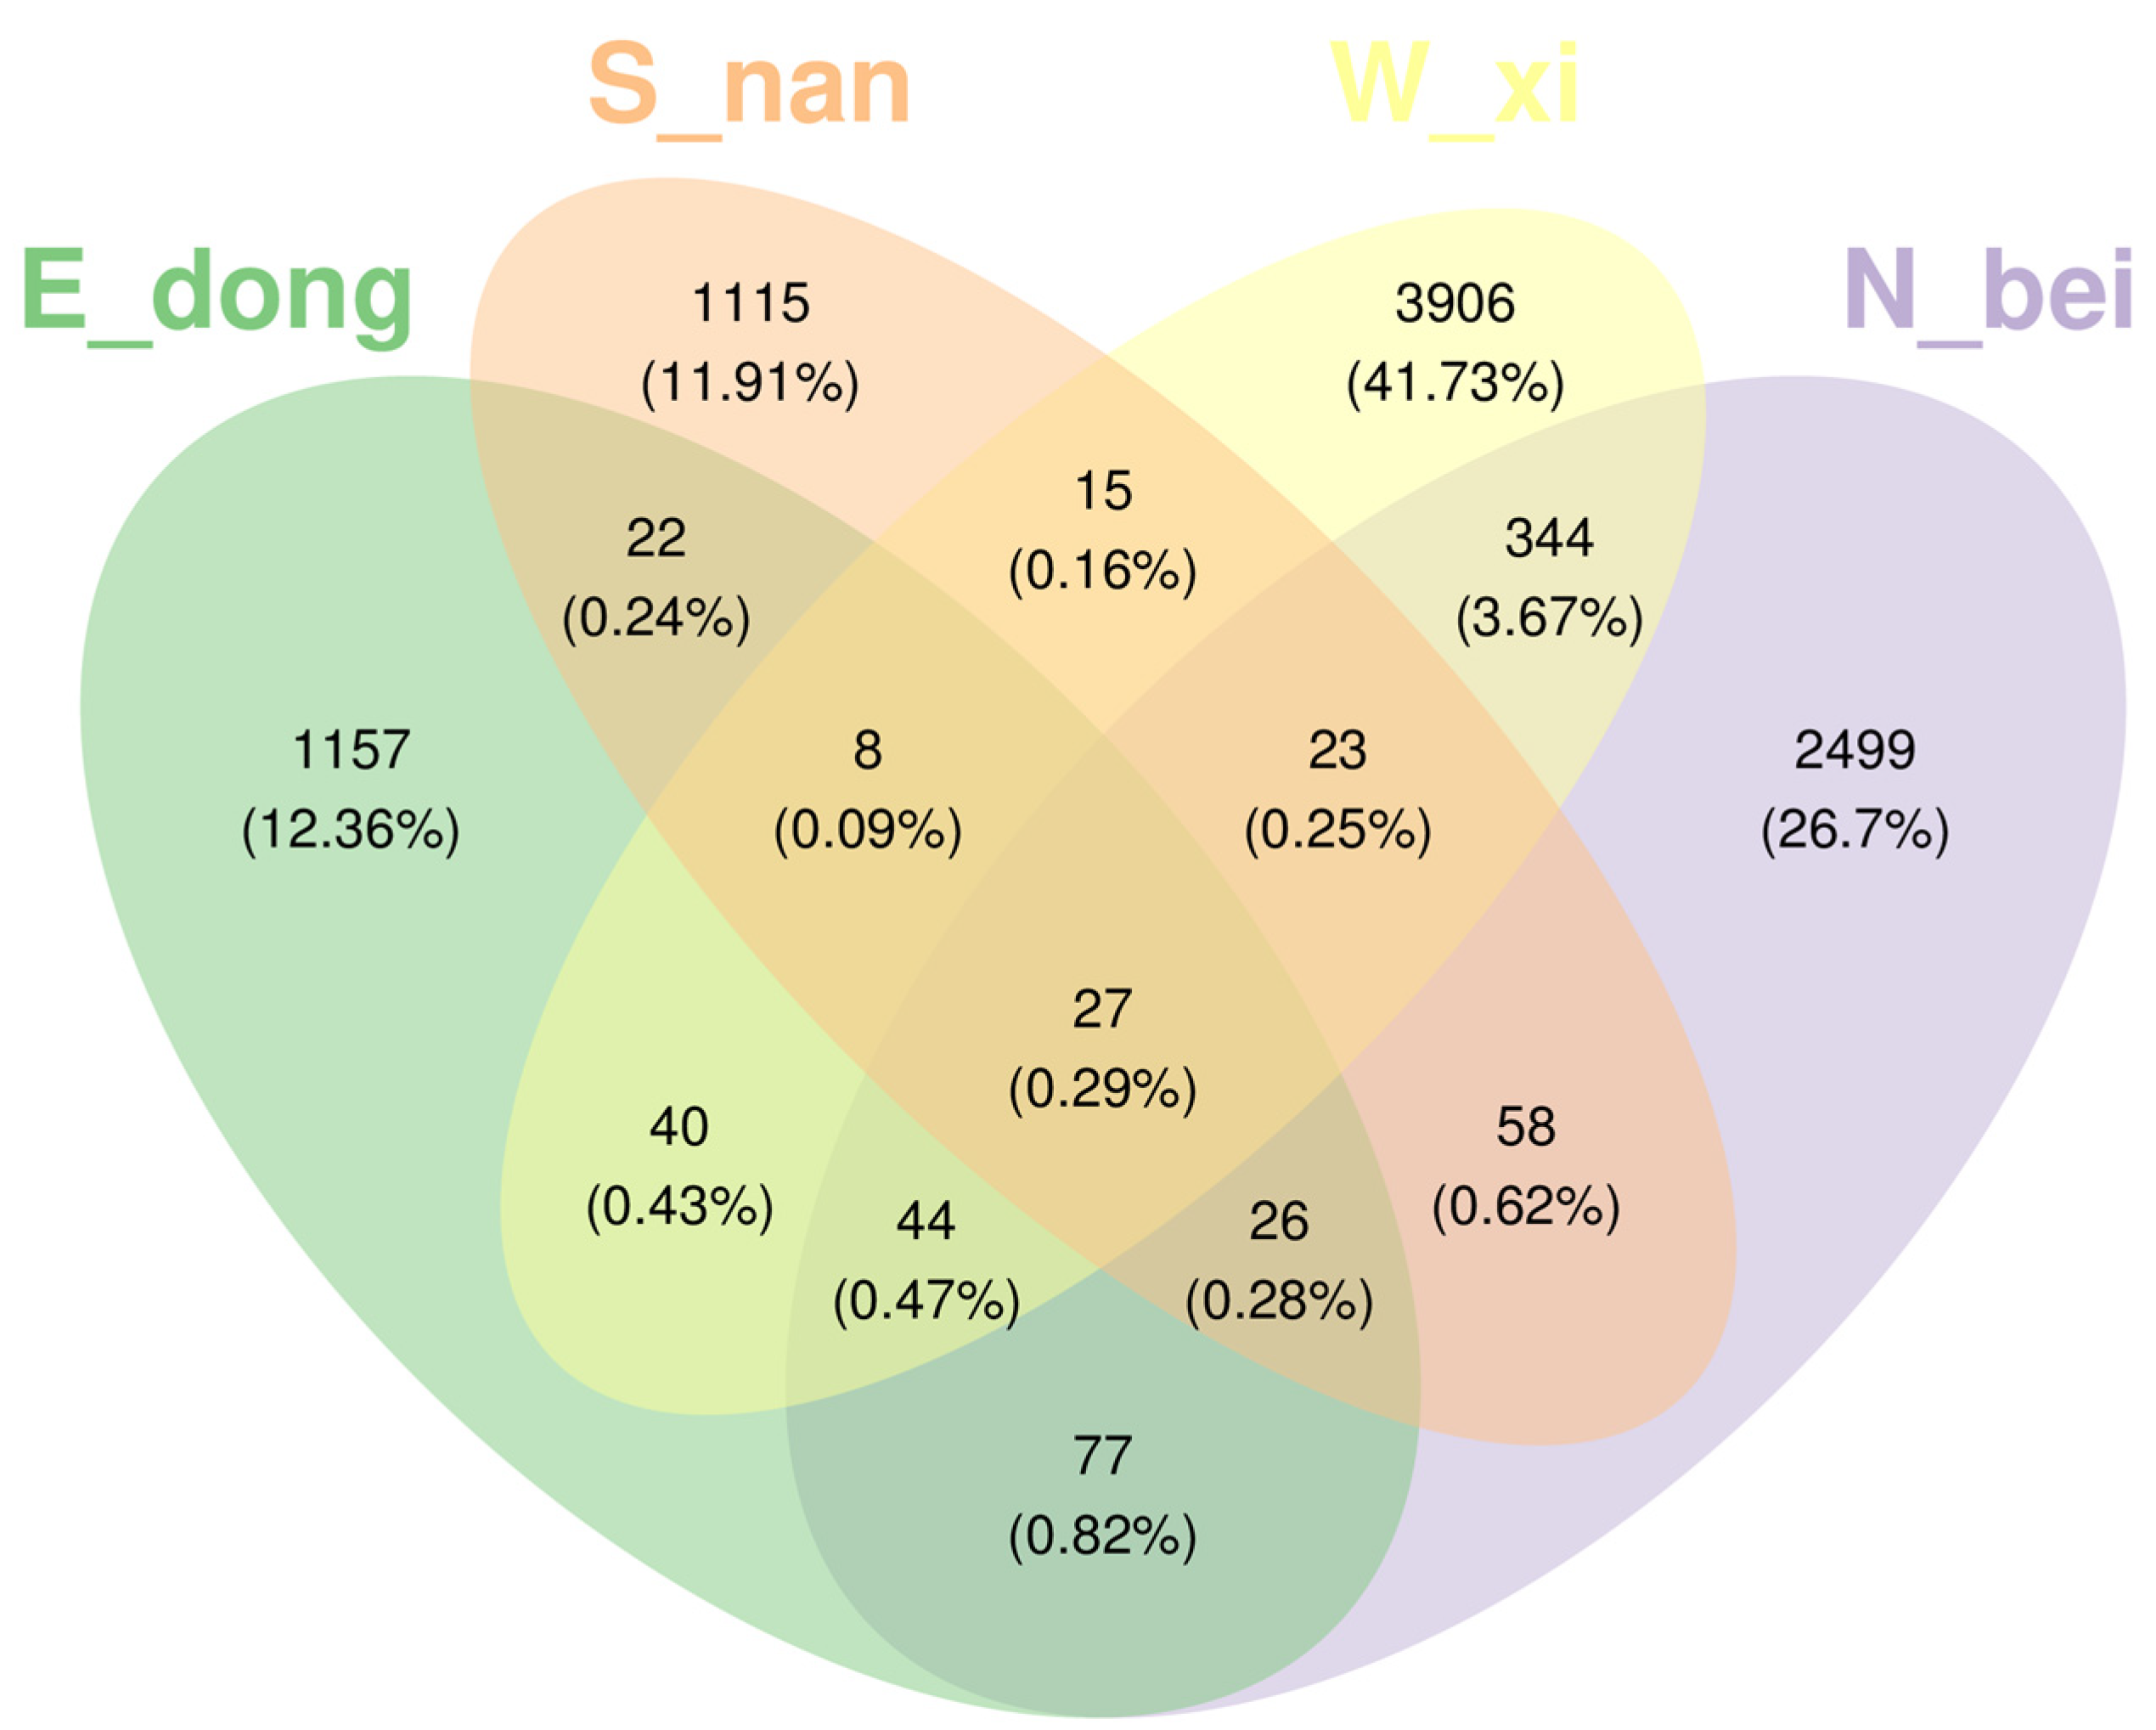
The Venn diagram (
Figure 15) illustrates the distribution and overlap of amplicon sequence variants (ASVs) among rammed earth samples collected from the north (N_bei), south (S_nan), west (W_xi), and east (E_dong) walls. It should be noted that the diagram represents ASV-level sequence features rather than species-level classifications; therefore, it reflects compositional similarity and differentiation among microbial communities rather than direct taxonomic differences. The number of unique ASVs in each group varied considerably: The west wall contained the highest number of unique ASVs (3906, 41.73%), followed by the north wall (2499, 26.7%). The south and east walls exhibited fewer unique ASVs—1115 (11.91%) and 1157 (12.36%), respectively—indicating relatively similar community compositions between these two orientations. Only 27 ASVs (0.29%) were shared across all four groups, representing a small core community with broad environmental tolerance. Limited overlaps between two or three wall orientations (e.g., 344 shared ASVs between north and west walls, 22 between south and east walls) further demonstrate the spatial heterogeneity of microbial assemblages associated with microclimatic variations in light exposure, humidity, and salinity.
Figure 16 presents the frequency distribution of operational taxonomic units (OTUs) at the genus and phylum levels in the rammed earth samples. This figure complements the previous compositional analysis (
Figure 9) by illustrating the relative frequencies of dominant taxa rather than their proportional abundances. The bars do not sum to 100% because only the most representative genera and phyla are shown, while low-abundance groups were excluded for clarity. At the genus level, variations in the frequency of taxa, such as
Conexibacter and
Geodermatophilus, across orientations indicate orientation-related differences in microbial enrichment. At the phylum level, the frequencies of
Verrucomicrobiota and
Deinococcota fluctuate among samples, suggesting subtle shifts in phylum-level distributions.
Figure 17 shows the relative abundance distribution of microbial groups in rammed earth samples from different combinations at the phylum and genus levels. At the phylum level, the proportions of phyla, such as
Actinobacteriota, in each combination are different, reflecting the selection of phylum-level communities by the microenvironment; at the genus level, the abundance of genera such as
Rubrobacter fluctuates between combinations, reflecting the environmental adaptability of genus-level groups.
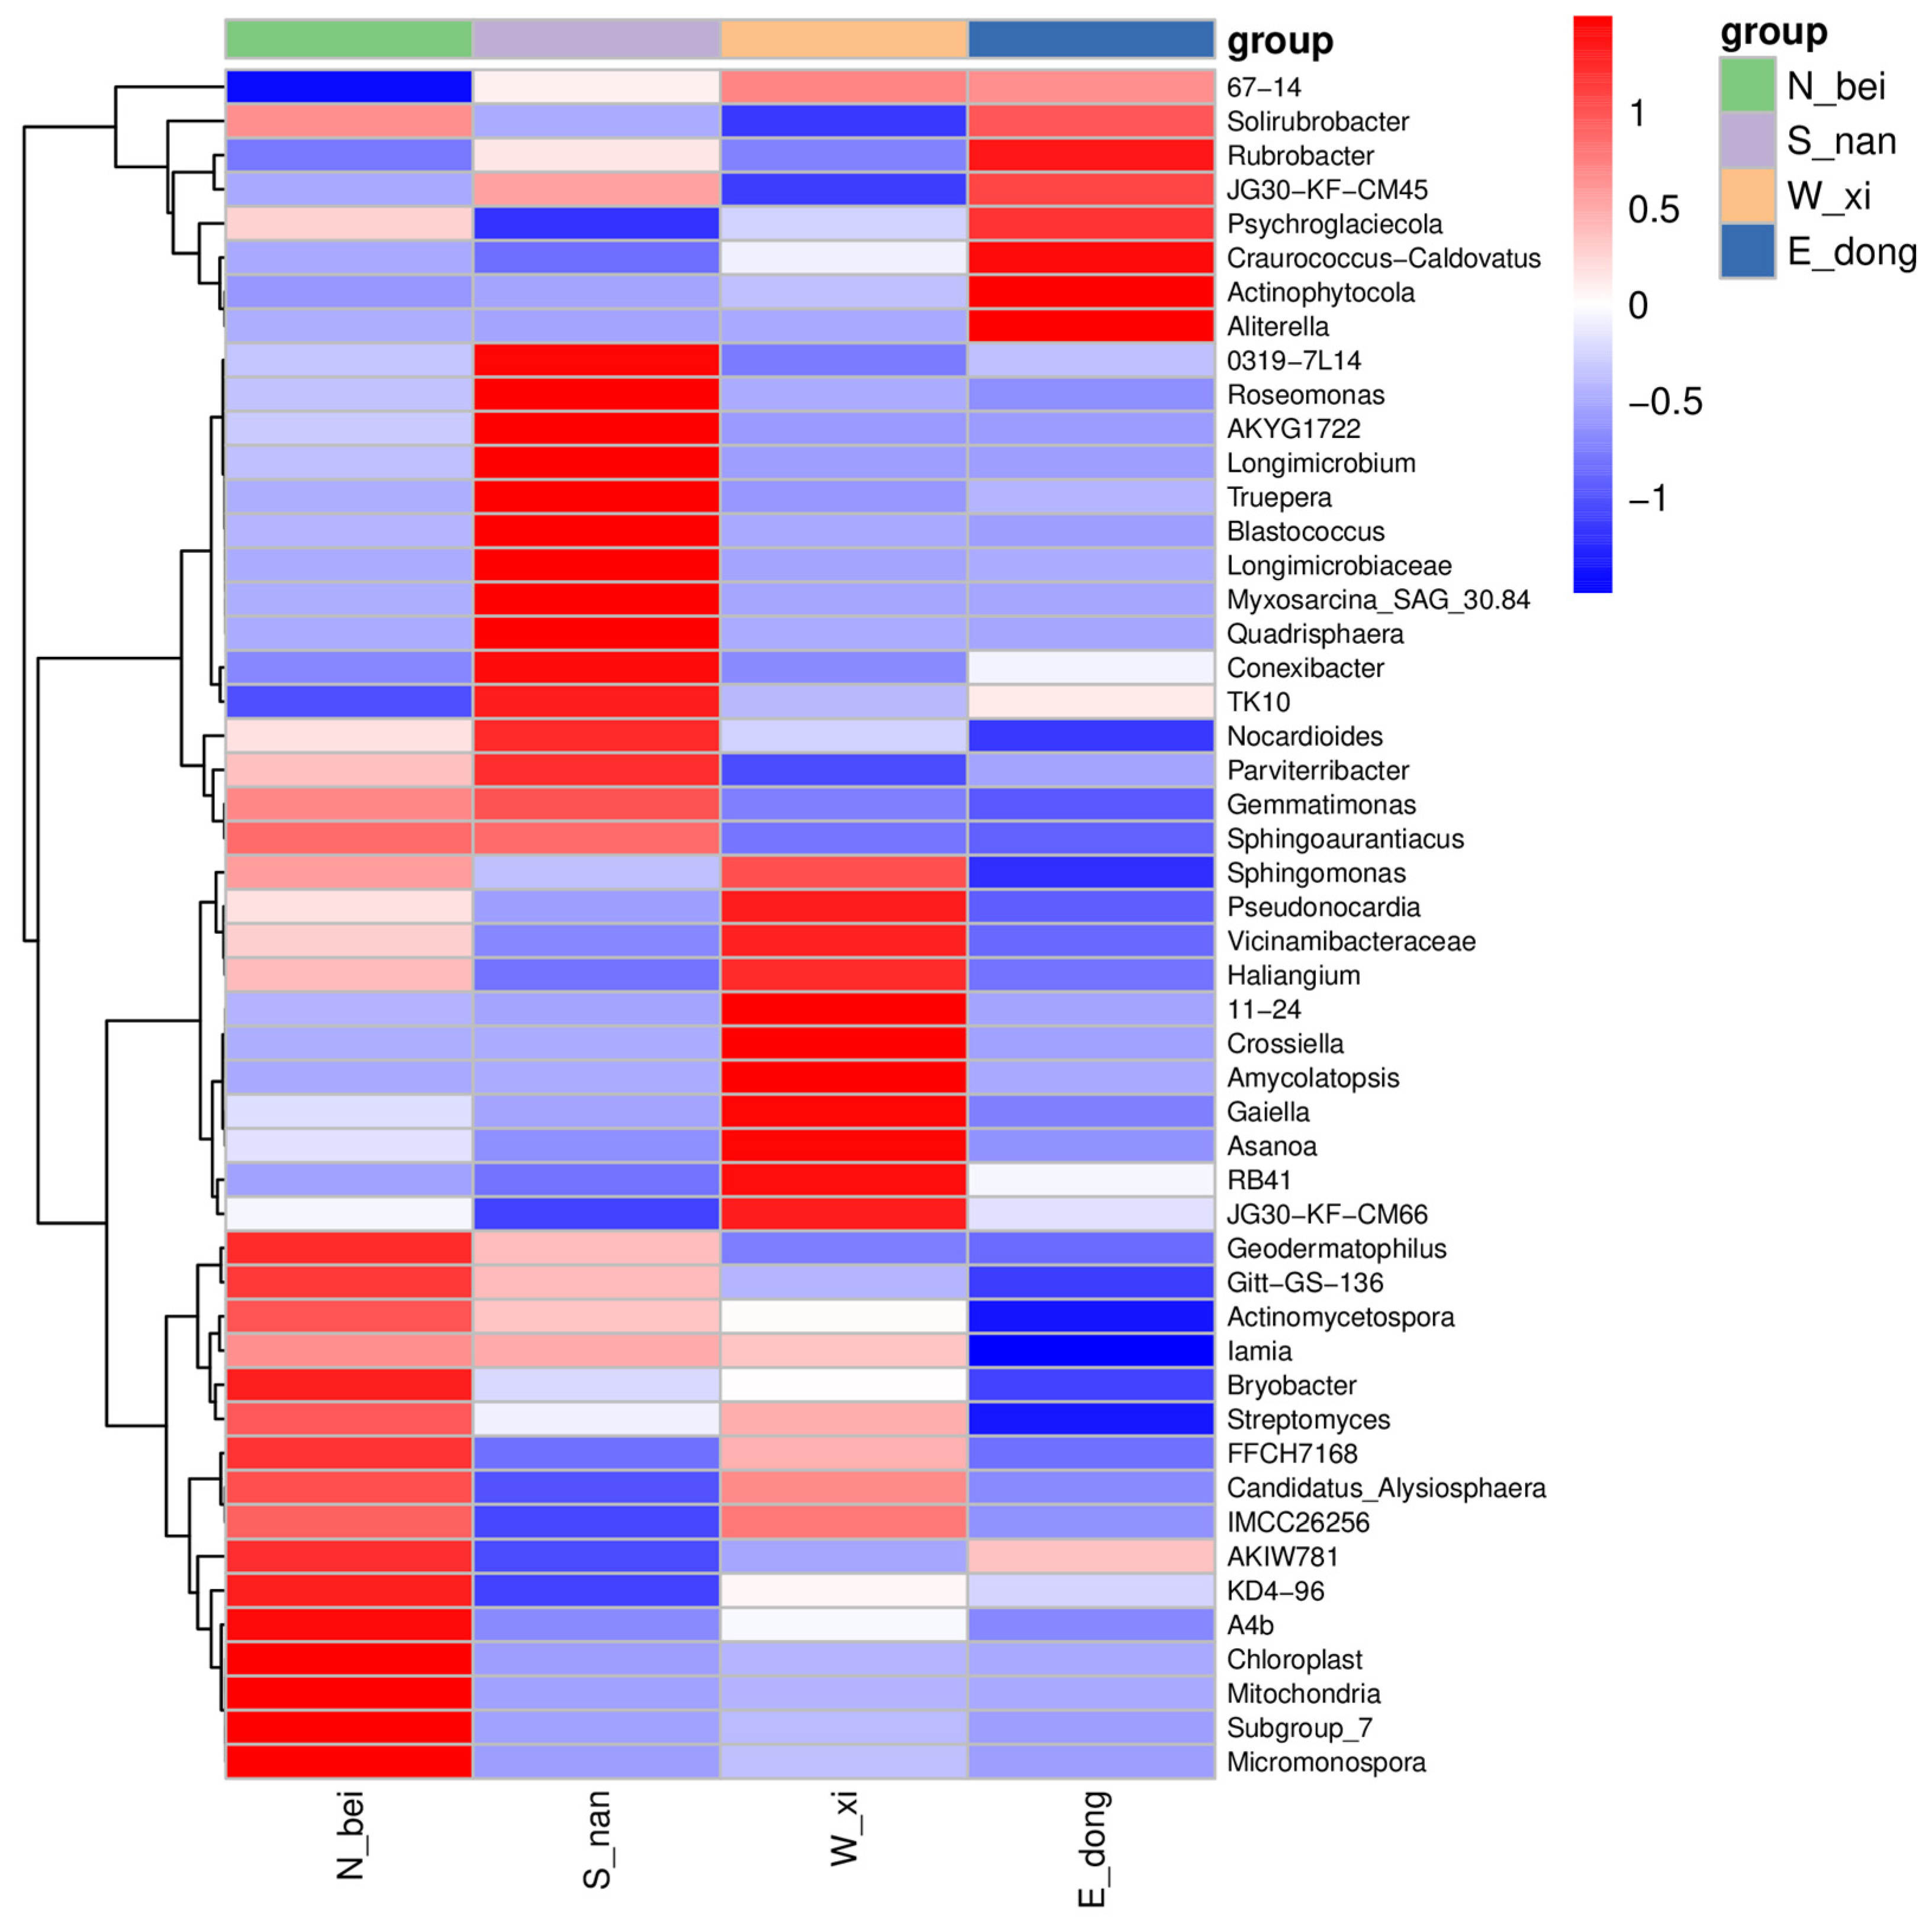
To explore the ecological differences among walls, we performed clustering analysis based on Bray–Curtis dissimilarity and visualized the results as heatmaps (
Figure 18). Red blocks indicate higher abundance, and blue blocks indicate the lower abundance of each genus, revealing distinct clustering patterns among wall orientations. This form of clustering corresponds well with environmental gradients such as humidity and sunlight exposure, confirming spatial heterogeneity in microbial communities.
In the heat map, the red–blue gradient is used to intuitively map the abundance differences at the genus level. Red blocks (such as Solirubrobacter and 67-14 in the N_bei group) indicate high-abundance groups, reflecting the low-light and high-humidity environment of the north wall and its effect on hygrophilous and shade-tolerant microorganisms, while blue blocks (such as some actinomycetes in the E_dong group) correspond to low-abundance groups, suggesting the adaptive succession of the community under the mild microenvironment of the east wall. Among the specific groups, JG30-KF-CM45 is highlighted via a darker shade of red (high abundance) in the S_nan group, which is highly consistent with the selection pressure inflicted by the strong sunlight and high-temperature environment of the south wall. TK10 is highlighted in blue (low abundance) in the W_xi group, reflecting the inhibitory effect of salt stress and wind disturbance on the genus in the west wall. This dual “cluster association + abundance gradient” visualization accurately analyzes the ecological differentiation of microbial genera driven by the orientation microenvironment and provides a quantitative basis at the genus level for exploring the microecological construction mechanism and environmental response laws of historical rammed earth walls.
3.7. Predictive Calculation of Metabolic Pathways
Figure 19 presents the predicted KEGG secondary functional pathway distribution of the microbial community, inferred from 16S rRNA gene sequencing data using the Tax4Fun2 functional annotation tool [
31]. The analysis workflow followed three key steps: first, the high-quality OTU (Operational Taxonomic Unit) table was normalized by 16S rRNA gene copy number to reduce taxonomic bias; second, OTUs were matched to the SILVA database (v138) for taxonomic annotation; third, annotated taxa were mapped to the KEGG Orthology (KO) database to calculate the relative abundance of secondary metabolic pathways. It should be noted that this analysis reflects potential rather than directly measured metabolic functions. 16S-based functional prediction relies on the correlation between taxonomic composition and known functional profiles of reference microbes, so the results are approximate estimations [
32]. This method has been validated in studies of historical building-associated microbes [
33], showing consistent trends with metagenomic data for core metabolic pathways (e.g., amino acid metabolism), though it may underestimate rare functional modules.
The predicted functions are distributed across six major KEGG categories, including Metabolism, Environmental Information Processing, and Cellular Processes. Among these, pathways related to amino acid and carbohydrate metabolism show relatively high predicted abundance. This is particularly relevant to the study of historic rammed earth materials: these pathways suggest the microbial community may participate in nutrient cycling (e.g., decomposition of organic matter in rammed earth) and energy metabolism, which are key to understanding microbial impacts on the material’s physical and chemical stability (e.g., preventing organic acid accumulation that causes structural erosion).
The Environmental Information Processing module, particularly membrane transport pathways, may indicate adaptive responses to environmental changes (e.g., fluctuations in moisture and temperature within historic rammed earth structures). In contrast, pathways associated with Genetic Information Processing and Human Diseases display lower predicted abundance, reflecting limited direct host-related activity and supporting the hypothesis that the microbial community is primarily adapted to the abiotic historic rammed earth environment.
The occurrence of unclassified taxa at different taxonomic levels reflects the limitations of current reference databases and the complexity of microbial communities inhabiting historic rammed earth materials. We therefore only interpreted confidently annotated taxa, avoiding overgeneralization of uncertain classifications. This conservative approach provides a more robust and scientifically sound basis for discussing microbial community patterns.
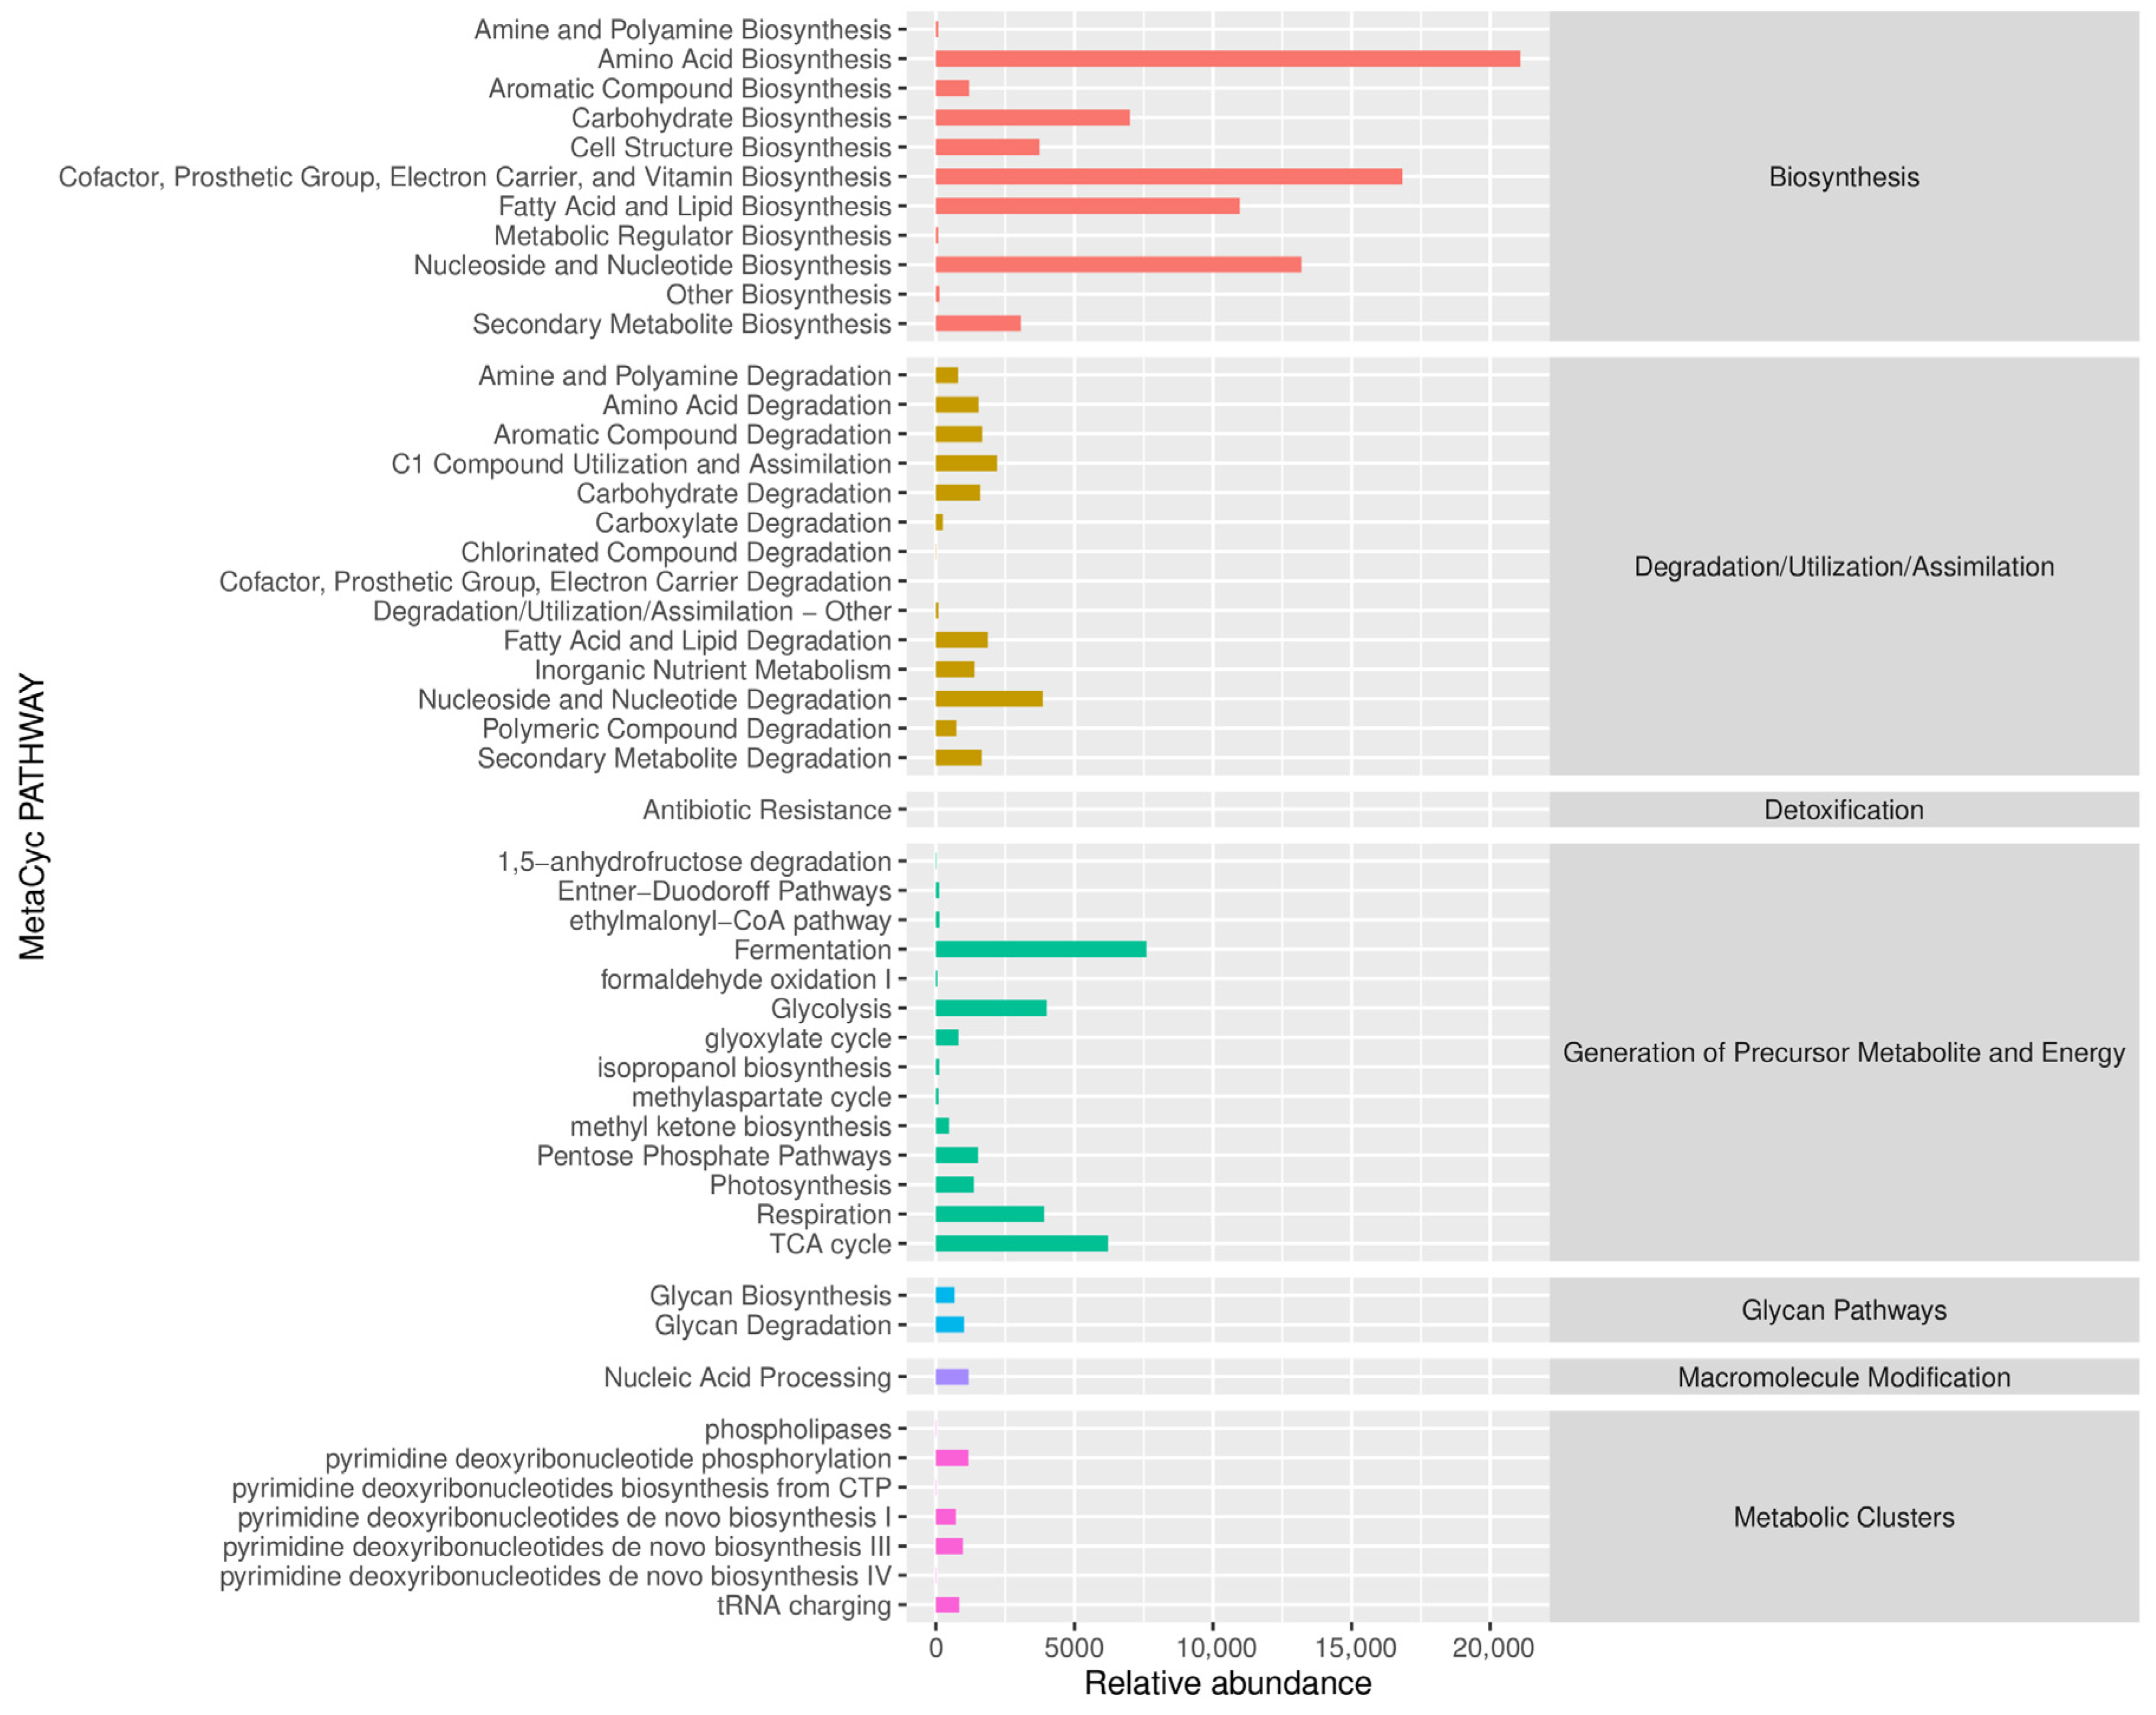
Figure 20 presents the Predicted MetaCyc secondary functional pathway abundance map. The MetaCyc database covers a large amount of microbial metabolic pathway information. Through the predicted abundance map, we can understand the potential activity of various metabolic pathways (such as substance synthesis, decomposition, energy metabolism, etc.) in the microbial community and thus infer the metabolic functions that the community may have. Among biosynthetic pathways, Amino Acid Biosynthesis showed an extremely high abundance, approaching 20,000, suggesting that the microbial community may be actively synthesizing amino acids. Amino acids are the building blocks of proteins, and this high abundance may indicate a high demand for protein for the microbial growth and reproduction within the community, or that the microbial community is providing amino acids to the surrounding environment. Furthermore, pathways such as Carrier and Vitamin Biosynthesis also showed a certain abundance, suggesting that microbes have the potential to synthesize substances such as cofactors and vitamins that are crucial for life, helping to maintain metabolic balance within the community itself and potentially that of surrounding organisms. Under the Degradation/Utilization/Assimilation category, the abundance of degradation pathways for various substances is relatively moderate. Pathways such as amino acid degradation and aromatic compound degradation show some activity, indicating that the microbial community has the potential to degrade these organic substances. Rammed earth walls may contain amino acids and aromatic compounds from the environment. Microorganisms degrade these substances to obtain energy and nutrients, participating in the material cycle surrounding the rammed earth wall and contributing to the transformation of substances in the wall’s microenvironment.
It should be noted that these results represent predicted metabolic potential derived from 16S rRNA data rather than experimentally verified metagenomic or metatranscriptomic evidence. Therefore, the functional interpretations remain hypothetical. Future studies should validate them using whole-genome sequencing (to confirm functional gene presence) or transcriptome sequencing (to verify gene expression), which will further clarify the actual metabolic activities of the microbial community in historic rammed earth.
4. Discussion
4.1. Benefits of Microbial Diversity in Rammed Earth Walls
This study provides the first systematic characterization of microbial community compositions and potential ecological functions on historic rammed earth walls in the Lingnan region. The SEM microstructural differences are closely related to the microbial diversity patterns observed in the sequencing results. The north and west walls, characterized by looser particle structures and higher porosity, provide favorable conditions for microbial attachment and nutrient retention, explaining their higher microbial richness. Conversely, the south and east walls exhibit denser structures with lower pore connectivity, which limits microbial colonization and corresponds to lower diversity levels dominated by heat-tolerant and light-tolerant taxa. This correlation between SEM observations and microbial community composition highlights the influence of microstructural features on microbial distribution across different wall orientations. Specifically, 16S rRNA metabarcoding and SEM analyses revealed the clear spatial differentiation of microbial diversity across the four wall orientations (north, south, east, and west). The north and west walls exhibited higher ASV richness and more complex community structures, likely due to higher humidity and lower light exposure, while the south and east walls were dominated by Actinobacteriota and Proteobacteria under stronger sunlight. These results indicate that microclimatic factors such as light, moisture, and salinity strongly influence microbial community assembly and may serve as bioindicators of wall preservation states. The predicted metabolic pathways related to amino acid and carbohydrate metabolism further suggest that microorganisms play potential roles in nutrient cycling, soil stabilization, and biogeochemical transformation processes within the earthen matrix.
Our findings generally align with prior research on earthen heritage microbiology, which indicates that microorganisms can both damage and protect such structures. For instance, surface biofilms have been reported to reduce erosion on historic rammed earth walls. Similarly, the dominance of Actinobacteria on our sun-exposed south wall echoes observations from other hot-climate sites, where thermophilic Actinobacteria are predominant. Similarly, the moisture-loving microbes enriched on the north wall reflect findings from humid-climate studies, in which shaded, damp sections of old walls exhibited increased algal and mold growth that accelerated biodeterioration.
The novelty of this study lies in bridging microbial ecology and architectural conservation through a spatially resolved analysis of ancient rammed earth materials. Unlike previous studies that examined either material properties or microbial taxonomy alone, our research integrates microstructural observation, molecular diversity analysis, and functional prediction to uncover how microorganisms adapt to orientation-specific microenvironments. Our findings contribute to understanding the interaction between environmental factors and microbial colonization mechanisms, revealing how microbial diversity patterns can inform preventive conservation strategies. These interdisciplinary insights expand current knowledge on the ecological processes that underpin the degradation and stabilization of traditional earthen heritage. By distinguishing between wall orientations, our study offers a more granular view than studies that sample whole structures without microhabitat differentiation. For example, a recent metagenomic survey of a Song Dynasty city wall found that well-preserved sections had much richer and distinct microbiomes than heavily weathered sections, suggesting that microbial activity can both mitigate and exacerbate decay. This supports our conclusion that fine-scale environmental factors drive community structure and function, directly impacting conservation outcomes. Additionally, by integrating SEM-observed microstructure with microbial sequencing, we answered calls for a multi-dimensional approach linking biology to material changes—a strategy increasingly advocated in heritage science.
Our study also highlights certain knowledge gaps. Although some researchers have improved earthen material durability using specific microbial inoculants or bio-mineralization techniques, the in situ cause–effect relationships remain complex. We found clear correlations between environment and community traits, but pinpointing which microbes cause material decay versus those that offer protection will require targeted experiments. Moreover, as with most current studies (including ours), our analysis is essentially a snapshot; the seasonal dynamics of these wall microbiomes remain largely uncharted and merit future investigation. Overall, our results reinforce the view that microbes are key agents in earthen wall weathering. We advance this understanding by providing fine-scale evidence of niche partitioning on one structure and by demonstrating the value of an integrated, interdisciplinary analysis.
4.2. Multi-Dimensional Conservation Strategy Recommendations
Building on these insights, we propose a multi-dimensional conservation strategy that combines scientific, ecological, and community-based measures. Preservation efforts should balance material protection with public engagement, effectively turning the microbial “problem” into an educational and protective resource. By linking material heritage with its micro-ecology, this approach also provides a novel pathway for cultural empowerment as the village pursues rural revitalization:
- (1)
Ecological Restoration Technologies: Bio-based consolidation methods should be explored to naturally strengthen rammed earth walls. For example, introducing beneficial native microbes or applying microbial-induced calcite precipitation (MICP) can bind soil particles and increase cohesion. These nature-inspired techniques treat biofilms as living protective agents, offering a symbiotic restoration approach. They can complement traditional chemical consolidants to improve structural resilience while preserving material authenticity.
- (2)
Heritage Science Education and Tourism: Educational tourism activities centered on the walls’ microbiology should be developed. Rather than excessive commercialization, Paishan Village can host “microbial exploration” tours where visitors (especially students) observe wall microbes—for example, via portable microscopes—and learn how different areas harbor different micro-ecologies. Framing preservation as a scientific adventure not only raises public awareness of the value of rammed earth sites but also fosters a sense of wonder, reinforcing that these historic walls are dynamic “living” heritage sites rather than inert relics.
- (3)
Community Engagement and Co-Governance: Local residents should be encouraged to participate in protecting their heritage. Scientific findings should be shared in accessible formats (e.g., workshops or illustrated posters) to help residents understand that “moldy” wall spots are part of a natural ecosystem and that proper maintenance can extend the life of their ancestral homes. This understanding fosters pride and a sense of ownership, motivating residents to help monitor and maintain the walls. Shifting from a top–down approach to a co-governance model—with residents collaborating alongside experts—ensures that interventions are culturally appropriate and sustainable. For instance, communities could form volunteer maintenance teams trained in basic microbial monitoring and preventive care, guided by conservation specialists. Such community-driven stewardship, supported by scientific guidance, establishes a sustainable framework that keeps rammed earth heritage alive and collectively cared for.
Furthermore, our survey revealed that some residents in Paishan Village lack awareness of rammed earth wall preservation, arbitrarily modifying and discarding traditional building materials. By translating the findings of microbial diversity research into accessible language, residents can understand the vitality of rammed earth walls from a microecological perspective. For example, we can produce posters that explain the following: “mold spots on walls are not merely a disease but part of the village’s ecology, and that scientific restoration can extend the life of old houses.” This helps residents understand that these are not merely “old houses” but “living heritage” embodying the village’s ecological memory and cultural identity. This cultural identity, grounded in scientific understanding, can effectively inspire residents to proactively participate in heritage protection, promote the transition from “government-led conservation” to “government + villager co-governance”, and provide a foundation for the sustainable development of Paishan Village.
In combination, these strategies reinforce one another and exemplify the symbiosis between ecological protection and cultural heritage. Recognizing the microbiological dimension of conservation not only aids in safeguarding the physical integrity of the walls but also enriches their cultural significance, ensuring that preservation is both scientifically informed and socially resilient.
5. Conclusions
This study combined scanning electron microscopy (SEM) and high-throughput 16S rRNA sequencing to investigate the microbial diversity and environmental adaptation mechanisms of rammed earth walls in Paishan Village, a representative site of Lingnan’s hot and humid climate. The results revealed clear spatial differentiation in both microstructure and microbial compositions across different wall orientations. The north and west walls exhibited looser textures and higher microbial richness due to greater humidity and wind exposure, while the south and east walls exhibited more compact structures and specialized microbial communities dominated by heat-tolerant and light-tolerant taxa. Only a small fraction of core microorganisms was shared among all orientations, confirming that light, temperature, humidity, and salinity are major factors shaping microbial community differentiation. The predicted metabolic functions suggested that microorganisms contribute to nutrient cycling and material stabilization within rammed earth, with low representations of human-related pathogenic pathways.
The findings highlight the complex interactions between environmental conditions, material properties, and microbial ecology in traditional earthen heritage, offering new perspectives for conservation science. By linking microstructural analysis with microbial functional profiling, this study contributes to a better understanding of how microorganisms participate in both the degradation and preservation of rammed earth materials, providing a scientific foundation for developing ecological restoration strategies.
Nonetheless, this study remains a preliminary exploration. Future studies should conduct long-term monitoring to capture seasonal changes and environmental fluctuations and perform controlled laboratory experiments to verify the effects of key microbial groups on material performance. Moreover, the potential application of beneficial indigenous microorganisms or microbial-induced calcite precipitation (MICP) could be explored to enhance the durability and ecological resilience of rammed earth structures. These efforts will promote an integrated approach combining microbial ecology and cultural heritage conservation for the sustainable protection of historic villages such as Paishan.
