Article

An SWIR-MIR Spectral Database of Organic Coatings Used on Historic Metals †

Department of Art History and Art Conservation, Queen’s University, Kingston, ON K7L 3N7, Canada
*
Author to whom correspondence should be addressed.
This article is an expanded version of a paper entitled “Non-destructive characterization of organic patinas on Renaissance bronzes using short-wave infrared and mid-infrared spectroscopy,” which was presented at Metal 2025, Cardiff, Wales, UK, 1–5 September 2025, and published under the same name in the proceedings: METAL 2025: Proceedings of the International Conference on Metals Conservation, Nicola Emmerson, Johanna Thunberg, and David Watkinson, eds, 2025. In addition, select figures and writing, as well as the full scope of the research project, are published in an internal, non peer-reviewer thesis at Queen’s University.
Coatings 2025, 15(10), 1226; https://doi.org/10.3390/coatings15101226
Submission received: 30 August 2025 / Revised: 11 October 2025 / Accepted: 14 October 2025 / Published: 20 October 2025

Abstract

Surface organic coatings (SOCs) composed of drying oils, resins, and bitumen were commonly applied to small Renaissance bronze sculptures to enhance their visual and physical properties, producing dark, lustrous surfaces that were both esthetic and protective. Yet, the identification of these coatings remains challenging due to aging, conservation interventions, and the damage caused by physical sampling. This study presents a reproducible, non-destructive protocol for characterizing SOCs on metal substrates using external reflection Fourier transform infrared spectroscopy (ER-FTIR) and fiber optic reflectance spectroscopy (FORS). Twenty-seven reference coating mock-ups of linseed oil, walnut oil, mastic resin, pine resin, and bitumen were stoved onto bronze coupons and artificially aged. Spectra were analyzed across the visible/near-infrared (VIS-NIR) (~400–1000 nm), short-wave-infrared (SWIR) (~1000–2500 nm), and mid-infrared (MIR) (~2.5–25 µm) ranges, with key diagnostic features identified for each component and blend, including primary absorptions, combination bands, and overtones. ER-FTIR proved highly effective in detecting oil–resin mixtures and later wax coatings through characteristic bands in the MIR, while FORS, enhanced by first-derivative processing, successfully differentiated triterpenoid and diterpenoid resins and identified multi-component SOCs in the SWIR region. The reference spectral database generated in this study is intended to serve as a comparative tool for future non-invasive analysis of organic coatings on metal surfaces and to demonstrate that ER-FTIR and FORS, used in tandem, offer a practical and scalable framework for the non-destructive identification of SOCs.

Graphical Abstract

1. Introduction

In the late fifteenth century, reflecting a revived interest in classical art, small bronze sculptures became highly sought after by Renaissance collectors [1,2]. Beyond their varied iconographies, forms, and uses, Renaissance bronzes also exhibited diverse visual effects, achieved through adjustments in alloy composition, mechanical finishing techniques, and the application of different surface coatings [3,4,5,6,7,8].
In a 2010 article published in the Metropolitan Museum Journal, conservator Richard Stone noted, “Most, if not all, Renaissance patinas are organic” [2] (p. 107). Two subsequent studies at the MET and Kunsthistorisches museums using gas chromatography–mass spectrometry (GC-MS) revealed coatings comprising drying oils, tree resins, mineral bitumen, and occasionally, pigment additives, yielding colors from translucent reds to deep, opaque blacks [9,10]. Building on these findings, this research aims to correlate non-invasively derived spectral features from various surface organic coating (SOC) compositions using diagnostic spectral markers in reflectance and first-derivative spectra. Fiber optic reflectance spectroscopy (FORS) and external reflection Fourier transform infrared spectroscopy (ER-FTIR) across the visible/near-infrared (VIS-NIR) (~400–1000 nm), short-wave-infrared (SWIR) (~1000–2500 nm), and mid-infrared (MIR) (~2.5–25 µm) ranges were used (Table 1). Both ER-FTIR and FORS have demonstrated effectiveness in identifying organic materials in paintings and illuminated manuscripts [11,12,13,14,15,16,17,18,19,20,21,22,23,24,25], as well as inorganic copper corrosion products [26,27,28].
In the NIR and SWIR, absorption bands arise primarily from vibrational overtones and combination bands rather than fundamental vibrations, which dominate the MIR region of ER-FTIR. An overtone occurs when a molecule absorbs enough energy to excite a vibration to a higher harmonic level, typically the second (2ν) or third (3ν) vibrational state. Combination bands result from the simultaneous excitation of two or more fundamental vibrations, as explained by Badr Eldin [29]. Because overtones and combinations involve higher energy transitions, they tend to be weaker and broader than fundamental bands in the MIR and often overlap substantially. Nevertheless, they provide valuable information about functional groups that are abundant in organic coatings. Combining ER-FTIR and FORS expands the spectral range from the visible to the mid-infrared, enabling more precise surface characterization of SOCs by capturing both vibrational fundamentals and electronic or overtone absorptions.
To date, invasive and micro-invasive techniques like GC-MS, attenuated total reflectance, and transmission infrared spectroscopy have been used to characterize the surfaces of Renaissance bronzes, particularly investigating SOCs and some aspects of metal corrosion [10,19,30,31,32,33,34]. However, the small size and often pristine condition of indoor Renaissance bronzes make sampling restrictive, as even minor sampling can leave noticeable flaws. Non-destructive, portable methods are increasingly favored for their ability to analyze cultural heritage on-site without compromising physical integrity, making ER-FTIR and FORS ideal options.
The characterization of surface coatings on bronzes is of high importance to art conservators, whose treatment approaches depend on understanding the surface chemistry of an artefact. Despite historic and modern interventions common to Renaissance bronzes—including tinted shellac, beeswax, or other materials applied to meet changing tastes or to mimic antiquities, as seen with selenium-based coatings applied to European collections in the 19th and 20th centuries [10,35]—small bronzes have maintained traces of robust patinas, with original SOCs often entirely preserved. Knowledge of an original surface coating not only guides appropriate conservation strategies but also cautions against treatments that could irreversibly alter or destroy these layers, such as the use of heat during waxing or the use of aggressive approaches to cleaning (e.g., scrubbing or abrading the surface in preparation for preservative coatings).

2. Materials and Methods

2.1. Coupon Preparation

Leaded red brass (C83600) was selected as the base alloy based on a literature survey of 237 published data points from Renaissance bronze alloy analysis. The results are summarized in Table 2.
Metal coupons (~2 cm × 5 cm × 3 mm) were cut and sequentially wet-sanded using 240, 300, and 600 grit paper. An oxide passivation layer was induced by heating the coupons at 500 °C for 20 min. The passivation layer increases corrosion resistance and encourages metallic cross-linking with the SOC [38].
Twenty-seven coatings of pure standards and mixtures (Table 3) were prepared with equal w/w ratios. Oil–resin mixtures were prepared by crushing the resin tears or chunks and dissolving them in oil in a double boiler for 1.5–2 h with intermittent stirring. For pure resin standards, the resins were solubilized in 99% ethanol (equal w/w); the ethanol was evaporated prior to stoving. Coatings and coupons were heated with a heat gun until ~49 °C before the coatings were applied with a brush. The surface was immediately burnished with a cheesecloth to create a thin, uniform layer. A duplicate of each mock-up was prepared. Mock-ups were “stoved” for 1.5–5 h at 120–150 °C, coated again, and “stoved” for an additional 1.5–3 h until the mock-ups were dry to touch.
Table 3. Oil, resin, and bitumen combinations applied to metal coupons.
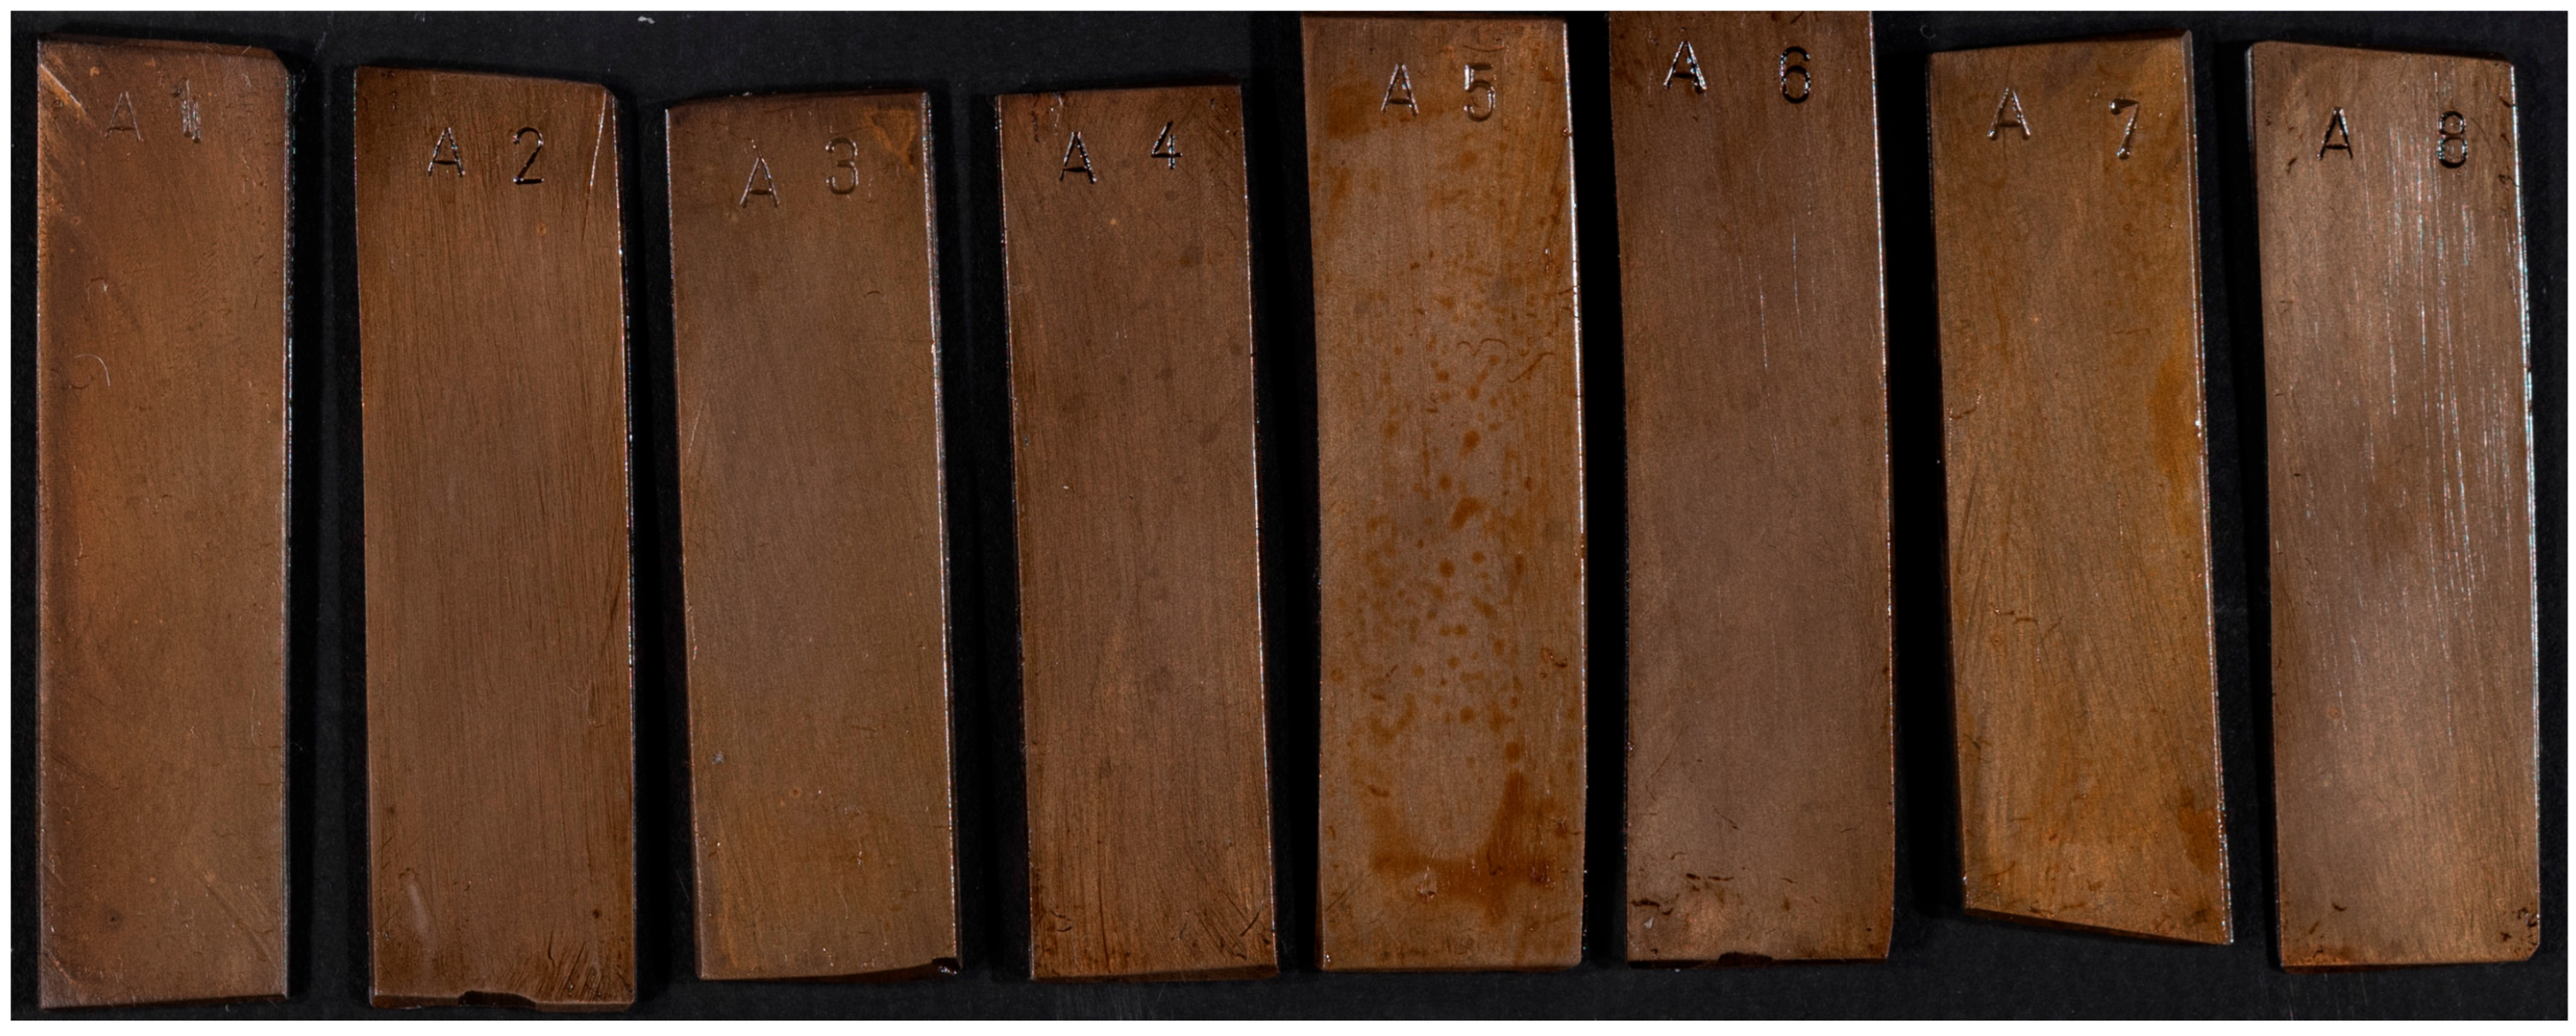
Linseed Oil-Based Mock-Ups (Figure 1)Walnut Oil-Based Mock-UpsLinseed–Walnut Oil-Based Mock-UpsOther Mock-Ups
LinseedWalnutLinseed–walnutBitumen
Linseed–bitumenWalnut–bitumenLinseed–walnut–
bitumen
Mastic
Linseed–masticWalnut–masticLinseed–walnut–masticPine
Linseed–mastic–
bitumen
Walnut–mastic–
bitumen
Linseed–walnut–mastic–bitumen
Linseed–pineWalnut–pineLinseed–walnut–pine
Linseed–pine–
bitumen
Walnut–pine–
bitumen
Linseed–walnut–pine–bitumen
Linseed–mastic–pineWalnut–mastic–pineLinseed–walnut–mastic–pine
Linseed–mastic–pine–bitumenWalnut–mastic–pine–bitumenLinseed–walnut–mastic–pine–bitumen
Figure 1. Linseed oil-based stoved mock-ups. Coatings: A1: linseed; A2: linseed–bitumen; A3: linseed–mastic; A4: linseed–mastic–bitumen; A5: linseed–pine; A6: linseed–pine–bitumen; A7: linseed–mastic–pine; A8: linseed–mastic–pine–bitumen.
Coatings 15 01226 g001
To determine if SOCs can be characterized beneath later conservation treatments and maintenance, two maintenance coatings were applied to coated mock-ups. Renaissance wax polish—a microcrystalline wax developed by the British Museum in the 1950s and since used worldwide in museum conservation—was applied to the linseed oil mock-up using a cotton rag and burnished using a cheese cloth. Shellac flakes were dissolved (1:8 w/w) in 100% isopropanol using a magnetic stirrer for 5 h. The solution was applied with a cheese cloth to the walnut oil mock-up and left to airdry. After analysis, Renaissance wax was removed with odourless mineral spirits and shellac was removed with 100% isopropanol.

2.2. Accelerated Aging

Duplicates of the 27 mock-ups were mounted on a plastic tray at an inclination of ~30°. Samples were subjected to 30 artificial aging cycles (24 h each) in a humidity cabinet. Aging conditions were selected based on the protocol outlined by Oliveira (2015), following the PROMET guidelines [39,40]. Temperature (T) and relative humidity (RH) parameters are detailed in Table 4.

2.3. ER-FTIR and FORS Analysis

ER-FTIR spectra were collected in reflectance mode using a ConservatIR external reflection accessory coupled to a Nicolet iS5 FTIR spectrometer (Thermo Fisher Scientific, Waltham, MA USA) from 6000 to 400 cm−1 with an average of 64 scans at 4 cm−1 spectral resolution. Backgrounds were acquired every four measurements using a standardized reflection mirror. Noise from carbon dioxide and water vapour was minimized for some spectra by subtracting spectra from a blank metal coupon. The FTIR was equipped with a fast recovery DTGS detector. Data was processed using OMNIC® (Thermo Fisher Scientific, v9.12.928) and Spectragryph™ software (v1.2.16.1) programmes.
FORS spectra were acquired using an oreXplorer™ Portable UV-Vis-NIR Spectrometer (Spectral Evolution, Haverhill, MA, USA). The instrument has three detectors: a 512-element extended TE-cooled InGaAs detector (350–1000 nm), a 512-element TE-cooled InGaAs detector, and a 1024-element UV-enhanced Silicon detector. The spectrometer operated in the range of 350–2500 nm with an integrated fiber optic input for reflectance measurements. The instrument has a spectral resolution of 2.7 nm at 700 nm and 5.5 nm at 1400 nm and 5.8 nm at 2100 nm. The illumination source was a Spectral Evolution contact probe. The fiber optic cable produced a ~1 cm diameter spot size with the illumination source at 90° and the detector at 30° relative to the sample surface at ~5 mm standoff distance. Calibration was performed using a 2″ × 2″ 98% reflectance white reference plate made of polytetrafluoroethylene. Dark field readings were taken internally prior to each measurement. Each scan averaged 80 spectra. Data was collected in the DARWin SP software (v1.5) and processed using the Spectragryph™ software. All spectra were smoothed using the Savitsky–Golay smoothing option at an interval of 9 and polynomial order of 3.

3. Results and Discussion

To demonstrate the results of ER-FTIR and FORS, pure standards (linseed oil, walnut oil, pine resin, mastic resin, and bitumen) and select mixtures will be discussed. Artificially aged mock-up spectra yielded less spectral information, with band weakening and broadening observed in all samples. As such, data prior to artificial aging is presented in the main results, while all spectra and band assignments for the 27 mock-ups before and after aging can be found in Supplementary Materials. ER-FTIR and FORS spectra were collected over a combined range of 28,000–400 cm−1 (equal to ~350–25,000 nm); presented spectra are cropped to areas of observed absorption. The metal substrate and its oxide layer did not significantly affect the absorption features, which thus originate from the organic materials alone.

3.1. ER-FTIR

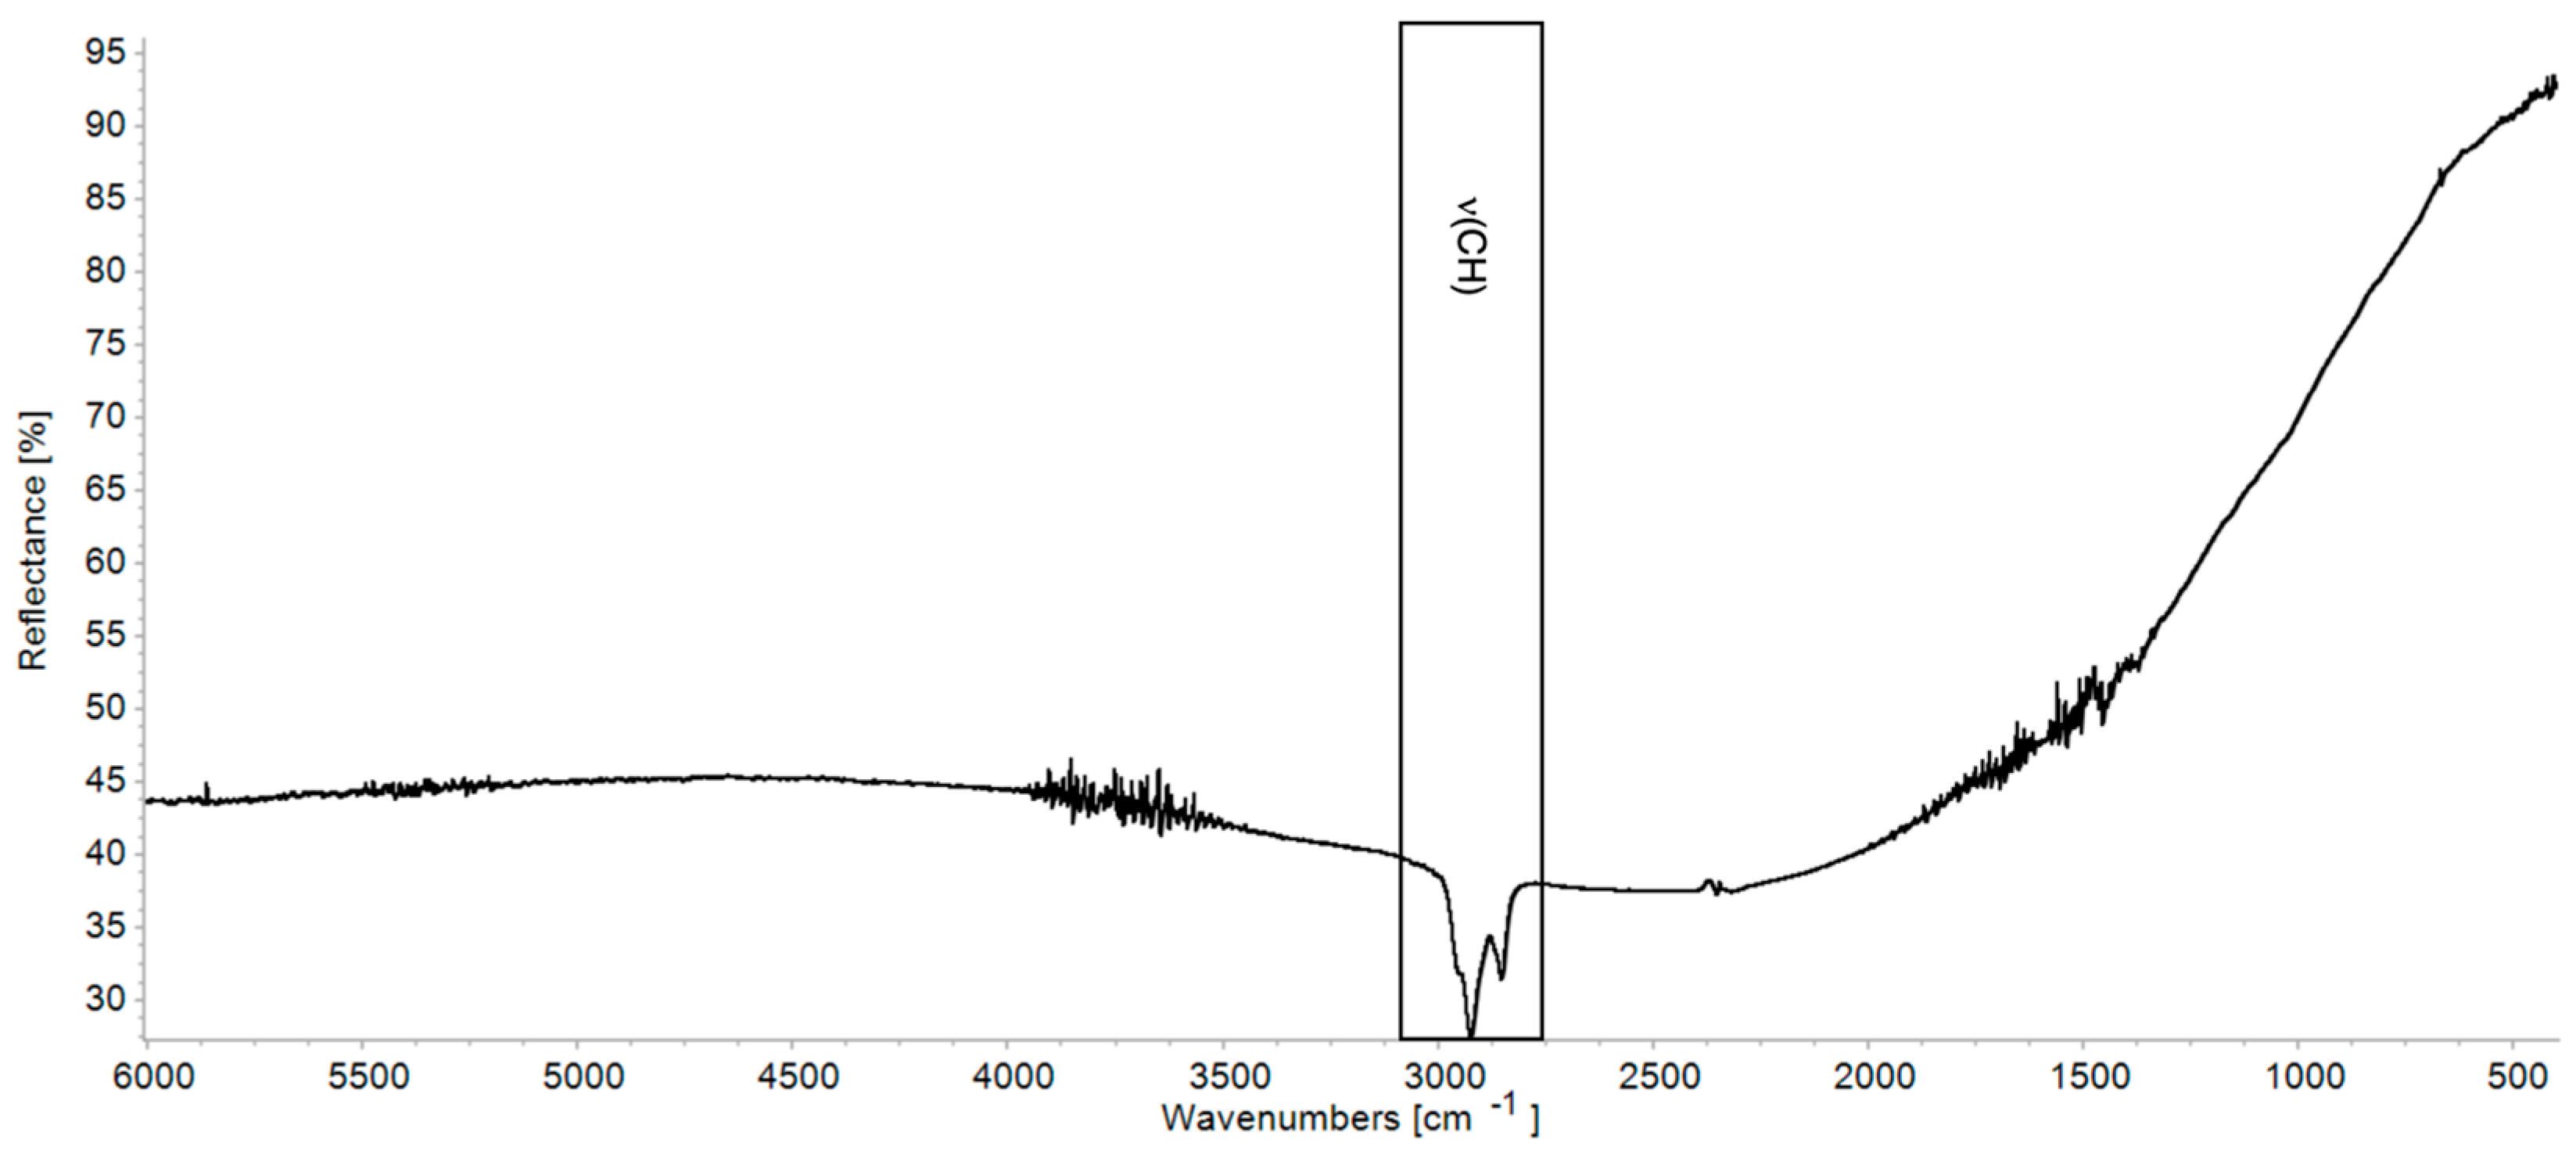
ER-FTIR analysis successfully classified oils, resins, and bitumen. Band assignments of pure standards are presented in Table 5. Spectra for linseed oil, mastic resin, and bitumen are shown in Figure 2, Figure 3, and Figure 4, respectively.
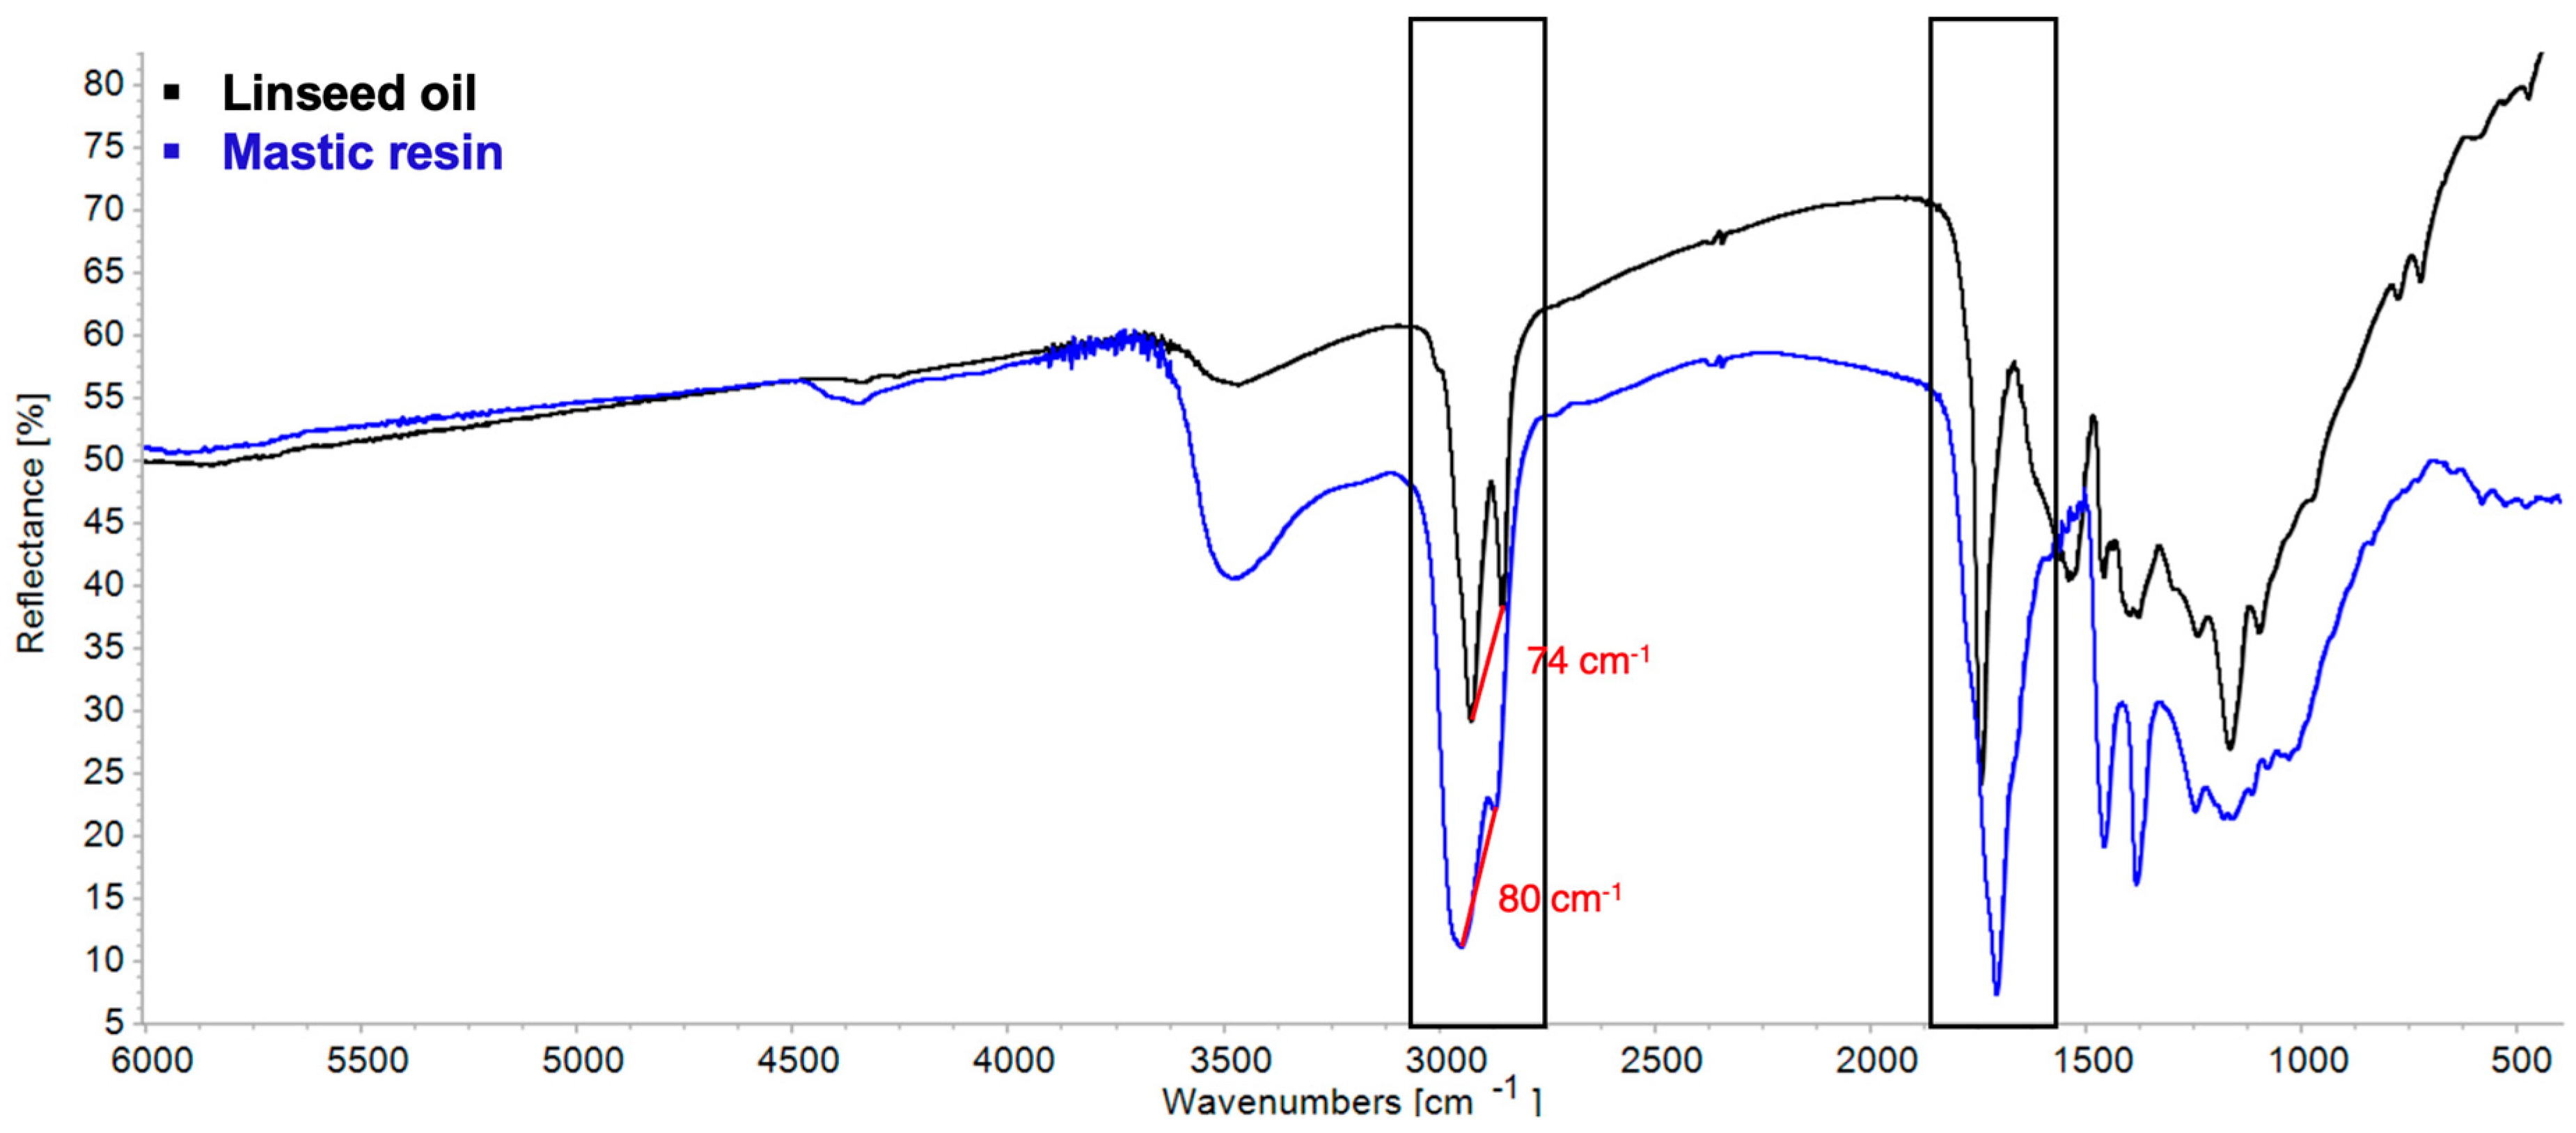
ER-FTIR spectra of pure standards shared absorptions, with only small, but noticeable shifts observed. For example, the doublet attributed to the symmetric and asymmetric stretching of C–H is broader for mastic resin than for linseed oil: 74 cm−1 separates the two absorptions of linseed oil, while 80 cm−1 separates those for mastic resin, as illustrated in Figure 5. This broadening and shifting, also evident in the νC=O absorptions at 1743 cm−1 for linseed oil and 1707 cm−1 for mastic, provides distinct visual, and numerical markers for two kinds of organic materials common to SOCs.
ER-FTIR analysis of bitumen was not informative as noise due to variation in humidity during readings interfered with absorptions in the 1800–1600 cm−1 region where characteristic ester, carboxylic acid, and ketone vibrations occur [43]. This part of the fingerprint region has been used to discriminate aging and to characterize physical and rheological properties [45] (p. 5507). Crude source and aging state significantly vary the composition of bitumen. ATR-ER-FTIR, combined with chemometric approaches such as principal component analysis, hierarchical cluster analysis, and linear discriminant analysis, has shown greater success [43,45].
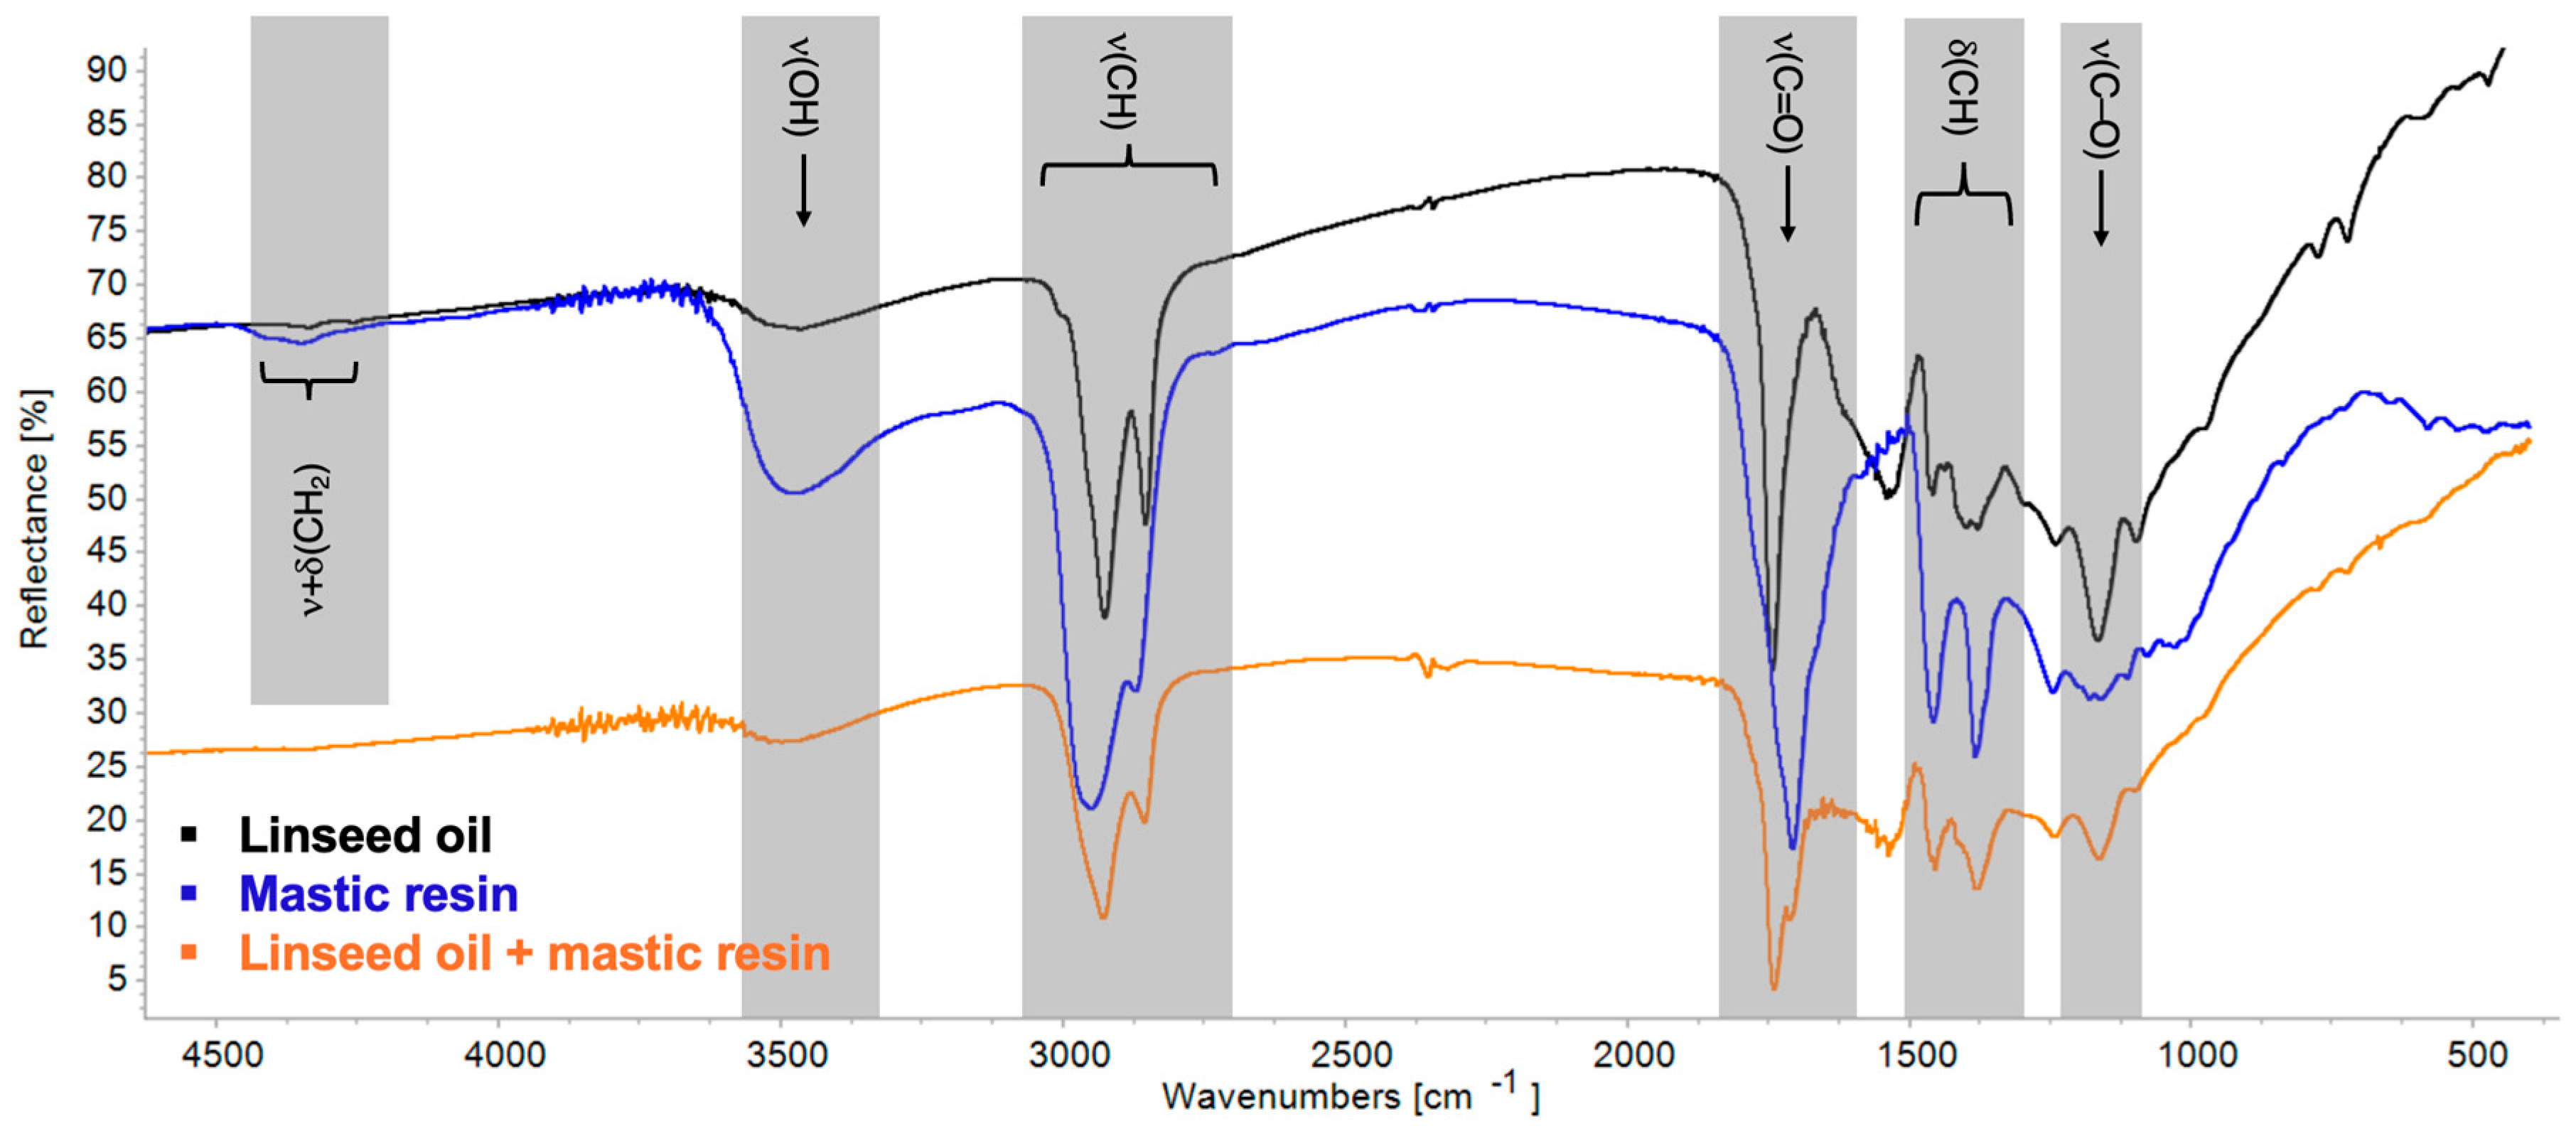
Instead, in the Renaissance, oil- or oil-resin-based varnishes were favored for producing hard, solvent-resistant coatings [2]. Despite the historical prevalence of oleoresinous mixtures, no previously published spectral data for such blends could be identified. This study demonstrates that mixture identification can be approached through characteristic peak addition and shifts in spectra. For example, the νC=O absorptions for linseed oil and mastic resin appear as single peaks at 1743 cm−1 and 1707 cm−1, respectively, but in the linseed–mastic blend, they appear as a broadened doublet at 1739 cm−1 and 1711 cm−1 (Figure 6). Additional peak changes for the linseed–mastic blend are summarized in Table 6. This additive behaviour, combined with shifts and changes in peak intensity or width, can indicate the presence of multiple components.
However, distinguishing blends is not always straightforward. Many organic materials, particularly drying oils and natural resins, share functional groups and produce overlapping spectral features depending on composition, degree of aging, or molecular environment. In blended spectra, this can result in band broadening, shoulders, or minor shifts rather than discrete new peaks. For this reason, interpretation relies heavily on well-characterized reference spectra and direct comparison of expected features. Ultimately, a pattern-recognition approach, guided by spectral comparison and contextual knowledge of historically plausible materials, must be taken. While it may not be possible to discriminate the exact composition of the SOC, general classification is plausible, especially when supported by complementary techniques such as FORS, discussed in the next subsection.

3.2. FORS

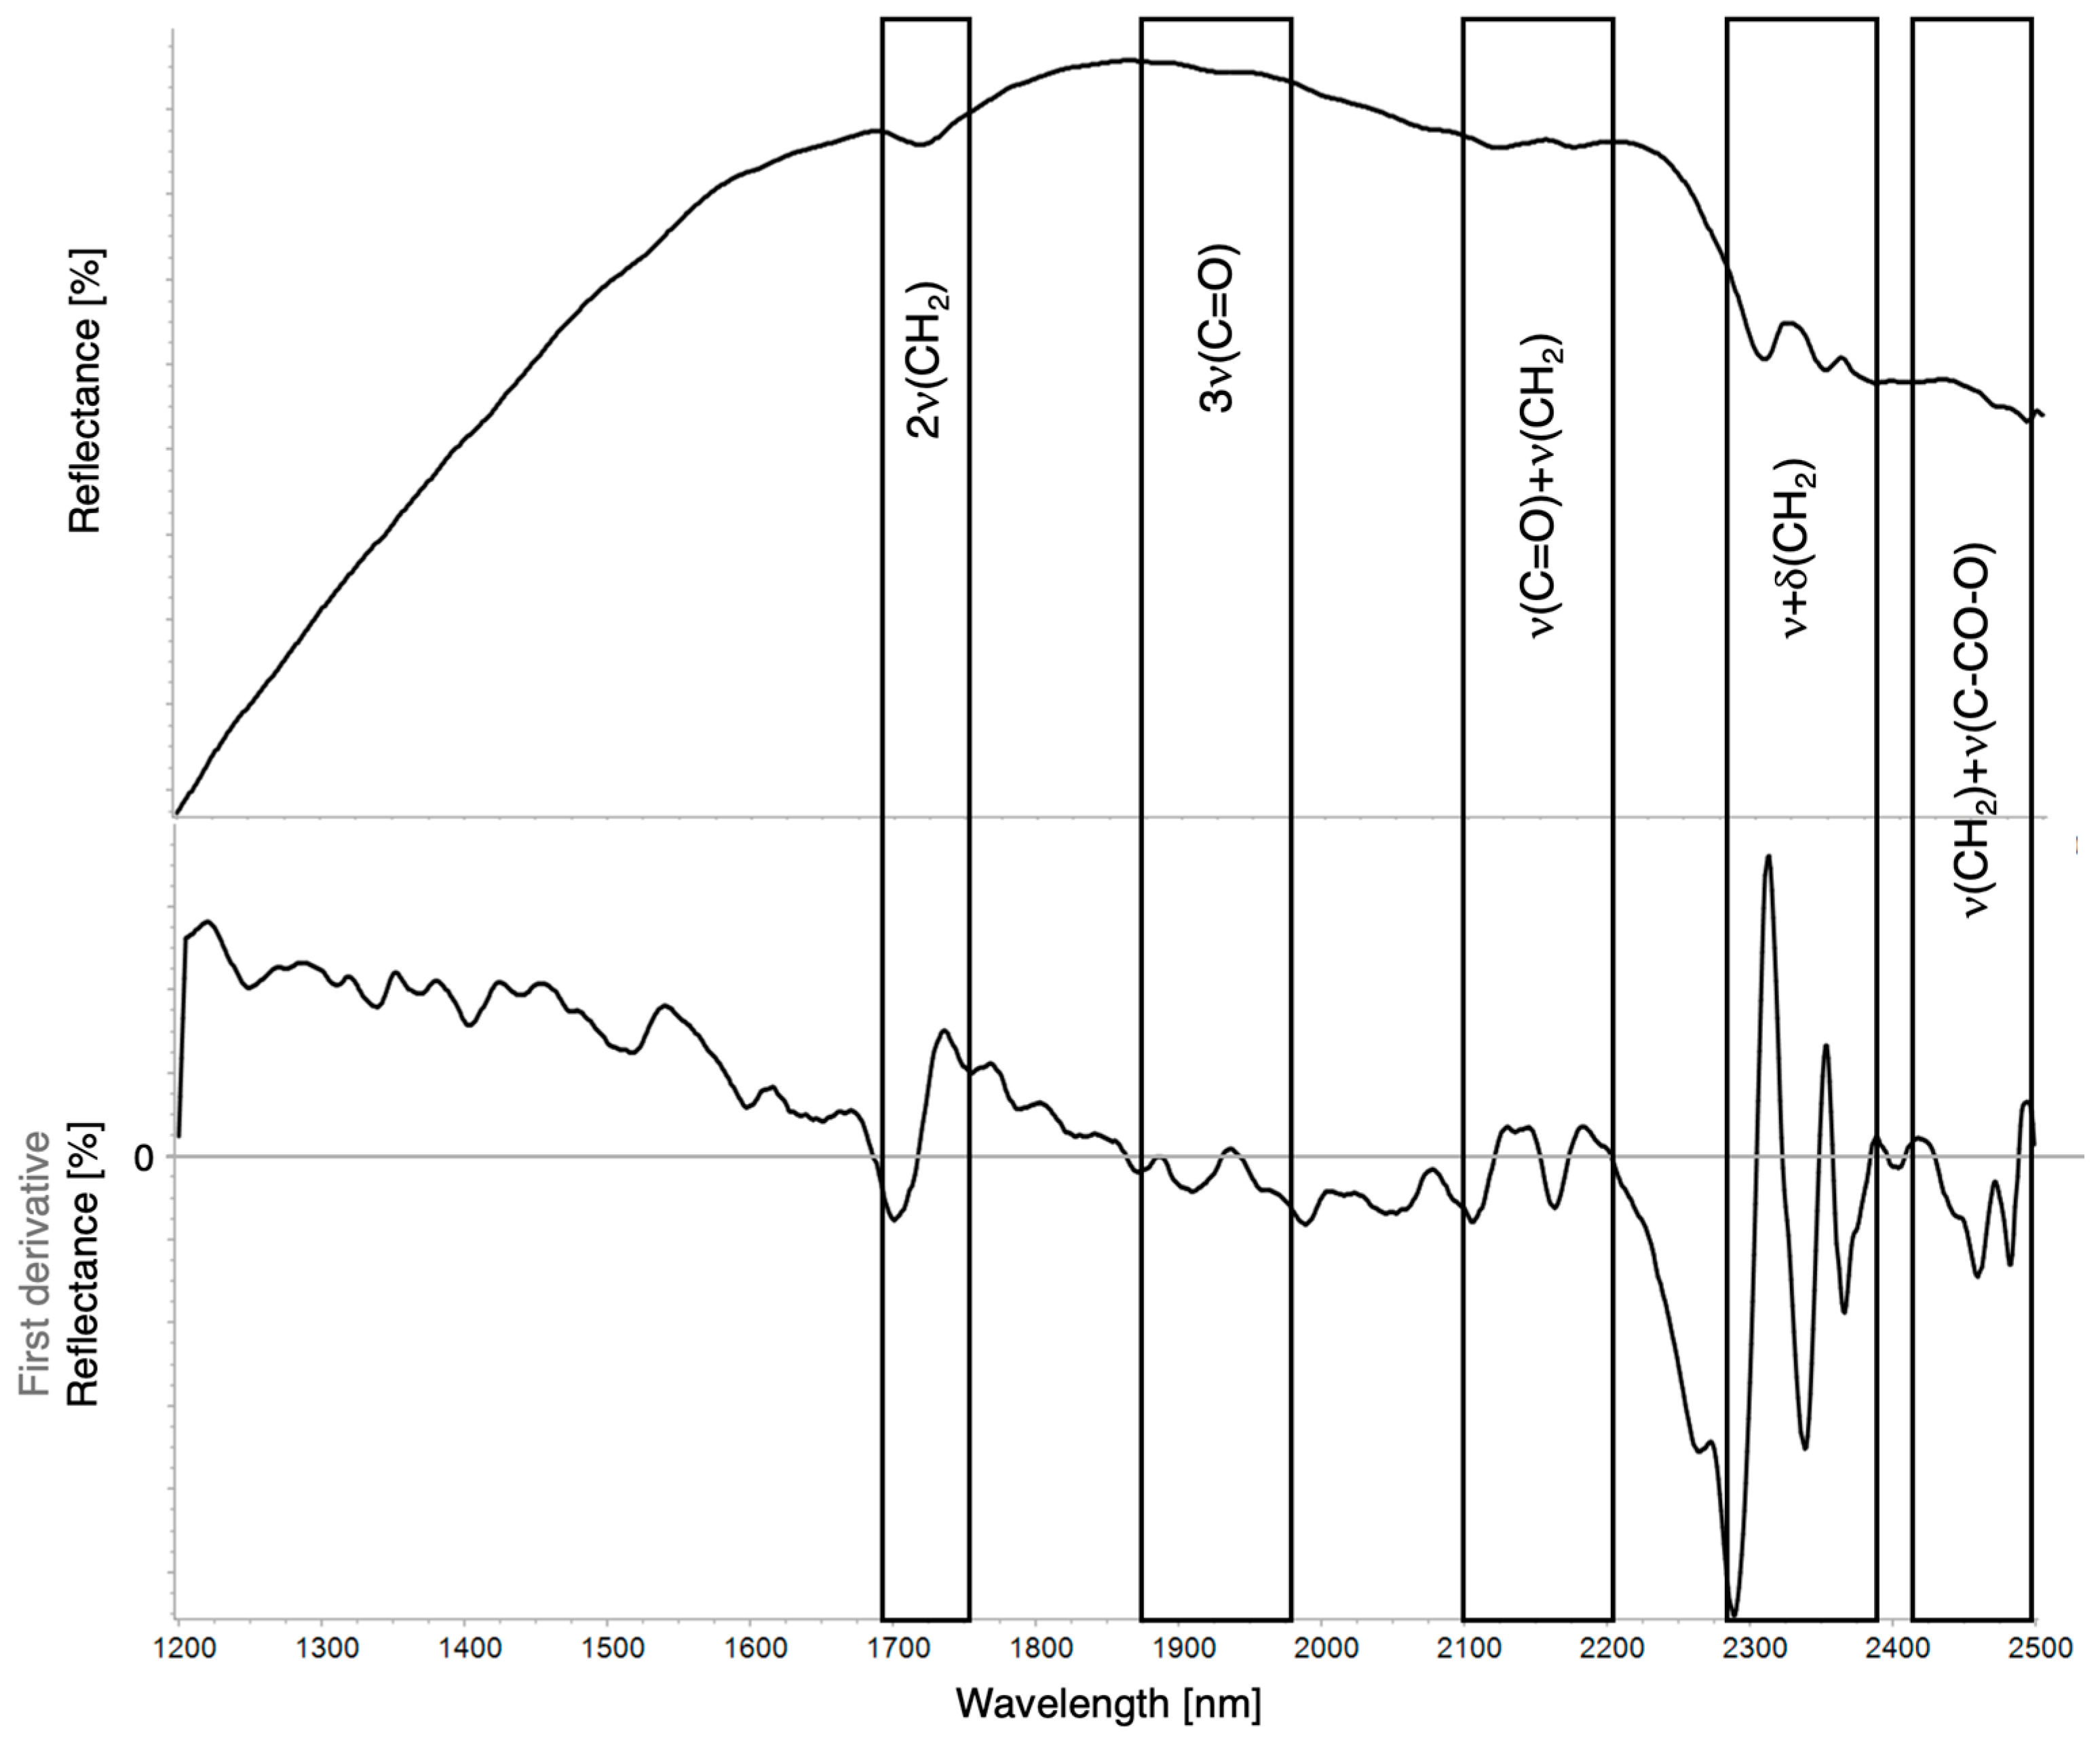
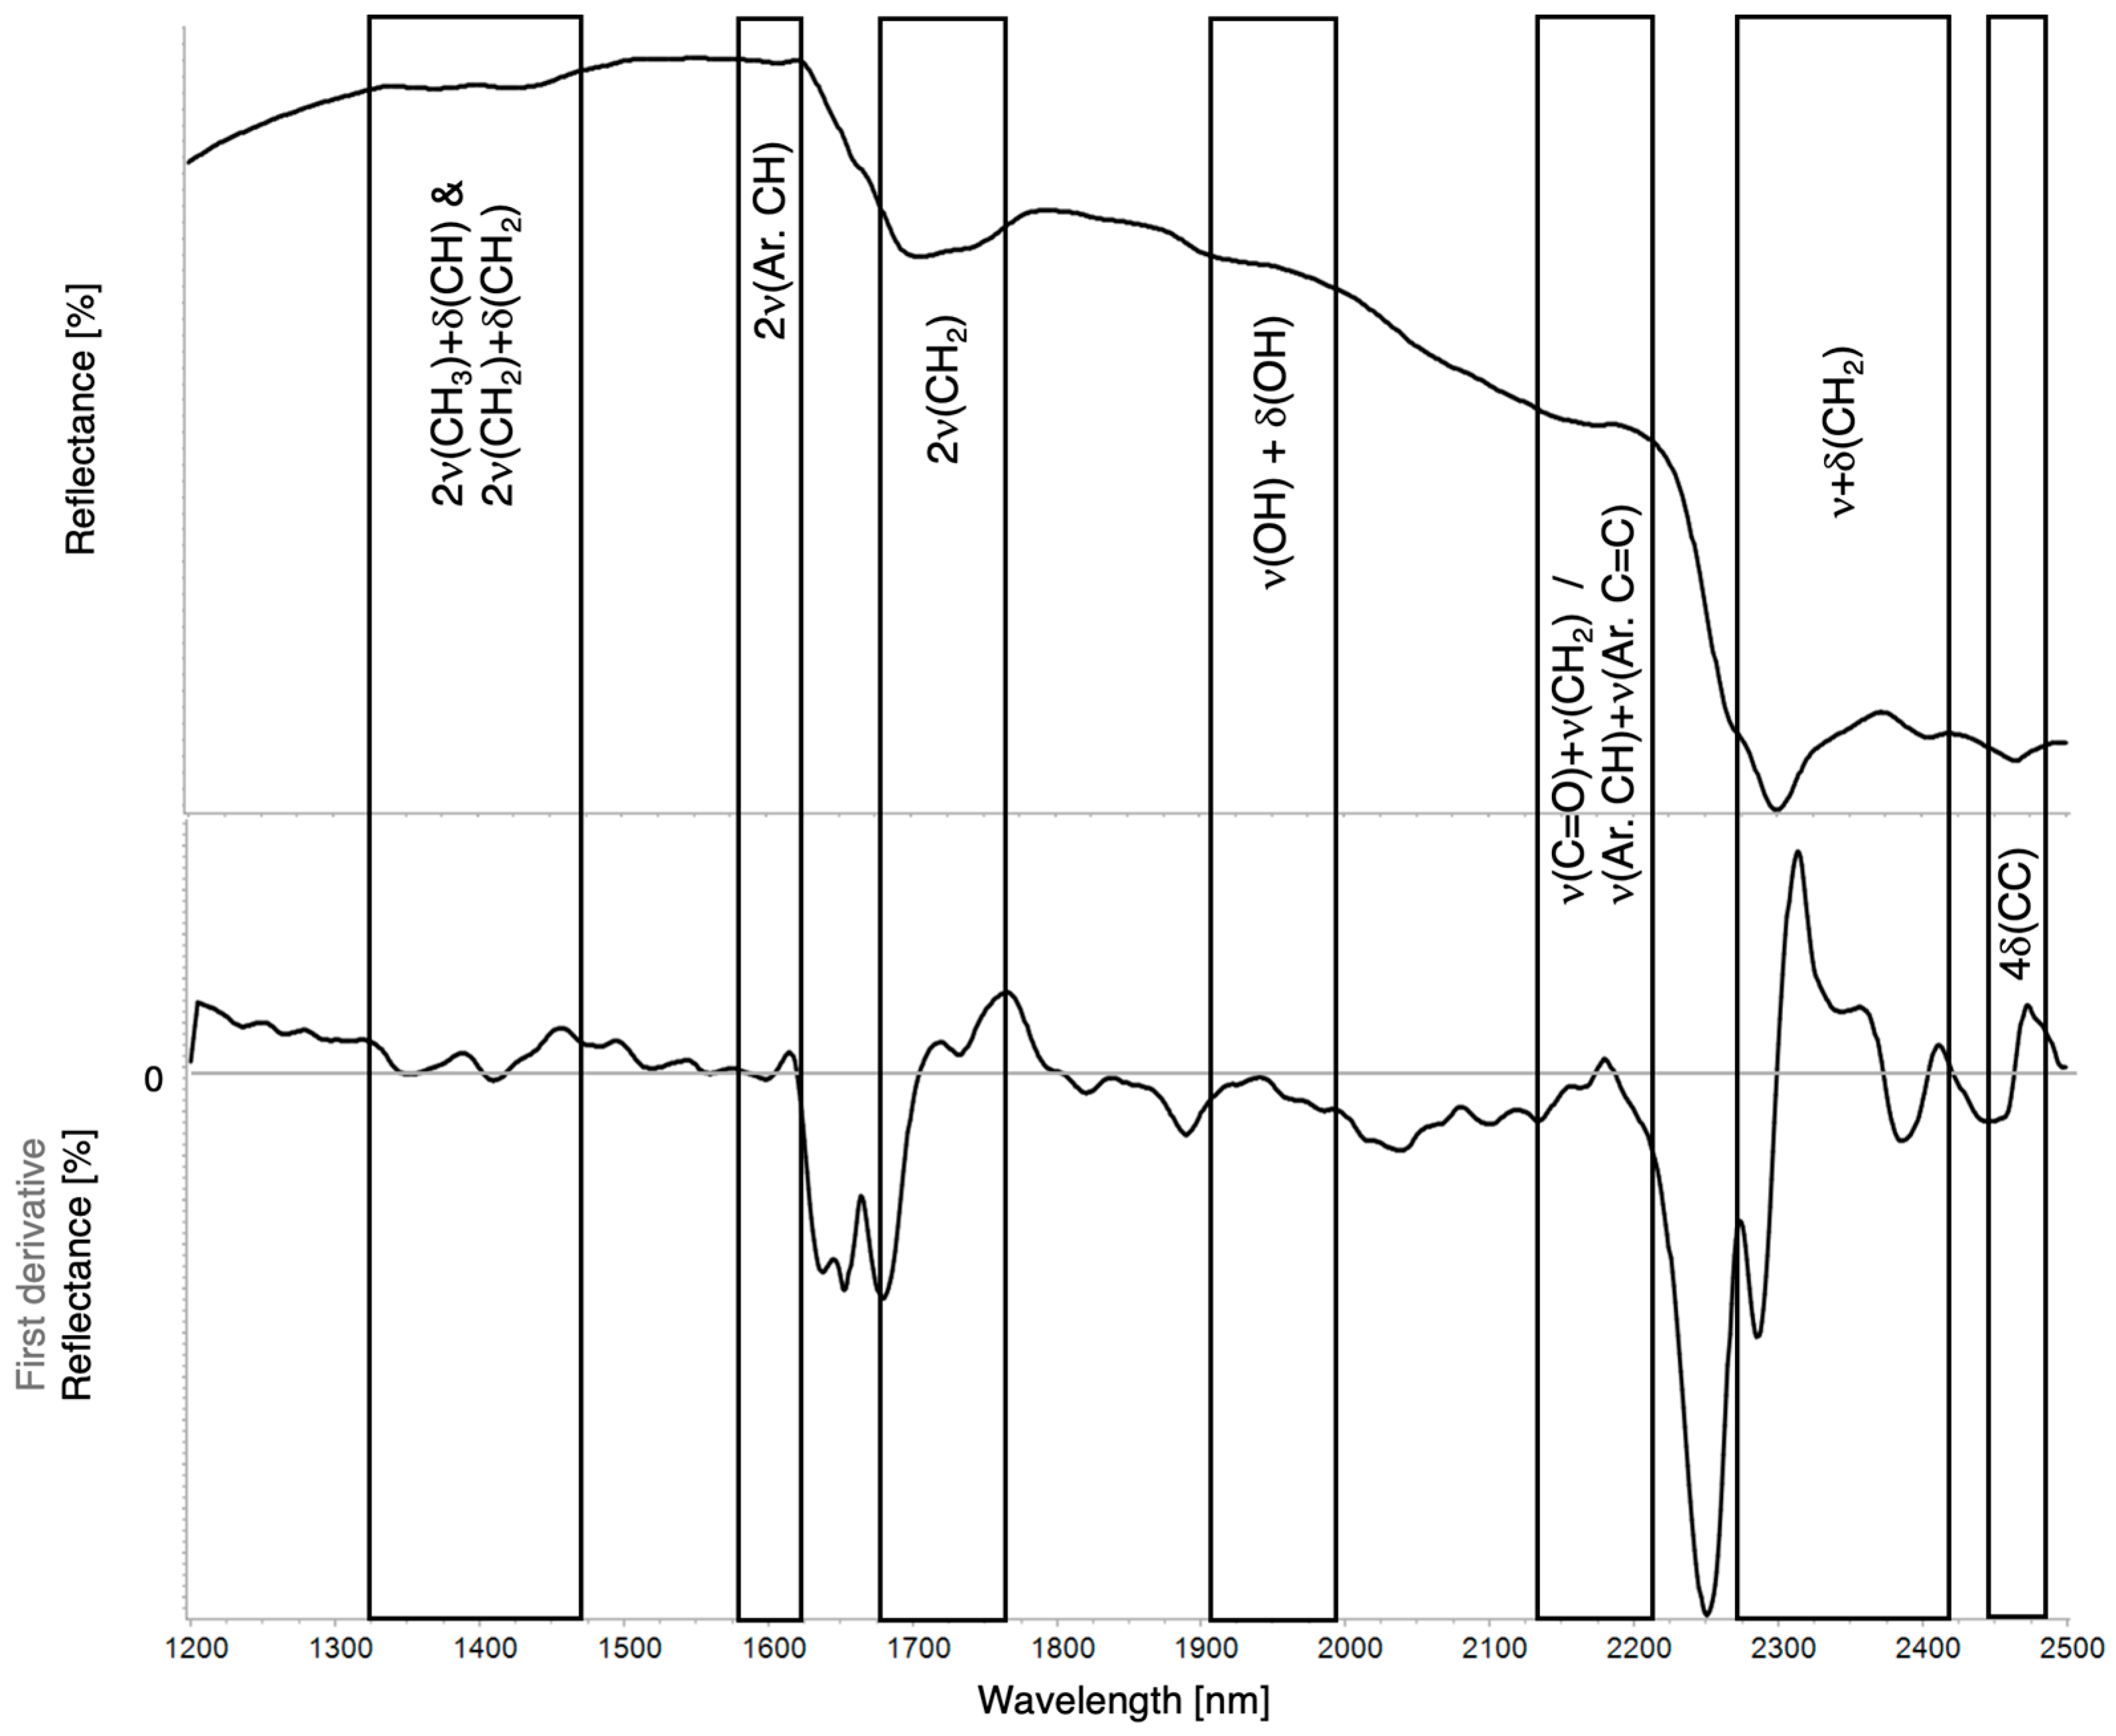
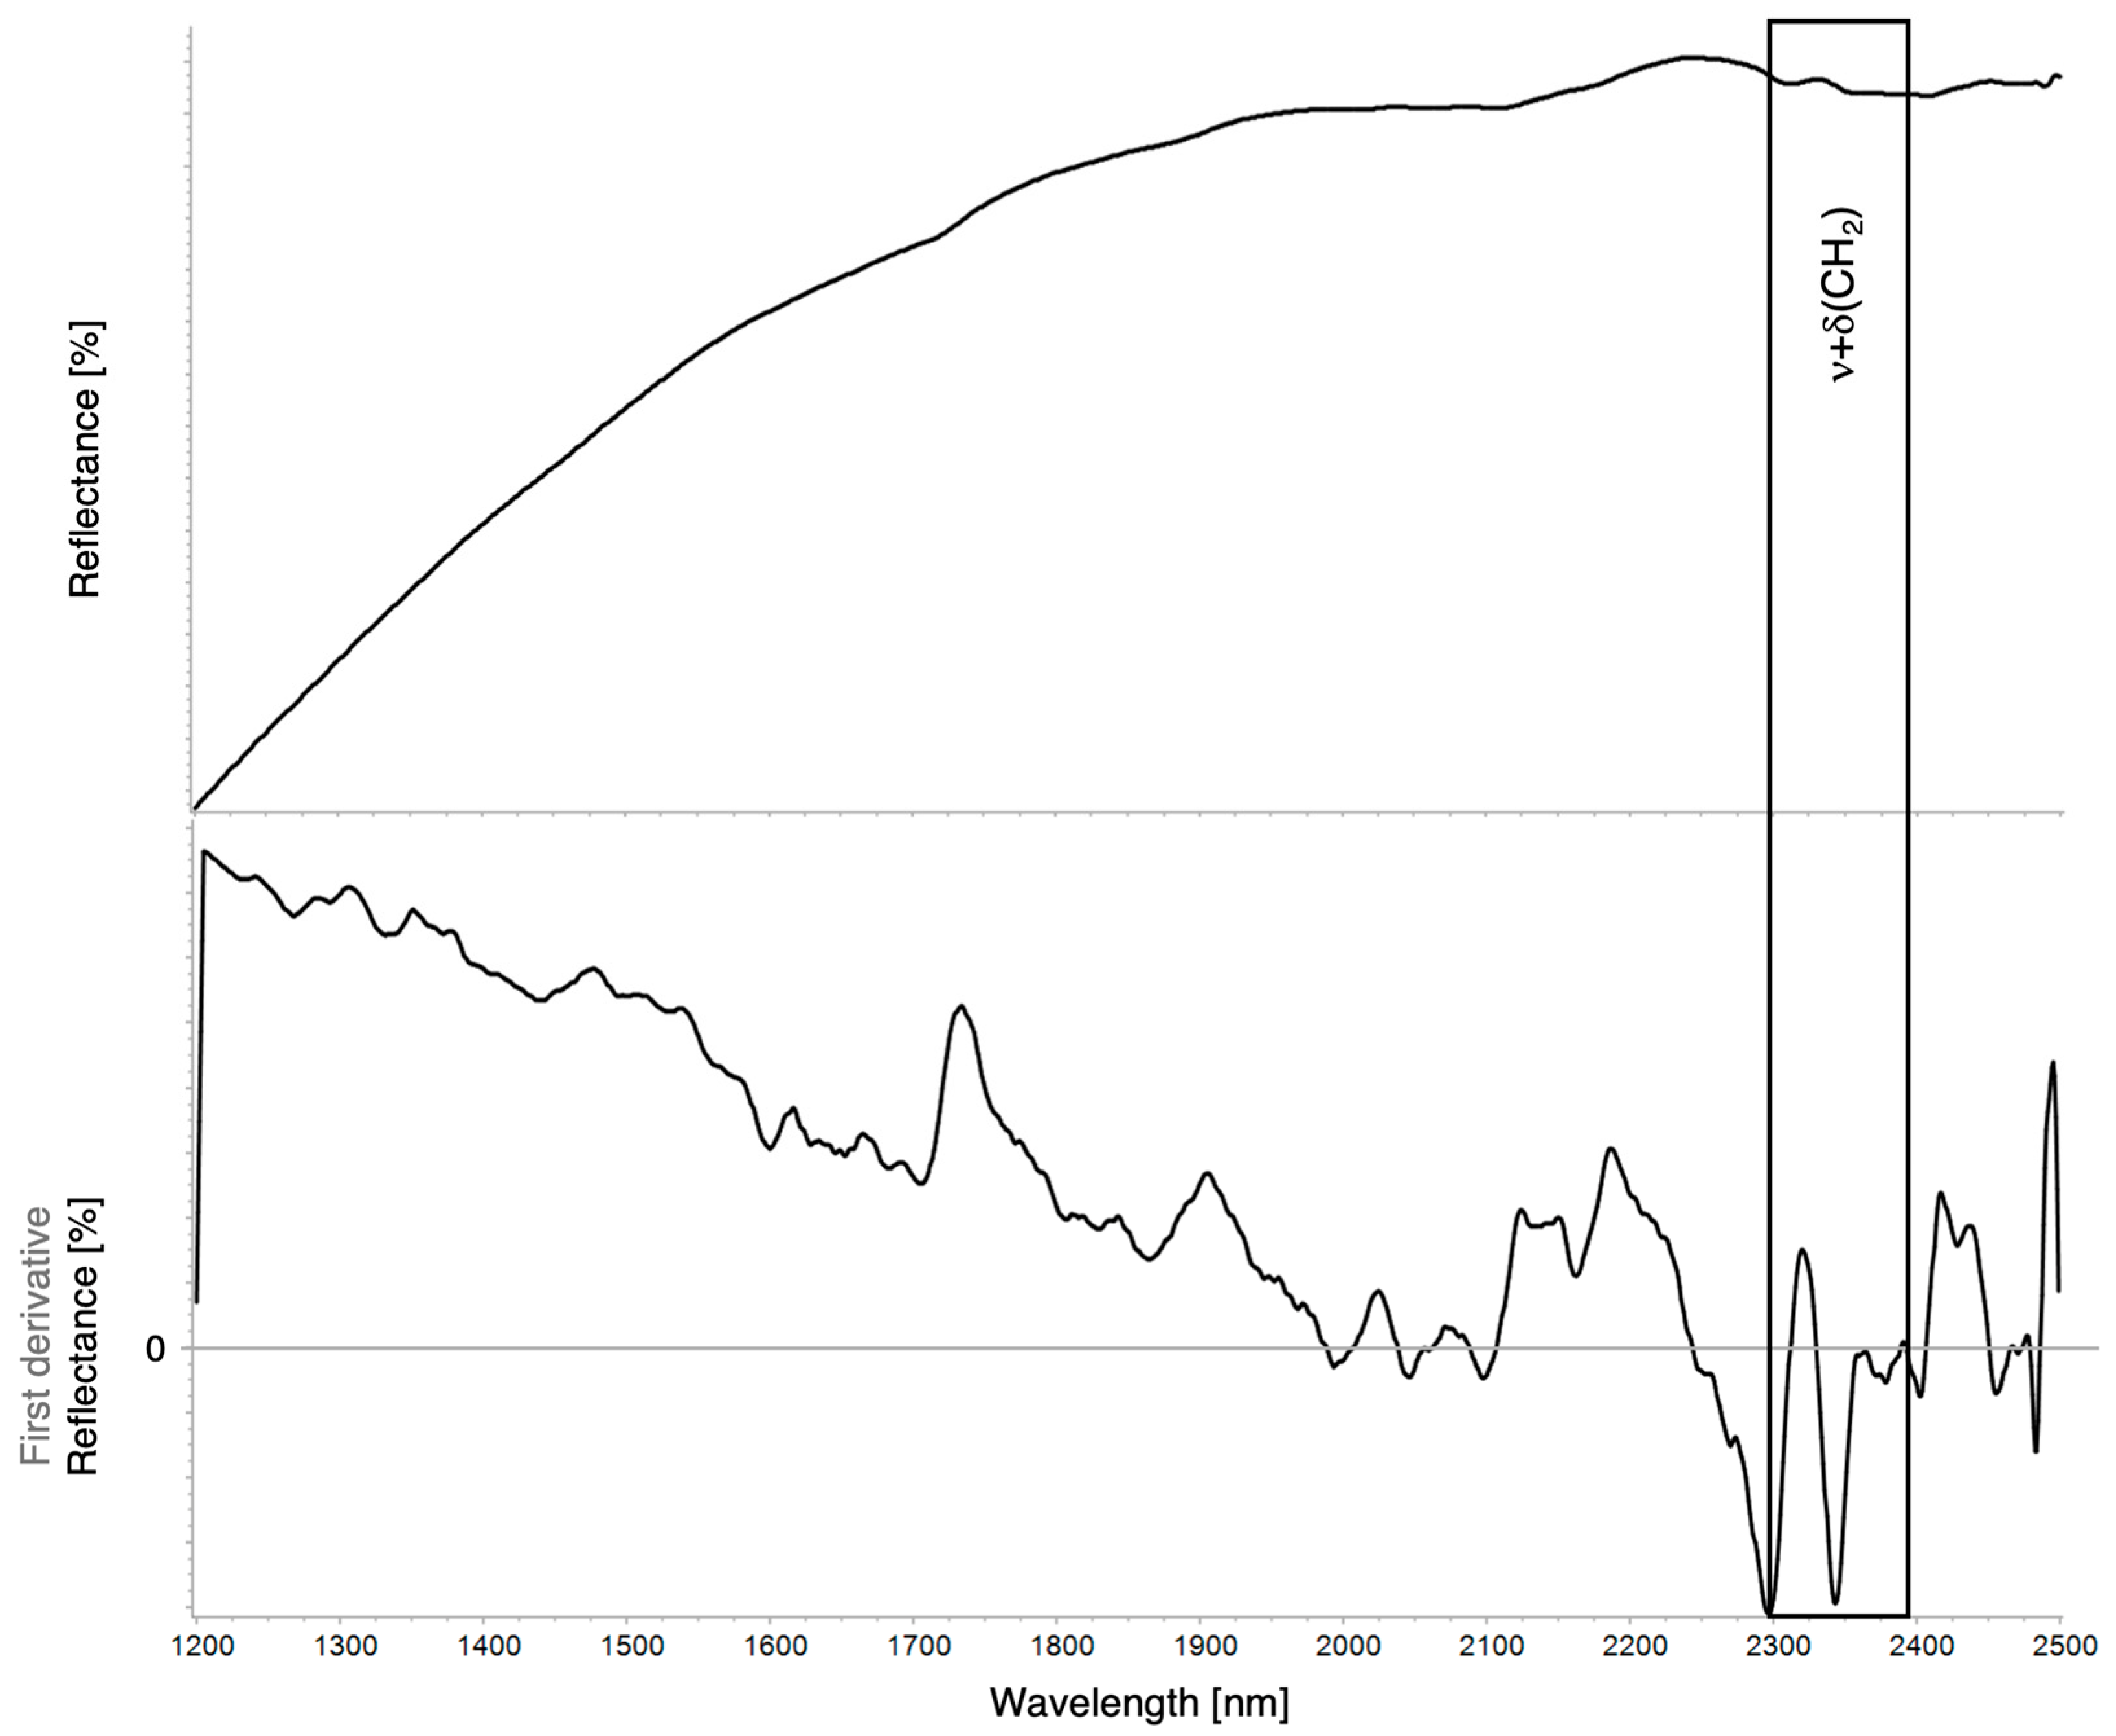
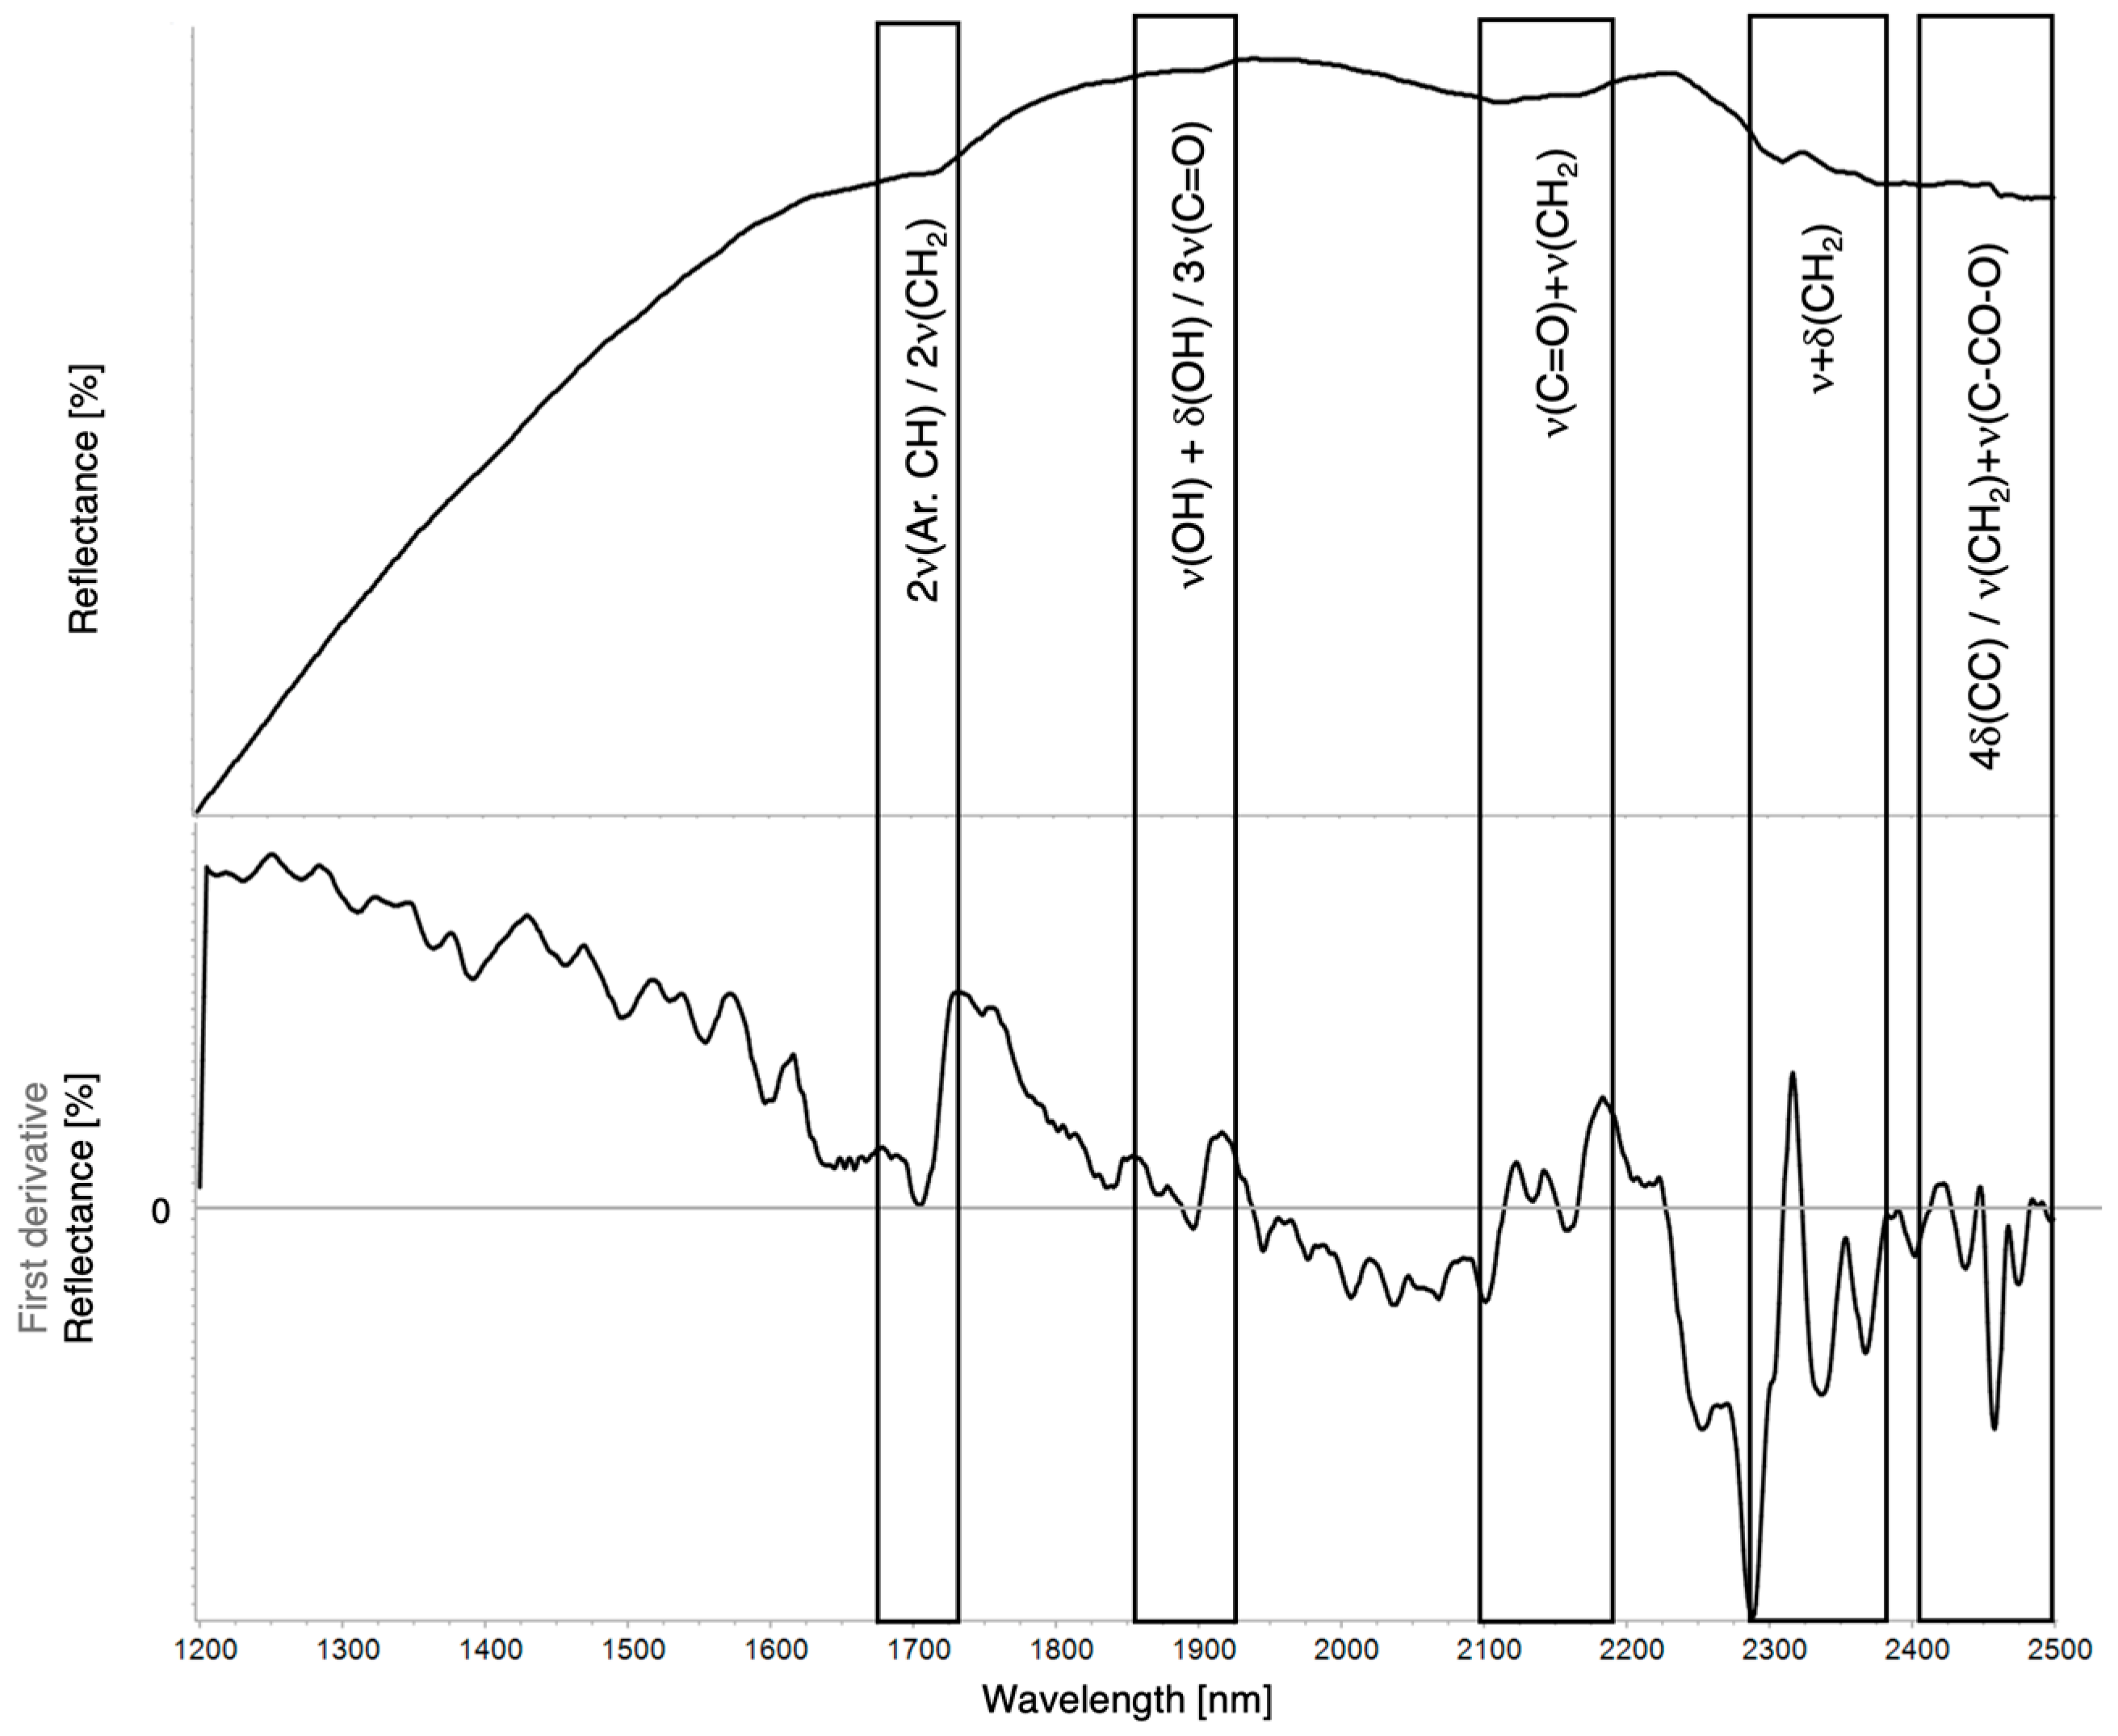
FORS analysis successfully classified oils, resins, and bitumen. Band assignments of pure standards are presented in Table 7. Spectra for linseed oil, mastic resin, and bitumen are shown in Figure 7, Figure 8, and Figure 9, respectively. Given the broad and overlapping nature of overtone and combination bands in the SWIR, traditional interpretation of raw reflectance spectra can be challenging. To address this, the first derivative with respect to the wavelength of the FORS spectra was calculated. Derivative analysis minimizes baseline shifts and intensity variations, enhances the resolution of sharper spectral features, and helps differentiate subtle changes that would otherwise be obscured.
Characteristic methylenic C–H stretching and bending combination bands (νa+s(CH2) + δ(CH2)) appear as doublets around 2300 nm for all organic reference materials. First overtone bands (2ν) of CH2 were also identified for all materials except bitumen, while second overtone (3ν) bands, expected around 1200 nm, were not detected due to limited spectral resolution in this range. Although minor shifts were observed between linseed and walnut oils, their reflectance spectra were too similar to distinguish. By contrast, Amato et al. (2020) differentiated linseed and poppy seed oils using statistical analysis of FORS and diffuse reflectance imaging spectroscopy in the SWIR, particularly at the first overtone of CH2 groups (~1700 nm) [48].
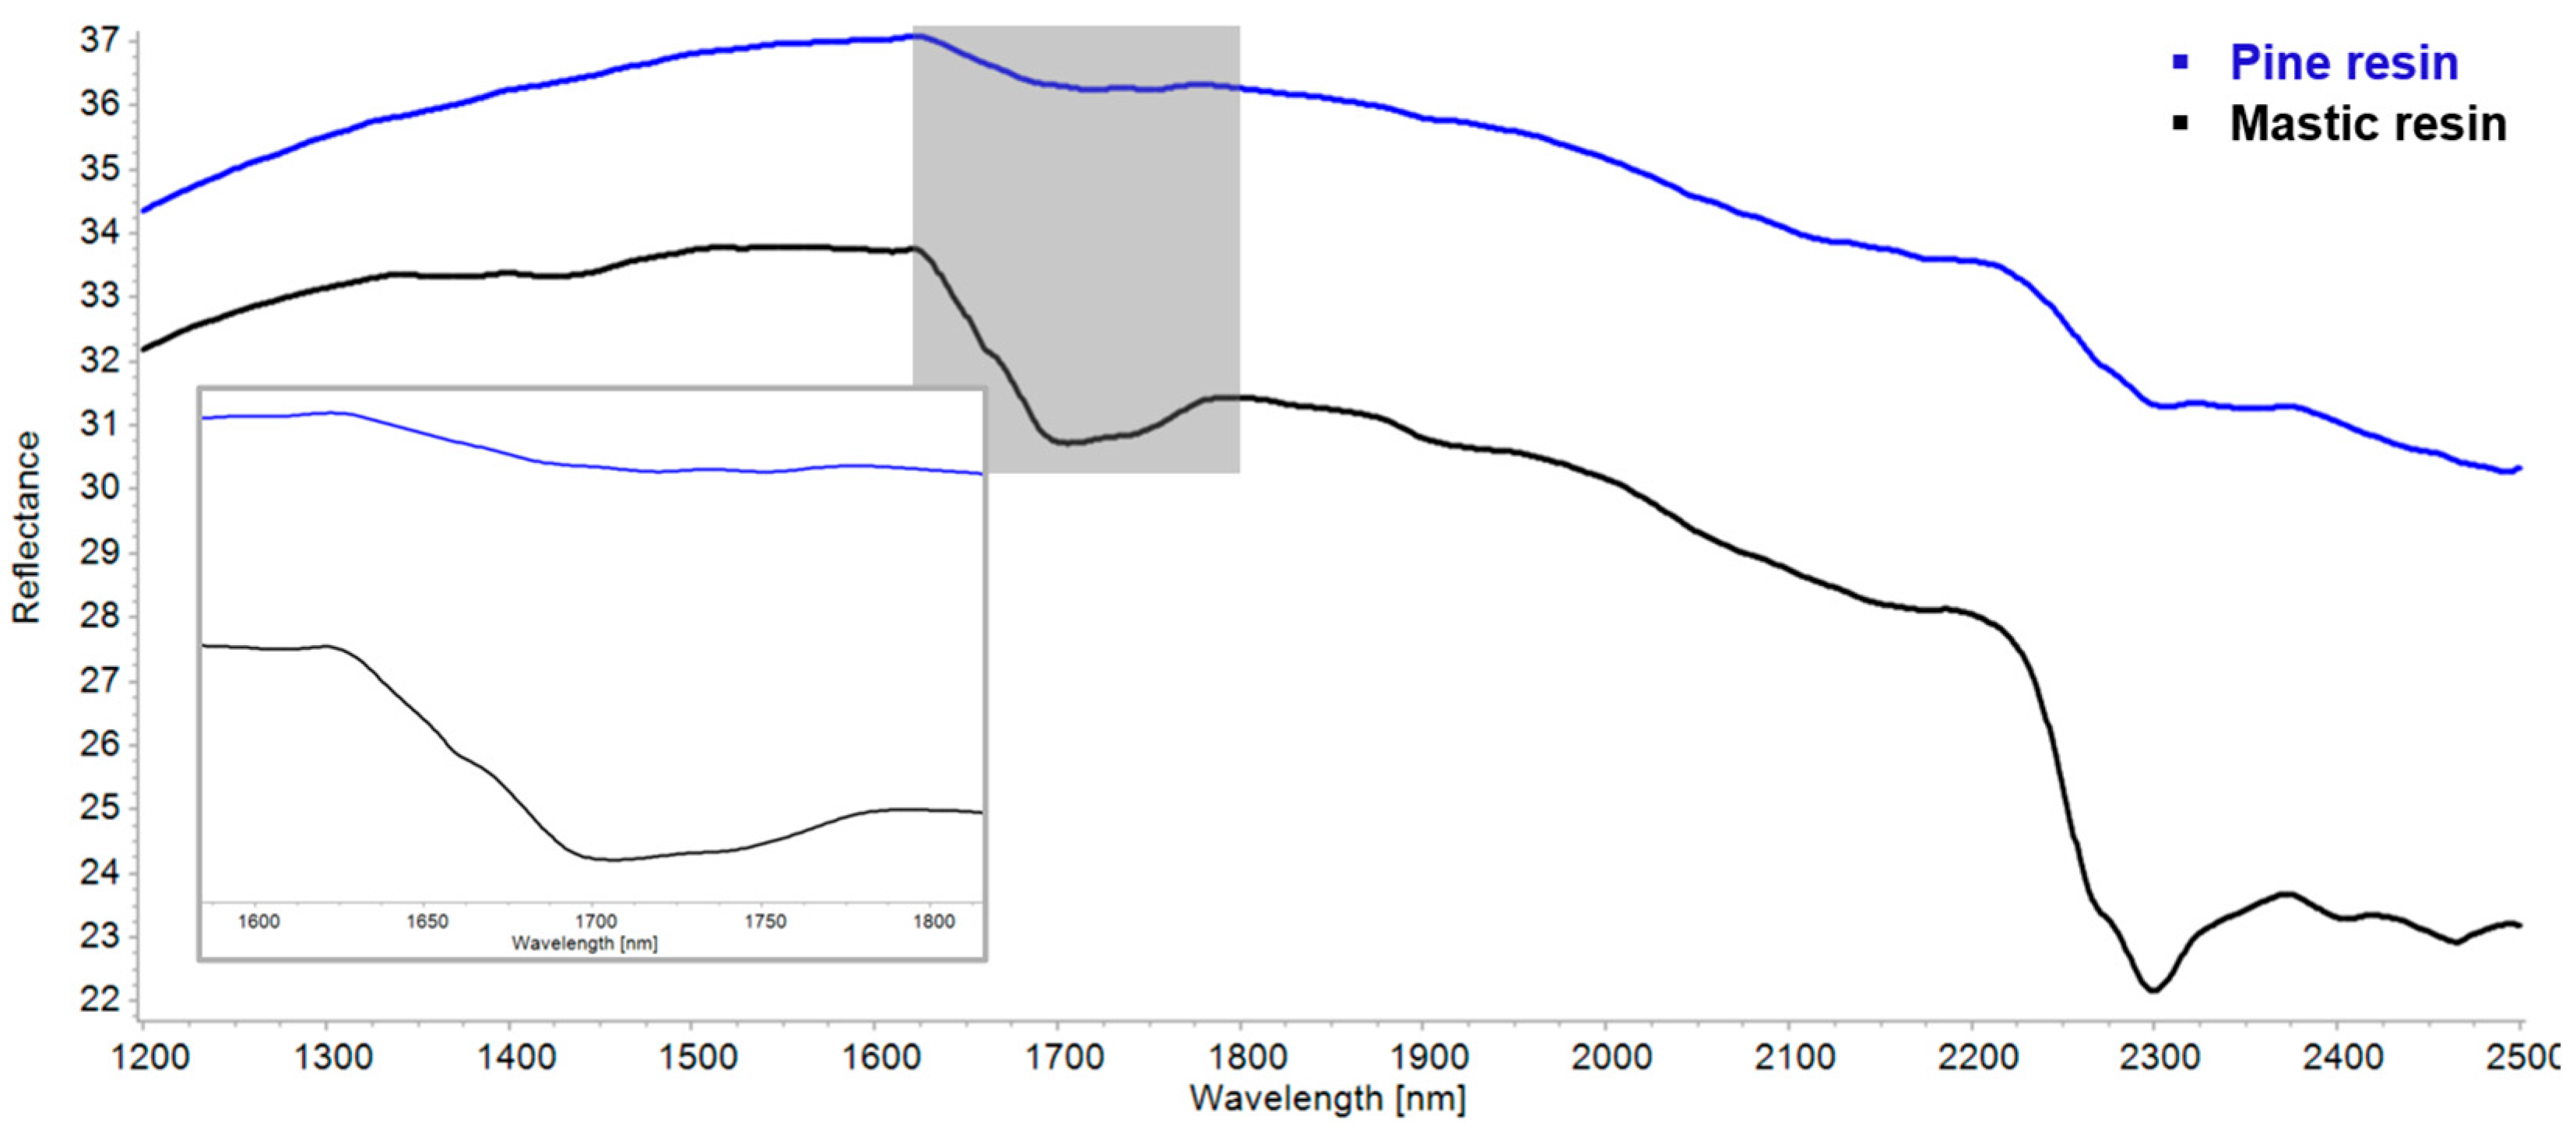
The distinction between mastic and pine resin in this study follows Vagnini et al. (2009), who grouped natural resins in the NIR into two classes based on terpenoid composition [25]. Diterpenoid resins (pine, turpentine, colophony, sandarac, copal) show a resolved doublet in the methylenic stretching and bending overtone region (5600–6000 cm−1; 1786–1667 nm), while triterpenoid resins (mastic, dammar) display a single broad, unresolved band [25] (pp. 2111–2112). In this analysis, pine resin presented only a subtle doublet rather than a strongly resolved one, whereas mastic showed a broad, convoluted shoulder (Figure 10). Though subtle, these spectral differences provide a reproducible way to distinguish mastic from pine in the SWIR range.
Like ER-FTIR results, band assignment for bitumen was limited. Although some major features associated with aromatic C–H stretching and C–O carbonyl vibrations were identified in the literature [49,50], only the strong doublet near 2311 and ~2350 nm could be assigned. Additional absorptions near 2000–2100 nm could not be conclusively attributed.
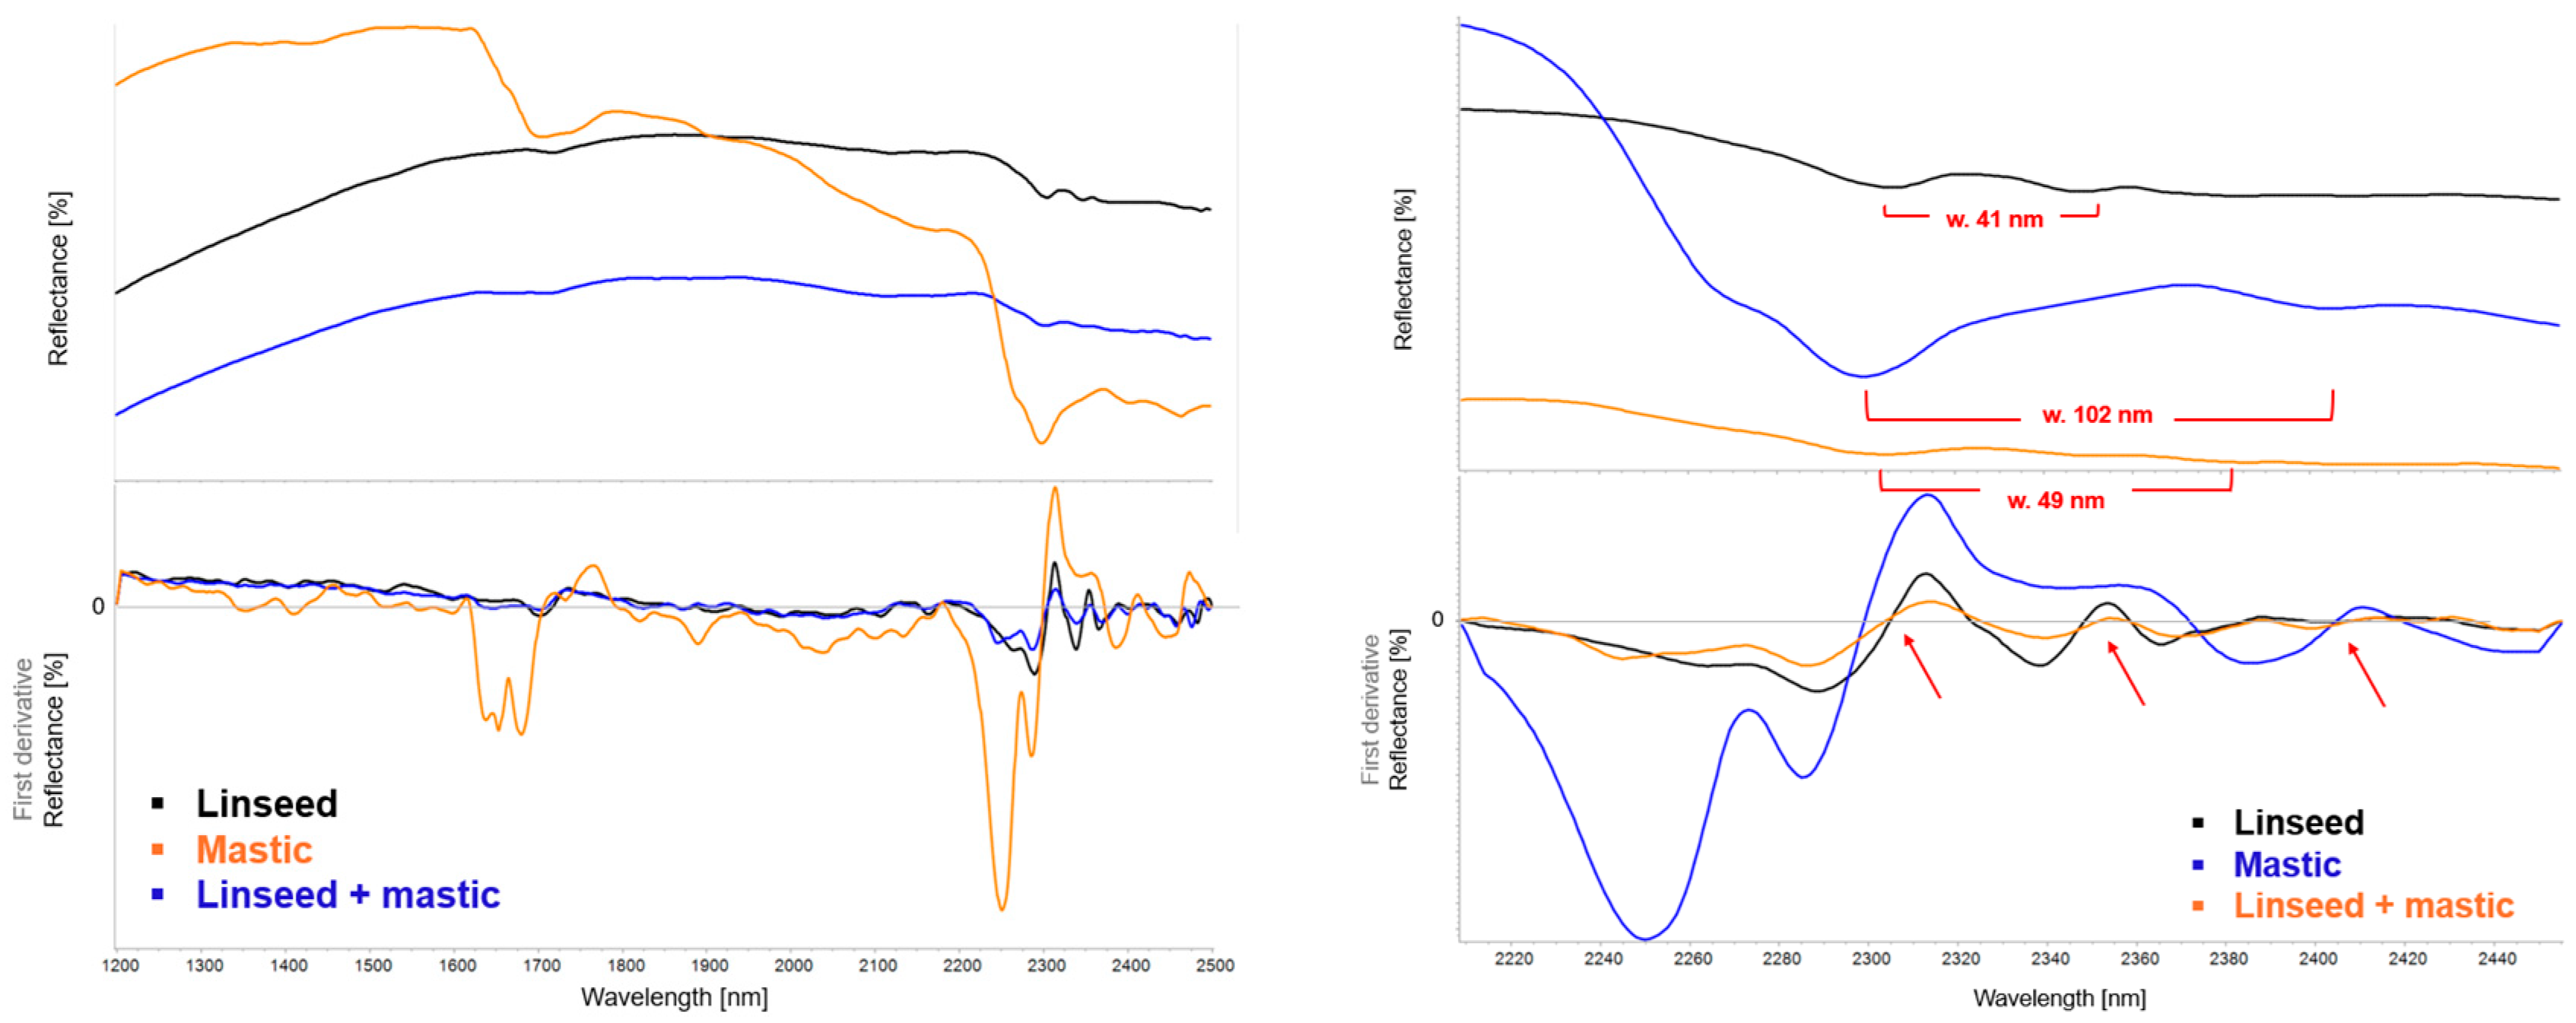
Regarding the spectra of blended SOCs, changes in peak width, position, and the appearance of combination features in the FORS spectra can indicate the presence of multi-component SOCs. For example, the methylenic C–H combination bands at 2306 nm and 2347 nm in linseed oil (41 nm wide) and at 2299 nm and 2401 nm in mastic resin (102 nm wide) combine in the linseed–mastic mixture to appear at 2300 nm and 2349 nm (49 nm wide), with additional shoulders preserved from the resin (Figure 11). A similar effect was discussed for ER-FTIR previously.
However, in even more complex mixtures, such as walnut–mastic–pine–bitumen (Figure 12), spectral specificity decreases significantly. Individual components become practically impossible to distinguish. This is primarily due to spectral congestion and overlap interference, where overlapping absorptions from multiple organic constituents cause broad, merged bands that obscure distinct features. Band broadening and weakening is observed, as the additive effects of small shifts and variations in peak position from each component accumulate. Moreover, chemical interactions between components, such as hydrogen bonding or physical blending, may contribute to additional band shifts and increased spectral congestion. While discrete identification of each material is not feasible in these mixtures, the presence of broad features, shoulders, and increased spectral complexity itself serves as an important diagnostic indicator of a multi-component SOC. Recognizing such complexity is essential when interpreting historical coatings, where layered or blended recipes were often employed to achieve specific visual and functional properties.

3.3. Re-Coating/Overcoating

Small Renaissance bronzes, especially those made for domestic settings, were routinely waxed or polished, often in response to changing collector preferences. Once bronzes entered museum collections, they could be subjected to conservation treatments, with wax and shellac being the most frequently applied materials, used to even out visible damage and wear.
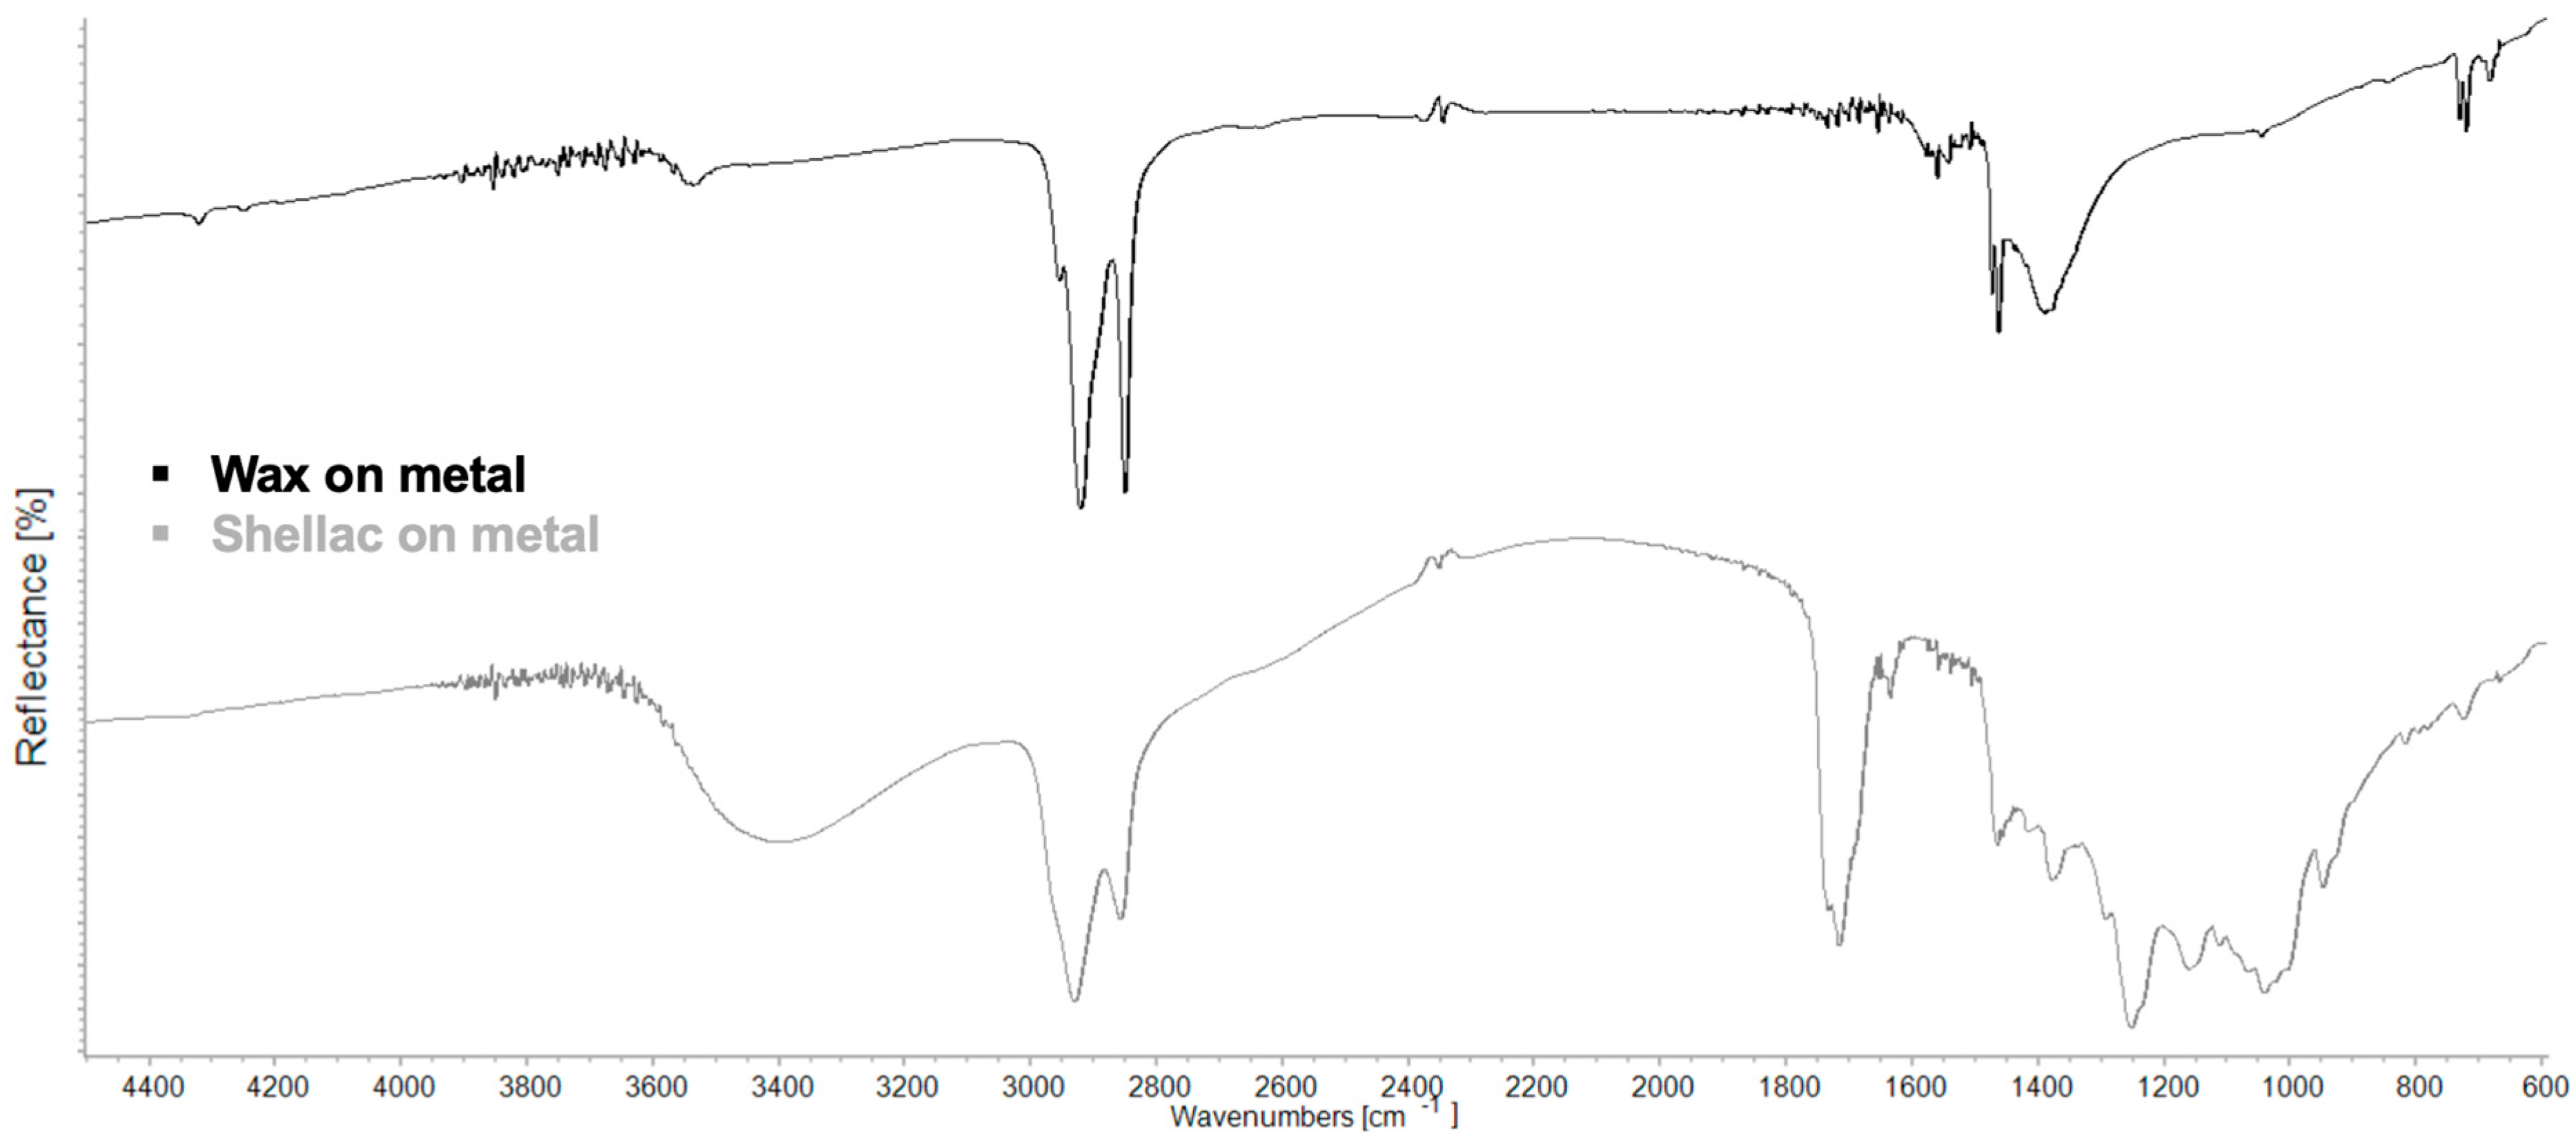
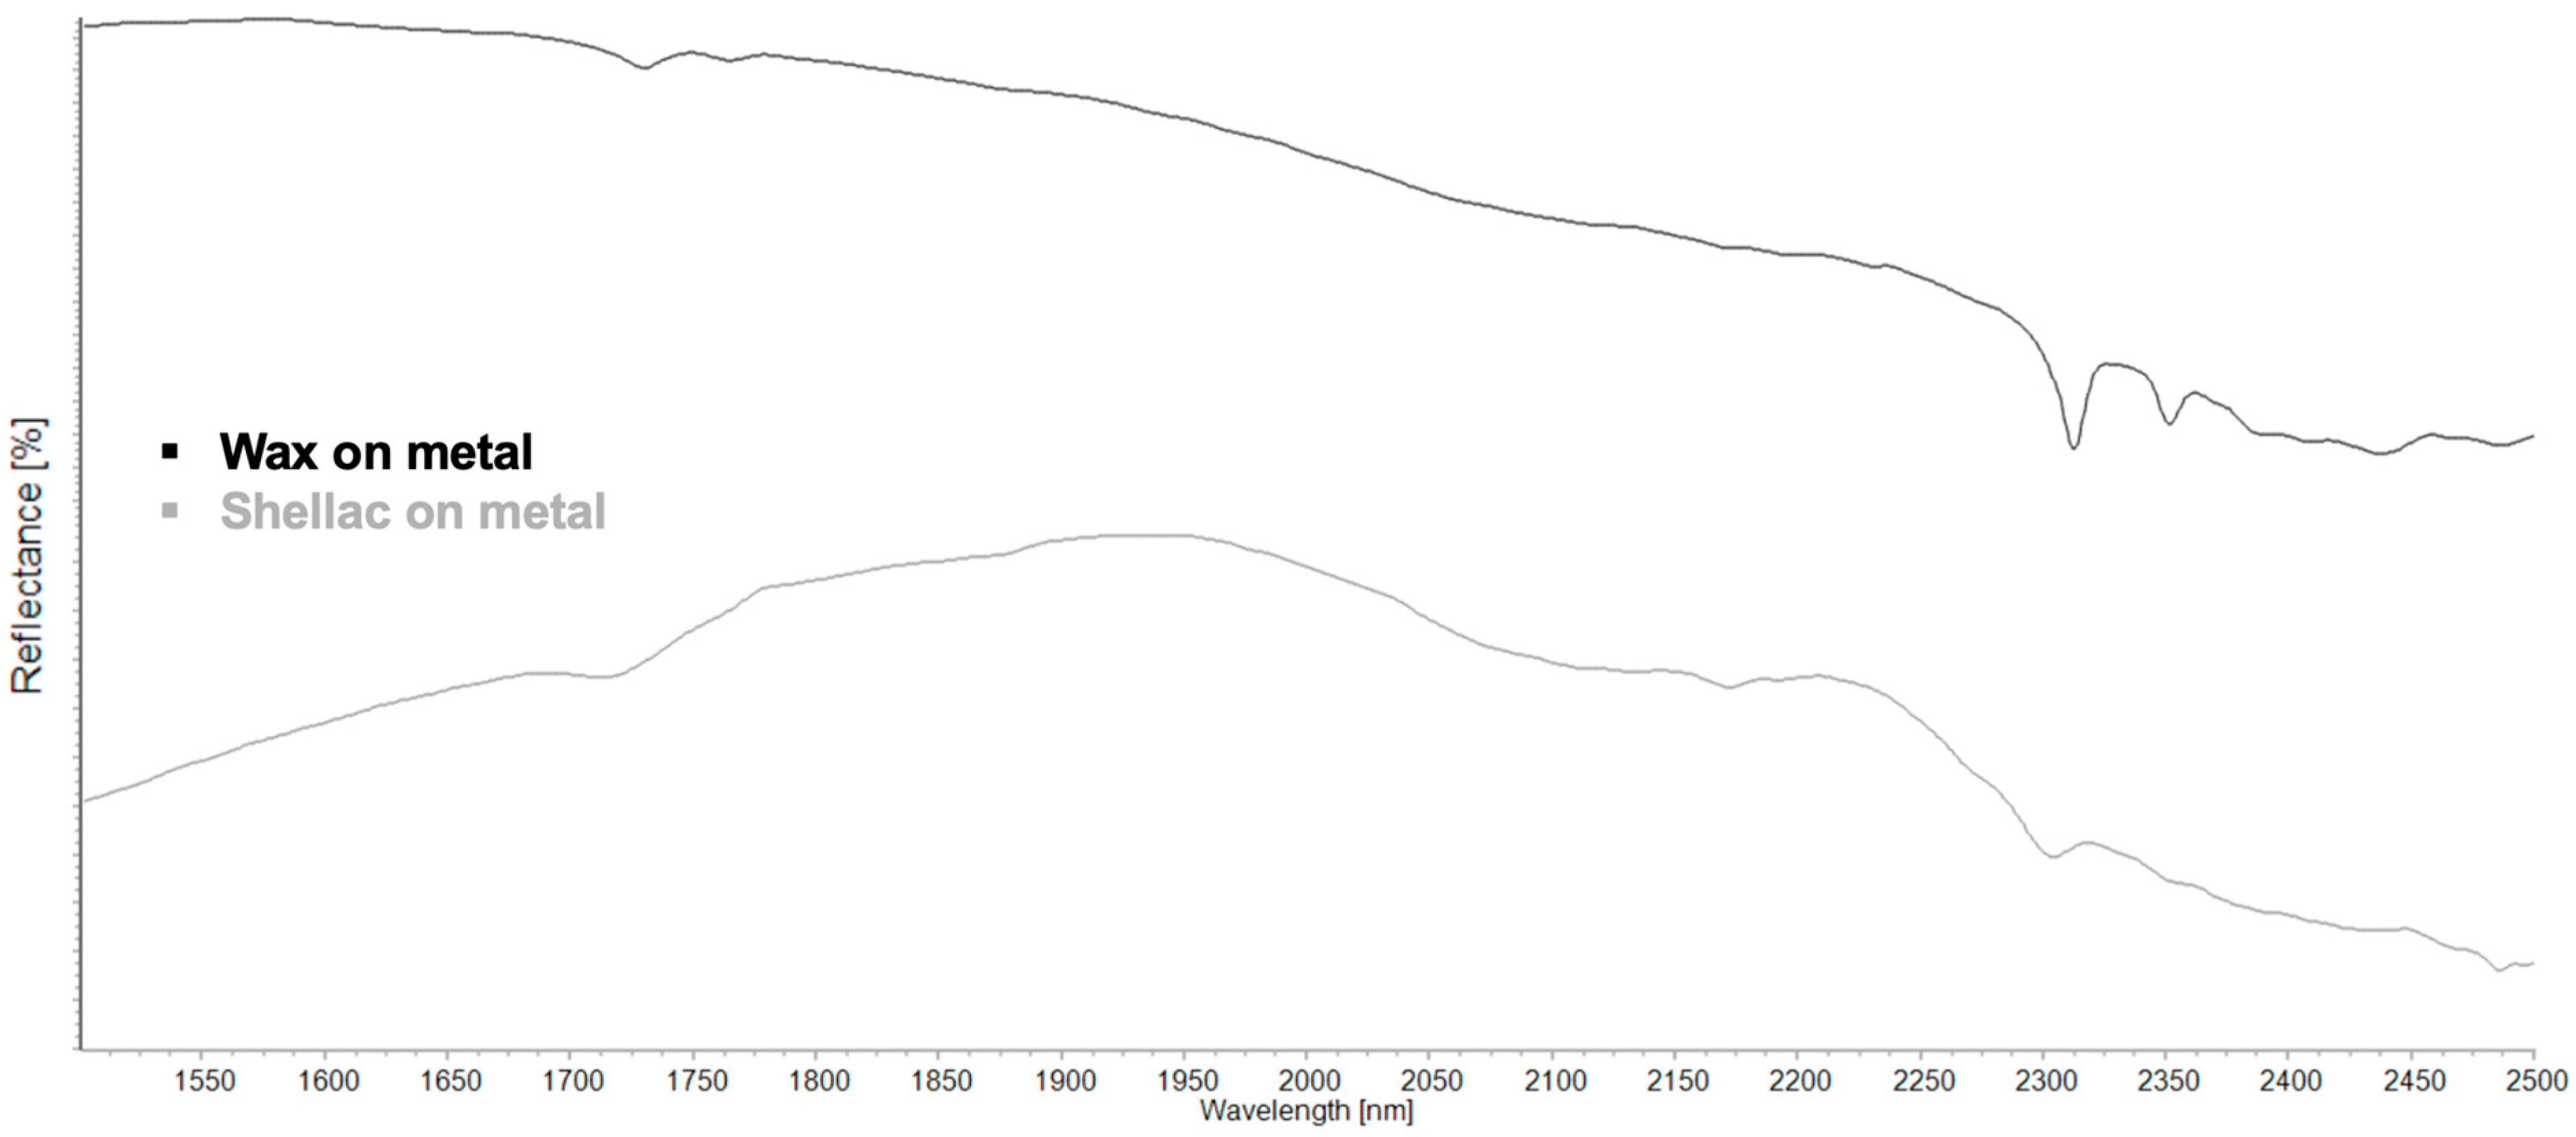
ER-FTIR and FORS analysis successfully identified wax and shellac on metal. ER-FTIR and FORS band assignments are presented in Table 8 and Table 9, respectively. ER-FTIR and FORS spectra are presented in Figure 13 and Figure 14, respectively. Both materials can also be removed using appropriate solvents, revealing the underlying coated surface. The ability to identify wax and shellac non-destructively is essential for conservation, as it enables discrimination between original and non-original coatings, thereby informing treatment strategies and safe methods for removal or reintegration. This is critical, as non-original materials may obscure the artist’s intended finish, alter surface chemistry, or mislead historical interpretations regarding the object’s condition and appearance.
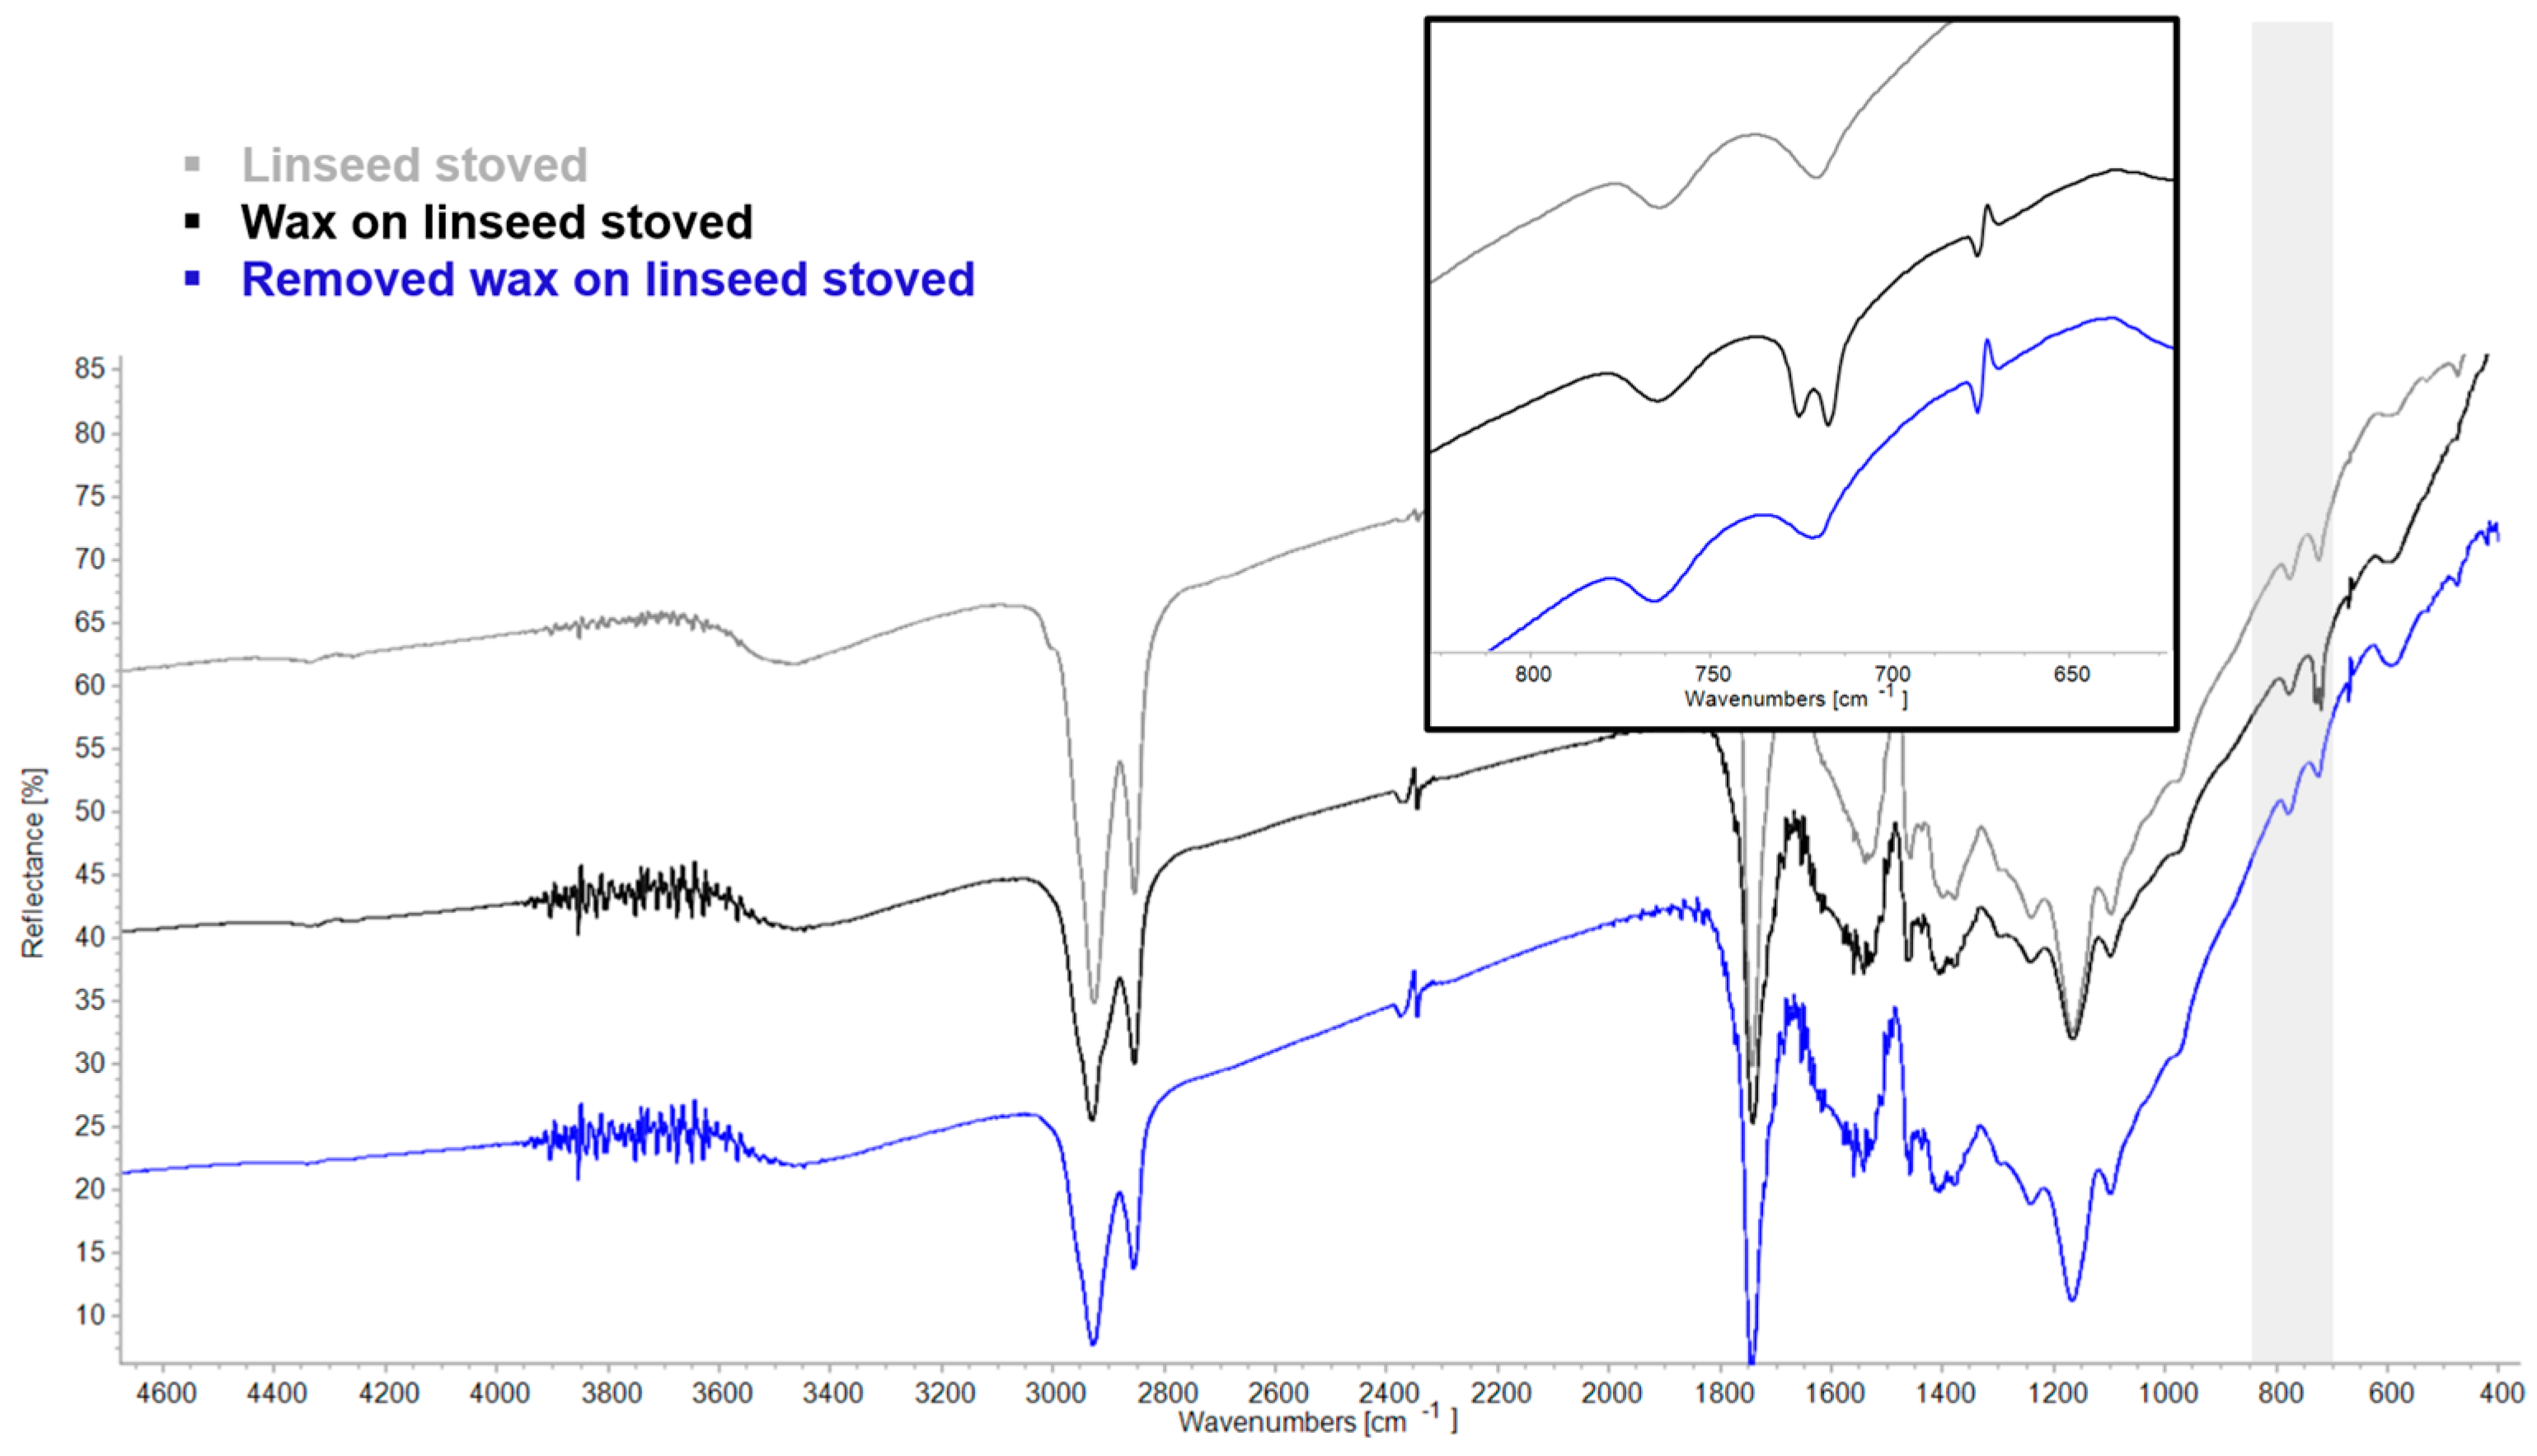
ER-FTIR analysis of wax on the linseed oil-coated mock-up isolated a spectral response attributable to the wax. Two sharp bands at 730 cm−1 and 719 cm−1, illustrated in Figure 15, correspond to CH2 rocking vibrations (ρ): the 730 cm−1 band reflects the crystalline phase, while the 719 cm−1 band reflects both amorphous and crystalline phases [50] (p. 1165). These bands are characteristic of both microcrystalline and natural waxes, including carnauba and beeswax [51,52,53,54,55]. Following treatment with odourless mineral spirits, these bands were no longer present in the spectrum, confirming the successful removal of the wax layer. The appearance and subsequent loss of this diagnostic CH2 rocking doublet can serve as a reliable spectral marker for detecting and monitoring wax presence and removal during conservation treatments.
FORS analysis of wax on the linseed oil-coated mock-up was less definitive (Figure 16). Although spectral changes were observed, no new bands could be confidently assigned. Notable shifts include a change in the second CH2 overtone from 1717 nm to two separate absorptions at 1726 and 1758 nm. Also observed was the appearance of broad, uncharacterized bands at 1758 nm and 1808 nm. The methylenic C–H stretching and bending combination bands (νa+s(CH2) + δ(CH2)) shifted from 2306 nm and 2347 nm in the linseed oil-coated mock-up to 2312 nm and 2350 nm after wax application, consistent with the literature values for wax in the SWIR [19,21,50]. After removal, these bands returned to their original positions at 2305 nm and 2347 nm.
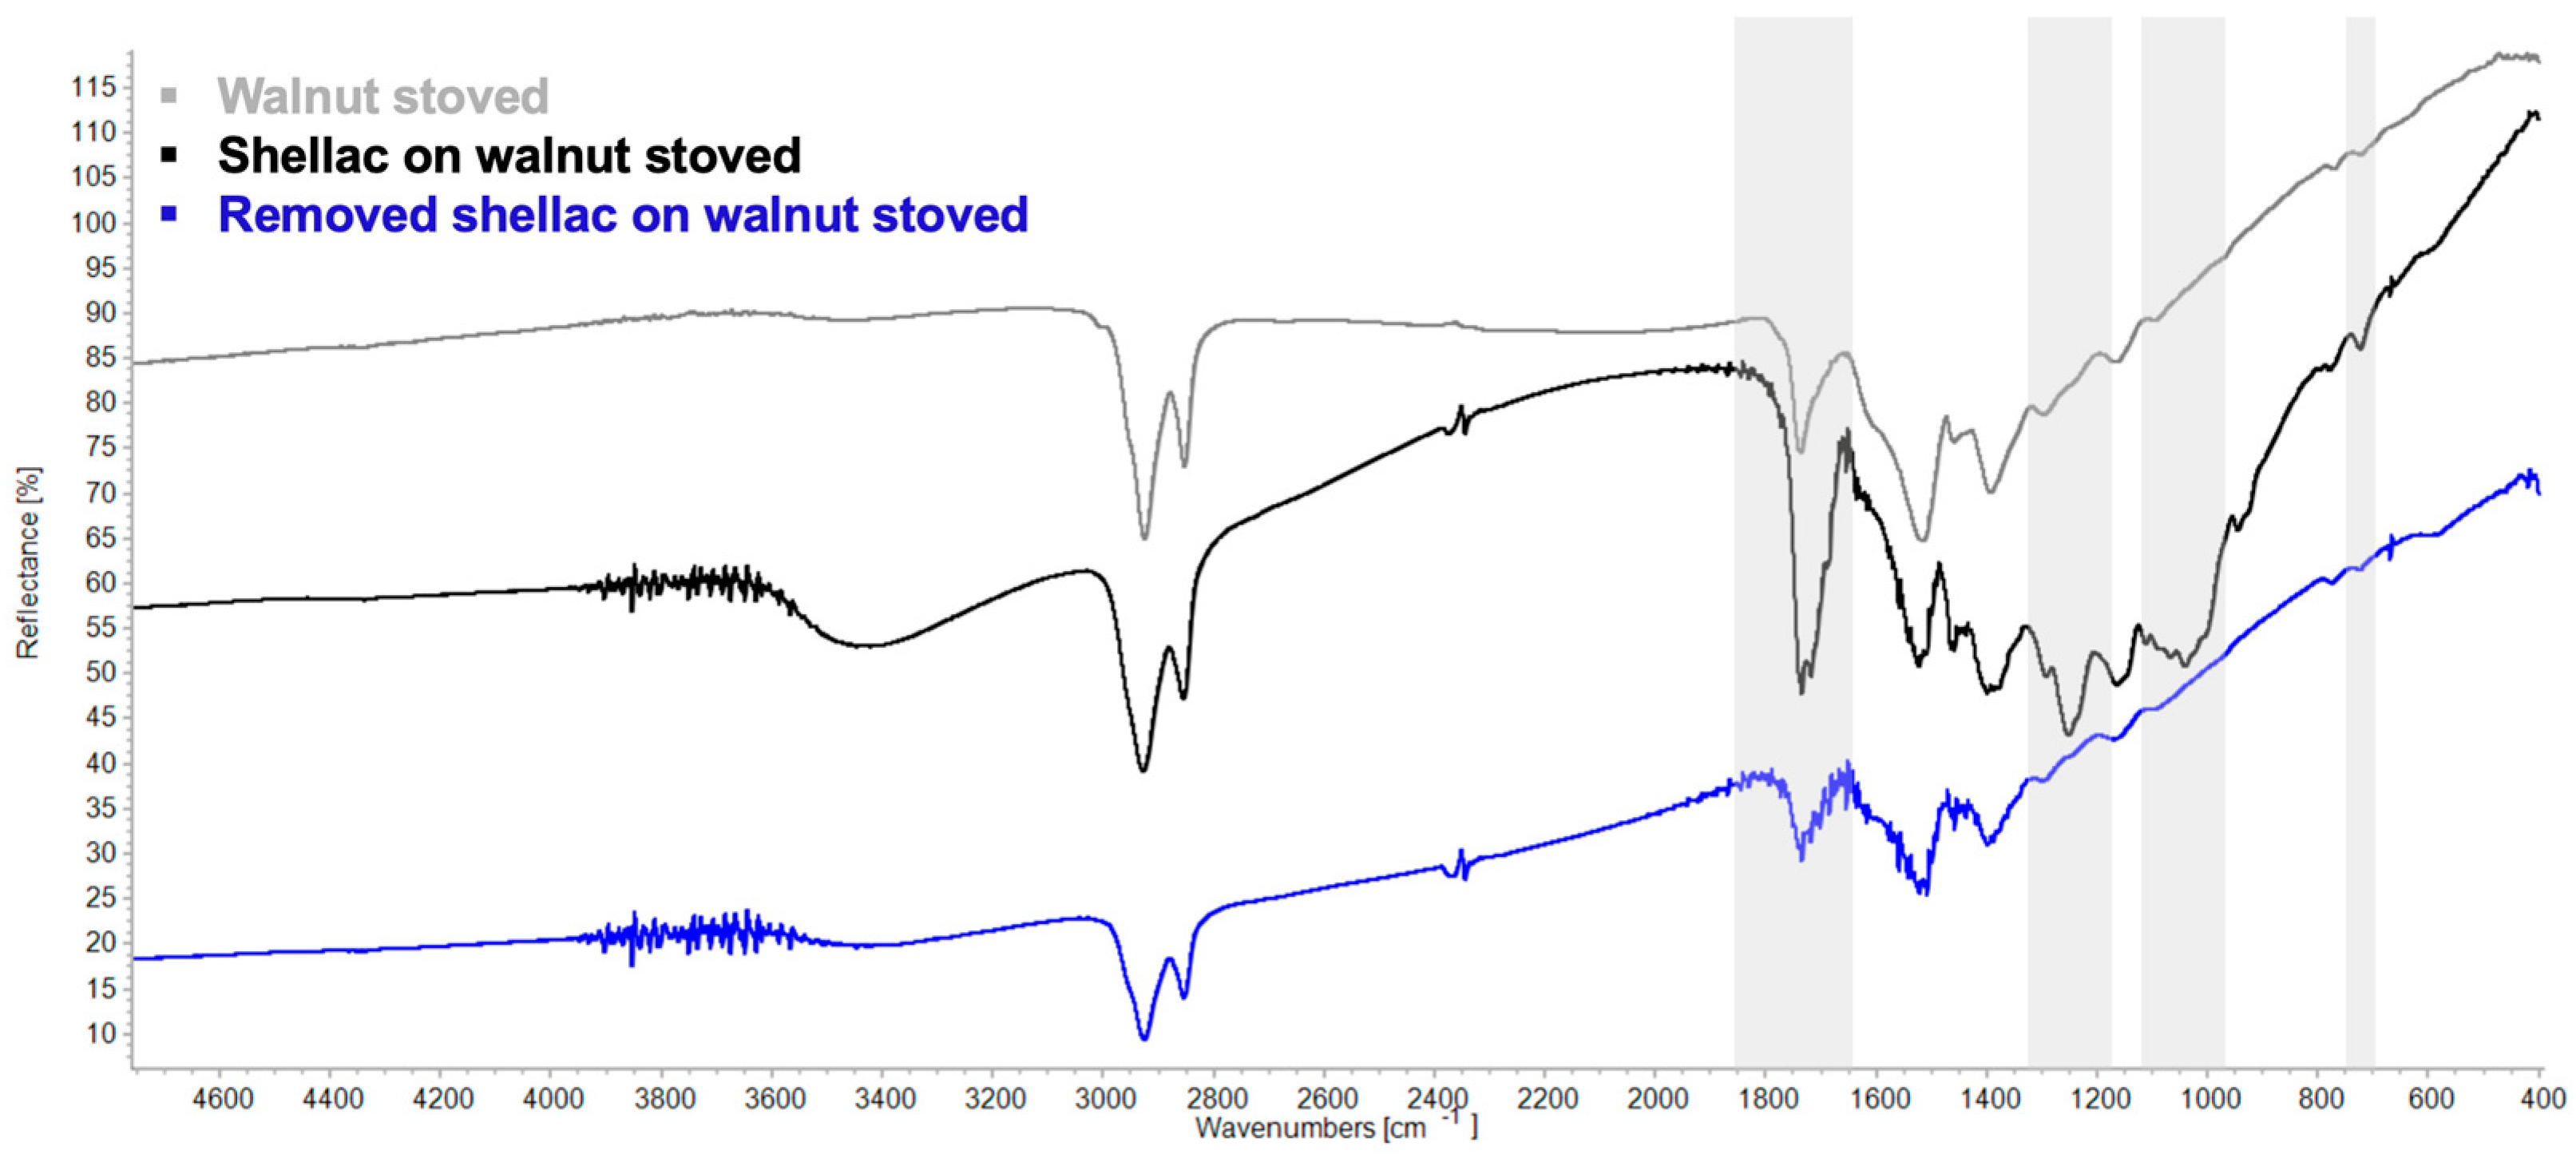
ER-FTIR analysis of shellac on the walnut oil-coated mock-up (Figure 17) revealed a strong absorption at ~1750 cm−1, attributed to the stretching of the carboxyl group (νOH). Although this band is also present in walnut oil, it is more intense in shellac due to the material’s high concentration of free carboxylic acid groups [44,55]. Three additional shellac-associated bands were identified. The first two, near 1247 cm−1 (C–O stretching) and near 1039 cm−1 (C–O stretching), were less clearly defined than the wax-associated bands [50,56] (p. 1167, p. 12). Third, the same CH2 rocking vibration (ρ) band that appears in wax as a doublet was also observed in the shellac-coated mock-up at 720 cm−1 as a singlet. However, it is not as distinct as it is for wax and overlaps with absorptions present in the oil-coated mock-up. All three bands were absent following removal with isopropanol.
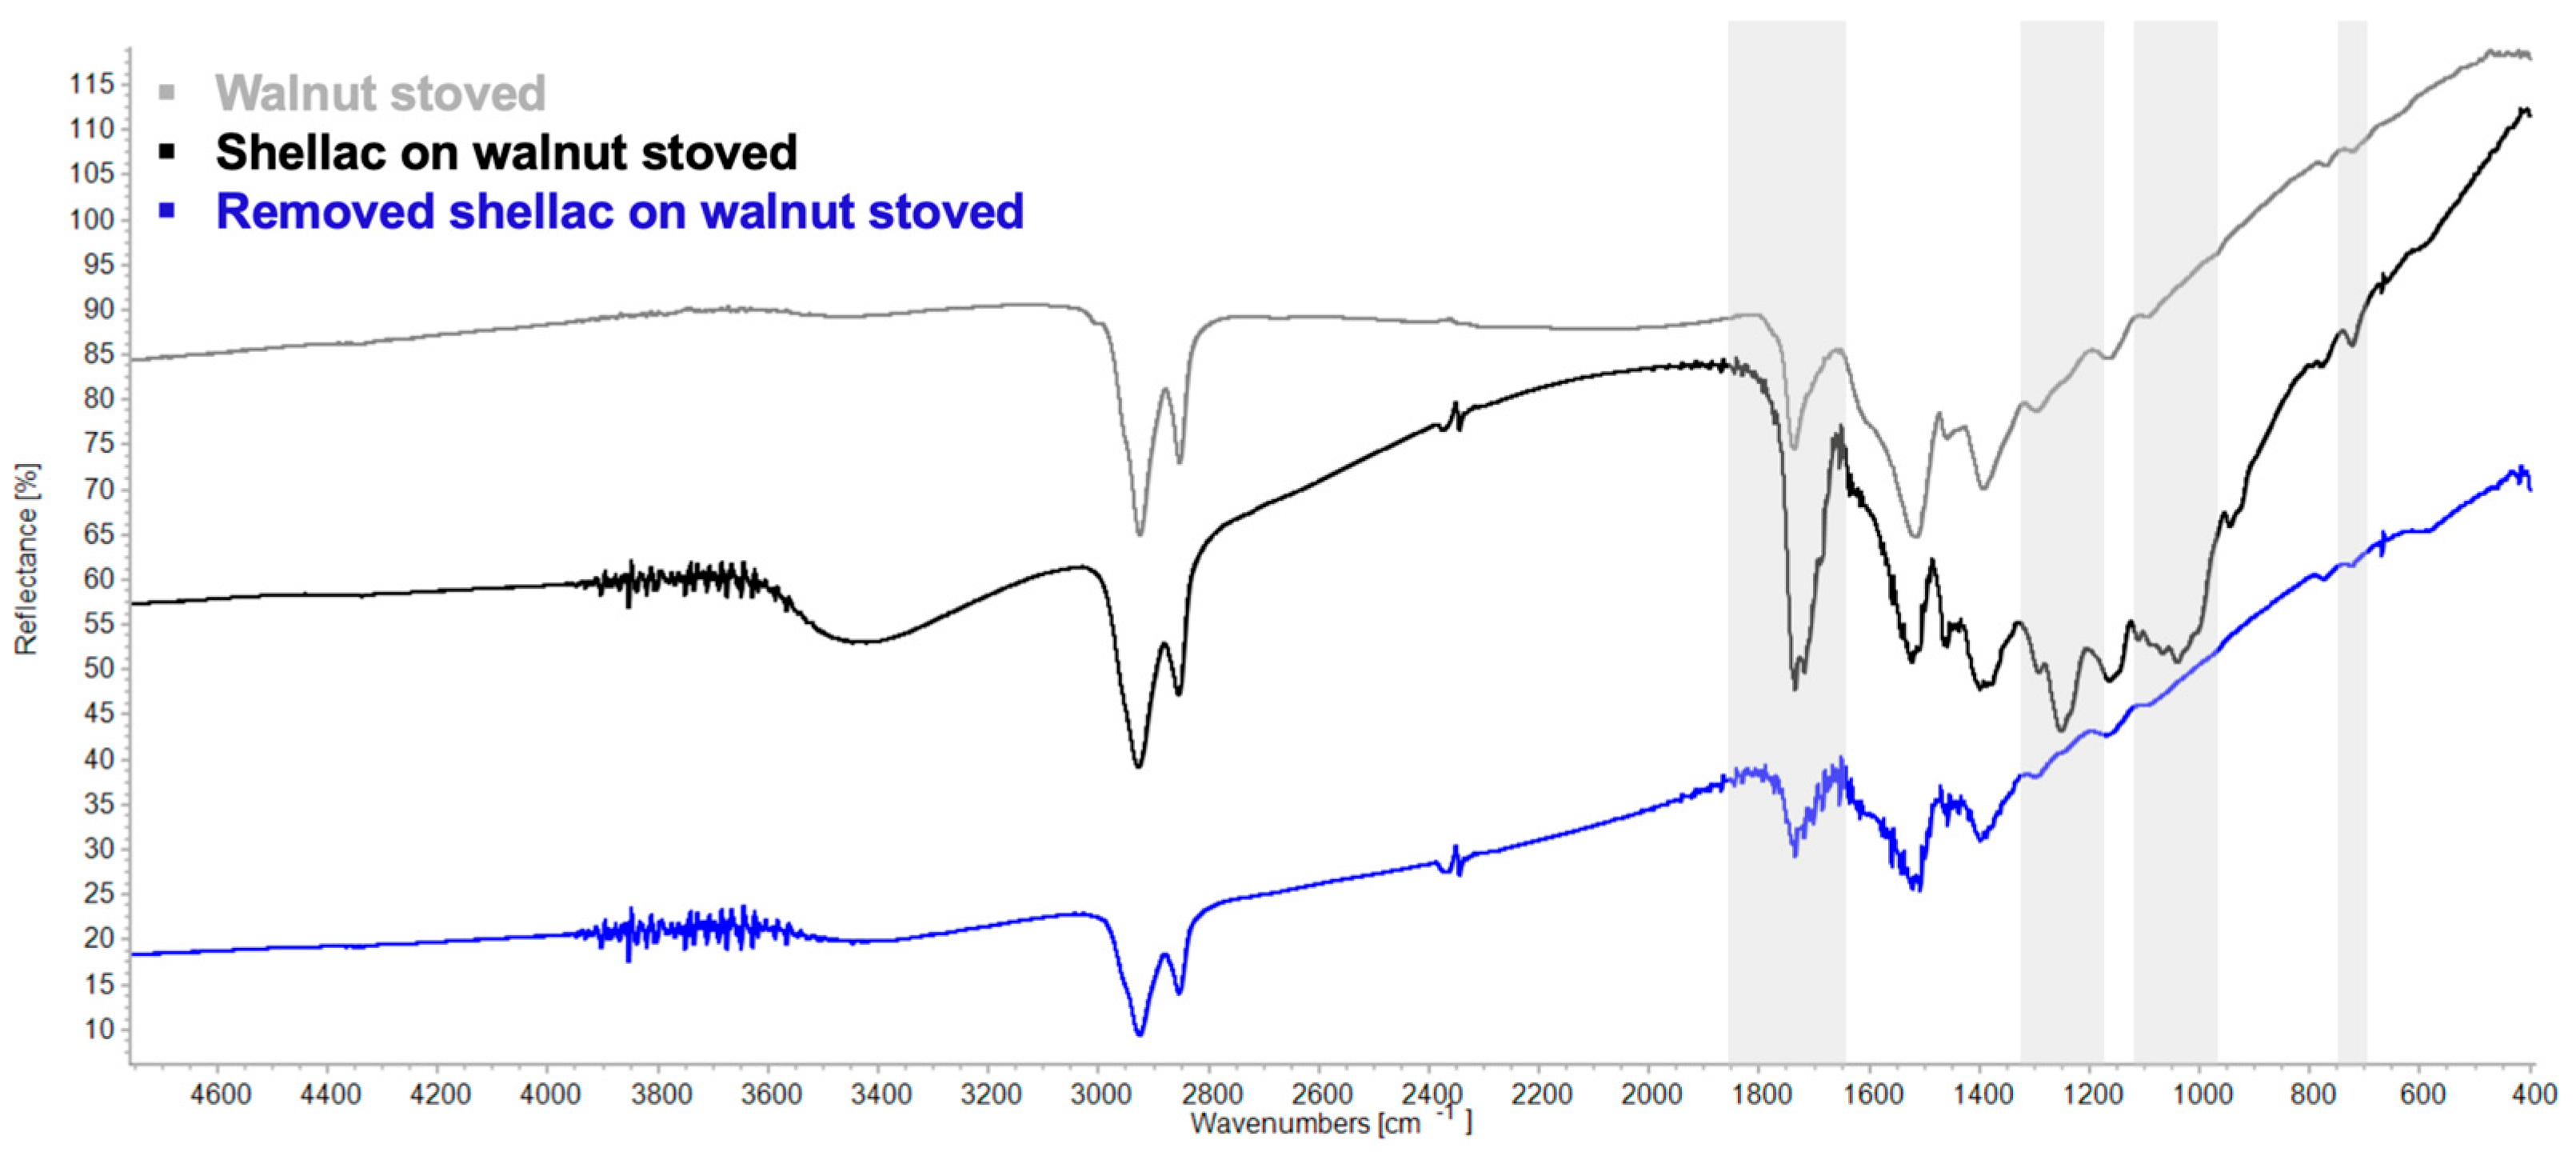
The FORS spectrum of shellac on the walnut oil-coated mock-up was ambiguous (Figure 18). The limited availability of published SWIR data for shellac hinders interpretation. Some spectral variation was observed between 1600–1800 nm and 2200–2400 nm, but only one absorption at 2480 nm could be assigned to shellac. This band is a combination of νCH and νCO, and an overtone of acidic OH vibrations [50] (p. 1167). However, it also overlaps with the ν(CH2) + ν(C-CO-O)aliphatic combination band of walnut, complicating interpretation.

4. Discussion

The combined use of ER-FTIR and FORS provides a complementary framework for the non-invasive analysis of SOCs on metal substrates. Each technique offers distinct advantages that, when integrated, enable a more complete characterization of drying oils, natural resins, bitumen, wax, and shellac.
ER-FTIR is particularly effective for identifying characteristic functional groups and assessing chemical changes associated with aging in the MIR [41]. However, ER-FTIR faces limitations in discriminating between materials with similar chemical compositions due to overlapping spectral features. FORS, by contrast, operates in the NIR and SWIR regions, providing access to overtone and combination bands that are not captured by MIR spectroscopy. It is well-suited for identifying broader material classes based on methylenic and aromatic overtone features and is sensitive to subtle differences in peak position and width resulting from blended organic materials, particularly when derivative analysis is applied.
However, FORS spectra exhibit weaker and less specific features, that can be difficult to discriminate, especially in complex mixtures. Machine learning, peak deconvolution, and multivariate statistical methods such as principal component analysis (PCA) demonstrate considerable potential for improving material discrimination of the chemically similar components of SOCs. Studies such as Carlesi et al. (2015) have integrated PCA with FT-NIR and Raman datasets to discriminate compounds from the same organic class in different fresh drying oil films (linseed, stand oil, poppy seed, and walnut) by differentiating functional groups [57].

5. Conclusions

In conclusion, while using ER-FTIR and FORS together clearly offers significant analytical advantages, it should be recognized that material identification remains partly inferential. In practice, it is necessary to look for additive effects—such as peak broadening, shifts, or emerging shoulders—and combine this spectral evidence with visual observations and historical knowledge to make informed interpretations. Although complete separation of every material component may not always be possible, the most significant and relevant features of SOCs, including the primary base material and the presence of resinous additives, can be reliably identified using this complementary approach and the spectral library provided in the Supplementary Materials. This method has been used to successfully identify SOCs on Renaissance bronzes in the collection of the Royal Ontario Museum, Toronto, Canada [58].

Supplementary Materials

The following supporting information can be downloaded at https://www.mdpi.com/article/10.3390/coatings15101226/s1, Table S1. Mastic resin stoved on metal coupon ER-FTIR and FORS band assignments; Figure S1. Mastic resin stoved on metal coupon ER-FTIR spectrum with assigned bands; Figure S2. Mastic resin stoved on metal coupon FORS spectrum and first derivative with assigned bands; Table S2. Pine resin stoved on metal coupon ER-FTIR and FORS band assignments; Figure S3. Pine resin stoved on metal coupon ER-FTIR spectrum with assigned bands; Figure S4. Pine resin stoved on metal coupon FORS spectrum and first derivative with assigned bands; Table S3. Bitumen stoved on metal coupon ER-FTIR and FORS band assignments; Figure S5. Bitumen stoved on metal coupon ER-FTIR spectrum with assigned bands; Figure S6. Bitumen stoved on metal coupon FORS spectrum and first derivative with assigned bands; Table S4. Linseed oil stoved on metal coupon ER-FTIR and FORS band assignments; Figure S7. Linseed oil stoved on metal coupon ER-FTIR spectrum with assigned bands; Figure S8. Linseed oil stoved on metal coupon FORS spectrum and first derivative with assigned bands; Table S5. Linseed oil–bitumen stoved on metal coupon ER-FTIR and FORS band assignments; Figure S9. Linseed oil–bitumen stoved on metal coupon ER-FTIR spectrum with assigned bands; Figure S10. Linseed oil–bitumen stoved on metal coupon FORS spectrum and first derivative with assigned bands; Table S6. Linseed oil–mastic resin stoved on metal coupon ER-FTIR and FORS band assignments; Figure S11. Linseed oil–mastic resin stoved on metal coupon ER-FTIR spectrum with assigned bands; Figure S12. Linseed oil–mastic resin stoved on metal coupon FORS spectrum and first derivative with assigned bands; Table S7. Linseed oil–mastic resin–bitumen stoved on metal coupon ER-FTIR and FORS band assignments; Figure S13. Linseed oil–mastic resin–bitumen stoved on metal coupon ER-FTIR spectrum with assigned bands; Figure S14. Linseed oil–mastic resin–bitumen stoved on metal coupon FORS spectrum and first derivative with assigned bands; Table S8. Linseed oil–pine resin stoved on metal coupon ER-FTIR and FORS band assignments; Figure S15. Linseed oil–pine resin stoved on metal coupon ER-FTIR spectrum with assigned bands; Figure S16. Linseed oil–pine resin stoved on metal coupon FORS spectrum and first derivative with assigned bands; Table S9. Linseed oil–pine resin–bitumen stoved on metal coupon ER-FTIR and FORS band assignments; Figure S17. Linseed oil–pine resin–bitumen stoved on metal coupon ER-FTIR spectrum with assigned bands; Figure S18. Linseed oil–pine resin–bitumen stoved on metal coupon FORS spectrum and first derivative with assigned bands; Table S10. Linseed oil–mastic resin–pine resin stoved on metal coupon ER-FTIR and FORS band assignments; Figure S19. Linseed oil–mastic resin–pine resin stoved on metal coupon ER-FTIR spectrum with assigned bands; Figure S20. Linseed oil–mastic resin–pine resin stoved on metal coupon FORS spectrum and first derivative with assigned bands; Table S11. Linseed oil–mastic resin–pine resin–bitumen stoved on metal coupon ER-FTIR and FORS band assignments; Figure S21. Linseed oil–mastic resin–pine resin–bitumen stoved on metal coupon ER-FTIR spectrum with assigned bands; Figure S22. Linseed oil–mastic resin–pine resin–bitumen stoved on metal coupon FORS spectrum and first derivative with assigned bands; Table S12. Walnut oil stoved on metal coupon ER-FTIR and FORS band assignments; Figure S23. Walnut oil stoved on metal coupon ER-FTIR spectrum with assigned bands; Figure S24. Walnut oil stoved on metal coupon FORS spectrum and first derivative with assigned bands; Table S13. Walnut oil–bitumen stoved on metal coupon ER-FTIR and FORS band assignments; Figure S25. Walnut oil–bitumen stoved on metal coupon ER-FTIR spectrum with assigned bands; Figure S26. Walnut oil–bitumen stoved on metal coupon FORS spectrum and first derivative with assigned bands; Table S14. Walnut oil–mastic resin stoved on metal coupon ER-FTIR and FORS band assignments; Figure S27. Walnut oil–mastic resin stoved on metal coupon ER-FTIR spectrum with assigned bands; Figure S28. Walnut oil–mastic resin stoved on metal coupon FORS spectrum and first derivative with assigned bands; Table S15. Walnut oil–mastic resin–bitumen stoved on metal coupon ER-FTIR and FORS band assignments; Figure S29. Walnut oil–mastic resin–bitumen stoved on metal coupon ER-FTIR spectrum with assigned bands; Figure S30. Walnut oil–mastic resin–bitumen stoved on metal coupon FORS spectrum and first derivative with assigned bands; Table S16. Walnut oil–pine resin stoved on metal coupon ER-FTIR and FORS band assignments; Figure S31. Walnut oil–pine resin stoved on metal coupon ER-FTIR spectrum with assigned bands; Figure S32. Walnut oil–pine resin stoved on metal coupon FORS spectrum and first derivative with assigned bands; Table S17. Walnut oil–pine resin–bitumen stoved on metal coupon ER-FTIR and FORS band assignments; Figure S33. Walnut oil–pine resin–bitumen stoved on metal coupon ER-FTIR spectrum with assigned bands; Figure S34. Walnut oil–pine resin–bitumen stoved on metal coupon FORS spectrum and first derivative with assigned bands; Table S18. Walnut oil–mastic resin–pine resin stoved on metal coupon ER-FTIR and FORS band assignments; Figure S35. Walnut oil–mastic resin–pine resin stoved on metal coupon ER-FTIR spectrum with assigned bands; Figure S36. Walnut oil–mastic resin–pine resin stoved on metal coupon FORS spectrum and first derivative with assigned bands; Table S19. Walnut oil–mastic resin–pine resin–bitumen stoved on metal coupon ER-FTIR and FORS band assignments; Figure S37. Walnut oil–mastic resin–pine resin–bitumen stoved on metal coupon ER-FTIR spectrum with assigned bands; Figure S38. Walnut oil–mastic resin–pine resin–bitumen stoved on metal coupon FORS spectrum and first derivative with assigned bands; Table S20. Linseed oil–walnut oil stoved on metal coupon ER-FTIR and FORS band assignments; Figure S39. Linseed oil–walnut oil stoved on metal coupon ER-FTIR spectrum with assigned bands; Figure S40. Linseed oil–walnut oil stoved on metal coupon FORS spectrum and first derivative with assigned bands; Table S21. Linseed oil–walnut oil–bitumen stoved on metal coupon ER-FTIR and FORS band assignments; Figure S41. Linseed oil–walnut oil–bitumen stoved on metal coupon ER-FTIR spectrum with assigned bands; Figure S42. Linseed oil–walnut oil–bitumen stoved on metal coupon FORS spectrum and first derivative with assigned bands; Table S22. Linseed oil–walnut oil–mastic resin stoved on metal coupon ER-FTIR and FORS band assignments; Figure S43. Linseed oil–walnut oil–mastic resin stoved on metal coupon ER-FTIR spectrum with assigned bands; Figure S44. Linseed oil–walnut oil–mastic resin stoved on metal coupon FORS spectrum and first derivative with assigned bands; Table S23. Linseed oil–walnut oil–mastic resin–bitumen stoved on metal coupon ER-FTIR and FORS band assignments; Figure S45. Linseed oil–walnut oil–mastic resin–bitumen stoved on metal coupon ER-FTIR spectrum with assigned bands; Figure S46. Linseed oil–walnut oil–mastic resin–bitumen stoved on metal coupon FORS spectrum and first derivative with assigned bands; Table S24. Linseed oil–walnut oil–pine resin stoved on metal coupon ER-FTIR and FORS band assignments; Figure S47. Linseed oil–walnut oil–pine resin stoved on metal coupon ER-FTIR spectrum with assigned bands; Figure S48. Linseed oil–walnut oil–pine resin stoved on metal coupon FORS spectrum and first derivative with assigned bands; Table S25. Linseed oil–walnut oil–pine resin–bitumen stoved on metal coupon ER-FTIR and FORS band assignments; Figure S49. Linseed oil–walnut oil–pine resin–bitumen stoved on metal coupon ER-FTIR spectrum with assigned bands; Figure S50. Linseed oil–walnut oil–pine resin–bitumen stoved on metal coupon FORS spectrum and first derivative with assigned bands; Table S26. Linseed oil–walnut oil–mastic resin–pine resin stoved on metal coupon ER-FTIR and FORS band assignments; Figure S51. Linseed oil–walnut oil–mastic resin–pine resin stoved on metal coupon ER-FTIR spectrum with assigned bands; Figure S52. Linseed oil–walnut oil–mastic resin–pine resin stoved on metal coupon FORS spectrum and first derivative with assigned bands; Table S27. Linseed oil–walnut oil–mastic resin–pine resin–bitumen stoved on metal coupon ER-FTIR and FORS band assignments; Figure S53. Linseed oil–walnut oil–mastic resin–pine resin–bitumen stoved on metal coupon ER-FTIR spectrum with assigned bands; Figure S54. Linseed oil–walnut oil–mastic resin–pine resin–bitumen stoved on metal coupon FORS spectrum and first derivative with assigned bands.

Author Contributions

E.P. and A.S.: Conceptualization, methodology, data collection, data interpretation, and writing was completed jointly. All authors have read and agreed to the published version of the manuscript.

Funding

This research was funded by Queen’s University’s Department of Art History and Art Conservation and the Ontario Graduate Scholarship (OGS) programme, funded in part by the government of Ontario and in part by Queen’s University.

Institutional Review Board Statement

Not applicable.

Informed Consent Statement

Not applicable.

Data Availability Statement

Data is contained within the article or Supplementary Materials.

Acknowledgments

We gratefully acknowledge the support of Queen’s University’s Department of Art History and Art Conservation, as well as the faculty of the Master of Art Conservation programme, whose guidance has shaped this research over the past two years. We extend our thanks to Scott Williams for his insightful advice on infrared spectroscopy. We are also deeply grateful to Brett Davis, founder of Age of Bronze and patina and bronze expert, for generously sharing his expertise on historic casting and patination practices and for his guidance in preparing the metal mock-ups. A. Shugar’s research is supported by Bader Philanthropies. This article is an expanded version of a paper entitled “Non-destructive characterization of organic patinas on Renaissance bronzes using short-wave infrared and mid-infrared spectroscopy”, which was presented at Metal 2025, Cardiff, Wales, UK, 1–5 September 2025, and published under the same name in the proceedings: METAL 2025: Proceedings of the International Conference on Metals Conservation, Nicola Emmerson, Johanna Thunberg, and David Watkinson, eds, 2025 [59]. In addition, select figures and writing, as well as the full scope of the research project, are published in an internal, non peer-reviewer thesis at Queen’s University.

Conflicts of Interest

The authors declare no conflicts of interest.

Abbreviations

The following abbreviations are used in this manuscript:
ER-FTIRExternal reflectance Fourier transfer infrared spectroscopy
FORSFiber optic reflectance spectroscopy
GC-MSGas chromatography–mass spectroscopy
MIRMid-infrared
NIRNear-infrared
PCAPrinciple component analysis
SOCSurface organic coating
SWIRShort-wave infrared

References

  1. Montagu, J. Bronzes; Octopus Books Ltd.: London, UK, 1972. [Google Scholar]
  2. Stone, R.E. Organic Patinas on Small Bronzes of the Italian Renaissance. Metrop. Mus. J. 2010, 45, 107–124. [Google Scholar] [CrossRef]
  3. Hughes, R.; Rowe, M. The Coloring, Bronzing and Patination of Metals; Thames and Hudson: London, UK, 1991. [Google Scholar]
  4. Allen, D.; Borsch, L.; Draper, J.D.; Fraiman, J.; Stone, R.E. (Eds.) Italian Renaissance and Baroque Bronzes in the Metropolitan Museum of Art; The Metropolitan Museum of Art: New York, NY, USA, 2022. [Google Scholar]
  5. Ciardi Dupre, M.G.; Ross, B., Translators; Small Renaissance Bronzes; Paul Hamlyn: London, UK, 1970. [Google Scholar]
  6. Galeotti, M.; Porcinai, S.; Cagnini, A.; Baruffetti, M.; Biondi, C.; Dal Fovo, A.; Fontana, R. Organic Patinas on Small Historical Bronzes: From Mock-Ups to Actual Artworks. Coatings 2024, 14, 212. [Google Scholar] [CrossRef]
  7. Leithe-Jasper, M. (Ed.) Renaissance Master Bronzes: From the Collection of the Kunsthistorisches Museum, Vienna; Scala Books: London, UK, 1986. [Google Scholar]
  8. Bewer, F.G. A Study of the Technology of Renaissance Bronze Statuettes. Ph.D. Thesis, University of London, London, UK, 1996. [Google Scholar]
  9. Pitthard, V.; Stanek, S.; Griesser, M.; Kryza-Gersch, C.; Hanzer, H. Comprehensive Investigation of the ‘organic Patina’ on Renaissance and Baroque Indoor Bronze Sculptures from the Collection of the Kunsthistorisches Museum, Vienna. Conserv. Sci. 2007, 12, 44–53. [Google Scholar]
  10. Pitthard, V.; Stone, R.; Stanek, S.; Griesser, M.; Kryza-Gersch, C.; Hanzer, H. Organic Patinas on Renaissance and Baroque Bronzes—Interpretation of Compositions of the Original Patination by Using a Set of Simulated Varnished Bronze Coupons. J. Cult. Herit. 2011, 12, 44–53. [Google Scholar] [CrossRef]
  11. Appolonia, L.; Vaudan, D.; Chatel, V.; Aceto, M.; Mirti, P. Combined Use of FORS, XRF and Raman Spectroscopy in the Study of Mural Paintings in the Aosta Valley (Italy). Anal. Bioanal. Chem. 2009, 395, 2005–2013. [Google Scholar] [CrossRef]
  12. Cheilakou, E.; Troullinos, M.; Koui, M. Identification of Pigments on Byzantine Wall Paintings from Crete (14th Century AD) Using Non-Invasive Fiber Optics Dif-fuse Reflectance Spectroscopy (FORS). J. Archaeol. Sci. 2014, 41, 541–555. [Google Scholar] [CrossRef]
  13. Garofano, I.; Perez-Rodriguez, J.L.; Robador, M.D.; Duran, A. An Innovative Combination of Non-Invasive UV-Visible-FORS, XRD and XRF Techniques to Study Roman Wall Paintings from Seville, Spain. J. Cult. Herit. 2016, 22, 1028–1039. [Google Scholar] [CrossRef]
  14. Nodari, L.; Ricciardi, P. Non-Invasive Identification of Paint Binders in Illuminated Manuscripts by ER-FTIR Spectroscopy: A Systematic Study of the Influence of Different Pigments on the Binders’ Characteristic Spectral Features. Herit. Sci. 2019, 7, 7. [Google Scholar] [CrossRef]
  15. Bell, J.; Nel, P.; Stuart, B. Non-Invasive Identification of Polymers in Cultural Heritage Collections: Evaluation, Optimisation and Application of Portable FTIR (ATR and External Reflectance) Spectroscopy to Three-Dimensional Polymer-Based Objects. Herit. Sci. 2019, 7, 95. [Google Scholar] [CrossRef]
  16. Grehk, T.M.; Berger, R.; Bexell, U. Investigation of the Drying Process of Linseed Oil Using FTIR and ToF-SIMS. J. Phys. Conf. Ser. 2008, 100, 12019. [Google Scholar] [CrossRef]
  17. Ricci, C.; Miliani, C.; Brunetti, B.G.; Sgamellotti, A. Non-Invasive Identification of Surface Materials on Marble Artifacts with Fiber Optic Mid-FTIR Reflectance Spectroscopy. Talanta 2006, 69, 1221–1226. [Google Scholar] [CrossRef]
  18. Catelli, E.; Sciutto, G.; Prati, S.; Chavez Lozano, M.V.; Gatti, L.; Lugli, F.; Silvestrini, S.; Benazzi, S.; Genorini, E.; Mazzeo, R. A New Miniaturised Short-Wave Infrared (SWIR) Spectrometer for on-Site Cultural Heritage Investigations. Talanta 2020, 218, 121112. [Google Scholar] [CrossRef]
  19. Catelli, E.; Sciutto, G.; Prati, S.; Jia, Y.; Mazzeo, R. Characterization of Outdoor Bronze Monument Patinas: The Potentialities of near-Infrared Spectroscopic Analysis. Environ. Sci. Pollut. Res. 2018, 25, 24379–24393. [Google Scholar] [CrossRef]
  20. Dooley, K.A.; Coddington, J.; Krueger, J.; Conover, D.M.; Loew, M.; Delaney, J.K. Standoff Chemical Imaging Finds Evidence for Jackson Pollock’s Selective Use of Alkyd and Oil Binding Media in a Famous ‘Drip’ Painting. Anal. Methods 2017, 9, 28–37. [Google Scholar] [CrossRef]
  21. Dooley, K.A.; Lomax, S.; Zeibel, J.G.; Miliani, C.; Ricciardi, P.; Hoenigswald, A.; Loewb, M.; Delaney, J.M. Mapping of Egg Yolk and Animal Skin Glue Paint Binders in Early Renaissance Paintings Using near Infrared Reflectance Imaging Spectroscopy. Analyst 2013, 138, 4838–4848. [Google Scholar] [CrossRef]
  22. Invernizzi, C.; Rovetta, T.; Licchelli, M.; Malagodi, M. Mid and Near-Infrared Reflection Spectral Database of Natural Organic Materials in the Cultural Heritage Field. Int. J. Anal. Chem. 2018, 2018, 7823248. [Google Scholar] [CrossRef] [PubMed]
  23. Ricciardi, P.; Delaney, J.K.; Zeibel, J.G.; Picollo, M.; Lomax, S.; Loew, M. Near Infrared Reflectance Imaging Spectroscopy to Map Paint Binders In Situ on Illuminated Manuscripts. Angew. Chem. Int. Ed. 2012, 51, 5607–5610. [Google Scholar] [CrossRef]
  24. Delaney, J.K.; Thoury, M.; Zeibel, J.G.; Ricciardi, P.; Morales, K.M.; Dooley, K.A. Visible and Infrared Imaging Spectroscopy of Paintings and Improved Reflectography. Herit. Sci. 2016, 4, 6. [Google Scholar] [CrossRef]
  25. Vagnini, M.; Miliani, C.; Cartechini, L.; Rocchi, P.; Brunetti, B.G.; Sgamellotti, A. FT-NIR Spectroscopy for Non-Invasive Identification of Natural Polymers and Resins in Easel Paintings. Anal. Bioanal. Chem. 2009, 395, 2107–2118. [Google Scholar] [CrossRef]
  26. Liu, W.; Li, M.; Wu, N.; Liu, S.; Chen, J. A New Application of Fiber Optics Reflection Spectroscopy (FORS): Identification of ‘Bronze Disease’ Induced Corrosion Products on Ancient Bronzes. J. Cult. Herit. 2021, 49, 19–27. [Google Scholar] [CrossRef]
  27. Liggins, F.; Vichi, A.; Liu, W.; Hogg, A.; Kogou, S.; Chen, J.; Liang, H. Hyperspectral Imaging Solutions for the Non-Invasive Detection and Automated Mapping of Copper Trihydroxychlorides in Ancient Bronze. Herit. Sci. 2022, 10, 142. [Google Scholar] [CrossRef]
  28. Hu, Q.; Liu, W.; Liu, S.; Chen, J. Detecting Copper Trihydroxychlorides with Reflectance Spectroscopy and Machine Learning Methods. J. Cult. Herit. 2023, 59, 49–56. [Google Scholar] [CrossRef]
  29. Badr Eldin, A. Near Infra Red Spectroscopy. In Wide Spectra of Quality Control; Akyar, I., Ed.; IntechOpen: Rijeka, Croatia, 2011; pp. 237–248. [Google Scholar]
  30. Basso, E.; Pozzi, F.; Day, J.; Borsch, L. Unmasking a Wild Man: Scientific Analysis of Bertoldo Di Giovanni’s Shield Bearer in The Frick Collection. Herit. Sci. 2020, 8, 109. [Google Scholar] [CrossRef]
  31. Boon, J.; van Langh, R. Comprehensive studies of patinas on Renaissance bronze statuettes with laboratory, synchrotron and neutron aided techniques. In Proceedings of the ICOM Committee for Conservation 17th Triennial Meeting, Melbourne, Australia, 19–23 September 2014; Bridgland, J., Ed.; International Council of Museums: Paris, France, 2014. [Google Scholar]
  32. Scott, D.A.; Swartz Dodd, L. Examination, Conservation and Analysis of a Gilded Egyptian Bronze Osiris. J. Cult. Herit. 2002, 3, 333–345. [Google Scholar] [CrossRef]
  33. Benzonelli, A.; Freestone, I.C.; Martinón-Torres, M. A Better Shade of Black: Effects of Manufacturing Parameters on the Development of Ancient Black Bronzes. Archaeometry 2017, 59, 1034–1049. [Google Scholar] [CrossRef]
  34. Pollini, J.; Giumlia-Mair, A. The Statue of Germanicus from Amelia: New Discoveries. Am. J. Archaeol. 2019, 123, 675–686. [Google Scholar] [CrossRef]
  35. Mass, J.L.; Shugar, A.; Finnefrock, A.C.; Tanimoto, S.; Little, M.; Stein, R.; Archie, E. Selenium-Based Black Bronze Treatment, as Compared to Other Patination Technologies of Ancient and Historic Black Bronzes. Technè 2023, 55, 64–74. [Google Scholar] [CrossRef]
  36. Ng, A.; Noelle, A.J.; Salomon, X.F. Bertoldo Di Giovanni: The Renaissance of Sculpture in Medici Florence; D Giles Ltd.: London, UK, 2019. [Google Scholar]
  37. Bourgarit, D. French Bronze Sculpture: Materials and Techniques 16th–18th Century; Archetype Publications Ltd.: London, UK, 2014. [Google Scholar]
  38. Valera-Medina, A.; Amer-Hatem, F.; Azad, A.K.; Dedoussi, I.C.; de Joannon, M.; Fernandes, R.X.; Glarborg, P.; Hashemi, H.; He, X.; Mashruk, S.; et al. Review on Ammonia as a Potential Fuel: From Synthesis to Economics. Energy Fuels 2021, 35, 6964–7029. [Google Scholar] [CrossRef]
  39. Siatou, A.; Argyropoulos, V.; Charalambous, D.; Polikreti, K.; Kaminari, A. Testing New Coating Systems for the Long-Term Protection of Copper and Iron Alloy Collections Exposed in Uncontrolled Museum Environment. In Proceedings of the CSSIM Conference, Cairo, Egypt, 25 February–1 March 2007. [Google Scholar]
  40. Leonor Brito do Nascimento e Oliveira, M. A Technical Investigation of an Oil Painting on Copper Support, Including a Study on Consolidants for Treatment. Master’s Thesis, Universidade Nova de Lisboa, Lisbon, Portugal, 2015. [Google Scholar]
  41. De Viguerie, L.; Payard, P.A.; Portero, E.; Walter, P.; Cotte, M. The Drying of Linseed Oil Investigated by Fourier Transform Infrared Spectroscopy: Historical Recipes and Influence of Lead Compounds. Prog. Org. Coat. 2016, 93, 46–60. [Google Scholar] [CrossRef]
  42. Favvas, E.P.; Kouvelos, E.P.; Papageorgiou, S.K.; Tsanaktsidis, C.G.; Mitropoulos, A.C. Characterization of Natural Resin Materials Using Water Adsorption and Various Advanced Techniques. Appl. Phys. A 2015, 119, 735–743. [Google Scholar] [CrossRef]
  43. Yut, I.; Zofka, A. Attenuated Total Reflection (ATR) Fourier Transform Infrared (FT-IR) Spectroscopy of Oxidized Polymer-Modified Bitumens. Appl. Spectrosc. 2011, 65, 765–770. [Google Scholar] [CrossRef]
  44. Derrick, M.R.; Stulik, D.; Landry, J.M. Infrared Spectroscopy in Conservation Science: Scientific Tools for Conservation; The Getty Conservation Institute: Los Angeles, CA, USA, 1999. [Google Scholar]
  45. Ma, L.; Varveri, A.; Jing, R.; Erkens, S. Chemical Characterisation of Bitumen Type and Ageing State Based on FTIR Spectroscopy and Discriminant Analysis Integrated with Variable Selection Methods. Road Mater. Pavement Des. 2023, 24, 506–520. [Google Scholar] [CrossRef]
  46. Herold, M.; Roberts, D. Spectral Characteristics of Asphalt Road Aging and Deterioration: Implications for Remote-Sensing Applications. Appl. Opt. 2005, 44, 7125. [Google Scholar] [CrossRef]
  47. Speta, M.A. Hyperspectral Imaging for the Characterization of Althabasca Oil Sands Core. Ph.D. Thesis, University of Alberta, Edmonton, AB, Canada, 2016. [Google Scholar]
  48. Amato, S.R.; Burnstock, A.; Michelin, A. A Preliminary Study on the Differentiation of Linseed and Poppy Oil Using Principal Component Analysis Methods Applied to Fiber Optics Reflectance Spectroscopy and Diffuse Reflectance Imaging Spectroscopy. Sensors 2020, 20, 7125. [Google Scholar] [CrossRef]
  49. Cloutis, E.A. Spectral Reflectance Properties of Hydrocarbons: Remote-Sensing Implications. Science 1989, 245, 165–168. [Google Scholar] [CrossRef] [PubMed]
  50. Poli, T.; Chiantore, O.; Nervo, M.; Piccirillo, A. Mid-IR Fiber-Optic Reflectance Spectroscopy for Identifying the Finish on Wooden Furniture. Anal. Bioanal. Chem. 2011, 400, 1161–1171. [Google Scholar] [CrossRef] [PubMed]
  51. Robertson, D.; Van Reenen, A.; Duveskog, H. A Comprehensive Investigation into the Structure-Property Relationship of Wax and How It Influences the Properties of Hot Melt Adhesives. Int. J. Adhes. Adhes. 2020, 99, 102559. [Google Scholar] [CrossRef]
  52. Chua, L.; Head, K.; Thomas, P.; Stuart, B. FTIR and Raman Microscopy of Organic Binders and Extraneous Organic Materials on Painted Ceremonial Objects from the Highlands of Papua New Guinea. Microchem. J. 2017, 134, 246–256. [Google Scholar] [CrossRef]
  53. Biribicchi, C.; Doutre, M.; Favero, G. Characterization and Assessment of Cleaning Systems Based on Fatty Acid Methyl Esters (FAMEs) for the Removal of Wax-Based Coatings from Cultural Heritage Objects. Mater. Adv. 2024, 5, 9359–9375. [Google Scholar] [CrossRef]
  54. Bucio, A.; Moreno-Tovar, R.; Bucio, L.; Espinosa-Dávila, J.; Anguebes-Franceschi, F. Characterization of Beeswax, Candelilla Wax and Paraffin Wax for Coating Cheeses. Coatings 2021, 11, 261. [Google Scholar] [CrossRef]
  55. Chen, Y.; Zhu, Z.; Shi, K.; Jiang, Z.; Guan, C.; Zhang, L.; Yang, T.; Xie, F. Shellac-Based Materials: Structures, Properties, and Applications. Int. J. Biol. Macromol. 2024, 279, 135102. [Google Scholar] [CrossRef] [PubMed]
  56. Truffa Giachet, M.; Schröter, J.; Brambilla, L. Characterization and Identification of Varnishes on Copper Alloys by Means of UV Imaging and FTIR. Coatings 2021, 11, 298. [Google Scholar] [CrossRef]
  57. Carlesi, S.; Ricci, M.; Cucci, C.; La Nasa, J.; Lofrumento, C.; Picollo, M.; Becucci, M. Multivariate Analysis of Combined Fourier Transform Near-Infrared Spectrometry (FT-NIR) and Raman Datasets for Improved Discrimination of Drying Oils. Appl. Spectrosc. 2015, 69, 865–876. [Google Scholar] [CrossRef] [PubMed]
  58. Provost, E.; Sugar, A. Surface Organic Coatings on Renaissance Bronzes at the Royal Ontario Museum: A Non-Destructive Spectroscopic Study, 2025. (Internal report).
  59. Provost, E.; Sugar, A. Non-destructive characterization of organic patinas on Renaissance bronzes using short-wave infrared and mid-infrared spectroscopy. In METAL 2025: Proceedings of the International Conference on Metals Conservation, Cardiff, UK, 1–5 September 2025; Emmerson, N., Thunberg, J., Watkinson, D., Eds.; Cardiff University: Cardiff, UK, 2025; pp. 231–237. [Google Scholar]
Figure 2. Linseed oil stoved on metal coupon ER-FTIR spectrum with assigned bands.
Coatings 15 01226 g002
Figure 3. Mastic resin stoved on metal coupon ER-FTIR spectrum with assigned bands.
Coatings 15 01226 g003
Figure 4. Bitumen stoved on metal coupon ER-FTIR spectrum with assigned bands.
Coatings 15 01226 g004
Figure 5. Comparison of linseed oil and mastic resin stoved on metal coupon ER-FTIR spectra highlighting areas of peak shifts and broadening.
Coatings 15 01226 g005
Figure 6. Comparison of linseed oil (black), mastic resin (blue), and linseed oil–mastic resin blend (orange) stoved on metal coupon ER-FTIR spectra with assigned bands.
Coatings 15 01226 g006
Figure 7. Linseed oil stoved on metal coupon FORS spectrum with assigned bands.
Coatings 15 01226 g007
Figure 8. Mastic resin stoved on metal coupon FORS spectrum with assigned bands.
Coatings 15 01226 g008
Figure 9. Bitumen stoved on metal coupon FORS spectrum with assigned bands.
Coatings 15 01226 g009
Figure 10. FORS spectra of mastic resin (black) and pine resin (blue) stoved on metal coupons, highlighting different absorption character between 1786 and 1667 nm. Highlighted region demonstrates the convoluted band observed in mastic resin and the subtle doublet in pine resin.
Coatings 15 01226 g010
Figure 11. (Left) Overall overlapped FORS spectra of linseed oil (black), mastic resin (orange), and linseed and mastic blend (blue) stoved on metal coupons. (Right) Zoomed area of C–H methylenic combination band near 2300 nm, with shifts/widening highlighted.
Coatings 15 01226 g011
Figure 12. Walnut–mastic–pine–bitumen stoved on metal coupon FORS spectrum with assigned bands.
Coatings 15 01226 g012
Figure 13. ER-FTIR spectra of wax (black) and shellac (gray) on metal.
Coatings 15 01226 g013
Figure 14. FORS spectra of wax (black) and shellac (gray) on metal.
Coatings 15 01226 g014
Figure 15. ER-FTIR spectrum tracking application and removal of wax on linseed oil-stoved mock-up (gray: linseed stoved on metal; black: wax on linseed stoved on metal; blue: linseed stoved on metal following removal of wax). Gray highlighted and zoomed band, corresponding to CH2 rocking vibrations (r), used to monitor application of wax.
Coatings 15 01226 g015
Figure 16. FORS spectrum tracking application and removal of wax on linseed oil-stoved mock-up (gray: linseed stoved on metal; black: wax on linseed stoved on metal; blue: linseed stoved on metal following removal of wax). Gray highlighted bands used to monitor application of wax.
Coatings 15 01226 g016
Figure 17. ER-FTIR spectrum tracking application and removal of shellac on walnut oil-stoved mock-up (gray: walnut stoved on metal; black: shellac on walnut stoved on metal; blue: walnut stoved on metal following removal of shellac). Gray highlighted areas correspond to areas of shifts used to monitor application of shellac.
Coatings 15 01226 g017
Figure 18. FORS spectrum tracking application and removal of shellac on walnut oil-stoved mock-up (gray: walnut stoved on metal; black: shellac on walnut stoved on metal; blue: walnut stoved on metal following removal of shellac). Gray highlighted bands monitor application of shellac.
Coatings 15 01226 g018
Table 1. Spectral ranges of NIR, SWIR, and MIR regions, with corresponding absorptions and characteristic features relevant to spectroscopy and cultural heritage analysis.
RegionInstrumentWavelength (nm)Wavenumber (cm−1)Features
NIRFORS780–250012,820–4000Overtones/combination bands
SWIRFORS1000–250010,000–4000Overtones/combination bands
MIRER-FTIR2500–25,0004000–400Fundamental vibrations
Table 2. Data from 237 data points of Renaissance bronze alloy analysis [8,36,37] (p. 552; pp. 236–237; pp. 88–89, 90–91, 116, 130, 199) compared to C836/C83600 leaded red brass.
ElementMin (%)Max (%)Average (%)C83600 (%)
Copper59.259685.5984–86
Tin0.1214.364.274.0–6.0
Lead041.644.094.0–6.0
Zinc031.14.944.0–6.0
Antimony03.290.420.25
Iron05.50.700.30
Nickel01.180.271.0
Silver00.410.14-
Arsenic020.52-
Silicon00.160.150.005
Phosphorus---1.50
Aluminum---0.005
Sulfur---0.08
Table 4. Artificial aging conditions per 24 h cycle.
Aging CycleCycle Periods and Conditions
1 cycle of 24 hNormal conditionstime = 8 hT = 23 °C
RH = 55%
Extreme conditionstime = 16 hT = 35 °C
RH = 90%
Table 5. ER-FTIR band assignment (cm−1, with an error margin of ±10 cm−1) for stoved reference materials on metal coupons prior to artificial aging [22,41,42,43,44,45]. (Underlined assignment indicates strong absorption; ν: stretching; δ: bending; a: asymmetric; s: symmetric; sh: shoulder.)
νa(CH2) + δ(CH2)νs(CH2) + δ(CH2)νOHνaCHνsCHνC=OδCHνC–O
Linseed oil4339425934683011 sh, 2926285217431532–13871166
Walnut oil4347425934683015 sh, 2924285217361523–13911164
Mastic resin4412 434734733079 sh, 2949286917071457, 13821247–1033
Pine resin~4389 34343070 sh, 294328702638 sh, 2529 sh, 1717, 16961460–13871247–1032
Bitumen 2952 sh, 29252852
Table 6. ER-FTIR band assignment (cm−1, with an error margin of ±10 cm−1) for linseed oil, mastic resin, and linseed and mastic blend, stoved on metal coupons, including description of observed shifts. (sh: shoulder.)
Linseed OilMastic ResinBlendObserved Change
νa(CH2) + δ(CH2)433944124338Weakening
νs(CH2) + δ(CH2)425943474251Weakening
νOH346834733500Increased absorbance
νaCH3011 sh, 29263079 sh, 29432928Shift and broadening
νsCH285228702855Shift and broadening
νC=O17432638 sh, 2529 sh, 1717, 16961739, 1711Splitting, shift, and broadening
δCH1532–13871460–13871453, 1378Shift, appearance of shoulders
νC–O11661247–10321162Increased absorbance
Table 7. FORS band assignment (nm) for stoved reference material on metal coupons prior to artificial aging [20,22,25,46,47]. (Underlined assignment indicates strong absorption; ν: stretching; δ: bending; a: asymmetric; s: symmetric; sh: shoulder.)
2ν(CH3) + δ(CH)2ν(CH2) + δ(CH2)2ν(Ar.CH)a+s(CH2)3ν(C=O)ν(OH) + δ(OH)ν(C=O) + δ(CH2)ν(Ar.CH) + ν(Ar.C=C)νa(CH2) + δ(CH2)νs(CH2) + δ(CH2)4δ(CC)ν(CH2) + ν(C–CO–O)aliphatic/aromatic
Linseed oil 17171929 2120–2165 23062347 2460–2480
Walnut oil 1716 2118–2169 23082355 2460–2486
Mastic resin13711426~1615 sh1706–1738 ~19402175, 2265 sh229924012463
Pine resin 1600–1623 sh1717–1774 2180230523542493
Bitumen 23112359–2408
Table 8. ER-FTIR band assignments (cm−1, with an error margin of ±10 cm−1) for spectral features, including overtones and combination bands for wax on metal [19,50] and shellac [50] on metal. (Underlined assignment indicates strong absorption; ν: stretching; δ: bending; ρ: rocking; a: asymmetric; s: symmetric; sh: shoulder.)
νa(CH2) + δ(CH2)νs(CH2) + δ(CH2)νOHνaCHνsCHνC=OδaCHδsCHδOHνC–OρCH2
Wax4320425035392952 sh, 29202849~171914721462, 1383 729, 718
Shellac~43383406292728561732 sh, 1715, 1634 sh14631455, 13771291, 1252, 11571038725
Table 9. FORS band assignments (nm) for spectral features, including overtones and combination bands for wax on metal [21,50] and shellac [50] on metal. (Underlined assignment indicates strong absorption; ν: stretching; δ: bending; a: asymmetric; s: symmetric; sh: shoulder.)
a(CH2)s(CH2)ν(C=O) + ν(CH2)νa(CH2) + δ(CH2)νs(CH2) + δ(CH2)?ν(CH) + ν(CO)/
OH vib.
Wax17301764 231212512386
Shellac1710~2135–217223052434, 2488
Disclaimer/Publisher’s Note: The statements, opinions and data contained in all publications are solely those of the individual author(s) and contributor(s) and not of MDPI and/or the editor(s). MDPI and/or the editor(s) disclaim responsibility for any injury to people or property resulting from any ideas, methods, instructions or products referred to in the content.