Article

Research on the Wrinkle Behavior of X80 Pipeline and B-Type Sleeve Repair Based on Finite Element Method

by
Hao Zhang
1,2,3,
Yuxing Li
1,3,*,
Hui Han
1,3,
Zhibo Guo
4 and
Ruibo Guo
5
1
College of Pipeline and Civil Engineering, China University of Petroleum (East China), Qingdao 266580, China
2
CNPC Tubular Goods Research Institute, Xi’an 710077, China
3
Shandong Provincial Key Laboratory of Oil, Gas and New Energy Storage and Transportation Safety, Qingdao 266580, China
4
CNPC First Oil Production Plant of Changqing Oilfield, Xi’an 710077, China
5
Longi Green Energy Technology Co., Ltd., Xi’an 710064, China
*
Author to whom correspondence should be addressed.
Coatings 2025, 15(10), 1191; https://doi.org/10.3390/coatings15101191
Submission received: 23 June 2025 / Revised: 5 September 2025 / Accepted: 17 September 2025 / Published: 10 October 2025

Abstract

Pipelines are critical infrastructure for energy transportation, but long-term service under complex loading can cause local buckling failures. This study investigates the wrinkle behavior of API-X80 pipelines under combined internal pressure and bending using finite element analysis. The results show that increasing internal pressure significantly improves structural stability and delays wrinkle formation by suppressing cross-sectional ovalization. Wrinkle growth and protrusion height were quantified under various geometric and load conditions. Furthermore, a convex B-type sleeve repair method was modeled and optimized using response surface methodology and genetic algorithms. The optimized sleeve design effectively mitigates stress concentration around the defect area. This work provides a theoretical foundation for understanding wrinkle mechanisms and enhancing pipeline integrity under complex loads.

1. Introduction

Pipelines, as the fastest, most reliable, and most economical means of transporting oil and natural gas, are regarded as a national energy lifeline project, and the safety and reliability of their structure and operation have become increasingly prominent, attracting widespread attention [1,2,3,4,5]. For oil and gas transmission pipelines that are thousands of kilometers long, approximately 98% are laid underground; however, because buried pipelines are in direct contact with the surrounding soil and rock, they are greatly influenced by geological strata, and geological hazards can cause pipeline damage and failure. Studies [6,7,8] have shown that among all geological hazards, severe ground shaking is the primary cause of damage to surface structures and to buried pipelines in urban infrastructure, and it can sometimes induce buckling deformation in pipelines, leading to potential safety risks during pipeline operation.
Due to the highly complex service conditions of oil and gas pipelines, buckling deformations under compression are typically difficult to predict, and the resulting folds are strongly influenced by the material properties and pipeline specifications. Research on predictive formulae for the critical buckling strain of steel pipes has a history of more than 50 years. In current standards, the formulae commonly used for predicting the limit compressive strain are found in the Det Norske Veritas (DNV) [9] and Canadian Standards Association (CSA) [10] codes. Traditional theoretical analysis of pipeline buckling deformation is not highly accurate, the regularity of wrinkle formation is not well-defined, and experimental research on this phenomenon is associated with high costs and long durations [11,12]. In 1927, Brazier [13] discovered the extreme buckling phenomenon of pipelines. In 1992, Ju et al. [14] studied the influence of the diameter-to-thickness ratio (D/t) of pipes on local buckling behavior. In 2005, Iflefel et al. [15] investigated the effect of dent depth on the ultimate bending moment of pressurized pipelines under bending loads. They found that when a dent occurs on the compressive side of the pipeline, it is more dangerous than when it occurs on the tensile side, and the buckling modes differ under these two conditions. In 2007, Blachut et al. [16] introduced dents in five small-diameter pipelines and conducted four-point bending tests to analyze the buckling behavior of pressurized pipelines with dents. Comparison showed that the simulation results of the denting process agree well with the experimental results, whereas the simulated buckling load is lower than the pipeline’s critical buckling load. With the breakthrough development of computer technology, numerical simulation techniques have been increasingly applied to pipeline–soil analysis. In particular, the finite element method has gradually been widely used in safety studies of buried pipelines under permanent ground deformations. In 2012, Beak et al. [17] used Abaqus to simulate the ultimate bending moment of a large-diameter API-X65 pipeline. Cai et al. [18], based on experimental data and numerical results, proposed an empirical formula for calculating the ultimate bending moment when a planar dent is located on the compressive side of the pipeline. Bai et al. [19], based on formulae for intact pipelines and considering the effects of dent angle and position, developed a predictive model for the ultimate bending moment of dented pipelines. Yu et al. [20] used a finite element model to study the failure behavior of pipelines under axial tension and torsion.
Sun et al. [21] investigated the failure pressure of X46/X60/X80 grade pipelines with corrosion defects of various geometries and orientations using finite element modeling, with a focus on the influence of defect interaction on pipeline integrity. Their study revealed that failure pressure decreases with increasing interaction between defects, with longitudinal defects exhibiting a wider interaction range, while circumferential spacing had a weaker effect. Overlapping defects significantly reduce failure pressure compared to single-layer defects, and increasing defect depth and length intensifies the interaction effect, further weakening the pipeline’s load-bearing capacity. Zhang et al. [22] employed finite element analysis to model B-type sleeve fillet welds and analyzed stress and stress concentration factors under varying crack lengths, depths, and angles. The results showed that the maximum stress concentration factor increases with crack length and depth, and initially increases then decreases with the increase in crack inclination angle. Robert et al. [23] conducted finite element analysis to compare pressurized and non-pressurized annular sleeves, finding that maximum stress occurred at the weld toe and root. They also developed a model linking pressure fluctuations to weld stress and proposed a fatigue crack propagation prediction algorithm. Their study suggested that the decision to drill holes in pipelines should consider operating pressure, dimensional parameters, and residual stress distribution. Liu et al. [24] developed a three-dimensional parametric finite element model of the pipeline–soil system using the finite element method. Arc-length and nonlinear stabilization algorithms were used to simulate the strain-softening behavior after pipeline plastic failure. Additionally, the effects of soil type and model size on maximum pipeline deflection were investigated. The proposed finite element approach provides a basis for safe design, failure assessment, and engineering acceptance standards for pipeline buckling failure.
The sleeve repair technique was first introduced in the 1970s by the British Gas Corporation. This method involves externally installing a steel sleeve at the damaged section of a pipeline to restore structural strength or seal ability. Its core principle is to allow the sleeve to share the pipeline load or seal the leakage, thereby extending pipeline service life. Sleeve repair has now become a relatively mature technology for addressing various pipeline defects such as internal and external corrosion [25], dents, buckling wrinkles, and fatigue cracks [26]. Currently, commonly used sleeve repair types for oil and gas pipelines include Type A sleeves, Type B sleeves, and epoxy sleeves.
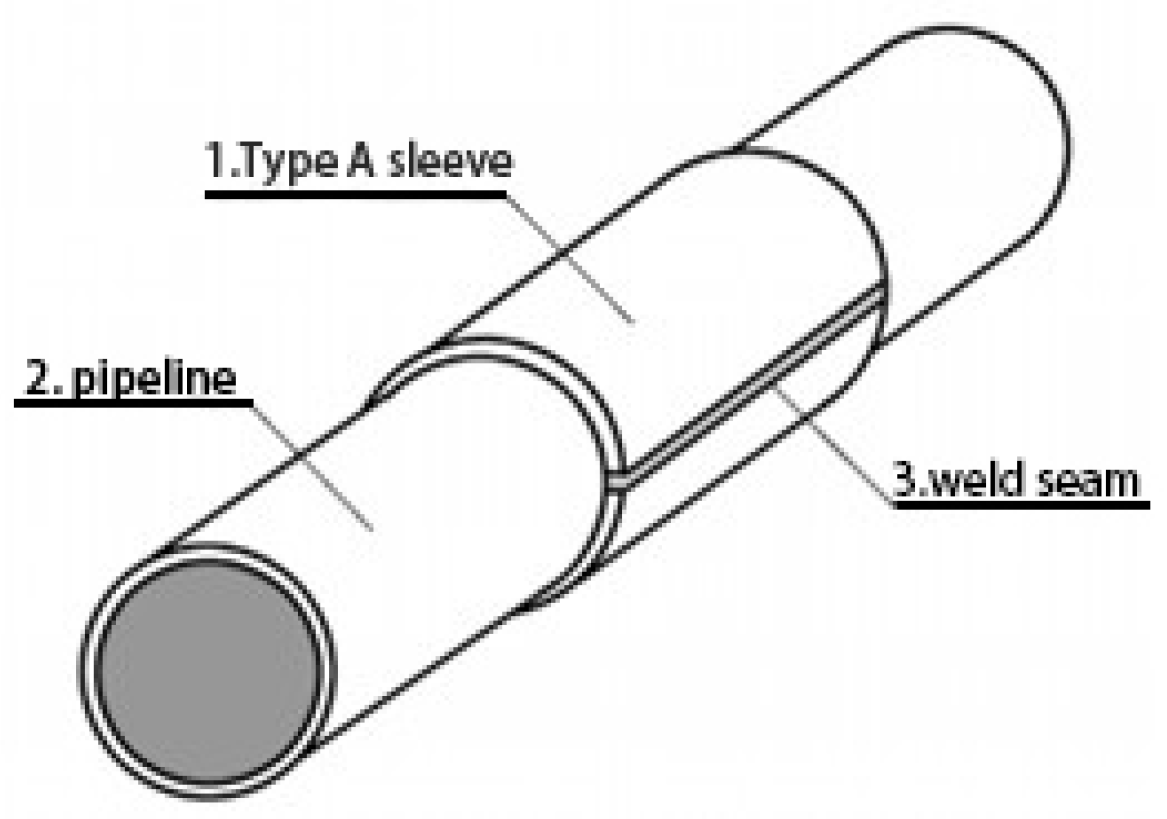
The conventional Type A sleeve typically consists of a pair of semi-cylindrical steel plates covering the defect area, joined by longitudinal side welds. The sleeve structure is illustrated in Figure 1. A key feature of this design is that it does not require welding onto the pipeline itself, making the repair process relatively simple. This type of sleeve is non-pressure-bearing and can provide reinforcement to the defected area, but it does not affect axial stress in the pipeline. It is mainly applicable to the repair of wall damage, arc burns, dents in the pipe body, dents in longitudinal welds, and cracks, but is unsuitable for repairing circumferential defects, leakages, or defects prone to further development.
In the figure, 1 represents the traditional Type A sleeve, 2 denotes the transmission pipeline, and 3 indicates the axial side weld seam.
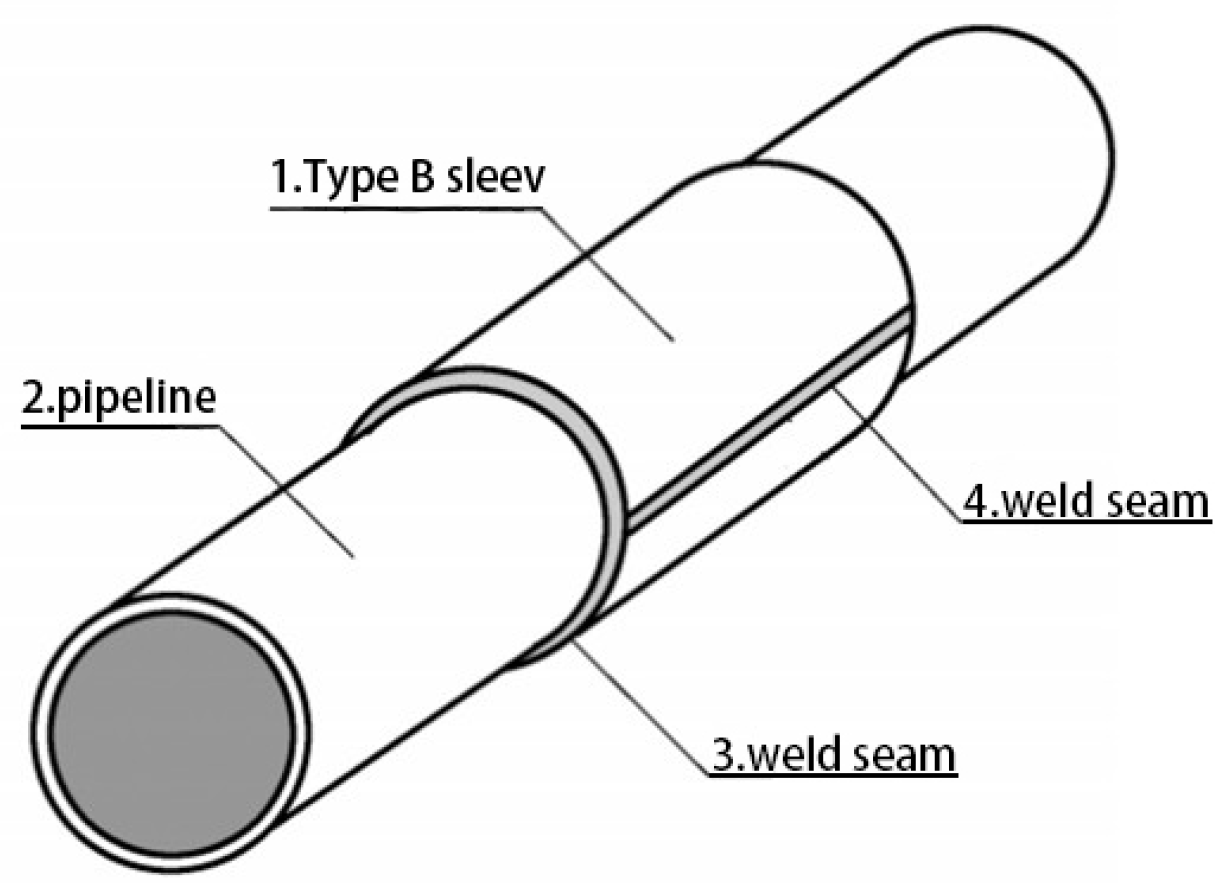
The structural design of traditional Type B sleeve repair is similar to that of Type A sleeve repair. Both utilize two semi-cylindrical shells made from steel plates that cover the defect area on the pipeline, with the center of the axial length of the defect aligned at the midpoint of the sleeve length. The two sleeve halves are welded together along two longitudinal side seams. A key distinguishing feature of the Type B sleeve is that its ends are fillet-welded to the transmission pipeline. The basic structural form of the Type B sleeve is shown in Figure 2.
As a pressure-bearing sleeve, the Type B sleeve is designed to withstand internal pressure no less than the pipeline’s design pressure; it also resists axial stress induced by pipeline bending or axial loads. The Type B sleeve is suitable for repairing a wide range of defects, including leaks and circumferential flaws that cannot be addressed by Type A sleeves, making it a critical pipeline defect repair technology. Due to the requirement for circumferential fillet welding, the construction process of Type B sleeve repair is more complex than that of Type A sleeve repair [27]. However, compared to pipe replacement methods, Type B sleeve repair offers significant advantages, including shorter repair time, relatively lower costs, and reduced environmental impact.
In the figure, 1 represents the traditional Type B sleeve, 2 denotes the transmission pipeline, 3 indicates the axial side weld seam, and 4 is the circumferential fillet weld.
In the field of Type B sleeve repair technology for pipelines, both domestic and international scholars have conducted a series of systematic studies and practical applications. In developed countries—particularly the United States and Canada—research teams have long focused on the engineering applications and performance improvement of oil and gas pipeline repair technologies. Their core research areas primarily concentrate on improving repair efficiency, reducing repair costs, and ensuring repair quality. Xu et al. [28] investigated the effects of Type B sleeve welding on X80 pipeline steel through physic-chemical property testing and corrosion experiments. They found that welding did not significantly alter the base material’s physical and chemical properties. The main corrosive agents identified were O2, SO42−, and Cl, and both the heat-affected zone and the sleeve material showed increased susceptibility to degradation with extended corrosion time. Wang et al. [29] applied X70 steel Type B sleeves and associated technologies to repair circumferential weld defects in φ1016 mm X80 grade gas transmission pipelines. Their verification process—using hydrostatic cycling, non-destructive testing, macroscopic inspection, and mechanical property testing—showed that under high-pressure fluctuations, defects did not propagate, weld defects were well controlled, performance metrics met standards, though errors were observed in PAUT (Phased Array Ultrasonic Testing) results. They concluded that this technique ensures long-term safe operation of defect-containing pipelines and recommended its broader application in oil and gas infrastructure. Ma et al. [30] evaluated the reliability of using Type B steel sleeves to repair circumferential weld defects in X80 pipelines. Results indicated that in cases of circumferential weld leakage, the load-bearing capacity of the Type B sleeve effectively maintained pipeline operational safety. However, welding heat significantly affected the surface material properties of the main pipeline. The influence of longitudinal welds was found to be smaller than that of circumferential fillet welds. Grain coarsening was observed in the heat-affected zone of the fillet weld, resulting in increased hardness and a 5.5% reduction in yield strength in the lower section of the main pipe beneath the fillet weld. Surface cracking occurred during bend testing, indicating a certain degree of service risk.
Currently, studies on the buckling behavior of pipelines under bending loads have mainly focused on the combined effects of wall thickness, outer diameter, and dents, while research on the influence of internal pressure on pipeline buckling behavior remains limited. Based on this, the present study investigates the buckling deformation behavior of buried pipelines under external forces. It analyzes the deformation patterns of API-X80 pipelines with varying outer diameters, wall thicknesses, and internal pressure conditions, aiming to provide a theoretical basis for understanding buckling failure mechanisms under service conditions. Simultaneously, a pipeline repair method based on response surface methodology and genetic algorithm has been proposed [31].
Despite extensive studies on pipeline local buckling under bending, limited attention has been given to the combined effects of internal pressure and bending on wrinkle formation and protrusion development, especially in high-grade pipelines like API-X80. Furthermore, while sleeve repair techniques are widely applied, few studies have focused on optimizing B-type sleeve structures tailored to accommodate pressure-induced wrinkling. In this context, this study addresses the coupled bending pressure-induced wrinkle behavior of X80 pipelines and proposes a convex B-type sleeve design optimized through response surface methodology (RSM) and genetic algorithm (GA), filling a current gap in the literature and providing a reference for practical repair designs.
2. Modeling Methodology

2.1. Riks Algorithm

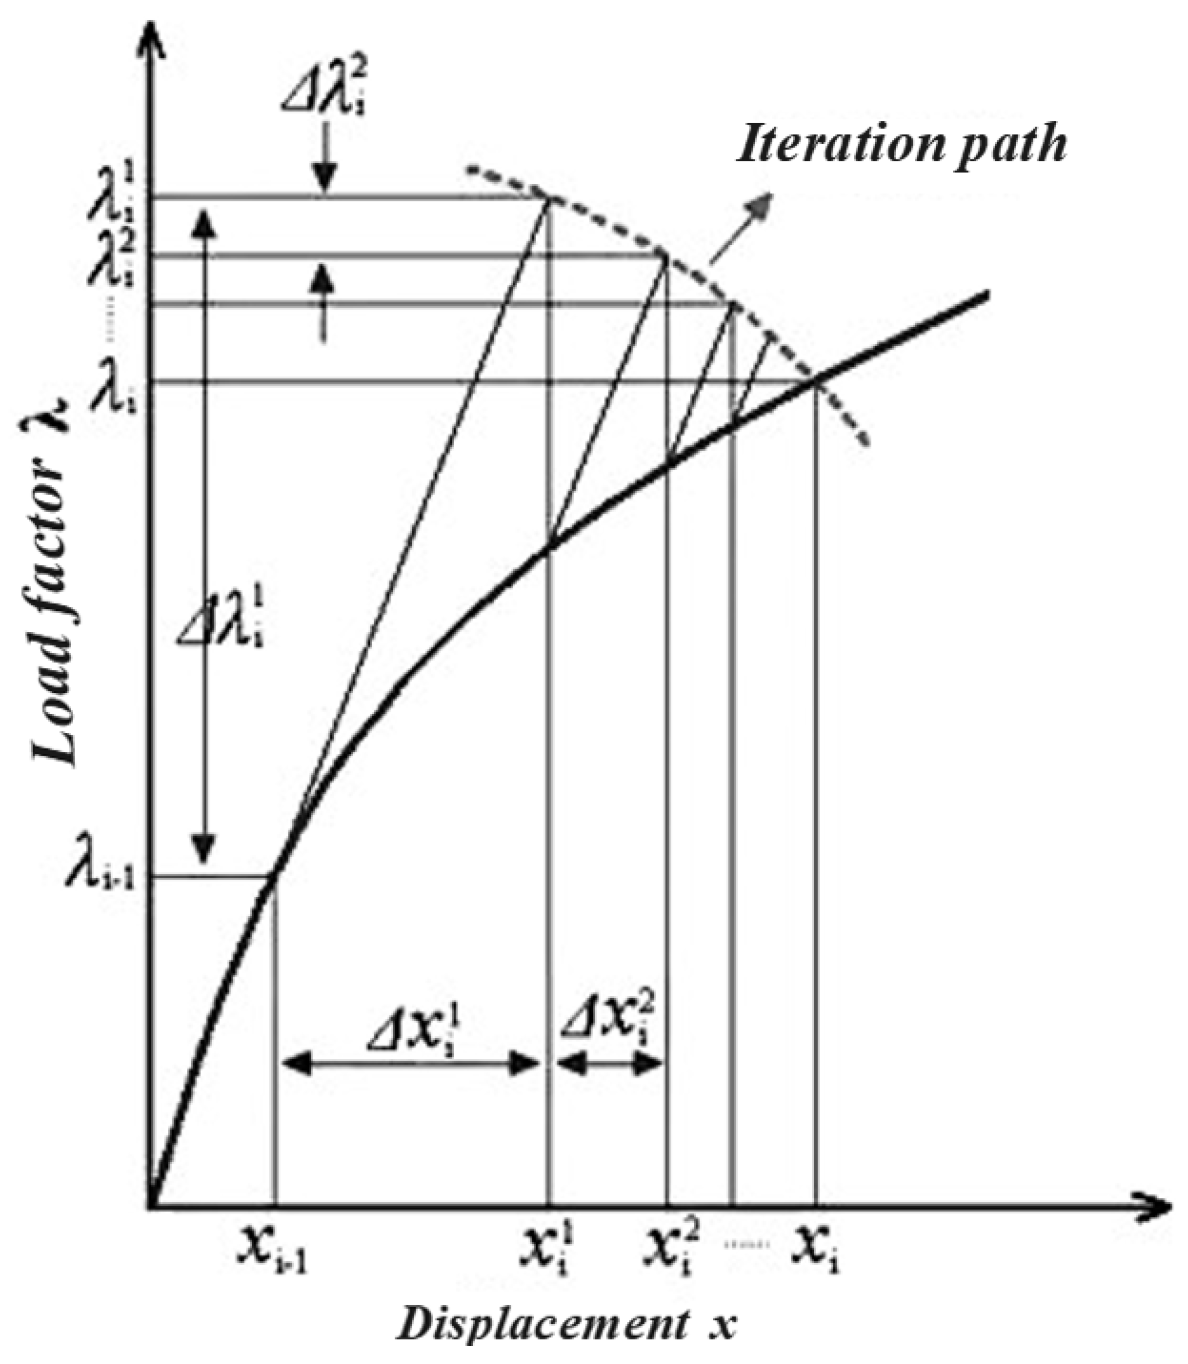
In finite element methods, common solution techniques for nonlinear problems include the Newton-Raphson method [32] and the arc-length method (also known as the Riks method). At present, the arc-length method has become one of the standard approaches for solving post-buckling and softening stages. The Riks algorithm [33] is a numerical analysis method specifically designed to address structural stability and ultimate load problems in nonlinear systems. It is considered one of the most stable, efficient, and reliable iterative control methods in structural nonlinear analysis. Its ability to effectively analyze pre- and post-buckling behavior and accurately trace the buckling path has earned it a distinguished reputation in the field of structural engineering.
In Figure 3, the subscript i denotes the i -th load step, and the superscript j represents the j -th iteration within the i -th load step. Evidently, when the load increment λ i j = 0 , ( j 2 ) , the iteration path follows a straight line parallel to the axis, corresponding to the Newton-Raphson method.
Assuming the ( i 1 ) -th load step has converged to point x ( i 1 ) , λ ( i 1 ) , the i -th load step requires j iterations to reach a new convergence point x i , λ i . In ABAQUS (https://www.3ds.com/products/simulia/abaqus, accessed on 16 September 2025), the external reference load F r e f must be applied in the form of an external load, so the actual force acting on the structure is scaled by a factor λ F r e f . In the Newton-Raphson method, since the load increment step Δλ is constant under either load or displacement control, it cannot pass through limit points to capture the complete load–displacement curve. In fact, only a variable load increment step can enable the solution to traverse through such critical points.
As shown in Figure 3, the load increment step Δ λ in the arc-length method is variable, allowing automatic control of the applied load. However, this introduces an additional unknown into the original system of equations. Therefore, a supplementary constraint equation is required to close the system, which is typically expressed as:
( x i j x i 1 ) 2 + ( λ i j λ i 1 ) 2 = l i 2
Equation (1) indicates that the iterative path in the Riks algorithm follows a circular arc centered at the convergence point of the previous load step ( x i 1 λ i 1 ) , with a radius of l i . Typically, an initial arc-length radius l 1 or a fixed arc-length radius l 0 must be specified. When an initial arc-length radius is defined, the radius l i for subsequent steps is usually adjusted according to the convergence rate, as calculated by Equation (2), where n d is the desired number of iterations per load step—generally taken as 6—and n i 1 is the number of iterations in the previous load step, capped at 10 when it exceeds that value.
l i = l i 1 n d n i 1
When j = 1 , the tangent stiffness matrix K i for the i -th load step is obtained from the configuration that converged at the end of the ( i 1 )-th load step; this matrix corresponds to the slope of the slanted parallel line shown in Figure 3. Using Equation (2), the corresponding tangent displacement associated with F r e f can then be determined.
K i x r e f = F r e f
l i 2 = ( Δ λ i 1 ) 2 + ( Δ x i 1 ) 2 = ( Δ λ i 1 ) 2 + ( Δ λ i 1 ) x r e f i 2
Δ λ i 1 = l i 1 + x r e f i T x r e f i
λ i 1 can be readily obtained from Equation (5), but its sign cannot be directly determined. However, the sign of Δ λ i 1 is crucial, as it dictates whether the path-following analysis proceeds forward or backward. In ABAQUS, the sign is determined according to Equation (6):
Δ λ i 1 x r e f i T x r e f i 1 + Δ λ i 1 1 > 0
When j 2 , to simplify the solution process of Δ λ i 1 , the tangent plane method can be employed, which involves replacing the circular arc with a vector perpendicular to the tangent line. That is:
x i j x i 1 , λ i j λ i 1 Δ x i j ,   Δ λ i j = 0
The relationship that needs to be supplemented is:
K i Δ x i j = Δ λ i j F r e f R i j 1
R i j 1 = { F i n t } i j 1 F e x t i j 1
F e x t i j 1 = λ i j 1 F r e f i
It is important to note that if material plasticity is considered, the tangent stiffness matrix at each iteration step must be based on the current configuration of that specific iteration.

2.2. Wrinkling Model Development

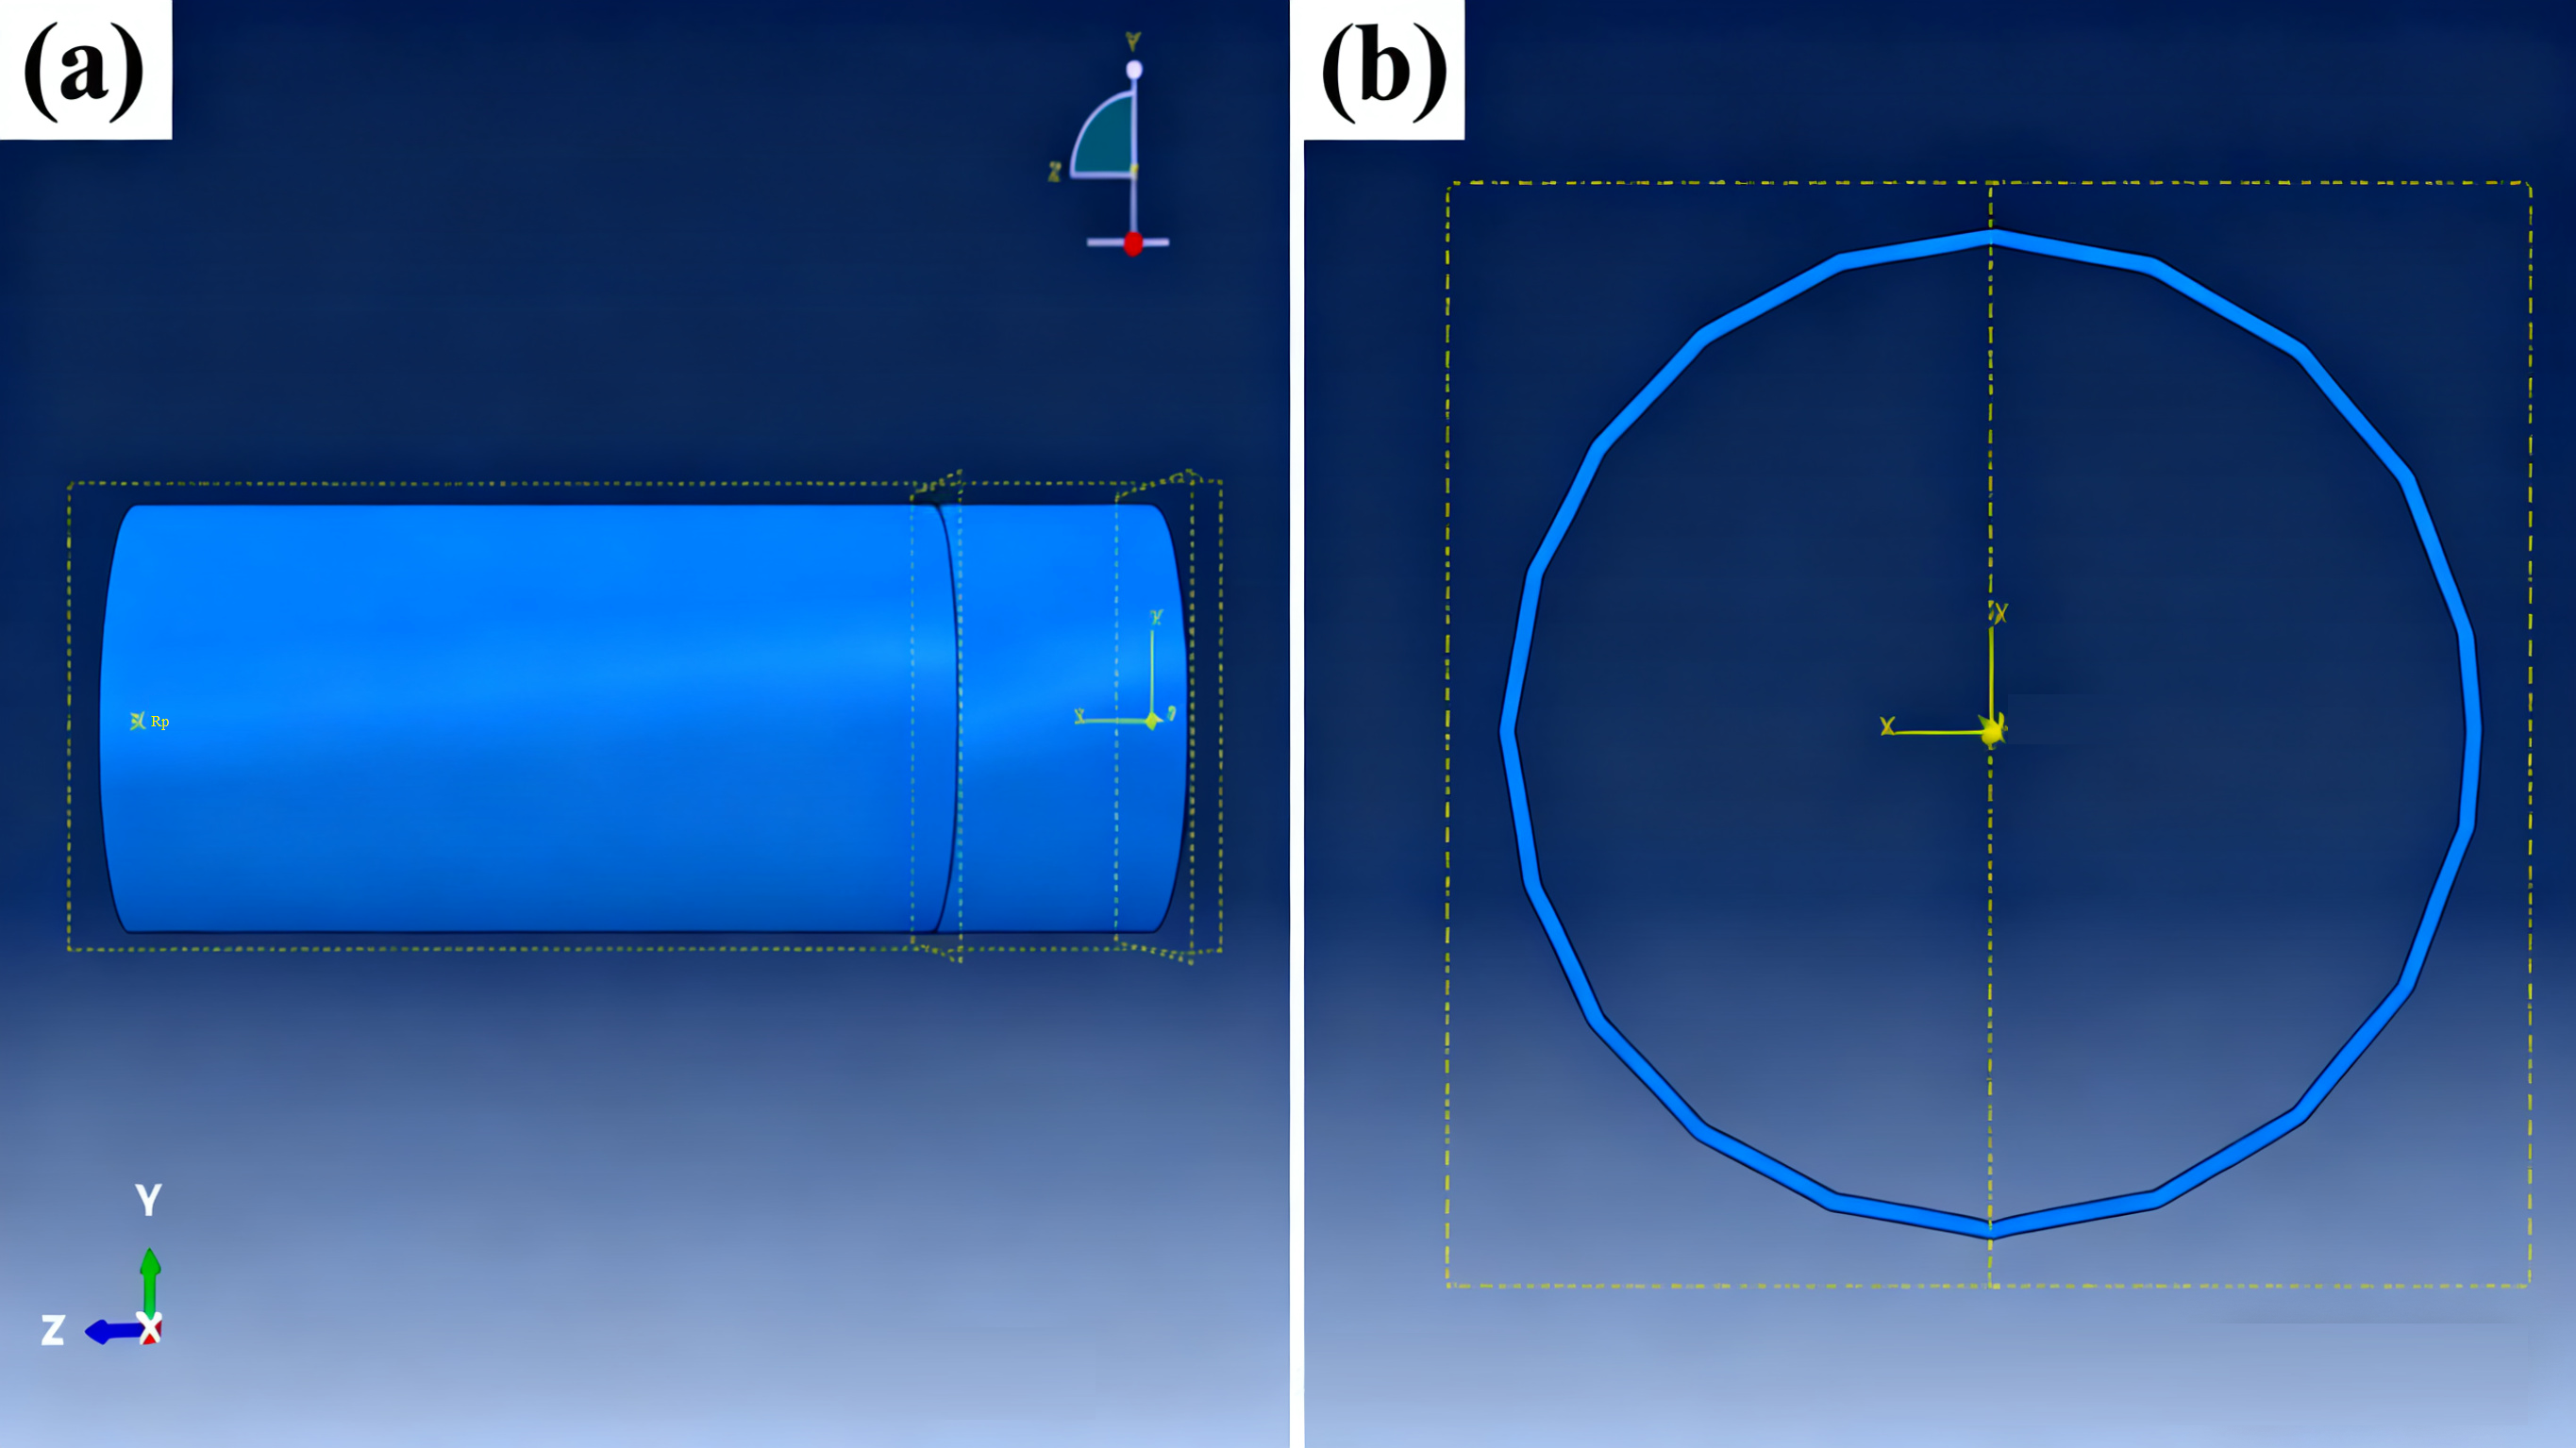
Figure 4a,b show the front and side views of the pipeline geometry model, respectively. Relevant material parameters, including elastic and plastic properties, are assigned to the pipeline model. The material of the X80 pipeline was modeled as elastic–plastic steel with isotropic hardening behavior. A standard bilinear stress–strain relationship was used, and yielding was governed by the von Mises yield criterion. Strain-rate effects were neglected due to quasi-static loading conditions.
Plastic properties were defined through tabulated true stress–true plastic strain data, based on typical mechanical behavior of high-strength pipeline steels. These values were incorporated into the model using standard material definition options in ABAQUS.
To ensure simulation stability and convergence, reduced-integration solid elements (C3D8R) were employed with enhanced hourglass control, and the mesh was locally refined in regions of expected high gradient deformation. To balance simulation accuracy and computational efficiency, twenty sets of plastic parameters are defined. In the loading module, internal pressure is applied to the inner wall of the pipeline, as shown in Figure 5a, and different levels of internal pressure are applied in the model as listed in Table 1. The rightmost 1000 mm section of the pipeline is fully fixed, while a vertically upward displacement load is applied to the left end of the model to induce bending deformation, as illustrated in Figure 5b. The progression of local buckling under bending is illustrated in Figure 5c. As the bending moment increases, compressive stresses accumulate on the inner arc of the pipe, resulting in local instability and the formation of outward wrinkles. The cross-section of the pipe transitions from circular to ovalized, and a localized wrinkled zone develops as deformation intensifies. This process reflects the typical nonlinear post-buckling behavior of high-strength steel pipelines under bending loads. Figure 6a presents an overall schematic of the mesh generation for the pipeline. Given the need to account for large deformation and analyze the pipeline’s response under bending loads, reduced integration linear brick elements (C3D8R) are used for meshing. Figure 6b shows a detailed view of the mesh in the localized bending region of the pipeline. Since stress and strain are more concentrated in the bent portion, the mesh is refined in this area to enhance calculation accuracy and precision.
The study employed multiple API-X80 pipeline models with varying outer diameters and wall thicknesses. For each pipeline specification, four different internal pressure load levels were applied. The detailed parameter settings for the different pipeline models used in the study are listed in Table 1.

3. Simulation Study of Pipeline Wrinkling

3.1. Simulation Results of Wrinkling

3.1.1. Stress Distribution in X80-1016-12.8 Pipeline

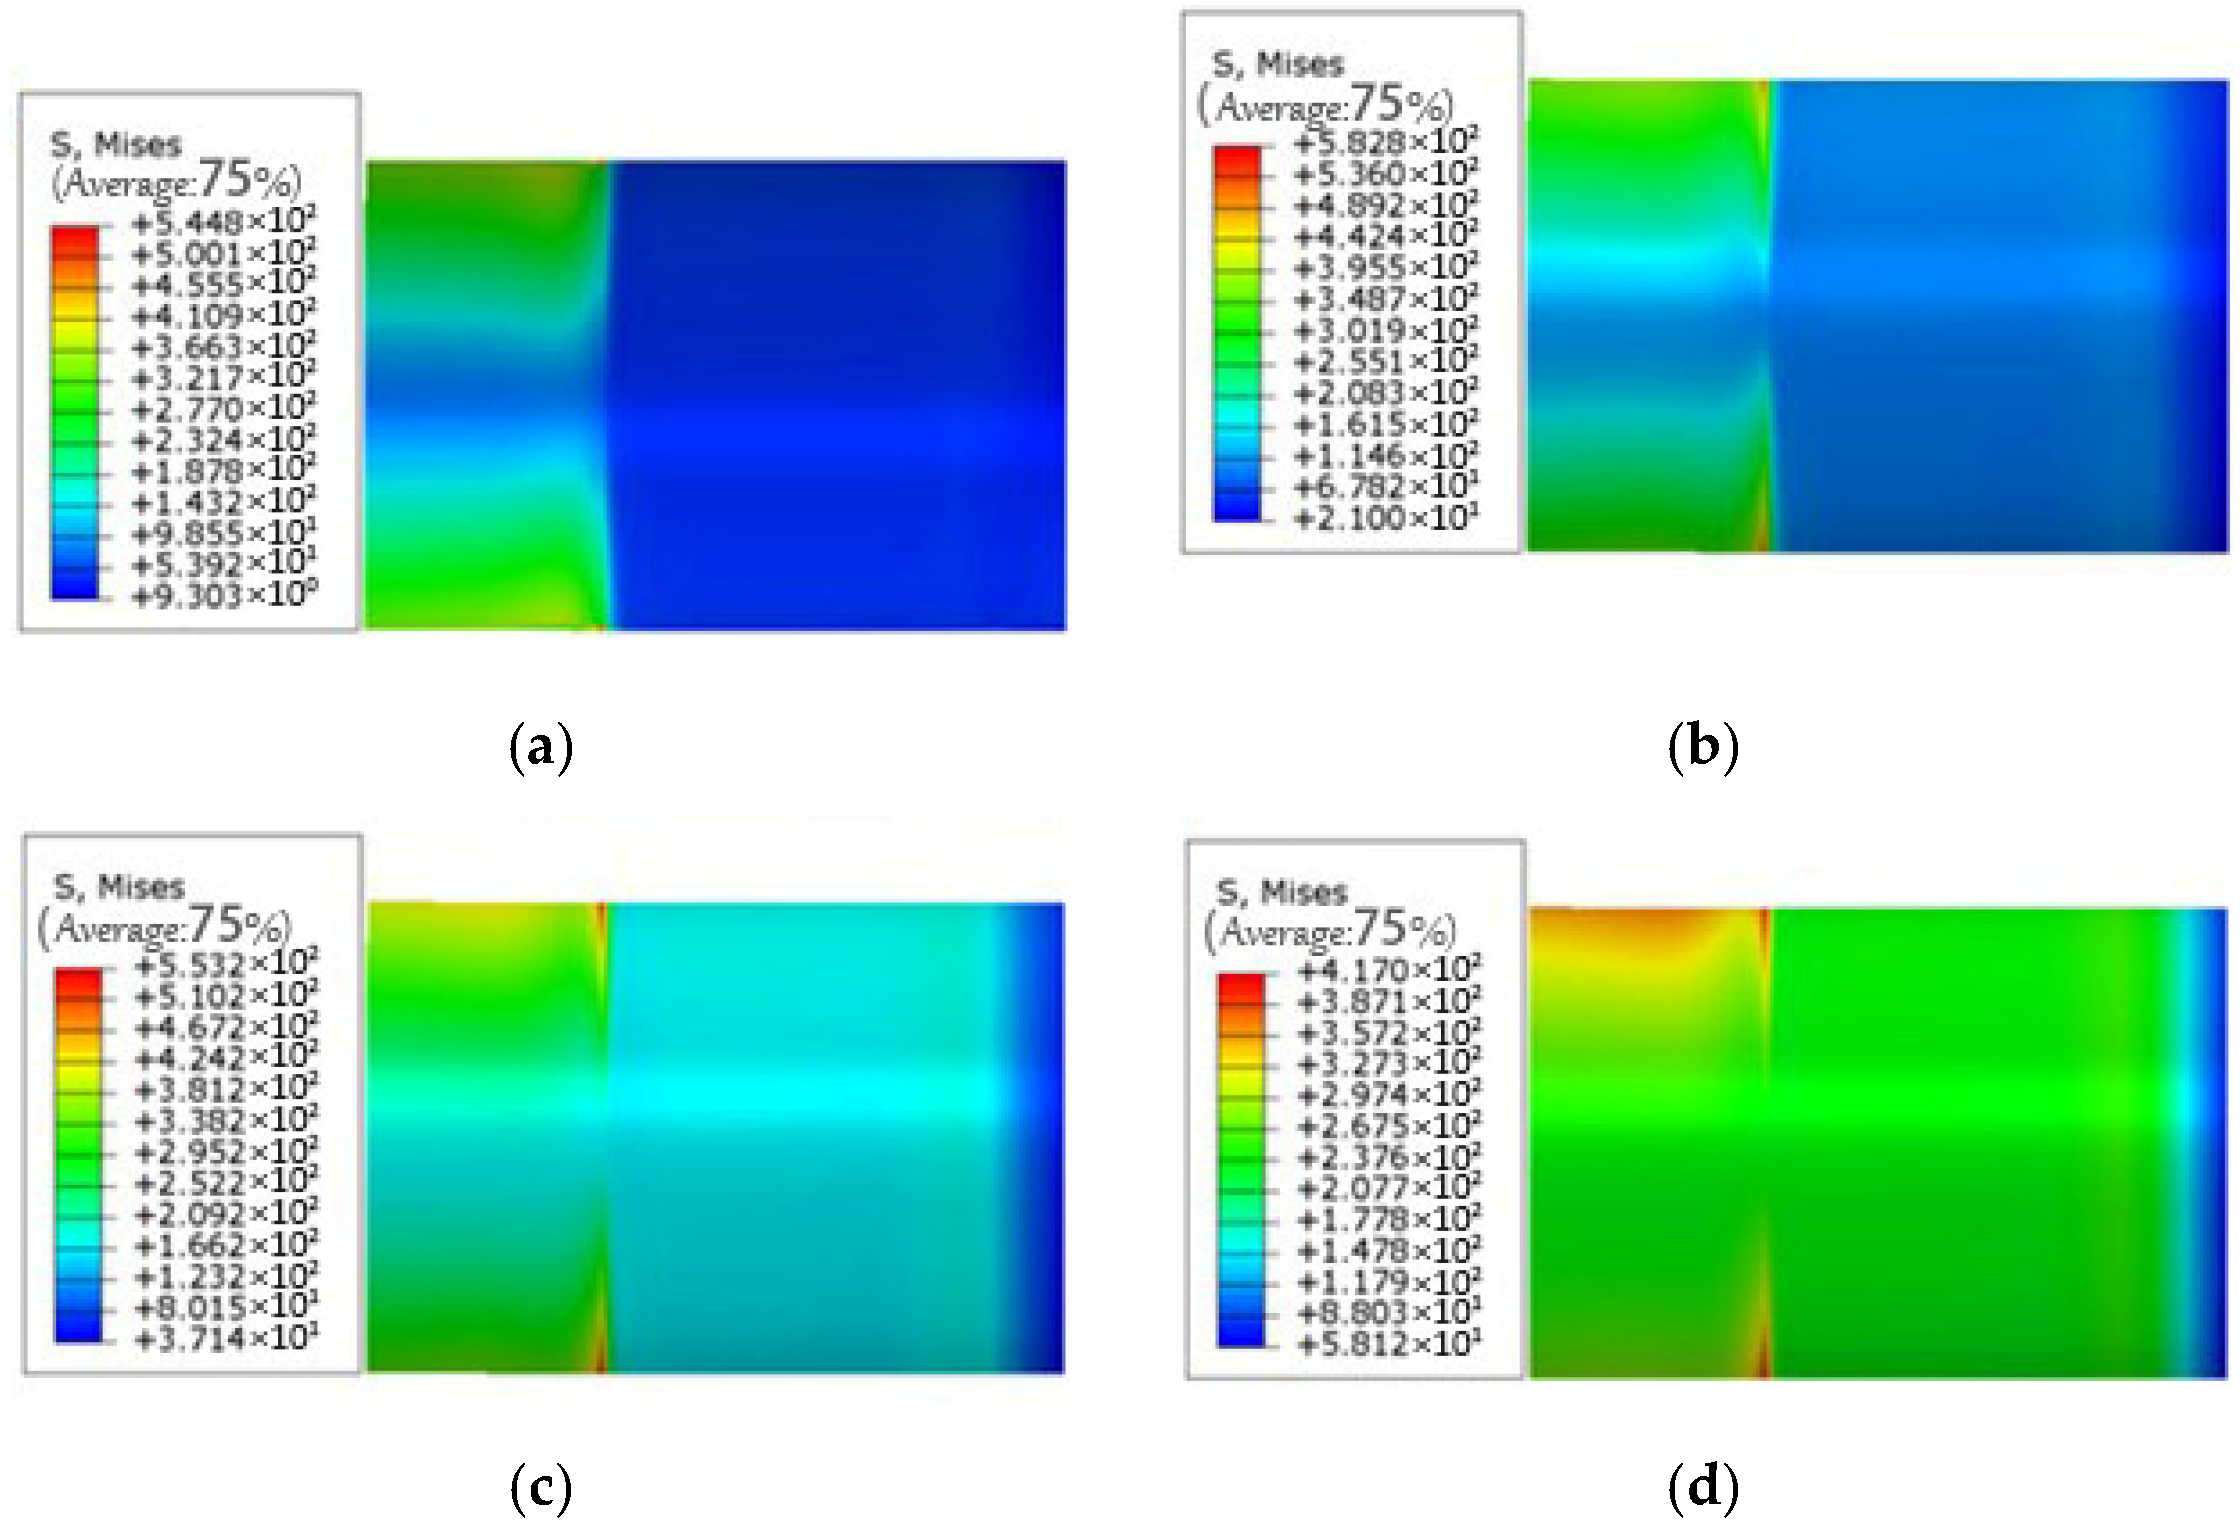
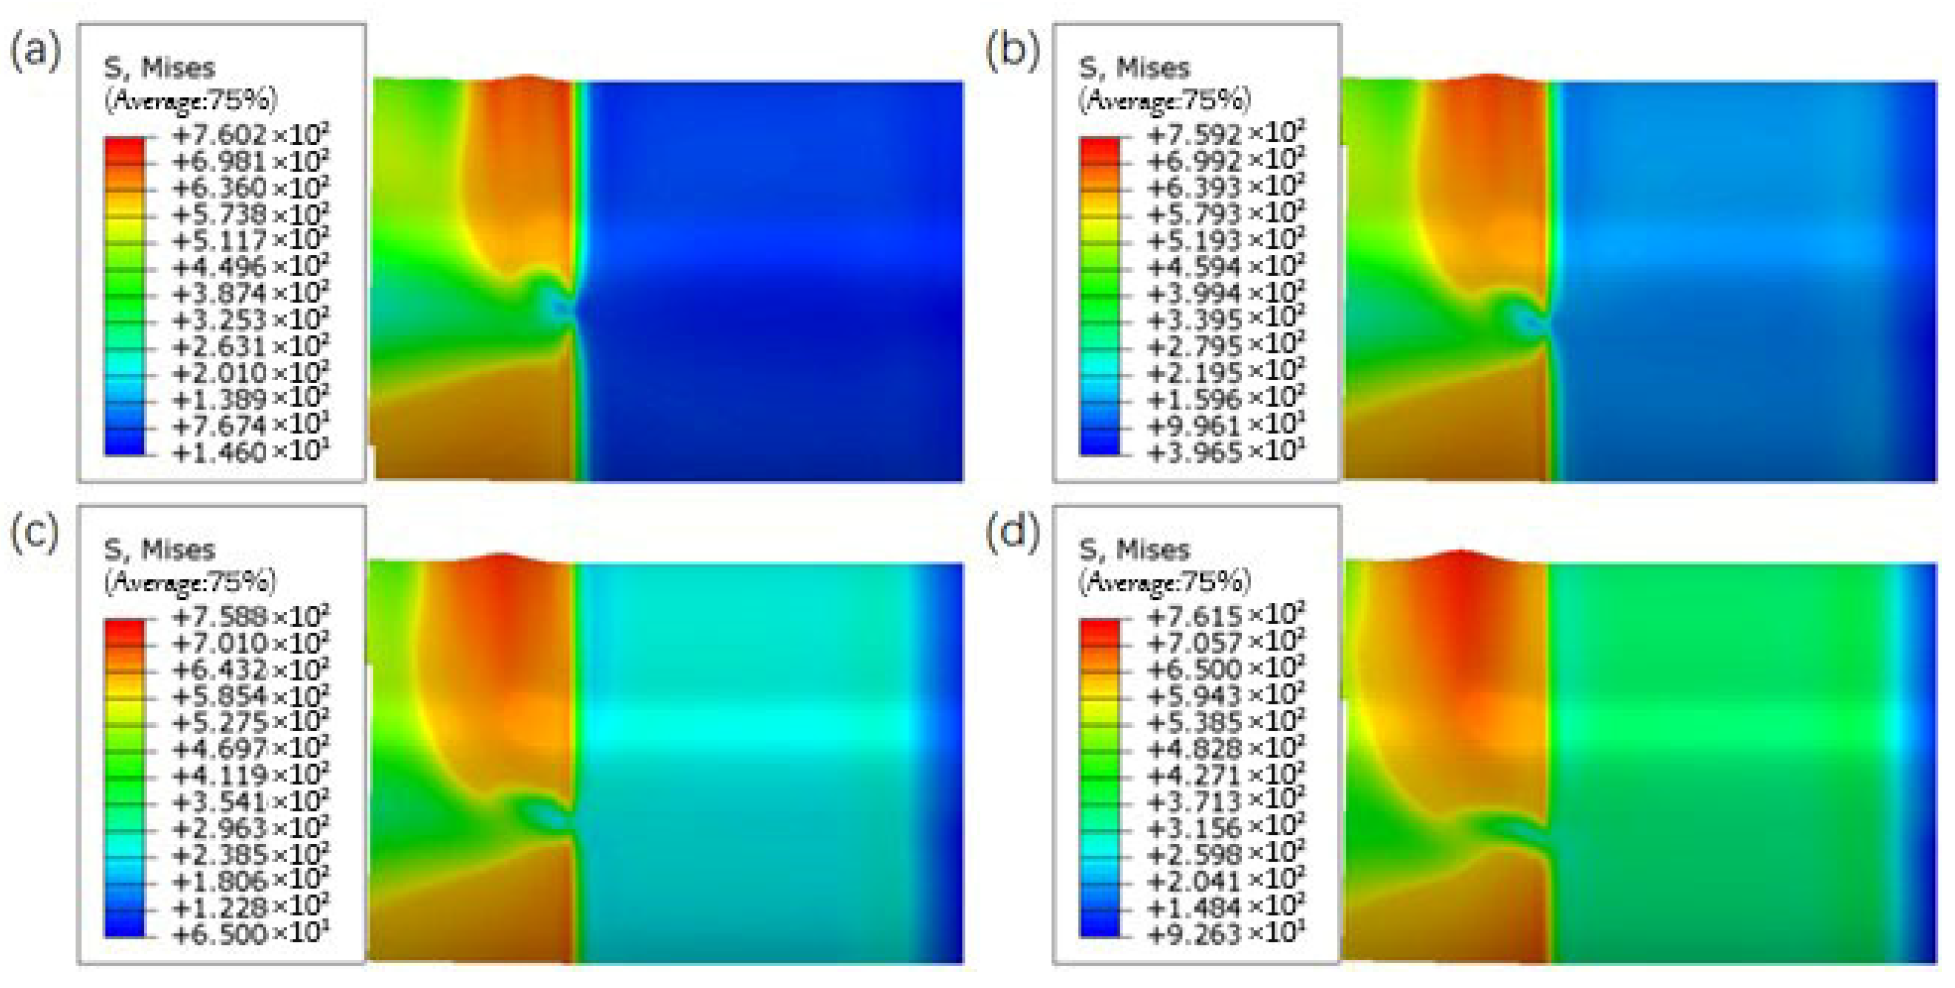
Figure 7 shows the stress distribution of an X80 pipeline with an outer diameter of 1016 mm and a wall thickness of 12.8 mm before bending occurs. Figure 7a–d correspond to internal pressures of 1 MPa, 4 MPa, 7 MPa, and 10 MPa. The results indicate that prior to bending, the stress distribution is relatively uniform and the overall stress level is low. Stress is mainly concentrated in the central fixed region, suggesting that greater stress concentration occurs in the bending zone. The stress distribution in the upper and lower sections of the pipeline is approximately mirror-symmetric. Furthermore, as the internal pressure increases, the critical stress before the onset of bending also rises accordingly.
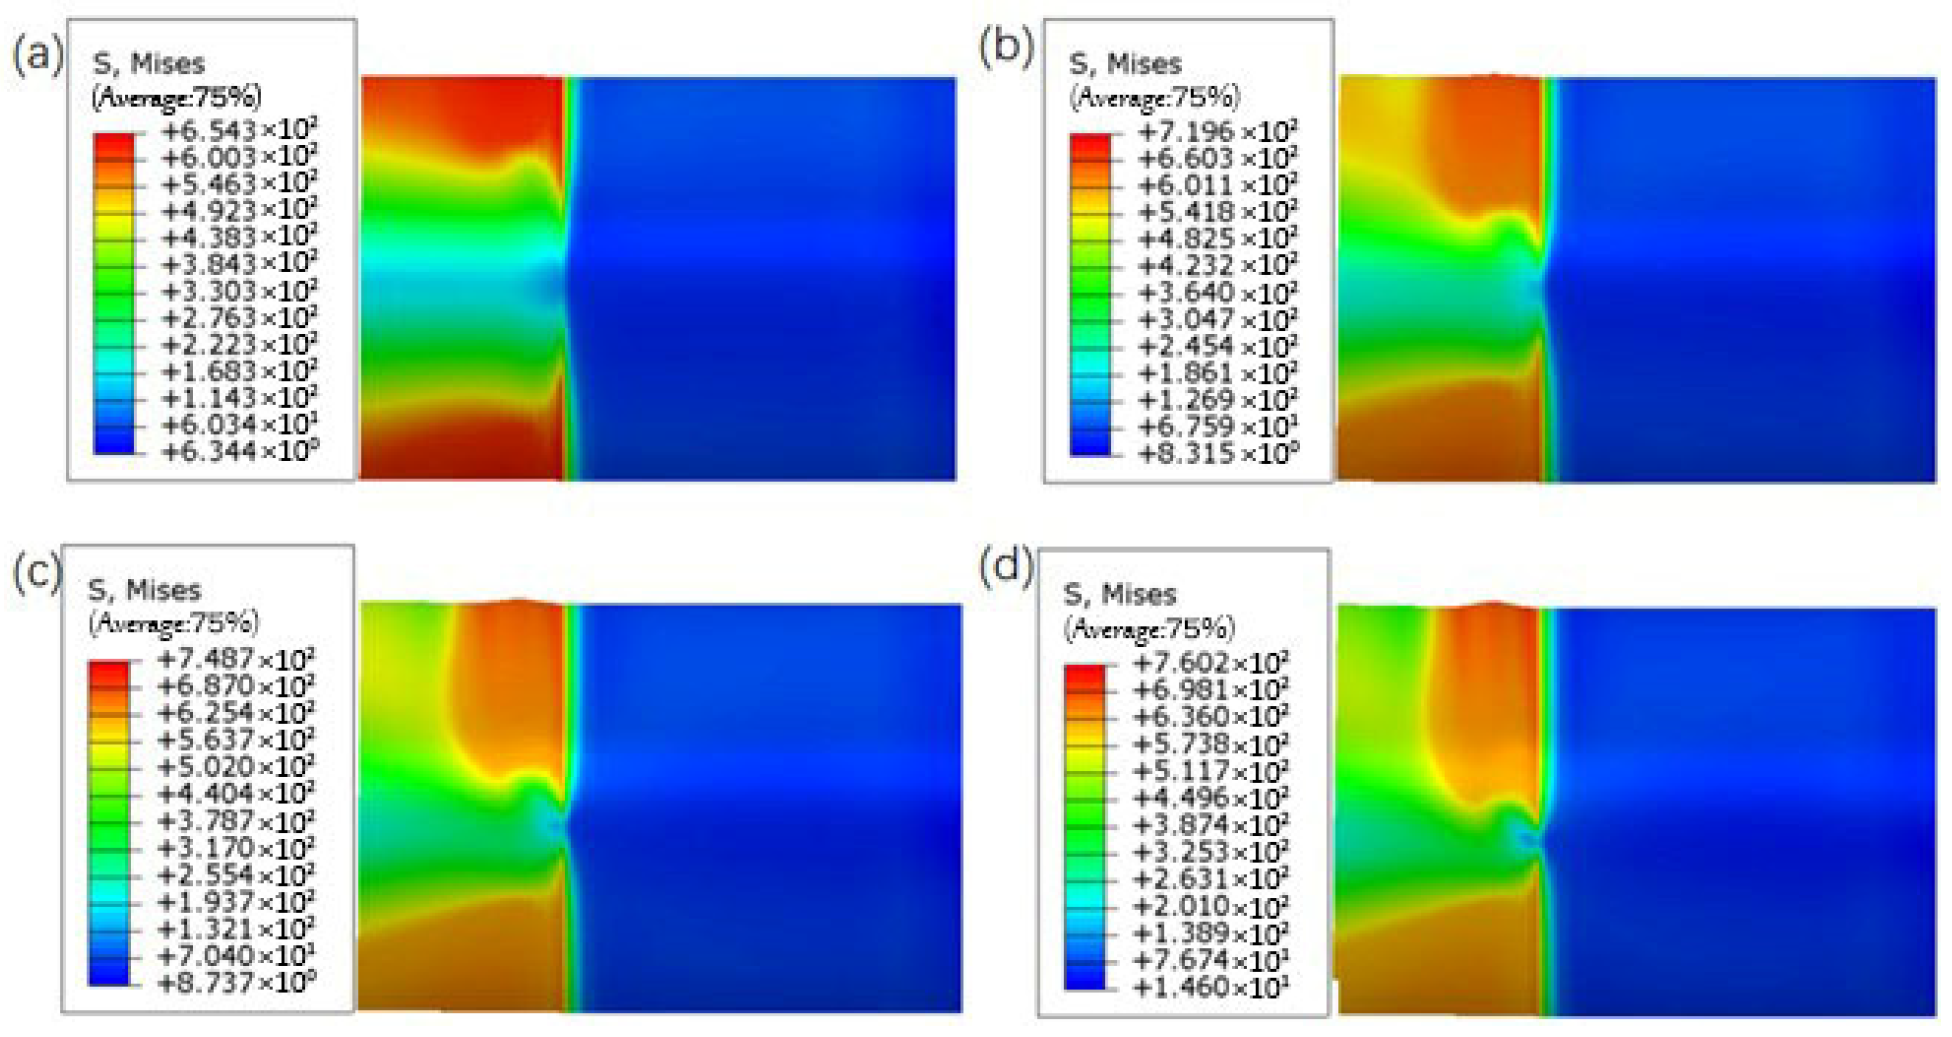
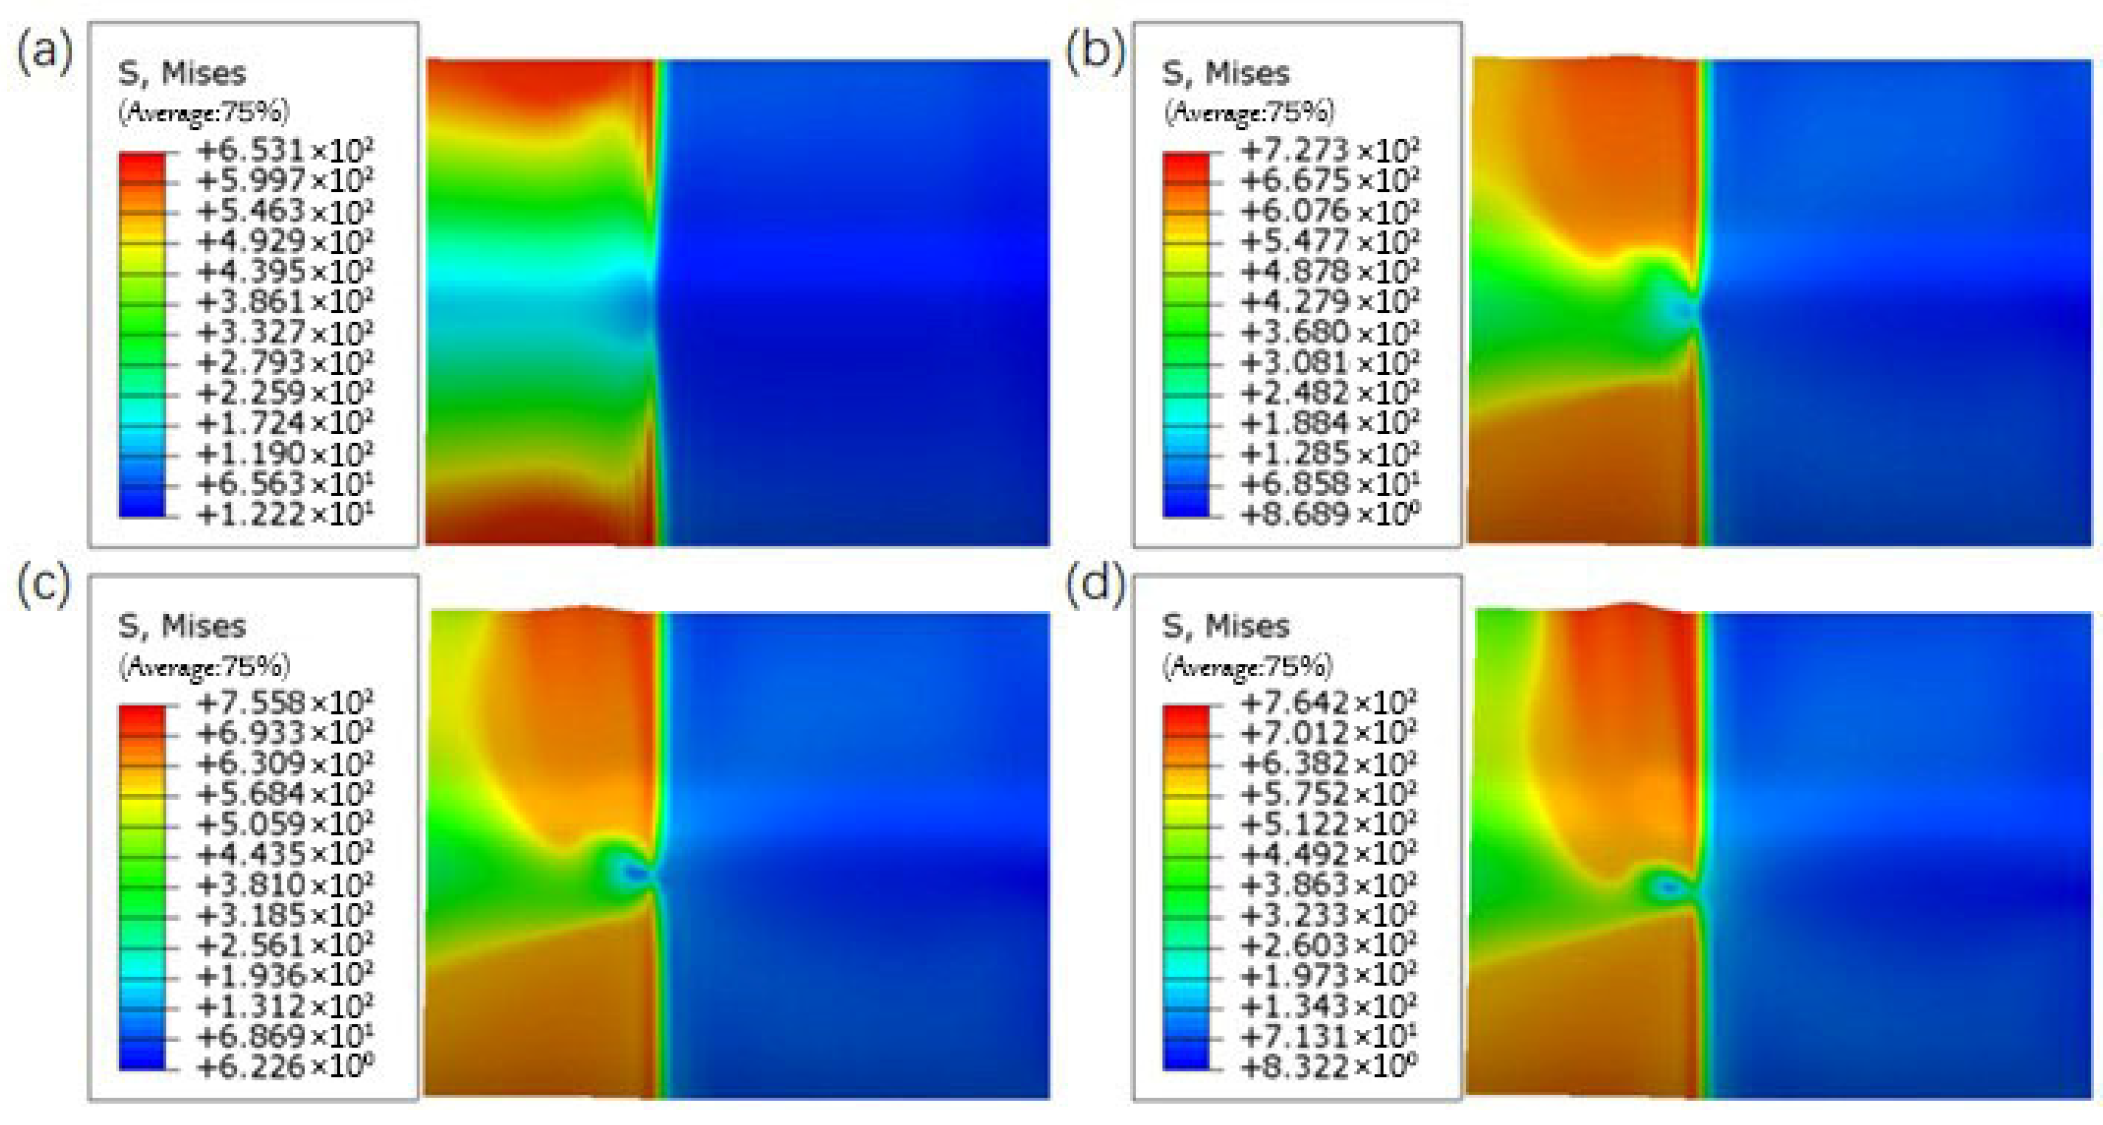
Figure 8 illustrates the local stress distribution of the X80-1016-12.8 pipeline under an internal pressure of 1 MPa after bending begins. Figure 8a–d, respectively, represent the stress distributions at different strain levels. In Figure 8a, when the pipeline strain is 0.01, the stress distribution on the upper and lower parts of the pipe wall appears mirror-symmetric, with relatively low stress levels in the central region. In Figure 8b, at a strain of 0.03, the stress distribution remains largely unchanged. As shown in Figure 8c, when the strain increases to 0.05, the upper part of the pipe wall begins to bulge, and stress starts to concentrate at the bulged area, while the stress distribution in the lower tensile region of the pipe wall remains essentially unchanged. In Figure 8d, at a strain of 0.08, the pipeline bulge becomes pronounced, and the stress at the bulge increases. From the peak of the bulge extending radially outward, the stress in the pipeline gradually decreases.
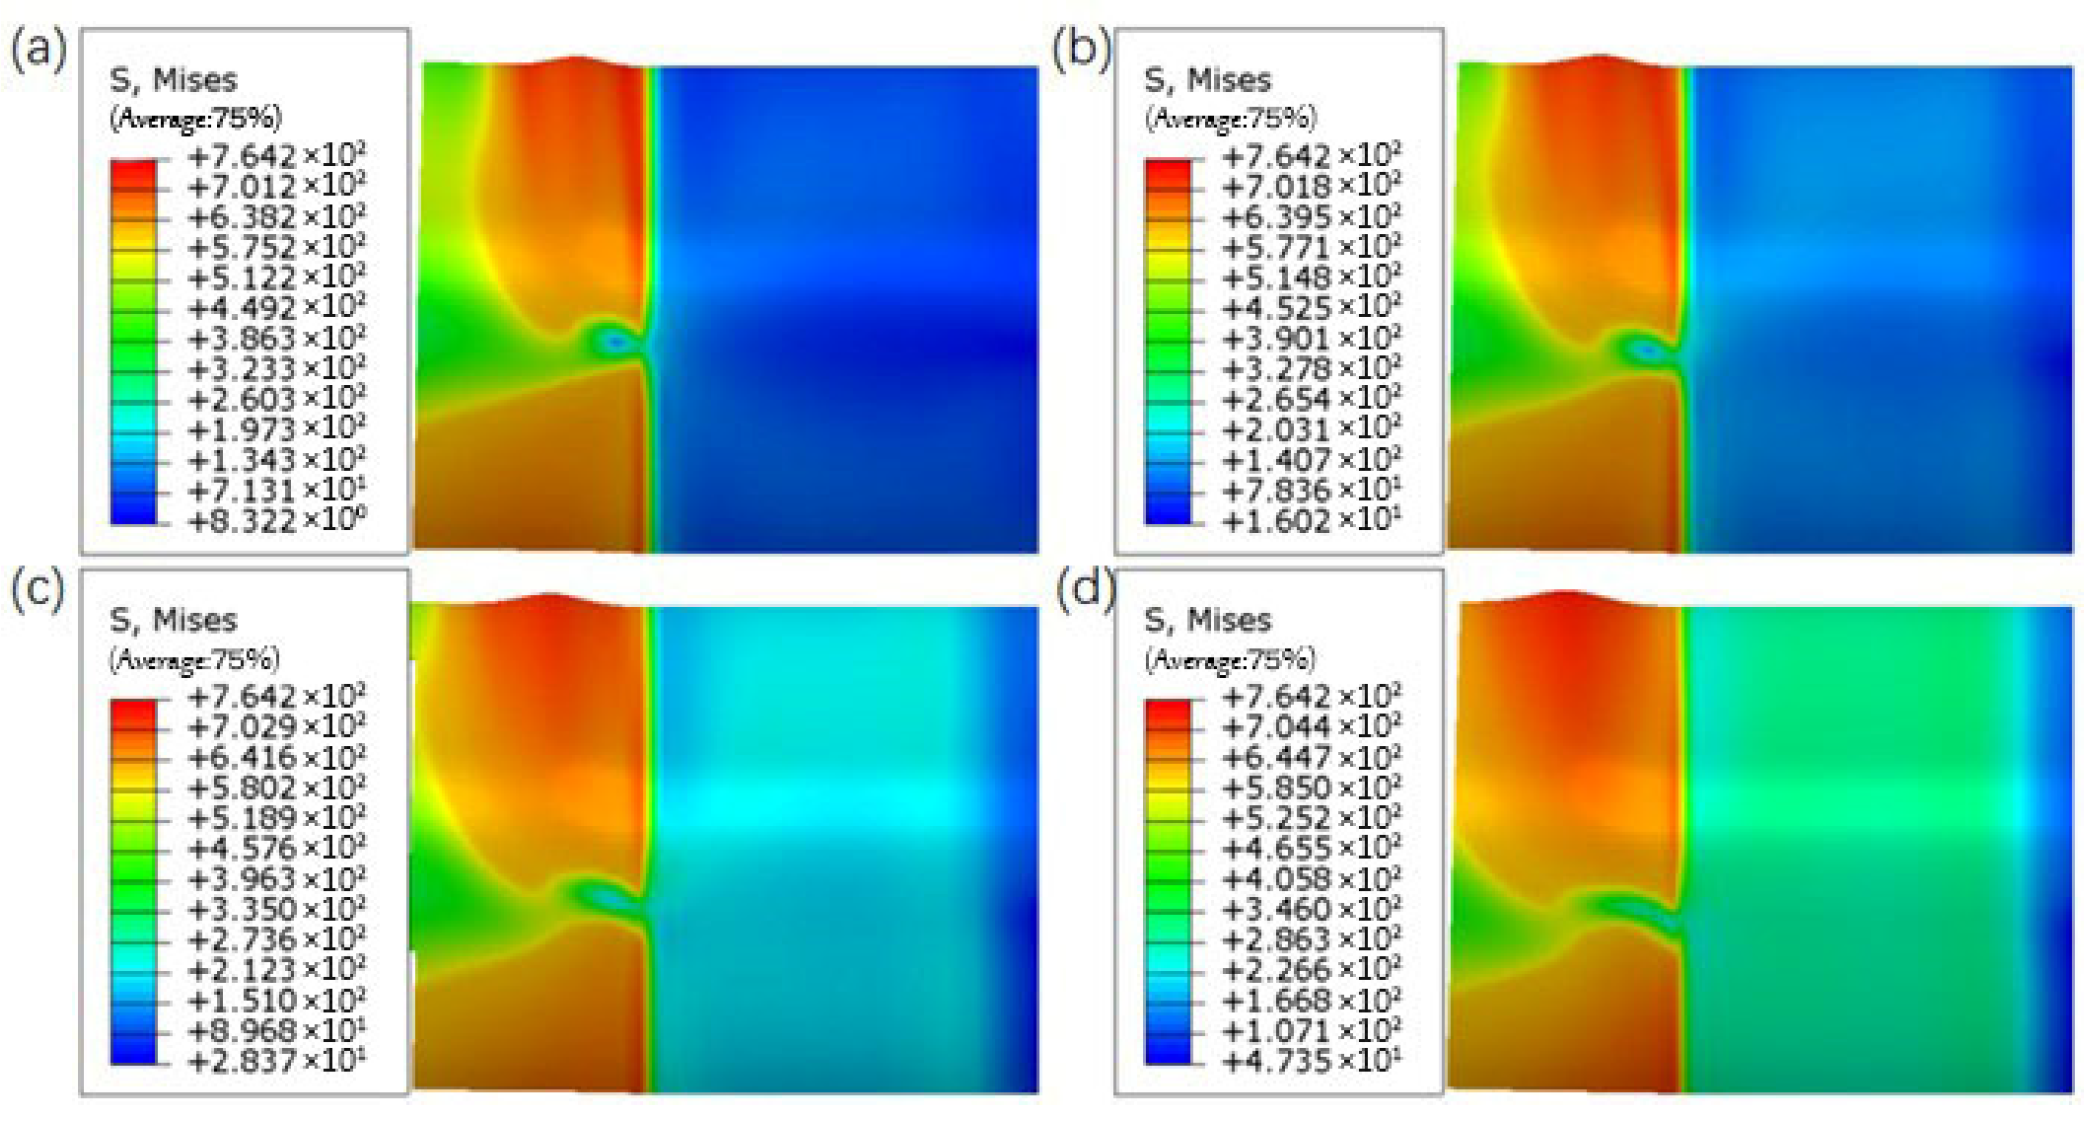
Using a necking strain of 0.08 as the failure criterion for API-X80 pipelines, Figure 9a–d show the stress distribution of the X80-1016-12.8 pipeline at a strain of 0.08 under different internal pressures. It can be observed that when the strain reaches the necking point, the upper part of the pipe wall near the fixed end is compressed, while the lower part is subjected to tension. Local buckling occurs in the compressed region, forming a circumferential “compression-type” band-shaped bulge, which generally extends along the circumferential direction. Moreover, the magnitude of internal pressure does not significantly alter the overall stress distribution pattern in the pipeline. The stress remains primarily concentrated in the bulged region of the pipe wall and in the lower tensile area, with the highest stress occurring at the bulge, slightly higher than that in the tensile region.

3.1.2. Stress Distribution in X80-1219-22 Pipeline

Figure 10 illustrates the stress distribution of the X80 pipeline with an outer diameter of 1219 mm and wall thickness of 22 mm before the onset of bending. Figure 10a–d represent internal pressures of 1 MPa, 4 MPa, 8 MPa, and 12 MPa. The results indicate that, prior to bending, the stress distribution is relatively uniform, with a generally low overall stress level. Stress is mainly concentrated in the fixed central region, where bending induces significant stress concentration. A comparison between Figure 7 and Figure 10 reveals that the stress distributions for the X80-1016-12.8 and X80-1219-22 pipelines are consistent. This is because, prior to bending, the vertical displacement load applied to the pipe tends to compress the upper portion of the pipe wall and stretch the lower portion. Meanwhile, the internal pressure exerted on the inner wall provides a supporting effect, partially offsetting the internal stress and resisting the pipe wall’s tendency to shrink or stretch. As a result, higher stress is required to initiate bending, and the critical stress prior to bending increases with increasing internal pressure.
Figure 11 shows the stress distribution of the X80-1219-22 pipeline under an internal pressure of 1 MPa after the onset of bending. Figure 11a–d represent the stress distribution at different strain levels. It can be observed that the stress distributions under varying strains are relatively consistent, primarily concentrated in the bulging and tensile regions of the pipe wall, while the central region along the axial direction exhibits a more uniform stress distribution. When the strain is 0.01, the stress distribution on the upper and lower parts of the pipe wall exhibits mirror symmetry, with relatively low stress in the middle. As the strain increases, the upper part of the pipe wall gradually bulges, and stress begins to concentrate in the bulging region, while the stress distribution in the lower tensile region remains largely unchanged. A comparison of Figure 8 and Figure 11 indicates that the stress distributions of the X80-1016-12.8 and X80-1219-22 pipelines are essentially consistent at the same strain levels. This consistency is primarily due to the supporting effect of internal pressure on the pipe wall. During bending, the pipe wall does not collapse inward but rather bulges outward, and the bent section of the wall undergoes severe buckling deformation, forming protruding wrinkles.
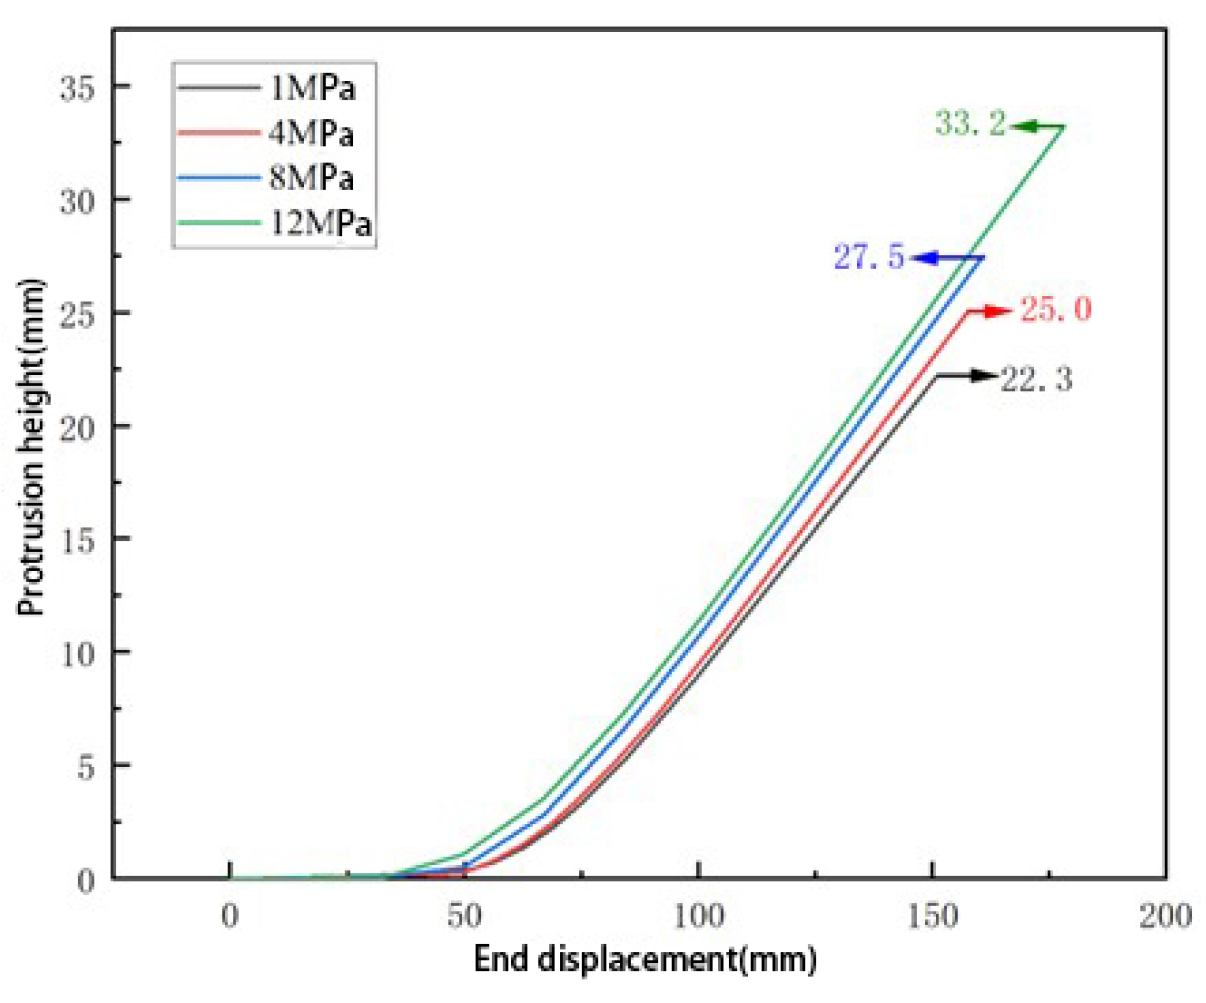
Figure 12a–d present the stress distribution of the X80-1219-22 pipeline at a strain level of 0.08 under different internal pressures. The results show that, at the necking strain point, the upper half of the pipe wall near the fixed end is subjected to compression, while the lower half is subjected to tension. Local buckling occurs in the compressed region. The magnitude of internal pressure does not alter the overall stress distribution pattern, as the stress remains primarily concentrated in the bulging region of the pipe wall and the tensile area on the lower side. The stress in the bulging region is the highest, slightly exceeding that in the tensile zone. As shown in Table 2, significant differences can be observed in the critical bulge height of API-X80 pipelines under varying internal pressures. For the X80-1016-12.8 pipeline, the critical bulge height ranges from 14.0 to 28.8 mm, while for the X80-1219-22 pipeline, it ranges from 22.3 to 33.2 mm. In general, the maximum bulge height increases notably with the rise in internal pressure, which is consistent with the stress–deformation distributions illustrated in the following figures.
Moreover, a comparison between Figure 9 and Figure 12 indicates that the stress distribution characteristics at the necking point are consistent for both the X80-1016-12.8 and X80-1219-22 pipelines. This consistency arises because, at the necking strain threshold, severe buckling occurs in the upper part of the pipe wall, causing a rapid increase in stress, whereas the tensile region in the lower part of the wall experiences relatively smaller strain due to the support of internal pressure, leading to minimal stress variation. This finding provides valuable insights into the failure mechanisms of pipelines with different specifications and offers guidance for the optimization of sleeve repairs.

3.1.3. Influence of Internal Pressure on Wrinkle Protrusion Height

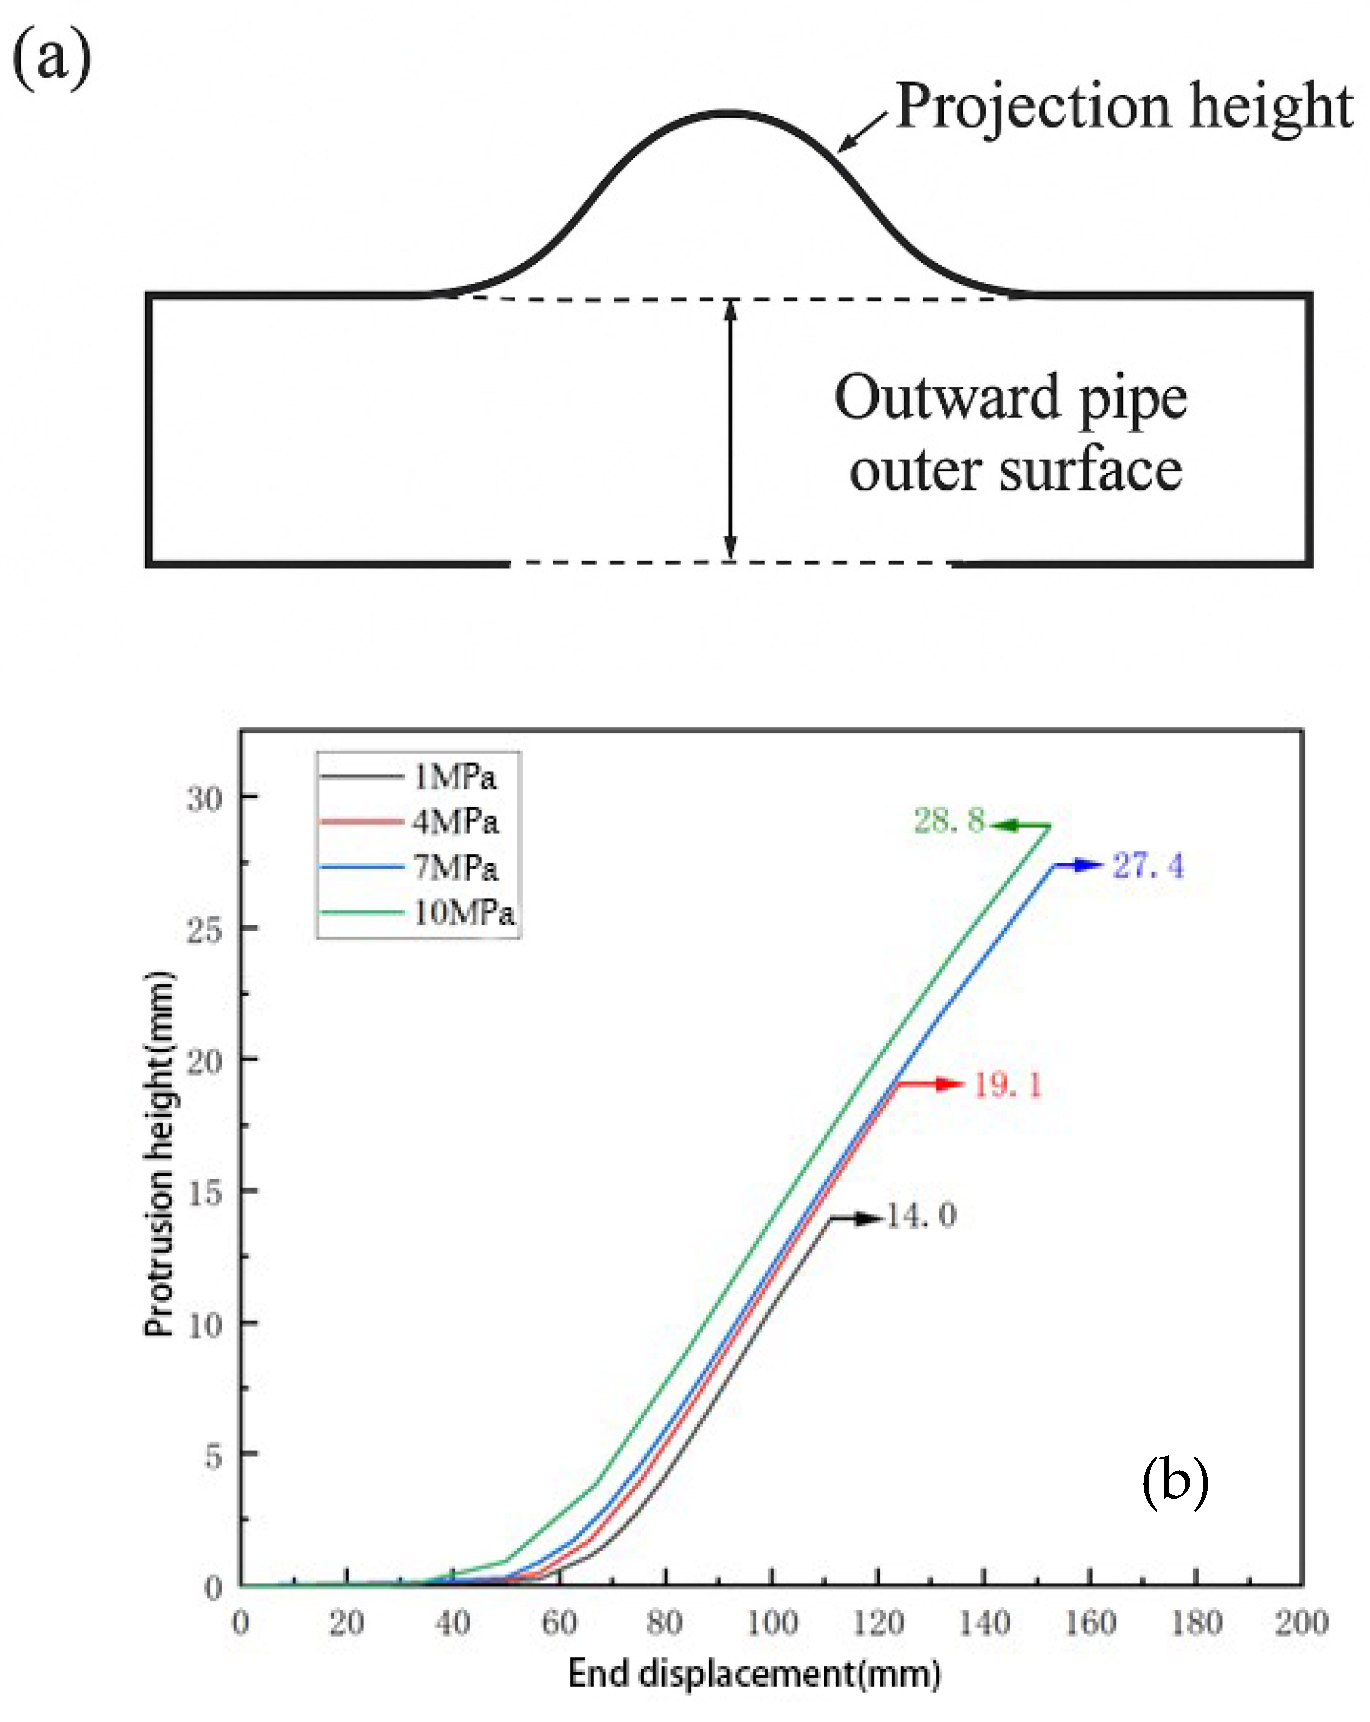
To quantify wrinkle severity, the projection height parameter was introduced, as illustrated in Figure 13a. Projection height is defined as the vertical distance between the undeformed outer surface of the pipe and the peak of the outward wrinkle. Figure 13b presents the stress distribution in the pipeline for a given projection height under combined bending and internal pressure.
The mechanical responses for three projection heights are summarized in Table 3. Results indicate that as the projection height increases, stress concentration becomes more pronounced, deformation grows, and the ultimate load-carrying capacity decreases.
Figure 13b illustrates the relationship between protrusion height and tail-end displacement for an API-X80 pipeline with an outer diameter of 1016 mm and a wall thickness of 12.8 mm under the failure criterion. It can be observed that the protrusion height increases with the increase in tail-end displacement. For the X80 pipeline with a wall thickness of 12.8 mm, the protrusion height remains nearly zero when the tail-end displacement is less than 35 mm. Once the displacement reaches approximately 70 mm, the protrusion height exhibits an almost linear increase with further displacement. Moreover, the maximum protrusion height increases with rising internal pressure. When the internal pressure reaches 10 MPa, the maximum protrusion height is observed to be 28.8 mm.
Figure 14 illustrates the relationship between protrusion height and tail-end displacement for an API-X80 pipeline with an outer diameter of 1219 mm and a wall thickness of 22 mm under the failure criterion. It is evident that the protrusion height increases with the increase in tail-end displacement. For the X80 pipeline with a wall thickness of 22 mm, the protrusion height remains nearly zero when the tail-end displacement is less than 40 mm. Once the displacement reaches approximately 55 mm, the protrusion height begins to increase linearly with further displacement. Furthermore, the maximum protrusion height increases as the internal pressure rises. When the internal pressure reaches 12 MPa, the maximum protrusion height reaches 33.2 mm.
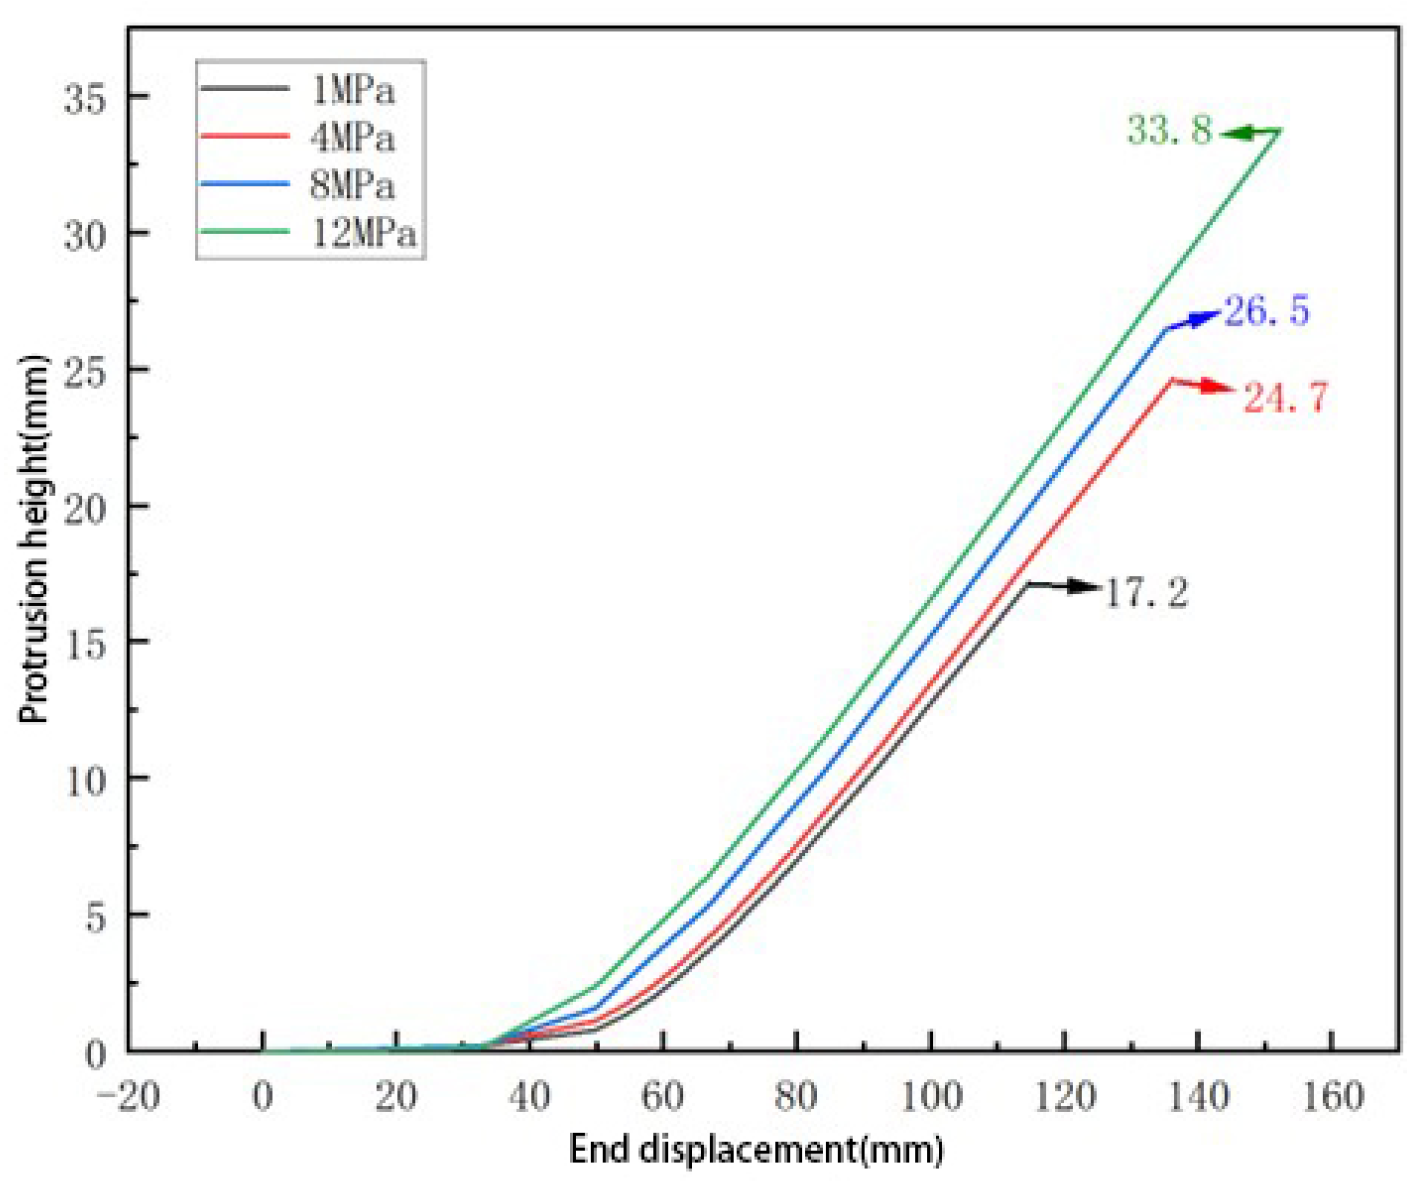
Figure 15 illustrates the relationship between protrusion height and tail-end displacement for an API-X80 pipeline with an outer diameter of 1422 mm and a wall thickness of 25.4 mm under the failure criterion. It can be observed that the protrusion height increases with the increase in tail-end displacement. For the X80 pipeline with a wall thickness of 25.4 mm, the protrusion height remains nearly zero when the tail-end displacement is below 30 mm. Once the displacement reaches around 60 mm, the protrusion height begins to increase linearly with further displacement. Moreover, as the internal pressure increases, the maximum protrusion height shows an overall upward trend, indicating a positive correlation between internal pressure and the severity of local buckling deformation.

3.2. Wrinkling Mechanism

3.2.1. Effect of Bending Load on the Pipeline

To simulate the actual external environment acting on oil pipelines, appropriate loads are applied during numerical modeling to observe the distribution of stress and strain. When a bending load is applied to a pipeline under internal pressure, the literature [35,36] indicates that in the initial loading stage, the circumferential bending moment stretches the pipeline cross-section, causing the originally circular cross-section to expand laterally along the bending direction—this is the ovalization process.
At this early stage, due to the small bending moment, the deformation remains elastic. As ovalization progresses, the pipeline’s outer diameter and curvature increase, resulting in a growing circumferential moment. Once the material yields, the deformation enters the plastic regime, and small wrinkles begin to form on the pipeline surface. These wrinkles initially grow slowly and subtly. However, once the bending curvature reaches a critical threshold, wrinkle growth accelerates rapidly, and the bending moment peaks.
Visible bulging on the outer surface of the pipeline emerges due to localized collapse caused by wrinkling. As ovalization continues, the bulge becomes sharper and forms a tight outward wrinkle flanked by deep inward folds. Although high local bending strains occur in these folds, failure or rupture does not necessarily occur, and the actual failure point depends on the material’s ductility.
This analysis shows that, under internal pressure and bending, localized outward bulges (wrinkles) appear, and the protrusion height becomes a key indicator of structural stability—a larger protrusion height implies greater structural resilience before failure.

3.2.2. Effect of Internal Pressure on the Pipeline

During oil transport, pipelines are influenced not only by external natural forces but also by the internal pressure exerted by the transported fluid. In simulations, bending loads are applied along with varying levels of internal pressure to evaluate the combined effects on stress–strain behavior.
When internal pressure is applied, it induces circumferential stress within the pipe wall, which counteracts the radial bending stress and suppresses ovalization. This prolongs the elastic deformation stage. As internal pressure increases, the circumferential stress strengthens, enhancing the resistance to ovalization. As a result, a greater bending moment is required to enter the plastic regime, thereby increasing the wrinkle growth rate and the pipeline’s maximum protrusion height before failure—an indicator of enhanced stability.
At low internal pressures, local inward collapse is more likely, while at higher pressures, the pipe tends to bulge outward at the bend, forming a more pronounced wrinkle. The larger the internal pressure, the higher the wrinkle.
Figure 16 illustrates the influence of internal pressure on the inelastic wrinkling of X80 pipelines under bending. Figure 16a shows that at zero internal pressure ( P / P 0 = 0 ) , the moment–curvature curve rapidly softens beyond κ / κ 1 1 due to pronounced ovalization. With small pressures ( P P 0 =   0.14 0.20 ) , the post-yield stiffness is noticeably increased, and the critical curvature is delayed to around κ / κ 1   =   2 3 . At higher pressures ( P / P 0 = 0.49 0.60 ) , the peak moment rises by approximately 20–30%, and the curve maintains a higher slope, confirming the strengthening role of pressure. Figure 16b demonstrates that without pressure, wrinkles initiate early ( κ / κ 1 1.5 ) and grow rapidly to amplitudes of 6–7%. By contrast, increasing pressure postpones wrinkle initiation ( t o   κ / κ 1     3.5 4.0   f o r   P / P 0   =   0.60 ) and reduces the maximum amplitude to around 4–5%. These results highlight the dual role of internal pressure: enhancing the load-bearing capacity of the pipe while simultaneously suppressing and delaying local wrinkling.
In summary, applying internal pressure to the pipeline increases its overall stiffness. When an upward displacement load is simultaneously applied, it leads to local outward bulging, resulting in localized wrinkling. The critical curvature at which wrinkle growth accelerates increases with internal pressure, thereby raising the curvature required for pipeline failure. Meanwhile, the circumferential stress induced by the internal pressure grows correspondingly, which delays the ovalization of the pipeline cross-section. Internal pressure thus exerts a stabilizing effect on the structure, allowing the pipeline to sustain greater protrusion heights before reaching failure.
To validate the numerical model, simulation results were compared with existing literature. The observed local outward bulging and circumferential wrinkle patterns under bending load are consistent with the experimental observations of Brazier [13], who first described cross-sectional ovalization and instability in thin-walled cylinders. Furthermore, the post-buckling behavior and ultimate moment trends align with the findings of Beak et al. [17], who simulated X65 pipelines under similar loading conditions. The consistency in stress concentration zones and wrinkle formation locations confirms the validity of the current finite element setup.

4. Optimization of Pipeline Repair Based on B-Type Sleeve

As one of the critical technologies for in-service welding repair of pipelines, B-type sleeve repair is recognized as the preferred alternative to pipe replacement in current standards due to its permanent repair characteristics. This technique is applicable for repairing various defect types in pipelines, including mechanical damage, corrosion, cracks, and weld defects, and has become a significant research direction in pipeline repair technology [38].

4.1. Overview of Convex B-Type Sleeve Structure

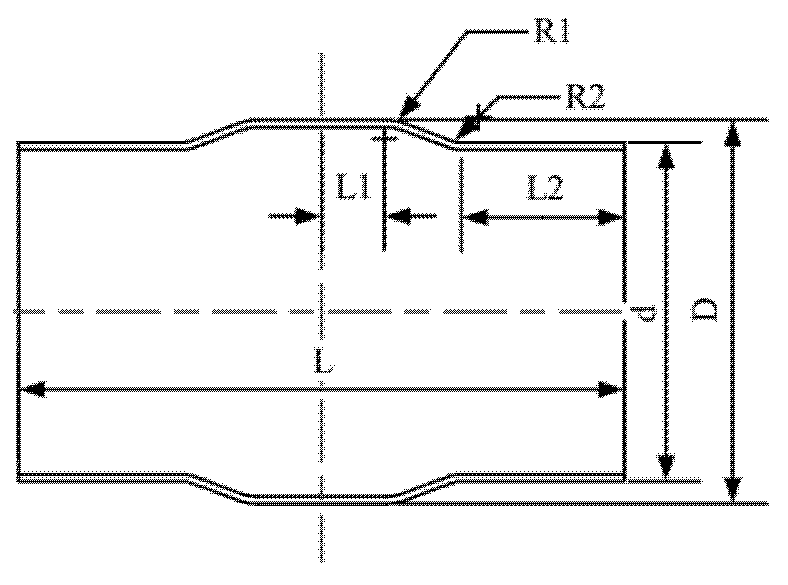
Traditional cylindrical B-type sleeves, characterized by a cylindrical shell geometry, require strict matching between the sleeve’s inner diameter and the pipeline’s outer diameter during repair [39]. However, when the defective pipeline exhibits localized dents, deformation-induced wrinkles, or weld seams within the sleeve coverage area, traditional B-type sleeves cannot achieve tight adhesion to the pipeline’s inner surface. This mismatch creates gaps in the repaired region, which are prone to stress concentration after welding [40]. In engineering practice, weld reinforcement is typically removed by grinding to ensure sleeve-pipeline compatibility. For pipelines with localized dents or wrinkles, a convex B-type sleeve with preformed protrusions is recommended. The structure of the convex B-type sleeve is illustrated in Figure 17.
In the diagram, L1 represents half the length of the large-diameter segment of the sleeve, L2 denotes the length of the small-diameter segment on one side of the sleeve, R1 is the fillet radius of the large-diameter segment, R2 is the fillet radius of the small-diameter segment, d is the diameter of the small-diameter segment, and D is the diameter of the large-diameter segment.
According to SY/T 7666-2022 [42] (Specification for B-type Sleeves in Oil and Gas Pipeline Defect Repair), the fundamental structure, thickness, length, and material properties of the sleeve are specified. The pressure-bearing capacity of the sleeve shall not be less than the design pressure of the pipeline to be repaired [43]. The minimum wall thickness is calculated using Equation (11):
T s > σ s p σ s s × T p + H 1 + H 2
where T p is the pipe wall thickness, T s is the sleeve wall thickness, H 1 is the depth of the inner wall groove of the sleeve, and H 2 is the machining compensation thickness. These parameters must satisfy the constraint condition:
3.5   m m H 1 + H 2 6   m m
The sleeve length shall satisfy Equations (12) and (13), with a minimum length of 150 mm. Additionally, the sleeve length must ensure that the distance from the edge of the repaired defect to the nearest fillet weld of the sleeve is not less than 50 mm. The selected sleeve length shall also guarantee that the spacing between adjacent sleeve fillet welds is no smaller than half of the pipeline’s outer diameter.
L s 2 × 4 T p + 4 × 1.4 T p + G
L s 2 × l 2 + 4 × 1.4 T p + G
where G is the radial installation gap between the sleeve and the pipeline to be repaired, and l is the axial length of the defect or the axial length of the weld defect on the steel pipe body.
The SY/T 6649-2018 [44] (Technical Specifications for Pipeline Body Defect Repair in Oil and Gas Pipelines) defines the B-type sleeve, its applicable scope, and partial structural and material parameters for repair design. Specifically, the thickness of the B-type sleeve must be greater than or equal to the wall thickness of the pipeline to be repaired. The sleeve length shall not be less than 100 mm, and the sleeve must extend at least 50 mm beyond each side of the defect. Additionally, the spacing between adjacent sleeve fillet welds shall not be less than half of the pipeline’s outer diameter. These requirements are expressed by Equations (14) and (15):
T s T p
L s > 100   m m

4.2. Structural Parameter Optimization Objective Analysis

Given the multiple parameter levels of the non-standard B-type model, including L 1 , L 2 ,   R 1 ,   R 2 , four objective functions are selected for global optimization of the four design factors. The objective functions are defined as follows:
ζ = q m a x q e q u
q m a x = q v o n - m a x
q e q u = q v o n - e q u
q m i n = q v o n - m i n
where ζ is the stress concentration factor; q m a x is the maximum stress; q m i n is the minimum stress; q v o n - m a x is the maximum Von Mises stress in the sleeve section; q v o n - e q u is the average Von Mises stress in the sleeve section; q v o n - m i n is the minimum Von Mises stress in the sleeve section.
Additionally, based on the constraint conditions for B-type sleeve optimization, the spatial geometric relationship constraints of the sleeve can be expressed by Equation (20):
L 1 + L 2 < L 2
R 1 + R 2 < D d 2 + ( L 2 L 1 L 2 ) 2 ( D d 2 ) 2 D d
where D is the diameter of the large-diameter segment, d is the diameter of the small-diameter segment, with constraints L 1 > 110,   L 2 > 80,   R 1 > 60, and R 2 > 36.

4.3. Establishment of Finite Element Model for B-Type Sleeve Repair

The B-type sleeve studied in this work is designed to repair pipelines with a wall thickness of 22 mm and an inner diameter of 511 mm. The L 1 , L 2 , R 1 , R 2 of the sleeve are four parameters for structural optimization, where L 1 is half the length of the large diameter section of the sleeve, L 2 is the length of the small diameter section at one end of the sleeve, and R 1 and R 2 are the fillet radii of the sleeve. Considering different external conditions, there are different heights of buckling wrinkles in the pipelines to be repaired. The variable h is defined as the height of the sleeve:
h = D d 2
The sleeve height h corresponds to the protrusion height of the pipeline to be repaired. When buckling deformation occurs in the pipeline, the protrusion height depends on pipeline parameters (e.g., diameter-to-thickness ratio), loading conditions, and defect types. A larger diameter-to-thickness ratio reduces the bending stiffness, resulting in higher protrusion heights. Initial ovality, welding defects, or localized corrosion can lower the critical buckling load and further increase protrusion height during buckling deformation. Based on the analysis in Section 3, the typical protrusion height range for pipelines is statistically less than 40 mm. Therefore, the protrusion range studied in this work is set to 10 mm to 40 mm (Table 4).
This study employs API-X70 steel as the material for the sleeve. The material configurations of the sleeve are detailed in Table 5.
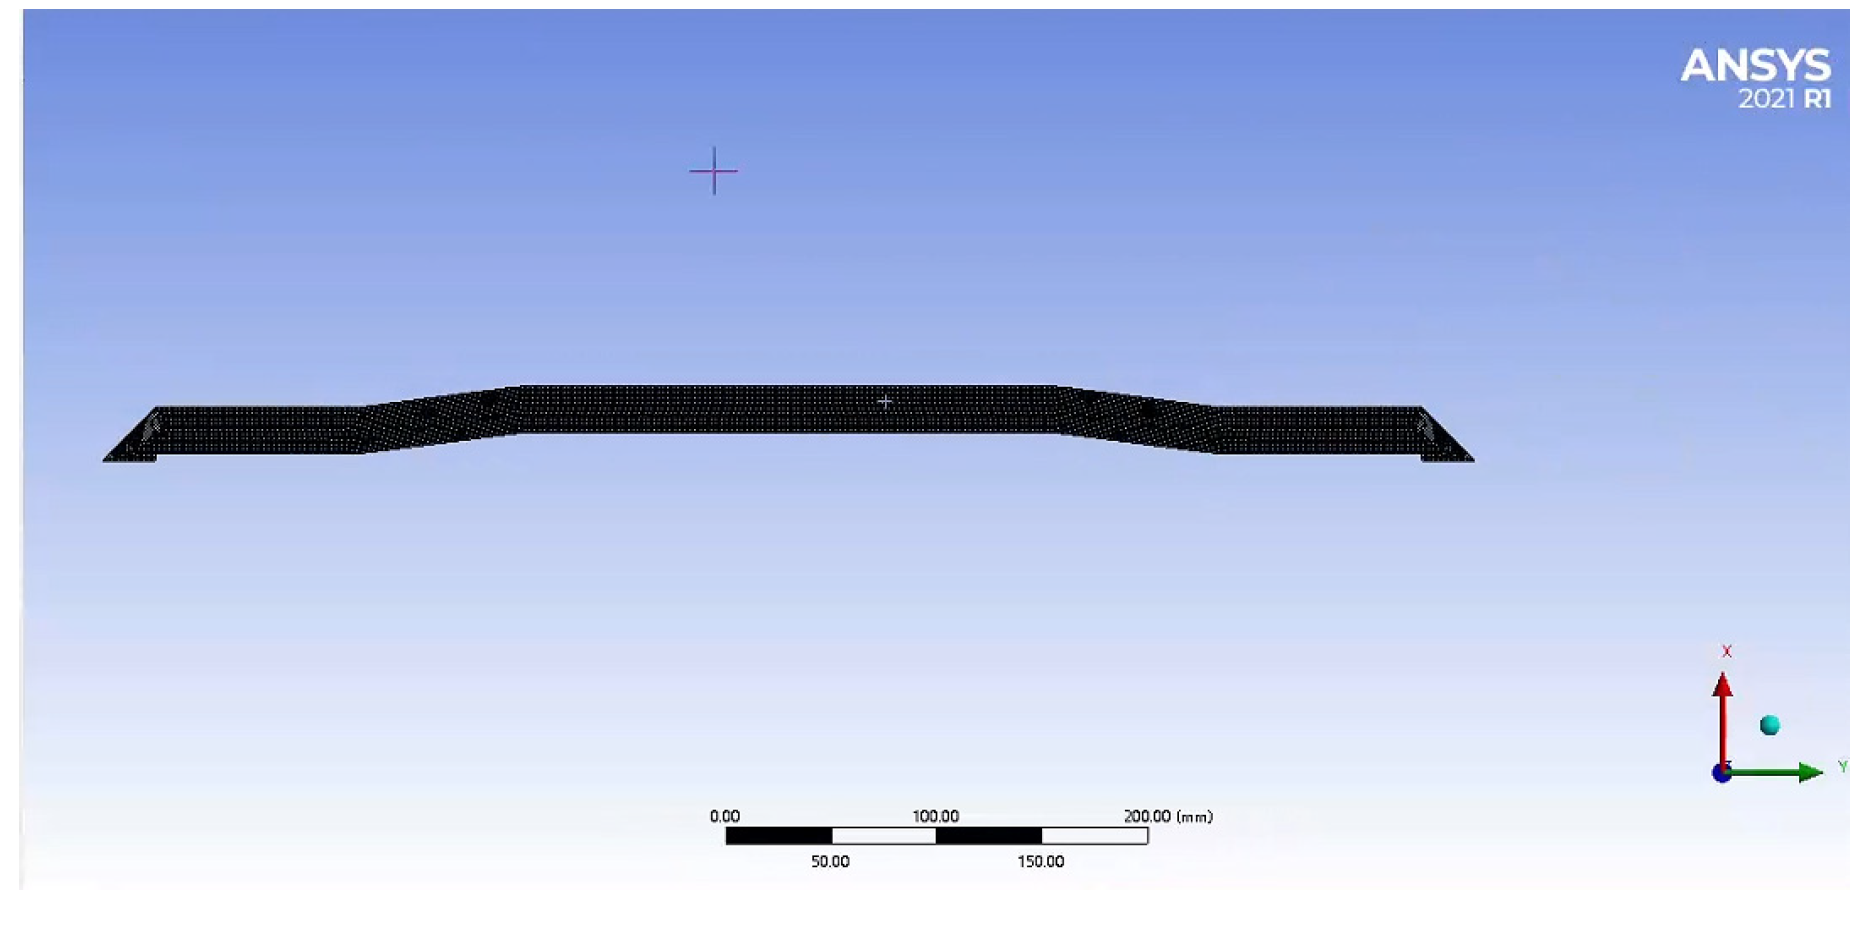
The mesh generation methods provided by the module include: Tetrahedrons, Hex Dominant, Multizone. To balance computational efficiency and solution accuracy, this study adopted the automatic mesh generation method. The pipeline and sleeve structures were discretized with eight-node reduced integration solid elements (C3D8R), and the bending region was refined to improve accuracy. The mesh configuration of the convex B-type sleeve is illustrated in Figure 18.
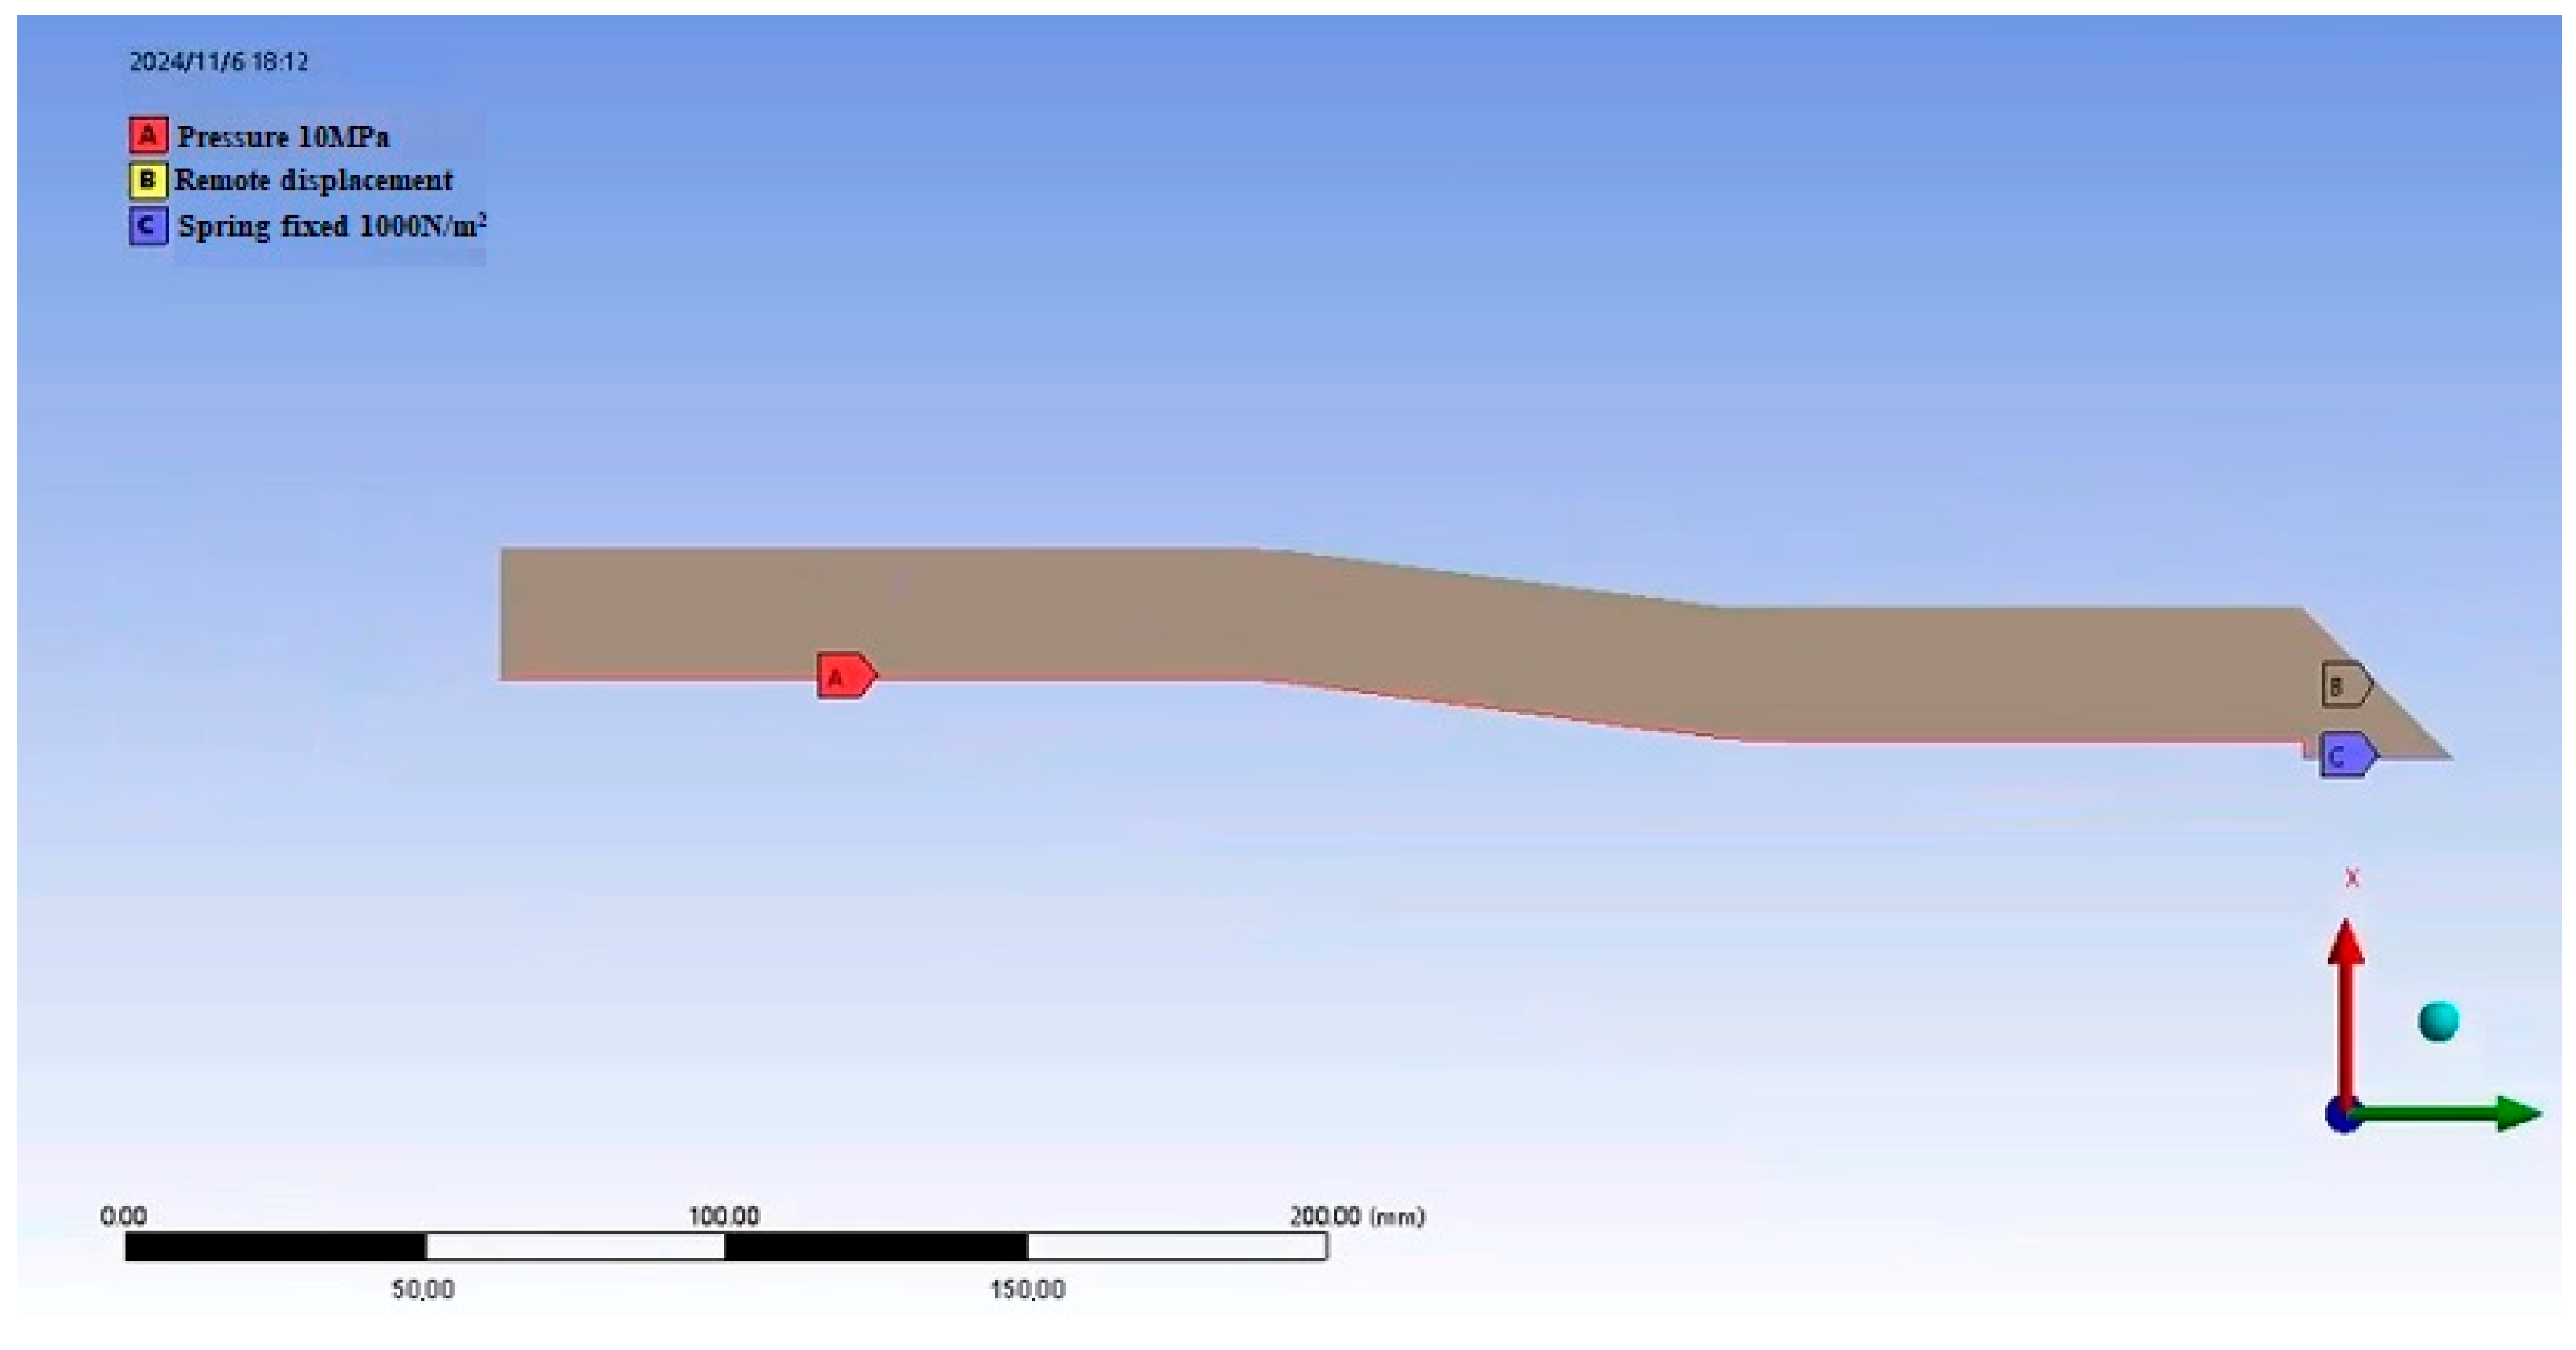
During actual service of the sleeve, it is subjected to internal medium pressure and connected to the pipeline via fillet welds. As shown in Figure 19, the load and boundary conditions for the convex B-type sleeve are defined. A pressure load of 10 MPa was applied at location a of the sleeve, and an elastic support with a stiffness of 1000 N/mm3 was configured at location c.

4.4. Analysis of the Effect of Sleeve Height on the Structure of B-Type Sleeves

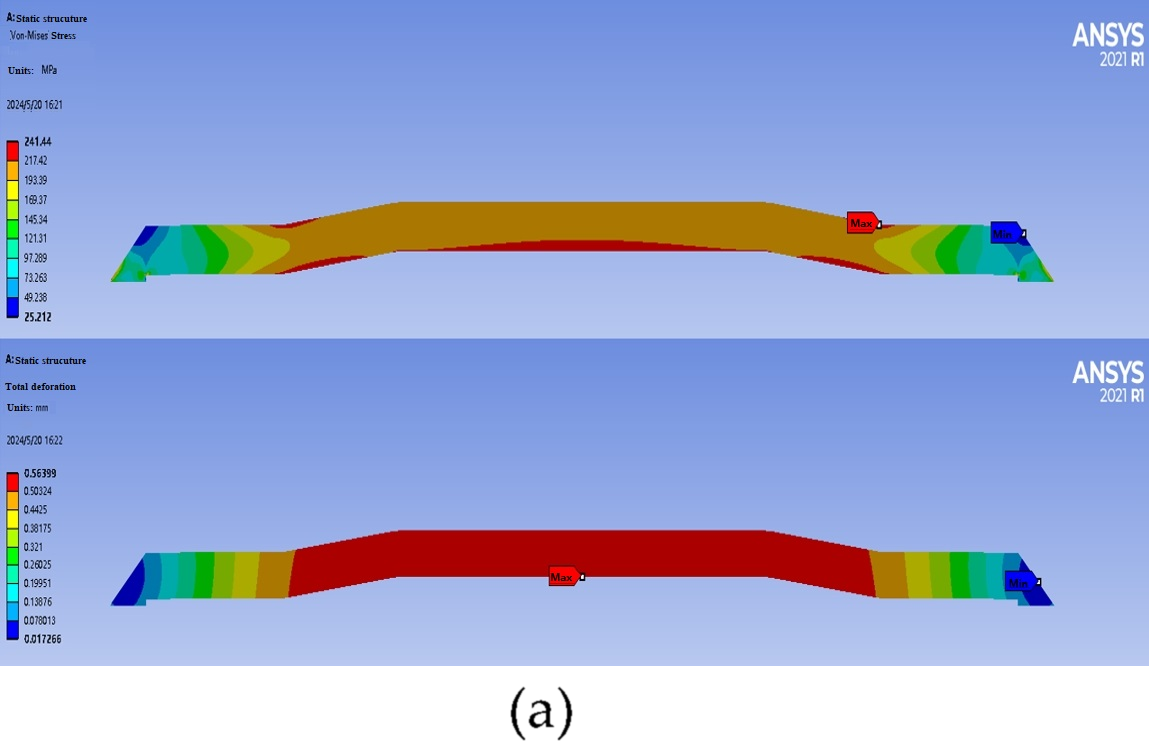
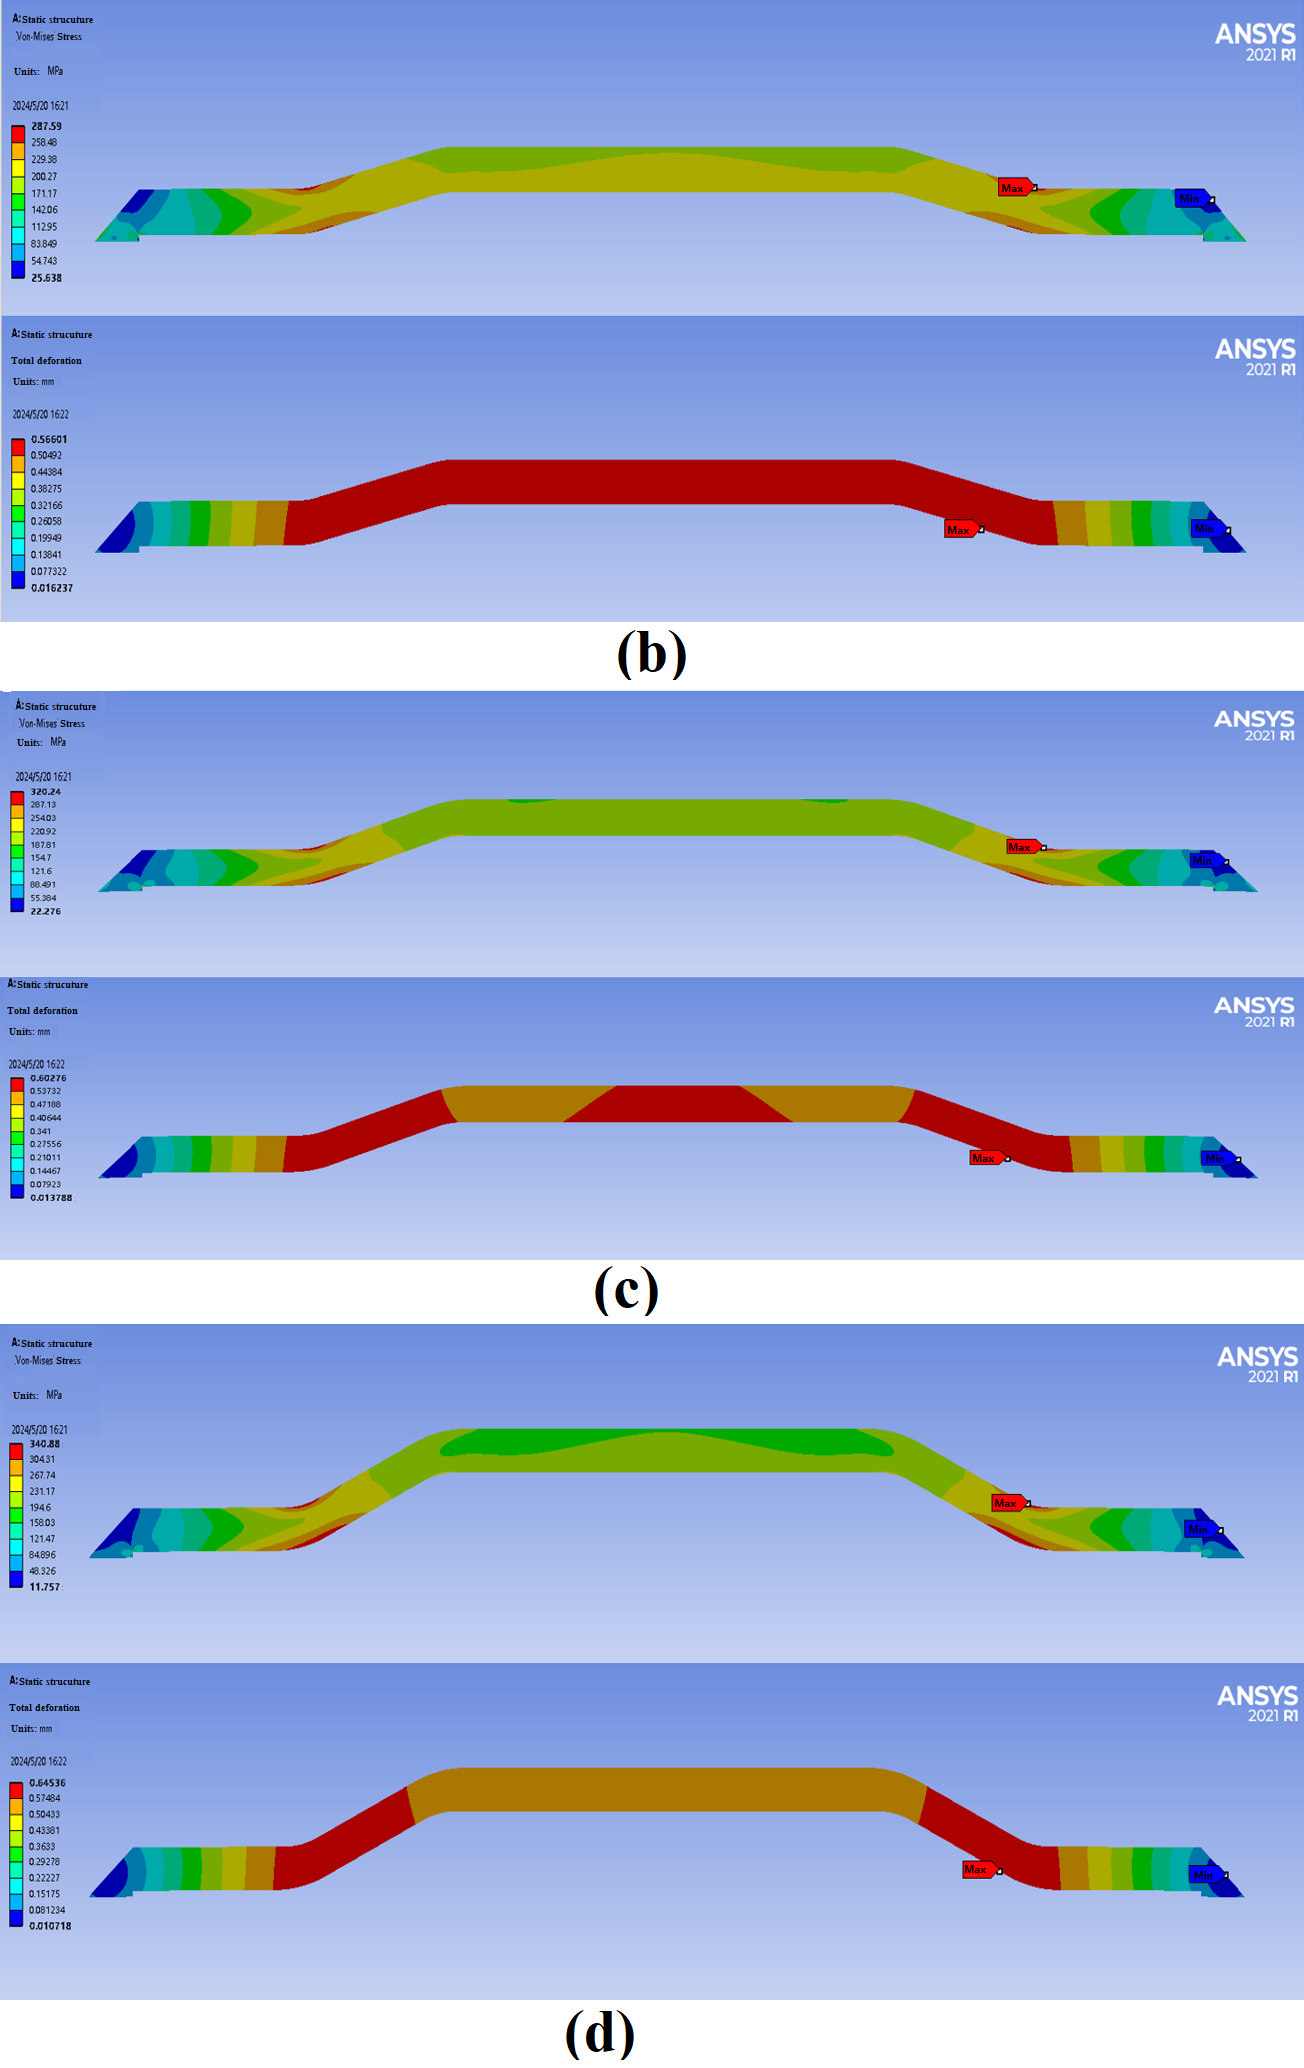
Stress–strain distribution contours from numerical simulations at varying sleeve heights are presented in Figure 20. These results correspond to domed B-type sleeves with heights of 10 mm, 20 mm, 30 mm, and 40 mm, respectively. As depicted in Figure 20a, the upper section shows the stress distribution contour, while the lower section illustrates the corresponding strain distribution.
The comparative analysis of the stress contour plots in Figure 20a–d for sleeves of different heights reveals that the maximum Von Mises equivalent stress consistently occurs near the fillet connecting the smaller diameter section to the transition section, with peak values of 241.4 MPa, 287.6 MPa, 320.3 MPa, and 340.9 MPa, respectively. Moreover, stress concentration is observed in both the upper and lower fillet transition regions, specifically at the sleeve structural parameter R2. The remaining key simulated stress results for the sleeves are listed in Table 6.
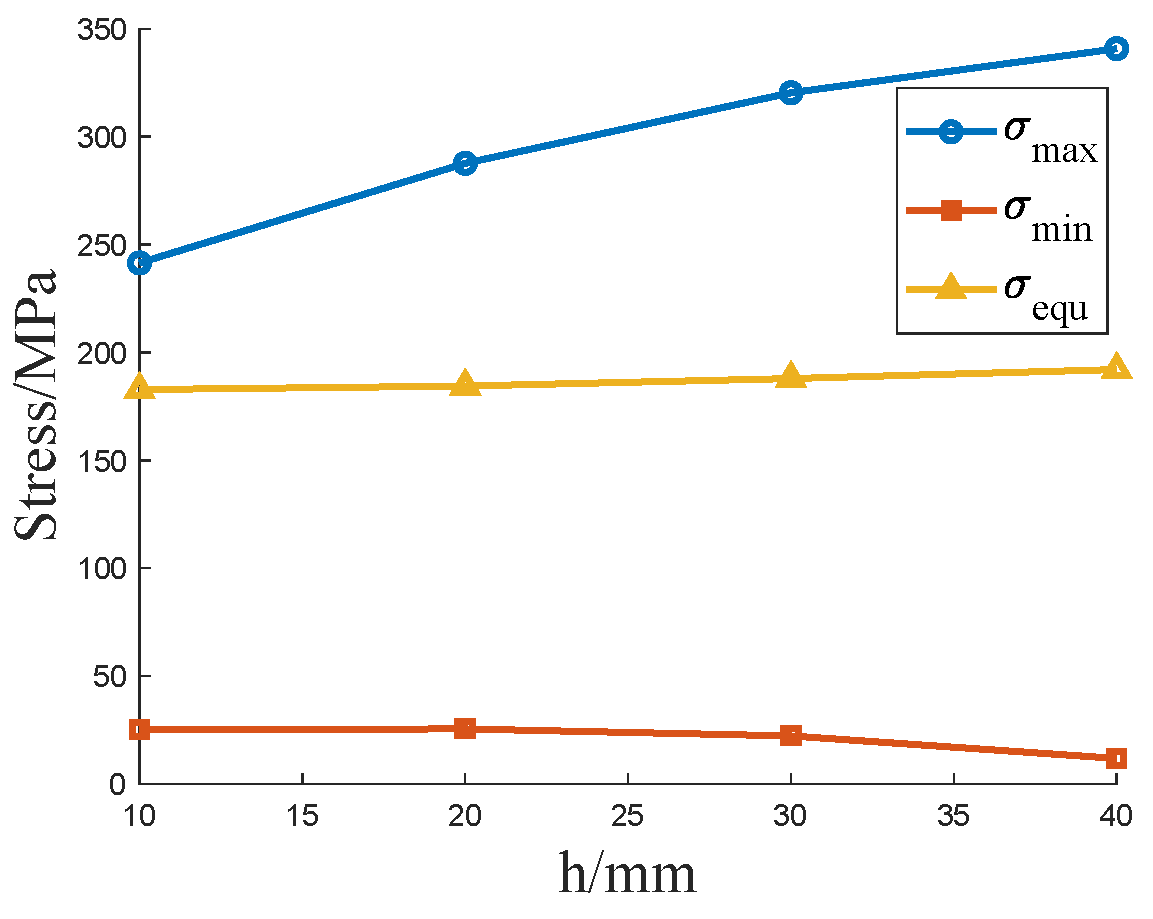
Based on Table 6, the trends of sleeve height versus stress and the stress concentration factor are plotted in Figure 21 and Figure 22. Observations indicate that as the sleeve height increases, both the maximum effective Von Mises stress and the stress concentration factor increase, while the variation in average effective stress is not significant, and the minimum effective stress shows a slight decrease.
An analysis of the strain distribution contour plots in the lower part of Figure 20 reveals that the strain in the large-diameter section of the sleeve is generally higher, while the strain at the fillet region is relatively lower, and the strain in the small-diameter section of the sleeve is the lowest.

4.5. Optimization Analysis

This study employs the Response Surface Methodology (RSM) in conjunction with a Genetic Algorithm (GA) to perform optimization analysis. RSM is a multivariate optimization technique based on statistical principles, which centers on establishing a mathematical model between input variables (independent variables) and output responses (dependent variables) through experimental design, and subsequently using this model for optimization. Experimental point combinations of the independent variables are selected using methods such as Central Composite Design (CCD) and Box–Behnken Design (BBD), aiming to minimize the number of simulations while adequately covering the design space. Model accuracy is evaluated using indicators such as the coefficient of determination (R2) and root mean square error (RMSE), ensuring the reliability of the predictions. On this basis, GA is employed to identify the optimal multi-objective parameter combination [45].
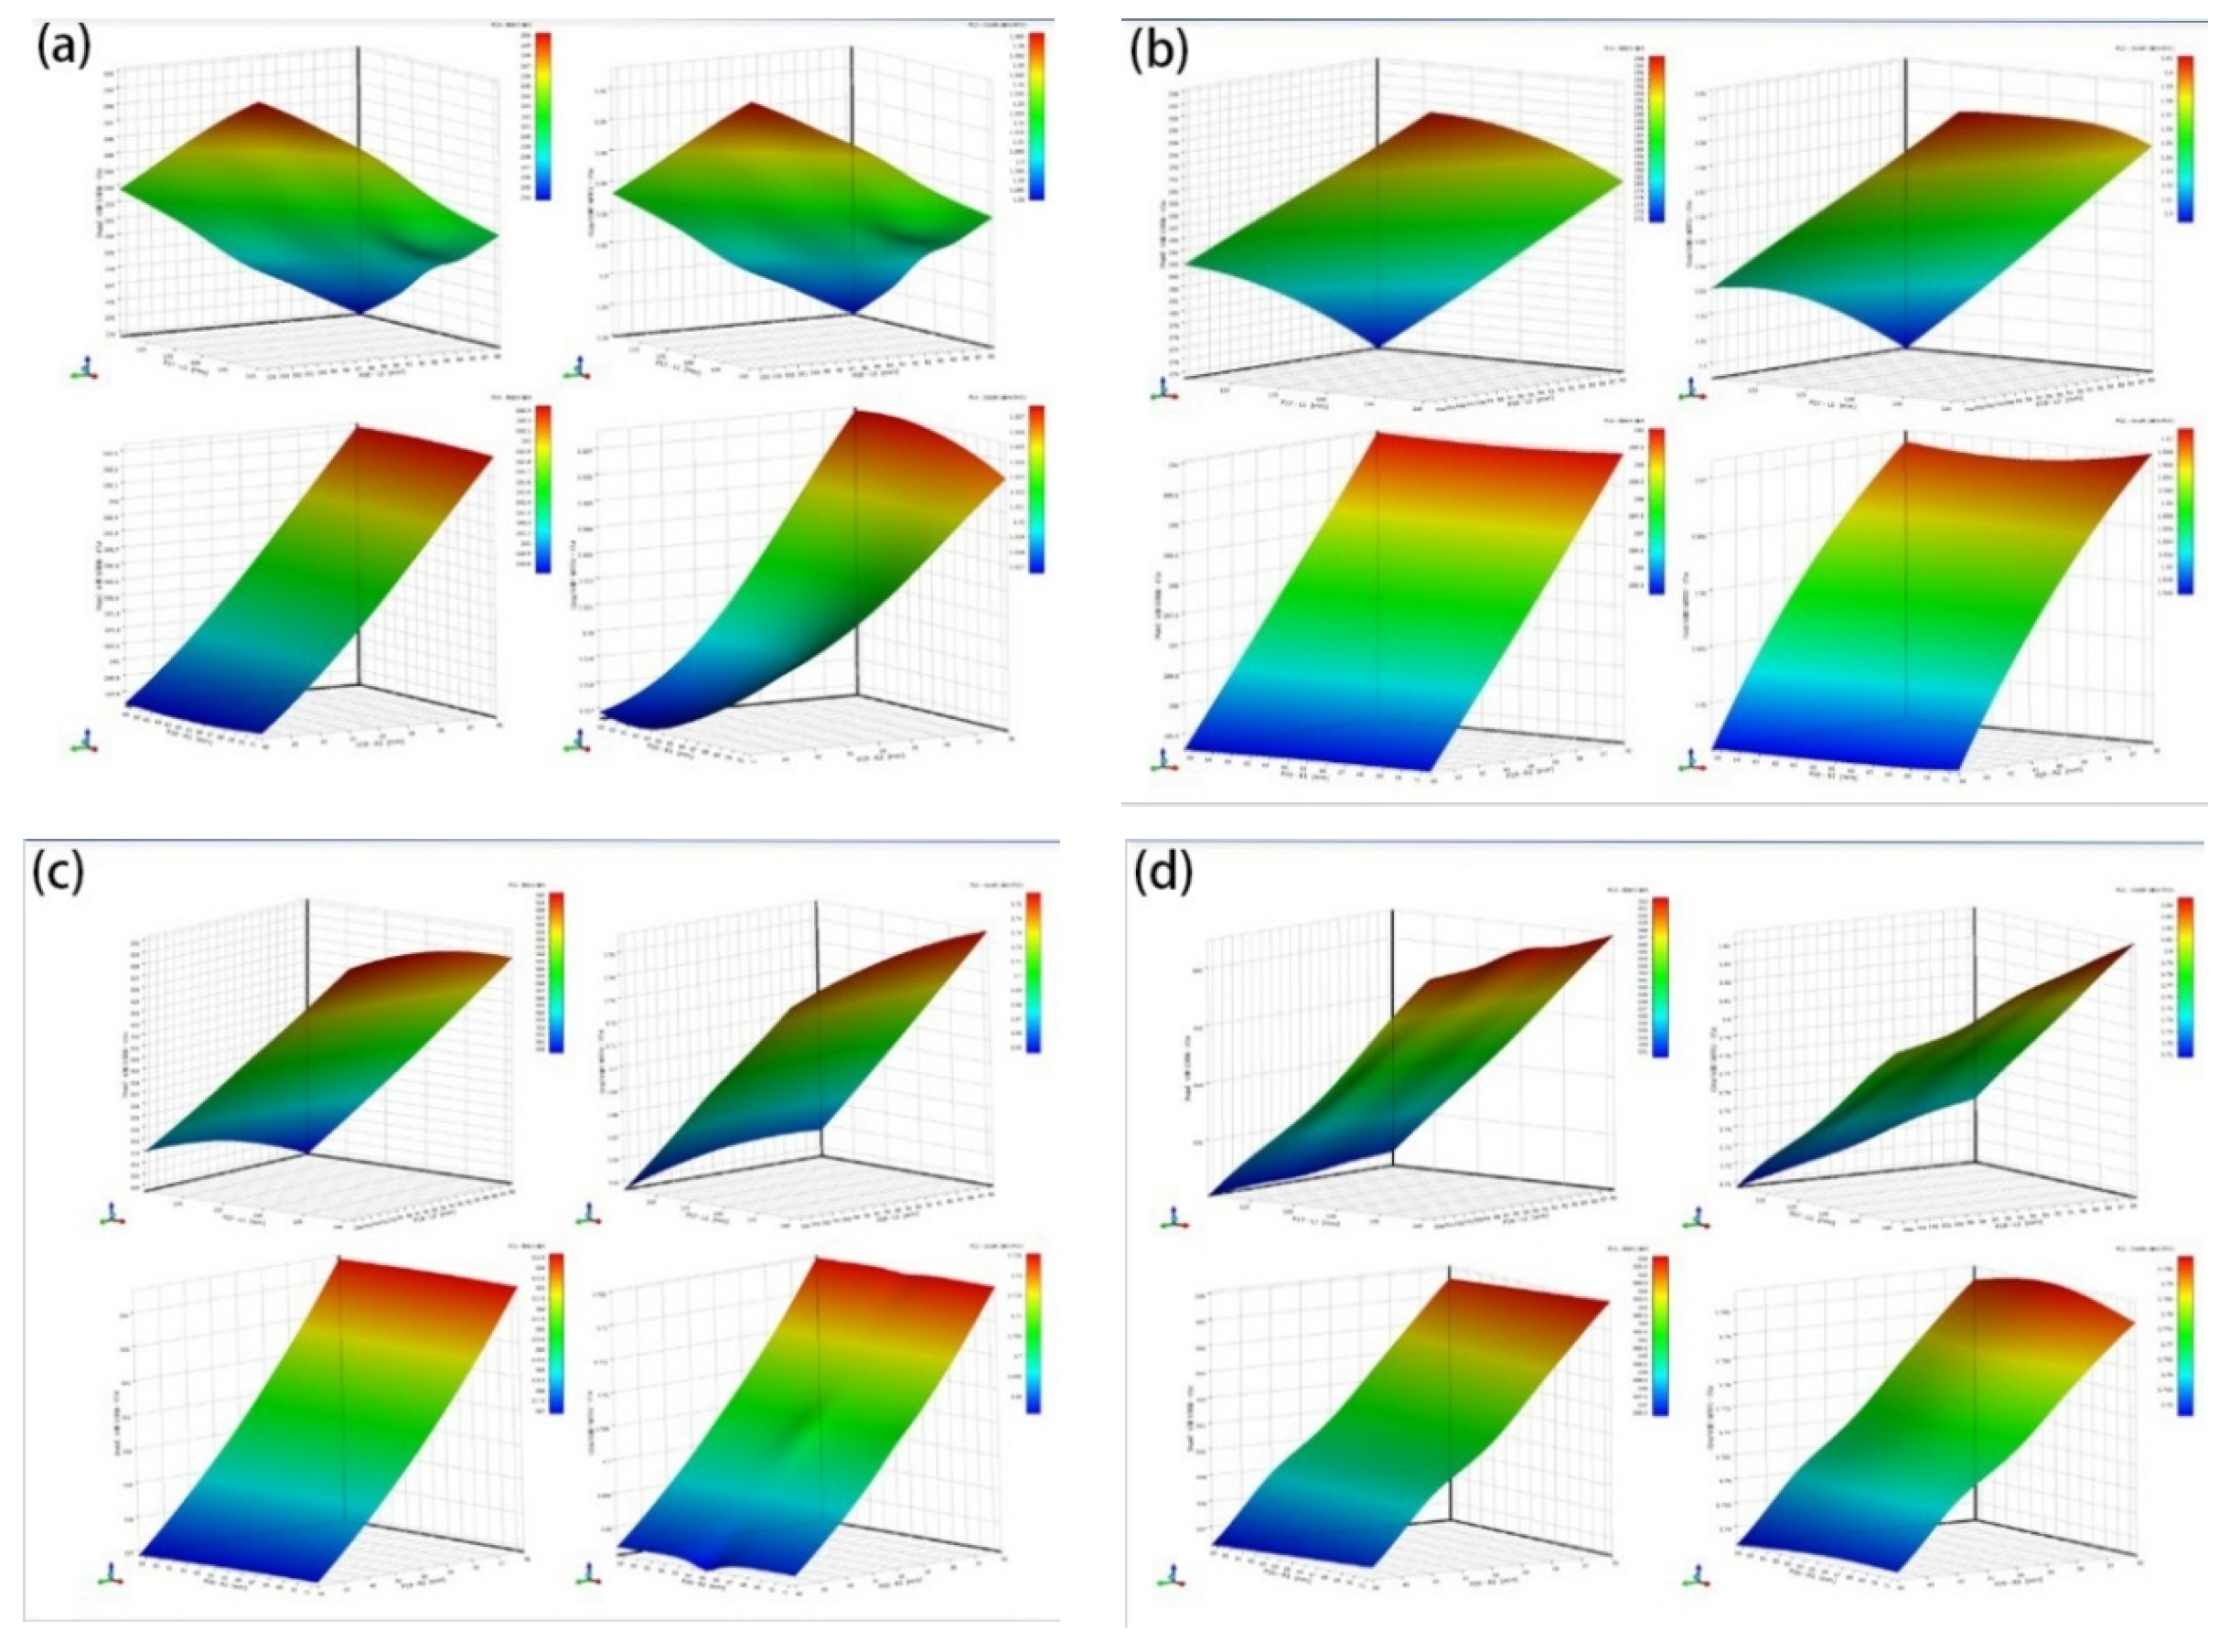
As shown in Figure 23, the response surface plots present the numerical simulation results of the sleeve under different geometric parameter conditions. In all upper subplots, the horizontal axis represents L1 and the vertical axis represents L2, while in the lower subplots, the horizontal axis corresponds to R1 and the vertical axis to R2. The left column illustrates the distributions of equivalent Mises stress, and the right column shows the corresponding stress concentration factors. The contour color scale ranges from blue to red, indicating a gradual increase in stress or stress concentration ratio. The results indicate that increases in L1, L2, or both lead to higher maximum stress and stress concentration factors, highlighting the decisive influence of the large- and small-diameter sections on the mechanical performance. In contrast, an increase in R2 results in a marked reduction in both maximum stress and stress concentration, whereas variations in R1 have almost no effect on the overall stress state.
Based on the response surface results and parameter sensitivity analysis mentioned above, the response surface optimization method was employed to conduct the experimental design for parameter optimization. The optimized parameters are presented in Table 7.

5. Conclusions

This study conducted a comprehensive finite element simulation of wrinkling behavior in API-X80 pipelines under internal pressure and bending. The results demonstrate consistent stress–strain distributions across different pipeline geometries, with protrusion height increasing as internal pressure rises due to enhanced ovalization resistance. A convex B-type sleeve design was proposed and optimized, effectively reducing stress concentration at defect sites.

Limitations and Future Work

This work is based solely on numerical simulation without experimental validation. Future studies should include laboratory-scale tests for model calibration. Additionally, the influence of welding residual stress, internal corrosion, and long-term cyclic loading on wrinkle behavior and sleeve performance should be explored. Extension of the sleeve optimization to real-time field conditions is also a prospective direction.

Author Contributions

Methodology, H.H. and Z.G.; Software, R.G.; Investigation, H.Z.; Supervision, Y.L. All authors have read and agreed to the published version of the manuscript.

Funding

This research received no external funding.

Data Availability Statement

The original contributions presented in this study are included in the article. Further inquiries can be directed to the corresponding author.

Conflicts of Interest

Author Hao Zhang was employed by the company CNPC Tubular Goods Research Institute. Author Zhibo Guo was employed by the company CNPC First Oil Production Plant of Changqing Oilfield. Author Ruibo Guo was employed by the company Longi Green Energy Technology Co., Ltd. The remaining authors declare that the research was conducted in the absence of any commercial or financial relationships that could be construed as a potential conflict of interest.

References

  1. Yu, Z.F.; Zhang, W.W.; Zhang, Z.H. Development direction and relevant technical problems of natural gas pipeline in China. Oil Gas Storage Trans. 2012, 31, 321–325. [Google Scholar]
  2. Gao, P.; Gao, Z.F.; Wang, F. New progress in China’s oil and gas pipeline construction in 2018. Int. Pet. Econ. 2019, 27, 54–59. [Google Scholar]
  3. Fekete, J.R.; Sowards, J.W.; Amaro, R.L. Economic impact of applying high strength steels in hydrogen gas pipelines. Int. J. Hydrog. Energy 2015, 40, 10547–10558. [Google Scholar] [CrossRef]
  4. Shuai, Y.; Wang, X.H.; Feng, C.; Zhu, Y.; Wang, C.-L.; Sun, T.; Han, J.; Cheng, Y.F. A novel strain-based assessment method of compressive buckling of X80 corroded pipelines subjected to bending moment load. Thin-Walled Struct. 2021, 167, 108172. [Google Scholar] [CrossRef]
  5. Wang, C.T.; Li, W.; Wang, Y. Remaining lifetime assessment of gas pipelines subject to stray current interference using an integrated electric-electrochemical method. Eng. Fail. Anal. 2021, 127, 105494. [Google Scholar] [CrossRef]
  6. Jiang, N.; Zhu, B.; Zhou, C.; Li, H.; Wu, B.; Yao, Y.; Wu, T. Blasting vibration effect on the buried pipeline: A brief overview. Eng. Fail. Anal. 2021, 129, 105709. [Google Scholar] [CrossRef]
  7. Chen, D.; Qin, Y.; Tie, M.; Zuo, L.; Wang, W.; Li, X. Analysis of dynamic response of pipeline suspension cable bridge under near-fault pulse type earthquake. Structures 2025, 78, 109326. [Google Scholar] [CrossRef]
  8. Tsatsis, A.; Alvertos, A.; Gerolymos, N. Fragility analysis of a pipeline under slope failure-induced displacements occurring parallel to its axis. Eng. Struct. 2022, 262, 114331. [Google Scholar] [CrossRef]
  9. DNVGL-ST-F101; Submarine Pipeline Systems. Det Norske Veritas GL: Høvik, Norway, 2017.
  10. CSA Z662-15; Oil and Gas Pipeline Systems. CSA Group: Etobicoke, ON, Canada, 2007.
  11. Dong, X.; Zhang, W.; Shiri, H.; Randolph, M.F. Large deformation coupled analysis of embedded pipeline—Soil lateral interaction. Mar. Struct. 2021, 78, 102971. [Google Scholar] [CrossRef]
  12. API Spec 5L; Specification for Line Pipe. American Petroleum Institute: Washington, DC, USA, 2018.
  13. Brazier, L.G. On the flexure of thin cylindrical shells and other thin sections. Proc. R. Soc. A-Math. Phys. Eng. Sci. 1927, 114, 104–114. [Google Scholar]
  14. Ju, G.T.; Kyriakides, S. Bifurcation and localization instabilities in cylindrical shells under bending-II predictions. Int. J. Solids Struct. 1992, 29, 1117–1142. [Google Scholar] [CrossRef]
  15. Iflefel, I.B.; Moffat, D.G.; Mistry, J. The interaction of pressure and bending on a dented pipe. Int. J. Press. Vessel Pip. 2015, 82, 761–769. [Google Scholar] [CrossRef]
  16. Blachut, J.; Iflefel, I.B. Collapse of pipes with plain or gouged dents by bending moment. Int. J. Press. Vessel Pip. 2007, 84, 560–571. [Google Scholar] [CrossRef]
  17. Beak, J.H.; Kima, Y.P. Load bearing capacity of API X65 pipe with dent defect under internal pressure and in-plane bending. Mater. Sci. Eng. A 2012, 540, 70–82. [Google Scholar] [CrossRef]
  18. Cai, J.; Jiang, X.L.; Lodewijks, G. Numerical investigation of residual ultimate strength of dented metallic pipes subjected to pure bending. Ships Offshore Struct. 2018, 13, 519–531. [Google Scholar] [CrossRef]
  19. Bai, Y.; Bai, Q. Subsea Pipeline Integrity and Risk Management; Gulf Professional Publishing: Houston, TX, USA, 2014; pp. 52–70. [Google Scholar]
  20. Yu, J.; Liu, P.; Yu, Y.; Liu, X.; Li, H.; Sun, R.; Zong, X. Buckling collapse of submarine thick-wall pipe under torque and hydraulic pressure based on vector form intrinsic finite element method. Appl. Ocean Res. 2024, 146, 103972. [Google Scholar] [CrossRef]
  21. Sun, J.; Cheng, Y.F. Assessment by finite element modeling of the interaction of multiple corrosion defects and the effect on failure pressure of corroded pipelines. Eng. Struct. 2018, 165, 278–286. [Google Scholar] [CrossRef]
  22. Zhang, H.; Wei, Z.; Li, X.; Yuan, Z.; Guo, M. Finite Element Analysis Study of Buried Crack Defects in B-Sleeve Fillet Welds. Coatings 2024, 14, 560. [Google Scholar] [CrossRef]
  23. Lazor, R.; Carroll, L.B.; Bloom, M.E.; Booth, R.F. Modeling of Pipeline Repair Sleeves. In Proceedings of the 2002 4th International Pipeline Conference, Calgary, AB, Canada, 29 September–3 October 2002; pp. 1991–1995. [Google Scholar]
  24. Liu, P.F.; Zheng, J.Y.; Zhang, B.J.; Shi, P. Failure analysis of natural gas buried X65 steel pipeline under deflection load using finite element method. Mater. Des. 2010, 31, 1384–1391. [Google Scholar] [CrossRef]
  25. Shuai, Y.; Wang, X.H.; Cheng, Y.F. Buckling resistance of an X80 steel pipeline at corrosion defect under bending moment. J. Nat. Gas Sci. Eng. 2021, 93, 104016. [Google Scholar] [CrossRef]
  26. Law, M.; Linton, V.; Gamboa, E. Fatigue crack growth comparison between sleeved and non-sleeved pipeline. Adv. Mater. Res. 2008, 41–42, 105–112. [Google Scholar] [CrossRef]
  27. Guo, L.; Wu, M.; Xu, Y.; Wang, L.; Yang, F.; Bai, Q.; Feng, Z.; Zhang, X.; Lu, Y. Influence of heat input on temperature and stress field of X80 steel pipeline cirumferential weld using type-B sleeve repairing. Mater. Test. 2023, 65, 1786–1794. [Google Scholar] [CrossRef]
  28. Xu, C.-M.; Luo, L.-H.; Zhou, H.-P. Influence of B-type sleeve welding on the performance of X80 pipeline steel. Mater. Prot. 2019, 52, 149–156. [Google Scholar]
  29. Wang, G.-F.; Ren, G.-Q.; Deng, B.; Zhang, L.; Jia, P. Verification analysis of X70 type B sleeve for in-service pipeline repair. J. Fail. Anal. Prev. 2023, 23, 1137–1149. [Google Scholar] [CrossRef]
  30. Ma, W.; Ren, J.; Zhou, H.; Wang, K.; Luo, J.; Zhao, X.; Huo, C. Effect of Type B Steel Sleeve Rehabilitate Girth Weld Defect on the Microstructure and Property of X80 Pipeline. Mater. Sci. Forum 2019, 944, 854–861. [Google Scholar] [CrossRef]
  31. Rad, M.M. Reliability based analysis and optimum design of laterally loaded piles. Period. Polytech. Civ. Eng. 2017, 61, 491–497. [Google Scholar] [CrossRef]
  32. Bathe, K.-J. Finite Element Procedures; Prentice Hall, Pearson Education: London, UK, 2006. [Google Scholar]
  33. Riks, E. An incremental approach to the solution of snapping and buckling problems. Int. J. Solids Struct. 1979, 15, 529–551. [Google Scholar] [CrossRef]
  34. Li, Y.; Liao, Y.; Xie, Z.; Peng,, L. Stability Analysis of Curved Beams Based on First-Order Shear Deformation Theory and Moving Least-Squares Approximation. Buildings 2024, 14, 3887. [Google Scholar] [CrossRef]
  35. Limam, A.; Lee, L.H.; Kyriakides, S. On the collapse of dented tubes under combined bending and internal pressure. Int. J. Mech. Sci. 2012, 55, 1–12. [Google Scholar] [CrossRef]
  36. Limam, A.; Lee, L.H.; Kyriakides, S. Effect of local imperfections on the collapse of tubes under bending and internal pressure. In Proceedings of the 2010 8th International Pipeline Conference, Calgary, AB, Canada, 27 September–1 October 2010. IPC2010-31594. [Google Scholar]
  37. Limam, A.; Lee, L.-H.; Corona, E.; Kyriakides, S. Inelastic wrinkling and collapse of tubes under combined bending and internal pressure. Int. J. Mech. Sci. 2010, 52, 637–647. [Google Scholar] [CrossRef]
  38. Alexander, C.; Vyvial, B.; Wilson, F. Pipeline repair of corrosion and dents: A comparison of composite repairs and steel sleeves. In Proceedings of the International Pipeline Conference, Calgary, AB, Canada, 29 September–3 October 2014; p. V002T006A040. [Google Scholar]
  39. Crapps, J.M.; Yue, X.; Berlin, R.A.; Suarez, H.A.; Pribytkov, P.A.; Vyvial, B.A.; Proegler, J.S. Strain-based pipeline repair via type B sleeve. Int. J. Offshore Polar Eng. 2018, 28, 280–286. [Google Scholar] [CrossRef]
  40. Tang, H.; Ding, Y.; Qiu, G.; Liu, Z.; Deng, Z. Numerical Simulations for the Mechanical Behavior of a Type-B Sleeve under Pipeline Suspension. Processes 2024, 12, 1585. [Google Scholar] [CrossRef]
  41. Zhang, H.; Yang, F.; Zhang, L.; Wu, F. 输油气管道异型B型套筒构型设计及优化研究. 管道保护 2024, 40, 10–14. [Google Scholar] [CrossRef]
  42. SY/T 7666-2022; Type B Sleeve for Defect Repairing of Oil & Gas Pipeline. National Energy Administration: Beijing, China, 2022.
  43. Orynyak, I.; Okhrimchuk, S.; Venglovskii, L.; Strizhalo, V.; Ageev, S.; Chuikov, S.; Chechin, É.; Bogdan, A. Strength analysis of a split sleeve in a pipe containing a defect. Strength Mater. 2009, 41, 192–199. [Google Scholar] [CrossRef]
  44. SY/T 6649-2018; Technical Specifications for Repairing Defects in Oil and Gas Pipeline Bodies. National Energy Administration: Beijing, China, 2018.
  45. Grubits, P.; Cucuzza, R.; Habashneh, M.; Domaneschi, M.; Aela, P.; Movahedi Rad, M. Structural topology optimization for plastic-limit behavior of I-beams, considering various beam-column connections. Mech. Based Des. Struct. Mach. 2025, 53, 2719–2743. [Google Scholar] [CrossRef]
Figure 1. Structural configuration of traditional type A sleeve.
Coatings 15 01191 g001
Figure 2. Structural configuration of traditional type B sleeve.
Coatings 15 01191 g002
Figure 3. Iterative solution process of the Riks algorithm [34].
Coatings 15 01191 g003
Figure 4. Schematic of X80 geometric model: (a) Front view. (b) Side view.
Coatings 15 01191 g004
Figure 5. (a) Schematic of X80 pipeline constraints and loads. (b) Pipeline boundary conditions. (c) Visualization of buckling behavior under pure bending.
Coatings 15 01191 g005
Figure 6. (a) Global mesh of X80 pipeline. (b) Bending section mesh.
Coatings 15 01191 g006
Figure 7. Stress distribution in the central fixed region of X80-1016-12.8 before bending initiation. From left to right and top to bottom: (a) internal pressure of 1 MPa, (b) 4 MPa, (c) 7 MPa, (d) 10 MPa.
Coatings 15 01191 g007
Figure 8. Local stress distribution of X80-1016-12.8 under varying strains (internal pressure of 1 MPa): (a) strain = 0.01, (b) 0.03, (c) 0.05, (d) 0.08.
Coatings 15 01191 g008
Figure 9. Local stress distribution of X80-1016-12.8 at 0.08 strain: (a) internal pressure of 1 MPa, (b) 4 MPa, (c) 7 MPa, (d) 10 MPa.
Coatings 15 01191 g009
Figure 10. Stress distribution in the central fixed region of X80-1219-22 before bending initiation. From left to right and top to bottom: (a) Internal pressure of 1 MPa, (b) 4 MPa, (c) 8 MPa, (d) 12 MPa.
Coatings 15 01191 g010
Figure 11. Stress distribution of X80-1219-22 under varying strains (internal pressure of 1 MPa): (a) strain = 0.01, (b) 0.03, (c) 0.05, (d) 0.08.
Coatings 15 01191 g011
Figure 12. Stress distribution of X80-1219-22 at 0.08 strain under internal pressures of: (a) 1 MPa, (b) 4 MPa, (c) 8 MPa, (d) 12 MPa.
Coatings 15 01191 g012
Figure 13. (a) Schematic definition of projection height used in post-wrinkling analysis; (b) Stress distribution in the pipeline under bending with a given projection height.
Coatings 15 01191 g013
Figure 14. Protrusion height vs. end displacement of X80-1219-22 pipeline under varying internal pressures.
Coatings 15 01191 g014
Figure 15. Protrusion height vs. end displacement of X80-1422-25.4 pipeline under varying internal pressures.
Coatings 15 01191 g015
Figure 16. (a) Moment-curvature response of pipeline bending collapse under varying internal pressures, and (b) Corresponding diameter variation in the bending plane [37].
Coatings 15 01191 g016
Figure 17. Structure of Convex B-type Sleeve [41].
Coatings 15 01191 g017
Figure 18. Mesh generation of the convex B-type sleeve.
Coatings 15 01191 g018
Figure 19. The load and boundary conditions for the convex B-type sleeve.
Coatings 15 01191 g019
Figure 20. Stress–strain distributions of sleeves with different heights obtained from numerical simulations. From top to bottom: (a) h = 10, (b) h = 20, (c) h = 30, (d) h = 40.
Coatings 15 01191 g020aCoatings 15 01191 g020b
Figure 21. Sleeve height-stress trend.
Coatings 15 01191 g021
Figure 22. Trend of sleeve stress concentration factor.
Coatings 15 01191 g022
Figure 23. Response surface contour plots of sleeves with varying heights: (a) h = 10, (b) h = 20, (c) h = 30, (d) h = 40.
Coatings 15 01191 g023
Table 1. Research parameter settings.
APIOuter Diameter/mmWall Thickness/mmInternal Pressure/MPa
X80101612.81, 4, 7, 10
15.31, 4, 7, 10
18.41, 4, 7, 10
121918.41, 4, 8, 12
22.01, 4, 8, 12
26.41, 4, 8, 12
142221.41, 4, 8, 12
25.71, 4, 8, 12
30.81, 4, 8, 12
Table 2. Critical bulge height of API-X80 pipelines under different internal pressures.
APIOuter Diameter/mmInternal Pressure/MPaMinimum Bulge Height (mm)Maximum Bulge Height (mm)
X8010161, 4, 7, 1014.028.8
12191, 4, 8, 1222.333.2
Table 3. Summary of simulation results for different projection heights.
Projection Height/mmMax von Mises Stress/MPaMax Deformation/mmUltimate Load/kN
33884.2162
64206.3147
94588.9129
Table 4. Structural parameters of the sleeve.
h/mmL/mmL1/mmL2/mmR1/mmR2/mm
10600128956540
20600128956540
30600128956540
40600128956540
Table 5. Material properties of the sleeve.
PropertyValueUnit
Young’s Modulus2.06 × 105MPa
Poisson’s Ratio0.3 
Bulk Modulus1.7167 × 105MPa
Shear Modulus9.9231 × 104MPa
Table 6. Stress state analysis of sleeves with varying heights from numerical simulation.
Sleeve Height/mmMaximum Stress/MPaMinimum Stress/MPaAverage Stress/MPaStress Concentration Factor
10241.525.2182.91.32
20287.625.6184.41.56
30320.322.3187.91.7
40340.911.8192.11.78
Table 7. Final optimization results of different sleeves.
h/mmL/mmL1/mmL2/mmR1/mmR2/mm
10600115866543
20600115866044
30600115866044
40600115866044
Disclaimer/Publisher’s Note: The statements, opinions and data contained in all publications are solely those of the individual author(s) and contributor(s) and not of MDPI and/or the editor(s). MDPI and/or the editor(s) disclaim responsibility for any injury to people or property resulting from any ideas, methods, instructions or products referred to in the content.