Abstract
Titanium and its alloys are widely used in biomedical implants due to their favorable mechanical properties and corrosion resistance; however, their natural surface lacks sufficient bioactivity and antibacterial performance. Micro-arc oxidation is a promising approach to producing bioactive coatings, and the incorporation of nanoparticles such as TiO2 may further improve their functionality. This study aimed to determine the optimal TiO2 nanoparticle concentration in the micro-arc oxidation electrolyte that ensures coating stability and biological safety. Calcium–phosphate coatings were fabricated on commercially pure titanium using micro-arc oxidation with two TiO2 concentrations: 0.5 wt.% (MAO 1) and 1 wt.% (MAO 2). Surface morphology, porosity, and phase composition were analyzed by scanning electron microscopy, energy-dispersive spectroscopy, and X-ray diffraction. Corrosion resistance was evaluated via potentiodynamic polarization in NaCl and Ringer’s solutions, while biocompatibility was assessed in vitro using HOS human osteosarcoma cells and MTT assays. Increasing the TiO2 content to 1% decreased coating porosity (13.7% vs. 26.3% for MAO 1), enhanced corrosion protection, and reduced the friction coefficient compared to bare titanium. However, MAO 2 exhibited high cytotoxicity (81% cell death) and partial structural degradation in the biological medium. MAO 1 maintained integrity and showed no toxic effects (3% cell death). These results suggest that 0.5% TiO2 is the optimal concentration, providing a balance between corrosion resistance, mechanical stability, and biocompatibility, supporting the development of safer implant coatings.
1. Introduction
Titanium and its alloys are among the most widely used materials in modern medicine due to their high corrosion resistance, low density, favorable mechanical properties, and good bioinertness under physiological conditions [1,2]. However, the natural surface of titanium has several limitations, such as low wear resistance, limited osseointegration, and lack of pronounced antibacterial activity [3,4]. These factors drive the search for effective surface modification methods capable of improving the functional characteristics of titanium implants [5].
Various technologies are employed for the surface modification of titanium implants, including anodic oxidation, plasma spraying, sol-gel methods, laser texturing, ion implantation, and others [6,7,8,9]. These approaches allow the formation of oxide or bioactive layers that enhance cell adhesion and improve the corrosion resistance of the material. However, they also have several limitations, including poor coating adhesion to the substrate, insufficient porosity that slows down the osseointegration process, and challenges in the controlled incorporation of functional elements into the layer composition [10,11]. Micro-arc oxidation (MAO) is one of the most promising methods for producing bioactive coatings on titanium [12,13]. During MAO, a multilayered oxide film with a well-developed porous structure forms on the surface, increasing the contact area with biological tissues and enhancing osseointegration [14]. The additional incorporation of nanoparticles of various elements (Ag, Zn, Cu, TiO2, CeO2, etc.) into the coating can impart antibacterial, osteogenic, and photocatalytic properties [15,16,17], making MAO a versatile tool for the development of medical implants.
Particular attention has been given to TiO2 nanoparticles, which are widely used due to their bioinertness, photocatalytic activity, and ability to enhance the corrosion and mechanical resistance of coatings [18,19,20]. However, growing evidence indicates potential toxicological risks associated with the migration of TiO2 nanoparticles from coatings into biological environments. In vivo and in vitro studies have demonstrated that nanoparticles can penetrate tissues and organs, accumulate in the liver, kidneys, and brain, and cause oxidative stress, cell membrane damage, and apoptosis [21,22,23,24]. These effects depend on the concentration, size, and degree of nanoparticle aggregation, as well as the stability of the coating in physiological media.
Recent review and experimental studies have confirmed the promising potential of MAO coatings while highlighting the need for precise control over the composition and dosage of incorporated ions. For instance, electrochemical modification of titanium with Zn, Cu, Ag, Sr, and Ce ions via MAO has been shown to enhance osteogenic, angiogenic, and antibacterial properties. However, systematic reviews emphasize the risk of uncontrolled ion release and coating instability during long-term exposure to physiological environments [25,26,27,28,29].
In vitro studies on cell cultures further underline the dose-dependent nature of TiO2 toxicity: high nanoparticle concentrations can induce oxidative stress, DNA damage, and cell cycle disruptions, particularly in three-dimensional models that mimic in vivo conditions. This highlights the increased cellular sensitivity to nanoparticle dosage and morphology and underscores the need for a comprehensive analysis of both the physicochemical and biological properties of such coatings [30,31].
Despite the widespread use of TiO2-modified coatings in implantology, the mechanisms underlying their potential cytotoxicity at different nanoparticle concentrations remain unclear. A comprehensive study, combining physicochemical characterization and biological testing, is required to assess coating stability and safety for living cells.
The aim of this work is to provide a systematic evaluation of the influence of TiO2 nanoparticle concentration in the MAO electrolyte on the morphology, phase composition, corrosion resistance, and cytotoxicity of calcium–phosphate coatings formed on titanium. The findings of this study are expected to help define optimal MAO processing conditions that ensure a balance between mechanical and corrosion stability and biological safety, which is essential for the development of next-generation implantable medical devices.
2. Materials and Methods
Commercially pure titanium (grade VT1-0) samples with dimensions of 10 × 10 × 3 mm were used in this study. Prior to treatment, the sample surfaces were subjected to mechanical grinding, ultrasonic cleaning in ethanol, rinsing with deionized water, and sandblasting to remove the native oxide layer and level the surface. Calcium–phosphate coatings were produced by micro-arc oxidation (MAO) in an aqueous electrolyte containing 30% phosphoric acid (H3PO4), 60 g L−1 hydroxyapatite (HA), and 90 g L−1 calcium carbonate (CaCO3). To investigate the effect of TiO2 nanoparticle concentration, two electrolyte compositions were prepared, containing 0.5% and 1% TiO2 nanoparticles, respectively. Samples obtained under these conditions are hereafter designated as MAO 1 (0.5% TiO2) and MAO 2 (1% TiO2). In addition to the TiO2-containing coatings, a control PEO coating was prepared in the same calcium–phosphate electrolyte without TiO2 nanoparticles (denoted MAO 0) to provide a reference for comparison of the morphological and physicochemical properties. We used commercial titanium (IV) oxide nanopowder (anatase phase) purchased from AldrichSt. Louis, MI, USA (catalogue No. 637254-50G, Lot No. MKCN0838). According to the manufacturer’s specifications, the particles have an average size of <25 nm, a purity of 99.7%, and the crystalline phase is anatase. The base electrolyte for micro-arc oxidation was a calcium–phosphate solution consisting of 30% H3PO4, 60 g L−1 hydroxyapatite, and 90 g L−1 CaCO3. For the MAO 1 and MAO 2 samples, this same calcium–phosphate electrolyte was used, with the only difference being the addition of 0.5 wt.% or 1 wt.% of the TiO2 nanopowder described above. The MAO process was performed using a KP-HI-F-40A600V pulsed power supply under the following parameters: voltage—300 V, processing time—600 s, frequency—200 Hz, duty cycle—15%, and current density—0.23–0.35 A/cm2. After treatment, the samples were rinsed with deionized water and dried at room temperature.
The surface morphology and elemental composition of the coatings were analyzed using a Tescan scanning electron microscope equipped with an energy-dispersive spectroscopy (EDS) detector. Phase composition was determined by X-ray diffraction (X’Pert PRO, PANalytical, Almelo, The Netherlands). Porosity and average pore size were quantified based on SEM images using the ImageJ softwareversion:1.54d.
Corrosion resistance was evaluated by potentiodynamic polarization using a CS350M potentiostat-galvanostat (Corrtest Instruments) with a flat-type corrosion cell (model CS936) in a standard three-electrode configuration. The working electrode was a coated or uncoated sample with an exposed area of 1 cm2. A saturated Ag/AgCl electrode served as the reference, and a platinum mesh was used as the counter electrode. Tests were conducted in two media: 3.5 wt.% NaCl and Ringer’s solution at 25 °C. Prior to polarization, the open-circuit potential (OCP) was stabilized for 30 min. The potential sweep was carried out from −0.25 V to 0.00 V versus Ag/AgCl at a scan rate of 0.5 mV/s. The open surface porosity and pore size were quantified from plan-view SEM micrographs in ImageJ. After scale calibration images were segmented (Otsu threshold) with watershed separation; edge-touching features and objects < 2 µm were excluded. For each condition, 5 random fields of view were analyzed; the results are reported as mean ± SD. Static water contact angles were measured using a goniometer SDA-100 contact goniometer (Qchaida, Dongguan, China, sessile-drop method (3 µL), at 23 ± 1 °C.
Tribological tests were performed using an Anton Paar TRB3 tribometer in a ball-on-disk configuration in Ringer’s solution. As the counterbody, we used a 6 mm silicon–nitride (Si3N4) ceramic ball, supplied with the instrument, with an applied load of 2 N and a sliding distance of 100 m. The friction coefficient was recorded in real time. Si3N4 was chosen because it is chemically inert and does not corrode in Ringer’s solution, allowing the tribological response of the coating itself to be evaluated without interference from the counterbody.
For cytotoxicity evaluation, 10 samples were prepared (5 from each coating group). The study was carried out using the HOS human osteosarcoma cell line in accordance with ISO 10993-5 [32]. The cell concentration was 105 cells/mL in culture medium (90% DMEM, 10% FBS, antibiotics, and L-glutamine). Samples were incubated with the cell culture for 24 h at 37 °C, 5% CO2, and 100% humidity. A culture without samples served as the control. After incubation, samples were removed, and 0.5% MTT solution (NeoFroxx, Einhausen Germany) was added and incubated for an additional 4 h, followed by dissolution of the formazan crystals in 10% dodecyl sulfate in 0.01 M HCl. Optical density was measured using a Multiskan FC spectrophotometer (Thermo Fisher Scientific, Shanghai China) at 540 nm with a 630 nm reference. The cytotoxicity index (CI, %) was calculated using the following formula:
where K is the absorbance of the control and O is the absorbance of the sample. Samples were considered non-cytotoxic when CI ≤ 30%. Macro- and microscopic images of the surfaces before and after the experiments were taken using a Canon Power Shot A630 digital camera and an ADF I350 inverted metallographic microscope after staining fixed cells with a mixture of Azure II and eosin. Statistical analysis was performed in RStudio (R) software version:6.3.1128.1 using the Shapiro–Wilk test (with Royston’s correction), Welch’s ANOVA, the Brunner–Munzel test, and Games–Howell multiple comparisons, with a significance level of p < 0.05. Prior to cell contact, specimens were rinsed 3× with deionized water (and PBS), then air-dried; after MAO, all samples were rinsed and dried as described.
3. Results
3.1. Surface Morphology of MAO Coatings
Figure 1 presents the surface morphology of the coatings produced in electrolytes with different TiO2 nanoparticle contents. The MAO 0 surface, obtained without nanoparticle addition, exhibits the typical micro-arc oxidation (MAO) morphology: a porous layer with rounded discharge craters of various sizes and relatively smooth, dense pore walls. When 0.5 wt.% TiO2 nanoparticles are introduced into the electrolyte (MAO 1, Figure 1b), the coating retains the characteristic MAO structure but shows a slightly denser arrangement of pores and more uniform pore distribution. Increasing the nanoparticle concentration to 1 wt.% produces a surface with reduced total open porosity and partial closure of some discharge channels; the large craters remain but their number is lower, indicating a more compact oxide layer. XRD analysis confirms the presence of TiO2 signals in both MAO 1 and MAO 2 coatings, demonstrating that the TiO2 nanoparticles become incorporated into the MAO layer during plasma-electrolytic oxidation. The amount of incorporated TiO2 increases with the nanoparticle content in the electrolyte, but no qualitative difference in the type of incorporated phase is observed. Thus, the main effect of increasing TiO2 concentration is a denser, less porous microstructure with a higher level of TiO2 incorporation, which can influence the subsequent corrosion resistance and biological response.
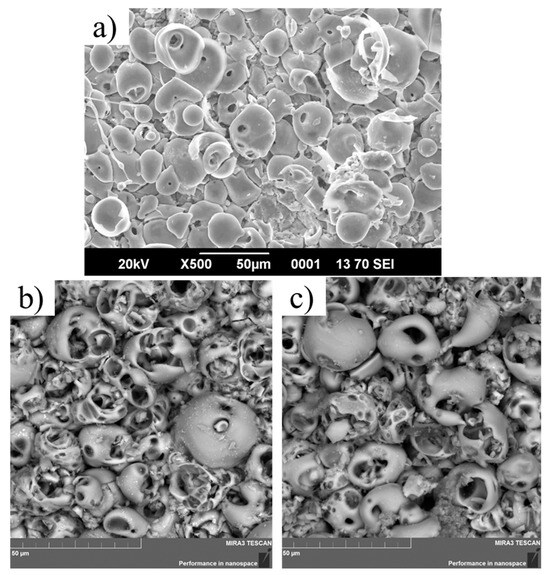
Figure 1.
Surface SEM images of the coatings: (a) MAO 0—coating formed in the calcium–phosphate electrolyte without TiO2 nanoparticles, (b) MAO 1—coating formed with 0.5 wt.% TiO2, (c) MAO 2—coating formed with 1 wt.% TiO2.
3.2. Phase Composition
Figure 2 presents the X-ray diffraction (XRD) patterns of the untreated titanium surface and the MAO coatings produced with different TiO2 nanoparticle concentrations. For the uncoated titanium substrate, characteristic diffraction peaks of α-Ti are observed at 2θ ≈ 35°, 38°, 40°, 53°, and 63°, corresponding to the hexagonal close-packed crystal structure of metallic titanium. After MAO treatment, additional diffraction peaks appear for both coating types (MAO 1 and MAO 2), which can be attributed to titanium dioxide phases. Distinct peaks of anatase TiO2 are detected at approximately 2θ ≈ 25°, 37°, 48°, and 55°, while rutile peaks are observed to a lesser extent near 2θ ≈ 27°. This indicates the formation of an oxide film with a mixed polymorphic composition. Increasing the TiO2 nanoparticle concentration in the electrolyte (MAO 2) results in a higher intensity of both anatase and rutile peaks compared to MAO 1, suggesting a greater amount of crystalline TiO2 phases in the coating [33,34]. The metallic titanium peaks remain visible, which is attributed to partial penetration of the X-ray beam through the porous coating layer to the underlying substrate. Thus, a higher TiO2 nanoparticle content promotes the formation of a coating with enhanced crystallinity and enrichment in the anatase and rutile phases.
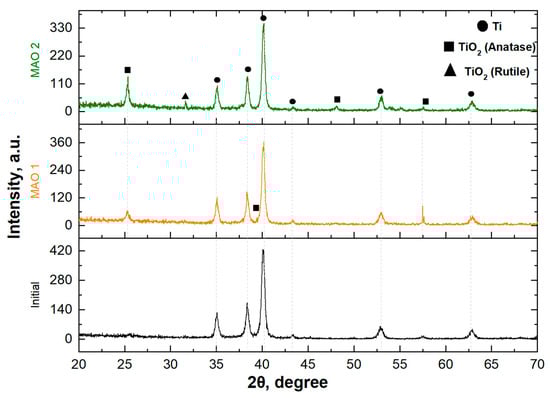
Figure 2.
X-ray diffraction patterns of initial titanium and coatings containing TiO2.
3.3. Porosity and Pore Size
In aqueous electrolytes, such particles can form loose agglomerates of several hundred nanometers, which is typical for unmodified TiO2 suspensions in near-neutral or weakly alkaline solutions [35]. During micro-arc oxidation, the local plasma micro-discharges reach transient temperatures of 2000–10,000 K, but the residence time of individual nanoparticles in the discharge channel is extremely short (micro- to milliseconds) and rapid quenching occurs [36]. Numerous studies have shown that TiO2 nanoparticles do not melt completely; instead, they become partially sintered and are incorporated into the growing calcium–phosphate/TiO2 oxide layer as crystalline anatase/rutile phases [37]. Our own XRD and EDS analyses (Figure 2) confirm the presence of anatase and rutile peaks in the final coating, demonstrating that TiO2 nanoparticles survive the MAO process and are embedded within the oxide matrix rather than being dissolved or lost.
Figure 3 presents the porosity and average pore-size values of the coatings. For the MAO 1 sample, the total open surface porosity is 26.3%, with an average pore size of 22.4 µm. Increasing the TiO2 nanoparticle concentration to 1% (MAO 2) reduces the open porosity to 13.7%, while the mean pore size decreases only slightly to 19.7 µm. SEM observations (Figure 1) show that a few large discharge craters remain visible on MAO 2, but their areal density is lower, so that the overall mean pore diameter is marginally smaller. The reduction in open porosity is attributed to a more intense micro-arc oxidation process and the consequent densification of the oxide layer, which leads to partial closure of discharge channels [38,39,40]. Although high porosity can facilitate osseointegration by increasing the surface area available for cell attachment, excessive porosity may compromise corrosion resistance and mechanical strength. Thus, a TiO2 nanoparticle concentration of 1% promotes the formation of a denser coating with potentially improved structural stability while maintaining the characteristic MAO surface morphology.
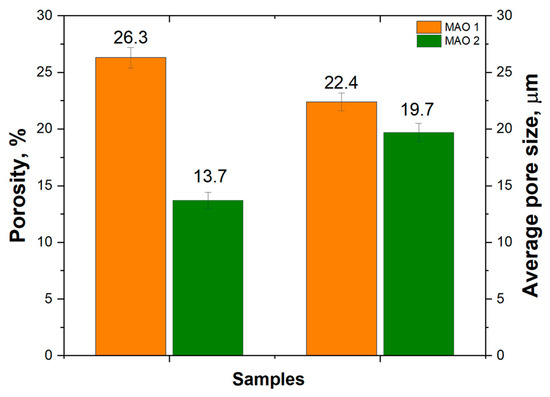
Figure 3.
Porosity and average pore size of MAO coatings formed with different TiO2 nanoparticle concentrations.
3.4. Coating Thickness (Cross-Sectional SEM)
Cross-sectional SEM micrographs (Figure 4) reveal the typical duplex MAO structure with a porous outer layer and a dense inner barrier layer. The coating thickness, determined from three independent measurements on each sample, is about 72 ± 8 µm for MAO 1 and about 123 ± 5 µm for MAO 2. Although no statistical analysis was performed, these values clearly indicate that the coating obtained with 1 wt.% TiO2 is markedly thicker than the one produced with 0.5 wt.% TiO2. The increase in thickness can be attributed to the higher density and energy of micro-discharges in the electrolyte with a larger amount of TiO2 nanoparticles, which accelerates oxide growth and promotes the formation of a thicker porous layer.
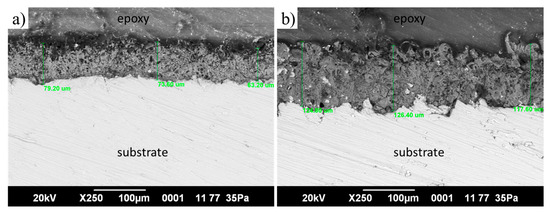
Figure 4.
SEM cross-section images of MAO coatings: (a) MAO 1, (b) MAO 2.
3.5. Surface Roughness
The surface roughness (Ra) values obtained from contact profilometry are summarized in Table 1 and representative profiles are shown in Figure 5. The untreated titanium surface exhibits an average roughness of 3.55 ± 1.5 µm, which reflects the initial sand-blasted preparation. The TiO2-free MAO coating (MAO 0) shows a comparable Ra of 3.96 ± 1.2 µm, indicating that the micro-arc oxidation process without nanoparticle additives does not substantially change the macro-scale roughness. In contrast, incorporation of TiO2 nanoparticles leads to a slight but measurable decrease: MAO 1—3.05 ± 0.4 µm and MAO 2—2.98 ± 0.7 µm. This trend is consistent with the SEM observations (Figure 1), where the coatings containing nanoparticles display partial closure of large discharge channels and a denser surface. A lower Ra can improve the uniformity of cell attachment while maintaining the characteristic porous microstructure required for osseointegration.

Table 1.
Average surface roughness (Ra) of untreated titanium and MAO coatings with different TiO2 nanoparticle contents.
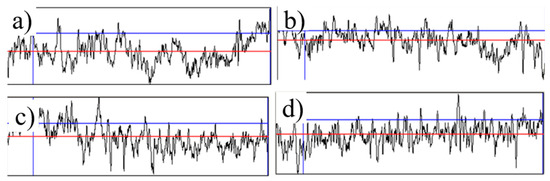
Figure 5.
Surface roughness profiles of the tested samples: (a) initial, (b) MAO 0, (c) MAO 1, (d) MAO 2.
3.6. Corrosion Behavior
The anodic polarization curves (Figure 6) demonstrate clear differences in the corrosion behavior of bare titanium and MAO-coated samples. In 3.5 wt.% NaCl solution (Figure 6a), the corrosion current density (Icorr) of untreated titanium is 1.48 × 10⁻⁵ A cm−2, whereas MAO 1 and MAO 2 show markedly lower values of 3.50 × 10⁻⁶ A cm−2 and 8.89 × 10⁻⁶ A cm−2, respectively. Both coatings also exhibit a positive shift of the corrosion potential, indicating a slowdown of anodic dissolution processes. Among them, the MAO 2 coating provides the most pronounced improvement in the chloride medium. In Ringer’s solution (Figure 6b), the absolute Icorr values for all samples are lower, reflecting the formation of a protective passive TiO2 film promoted by the calcium- and phosphate-containing ions of the medium: 2.27 × 10⁻⁶ A cm−2 for bare titanium, 9.68 × 10⁻⁷ A cm−2 for MAO 1, and 1.13 × 10⁻⁵ A cm−2 for MAO 2. Owing to this strong spontaneous passivation, the untreated titanium shows a slightly lower Icorr than the MAO coatings. This effect is well known for titanium in simulated body fluids and represents a temporary passivation phenomenon rather than superior long-term protection. Importantly, in the more aggressive chloride environment (NaCl), the MAO coatings, particularly MAO 2, still provide markedly better protection than bare titanium. The superior corrosion performance of MAO 2 compared with MAO 1 can be attributed to its lower open porosity (13.7% vs. 26.3%), which limits the penetration of aggressive ions, and to the higher crystallinity of the oxide layer with an increased content of stable TiO2 phases [41,42,43].
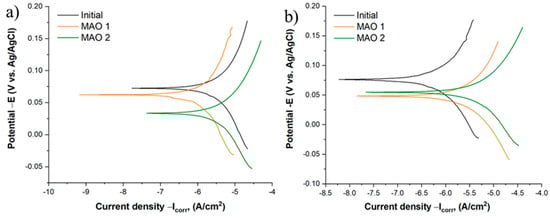
Figure 6.
Polarization curves of the samples: (a) in 3.5 wt.% NaCl solution; (b) in Ringer’s solution.
3.7. Tribological Performance
Figure 7 shows the evolution of the friction coefficient (µ) during ball-on-disk sliding in Ringer’s solution. All samples display an initial running-in stage with a rapid rise in µ, followed by a quasi-steady regime. The untreated titanium and the MAO 0 coating (formed without TiO2 nanoparticles) exhibit the highest steady-state friction coefficients, stabilizing at about 0.55–0.60 and 0.50–0.55, respectively. For the TiO2-containing coatings the friction levels are lower overall: MAO 1 reaches approximately 0.46–0.50, while MAO 2 remains in the range 0.38–0.42 throughout the test. It should be noted that, at longer sliding distances, the µ value of MAO 1 slightly exceeds that of the untreated reference, which we have now stated explicitly; this reflects the combined effect of its relatively high open porosity and the formation of a stable tribolayer rather than any measurement artefact. The progressive reduction of µ from MAO 0 to MAO 2 correlates with the decrease in open surface porosity and the more compact microstructure (Figure 3), which favor better retention of the lubricating medium and reduce adhesive interactions with the Si3N4 counterbody. Thus, the incorporation of TiO2 nanoparticles, particularly at 1 wt.%, results in coatings with improved tribological behavior compared to both untreated titanium and MAO 0.
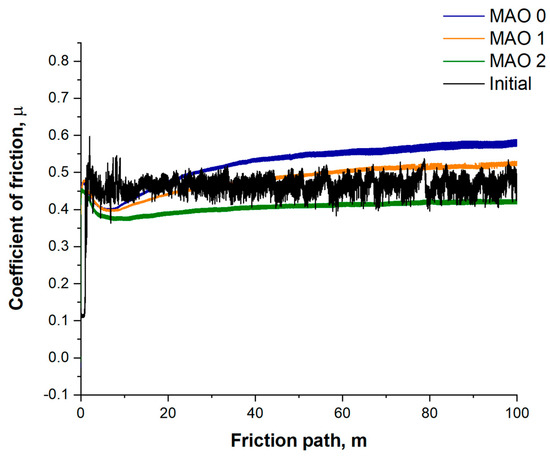
Figure 7.
Tribological test results.
3.8. Wettability (Water Contact Angle)
Figure 8 shows the static water contact angles of the investigated surfaces. The untreated titanium exhibits a contact angle of 68.0°, corresponding to a weakly hydrophilic surface. After micro-arc oxidation without TiO2 (MAO 0) the contact angle decreases to 52.0°, and further to 47.2° for MAO 1 (0.5 wt.% TiO2), indicating a more pronounced hydrophilic character. This trend correlates with the higher surface porosity and the moderately rough topography revealed by SEM and profilometry (Table 1), which favor the capillary penetration of water and thus enhance wetting. For MAO 2 (1 wt.% TiO2), the contact angle slightly increases to 60.3°, remaining within the hydrophilic range (<90°). The small rise compared with MAO 1 can be related to the lower open porosity (13.7% vs. 26.3%) and the denser outer layer, which reduce the capillary effect despite similar Ra values. Overall, all coatings remain hydrophilic, a surface property known to be beneficial for early cell adhesion and subsequent osseointegration of implant materials [44]. All coatings remain hydrophilic (<90°), which is favorable for early cell adhesion.
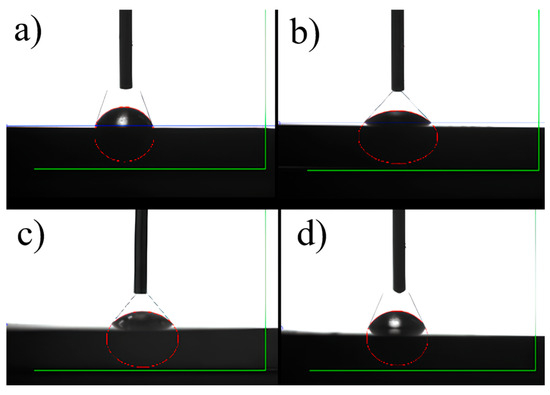
Figure 8.
Water contact angle images of the tested surfaces: (a) initial, (b) MAO 0, (c) MAO 1, (d) MAO 2.
3.9. Cytotoxicity and Surface Stability in Cell Culture
In this study, dark-field light microscopy was employed to assess the microrelief of the coating surfaces before and after thermal sterilization, as well as to analyze the uniformity and structural changes induced by technological treatments. Reflective dark-field microscopy of the samples (Figure 9) revealed a pronounced microrelief typical of calcium–phosphate coatings formed by the micro-arc oxidation process, consisting of bright spherulitic structures and darker surface depressions.
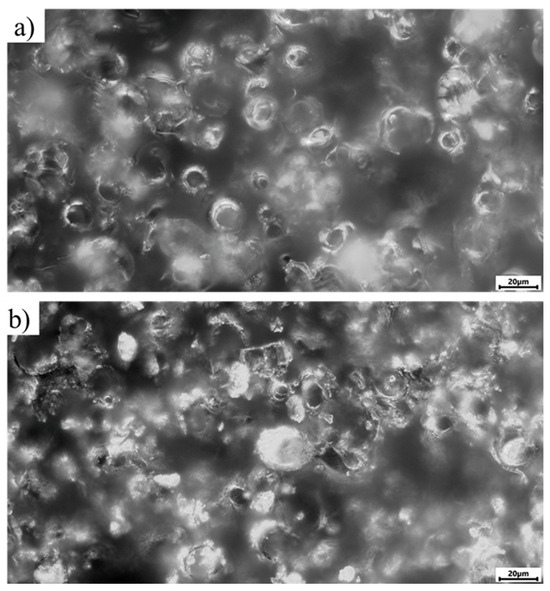
Figure 9.
Microscopic appearance of the sample surfaces before dry-heat sterilization (dark-field light microscopy), magnification ×500; (a) sample No. 31 from the MAO 1 group; (b) sample No. 21 from the MAO 2 group.
After sterilization at 160 °C for 60 min (prior to contact with the liquid cell culture), no additional surface integrity changes (such as cracks or delamination of structural elements) were observed. However, when the sterile samples were placed in the cell suspension, yellowing of the culture medium was noticeable in the MAO 2 group (Figure 10). Only sample No. 25 displayed a medium color similar to that of the control group (cells without samples, K1 for comparison) and the MAO 1 test group (sample No. 35 for comparison). In addition, a white amorphous, flake-like precipitate formed at the bottom of the test tubes containing samples No. 21–24 (MAO 2 group), which was absent in the control tubes and in tubes containing samples No. 25 and No. 35. Synthetic cell culture media have their own buffering systems that protect against pH fluctuations. The yellowing observed in group 2 indicates acidification of the medium caused by chemical products released from the samples (e.g., detachment of structural coating elements or residual products of the micro-arc oxidation process that were not fully removed during sample preparation). pH fluctuations of ±1 unit from the neutral range (7.0–7.4) indicate that the sample did not pass sanitary-chemical suitability tests for potential implant use. Therefore, samples from the MAO 2 group may subsequently demonstrate excessive cytotoxicity in the MTT assay.
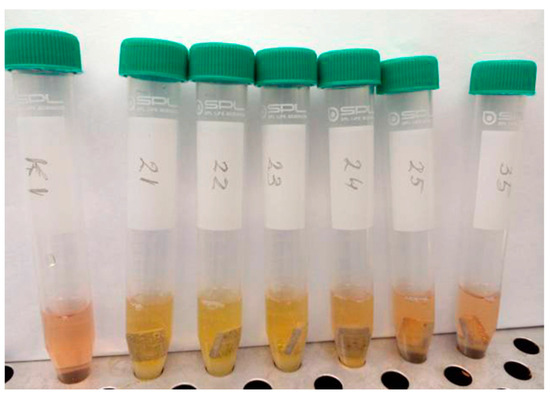
Figure 10.
Change in the color of the culture medium immediately after adding samples from the MAO 2 group (Nos. 21–24).
In this context, it should be noted that after contact with the cell culture, coating defects were observed on both sides of the MAO 2 samples, particularly along the edges, which may indicate partial dissolution of the coating and precipitation of its components into the medium (Figure 10). In the MAO 1 group, this effect was much less pronounced. Edge defects of MAO coatings have been reported in the literature in cases of excessive coating dissolution and are presumably associated with “stress concentrators.” The condition of a normal distribution of sample characteristics was not met ; therefore, a nonparametric test was used to compare the results between the MAO 1 and MAO 2 groups. Verification according to of the PI guidelines (Table 2) showed that the median cytotoxicity index (CI) in the MAO 2 group significantly exceeded the 30% in vitro cytotoxicity threshold recommended by ISO 10993-5, reaching 81% cell death compared to the control. In contrast, the MAO 1 group had a median CI of 3% (Table 3), indicating the non-cytotoxic nature of the samples in this group. Statistically significant differences (p < 0.001) in the median CI values were identified between the two groups (Table 3 and Figure 11).
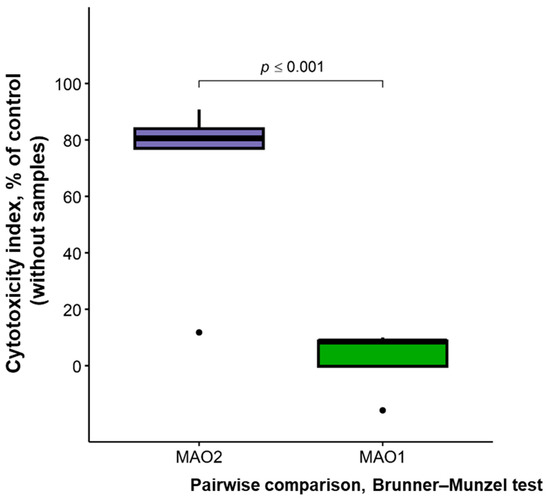
Figure 11.
Graphical representation of MTT test results for in vitro cytotoxicity of different sample groups (five samples per group).
Table 2.
Verification of MTT test results for the normal distribution of variables in the studied samples.
Table 2.
Verification of MTT test results for the normal distribution of variables in the studied samples.
| Group | Shapiro–Wilk Test with Royston’s Correction | Normal Distribution Law of the Variable |
|---|---|---|
| MAO 1 | SW = 0.94, p = 0.13 | yes |
| MAO 2 | SW = 0.66, p < 0.001 | no |
Table 3.
Intergroup comparison of MTT test results in the studied samples.
Table 3.
Intergroup comparison of MTT test results in the studied samples.
| Group | Cytotoxicity Index Values, % of Control, Me (Q1; Q3) | Pairwise Comparison, Brunner–Munzel Test |
|---|---|---|
| MAO 1 | 3 (−2; 10) | Brunner–Munzel Test Statistic = 17.63 p < 0.001 |
| MAO 2 | 81 (76; 84) |
Thus, the MAO 2 group samples exhibit a significant cytotoxic effect (>30% relative to control) on the in vitro culture of HOS human osteosarcoma cells under direct short-term contact for 24 h. The results presented in Table 4 and Table 5 indicate that the cytotoxic effect in the MAO 1 group varies around zero. Notably, sample No. 32 demonstrates statistically significant differences from the other samples in this group, showing a cytoprotective effect (enhanced cell viability).
Table 4.
Intragroup comparison of MTT test results among samples within the MAO 1 group.
Table 4.
Intragroup comparison of MTT test results among samples within the MAO 1 group.
| Group | n | Cytotoxicity Index Values, % of Control (X ± SD) | Multiple Comparison, Welch’s ANOVA | Pairwise Comparison, Games–Howell Test |
|---|---|---|---|---|
| Sample 31 | 5 | 10 ± 7 | F = 7.21 p = 0.0054 | p31–32 = 0.0067 p31–33 = 0.99 p31–34 = 0.28 p31–35 = 0.99 p32–33 = 0.0091 p32–34 = 0.099 p32–35 = 0.0095 p33–34 = 0.39 p33–35 = 0.99 p34–35 = 0.41 |
| Sample 32 | 5 | −15.80 ± 8.82 | ||
| Sample 33 | 5 | 8.80 ± 7.19 | ||
| Sample 34 | 5 | −0.2 ± 7.82 | ||
| Sample 35 | 5 | 8.6 ± 7.16 |
n—sample size (number of measurement replicates); the intragroup distribution of the variable was consistent with normality according to the Shapiro–Wilk test with Royston’s correction.
Table 5.
Intragroup comparison of MTT test results among samples within the MAO 2 group.
Table 5.
Intragroup comparison of MTT test results among samples within the MAO 2 group.
| Group | n | Cytotoxicity Index Values, % of Control (X ± SD) | Multiple Comparison, Welch’s ANOVA | Pairwise Comparison, Games–Howell Test |
|---|---|---|---|---|
| Sample 21 | 5 | 80.60 ± 1.67 | F = 201.47 p < 0.001 | p21–22 < 0.001 p21–23 = 0.042 p21–24 = 0.071 p21–25 < 0.001 p22–23 < 0.001 p22–24 < 0.001 p22–25 < 0.001 p23–24 = 0.0014 p23–25 < 0.001 p24–25 < 0.001 |
| Sample 22 | 5 | 90.80 ± 0.84 | ||
| Sample 23 | 5 | 84 ± 1.23 | ||
| Sample 24 | 5 | 77 ± 1.87 | ||
| Sample 25 | 5 | 11.80 ± 6.61 |
n—sample size (number of measurement replicates); the intragroup distribution of the variable was consistent with normality according to the Shapiro–Wilk test with Royston’s correction.
In turn, with the exception of sample No. 25 (CI = 11.8%), the remaining four samples showed CI values in the range of 77.0%–90.8% (Table 5), which is 2.5–3 times higher than the threshold level recommended by ISO 10993-5 (not exceeding 30%).
The significant intragroup differences in CI values observed among the MAO 2 samples may indicate variations in the structure and composition of the coatings, which are likely related to the visual non-uniformity of the coatings across the sample surfaces, as revealed by macroscopic imaging before and after contact with the cell culture, as well as partial detachment of the coatings into the cell suspension. For reader clarity, Figure 12 shows front and back views of both sample groups before and after cell contact and staining (MAO 1—Nos. 31–35; MAO 2—Nos. 21–25). Prior to exposure (Figure 12a,b), both groups exhibit uniform, intact surfaces. After 24 h in the HOS suspension and subsequent Azure II/eosin staining (Figure 12c,d), the MAO 1 samples retain a more uniform appearance with scattered stained spots corresponding to adhered cells, whereas the MAO 2 samples display more pronounced color heterogeneity and local surface changes, consistent with the higher cytotoxicity and partial coating instability reported below.

Figure 12.
Macroscopic appearance of the samples before and after 24 h contact with the HOS cell suspension followed by Azure II/eosin staining. (a) Front view, before exposure; (b) back view, before exposure; (c) front view, after exposure and staining; (d) back view, after exposure and staining. Sample groups: MAO 1—Nos. 31–35; MAO 2—Nos. 21–25 (engraved IDs are visible on each tile). Images in (a,b) were taken on graph paper for alignment; images in (c,d) were taken on a white background to visualize staining contrast.
Microscopic imaging of the sample surfaces after Azure II/eosin staining was used to visualize HOS cells adhered to the coatings (Figure 13). Because of the irregular micro-relief and variable depth of the MAO surface it was not possible to obtain sharply focused micrographs at all sites, even at low magnification (×200). Nevertheless, representative low-magnification images of the MAO 1 group (Figure 13a) show multiple scattered stained areas corresponding in size to individual cells. Examination of several fields of view at higher magnification (×500) confirmed the presence of cell nuclei-like structures in these stained regions (Figure 13b). For the MAO 2 group (Figure 13c), stained elements were also found, but in repeated fields the overall number of attached cells was lower than on MAO 1, even though the single representative image shows two stained spots. The lower apparent count in the selected micrographs should therefore be interpreted qualitatively; the conclusion of higher cell adhesion on MAO 1 is based on observation of multiple areas rather than only the frames shown.
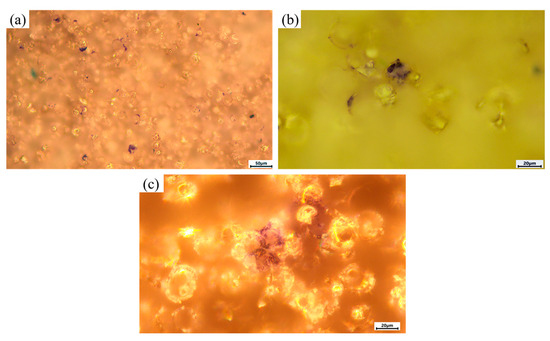
Figure 13.
Microscopic appearance of sample surfaces after 24 h contact with HOS cells and Azure II/eosin staining. (a) MAO 1 No. 33, dark-field, ×200: numerous stained regions corresponding in size to individual cells are visible across the surface; (b) MAO 1, bright-field, ×500: single stained element showing a cell-nucleus-like structure; (c) MAO 2 No. 22, dark-field, ×500: representative view with two stained elements.
Figure 14 presents the SEM results of the samples after cytotoxicity testing. For the MAO 1 group samples (Figure 14a,b), the surface largely retains its original coating structure with minimal signs of degradation. The morphology remains relatively stable, with individual areas showing adhered cellular elements, confirming the low cytotoxicity of the coating and its ability to support cell adhesion. No significant dissolution or delamination of the coating was observed. In contrast, the MAO 2 group samples (Figure 14c,d) exhibit more pronounced coating degradation, including localized dissolution, the appearance of microcracks, and areas where structural elements have delaminated. Some regions display residual decomposition products of the coating, likely released into the culture medium, correlating with the color change observed at the early stages of the experiment (Figure 10). Such surface alterations indicate coating instability and potential release of particles or ions that may cause toxic effects on cells [45,46,47,48].
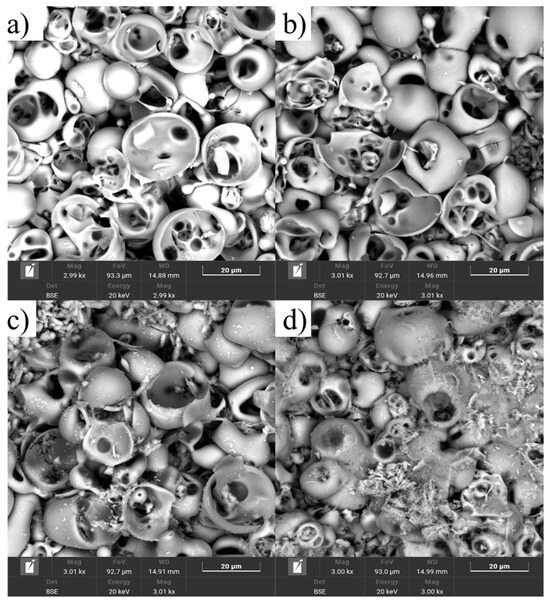
Figure 14.
SEM micrographs of MAO coatings after cytotoxicity testing: (a,b) MAO 1 sample No. 32, (c,d) MAO 2 sample No. 22.
EDS elemental mapping and spectra (Figure 15) confirm the presence of titanium, calcium, phosphorus, oxygen, and trace amounts of carbon in both coatings. In the MAO 1 sample (non-cytotoxic coating), the distribution of calcium and phosphorus remains relatively uniform across the surface, and the overall composition shows minimal changes after contact with the cell culture. This indicates good chemical stability of the coating and low release of degradation products into the surrounding medium, correlating with the absence of cytotoxic effects. In contrast, the MAO 2 sample exhibits decreased phosphorus and calcium signals accompanied by an increased titanium and oxygen contribution, suggesting partial dissolution of the calcium–phosphate layer and exposure of the underlying titanium oxide phase. These compositional changes are consistent with the previously observed yellowing of the culture medium and the higher cytotoxicity index (>30%). Thus, coatings formed with 0.5% TiO2 nanoparticles (MAO 1) demonstrate better chemical stability and biocompatibility compared to coatings formed with 1% TiO2 (MAO 2).
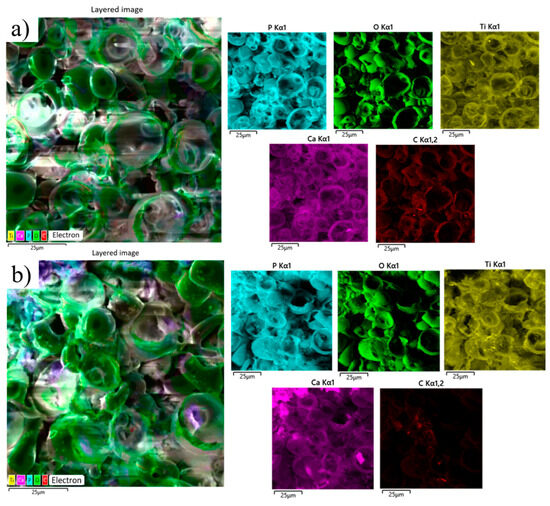
Figure 15.
EDS analysis of MAO coatings after cytotoxicity testing: (a) MAO 1; (b) MAO 2.
Table 6 summarizes the elemental composition of the coatings obtained from EDS mapping. Both coatings consist primarily of oxygen, phosphorus, and calcium, confirming the formation of a calcium–phosphate–titania layer. The titanium content is about 10.17 wt.% in MAO 1 and 7.24 wt.% in MAO 2, indicating that TiO2 nanoparticles are successfully incorporated into the oxide layer. The slightly lower Ti content at 1 wt.% TiO2 addition is consistent with the thicker Ca–P rich outer layer and agrees with the XRD identification of anatase and rutile phases. These EDS results, together with the XRD and SEM analyses, confirm the presence and stable incorporation of TiO2 nanoparticles in the MAO coatings and address the reviewers’ request for quantitative elemental data.
Table 6.
Elemental composition (EDS, weight %) of the MAO coatings.
The observed differences between coatings produced with 0.5 and 1 wt.% TiO2 nanoparticles can be explained by the influence of nanoparticle concentration on the micro-arc discharge behavior and the kinetics of oxide growth. TiO2 nanoparticles in the electrolyte act as additional charge carriers and heterogeneous nucleation sites, which modify the breakdown voltage and increase the density and energy of micro-discharges [49]. At a higher nanoparticle content (1 wt.%), the higher discharge energy promotes more intense local melting and re-solidification of the oxide, leading to partial closure of discharge channels and formation of a denser, more crystalline TiO2-containing layer. Conversely, at 0.5 wt.%, the lower concentration of particles results in a more open, highly porous structure with larger areal density of discharge craters. These microstructural changes directly affect the corrosion behavior, tribological performance, and cytotoxicity of the coatings.
4. Conclusions
In this study, a comprehensive evaluation was conducted on the effect of TiO2 nanoparticle concentration in the micro-arc oxidation (MAO) electrolyte on the morphology, phase composition, corrosion resistance, and biological safety of calcium–phosphate coatings on titanium. The results demonstrated that increasing the TiO2 content from 0.5% to 1% led to coating densification, reduced porosity, and improved corrosion resistance; however, it was also associated with decreased biocompatibility and increased in vitro cytotoxicity. SEM and EDS analyses after the cytotoxicity test revealed partial degradation and leaching of the coating in the MAO 2 group, which correlated with higher cell death rates and pH changes in the culture medium. In contrast, MAO 1 coatings maintained stable morphology, preserved their elemental composition, and exhibited no toxic effects on cells. Therefore, to enhance the biological safety of implantable devices, MAO coatings with an optimized TiO2 nanoparticle concentration (≤0.5%) are preferable, providing a balance between corrosion protection and biocompatibility. These findings may serve as a basis for further optimization of electrolyte composition and MAO processing parameters in the development of bioinert and bioactive implant materials. A limitation of the present study is that cytotoxicity was not assessed for the TiO2-free MAO 0 coating, since the biological experiments were focused on elucidating the specific influence of TiO2 nanoparticles.
Author Contributions
Conceptualization, A.Z. and B.R.; methodology, D.B.; software, D.K.; validation, D.B., N.M., and B.R.; formal analysis, D.K.; investigation, A.Z.; resources, D.B.; data curation, N.M.; writing—original draft preparation, A.Z.; writing—review and editing, A.K.; visualization, D.B.; supervision, A.K.; project administration, A.K.; funding acquisition, B.R. All authors have read and agreed to the published version of the manuscript.
Funding
This research has been funded by the Committee of Science of the Ministry of Science and Higher Education of the Republic of Kazakhstan (Grant No. BR24992862).
Institutional Review Board Statement
Not applicable.
Informed Consent Statement
Informed consent was obtained from all subjects involved in this study.
Data Availability Statement
Data are available from the authors upon reasonable request.
Conflicts of Interest
Author Bauyrzhan Rakhadilov, Aidar Kengesbekov and Dauir Kakimzhanov were employed by the company PlasmaScience LLP. The remaining authors declare that the research was conducted in the absence of any commercial or financial relationships that could be construed as a potential conflict of interest.
References
- Akshaya, S.; Rowlo, P.K.; Dukle, A.; Nathanael, A.J. Antibacterial coatings for titanium implants: Recent trends and future perspectives. Antibiotics 2022, 11, 1719. [Google Scholar] [CrossRef] [PubMed]
- Besisa, N.H.A.; Yajima, T. Titanium-Based Alloys: Classification and Diverse. Titan.-Based Alloys-Charact. Appl. 2024, 125. [Google Scholar]
- Spriano, S.; Yamaguchi, S.; Baino, F.; Ferraris, S. A critical review of multifunctional titanium surfaces: New frontiers for improving osseointegration and host response, avoiding bacteria contamination. Acta Biomater. 2018, 79, 1–22. [Google Scholar] [CrossRef]
- Liu, Z.; Liu, X.; Ramakrishna, S. Surface engineering of biomaterials in orthopedic and dental implants: Strategies to improve osteointegration, bacteriostatic and bactericidal activities. Biotechnol. J. 2021, 16, 2000116. [Google Scholar] [CrossRef]
- Kengesbekov, A.B.; Serikbaykyzy, A.; Bayandinova, M.B.; Batanov, E.E.; Bazarov, N.E.; Askhatov, A.N. Development of biocompatible coatings for orthopedic joint implants. Phys. Sci. Technol. 2025, 12, 84–94. [Google Scholar] [CrossRef]
- Ben Arbia, M.; Helal, H.; Comini, E. Recent advances in low-dimensional metal oxides via sol-gel method for gas detection. Nanomaterials 2024, 14, 359. [Google Scholar] [CrossRef]
- Prasad, K.N.; Syed, I.; Subbu, S.K. Laser dimple texturing–applications, process, challenges, and recent developments: A review. Aust. J. Mech. Eng. 2022, 20, 316–331. [Google Scholar] [CrossRef]
- Roccaforte, F.; Giannazzo, F.; Greco, G. Ion implantation doping in silicon carbide and gallium nitride electronic devices. Micro 2022, 2, 23–53. [Google Scholar] [CrossRef]
- Xie, J.; Zhang, C.; Waite, T.D. Hydroxyl radicals in anodic oxidation systems: Generation, identification and quantification. Water Res. 2022, 217, 118425. [Google Scholar] [CrossRef] [PubMed]
- Xue, T.; Attarilar, S.; Liu, S.; Liu, J.; Song, X.; Li, L.; Tang, Y. Surface modification techniques of titanium and its alloys to functionally optimize their biomedical properties: Thematic review. Front. Bioeng. Biotechnol. 2020, 8, 603072. [Google Scholar] [CrossRef] [PubMed]
- Alontseva, D.; Safarova, Y.; Voinarovych, S.; Obrosov, A.; Yamanoglu, R.; Khoshnaw, F.; Weiß, S. Biocompatibility and corrosion of microplasma-sprayed titanium and tantalum coatings versus titanium alloy. Coatings 2024, 14, 206. [Google Scholar] [CrossRef]
- Zhang, Z.Y.; Huang, T.Y.; Zhai, D.J.; Wang, H.B.; Feng, K.Q.; Xiang, L. Study on strontium doped bioactive coatings on titanium alloys surfaces by micro-arc oxidation. Surf. Coat. Technol. 2022, 451, 129045. [Google Scholar] [CrossRef]
- Wen, X.; Liu, Y.; Xi, F.; Zhang, X.; Kang, Y. Micro-arc oxidation (MAO) and its potential for improving the performance of titanium implants in biomedical applications. Front. Bioeng. Biotechnol. 2023, 11, 1282590. [Google Scholar] [CrossRef]
- Wang, R.; Ni, S.; Ma, L.; Li, M. Porous construction and surface modification of titanium-based materials for osteogenesis: A review. Front. Bioeng. Biotechnol. 2022, 10, 973297. [Google Scholar] [CrossRef]
- Manisekaran, R.; Chettiar, A.D.R.; Marasamy, L.; Arthikala, M.K.; Kandasamy, G.; Ibarra, V.C.; Rathore, H.S. Copper, Zinc, and Titanium-Based Semiconductor Nanomaterials for Antimicrobial Coatings and Their Mechanisms. Nano Select 2025, 6, e202400155. [Google Scholar] [CrossRef]
- Rezić, I.; Meštrović, E. Characterization of Nanoparticles in Antimicrobial Coatings for Medical Applications—A Review. Coatings 2023, 13, 1830. [Google Scholar] [CrossRef]
- Parham, S.; Wicaksono, D.H.; Bagherbaigi, S.; Lee, S.L.; Nur, H. Antimicrobial treatment of different metal oxide nanoparticles: A critical review. J. Chin. Chem. Soc. 2016, 63, 385–393. [Google Scholar] [CrossRef]
- Vera, M.L.; Traid, H.D.; Dwojak, A.N.; Rosenberger, M.R.; Schvezov, C.E. Advances in nanostructured TiO2 coatings for industrial applications. In Industrial Applications of Nanoparticles; CRC Press: Boca Raton, FL, USA, 2023; pp. 228–255. [Google Scholar] [CrossRef]
- Rakhadilov, B.; Zhassulan, A.; Ormanbekov, K.; Shynarbek, A.; Baizhan, D.; Aldabergenova, T. Surface Modification and Tribological Performance of Calcium Phosphate Coatings with TiO2 Nanoparticles on VT1-0 Titanium by Micro-Arc Oxidation. Crystals 2024, 14, 945. [Google Scholar] [CrossRef]
- Kengesbekov, A.; Sagdoldina, Z.; Torebek, K.; Baizhan, D.; Kambarov, Y.; Yermolenko, M.; Maulet, M. Synthesis and Formation Mechanism of Metal Oxide Compounds. Coatings 2022, 12, 1511. [Google Scholar] [CrossRef]
- Abbasi-Oshaghi, E.; Mirzaei, F.; Pourjafar, M. NLRP3 inflammasome, oxidative stress, and apoptosis induced in the intestine and liver of rats treated with titanium dioxide nanoparticles: In vivo and in vitro study. Int. J. Nanomed. 2019, 14, 1919–1936. [Google Scholar] [CrossRef] [PubMed]
- Kumar, V.; Sharma, N.; Maitra, S.S. In vitro and in vivo toxicity assessment of nanoparticles. Int. Nano Lett. 2017, 7, 243–256. [Google Scholar] [CrossRef]
- Ajdary, M.; Moosavi, M.A.; Rahmati, M.; Falahati, M.; Mahboubi, M.; Mandegary, A.; Varma, R.S. Health concerns of various nanoparticles: A review of their in vitro and in vivo toxicity. Nanomaterials 2018, 8, 634. [Google Scholar] [CrossRef]
- Salama, B.; Alzahrani, K.J.; Alghamdi, K.S.; Al-Amer, O.; Hassan, K.E.; Elhefny, M.A.; Fathalla, A.S. Silver nanoparticles enhance oxidative stress, inflammation, and apoptosis in liver and kidney tissues: Potential protective role of thymoquinone. Biol. Trace Elem. Res. 2023, 201, 2942–2954. [Google Scholar] [CrossRef]
- Zhang, X.; Zhou, W.; Xi, W. Advancements in incorporating metal ions onto the surface of biomedical titanium and its alloys via micro-arc oxidation: A research review. Front. Chem. 2024, 12, 1353950. [Google Scholar] [CrossRef] [PubMed]
- Xu, N.; Fu, J.; Zhao, L.; Chu, P.K.; Huo, K. Biofunctional elements incorporated nano/microstructured coatings on titanium implants with enhanced osteogenic and antibacterial performance. Adv. Healthc. Mater. 2020, 9, 2000681. [Google Scholar] [CrossRef] [PubMed]
- Ming, X.; Wu, Y.; Zhang, Z.; Li, Y. Micro-arc oxidation in titanium and its alloys: Development and potential of implants. Coatings 2023, 13, 2064. [Google Scholar] [CrossRef]
- Rakhadilov, B.; Zhassulan, A.; Baizhan, D.; Shynarbek, A.; Ormanbekov, K.; Aldabergenova, T. The effect of the electrolyte composition on the microstructure and properties of coatings formed on a titanium substrate by microarc oxidation. AIMS Mater. Sci. 2024, 11, 547–564. [Google Scholar] [CrossRef]
- Bayatanova, L.B.; Zhassulankyzy, A.Z.; Magazov, N.M.; Rakhadilov, B.K.; Muktanova, N.; Uazyrkhanova, G.K. Effect of plasma-electrolytic oxidation on mechanical properties of titanium coatings. Bull. Karaganda Univ. Phys. Ser. 2023, 111, 65–74. [Google Scholar] [CrossRef]
- Kashin, A.D.; Sedelnikova, M.B.; Uvarkin, P.V.; Ugodchikova, A.V.; Luginin, N.A.; Sharkeev, Y.P.; Bakina, O.V. Functionalizing diatomite-based micro-arc coatings for orthopedic implants: Influence of TiO2 addition. Biomimetics 2023, 8, 280. [Google Scholar] [CrossRef]
- Makurat-Kasprolewicz, B.; Wekwejt, M.; Ronowska, A.; Gajowiec, G.; Grodzicka, M.; Dzionk, S.; Ossowska, A. Influence of Ultrasound on the characteristics of CaP Coatings Generated Via the micro-arc oxidation process in relation to Biomedical Engineering. ACS Biomater. Sci. Eng. 2024, 10, 2100–2115. [Google Scholar] [CrossRef]
- ISO 10993-5; Biological Evaluation of Medical Devices—Part 5: Tests for In Vitro Cytotoxicity. International Organization for Standardization: Geneva, Switzerland, 2009.
- Wang, P.; Wei, X.W.; Cao, W.J.; Tang, Y.T.; Wang, Y.; Gong, Z.Y.; Zu, X.T. Effect of TiO2 nanoparticles on the characteristics of MAO coatings. Int. J. Electrochem. Sci. 2019, 14, 9311–9325. [Google Scholar] [CrossRef]
- Woo, S.R.; Sung, Y.M. Enhanced photoelectrochemical water splitting of micro-arc oxidized TiO2 via anatase/rutile phase control and nitrogen doping. J. Electrochem. Soc. 2016, 163, H278. [Google Scholar] [CrossRef]
- Yerokhin, A.L.; Nie, X.; Leyland, A.; Matthews, A. Characterisation of oxide films produced by plasma electrolytic oxidation of a Ti–6Al–4V alloy. Surf. Coat. Technol. 2000, 130, 195–206. [Google Scholar] [CrossRef]
- Ceriani, F.; Casanova, L.; Massimini, L.; Brenna, A.; Ormellese, M. TiO2 microparticles incorporation in coatings produced by plasma electrolytic oxidation (PEO) on Titanium. Coatings 2023, 13, 1718. [Google Scholar] [CrossRef]
- Erfanifar, E.; Aliofkhazraei, M.; Nabavi, H.F.; Rouhaghdam, A.S. Growth kinetics and morphology of microarc oxidation coating on titanium. Surf. Coat. Technol. 2017, 315, 567–576. [Google Scholar] [CrossRef]
- Zhang, P.; Zuo, Y.; Nie, G. The pore structure and properties of microarc oxidation films on 2024 aluminum alloy prepared in electrolytes with oxide nanoparticles. J. Alloys Compd. 2020, 816, 152520. [Google Scholar] [CrossRef]
- Jin, F.; Chu, P.K.; Tong, H.; Zhao, J. Improvement of surface porosity and properties of alumina films by incorporation of Fe micrograins in micro-arc oxidation. Appl. Surf. Sci. 2006, 253, 863–868. [Google Scholar] [CrossRef]
- Li, Z.; Cai, Z.B.; Cui, X.J.; Liu, R.R.; Yang, Z.B.; Zhu, M.H. Influence of nanoparticle additions on structure and fretting corrosion behavior of micro-arc oxidation coatings on zirconium alloy. Surf. Coat. Technol. 2021, 410, 126949. [Google Scholar] [CrossRef]
- Kumar, K.; Bhadauria, S.S.; Singh, A.P. Effect of post-coating heat treatment on corrosion and stress corrosion behaviors of NiCr/TiO2-coated 316L stainless steel. Arab. J. Sci. Eng. 2023, 48, 3893–3908. [Google Scholar] [CrossRef]
- Chen, X.W.; Song, H.; Pu, H.; Zheng, R.; Zhang, M.; Zhang, D. Study of wear and corrosion resistance of ATO nanoparticle–doped micro-arc oxide film layers. Int. J. Appl. Ceram. Technol. 2024, 21, 1078–1093. [Google Scholar] [CrossRef]
- Steel, J.P. The Treatment of Certain Mental Diseases by Ringer-Locke Solution. Br. Med. J. 1927, 2, 1177. [Google Scholar] [CrossRef][Green Version]
- Zhu, G.; Wang, G.; Li, J.J. Advances in implant surface modifications to improve osseointegration. Mater. Adv. 2021, 2, 6901–6927. [Google Scholar] [CrossRef]
- Suthar, J.K.; Rakesh, B.; Vaidya, A.; Ravindran, S. Comprehensive Analysis of Titanium Oxide Nanoparticle Size and Surface Properties on Neuronal PC-12 Cells: Unraveling Cytotoxicity, Dopaminergic Gene Expression, and Acetylcholinesterase Inhibition. J. Xenobiotics 2023, 13, 662–684. [Google Scholar] [CrossRef]
- Line, F.C. Titanium Dioxide Nanoparticle (TiO2 NP) Induces Toxic Effects on LA-9 Mouse Fibroblast Cell Line. Cell. Physiol. Biochem. 2023, 57, 63–81. [Google Scholar] [CrossRef]
- Mohammadalipour, Z.; Rahmati, M.; Khataee, A.; Moosavi, M.A. Different concentrations of titanium dioxide nanoparticles induce autophagy followed by growth inhibition or cell death in A375 melanoma cells. J. Skin Stem Cell 2017, 4, e63994. [Google Scholar] [CrossRef]
- Jin, C.Y.; Zhu, B.S.; Wang, X.F.; Lu, Q.H. Cytotoxicity of titanium dioxide nanoparticles in mouse fibroblast cells. Chem. Res. Toxicol. 2008, 21, 1871–1877. [Google Scholar] [CrossRef]
- Mamaeva, A.; Kenzhegulov, A.; Panichkin, A.; Abdulvaliyev, R.; Fischer, D.; Bakhytuly, N.; Toiynbaeva, N. Influence of Current Duty Cycle and Voltage of Micro-Arc Oxidation on the Microstructure and Composition of Calcium Phosphate Coating. Coatings 2024, 14, 766. [Google Scholar] [CrossRef]
Disclaimer/Publisher’s Note: The statements, opinions and data contained in all publications are solely those of the individual author(s) and contributor(s) and not of MDPI and/or the editor(s). MDPI and/or the editor(s) disclaim responsibility for any injury to people or property resulting from any ideas, methods, instructions or products referred to in the content. |
© 2025 by the authors. Licensee MDPI, Basel, Switzerland. This article is an open access article distributed under the terms and conditions of the Creative Commons Attribution (CC BY) license (https://creativecommons.org/licenses/by/4.0/).