Abstract
Aluminum and its alloys are widely used in aerospace and industrial sectors due to their high specific strength, low density, and abundance. However, their low hardness, high corrosion susceptibility, and poor wear resistance limit broader applications. Surface treatments such as electroplating, PVD/CVD, and anodizing have been used to enhance surface properties. Plasma electrolytic oxidation (PEO), also known as micro-arc oxidation (MAO), has emerged as a promising technique for producing durable ceramic coatings on light metals like Al, Mg, and Ti alloys. In this study, PEO was applied to AA6061 aluminum alloy using an AC power source in potentiostatic mode at 350 V and 400 V, 1000 Hz, and 80% duty cycle for 30 min in a silicate-based electrolyte (5 g/L Na2SiO3 + 5 g/L KOH) maintained at 25–40 °C. The effect of voltage on the coating morphology, thickness, and corrosion resistance was investigated. The coatings exhibited porous structures with pancake-like, crater, and nodular features, and thicknesses ranged from 0.053 to 83.64 µm. XRD analysis confirmed the presence of Al, α-Al2O3, Ƴ-Al2O3, and mullite. The 400 V-coated sample showed superior corrosion resistance (
;
) and improved hardness (up to 233 HV), compared to 89 HV for the bare AA6061.
1. Introduction
Aluminum (Al) is one of the most abundant metals in the Earth’s crust. Al and its alloys have been used in various fields of application such as aerospace and automotive due to its unique properties owing to its low density (2.7 g/cm3), high specific strength, and thermal and electrical conductivities, making it so attractive and considered as an economical and most versatile metallic material [1,2,3]. About 70–80% of aircraft components are composed of Al alloys used for fuselages, wings, and stringers of commercial airlines and military cargo support structures. Despite the increasing development of composite and other materials, Al alloys remain the primary airframe of choice [4,5]. The 6xxx series is among the most extensively used Al alloys comprising Mg and Si as the primary alloying element. It offers good formability, weldability, and machinability [6]. Specifically, AA6061 is a widely used alloy for structural and aerospace applications.
Despite the extensive use of Al and its alloys in various applications, it also has drawbacks that limit its further application, such as low hardness, high tendency to adhesion, high corrosion, and poor wear resistance. Surface treatments such as electroplating, PVD/CVD, and anodizing are proposed to form a protective coating to improve the metal and its alloys [7]. Plasma electrolytic oxidation (PEO), also known as micro-arc oxidation (MAO), emerged as a promising surface coating technique producing high-quality ceramic coating for light metal alloys like Al, Mg, Ti, and their alloys. PEO originates from the conventional anodic oxidation of light metals and their alloys in aqueous solutions operated above the breakdown voltage. Although it originates from anodizing, the PEO treatment is much simpler, ecologically friendlier, and cheaper. Plasma microdischarge events are formed at potentials beyond the breakdown voltage. The formed coatings comprise predominantly of the substrate oxide but can also contain more complex oxides depending on the electrolyte [4,8,9]. Properties of the PEO coatings vary based on electrolyte composition, temperature, treatment time and alloy composition, and electrical parameters such as applied voltage, current density, duty cycle, and frequency. These parameters significantly influence the growth rate, morphology, structure, phase composition, and elemental composition of the coating, which may improve the tribological and corrosion properties [4,10,11]. Alkaline electrolytes, such as those based on phosphate [7], silicate [12,13] and aluminate [7,12], are the most commonly used ones for the PEO coating on Al alloys [4,8,9]. K. Wang et al. evaluated the effect electrolyte variation using silicate and aluminate solution with and without sodium fluorosilicate (Na2SiF6) on the oxide layer formation. N. Xiang et al. [14] investigated the PEO coating of AA6063 in a different alkaline solution using silicate and borate-based electrolytes. The silicate-based PEO coating (Si-PEO) has a denser structure than the borate-based PEO coating (B-PEO). The samples have micropores and microcracks on the surface with a pore range size from 5 µm to 10 µm and 5 µm to 30 µm, respectively. Both samples are mainly composed of α-Al2O3 and β-Al2O3. Based on the corrosion test, the Si-PEO coating provides superior corrosion behavior attributed to its fewer defects and more stable composition in an aggressive environment [14]. In the study of A. Sharma et al. [15], the effects of different KOH: Na2SiO3 electrolyte concentration of 5–15 g/L and process time of the PEO coating on AA6061 were investigated at various properties. It was found that treatment time beyond 30–60 min formed more stable α- alumina dominant over γ-alumina. The sample with higher Na2SiO3 concentration exhibited higher growth rate constant and reduced with highly basic electrolytes. The hardness values of the samples ranged from 950 to 1300 HV. The sample at 15:10 concentration has the highest hardness value, followed by 10:10 concentration for 30- and 60-min process time. In the study by Peng et al. [7], the microhardness of the PEO-coated 6061 aluminum alloy samples, treated with various electrolytes and different durations, showed a significant improvement—about eight times higher compared to the uncoated 6061 aluminum alloy substrate (from 155 HV to 1300 HV). The increased treatment time was associated with greater coating thickness and higher hardness. Additionally, the surface structure and phase composition were found to strongly correlate with the microhardness of the PEO coating. Kim et al. reported that the PEO-coated samples with higher hardness values primarily consisted of α-Al2O3, as revealed by XRD analysis [16].
The PEO electrical mode is essential as it determines how the electrical parameter (current or voltage) is controlled during the process. It has been known that the PEO process under the galvanostatic mode (constant current) offers better control over the coating thickness but has lesser control over the coating properties and greater risk of uneven coating formation due to voltage fluctuation. V. Raj et al. [17] evaluated that the ceramic coating with the best corrosion resistance was achieved at a higher current density, lower temperature, moderated treatment time, and optimum electrolyte concentration of NaOH and Na2SiO3 [14]. In the other study, D. Dzhurinkiy et al. [18] reported the corrosion behavior of the PEO coating Al alloy at different coating thicknesses in a unipolar two-stage current regime. Different coating thicknesses of 4–12 µm were formed at 15–45 min treatment time. The highest corrosion resistance was achieved at a coating thickness of 8 µm, providing an effective barrier against corrosion attacks [18].
The potentiostatic mode (constant voltage), on the other hand, maintains constant voltage preventing voltage fluctuations. Thus, it has better control over the coating properties such as composition and thickness and a reduced risk of uneven coating, though it has a slower coating process. L. An et al. [19] investigated the effect of voltage, frequency, and duty ratio on the thickness and corrosion resistance of the PEO coating on pure Al substrate in a silicate-based electrolyte. The results showed that a combination of high voltage, low frequency, and large duty ratio could improve the coating thickness as well as the corrosion resistance of the coating [13]. K.V. Nadaraia [20] reported the rate of voltage change affects the coating thickness on Mg alloy. The morphology significantly affects the corrosion property of the coating [20].
Between the electrical mode, potentiostatic mode offers more controllability to prevent excessive high electrical discharges from localized damaged, cracking, or uneven coating formation that affect the coating properties. However, the past years’ researchers have focused more on the study of the PEO coating under galvanostatic mode and limited studies have been explored in the properties of the PEO coating on AA6061 under potentiostatic mode.
Thus, this study investigates the microstructure and corrosion behavior of the PEO coating on AA6061 at varying voltages in an AC power source under potentiostatic mode. The PEO treatment was under constant frequency, duty cycle, and treatment time in a silicate-based electrolyte. The applied potentials were determined from the breakdown voltage of the AA6061 with respect to the electrolyte’s properties. The surface morphology, elemental, and phase composition of the PEO AA6061 samples were characterized using SEM, EDX, and XRD. The corrosion behavior was characterized using potentiodynamic polarization and electrochemical impedance spectroscopy in a 3.5 wt% NaCl solution. The Vickers hardness of the bare and PEO-coated samples was measured via microhardness tester at 0.5 kgf load force for 10 s.
2. Materials and Methods
2.1. Chemicals and Materials
Aluminum alloy 6061 (0.4–0.8% Si, 0.7% Fe, 0.15–0.40% Cu, 0.15% Mn, 0.8–1.2% Mg, 0.04–0.35% Cr, 0.25 Zn, 0.15% Ti, Shandong Hanlin Import&Export Co., LTD., Shandong, China) was used as the substrate, with dimensions of 3 cm × 3 cm × 0.4 cm. All chemicals used to prepare the PEO electrolytes and substrate cleaning were AR grade and prepared using DI water.
2.2. Substrate Preparation
The substrates were ground and polished using silicon carbide paper at 240–1200 grit size and then ultrasonically washed in acetone, ethanol, and deionized water for 10 min. The substrates were subsequently pickled in nitric acid (500 mL 67% HNO3 in 1 L distilled water, RCI Labscan, Bangkok, Thailand) for 3 min, rinsed with DI water, and air dried. This acid etching treatment was employed to dissolve and remove surface contaminants, native oxide layers, and heterogeneous structures from the substrate. Finally, the substrate was then attached to an Al wire to facilitate an electrical connection to the PEO apparatus.
2.3. Electrolyte Preparation and Characterization
The PEO electrolyte consisting of 5 g/L Na2SiO3 (Sigma Aldrich, Burlington, MA, USA) and 5 g/L KOH (Chemlab, West Flanders, Belgium) was used for this study. The conductivity, pH, and viscosity of the electrolyte were assessed using a handheld conductivity meter (Horiba Scientific, Kyoto, Japan), LAQUAact-EC110, Kyoto, Japan), pH meter (Horiba Scientific, LAQUAact-PH110, Kyoto, Japan), and viscometer (Visco, Atago, Minato-ku, Tokyo, Japan). The measured properties of the electrolyte at 25 and 40 °C are presented in Table 1.

Table 1.
Conductivity, pH, and viscosity values of the electrolyte.
2.4. PEO Process
The PEO process was carried out using MAO24B Plasma Technology Ltd. power supply (Plasma Technology Limited (PTL), Kowloon Tong, Hongkong) in an AC power source under potentiostatic mode at 1000 Hz, 80% duty cycle for 30 min summarized in Table 2. A 4-L stainless-steel container, which also serves as the cathode, was used as the process bath chamber. Oxidation was conducted at two potentials 350 V and 400 V. Electrolyte temperature was maintained at 25–40 °C during the coating process. After coating, the substrates were washed with DI water and air dried.

Table 2.
PEO electrical parameters used in the study.
2.5. Characterization of the PEO Coatings
Morphological features, elemental composition, and coating thickness were evaluated from the surface and cross-section of the PEO-coated samples. The scanning electron microscope (SEM, Hitachi SU3800, Tokyo, Japan ) and energy dispersive X-ray spectroscopy (EDX, Oxford Ultim Max 40, Abingdon, United Kingdom) were used for microstructural analysis and chemical composition assessment, respectively. The average coating thickness and pore size diameter were measured via an image analyzer, ImageJ (1.54g), using at least 10–50 points for analysis in each substrate. The phase composition of the surface coatings was evaluated via X-ray diffractometer (XRD, Shimadzu XRD-1700 PharmaSpec, Kyoto, Japan) using Cu Kα radiation at the 2θ range from 20° to 90° with a 0.02° step size.
The characterization of corrosion behavior was evaluated via potentiodynamic polarization (PP) and electrochemical impedance spectroscopy (EIS) in 3.5 wt% NaCl aqueous solution using SP150 Biologic potentiostat (BioLogic Science Instruments SAS, Seyssinet-Pariset, France). A three-electrode system consisting of Ag/AgCl as reference electrode, platinum as the counter electrode, and the sample with an exposed surface area of 1 cm2 as the working electrode was employed for the corrosion test. The PP test was assessed by polarizing the sample over the potential range from
vs. OCP at 10 mV/s scan rate and EIS test under
mV amplitude in the frequency range from 10 mHz to 100 kHz.
The Vickers hardness of the bare and PEO-coated samples was measured via microhardness tester (HMV-G20ST, Shimadzu, Kyoto, Japan) at 0.5 kgf load force for 10 s.
3. Results and Discussion
3.1. Surface Morphology of the PEO Coatings
Figure 1 presents the surface morphology of the PEO-coated AA6061 at 350 V and 400 V applied voltage. Both samples show a characteristic porous structure associated with the PEO coating, consistent with the previously reported literature, where such pores are attributed to the plasma discharge channels formed during the coating process [21]. The influence of deposition voltage on the oxide layer morphology is clearly distinguishable. At the lower voltage of 350 V (Figure 1a–c), the surface exhibited a combination of nanopores and overlapping micropores, with average pore diameters of
and
µm, respectively. In contrast, the sample at 400 V (Figure 1d–f) revealed a more uniform surface morphology, characterized by crater-like or pancake-shaped features, nodular structures, and nanopores. At 400 V sample, the average diameters of the nanopores and micropores were
nm and 2.26
µm, respectively. The presence of some microcracks at the higher voltage sample was noticeable. These cracks are likely due from thermal stress and high internal pressures induced by elevated reaction temperatures at higher voltages. The observed increase in pore size at 400 V can be attributed to the formation of larger and more intense plasma discharge channels. Conversely, the reduction in pore density may be associated with a decreased number of active discharge events, which was also observed from Wang et al. and Nadaraia et al. [20,22].
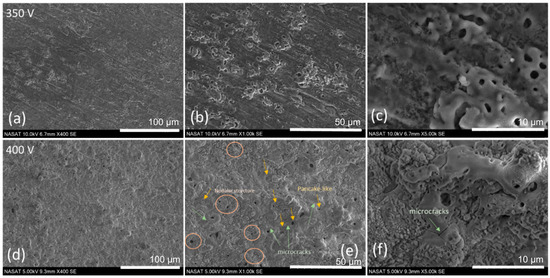
Figure 1.
SEM images of AA6061 PEO-coated at discharge potentials of (a–c) 350 V and (d–f) 400 V.
Hussein et al. [23] classified the pores formed based on the location of the discharge occurrence, namely type A, B, and C. Both type A and C were associated with the gas discharges happening in the micropores in the oxide film at the coating/electrolyte interface, while type B discharges are attributed to the dielectric breakdown of the oxide film subjected to a strong electric field occurring at the coating/substrate interface. As for the difference between A and C, the type A arise from the surface of the micropores, while the type C originates from deep inside the micropores [24,25]. The nanopores from both samples (350 V and 400 V) are associated with the type A, where the breakdown occurs at the surface oxide layer with finer pores [26]. The micropores observed from the 350 V sample were formed from the oxide layer with weaker dielectric breakdown resulting in multiple and overlapping pores creating some unconnected/open pore structures categorized as type C [27]. On the other hand, pancake-like or crater-like structures observed at 400 V sample are classified as type B [4]. This structure is formed in the surface coating through an intense penetrating plasma discharge from the metal substrate [28]. The nodular structures primarily observed in the surroundings of the pancake or crater-like structures were formed by the rapid solidification of molten material ejected from the coating/substrate interface [15,29]. Nodular structures were formed from the electrolyte constituents when the electrolyte reacts and transforms due to the high local temperature during the discharges and ejection of the molten Al.
The growth mechanism under potentiostatic conditions (350 and 400 V) follows the same stages of the PEO coating. Initially, a passive film is formed on the metal substrate surface, which is subsequently disrupted by a series of microdischarge avalanches once the dielectric breakdown threshold is reached, leading to the development of a porous oxide layer [27,28]. In the potentiostatic mode, the dielectric breakdown/resistance of the oxide layer increases as the coating thickens. Consequently, the applied constant voltage becomes insufficient to sustain high-intensity discharges over prolonged processing time. This behavior is supported by visual observations during the coating process, as illustrated in Figure 2. During the initial stage of oxidation, more intense microdischarges were distributed across the entire substrate surface (Figure 2a). As the process progressed, the intensity of these microdischarges diminished, gradually transitioning into fewer but more pronounced micro-arcs, as shown in Figure 2b.
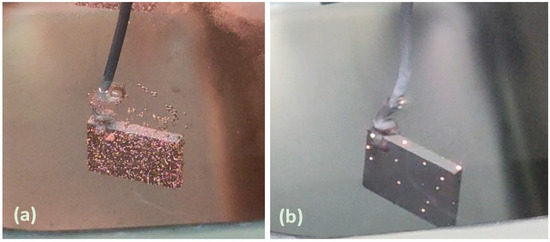
Figure 2.
Visual snapshots during PEO coating after (a) 1–3 min and (b) 30 min at 350 V.
The coating thickness of the PEO-treated AA6061 samples was measured through cross-sectional SEM images illustrated in Figure 3. The average coating thicknesses for samples processed at 350 V and 400 V were
µm and
µm, respectively. The higher thickness observed in the sample oxidized at 400 V can be attributed to the higher applied potential, which induces more intense plasma discharges that accelerate the formation of the oxide layer. Additionally, with the enhanced discharge intensity at elevated voltages, it facilitates deeper penetration into the oxide layer, promoting the continuing growth of the coating.
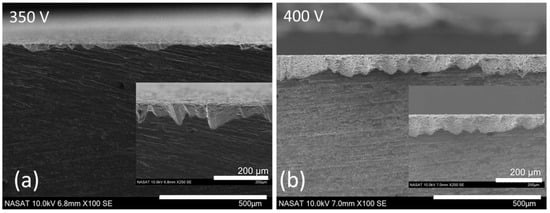
Figure 3.
Cross-section of PEO-coated AA6061 at (a) 350 V and (b) 400 V. Inset shows a magnified image of the coating–substrate interface.
3.2. Elemental and Phase Composition of the PEO Coatings
The SEM-EDX analysis of the PEO-coated AA6061 samples at 350 V and 400 V was presented in Figure 4. The primary elements identified in the surface coating of the PEO-coated samples were Al, O, and Si, and they are summarized in Table 3. The elements such as Mg, Fe, K, and Na were detected and associated with the alloying elements of the substrate and the composition of the electrolyte. Based on the SEM-EDX mapping, Al and O were uniformly distributed across the coating surface for both samples. The sample at a higher voltage (400 V) has a higher wt% of O, suggesting more oxide formation occurs at a higher voltage. This can be correlated with its higher growth rate and coating thickness. Along with this, Si was also observed to have a higher wt% at 400 V sample compared to the 350 V sample. The increase in Si wt% at a higher voltage is attributed to the enhanced incorporation of Si species from the electrolyte. This incorporation happens during elevated local temperatures and discharge intensities in the PEO process. It promotes the transformation and integration of the electrolyte component into the oxide layer, specifically during the ejection and rapid solidification of the molten materials along the discharge channels. The 400 V sample shows the presence of a nodular structure around the crater-like features, which is confirmed to be a Si-rich element, as seen from the EDX mapping.
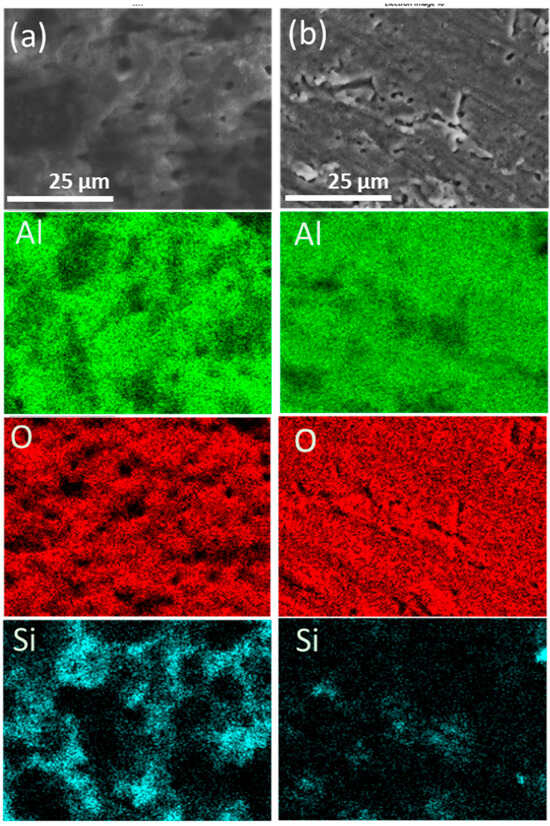
Figure 4.
SEM-EDX of PEO-coated AA6061 at (a) 350 V and (b) 400 V.

Table 3.
EDX elemental weight percentages (Wt%) of PEO-coated AA6061 at 350 V and 400 V.
The XRD pattern of the PEO-coated AA6061 samples at 350 V and 400 V is shown in Figure 5. The peaks of Al displayed as the prominent diffraction peaks for both samples of different voltage, at 2θ values of 38.79°, 44.91°, 65.3°, and 78.44° [11]. Furthermore, diffraction peaks of aluminum oxide (Al2O3) phases corresponding to γ-alumina and α-alumina were also observed. The γ-alumina phase is known to be metastable with a lower melting point compared to the α-alumina phase. The α-alumina, on the other hand, is thermodynamically stable, possessing a trigonal crystal structure and a high melting point of approximately 2050 °C [13,30]. Initially, at an early oxidation stage, γ-alumina started to form and gradually transforms into α-alumina under elevated temperature conditions [12,30]. All the PEO coatings produced crystalline phases. The PEO coating sample at 350 V was found to have Al and the γ-alumina phase, while at 400 V, peaks of Al, γ-alumina, and α- alumina phases were preset, which were identified using ICDD 01-085-1327, 00-050-0741 and 00-010-0173, respectively.
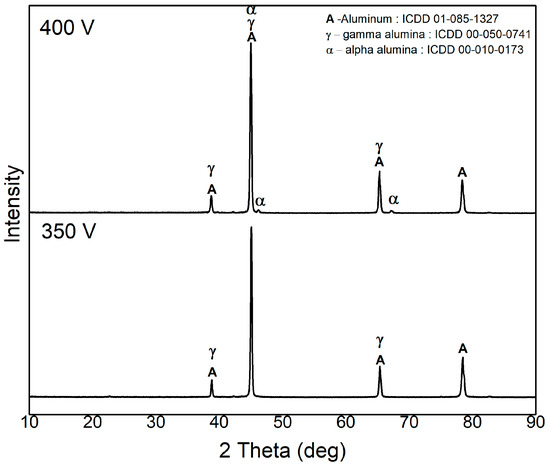
Figure 5.
XRD pattern of PEO-coated AA6061 at 350 V and 400 V.
No mullite (3Al2O3·2SiO2) phase was found from the XRD pattern for both samples, specifically for the higher voltage sample, which likely contained mullite phase because it exhibited a prominent Si-rich element from the EDX mapping found to be at the nodular structure observed in the SEM-EDX images. Previous studies by Tavares et al. and Denhavi et al. reported that the presence of nodular structures was associated with mullite phases. However, the absence of mullite in this study suggests that the observed nodular structures are solely composed of Si-rich phases that did not react with alumina to form mullite under the rapid processing conditions [24,31]. The absence of mullite formation may be attributed to the rapid, localized, and non-uniform heating temperature during the PEO process. Although PEO can generate higher temperatures that could potentially facilitate mullite formation, temperatures during the process might not be sufficient or sustained long enough to proceed the reaction between alumina (Al2O3) and silica (SiO2).
3.3. Corrosion Behavior of PEO-Coated AA6061
Figure 6 displays the potentiodynamic polarization curves of the bare AA6061 and the PEO-coated samples within the potential range from −1.75 V to +1.5 V (vs. Ag/AgCl) in a 3.5 wt% NaCl solution. The Tafel extrapolation method was used to determine the corrosion potential (Ecorr) and corrosion current density (icorr) from the potentiodyanmic polarization curves summarized in Table 4. The Ecorr value reflects the thermodynamic tendency of the material to undergo corrosion, while icorr is directly proportional to the corrosion rate.
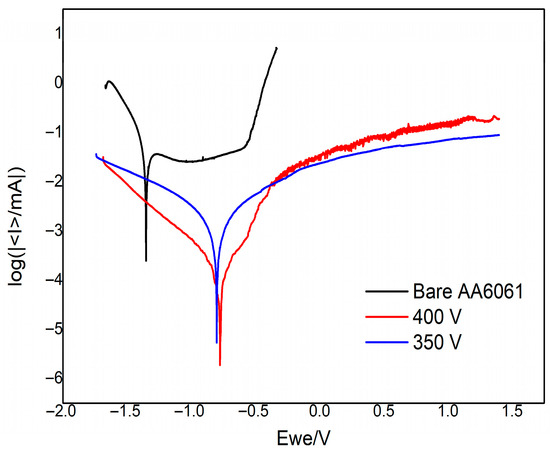
Figure 6.
Potentiodynamic polarization of bare AA6061, and PEO-coated samples at 350 V and 400 V.

Table 4.
Corrosion parameters derived from potentiodynamic polarization curves.
The PEO-coated samples exhibited a positive shift in Ecorr and a reduction in icorr compared to the bare sample, as shown in Figure 6 and Table 4. Moreover, the sample at higher voltage (400 V) demonstrated the highest Ecorr and lowest icorr values, indicating superior corrosion resistance among the tested samples. These results suggest that the PEO coatings effectively hinder the corrosion and reduce electrochemical interaction between aluminum substrate and corrosive medium. Thus, they improve the overall corrosion resistance of the alloy substrate.
The pitting potential (Ep) was also evaluated from the anodic branch of the potentiondynamic polarization curves found in Figure 6. The Ep describes the potential at which a localized breakdown of the oxide film occurs that leads to pitting corrosion. A higher (more positive) Ep signifies a better resistance of the metal/substrate to pitting corrosion. The bare AA6061 has an Ep value of
V (vs. Ag/AgCl), while the PEO-coated samples do not yet show their respective (Ep) values within the tested potential range up to
. This confirms that the PEO coatings enhanced the pitting corrosion of the AA6061 alloy with higher Ep value beyond
.
The corrosion behavior of the samples was further evaluated through electrochemical impedance spectroscopy (EIS). This test evaluates the samples’ charge-transfer mechanism at the electrolyte/electrode interface, electrical, and corrosion properties of the coatings [11]. The Nyquist and Bode plots of the bare AA6061 and the PEO-coated samples were tested in a 3.5 wt% NaCl solution shown in Figure 7. The symbols on the plots represent the experimental data of the samples, while the solid lines denote the fitted data based on the corresponding equivalent circuit (EC) models seen in Figure 8. Table 5 shows the summarized extrapolated data values from the fitted Nyquist with respect to the EC models.
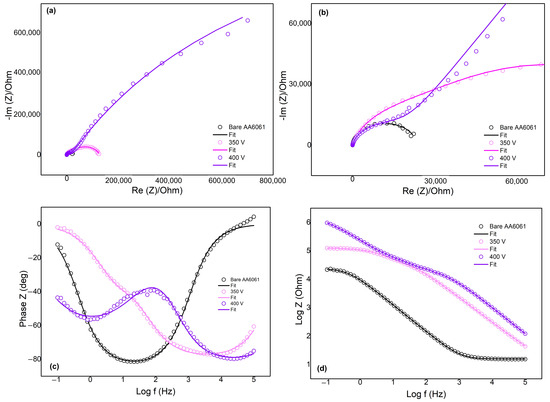
Figure 7.
EIS measurement of bare AA6061 and PEO-coated samples in 3.5 wt% NaCl (a) Nyquist plot, (b) enlarged Nyquist plot of bare AA60613, (c) Bode-phase and (d) Bode-modulus plot.

Figure 8.
The equivalent circuit for (a) bare AA6061 and (b) PEO-coated samples.

Table 5.
Summarized fitting parameter values of EIS equivalent circuit.
Figure 7a,b show the Nyquist plots of the bare AA6061 and PEO-coated samples at different potentials. The bare AA6061 exhibited the smallest impedance among the tested samples consistent with the results obtained from the potentiodynamic polarization testing, suggesting its poor corrosion resistance. On the other hand, the PEO-coated samples displayed higher impedance values, particularly at samples of higher voltage (400 V). This confirms the improved corrosion behavior of the PEO coatings consistent with the results from the potentiodynamic polarization.
The Bode plots on Figure 7c,d revealed that the bare AA6061 exhibited a prominent time constant observed in the mid-frequency region. A high phase angle of (~80°) is indicative of capacitive behavior. This is consistent with the EC model described in the bare alloy’s EIS behavior. The proposed EC model (Figure 8a) for the bare AA6061 is composed of solution resistance Rs, and a pair of resistor (R1) and capacitance (Q1) as the constant phase element (CPE), representing the passive film on the bare surface. The use of the CPE accounts for the non-ideal capacitive behavior of surface film [10,11].
The impedance spectra of the PEO-coated samples exhibited two distinct time constants at different frequency regions. The 350 V sample displayed time constants at regions of high- and mid- frequency ranges, while the 450 V sample was observed at high- and low-frequency regions. The time constants for both PEO coatings were fitted on the proposed EC model for porous film seen in Figure 8b. The proposed EC model for porous film consists of solution resistance Rs and two pairs of parallel resistor-CPE. The first parallel pair (R1 and Q1) represents the resistance and capacitance of the porous outer layer of the coating, respectively. The second pair (R2 and Q2), connected in series with the first pair and Rs, corresponds to the charge-transfer resistance and double-layer capacitance, respectively. This EC model describes the porous nature of the PEO coatings as observed from the cross-sectional SEM images of PEO coatings.
The highest impedance and lowest CPE values were observed at the 400 V sample. In addition, this sample has a high charge-transfer resistance of ~106 Ω, which is consistent with the reported values of the PEO coatings on Al [32]. Among all samples, the PEO-coated samples exhibited better corrosion resistance, specifically the 400 V sample, as shown in the summarized values in Table 5 and supported by the results from potentiodynamic polarization.
The superior corrosion resistance of the 400 V sample, compared to the other tested samples, is attributed to its increased coating thickness, presence of more stable oxide phases (α-alumina ang γ-alumina), and lower pore density. Although it has larger average pore size, the reduced porosity limits the contact of aggressive
with the substrate. Thus, the risk for localized corrosion is significantly reduced. Previous studies established that fewer surface defects/porosity and thermodynamically stable composition makes it more effective for providing corrosion protection to the metal substrate in aggressive environment [20].
3.4. Hardness of the PEO-Coated Samples
The Vickers hardness of bare and PEO-coated AA6061 samples at high (400 V) and low (350 V) voltage were tested at 0.5 kgf for 10 s. Both PEO-coated samples exhibited significantly improved hardness compared to the bare AA6061 as shown in Table 6. The hardness values of the PEO-coated samples at high (400 V) and low (350 V) voltages were approximately 2.6 and 2 times higher, respectively, than that of the bare AA6061 sample. The improved hardness value for the PEO-coated samples is expected due to the formation of oxide phases present on the surface coating, which can be inferred to the percent of the oxygen content found on the EDX in Figure 5. During the PEO process, γ-alumina and α-alumina are the primary oxide phases formed. γ-Alumina is a metastable phase that can transition to α-alumina at elevated temperatures. It has been established that γ-alumina is the initial oxide phase formed during PEO, whereas α-alumina, the most thermodynamically stable form, exhibits higher hardness. The hardness value of the PEO-coated samples can be greatly affected by the presence and content of the oxide phases. The sample at high voltage yield a higher hardness value of
. This is attributed to the more oxide coating formation generated at higher potential applied during PEO.

Table 6.
Hardness value of bare and PEO-coated AA6061 at high and low voltage.
4. Conclusions
The oxide coating of AA6061 was produced via plasma electrolytic oxidation (PEO) under potentiostatic mode. Two different voltage settings of high (400 V) and low (350 V), were applied for this process. Both PEO coatings exhibited a porous structure formed through the generation of discharge channels on the surface during the process. At 350 V, nanopores with overlapping micropores were observed on the oxide layer. On the other hand, the 400 V sample displayed a more uniform surface morphology composed of crater- or pancake-like structure, nodular structures, and nanopores. A thicker coating and larger pore size were also observed in the higher voltage (400 V) sample. These observations were associated to the more intense plasma discharge generated at higher applied potential.
The phase analysis of the PEO coatings consists of Al, γ-alumina, and α-alumina. A thicker coating with more oxide content were confirmed in the 400 V through EDX analysis, resulting to its higher O wt% content. Although nodular structures were observed in the 400 V and were expected to be mullite phase regions, no mullite phases were detected from the XRD. Instead, these nodular structures were only identified as Si-rich regions confirmed from the EDX mapping.
Electrochemical characterization via potentiodynamic polarization and EIS showed consistent results across all tested samples. A notable improvement in corrosion resistance was observed for both PEO-coated samples compared to the bare AA6061. The 400 V sample demonstrated a superior corrosion resistance, exhibiting the highest Ecorr and lowest icorr, indicating enhanced corrosion protection based on potentiodynamic polarization. Moreover, the EIS results supported the findings, showing the significantly higher impedance and charge-transfer resistance. The superior corrosion performance of the 400 V sample is attributed to its thicker coating, reduced porosity, and the presence of more stable oxide phase composition, which contribute to the enhanced barrier and effective corrosion protection of the metal in a given aggressive environment.
The hardness value of the PEO-coated AA6061 significantly improved, with 2.6 and 2 times higher for the 400 V and 350 V, respectively, compared to the bare AA6061. This improvement in hardness is attributed to the formation of oxide phases, which primarily consist of γ-alumina and α-alumina. The PEO coating at higher voltage (400 V) resulted to a thicker oxide formation, generated from higher applied potential during the process, and exhibited a maxiumum hardness of 233 ± 17 HV.
Author Contributions
Conceptualization, E.M.B.D.P.; investigation, S.B.O.; writing—original draft, S.B.O.; writing—review and editing, E.M.B.D.P.; supervision, E.M.B.D.P.; project administration, E.M.B.D.P.; funding acquisition, E.M.B.D.P. All authors have read and agreed to the published version of the manuscript.
Funding
This research was funded by Department of Science and Technology through the Philippine Council for Industry Energy and the Philippine Council for Industry, Energy, and Emerging Technology Research and Development (DOST-PCIEERD).
Institutional Review Board Statement
Not applicable.
Informed Consent Statement
Not applicable.
Data Availability Statement
The original contributions presented in this study are included in the article. Further inquiries can be directed to the corresponding author.
Acknowledgments
The authors would like to acknowledge the Department of Science and Technology through the Philippine Council for Industry Energy and the Philippine Council for Industry, Energy, and Emerging Technology Research and Development (DOST-PCIEERD) under the research project entitled “Advanced Surface Coatings for Lightweight Alloys Used in Aerospace Application” and the support from the University of the Philippines Diliman through the Office of the Vice Chancellor for Research and Development.
Conflicts of Interest
The authors declare no conflicts of interest.
References
- Sheasby, P.G.; Pinner, R.; Wernick, S. The Surface Treatment and Finishing of Aluminium and Its Alloys; ASM International Materials Park: Almere, The Netherlands, 2001; Volume 1. [Google Scholar]
- Megson, T.H.G. Introduction to Aircraft Structural Analysis. J. Aerosp. Eng. 2018, 3, 349–371. [Google Scholar]
- Kaufman, J.G. Introduction to Aluminum Alloys and Tempers; ASM International: Almere, The Netherlands, 2000. [Google Scholar]
- Famiyeh, L.; Huang, X. Plasma electrolytic oxidation coatings on aluminum alloys: Microstructures, properties, and applications. Mod. Concepts Mater. Sci. 2019, 2, 000526. [Google Scholar] [CrossRef]
- Mart’ınez-Viademonte, M.P.; Abrahami, S.T.; Hack, T.; Burchardt, M.; Terryn, H. A review on anodizing of aerospace aluminum alloys for corrosion protection. Coatings 2020, 10, 1106. [Google Scholar] [CrossRef]
- Rambabu, P.; Prasad, N.E.; Kutumbarao, V.V.; Wanhill, R.J.H. Aluminum alloys for aerospace applications. In Aerospace Materials and Material Technologies; Aerospace Materials; Springer: Singapore, 2017; Volume 1, pp. 29–52. [Google Scholar] [CrossRef]
- Peng, Z.; Xu, H.; Liu, S.; Qi, Y.; Liang, J. Wear and corrosion resistance of plasma electrolytic oxidation coatings on 6061 Al alloy in electrolytes with aluminate and phosphate. Mater 2021, 14, 4037. [Google Scholar] [CrossRef]
- Simchen, F.; Sieber, M.; Kopp, A.; Lampke, T. Introduction to plasma electrolytic oxidation—An overview of the process and applications. Coatings 2020, 10, 628. [Google Scholar] [CrossRef]
- Hryniewicz, T. Plasma electrolytic oxidation of metals and alloys. Metals 2018, 8, 1058. [Google Scholar] [CrossRef]
- Toulabifard, A.; Rahmati, M.; Raeissi, K.; Hakimizad, A.; Satamaria, M. The effect of electrolytic solution composition on the structure, corrosion, and wear resistance of PEO coatings on AZ31 magnesium alloy. Coatings 2020, 10, 937. [Google Scholar] [CrossRef]
- Vakili-Azghandi, M.; Fattah-Alhosseini, A. Effects of duty cycle, current frequency, and current density on corrosion behavior of the plasma electrolytic oxidation coatings on 6061 Al alloy in artificial seawater. Metall. Mater. Trans. A 2017, 48, 4681–4692. [Google Scholar] [CrossRef]
- Wang, K.; Koo, B.H.; Lee, C.G.; Kim, Y.J.; Lee, S.H.; Byon, E. Effects of electrolytes variation on formation of oxide layers of 6061 al alloys by plasma electrolytic oxidation. Trans. Nonferrous Met. Soc. 2009, 19, 866–870. [Google Scholar] [CrossRef]
- Fattah-alhosseini, A.; Molaei, M.; Babaei, K. The effects of nano-and micro-particles on properties of plasma electrolytic oxidation (PEO) coatings applied on titanium substrates: A review. Surf. Interfaces 2020, 21, 100659. [Google Scholar] [CrossRef]
- Xiang, N.; Song, R.G.; Li, H.; Wang, C.; Mao, Q.Z.; Xiong, Y. Study on microstructure and electrochemical corrosion behavior of peo coatings formed on aluminum alloy. J. Mater. Eng. Perform. 2015, 24, 5022–5031. [Google Scholar] [CrossRef]
- Sharma, A.; Jang, Y.J.; Jung, J.P. Effect of KOH to Na2SiO3 ratio on microstructure and hardness of plasma electrolytic oxidation coatings on AA 6061 alloy. J. Mater. Eng. Perform. 2017, 26, 5032–5042. [Google Scholar] [CrossRef]
- Kim, Y.; Kim, D.; Park, H.; Chung, U.; Chung, W. Effect of current step-down on the growth and hardness of PEO coatings on Al6061 alloy. Procedia Eng. 2011, 10, 2809–2814. [Google Scholar] [CrossRef]
- Raj, V.; Ali, M. Formation of ceramic alumina nanocomposite coatings on aluminium for enhanced corrosion resistance. J. Mater. Process. Technol. 2009, 209, 5341–5352. [Google Scholar] [CrossRef]
- Dzhurinskiy, D.; Dautov, S.; Shornikov, P.; Akhatov, I.S. Surface modification of aluminum 6061-O alloy by plasma electrolytic oxidation to improve corrosion resistance properties. Coatings 2020, 11, 4. [Google Scholar] [CrossRef]
- An, L.; Ma, Y.; Yan, X.; Wang, S. Effects of electrical parameters and their interactions on plasma electrolytic oxidation coatings on aluminum substrates. Trans. Nonferrous Met. Soc. 2020, 30, 883–895. [Google Scholar] [CrossRef]
- Nadaraia, K.V.; Suchkov, S.N.; Imshinetskiy, I.M.; Mashtalyar, D.V.; Sinebrykhov, S.L.; Gnedenkov, S.V. Some new aspects of the study of dependence of properties of PEO coatings on the parameters of current in potentiodynamic mode. Surf. Coat. Technol. 2021, 426, 127744. [Google Scholar] [CrossRef]
- Liu, R.; Wu, J.; Xue, W.; Yao, Q. Discharge behaviors during plasma electrolytic oxidation on aluminum alloy. Mater. Chem. Phys. 2014, 148, 284–292. [Google Scholar] [CrossRef]
- Wang, K.; Koo, B.H.; Lee, C.G.; Kim, Y.J.; Lee, S.; Byon, E. Effects of hybrid voltages on oxide formation on 6061 Al-alloys during plasma electrolytic oxidation. Chin. J. Aeronaut. 2009, 22, 564–568. [Google Scholar] [CrossRef]
- Hussein, R.O.; Nie, X.; Northwood, D.O.; Yerokhin, A.; Matthews, A. Spectroscopic study of electrolytic plasma and discharging behavior during the plasma electrolytic oxidation (PEO) process. J. Phys. D Appl. Phys. 2010, 43, 105203. [Google Scholar] [CrossRef]
- Dehnavi, V.; Liu, X.Y.; Luan, B.L.; Shoesmith, D.W.; Rohani, S. Phase transformation in plasma electrolytic oxidation coatings on 6061 aluminum alloy. Surf. Coat. Technol. 2014, 251, 106–114. [Google Scholar] [CrossRef]
- Sobolev, A.; Zinigrad, M.; Borodianskiy, K. Ceramic coating on Ti-6Al-4V by plasma electrolytic oxidation in molten salt: Development and characterization. Surf. Coat. Technol. 2021, 408, 126847. [Google Scholar] [CrossRef]
- Darband, G.B.; Aliofkhazraei, M.; Hamghalam, P.; Valizade, N. Plasma electrolytic oxidation of magnesium and its alloys: Mechanism, properties and applications. J. Magnes. Alloy 2017, 5, 74–132. [Google Scholar] [CrossRef]
- Rodriguez, L.; Paris, J.Y.; Denape, J.; Delbe, K. Micro-arcs oxidation layer formation on aluminium and coatings tribological properties—A Review. Coatings 2023, 13, 373. [Google Scholar] [CrossRef]
- Moga, S.G.; Negrea, D.A.; Ducu, C.M.; Malinovschi, V.; Schiopu, A.G.; Coaca, E.; Patrascu, I. The Influence of Processing Time on Morphology, Structure and Functional Properties of PEO Coatings on AZ63 Magnesium Alloy. Appl. Sci. 2022, 12, 12848. [Google Scholar] [CrossRef]
- Pillai, A.M.; Rajendra, A.; Sharma, A.K. Influence of process parameters on growth behaviour and properties of coatings obtained by plasma electrolytic oxidation (PEO) on AA 6061. J. Appl. Electrochem. 2018, 48, 543–557. [Google Scholar] [CrossRef]
- Loghman, Z.M.; Fattah-alhosseini, A.; Gashti, S.O. Corrosion behavior of PEO coatings on 6061 al alloy: Effect of sodium fluoride addition to aluminate-based electrolyte. Anal. Bioanal. Electrochem. 2019, 11, 1020–1031. [Google Scholar]
- Tavares, M.D.M.; Vitoriano, J.D.O.; da Silva, R.C.; Franco, A.R.; de Souza, G.B.; da Costa, J.A.P.; Alves-Junior, C. Effect of duty cycle and treatment time on electrolytic plasma oxidation of commercially pure Al samples. J. Mater. Res. Technol. 2019, 8, 2141–2147. [Google Scholar] [CrossRef]
- Sowa, M.; Olesinkski, A.; Szumaski, B.; Maciej, A.; Bik, M.; Jelen, P.; Sitarz, M.; Simka, W. Electrochemical characterization of anti-corrosion coatings formed on 6061 aluminum alloy by plasma electrolytic oxidation in the corrosion inhibitor-enriched aqueous solutions. Electrochim. Acta 2022, 424, 140652. [Google Scholar] [CrossRef]
Disclaimer/Publisher’s Note: The statements, opinions and data contained in all publications are solely those of the individual author(s) and contributor(s) and not of MDPI and/or the editor(s). MDPI and/or the editor(s) disclaim responsibility for any injury to people or property resulting from any ideas, methods, instructions or products referred to in the content. |
© 2025 by the authors. Licensee MDPI, Basel, Switzerland. This article is an open access article distributed under the terms and conditions of the Creative Commons Attribution (CC BY) license (https://creativecommons.org/licenses/by/4.0/).