Article

Preparation of ZnO Ultrasonic Transducer by Radio-Frequency Sputtering and Its Application in Bolt Preload Detection

1
Hubei Special Equipment Inspection and Testing Institute, Wuhan 430077, China
2
School of Power and Mechanical Engineering, Wuhan University, Wuhan 430072, China
*
Authors to whom correspondence should be addressed.
These authors contributed equally to this work.
Coatings 2024, 14(6), 718; https://doi.org/10.3390/coatings14060718
Submission received: 10 May 2024 / Revised: 3 June 2024 / Accepted: 3 June 2024 / Published: 5 June 2024

Abstract

:
Accurate detection of the preload force of tower crane bolts is of great significance for the stable and safe operation of the equipment. The method of contact ultrasonic detection of bolt preload has always been the focus of attention, which can realize rapid in situ detection without damaging the parts. In order to improve the accuracy and convenience of ultrasonic measurement of bolt preload and meet the urgent needs of the actual industrial site for high-precision measurement of bolt preload, we propose to prepare ZnO piezoelectric coatings as functional layers for ultrasonic transducers using magnetron sputtering and deposit them directly on bolts. The growth behavior of the ZnO coatings is investigated by varying the sputtering power, sputtering gas pressure and target substrate distance, and the morphology, structure, and properties are characterized and analyzed. The ZnO piezoelectric coatings with high c-axis optimal growth orientation and excitation of ultrasonic longitudinal waves were finally obtained and verified to be effective and stable when applied to the bolts.

1. Introduction

High-strength bolts are widely used in engineering machinery, railroads and bridges, automotive industry and other fields. With the development of modern construction towards large span and higher buildings, tower cranes are widely used, which is a kind of large equipment with high danger and high accident rate [1,2]. The tower frame, as a supporting component of the crane, consists of several standard sections, which are connected and fixed by bolt [3,4]. The bolts connecting the standard sections in the tower crane will vibrate in the process of use along with the variable working environment, and the bolts will loosen and overload in the process of vibration. Among them, bolt loosening and overloading are the most important influencing factors of bolt fracture failure. Both bolt loosening and overloading are closely related to the bolt preload. In the long run, the change in the preload force of the bolts of the tower crane will lead to the change in the stiffness of the tower crane, which will cause serious consequences. Therefore, it is of great significance to detect and monitor the bolt preload of tower crane.
The current methods of controlling and measuring the bolt preload mainly include the corner method, torque method, strain measurement method, elongation method and ultrasonic method [5]. Among them, ultrasonic preload measurement technology has been used to detect the axial stress of bolts since the 1980s, and it is the development direction that researchers and scholars are focusing on. This technology has the advantages of high accuracy, good real-time performance and strong penetration [6,7]. Ultrasonic stress measurement is mainly based on the theory of acoustic elasticity, and the stress value is calculated and solved by combining the measured sound velocity and sound time. However, very little research has been conducted on bolts that are integrated with the part to be inspected, those with structural functions. The use of directly deposited conversion coatings enables ultrasound to be transmitted directly into the part to be measured, which improves the problems of poor coupling, low stability, and high ultrasound loss. Currently commonly used piezoelectric coating materials are AlN [8,9,10], ZnO [11,12,13], LiNbO3 [14,15], etc., which have strong piezoelectric effect as well as can be grown on a variety of substrates with good characteristics. Therefore, researchers choose to prepare piezoelectric sensing coatings to achieve the conversion of acoustic—electrical signals in recent years. Jing et al. [16] investigated the relationship between longitudinal wave time of flight (TOF) and axial load under different clamping lengths.
Zinc oxide (ZnO) film is a multifunctional wide bandgap semiconductor thin-film material with a piezoelectric effect, and the coating has the characteristics of high stability, wide applicability, and low preparation cost, which is an excellent material for the preparation of integrated ultrasonic sensors. In this paper, ZnO piezoelectric coating is prepared by RF sputtering method, and the trial preparation test is carried out on bolts to study the feasibility of coating application on bolts. Detecting the stress state of bolt fasteners rapidly and accurately is of great significance to improve the stability and safety of the tower crane and other large-scale equipment operation.

2. Experimental

2.1. ZnO Coatings Deposition

ZnO piezoelectric coatings were prepared on a single crystal Si(100) substrate using Radio Frequency (RF) magnetron sputtering technique. The sputtering target was a 99.99% pure ZnO ceramic target with a target diameter of 150 mm and a thickness of 5 mm. Before the experiment, the silicon substrate was ultrasonically cleaned and dried and loaded into a clean vacuum chamber. When the temperature of the vacuum chamber reaches 200 °C and the vacuum is less than 7 × 10⁻³ Pa, argon gas (purity 99.99%) was introduced, the gas pressure was maintained at 0.5 Pa, and the substrates were Ar+ etched for 10 min at −150 V bias and 70 A arc current. After the end of etching, the vacuum was evacuated to 6 × 10⁻³ Pa, a gas mixture of argon (99.99%) and oxygen (99.99%) with an argon-oxygen ratio of 1:1 was introduced, and then the RF power supply was turned on to prepare the ZnO piezoelectric coating. The process parameters in the coating preparation process mainly include: power, gas pressure, target substrate distance (TSD). The experimental parameters such as gas pressure, power and target-substrate distance will have an effect on the growth behavior of ZnO. Therefore, in order to better study the actual influence of each factor, the above three items are set as the variables of this experiment. The substrates were placed directly against the target. The specific experimental parameters are detailed in Table 1.

2.2. Structure and Morphology Characterization on Si Substrate

A field emission scanning electron microscope (MIRA3,TESCAN, Brno, Czech Republic) was used to observe and test the surface and cross-section of the coatings, and the deposition rate of the layers was calculated. The crystalline state of the coatings was tested by XRD (Tongda TDM-10, Dandong, China) using a Cu Kα radiation source in the 2 theta range from 20° to 80°, λ = 0.15405 Å. In order to further investigate the coating orientation, the orientation coefficient R of the coating was calculated as follows in Equation (1):
R = I h k l / i = 1 n I h i k i l i
where I represent the intensity of the diffraction peaks, hkl is the index of the different crystal planes, n is the number of diffraction peaks measured in the XRD pattern, and R is the orientation coefficient.

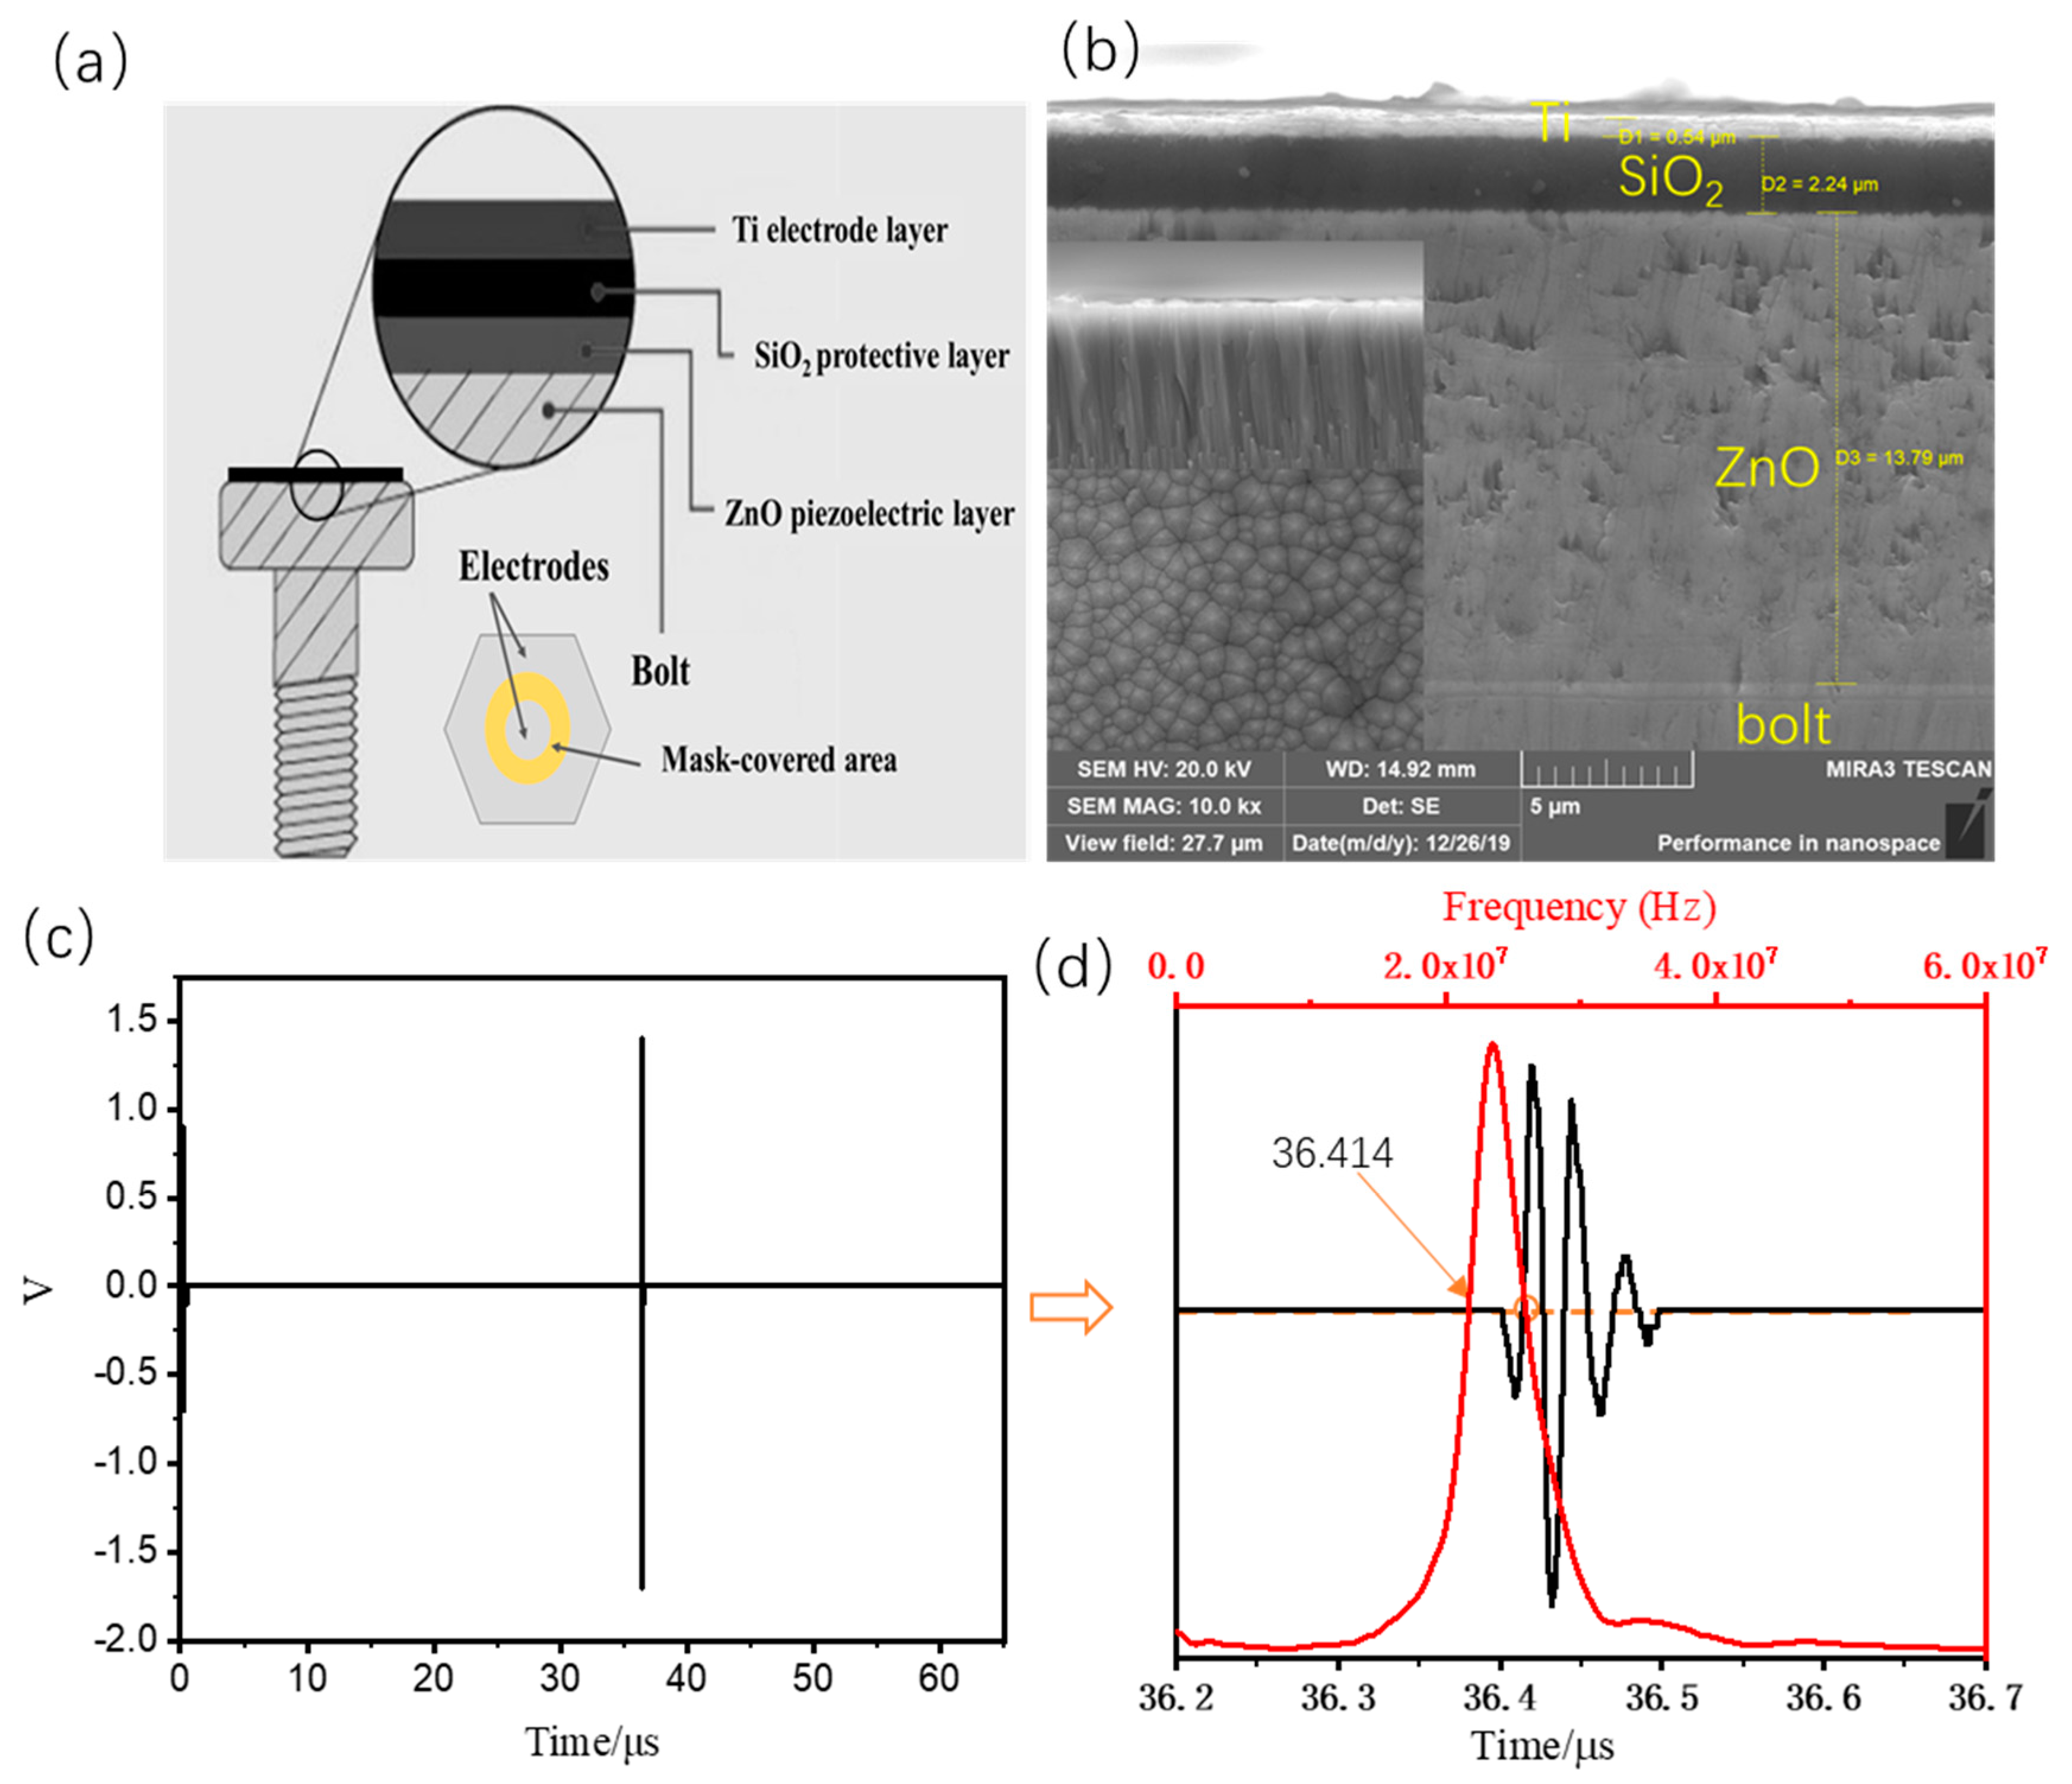
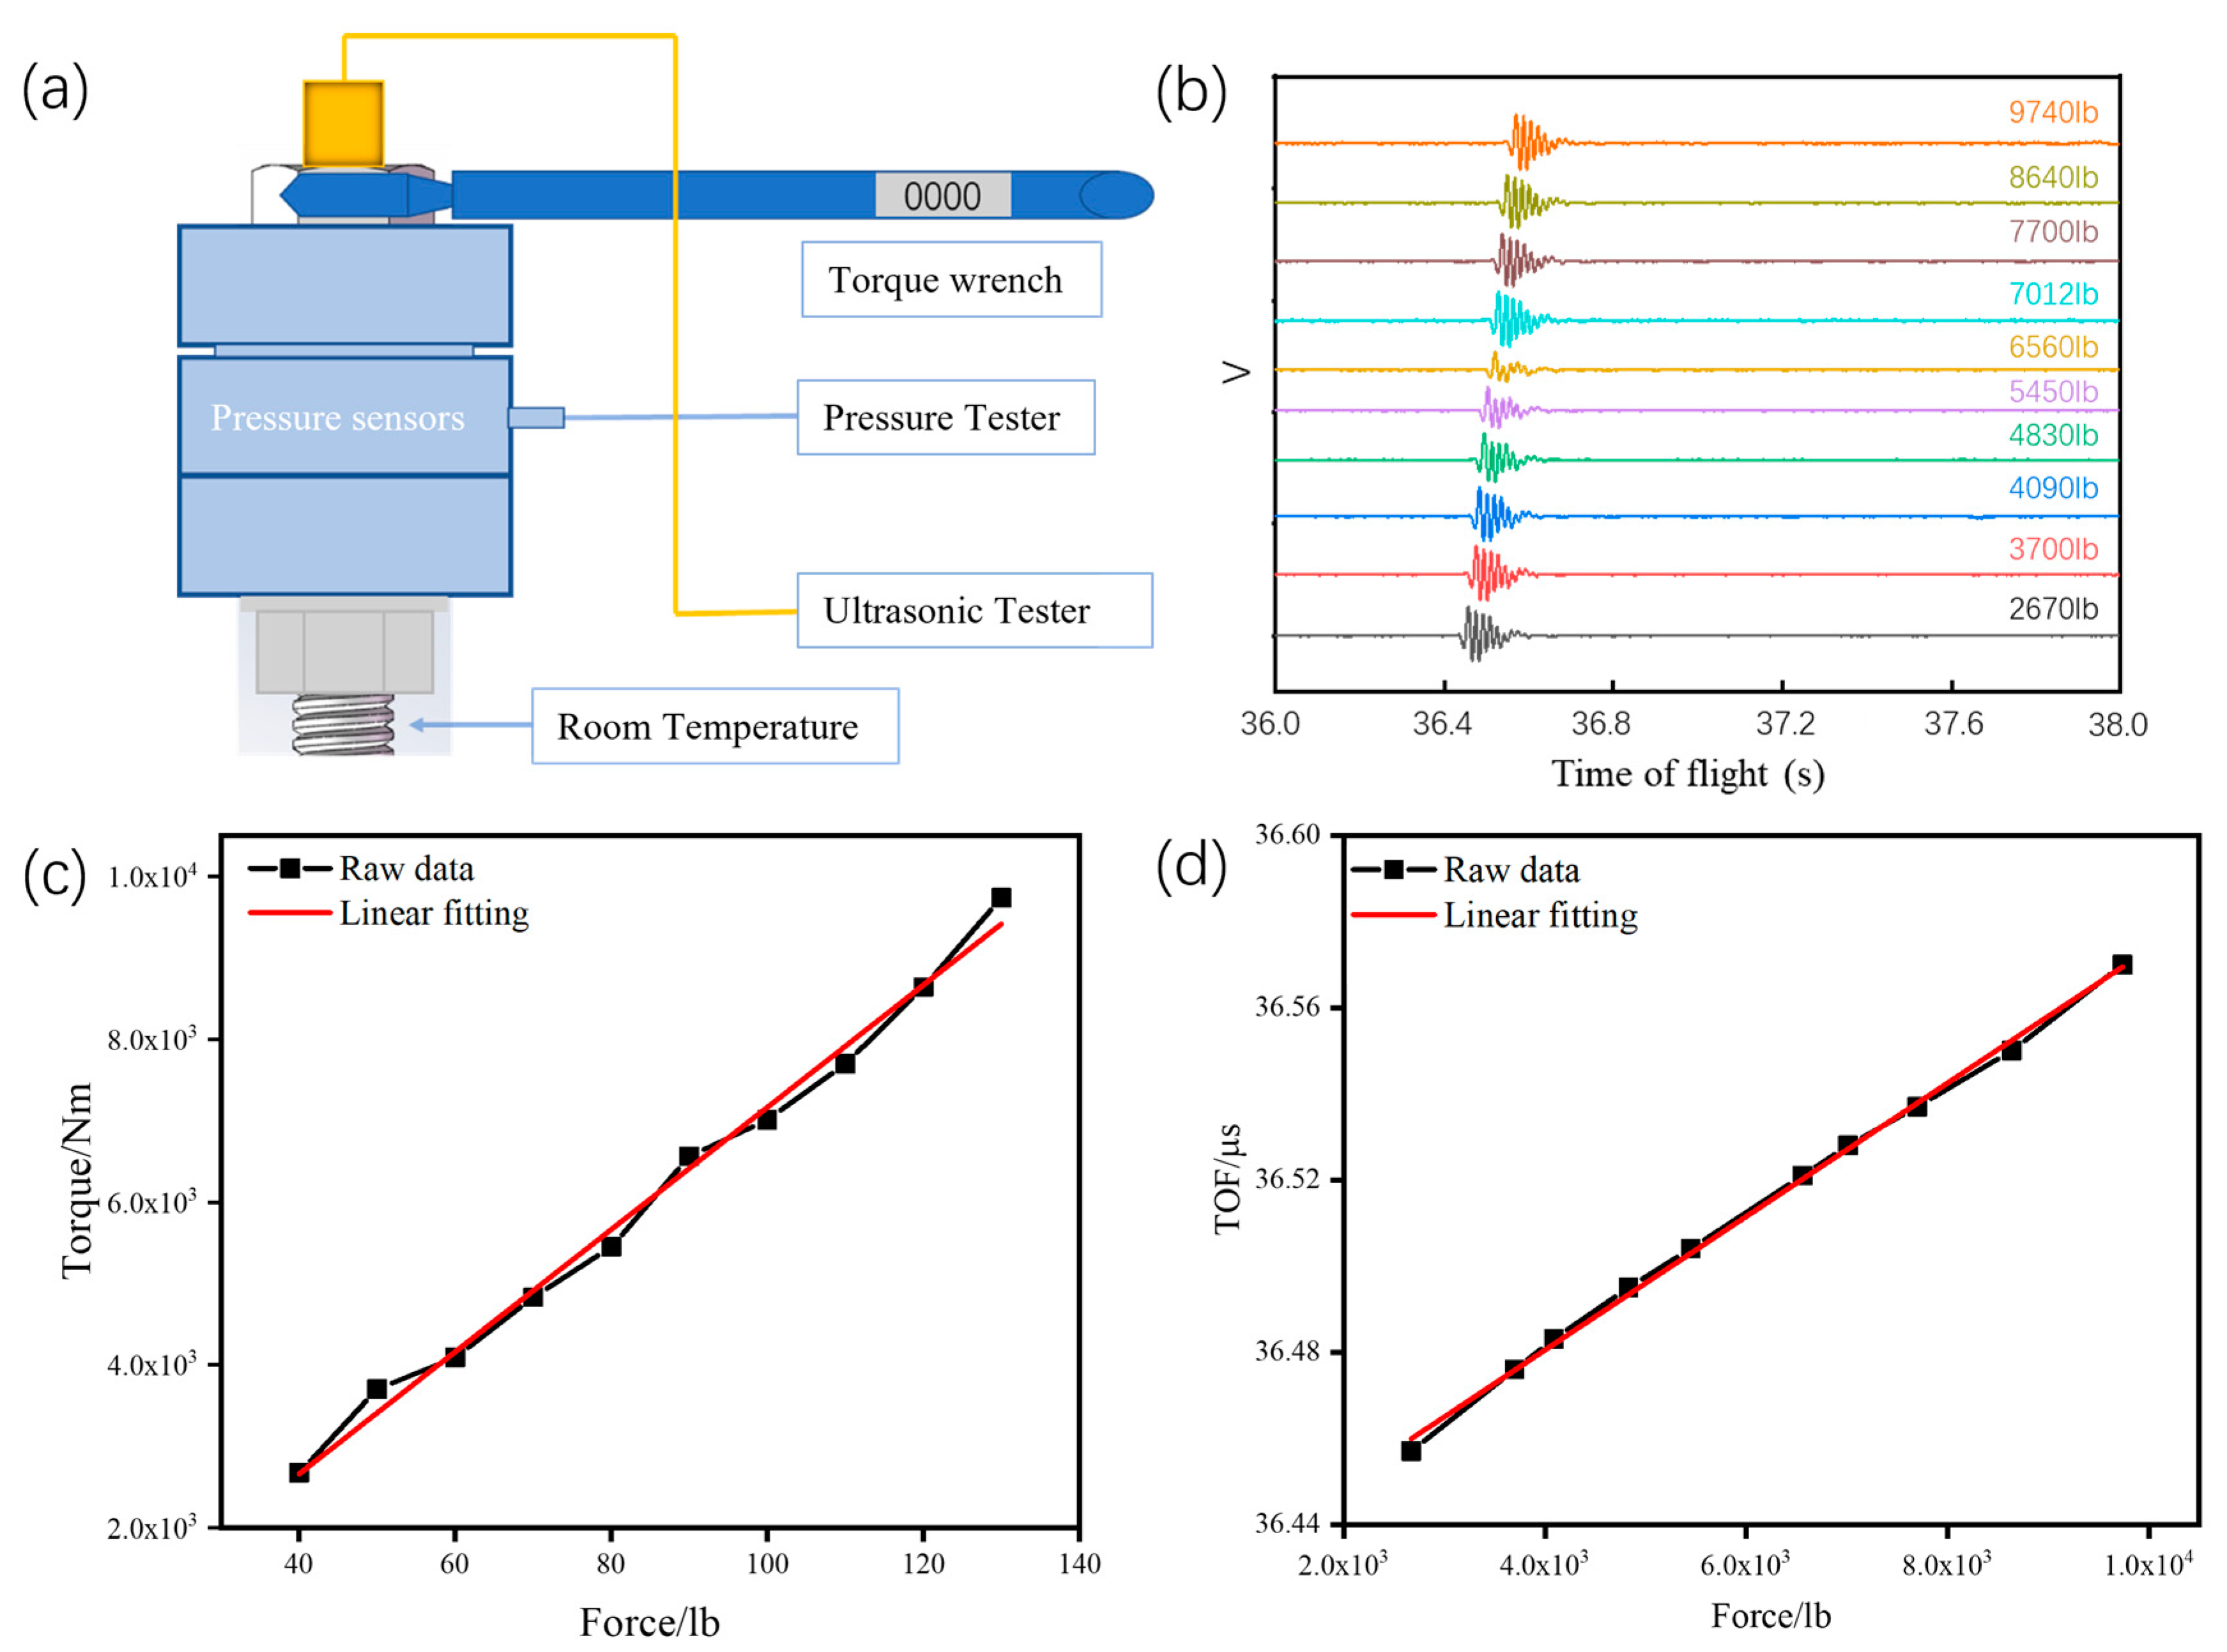
2.3. Ultrasonic Transducer Characterization on Bolts

The ultrasonic instrumentation consisted of a data acquisition card (PCI-5114, NI, Austin, TX, USA), pulse generator/receiver (DPR300, Imaginant, New York, NY, USA), and a control computer (Dell, TX, USA). An electric field can be applied between the poles of the membrane layer sample and the feedback signal can be collected using ultrasonic signal detection equipment.

3. Results and Discussion

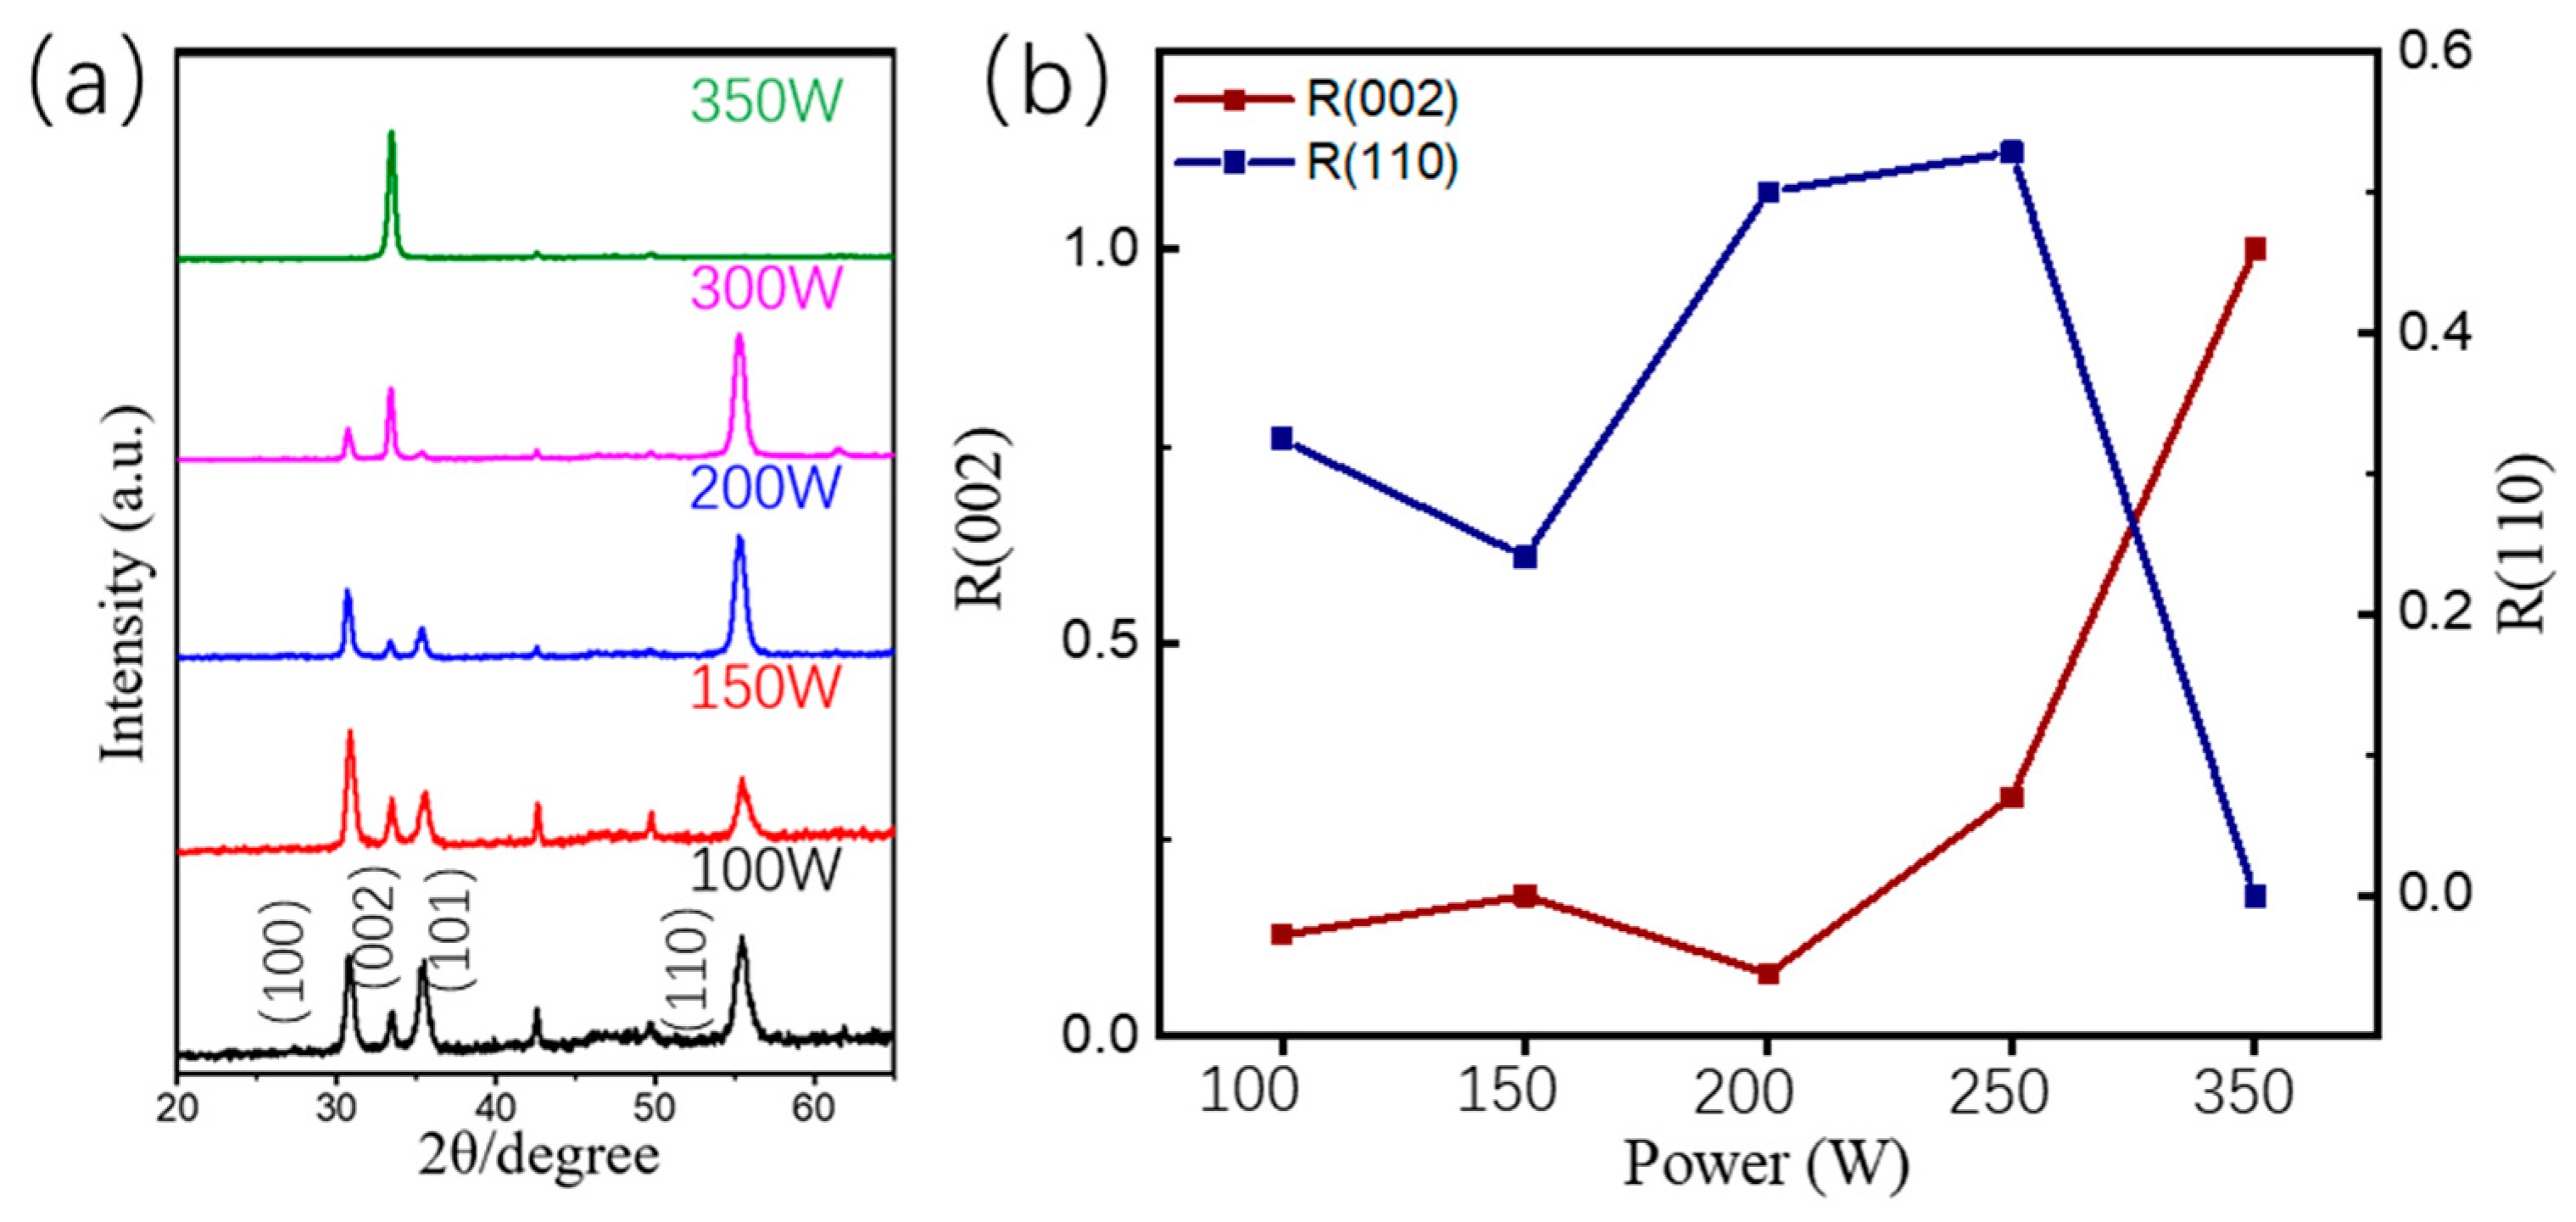
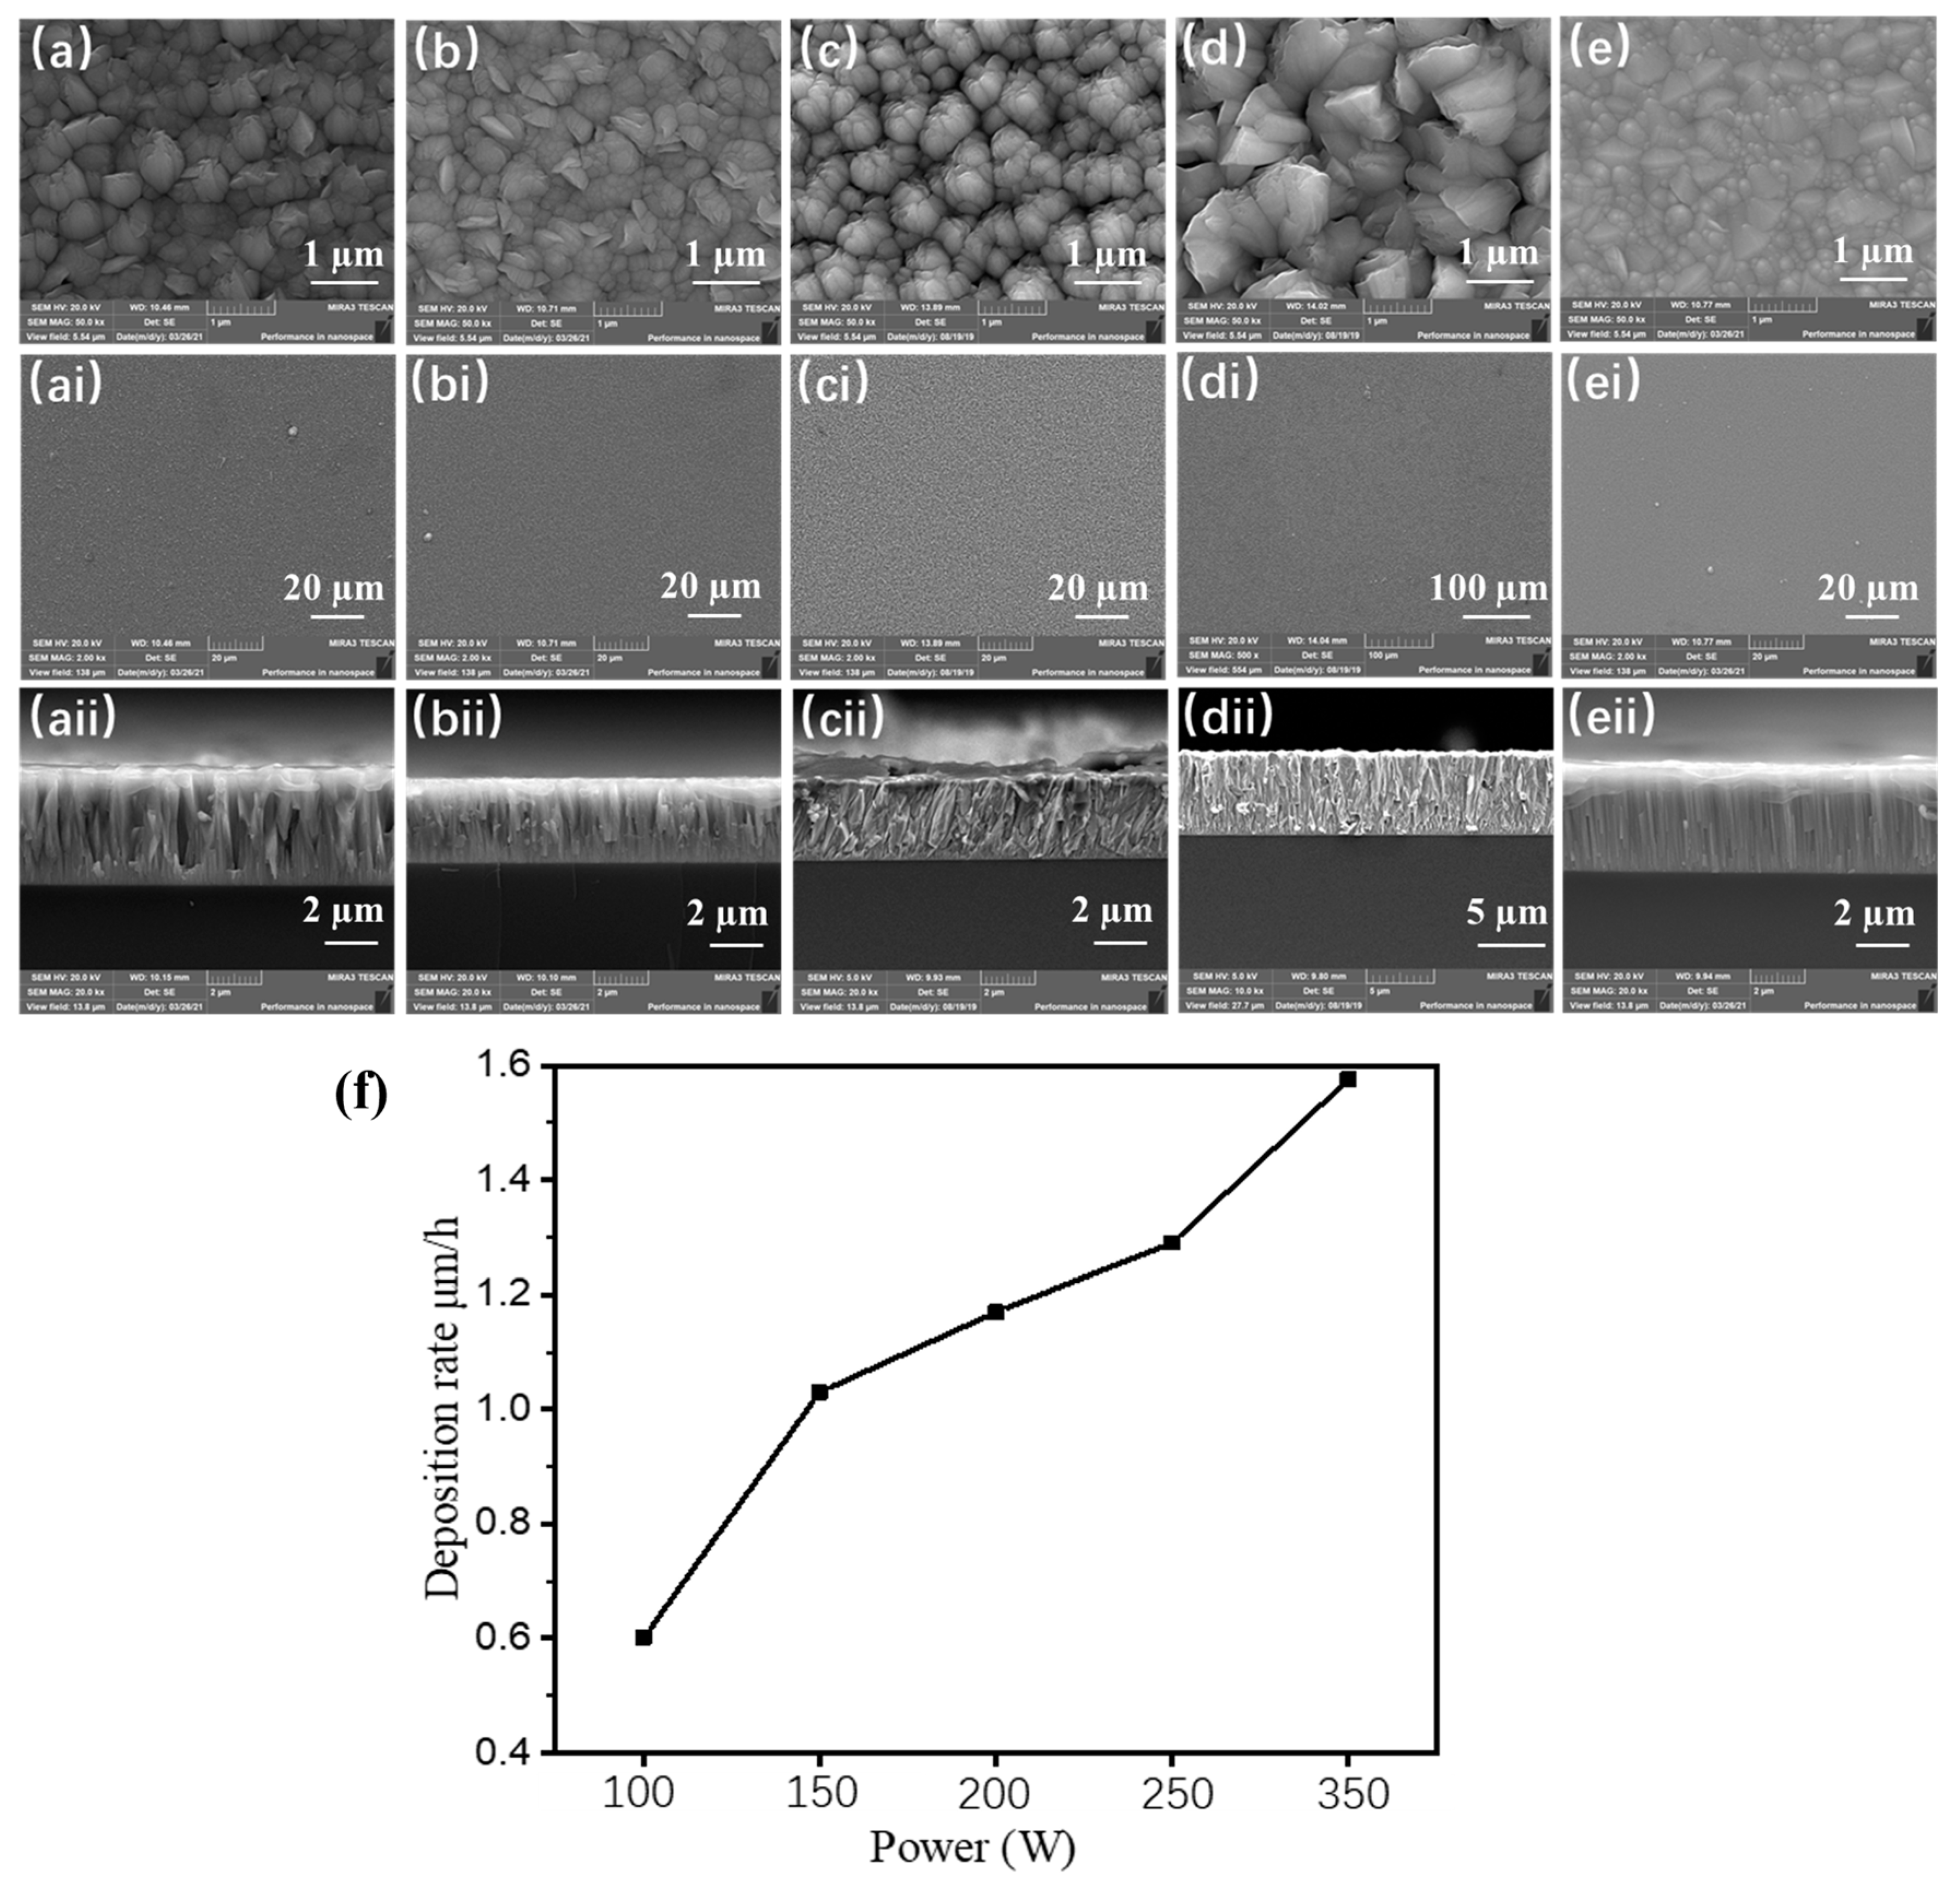
3.1. The Effect of Sputtering Power on the Growth Behavior of ZnO Coatings

Figure 1 shows the X-ray diffraction measurements of ZnO coatings at different sputtering powers. The coatings deposited at 350 W have only one (002) diffraction peak, indicating that the coatings have a good C-axis optimum orientation. The diffraction peak coefficients for different orientations of the coatings at different powers were calculated using Equation (1), and the results shown in Figure 1b were obtained. With the increase in power, the orientation coefficient of (002) diffraction peak increases gradually. This is because when the power is low, the sputtered particles do not have enough energy to migrate laterally after being deposited onto the substrate, so that the growth of coating (002) orientation is inhibited, whereas the trend of (002) oriented growth is gradually strengthened with the increase in sputtering power, the results of this study are in agreement with those of Sin [17]. This is due to the higher energy obtained by argon ions, the increased bombardment rate of the target, the increased energy of the sputtered target particles, and the sufficient energy to migrate to the (002) crystalline plane with lower surface energy for growth when deposited on the substrate.
Figure 2 shows the surface and cross-section micro-morphology of the ZnO coatings under different sputtering powers, and it can be seen from Figure 2a–e that there is a great difference in the surface characteristics of the coatings under different power conditions. This is directly related to the growth orientation of the coatings. In Figure 2a, it can be observed that the grain size is not uniform, with both rounded small-sized grains and irregularly shaped large-sized grains. The small-sized grains are (002) oriented and the large-sized grains are grains of other orientations that appear in the diffraction pattern. With the increase in sputtering power, the change in the number of small-sized grains was observed to be consistent with the change rule of the orientation coefficient. When the power reaches 350 W, it can be observed abnormally oriented grains (AOG), which indicates that although the XRD pattern shows a pure c-axis orientation, its crystallization quality in this direction is not very good. It can be observed from Figure 2aii–ei that the coating surface is clean and tidy at different sputtering powers, with no obvious large-size defects such as holes, indicating good densification of the prepared coatings. From the results given in cross-section Figure 2aii–eii, it can be observed that the columnar crystal structure growing perpendicular to the interface can be seen in the cross-section at powers of 100, 150, and 350 W. However, the columnar structures shown in aii and bii are irregular, indicating that there are different growth orientations of the grains in the whole columnar structure, whereas the columnar crystals shown by eii are regular and uniform, indicating that the grains within the columnar structure basically grow towards the (002) orientation. The coating deposition rate at different powers is given in Figure 2f, and it is found that with the increase in sputtering power, the coating deposition rate also increases.

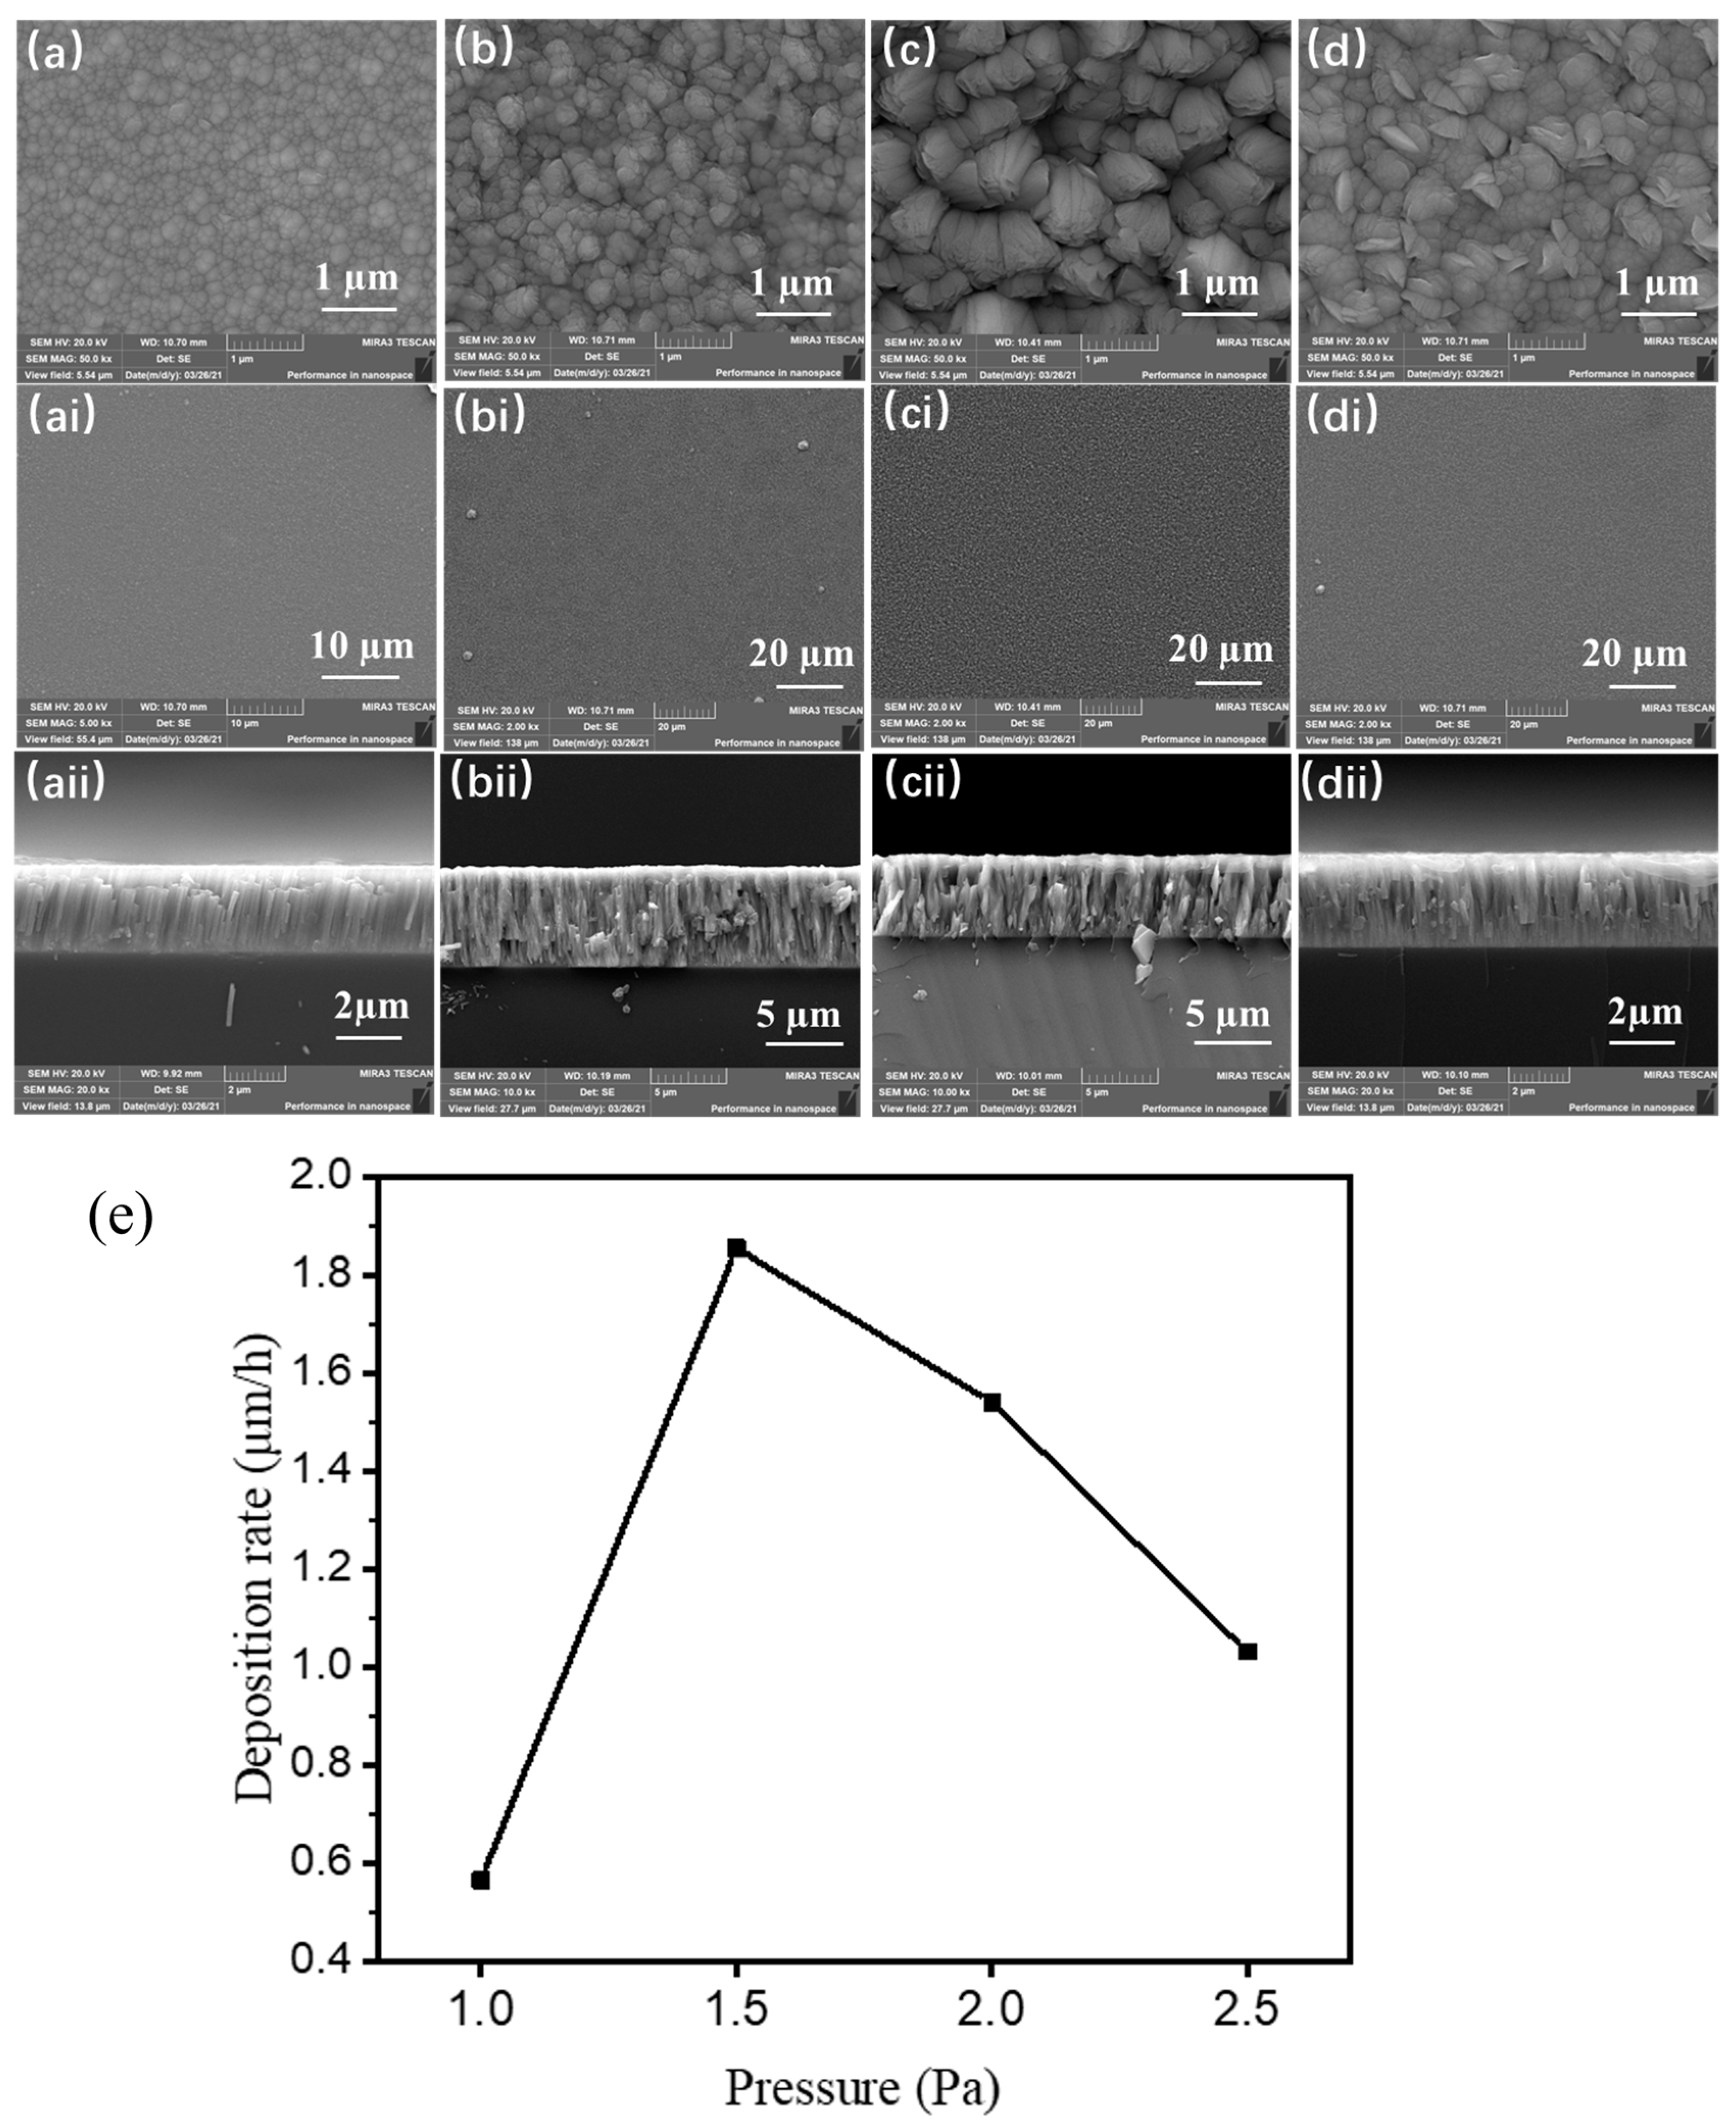
3.2. The Effect of Sputtering Gas Pressure on the Growth Behavior of ZnO Coatings

The sputtering gas pressure has a crucial role in the growth behavior of ZnO coatings. Figure 3 shows the XRD diffraction patterns of ZnO coatings prepared at different deposition gas pressures. From Figure 3a, it can be seen that when the gas pressure is 1.0 Pa, (100), (101), and (110) diffraction peaks appear in the pattern. When the gas pressure is higher than 1.0 Pa, (100), (002), (101) and (110) diffraction peaks appear in the pattern, and the intensities of the different diffraction peaks change with the increase in sputtering gas pressure. This indicates that the increase in sputtering gas pressure is favorable for the coating to show c-axis orientation growth.
In order to further investigate the effect of gas pressure on the coating orientation, the orientation coefficients of each diffraction peak were calculated, and the results are shown in Figure 3b. It is found that the overall orientation coefficient of (002) shows a gradual increase with the increase in gas pressure, and the orientation coefficient of (101) shows a gradual decrease, whereas the (100) and (110) orientation coefficients show opposite trends to each other. When the gas pressure is lower, the sputtering atoms have a large free path and a strong bombardment ability to the substrate, and the deposition rate of the film is accelerated, which is favorable to the (100) orientation formation [18]. When the gas pressure is higher than 1.5 Pa, the oxygen partial pressure ratio increases, the coating has a clear tendency to grow in multiple orientations, and the (100) orientation coefficients decrease. Therefore, the increase in the gas pressure is favorable to the growth of the (002) crystal planes.
Figure 4 shows the surface and cross-section morphology of ZnO coatings prepared with different sputtering gas pressures. When the sputtering gas pressure is low, the concentration of sputtered atoms is low, and only small stabilized nuclei can be formed on the substrate surface. As sputtering proceeds, the stabilized nuclei tend to merge with each other (due to lattice distortions that produce higher grain boundary energies), and clusters form between the small-sized stabilized nuclei (Figure 4a). As the gas pressure increases, the concentration of sputtered atoms increases, and the stabilized nuclei merge to make the grains grow (Figure 4b,c); when the sputtering gas pressure continues to increase, the ZnO coatings surface is saturated with sputtered atoms, and an excess of atoms prevents the stabilized nuclei from merging on the growth surface, so the growth of the grain size is limited, and tends to become smaller. Cross-sectional Figure 4aii–dii morphology difference is highly consistent with the morphology difference between surfaces, and the grain size is small and dense at low gas pressure. As the gas pressure increases to 2.0 Pa, the grain size gradually increases and the coating density decreases. When the gas pressure is increased to 2.5 Pa, the grain size decreases again and the coating becomes dense. Calculation of the coating growth rate under different sputtering gas pressures shows that the coating deposition rate increases and then decreases with the increase in sputtering gas pressure. This is due to the fact that at low sputtering gas pressure, the density of the sputtered particles is low and the deposition rate is also low. As the sputtering gas pressure increases and the particle concentration increases, the deposition rate increases. However, when the sputtering gas pressure is too large (more than 1.5 Pa), although the particle concentration will increase, but the free path of the sputtered particles is reduced, the concentration of particles that can reach the substrate is reduced; that is, the particle energy attenuation effect is greater than the effect of the increase in the concentration of the particles, so the deposition rate is reduced.

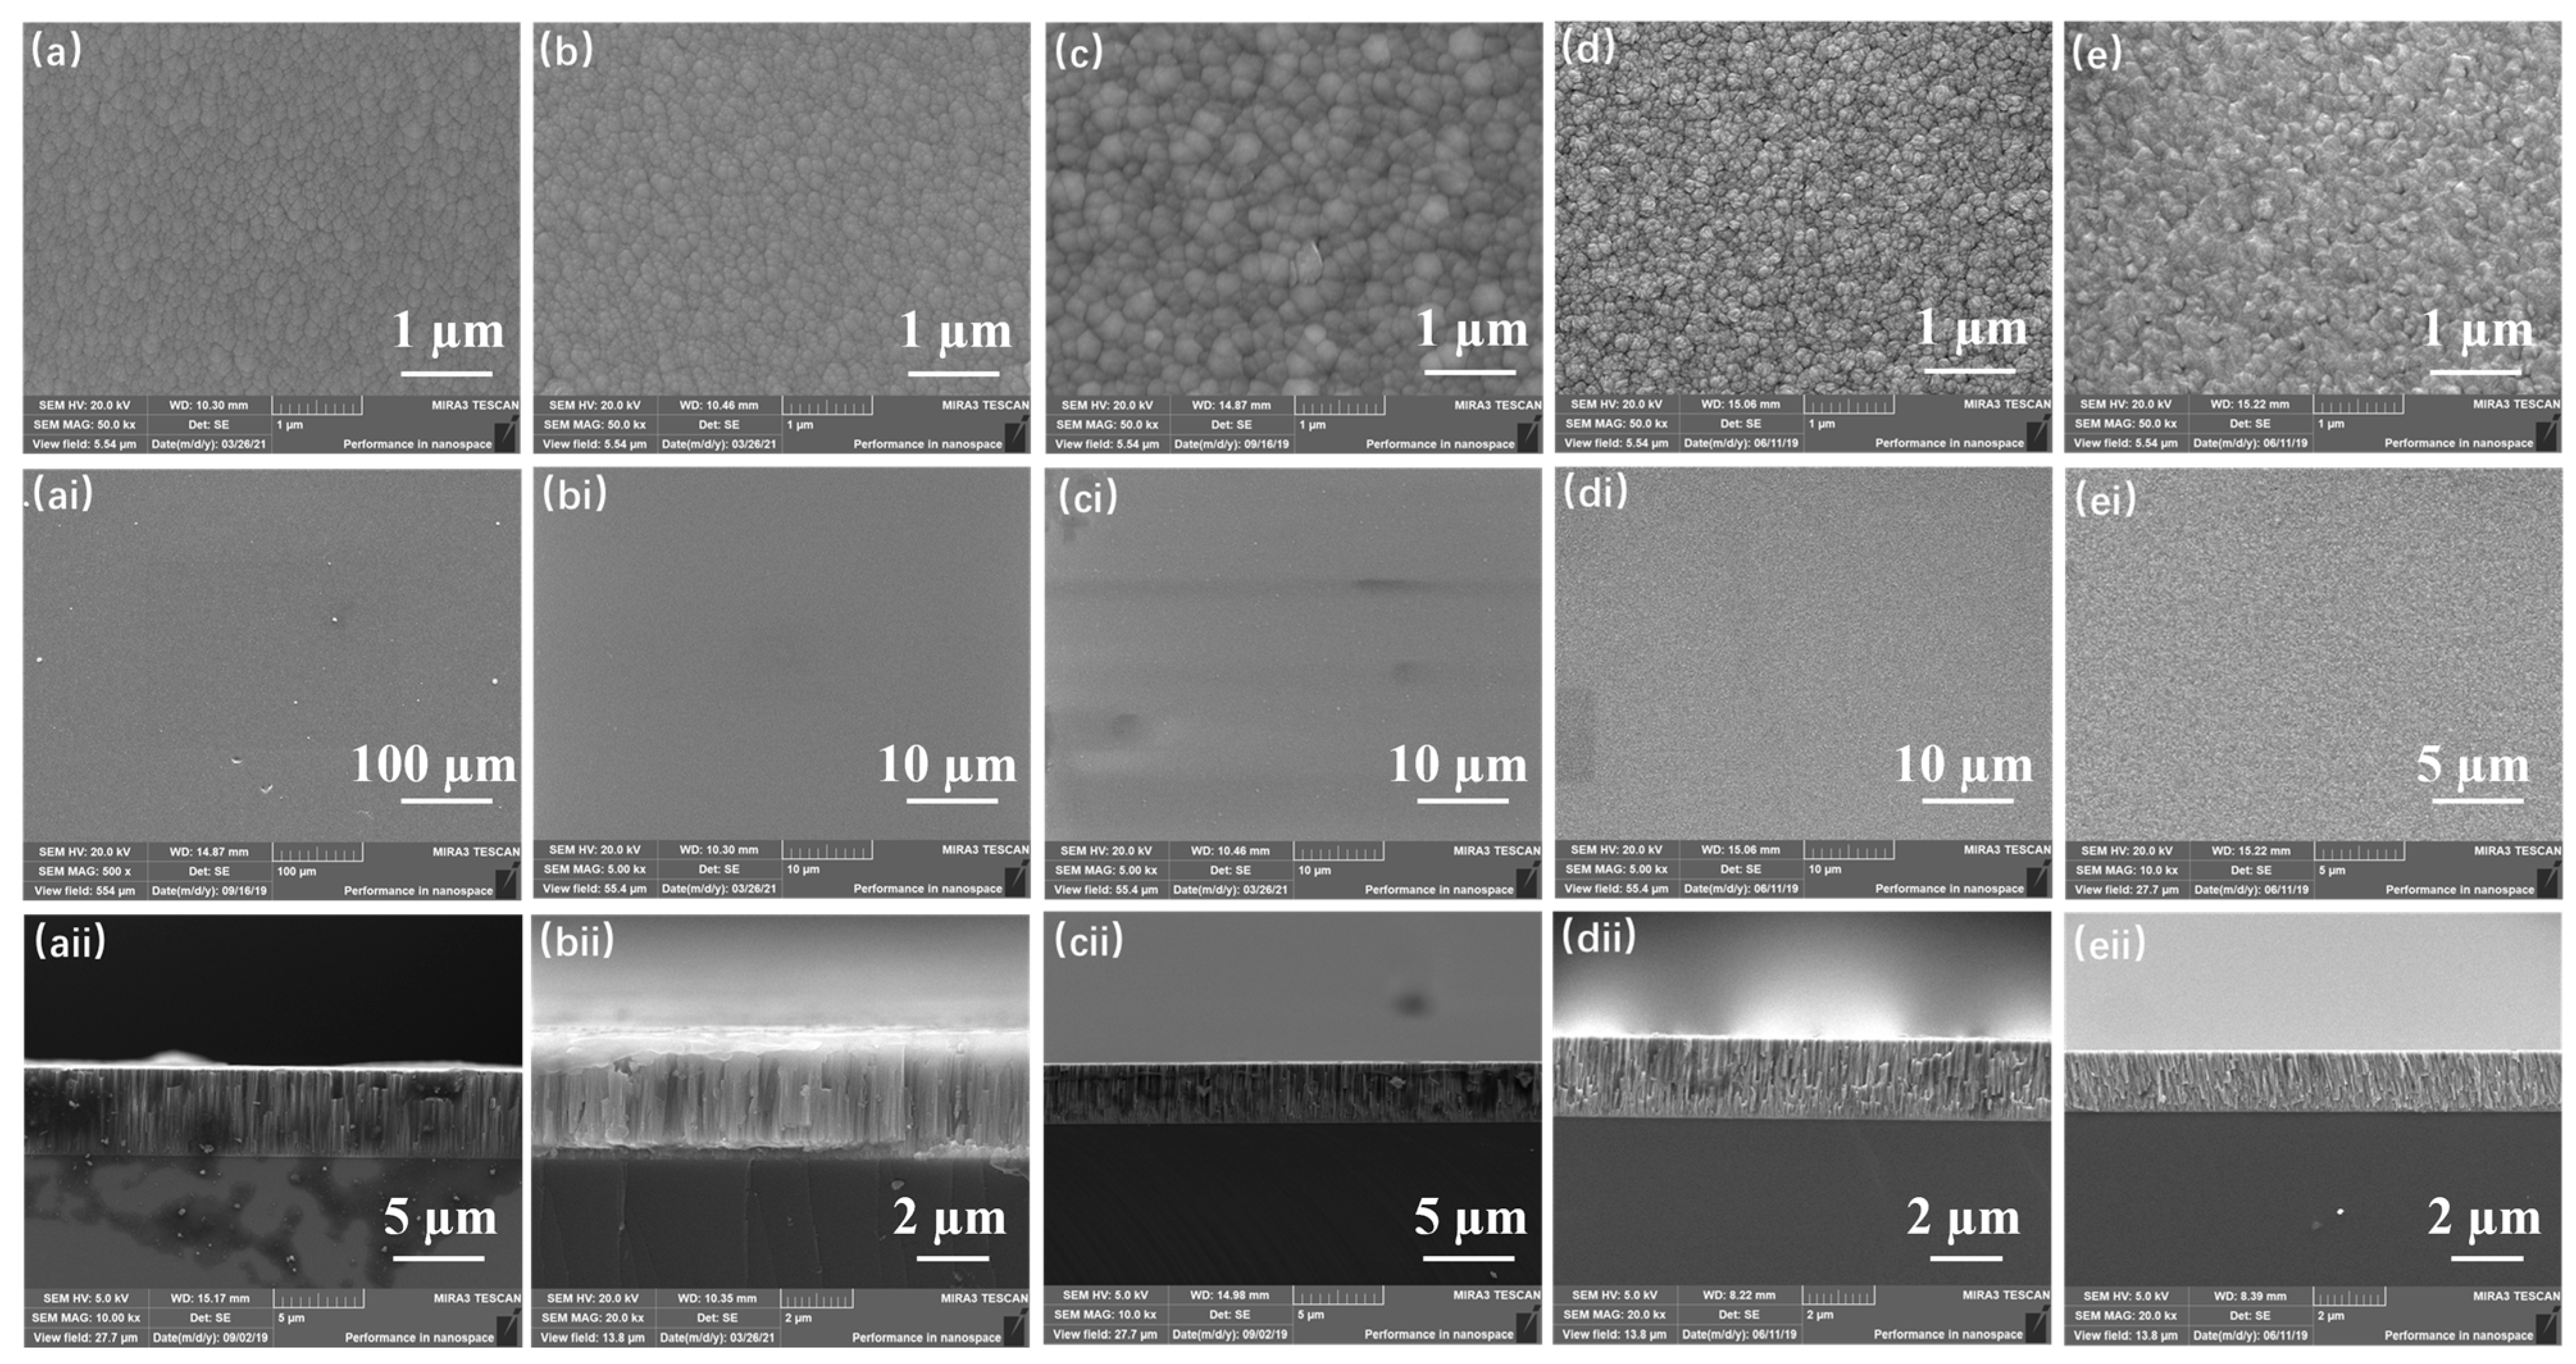
3.3. The Effect of TSD on the Growth Behavior of ZnO Coatings

The XRD diffraction patterns of ZnO coatings under different TSD conditions are given in Figure 5. From Figure 5a, it can be seen that the TSD has no effect on the crystallographic orientation of the coatings, and only one diffraction peak (002) appears in the spectrum, indicating that the coatings are all highly c-axis oriented. Figure 5b shows the intensity of the (002) diffraction peak, from which it can be seen that with the increase in the TSD, the intensity of the (002) diffraction peak first increases and then decreases, and reaches the maximum at 140 mm. In order to further investigate the effect of the TSD on the crystalline quality of the coating, the grain size of the coating was calculated by using Scherrer equation [19], and the results were obtained as shown in Figure 5c. From the figure, it can be seen that the grain size inside the ZnO piezoelectric coating increases and then decreases with the increase in the TSD, and the grains have a maximum value of 29.1 nm when the TSD is 140 mm, which indicates that the ZnO coating deposited here has the largest grain growth and the best crystalline quality in consistency with the XRD analysis results. The reason for the differentiation of coating performance at different TSD is mainly due to the fact that the plasma has a spatial variability of the energy, the closer to the target surface the higher the energy of the particles, but the relative time to reach the substrate is shorter.
Figure 6 shows the surface and cross-section micro-morphology of ZnO coatings under different TSDs. From Figure 6a–c, it can be found that the overall grain size of the coating increases and then decreases, and when the TSD is 140 mm, the size is the largest and the clearest, but it can also be observed that the grain size of the surface of the coating is inhomogeneous. When the TSD is increased to 160 mm, it is found that the coating surface is cluster stacked, the grain boundaries are blurred, and the cluster stacking is not dense enough. This is because the farther away from the target surface, the particles lack migration energy after deposition and are deposited in the form of cluster stacking. As more atoms are deposited, the gullies between clusters and clusters are filled, and voids may still exist in some areas, resulting in a non-dense coating. As can be seen from Figure 6aii–eii, when the TSD is less than 150 mm, a clear columnar crystal structure can be observed in all the coating cross sections. When the TSD is 160 mm, there is no obvious columnar crystal structure in the coating cross-section, which is related to the cluster growth mode of the coating.

3.4. Ultrasonic Signal Performance and Application

The optimal process parameters for the preparation of highly c-axis optimally oriented ZnO piezoelectric coatings are obtained through a systematic study of the preparation of ZnO piezoelectric coatings by RF sputtering. On this basis, ZnO coatings were deposited on the head of bolts with a length of L = 109 mm by RF sputtering. After the preparation of ZnO piezoelectric coating, the protective layer of SiO2 was prepared by an RF magnetron sputtering method (the diameter is 150 mm polycrystalline silicon target, RF power of 200 W, argon–oxygen pressure of 2.0 Pa, TSD of 140 mm, deposition time of 3 h). After the preparation of SiO2 protective layer, the Ti electrode layer is prepared by arc discharge method (the diameter is 150 mm Ti target, arc current of 50 A, bias voltage of −50 V, argon pressure of 0.5 Pa, TSD of 300 mm, deposition time of 0.5 h). The experimental parameters are shown in Table 2.
Figure 7a shows the structure of the sputtered smart bolt, in which piezoelectric, protective and electrode layers are deposited sequentially on the head of the bolt, and a single-sided double-electrode structure is prepared by using a mask plate in the preparation of the electrode layer. Figure 7b shows a cross-section of the head of bolt in which a clear three-layer structure can be observed: a ZnO piezoelectric layer (13.79 μm); a SiO2 protective layer (2.24 μm) and a Ti electrode layer (0.54 μm). The inset in the figure shows the surface and cross-section topography of the ZnO piezoelectric coating on a silicon wafer after 4 h of preparation. From the topography of the surface, it is obvious that the ZnO grains are uniform in size, and from the cross-section topography, it is obvious that the ZnO coating’s well-defined columnar crystalline structure grows perpendicularly to the substrate. The ultrasonic signal of the bolt is characterized using a probe that applies a voltage across the two electrodes of the bolt. Figure 7c gives the primary echo signal of the bolt at room temperature and without loading conditions, and the signal was amplified to obtain the signal map and frequency spectrum shown in Figure 7d. The pulse–echo response of the thin film sensor was concentrated at 24 MHz. In order to minimize the influence of interference phenomena (occurring between the reflected and divergent echoes generated by the diffraction of elastic waves in bolts of finite geometry) on the measurements, the first zero-crossing point of the echoes (circled position in Figure 7d) was taken as the value of the propagation time [20], and the propagation time TOF = 36.414 μs was obtained. The propagation distance l was twice the length of the bolt, l = 2L = 218 mm. After the calculation, the ultrasonic propagation velocity V = 5986.7 m/s was obtained, and the signal was determined to be an ultrasonic longitudinal wave signal.
To further investigate the suitability of the coating sensors for bolt applications, the bolts were load tested at room temperature. Real-time pressure testing was performed using a pressure sensor, and the test schematic is shown in Figure 8a. The pressure sensor was placed between the head and the tail of the bolt to measure the axial force of the bolt. The bolt was loaded using a torque wrench, and the measurement probe was connected directly to the coating sensor at the top of the bolt for ultrasonic signal measurement. Ten loading tests with different forces were carried out on the bolt studs to obtain the ultrasonic signal variation graph of the bolt under different tension conditions in Figure 8b. From Figure 8b, it can be seen that with the increase in loading force, the ultrasonic echo signal is constantly delayed, indicating that the ultrasonic propagation time inside the bolt increases. This is mainly caused by two reasons: one is the overall length of the bolt in the loading situation changes, resulting in an increase in the ultrasonic propagation distance; the second is according to the theory of acoustic elasticity, ultrasonic longitudinal wave is sensitive to the force parallel to the direction of propagation, so the ultrasonic propagation speed decreases under axial tensile stress conditions. Ten sets of values are given in Figure 8c for the real-time output pressure values of the pressure sensor in pounds (lb), and the conversion relationship with the tension force was 1lb = 4.4492 N. We controlled the loading by setting the torque value of the torque wrench from 40 Nm to 130 Nm, and the gradient of change was 10 Nm. The results show that the output tension value and the setting value do not have a perfect linear relationship, as shown in Figure 8c. shows. Therefore, the experiment only used the torque setting value as a reference, and the actual tension output value as the exact data value. The propagation time of ultrasonic signal of bolts with different loading forces was taken as the value, and the method of value was consistent with the above principle of taking the value of the first zero point. A plot of different loading forces versus time of flight is obtained as shown in Figure 8d below. Fitting of the data found that with the increase in loading force, the echo signal fetch value increased, and basically had a linear relationship, in agreement with the theoretical analysis results and the results of the studies of Y.P. Shen [20] and Xinxin Zhao [21]. It indicates that the prepared coatings are stable and practical under loading conditions when applied to bolts.

4. Conclusions

ZnO piezoelectric coatings were prepared by RF sputtering, and the growth behavior of the ZnO coatings was investigated by varying the variables of sputtering power, sputtering gas pressure, and TSD, and the morphology, structure, and properties were characterized and analyzed. It was found that with the increase in sputtering power, the crystallization quality of the (002) orientation of the coating was improved, and the best crystallization was achieved at 350 W. The sputtering gas pressure can strongly affect the growth trend of the coating along the (002) orientation, and the higher the air pressure (2.5 Pa), the more obvious the (002) orientation growth; the TSD has a small effect on the crystallization orientation of the coating, and the crystallization quality is optimal at 140 mm. The optimal parameters for the preparation of ZnO piezoelectric coatings with high c-axis optimal orientation by RF sputtering were synthesized and applied to the bolts. The results show that the smart bolts prepared by RF sputtering not only have detection effectiveness, but also the stress change was found to be positively proportional to the flight time by the detection of the flight time. This also provides a new idea for the preload force detection of tower crane bolts, which is good for improving the operational stability and safety of large-scale equipment such as tower cranes.

Author Contributions

Methodology, K.T.; Validation, Y.X.; Formal analysis, W.Y.; Resources, D.Z.; Data curation, J.L., D.D. and C.L.; Writing—original draft, Y.J.; Writing—review & editing, J.Z. and B.Y.; Supervision, J.Z. and B.Y. All authors have read and agreed to the published version of the manuscript.

Funding

This research received no external funding.

Institutional Review Board Statement

Not applicable.

Informed Consent Statement

Not applicable.

Data Availability Statement

Data are contained within the article.

Conflicts of Interest

The authors declare no conflict of interest.

References

  1. Kim, E.S.; Choi, S.K. Failure analysis of connecting bolts in collapsed tower crane. Fatigue Fract. Eng. Mater. Struct. 2013, 36, 228–241. [Google Scholar] [CrossRef]
  2. Tingaev, A.K.; Gubaydulin, R.G.; Shaburova, N.A. Causes of Failure of High-Tensile Stud Bolts Used for Joining Metal Parts of Tower Crane. IOP Conf. Ser. Mater. Sci. Eng. 2017, 262, 012058. [Google Scholar] [CrossRef]
  3. Ushio, Y.; Saruwatari, T.; Nagano, Y. Elastoplastic FEM analysis of earthquake response for the field-bolt joints of a tower-crane mast. Adv. Comput. Des. 2019, 4, 53–72. [Google Scholar] [CrossRef]
  4. Wang, S.; Ni, P.; Zhang, Y.; Dong, M. Investigation into the self-loosening trend of bolt joints on the tower crane. In Proceedings of the 2nd International Conference on Advances in Mechanical Engineering and Industrial Informatics (AMEII 2016), Hangzhou, China, 9–10 April 2016. [Google Scholar]
  5. Nikravesh, S.M.Y.; Goudarzi, M. A Review Paper on Looseness Detection Methods in Bolted Structures. Lat. Am. J. Solids Struct. 2017, 14, 2153–2176. [Google Scholar] [CrossRef]
  6. Johnson, E.C.; Kim, Y.M.; Morris, F.A.; Mitchell, J.; Pan, R.B. Ultrasonic method for deployment mechanism bolt element preload verification. In Proceedings of the 42nd Aerospace Mechanism Symposium, Baltimore, MD, USA, 14–16 May 2014. [Google Scholar]
  7. Song, W.; Xu, C.; Pan, Q.; Song, J. Nondestructive testing and characterization of residual stress field using an ultrasonic method. Chin. J. Mech. Eng. 2016, 29, 365–371. [Google Scholar] [CrossRef]
  8. Hou, R.; Hutson, D.; Kirk, K.J. Investigation of thin-film ultrasonic transducers for high-temperature applications. Insight Non-Destr. Test. Cond. Monit. 2012, 54, 68–71. [Google Scholar] [CrossRef]
  9. Hou, R.; Hutson, D.; Kirk, K.J. Development of sputtered AlN thin-film ultrasonic transducers for durable high-temperature applications. Insight Non-Destr. Test. Cond. Monit. 2013, 55, 302–307. [Google Scholar] [CrossRef]
  10. Xu, C.; Zeng, X.; Zhang, X.; Zeng, Z.; Chen, Z.; Neena, D.; Li, M.; Zhang, J.; Yang, B.; Liu, S.; et al. High temperature AlN thin film ultrasonic transducers with dual mode wave excitation. Ceram. Int. 2024, 50, 7480–7485. [Google Scholar] [CrossRef]
  11. Zhang, Y.; Jiang, Y.; Ma, C.; Zhang, J.; Yang, B. Preparation of ZnO Piezoelectric Thin-Film Material for Ultrasonic Transducers Applied in Bolt Stress Measurement. Coatings 2023, 13, 1538. [Google Scholar] [CrossRef]
  12. Feng, C.; Zhu, J.; Wang, Q.; Jiao, G.; Li, W.; Cheng, Q.; Wang, C.; Xia, B.; Jiang, Y.; Zhang, J.; et al. Development of Double-Insulated Ring Sensors for Hollow Pin Preload Measurement. IEEE Sens. J. 2023, 23, 6545–6553. [Google Scholar] [CrossRef]
  13. Jiang, Y.; Li, J.; Jiao, G.; Li, W.; Liu, Y.; Wang, C.; Xia, B.; Wan, B.; Zhang, J.; Pelenovich, V.; et al. ZnO piezoelectric coatings used for the ultrasonic excitation of longitudinal-transverse waves and their application for smart bolts. J. Vac. Sci. Technol. B 2022, 40, 043002. [Google Scholar] [CrossRef]
  14. Zeng, X.; Pelenovich, V.; Xu, C.; Neena, D.; Jiang, Y.; Zhang, X.; Pogrebnjak, A.; Rakhimov, R.; Zhang, J.; Yang, B.; et al. Morphology of lithium niobium oxide thin film ultrasonic transducers deposited by RF magnetron sputtering. Ceram. Int. 2023, 49, 16297–16304. [Google Scholar] [CrossRef]
  15. Zeng, X.; Zhang, X.; Pelenovich, V.; Neena, D.; Xu, C.; Liu, Y.; Jiang, Y.; Zeng, L.; Pogrebnjak, A.; Vildanov, R.; et al. High-temperature thin film lithium niobium oxide transducers for bolts. Ceram. Int. 2023, 49, 7710–7716. [Google Scholar] [CrossRef]
  16. Jing, X.; Dai, H.; Xu, W.; Zhao, Y.; Zhang, J.; Yang, B. Axial Load Measurement of Bolts with Different Clamping Lengths Based on High-Frequency Ultrasonic ZnO Film Sensor. Sensors 2023, 23, 3712. [Google Scholar] [CrossRef] [PubMed]
  17. Sin, N.D.M.; Musa, M.; Rusop, M. Effect of RF Power to the Properties of ZnO Thin Films Deposited by Magnetron Sputtering. Adv. Mater. Res. 2012, 364, 119–123. [Google Scholar] [CrossRef]
  18. Lu, J.; Ye, Z.; Huang, J.; Wang, L.; Zhao, B. Synthesis and properties of ZnO films with (1 0 0) orientation by SS-CVD. Appl. Surf. Sci. 2003, 207, 295–299. [Google Scholar] [CrossRef]
  19. Bindu, P.; Thomas, S. Estimation of lattice strain in ZnO nanoparticles: X-ray peak profile analysis. J. Theor. Appl. Phys. 2014, 8, 123–134. [Google Scholar] [CrossRef]
  20. Shen, Y.P.; Ma, G.B.; Ma, C.; Zhu, X.X.; Zhao, J.H. Bolt stress inspection by Electromagnetic Acoustic Transducer(EMAT) and PZT. In Proceedings of the Asia Pacific Conference for Non-Destructive Testing (APCNDT2017), Singapore, 13–17 November 2017; pp. 1–8. [Google Scholar]
  21. Zhao, X.-X.; Li, Y.-M.; Liu, X.-G.; Yao, K. Ultrasonic measurement on axial force of high-strength bolt in service. J. Low Freq. Noise Vib. Act. Control 2020, 39, 596–603. [Google Scholar] [CrossRef]
Figure 1. Structure of ZnO coatings deposited at 1.5 Pa and 120 m with different sputtering powers (a) XRD patterns; (b) change in orientation coefficient of (002) and (110) diffraction peaks.
Coatings 14 00718 g001
Figure 2. Morphologies of ZnO coatings under different sputtering powers (aaii) 100 W; (bbii) 150 W; (ccii) 200 W; (ddii) 250 W; (eeii) 350 W; (f) deposition rate.
Coatings 14 00718 g002
Figure 3. Structure of ZnO coatings deposited at 150 W and 140 mm with different sputtering gas pressure (a) XRD patterns; (b) orientation coefficient of peaks.
Coatings 14 00718 g003
Figure 4. Morphologies of ZnO coatings with different sputtering gas pressures: (aaii) 1.0 Pa; (bbii) 1.5 Pa; (ccii) 2.0 Pa; (ddii) 2.5 Pa; (e) deposition rate.
Coatings 14 00718 g004
Figure 5. Structure of ZnO coatings deposited at 350 W and 1.5 Pa with different TSDs: (a) XRD patterns; (b) (002) diffraction peak intensity; (c) grain size and (d) deposition rate.
Coatings 14 00718 g005
Figure 6. Morphology of ZnO coatings with different TSDs: (aaii) 120 mm; (bbii) 130 mm; (ccii) 140 mm; (ddii) 150 mm; (eeii) 160 mm.
Coatings 14 00718 g006
Figure 7. Bolts by RF sputtering: (a) structure schematic; (b) cross-section morphology of the bolt (the inset images show the surface and cross-section morphology on Si); (c) ultrasonic signal at room temperature under no-load condition; (d) pulse–echo waveform and frequency spectrum.
Coatings 14 00718 g007
Figure 8. Ultrasonic signal performance: (a) schematic diagram; (b) variation in ultrasonic signal of bolts with different loading forces; (c) relationship between actual tension value and torque value; (d) relationship between different loading forces and TOF.
Coatings 14 00718 g008
Table 1. Preparation parameters of the ZnO coatings.
Target MaterialSubstrateVacuum (Pa)TSD (mm)Power (W)Gas Pressure (Pa)Hour (h)
ZnOSi6 × 10–31201001.57
1201501.53
1202001.52.5
1202501.54.5
1203502.03
1401501.05
1401501.53.5
1401502.03.5
1401502.53
1203501.53
1303501.53
1403501.53
1503501.53
1603501.53
Table 2. Preparation parameters of smart bolt by RF sputtering.
Target MaterialVacuum (Pa)Bias (V)TSD (mm)Power/CurrentGas Pressure (Pa)Hour (h)
ZnO6 × 10−30140350 W2.510
Si6 × 10−30140200 W2.03
Ti6 × 10−3−5030050 A0.50.5
Disclaimer/Publisher’s Note: The statements, opinions and data contained in all publications are solely those of the individual author(s) and contributor(s) and not of MDPI and/or the editor(s). MDPI and/or the editor(s) disclaim responsibility for any injury to people or property resulting from any ideas, methods, instructions or products referred to in the content.

