Article

Excitation-Wavelength- and Time-Dependent Fluorescent Ink Based on RGB Building Blocks for Advanced Anti-Counterfeiting

Key Laboratory for Anisotropy and Texture of Materials (Ministry of Education), School of Materials Science and Engineering, Northeastern University, Shenyang 110819, China
*
Author to whom correspondence should be addressed.
Coatings 2024, 14(4), 506; https://doi.org/10.3390/coatings14040506
Submission received: 25 March 2024 / Revised: 10 April 2024 / Accepted: 17 April 2024 / Published: 19 April 2024
(This article belongs to the Special Issue Trends in Coatings and Surface Technology, 2nd Edition)

Abstract

:
What is reported here is an advanced anti-counterfeiting ink whose luminous effect changes over time and at different excitation wavelengths. Unlike traditional anti-counterfeit fluorescent materials, the phosphors used here exhibit multicolor emissions under multiple excitation modes. In this work, the most important building blocks are three classic phosphors with primary colors, red (Ca2YNbO6:0.4Eu3+), green (SrAl2O4:0.01Eu2+, 0.02Dy3+) and blue (CaAl2O4:0.012Eu2+, 0.06Nd3+, 0.036Gd3+), which were synthesized using the high-temperature solid-state method. The phosphors formed homogeneous solid solutions and were uniformly distributed throughout the mixture. A homogeneous transparent luminescent ink was obtained by blending the multi-mode phosphors with transparent screen-printing ink, resulting in multi-mode luminescence by simply varying the proportions of the red (R), green (G) and blue (B) phosphors. Thanks to this simple process, an advanced anti-counterfeiting ink with low production costs was achieved. Anti-counterfeiting logos of a “Giraffe” and “Steam Train” were printed using the transparent fluorescent ink onto black cardstock, exhibiting the characteristic of dynamic luminescence dependent on the duration and excitation wavelength. The anti-counterfeiting effect of the patterns suggests that the fluorescent ink is worth developing and is reliable in its application.

1. Introduction

Nowadays, with the rapid development of society and science, the phenomenon of fake and shoddy products continues to emerge in various fields, including bank checks, luxury goods, securities, pharmaceutical products, trademarks and even information security. This has become a critical problem requiring immediate action. Therefore, dozens of anti-counterfeiting technologies have emerged as required by the times, such as digital watermarking, bar codes, 2D bar codes, positioning hot stamping, chemical ink and anti-counterfeiting ink. Among them, optical anti-counterfeiting technology, characterized by its low manufacturing cost, low susceptibility to imitation, good concealment, high identification and integration with other anti-counterfeiting methods, has been extensively studied and widely used. The key element of optical anti-counterfeiting technology is luminescent material.
When exciting conventional fluorescent anti-counterfeiting materials using ultraviolet (UV) and/or near-infrared (NIR) light, they typically emit monochromatic or sometimes bi-color light (photoluminescence (PL) and/or up-conversion photoluminescence (UCPL)) [1]. However, traditional anti-counterfeit fluorescent materials generally emit only monochromatic light under fixed excitation modes. This single luminescent mode shows poor anti-counterfeit properties and is susceptible to counterfeiting [2]. As a result, in the past few years, plenty of dual-mode fluorescent materials have been developed, which have a higher security. Zhang et al. fabricated Ca3Al2Ge3O12:Yb3+, Er3+ phosphors with dual-mode luminescence and afterglow for anti-counterfeiting and fingerprint verification [3]. Li et al. reported core–shell UCNPs@SiO2@TEuTbB nanospheres with dual-mode luminescent behavior for high-level anti-counterfeiting and the recognition of latent fingerprints [4]. Unfortunately, achieving dual-mode luminescence covering the entire spectrum is difficult, resulting in limited emission colors. Multi-mode anti-counterfeiting technology is evidently safer, as it offers multicolor emissions under multiple excitation modes. Li et al. fabricated a double-perovskite phosphor of Cs2NaBiCl6, exhibiting multi emissions under various excitations [5], and Wu et al. synthesized multi-modal luminescent ZnGa2O4:Tb3+, Bi3+ through trap engineering, which was a potential optical material for advanced anti-counterfeiting [6]. All of the above are excellent luminescent anti-counterfeiting materials, but the product in this work can achieve a similar effect at a lower cost and using a simpler process.
Here, reliable luminescent fluorescent powders are the most important building blocks, as they enable the generation of multi-mode luminescent signals with different mixing proportions. It is expected that the multi-modal luminescence of the mixed phosphors will be visible to the naked eye. Considering the change in the luminescence effect over time, luminescent materials with transient emissions or long afterglow characteristics can achieve our goal. Overall, three classic phosphors with primary colors were selected: red (Ca2YNbO6:0.4Eu3+), green (SrAl2O4:0.01Eu2+, 0.02Dy3+) and blue (CaAl2O4:0.012Eu2+, 0.06Nd3+, 0.036Gd3+). Red, green and blue are the primary colors forming color light, which means that their emission colors can cover the whole spectrum. It is noteworthy that the chosen green and blue phosphors are readily available commercial phosphors. Herein, the aforementioned three monochromatic phosphors were synthesized using the high-temperature solid-state method. These three monochromatic phosphors were mixed in different proportions to emit in various ways, all possessing multi-modal stimulus properties. Then, fluorescent anti-counterfeit printing inks prepared from the mixtures were obtained and applied to printing several patterns as an example. The results showed that all the patterns exhibited great anti-counterfeiting effects, indicating that the final product can be utilized for information storage and anti-counterfeiting purposes.

2. Experimental Section

2.1. Sample Preparation

The samples of Ca2YNbO6:0.4Eu3+; SrAl2O4:0.01Eu2+, 0.02Dy3+ and CaAl2O4:0.012Eu2+, 0.06Nd3+, 0.036Gd3+ were synthesized using the high-temperature solid-state method. The starting materials, including CaCO3 (99.7%), Nb2O5 (99.99%), Eu2O3 (99.99%), Y2O3 (99.999%), SrCO3 (99.7%), Al2O3 (99.99%), Dy2O3 (99.99%), H3BO3 (99.7%), Nd2O3 (99.999%) and Gd2O3 (99.995%), were all purchased from China Pharmaceutical Group Chemical Reagent Co., Ltd. (Shanghai, China). Based on the composition, the above ingredients were weighed according to their stoichiometric ratios and mixed homogeneously in an agate mortar. Then, the red phosphor was calcined at 1400 °C for 6 h in air, while the green phosphor and blue phosphor were calcined at 1350 °C and 1300 °C for 2 h and 5 h, respectively, in a hydrogen atmosphere. After cooling them to room temperature and regrinding them for 30 min, monochromatic powders were prepared for the synthesis of multi-mode phosphors. Three proportions (R:G:B = 2:1:2, R:G:B = 4:2:1, R:G:B = 4:6:1) of multi-mode fluorescent powder were obtained by mixing the monochromatic powders.

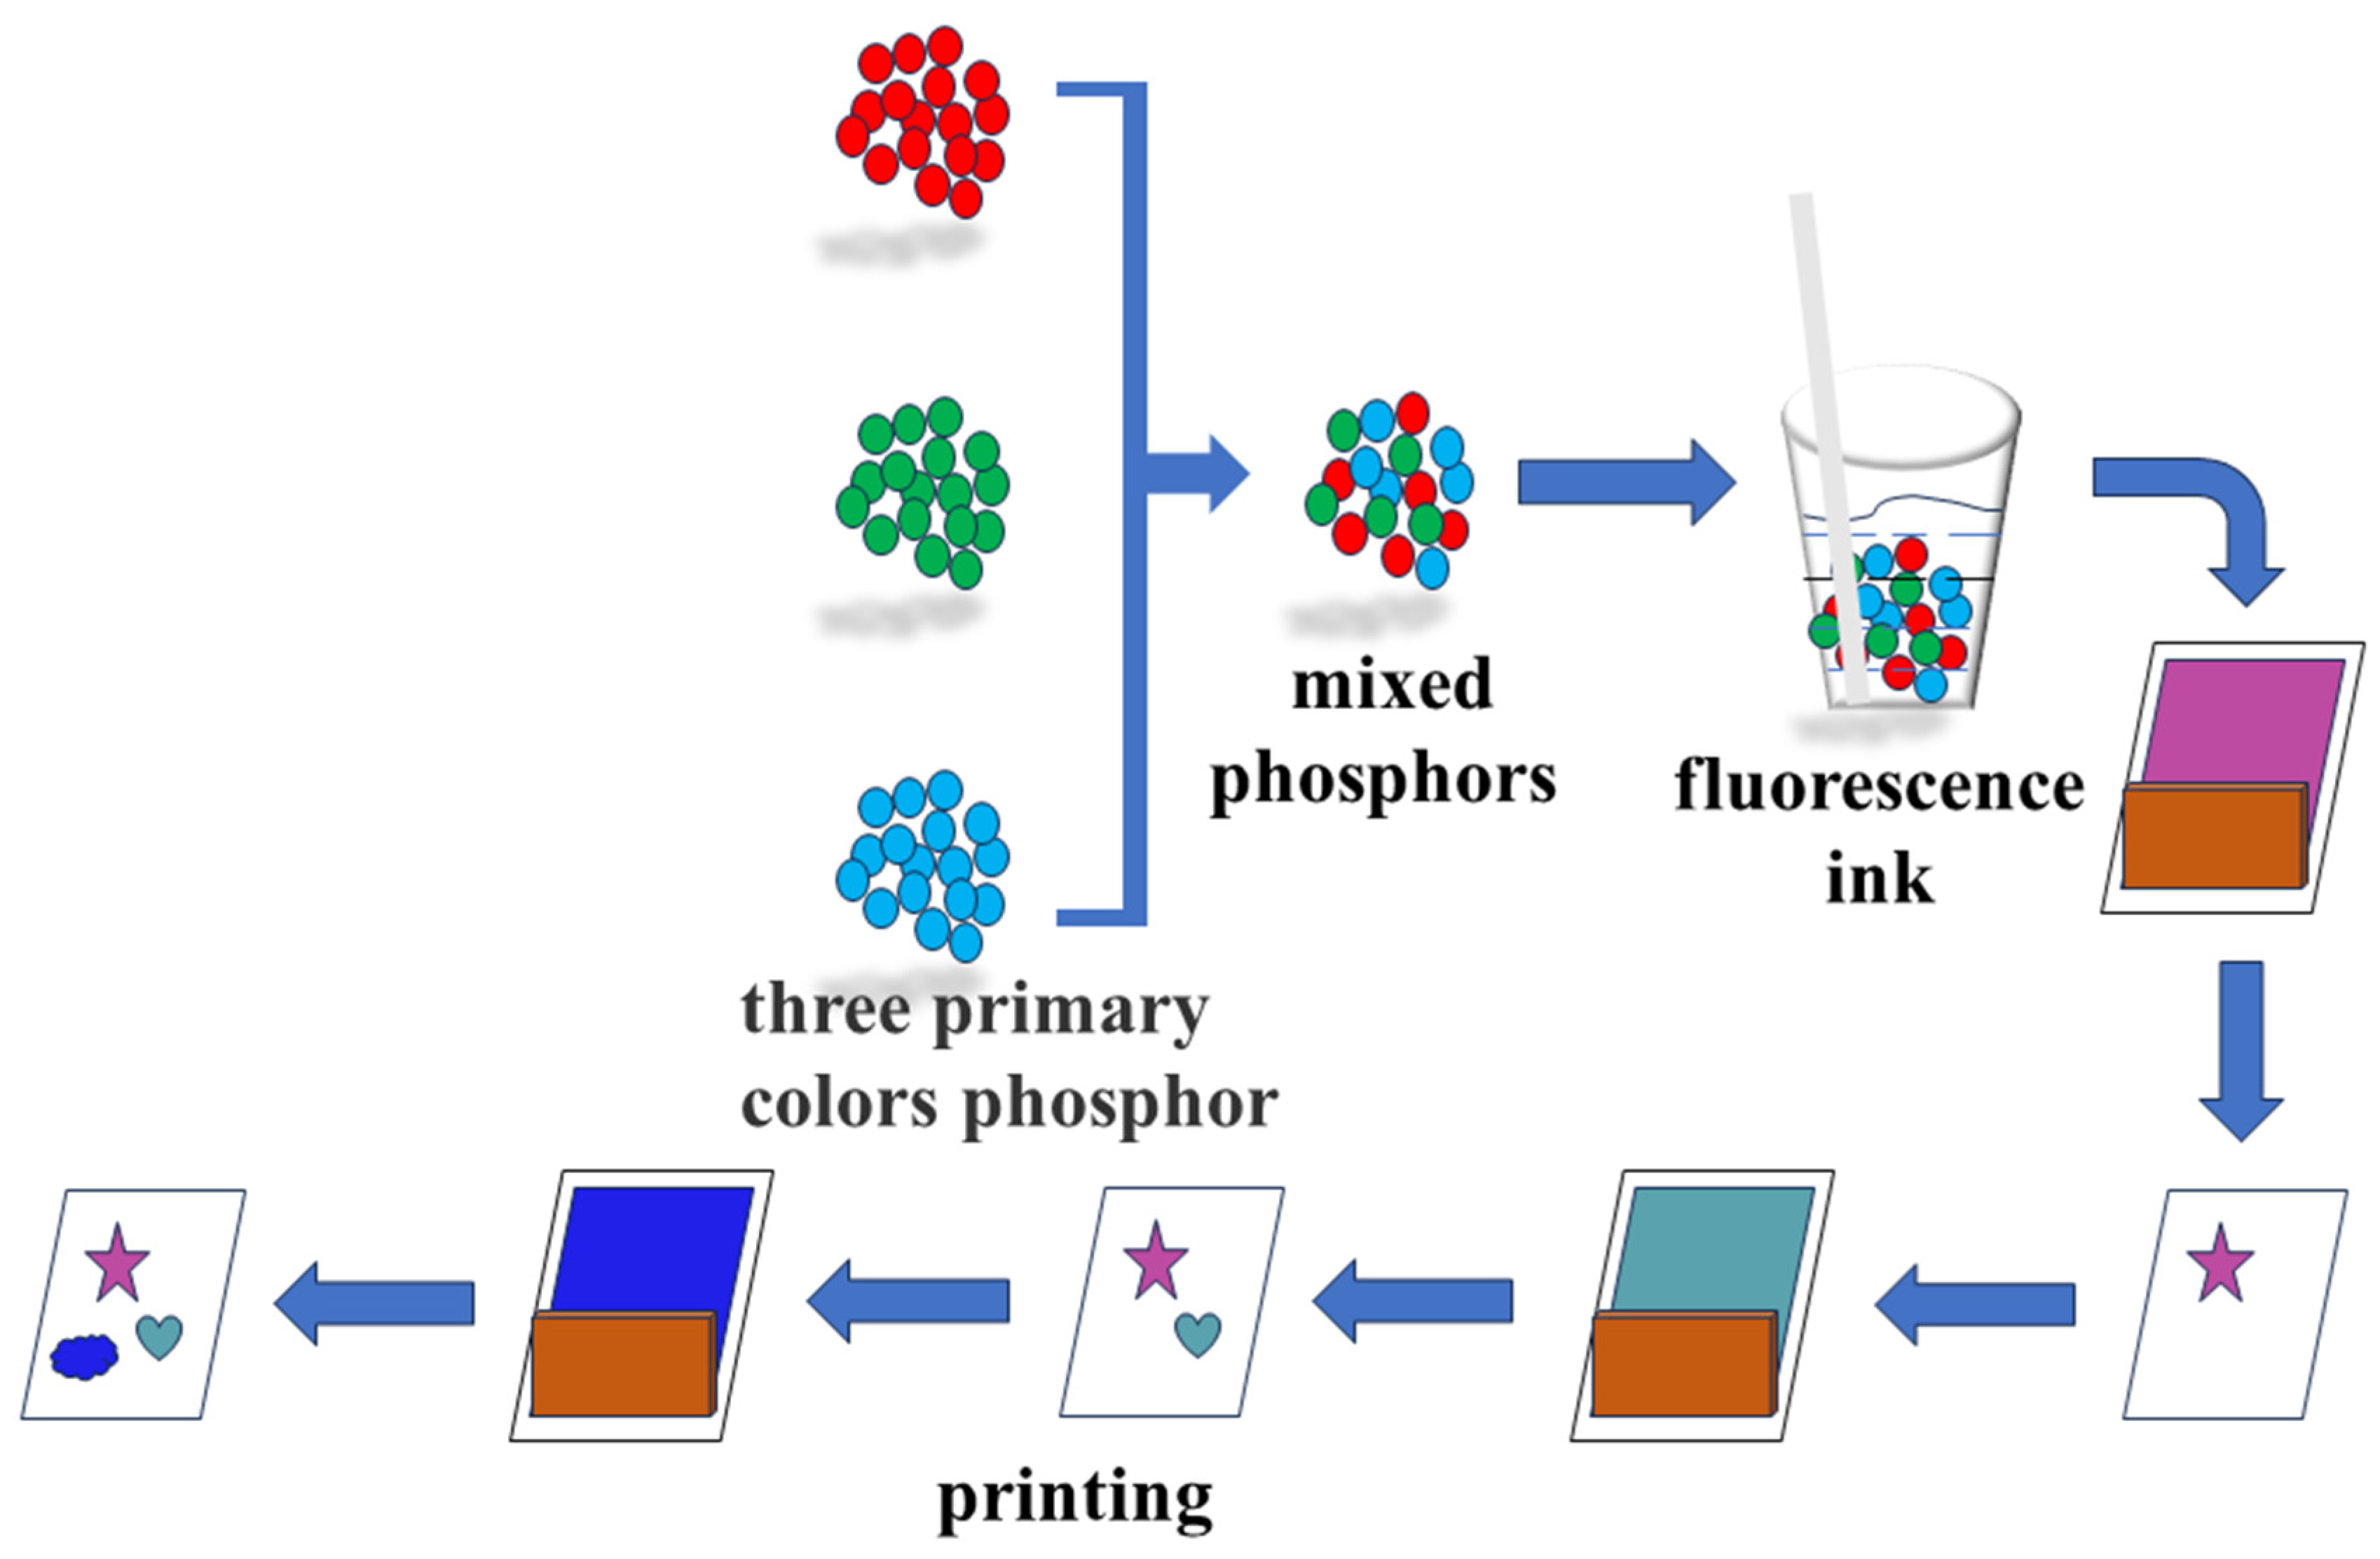
2.2. Preparation of the Anti-Counterfeit Logo

For the screen-printing ink, a homogeneous transparent luminescent ink was obtained by blending the multi-mode phosphors with transparent screen-printing ink (commercially polyvinyl chloride). For the sake of description, the three proportions of fluorescent ink (R:G:B = 2:1:2, R:G:B = 4:2:1, R:G:B = 4:6:1) were denoted as 212, 421 and 461 ink, respectively. As for the carrier of the printed patterns, black cardstock was selected because it offers the advantages of a smooth surface and no background fluorescence, making it suitable for printing and irradiation under UV light. Then, the prepared transparent luminescent inks were used to design and prepare a pattern of a “Giraffe” as demonstration of multi-mode luminescent images for information encryption and anti-counterfeiting using screen-printing techniques. A rubber flap was used to spread the ink across a 200-mesh screen-printing plate with different custom patterns, allowing the ink to bleed through the screen and form the final security pattern. The eyes and the bristles of the “Giraffe” were printed with the 461 ink, the body of the “Giraffe” was printed with the 421 ink and its spots and horns were printed with the 212 ink. Additionally, a pattern of a “Steam Train” was printed with monochrome transparent luminescent ink as a reference.

2.3. Characterization Method

X-ray diffraction (XRD, SmartLab model, Rigaku, Tokyo, Japan) analysis was performed on the monochrome samples to identify their crystal phase and structure. The Cu Kα radiation (λ = 0.15406 nm) was filtered by nickel at 40 mA and 40 kV. The morphology, microstructure and selected area electron diffraction (SAED) of the monochromatic samples were analyzed using a JEM-2100FX transmission electron microscope (TEM, JEOL, Tokyo, Japan). EDS of the sample was conducted using a field emission scanning electron microscope (FE-SEM, model JSM-7001F, JEOL, Tokyo, Japan). The photoluminescence spectra (PL), photoluminescence excitation spectra (PLE) and afterglow attenuation curve of the monochromatic samples were measured using a Horiba JY Fluorolog-3 fluorescence spectrophotometer (Kyoto, Japan). The PL spectra of the mixed phosphors at different proportions were also obtained.

3. Results and Discussion

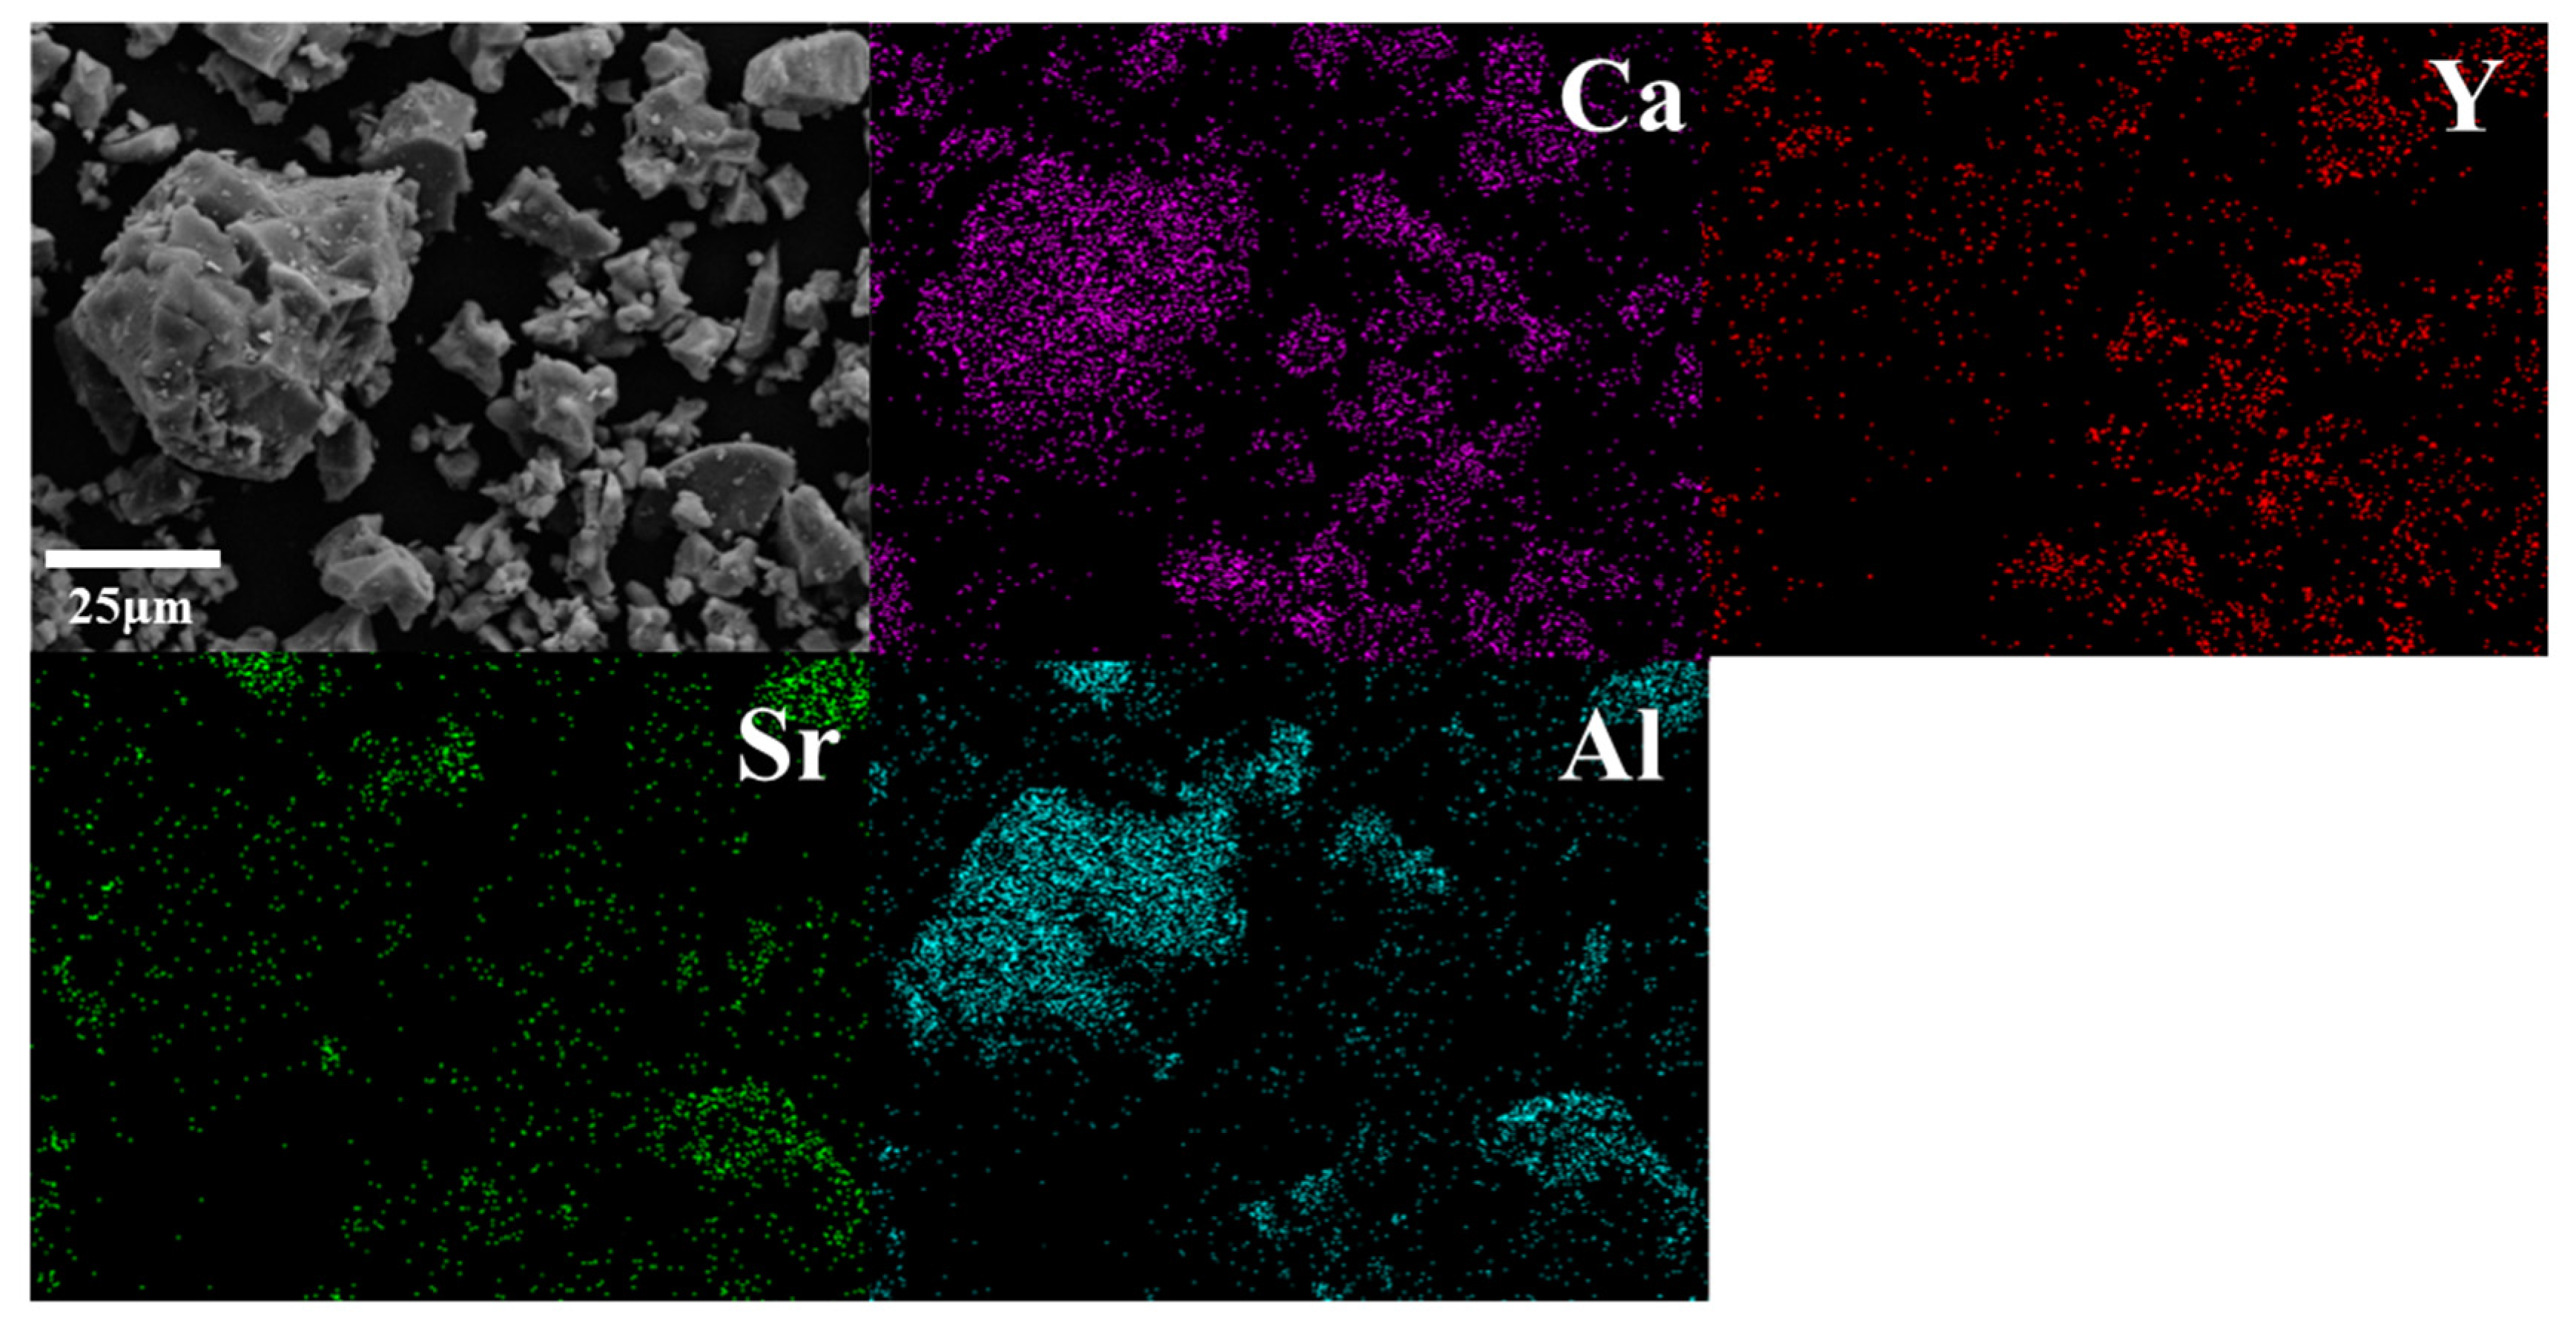
3.1. Structural Characterization

Figure 1 shows the XRD patterns of the Ca2YNbO6:0.4Eu3+; SrAl2O4:0.01Eu2+, 0.02Dy3+ and CaAl2O4:0.012Eu2+, 0.06Nd3+, 0.036Gd3+ samples. The main strong diffraction peaks in each XRD pattern matched well with the corresponding standard diffraction patterns of Ca2YNbO6 (JCPDS No. 04-005-8315), SrAl2O4 (JCPDS No. 34-0379) and CaAl2O4 (JCPDS No. 23-1036). There were no other impurity diffraction peaks, and no obvious diffraction shifts were found, indicating that the doped ions were well incorporated into the matrix lattice and formed a homogeneous solid solution without forming new phases.
For Ca2YNbO6:0.4Eu3+ (Figure 1a), the ionic radius of Eu3+ is 0.947 Å for six coordination, and it tends to replace the position of the Y3+ ion after entering the matrix lattice, mainly due to having the same valence as Y3+ and a similar ionic radius to Y3+ (CN = 6, r = 0.900 Å). The replacement of Eu3+ by Y3+ was also confirmed by Shi et al. in Ca2YNbO6 [7]. For SrAl2O4:0.01Eu2+, 0.02Dy3+ (Figure 1b), the ionic radii of Sr2+, Al3+, Eu2+ and Dy3+ are 1.180 Å, 0.535 Å, 1.170 Å and 0.912 Å for six coordination, respectively. Thus, the Eu2+ and Dy3+ ions occupy the Sr2+ site due to their closer ionic radius, while the Al3+ site is too small to accommodate them [8,9]. For CaAl2O4:0.012Eu2+, 0.06Nd3+, 0.036Gd3+ (Figure 1c), the ionic radii of Nd3+, Eu2+ and Gd3+ were 0.983 Å, 1.170 Å and 0.0938 Å for six coordination, respectively, while the ionic radii of Al3+ and Ca2+ were 0.535 Å and 1.000 Å. It can be concluded that the doped rare-earth ions have a closer ionic radius to Ca2+; thus, the Ca2+ ions in the cavities of CaAl2O4 [10] are more likely to be replaced by the doped rare-earth ions (Eu2+, Nd3+, Gd3+). In this case, the necessary conditions in the crystal structure for the reduction of Eu3+ into Eu2+ under a mild reducing atmosphere or even an air atmosphere are provided [11]. Zhang et al. also confirmed that a small amount of the doped rare-earth ions (Eu2+, Nd3+, Gd3+) has almost no impact on the phase composition of CaAl2O4 [12]. Through observation of the TEM images of the red (Figure 2a1), green (Figure 2b1) and blue (Figure 2c1) primary color phosphors, it can be seen that the particles of the primary color phosphors are irregular in shape, and the grain sizes of the samples are in the range of 0.5–2 μm. Selected area electron diffraction (SAED) of the three primary color phosphors yielded clear spots (Figure 2a3,b3,c3) and indicated distinct interplanar spacing, suggesting that three primary color phosphor samples were successfully synthesized. The TEM image, the HR-TEM lattice fringe and the SAED pattern for the Ca2YNbO6:0.4Eu3+ red primary phosphor sample are displayed in Figure 2a1, a2 and a3, respectively. As shown in Figure 2a3, calibrating the diffraction spot which is nearest to the diffraction center, respectively, could find that one interplanar space is around 0.560 nm, corresponding to the (001) lattice plane of Ca2YNbO6 (JCPDS No. 04-005-8315), and in Figure 2a2, the d-value corresponding to the (002) plane is determined to be approximately 0.280 nm, which agrees with the result of the SAED pattern, indicating that the phosphor sample of Ca2YNbO6:0.4Eu3+ was successfully synthesized. Figure 2b1–b3 show the TEM image, the HR-TEM lattice fringe and the SAED pattern for the SrAl2O4:0.01Eu2+, 0.02Dy3+ green primary phosphor sample. By calibrating the diffraction spots in Figure 2b3, one interplanar space is determined to be around 0.515 nm, corresponding to the (010) lattice plane of SrAl2O4 (JCPDS No. 34-0379). By analyzing Figure 2b2, the d-value corresponding to the (010) plane is determined to be approximately 0.515 nm, matching well with the result of the SAED pattern. It can be concluded that the phosphor sample of SrAl2O4:0.01Eu2+, 0.02Dy3+ was successfully synthesized. The spots in the SAED patterns were clear, confirming that the synthesized samples were well crystallized. Figure 2c1 is the TEM image for CaAl2O4:0.012Eu2+, 0.06Nd3+, 0.036Gd3+, showing that the grain size of the samples was less than 1 μm. The HR-TEM lattice fringe and SAED pattern for CaAl2O4:0.012Eu2+, 0.06Nd3+, 0.036Gd3+ are displayed in Figure 2c2,c3. Calibrating the diffraction spots in Figure 2c2 indicates that one interplanar space is around 0.244 nm, corresponding to the (3-1-3) lattice plane of CaAl2O4 (JCPDS No. 23-1036), and in Figure 2c2, the d-value corresponding to the (3-1-3) lattice plane is determined to be about 0.244 nm, which matches well with the result of the SAED pattern. This indicates that the phosphor sample of CaAl2O4:0.012Eu2+, 0.06Nd3+, 0.036Gd3+ was successfully synthesized. Figure 3 shows the SEM micrographs and element mapping images of the tricolor mixed phosphors (R:G:B = 4:2:1). The elemental mapping images confirmed the presence of the Ca, Sr, Al and Y elements in the samples, and the three primary color phosphors were uniformly distributed throughout the mixture.

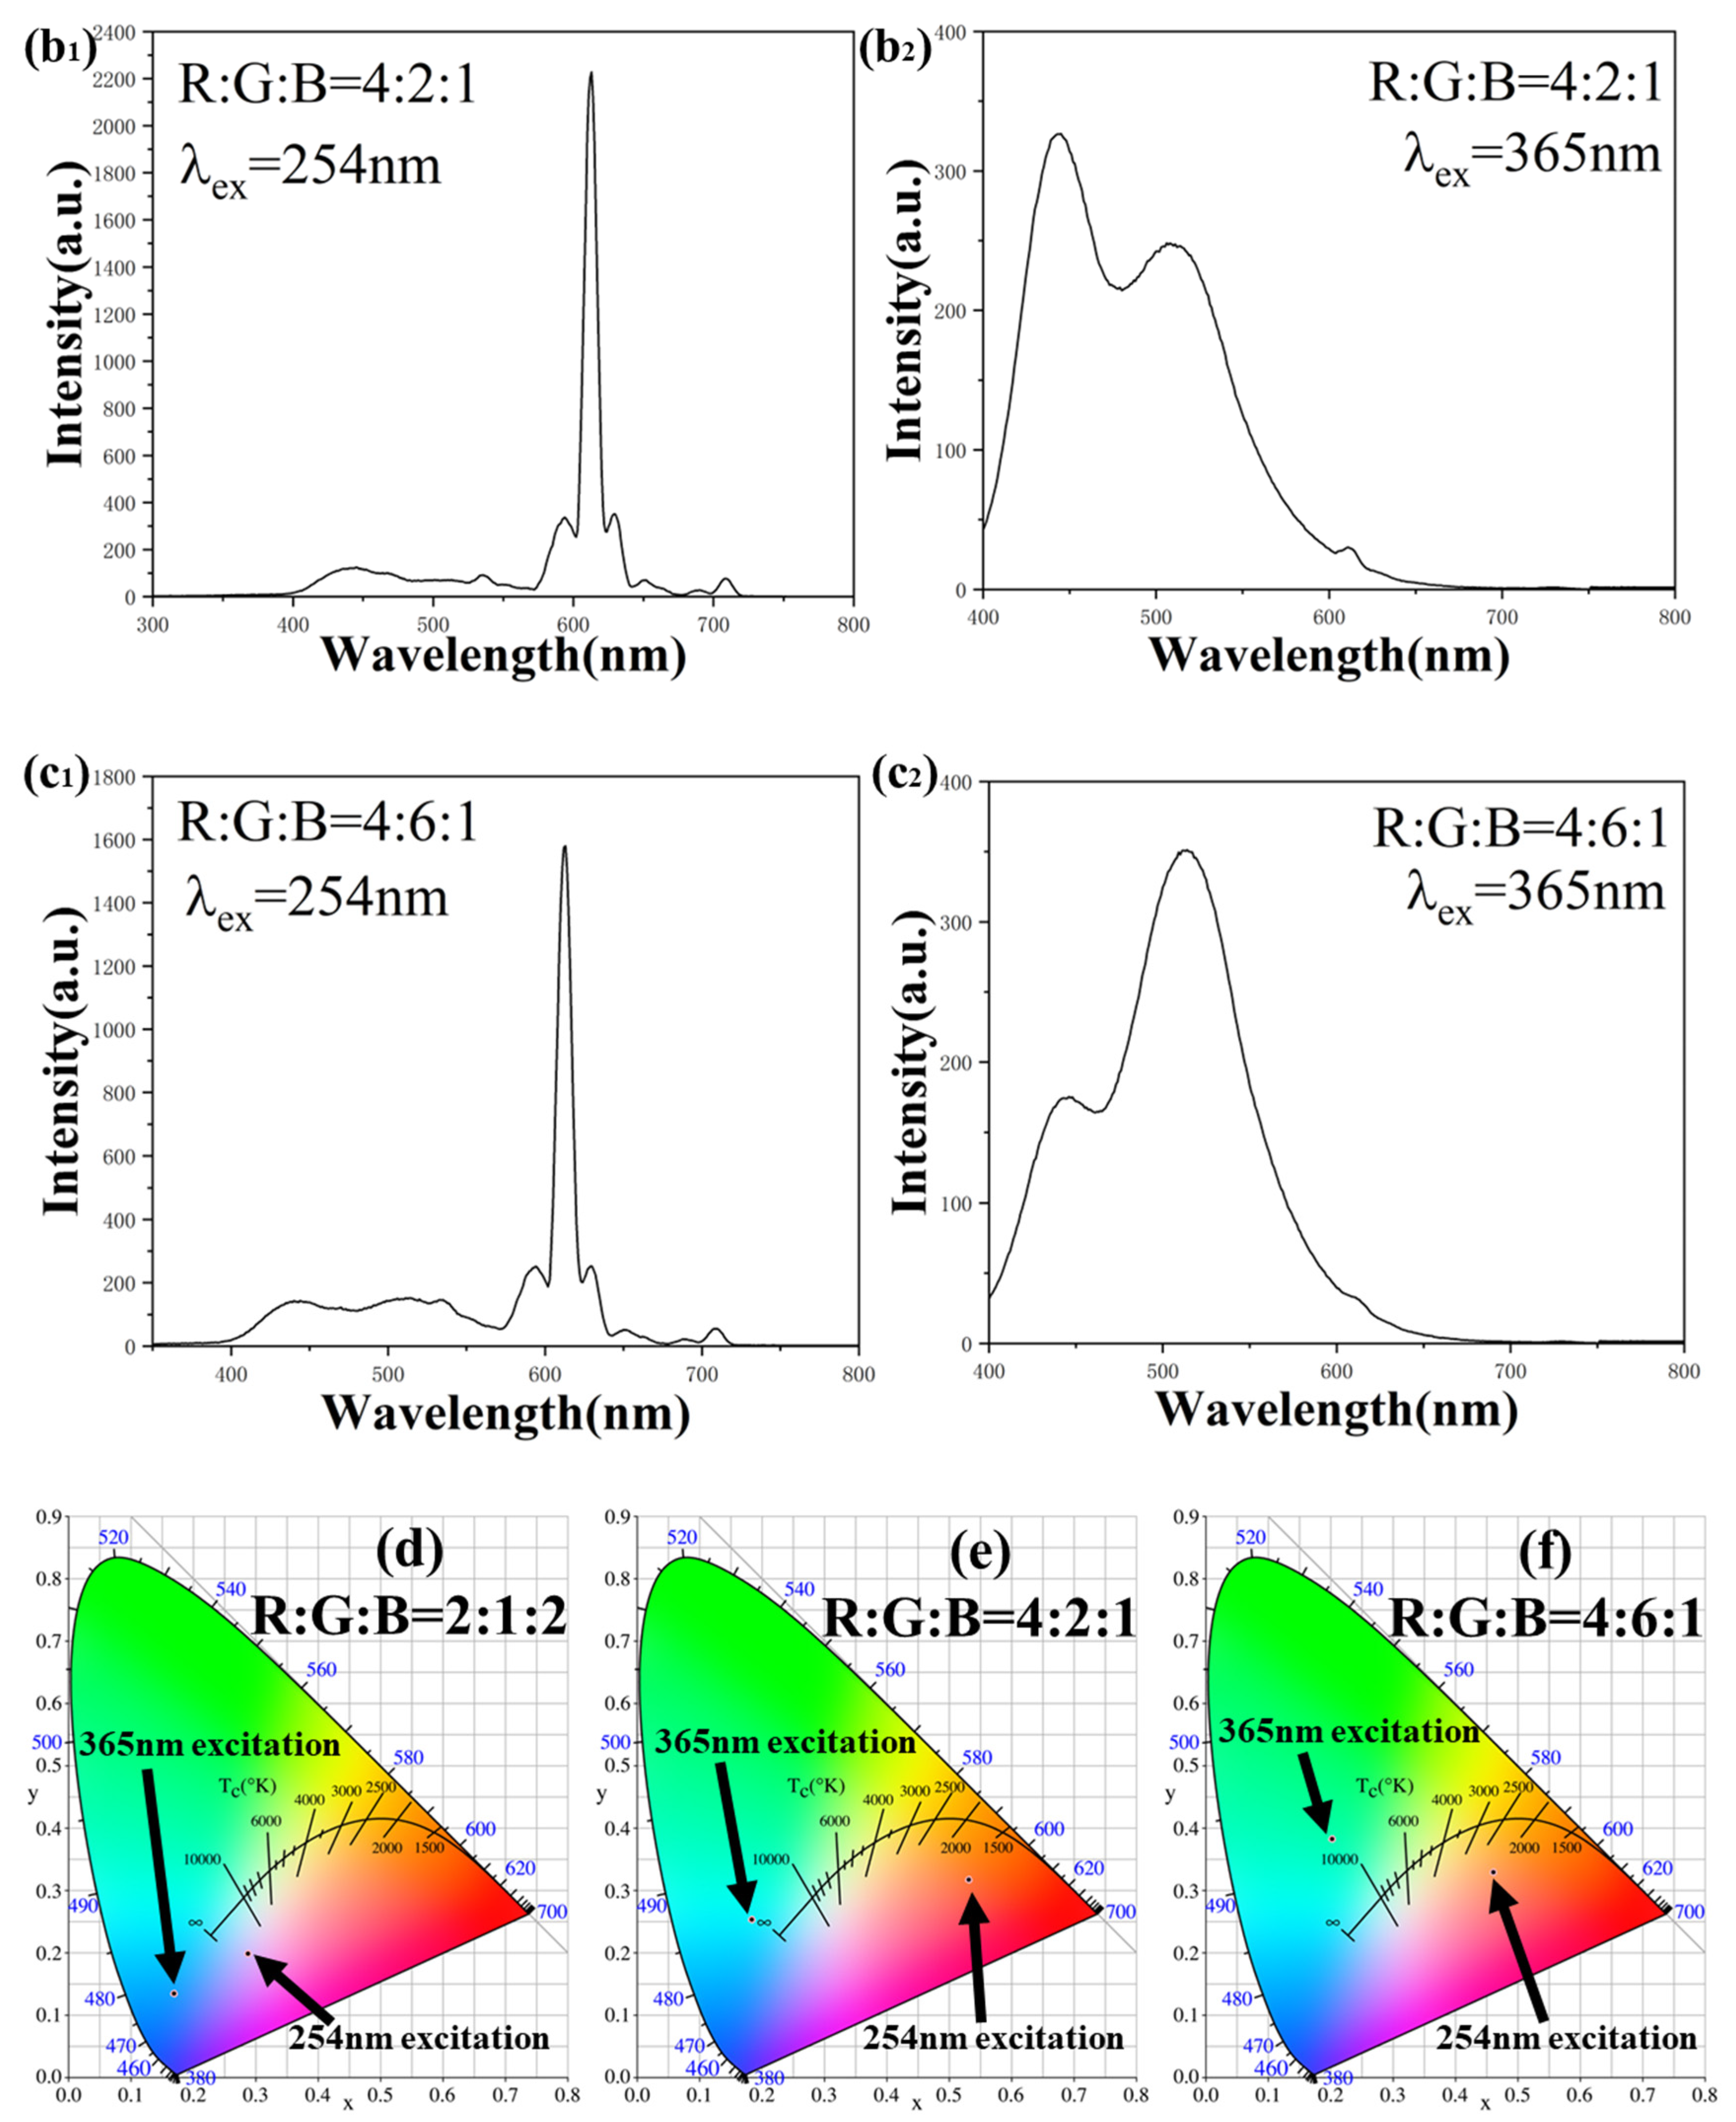
3.2. Photoluminescence and Persistent Luminescence of the Monochromatic Phosphors and Tricolor Mixed Phosphors

Under excitation at 251 nm, Ca2YNbO6:0.4Eu3+ exhibited a strong emission peak at 613 nm and two weak emission peaks at 593 nm and 709 nm (Figure 4a1), which correspond to the Eu3+ ions transitions 5D07F2, 5D07F1 and 5D07F4, respectively [13]. Figure 4a2 shows the photoluminescence excitation spectra of the Ca2YNbO6:0.4Eu3+ red primary phosphor. Monitored at 613 nm, the PLE spectra range from 225 to 600 nm, with one broad excitation band in the range of 225–300 nm and two narrow excitation bands at around 395 nm and 468 nm. According to previous studies, the broad excitation band appearing in the range of 225–300 nm may be produced by the transition of the Eu3+-O2– charge transfer band (CTB), and the narrow bands located at 395 nm and 468 nm correspond to the 7F05L6 and 7F05D2 transitions of the Eu3+ ions, respectively [14].
The PL spectrum excited at 361 nm of the SrAl2O4:0.01Eu2+, 0.02Dy3+ green primary phosphor (Figure 4b1) shows a wide band from 450 to 650 nm and a peak at 514 nm. This emission peak is attributed to the 4f65d1–4f7 (8S7/2) transition of Eu2+, indicating that Eu3+ can be effectively reduced into Eu2+ in a hydrogen atmosphere and the Eu2+ ions are the luminescence centers for the phosphorescence. The PLE spectrum of the SrAl2O4:0.01Eu2+, 0.02Dy3+ green primary phosphor monitored at 514 nm (Figure 4b2) exhibits a very strong excitation band from 240 to 470 nm with a peak at 361 nm, which may be produced by the 4f65d1–4f7 (8S7/2) transition of the Eu2+ ions [15]. Figure 4d shows the afterglow decay curves for the SrAl2O4:0.01Eu2+, 0.02Dy3+ sample after 254 nm UV light illumination for 5 min at room temperature. In around thirty minutes, the afterglow monitored at 514 nm had a high intensity, and attenuation took place quickly. The attenuation speed gradually slowed down by the late period. However, an intense afterglow can last longer than 1 h. According to previous studies, it may be concluded that the doped Dy3+ induced a more intense afterglow at the first period of 0–2000 s, but a weaker afterglow signal still can be found in the late period even after 1 h [16].
The PL spectrum excited at 326 nm of the CaAl2O4:0.012Eu2+, 0.06Nd3+, 0.036Gd3+ blue primary phosphor (Figure 4c1) shows a wide band from 400 to 525 nm, with its maximum intensity at 444 nm. This emission peak may be attributed to the 4f65d1–4f7 transition of Eu2+, and the wide emission band from 400 nm to 525 nm may be attributed to the concentrated vibration from the host lattice, inducing the original discrete state of the 4f65d hybrid orbital to be transformed into a continuous state [17]. Additionally, the characteristic emissions of Nd3+ and Gd3+ were not detected. This may be attributed to the inhibiting effect of Eu2+. The characteristic emissions of Nd3+ and Gd3+ were absorbed by the electronic transition of Eu2+ and transformed into energy for the characteristic emissions of Eu2+. However, the electrons that were excited by UV light but fell into the electron traps of Nd3+ and Gd3+ still remained in the traps due to the lack of energy for them to escape from the electron traps. The PLE spectrum of the CaAl2O4:0.012Eu2+, 0.06Nd3+, 0.036Gd3+ blue primary phosphor monitored at 444 nm (Figure 4c2) exhibits a wide excitation band from 235 to 415 nm, with two peaks at 269 nm and 326 nm. The peak at 269 nm could be attributed to the charge transition of Eu2+-O2−, while the peak at 326 nm is associated with the specific 4f-5d emission of Eu2+ in CaAl2O4. Figure 4e shows the afterglow decay curves for the CaAl2O4:0.012Eu2+, 0.06Nd3+, 0.036Gd3+ sample after 254 nm UV light illumination for 5 min at room temperature. In around twenty minutes, the afterglow monitored at 444 nm had a high intensity and attenuated fast. Approximately twenty minutes later, the attenuation speed gradually slowed down. However, an intense afterglow can last longer than half an hour. According to the previous research, the long-duration afterglow process for CaAl2O4:0.012Eu2+, 0.06Nd3+, 0.036Gd3+ is dominated by the recombination process of the electrons, which are thermally released from the electron traps. The electrons from the ground state can be pumped into the excitation state and be captured in the electron traps under light excitation. Then, the excited electrons can move to the ground state and produce emissions. After removing the excitation source, the electrons in the traps jump to the excitation state 4f65d1 through the CB and back to the ground state 4f7 (8S7/2) [18], leading to the output of a long afterglow. Additionally, the doping of Nd3+ not only increases the density of the trap but also introduces deeper electron traps [19,20], so the trap energy levels can capture more electrons and extend the average time of the afterglow [21].
Figure 4f–h show the corresponding CIE coordinates of Ca2YNbO6:0.4Eu3+, SrAl2O4:0.01Eu2+, 0.02Dy3+ and CaAl2O4:0.012Eu2+, 0.06Nd3+, 0.036Gd3+ under their optimal excitation wavelengths. It is obvious that the red, green and blue phosphors all performed well.
Based on the characteristics of the three primary color phosphors, three proportions of mixed fluorescent powder were selected (R:G:B = 2:1:2, R:G:B = 4:2:1, R:G:B = 4:6:1). Figure 5a1,b1,c1 show the PL spectra of the different proportions of the mixed phosphors excited by 254 nm UV light, and Figure 5a2,b2,c2 show the PL spectra excited by 365 nm UV light. It can be seen that the PL spectra of the different proportions of the mixed phosphors match well with the PL spectra of the monochromatic phosphors. Figure 5d–f show the corresponding CIE coordinates of the mixed phosphors (R:G:B = 2:1:2, R:G:B = 4:2:1, R:G:B = 4:6:1, respectively) under excitations of 254 nm and 365 nm. The proportions of the three monochromatic phosphors induced the emission color of the mixed phosphors to shift to their corresponding colors; however, the impacts of the three primary color phosphors on the mixed fluorescent powder varied at different excitation wavelengths. The proportion of the red phosphor had a more significant impact on the emission light of the mixed phosphors under UV excitation at 254 nm, and the impact on the emission color of the mixed phosphors of the proportion of the green phosphor was stronger under UV excitation at 365 nm, while the blue phosphor had a weaker but more balanced impact under UV excitation at 254 nm and 365 nm. This difference is mainly because the optimal excitation wavelength of red phosphor (251 nm) is much closer to 254 nm UV light, and the optimal excitation wavelength of green phosphor (361 nm) is much closer to 365 nm UV light, while the optimal excitation wavelength of blue phosphor (326 nm) is between the two. Thus, as shown in Figure 5g1, without the excitation light, the three proportions of the mixed phosphors appeared white under natural light. Under UV excitation at 254 nm, the 212 mixed phosphor emitted pink light. With a decrease in the proportion of the blue phosphor and an increase in the proportion of the green and red phosphors, the 421 mixed phosphor emitted red light. Increasing the proportion of the green phosphor continuously induced a shift in the emission color from red to orange, and the 461 mixed phosphor emitted an orange-yellow color. Additionally, as shown in Figure 5g2, under 365 nm UV light, the 212 mixed phosphor emitted blue light, and the 421 mixed phosphor emitted cyan light. With an increase in the proportion of the green phosphor, the emission color shifted from cyan to green, resulting in the 461 mixed phosphor emitting green light. Meanwhile, the proportions of the mixed phosphors also influence the afterglow performance. As previously known, green phosphor and blue phosphor have long afterglow characteristics, with green phosphor exhibiting a longer afterglow duration than blue phosphor. Thus, with an increase in the proportion of the green phosphor, the 212, 421 and 461 mixed phosphors emitted blue, cyan and green light, respectively, after being excited by 254 nm UV light. Additionally, the afterglow of both the 421 and 461 mixed phosphors lasted more than 5 min, significantly longer than that of the 212 mixed phosphor (no more than 2 min). This is mainly because the 421 and 461 mixed phosphors have similar proportions of green phosphor, which are much larger than that of the 212 mixed phosphor. Meanwhile, as mentioned before, the optimal excitation wavelength of green phosphor (361 nm) is much closer to the 365 nm UV light. Thus, after being excited by the 365 nm UV light, the afterglow time of the 421 and 461 mixed phosphors became longer, lasting more than 7 min. Additionally, the color of the afterglow of the 421 mixed phosphor shifted from cyan to bright green. It can be concluded that with different proportions of the red, green and blue phosphors in the mixture, the luminescence behavior of the mixed phosphors varies. By increasing or decreasing any one or several of the red, green or blue phosphors, the luminescence behavior of the mixed phosphors can be converted into various colors, as manifested in the movement of the points in the CIE coordinates. In addition, due to the different long afterglow properties of the green and blue phosphors, the long afterglow of the mixed phosphors also showed changes with time. The afterglow of green phosphor lasts longer than that of blue phosphor. Thus, the afterglow color of the mixed phosphors tends to change to green over time, while with higher proportions of the blue phosphor, the color of the early afterglow tends to be closer to blue. In short, mixed phosphors with various proportions exhibit multi-mode luminescence behavior under different excitations and demonstrate obviously different afterglow phenomena, providing additional identity information.

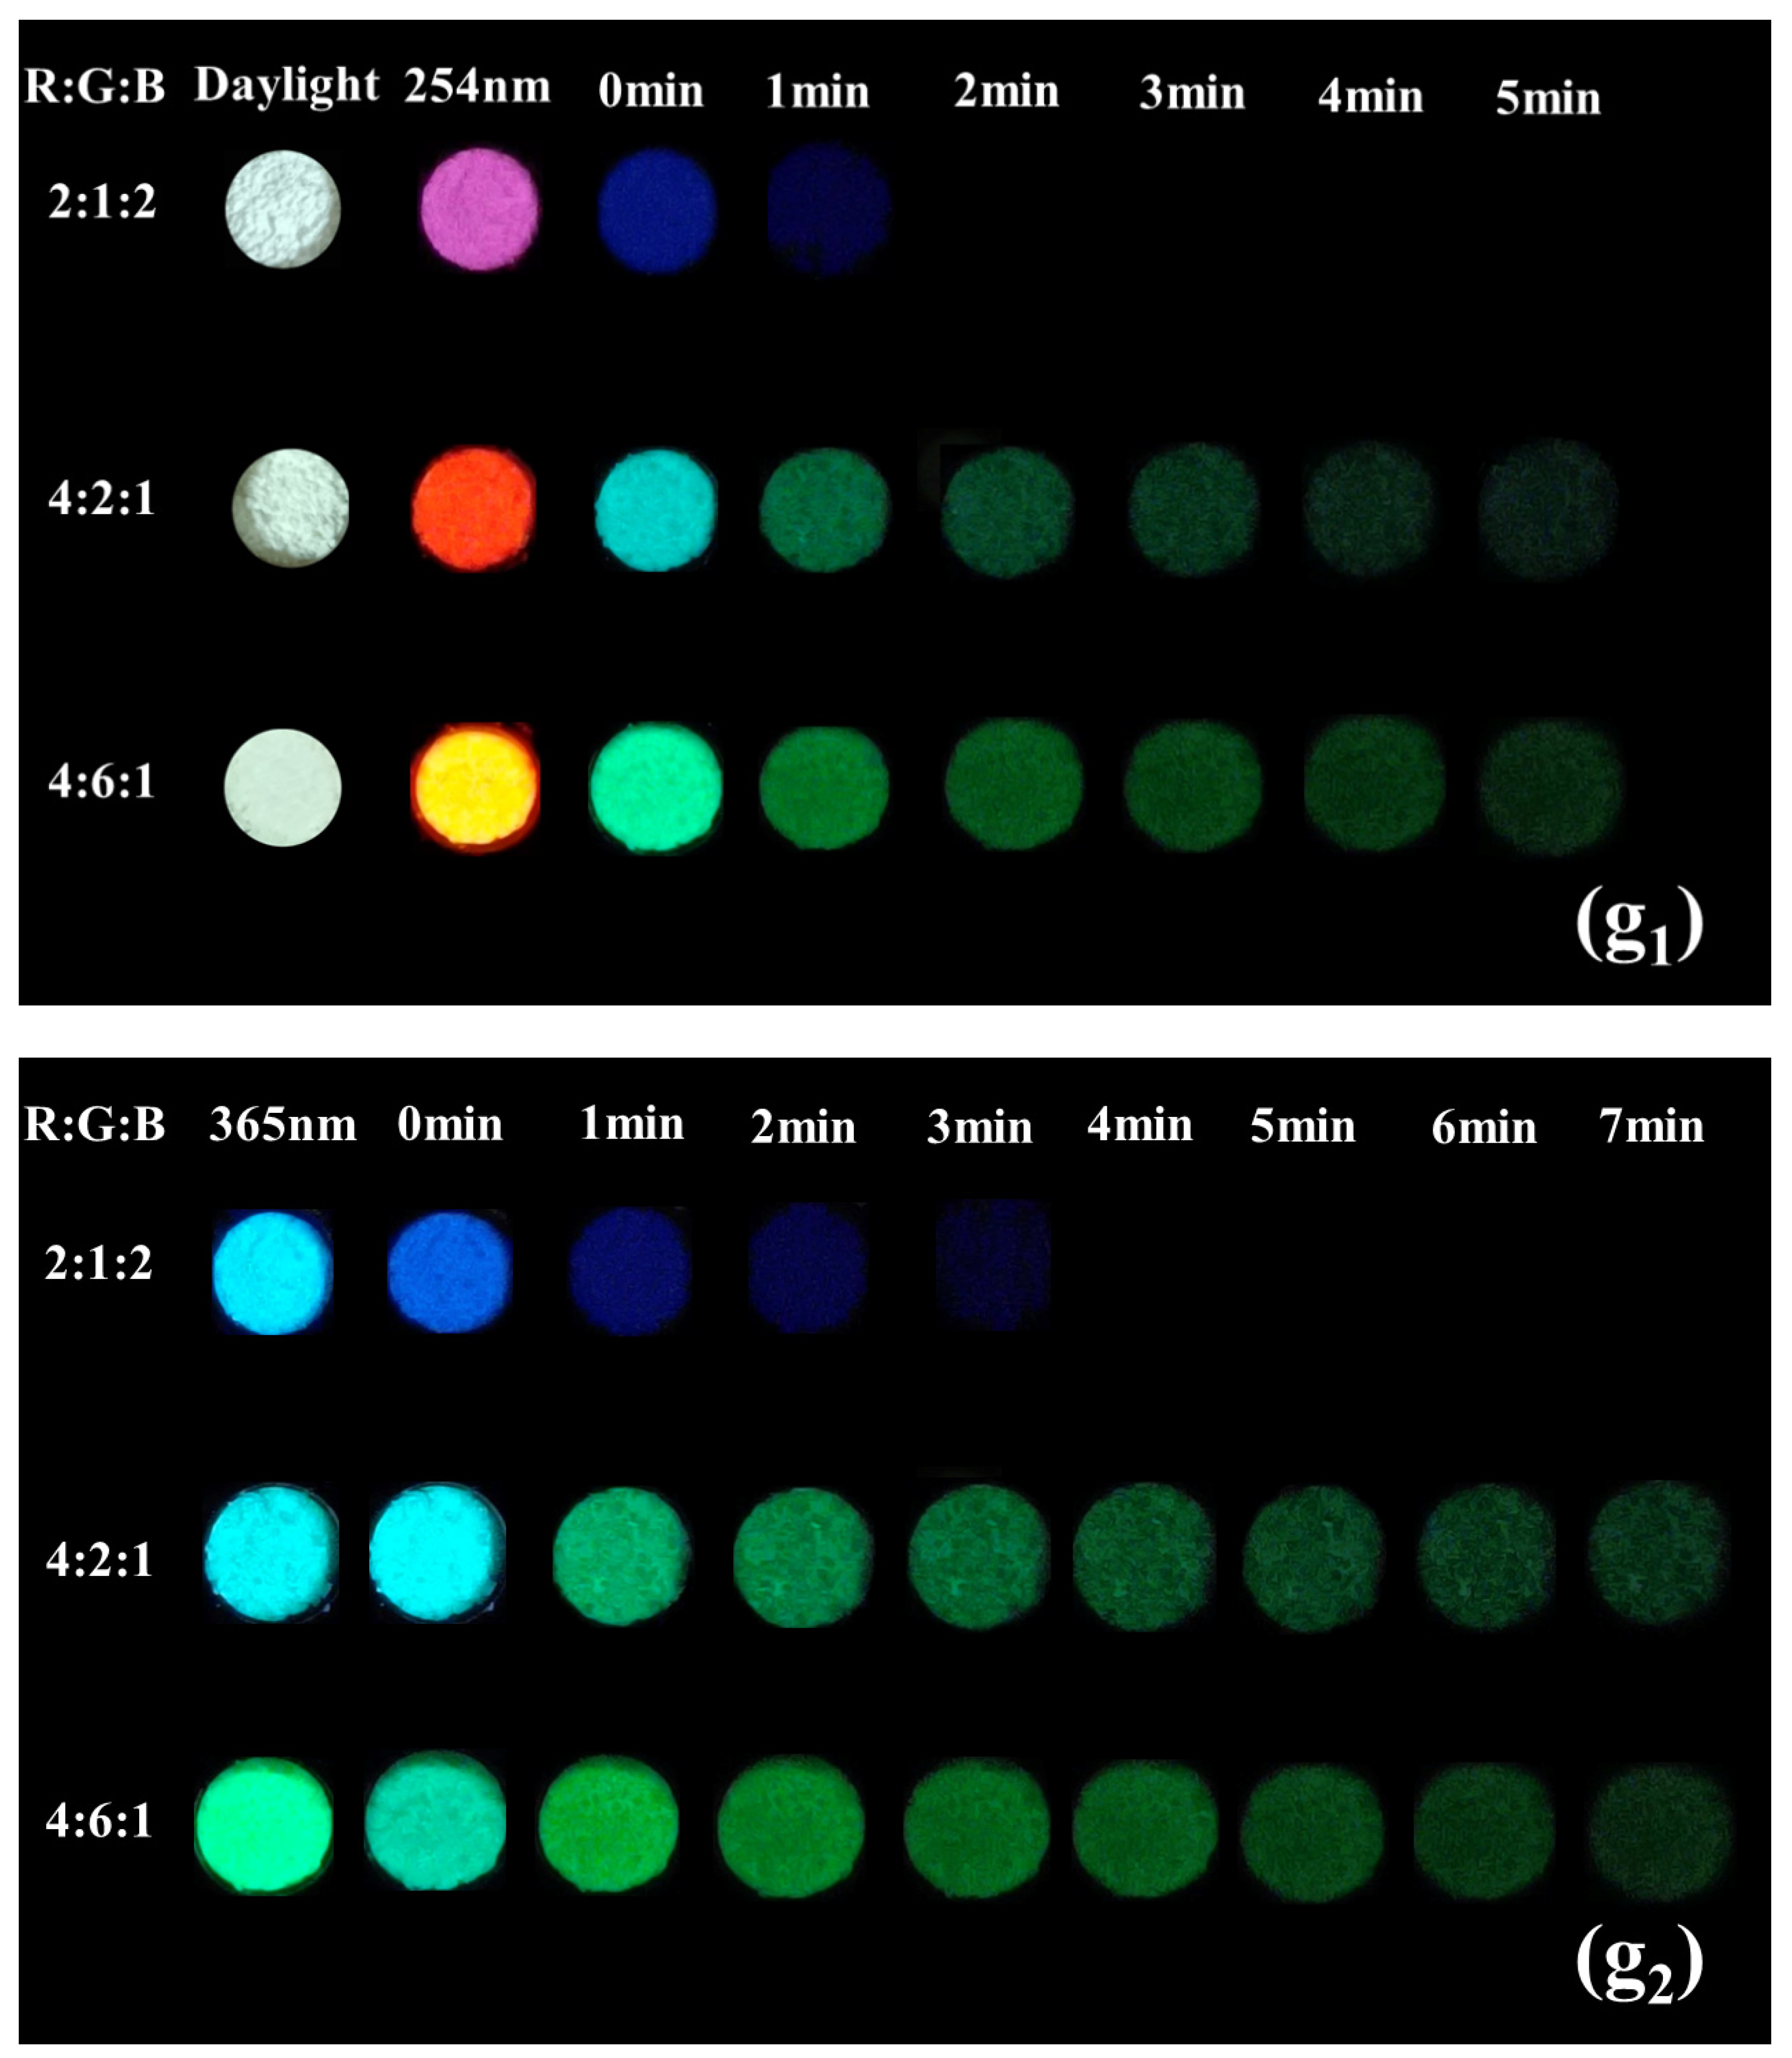
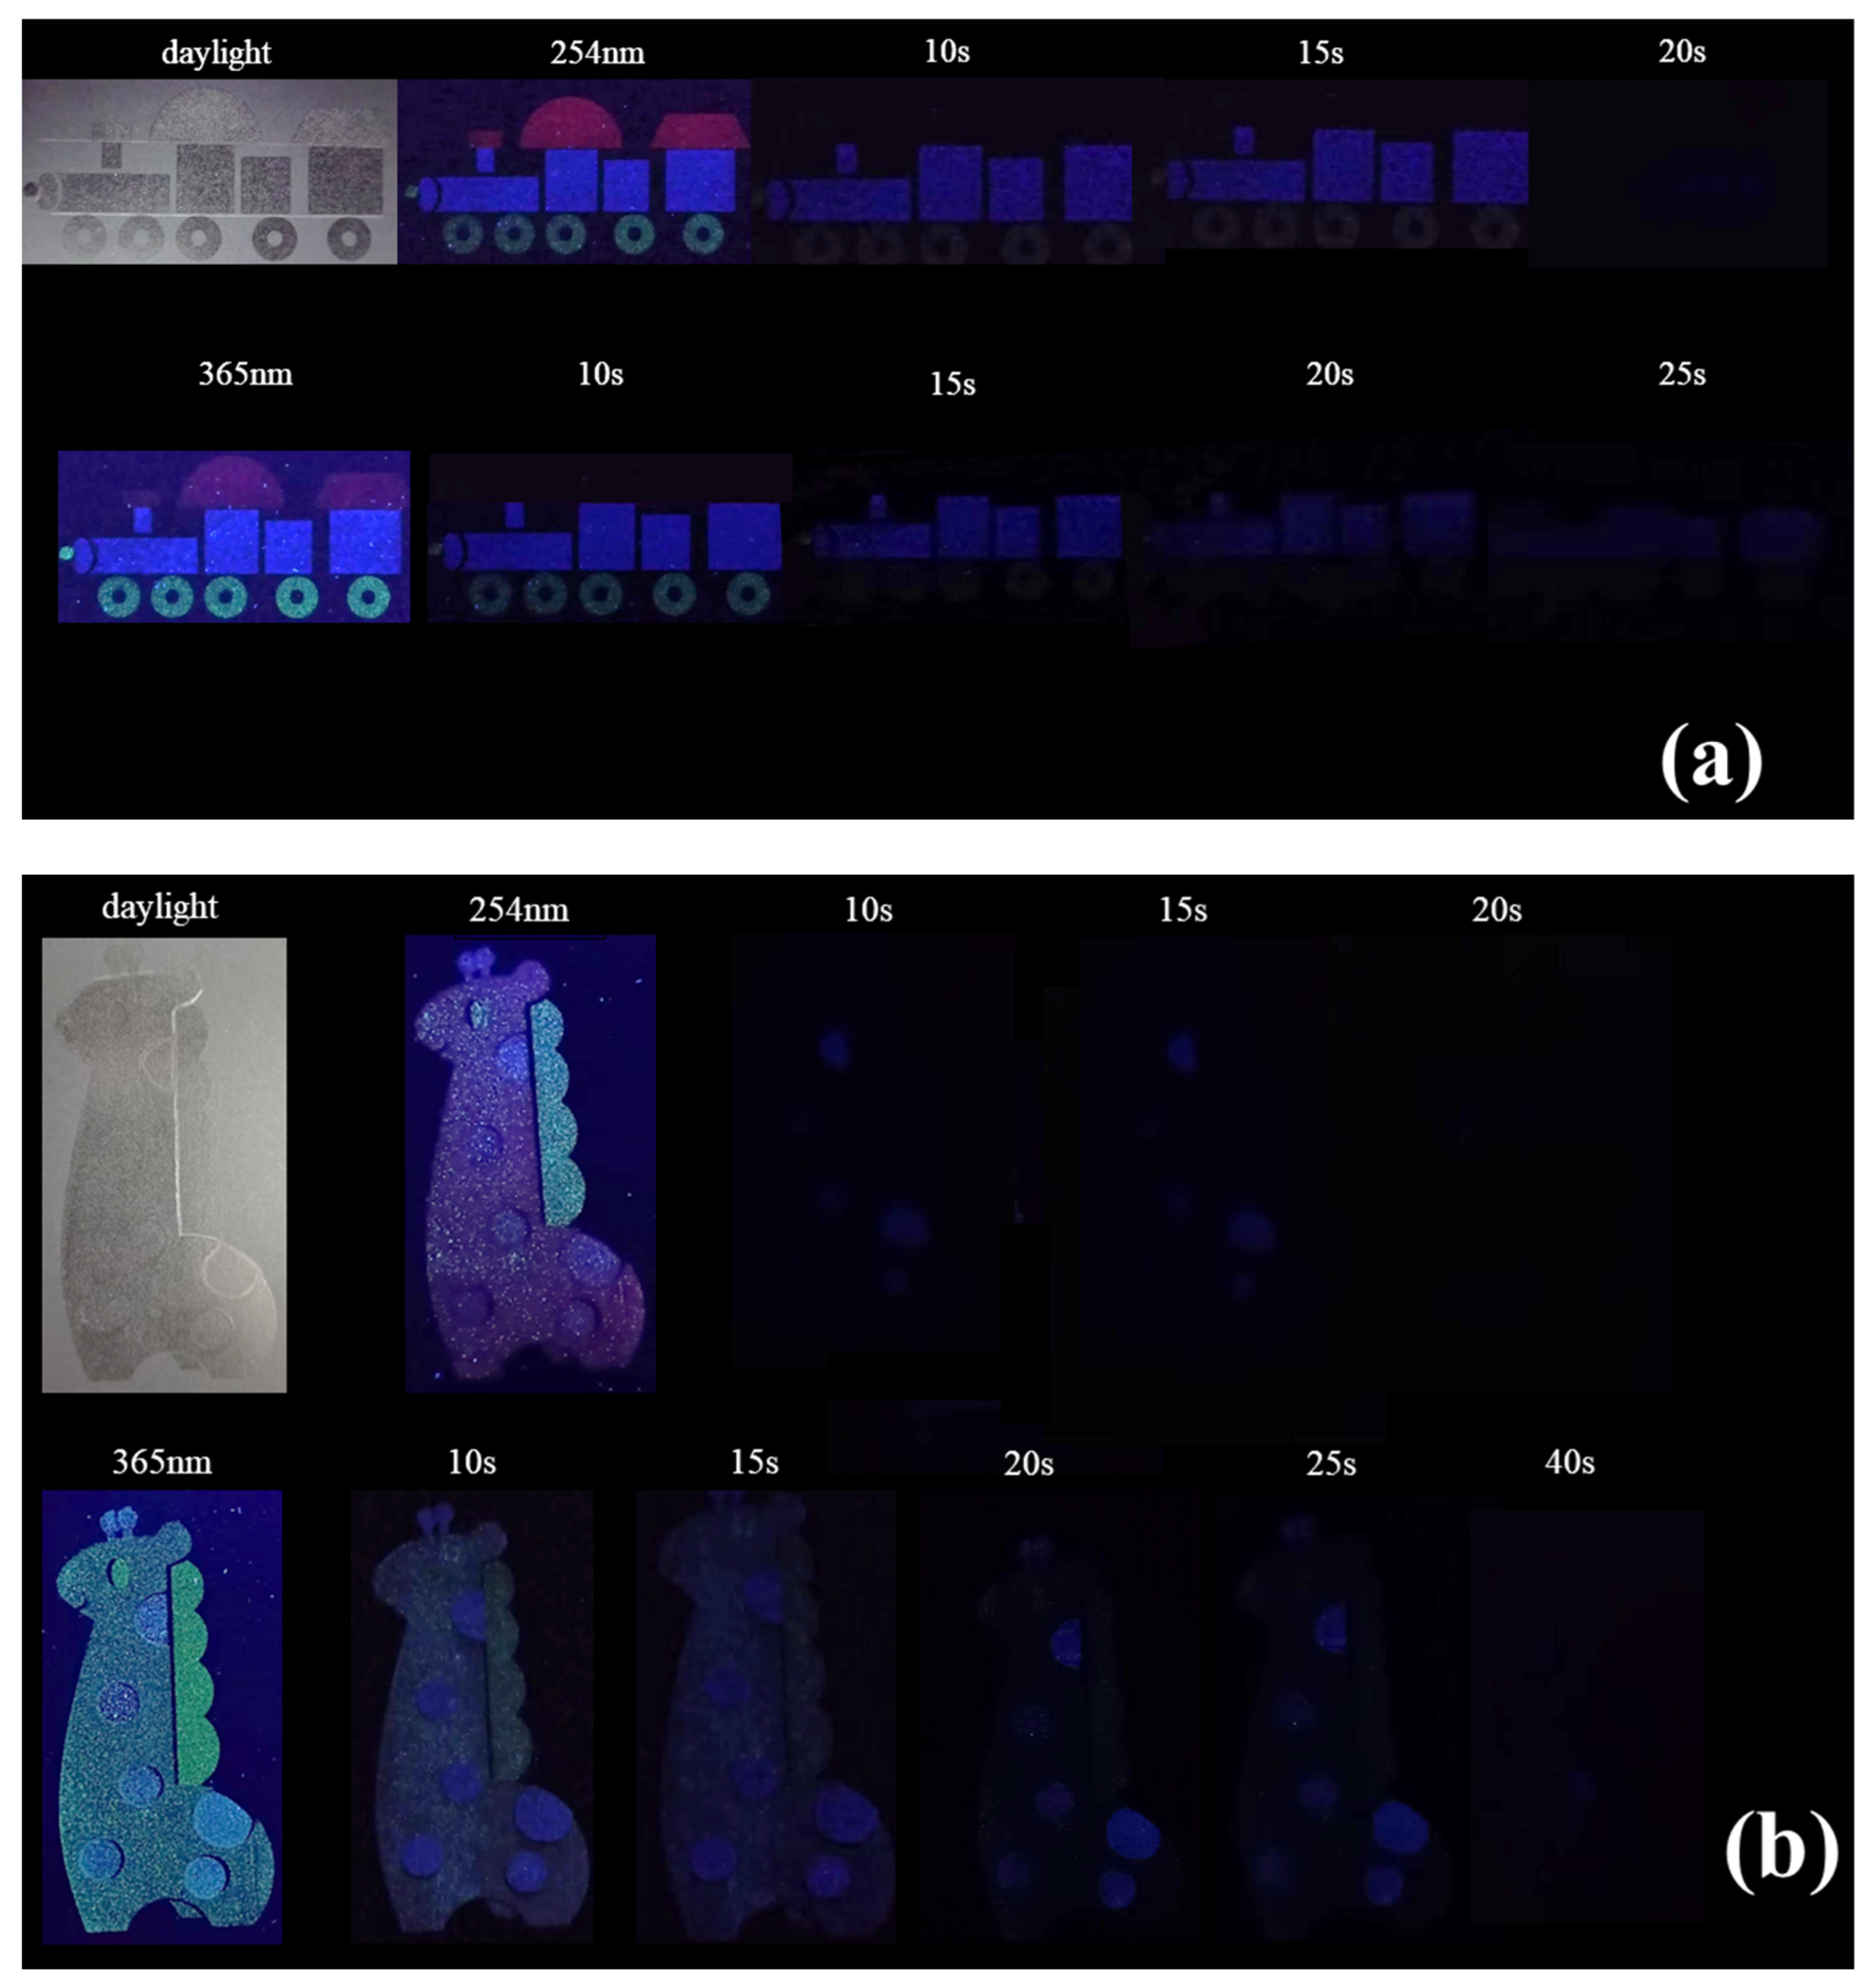
3.3. Application to Anti-Counterfeiting

Based on the research above, the mixed phosphors exhibited dynamic multi-mode luminescence under different test conditions and observation times, resulting in a homogeneous transparent luminescent ink being obtainable by blending the multi-mode phosphors with polyvinyl chloride. Figure 6 shows the appearances of the emissions and afterglow signals for the transparent luminescent inks. It can be observed that the 212, 421 and 461 inks presented as purple, pink and green, respectively, under 254 nm UV light and exhibited afterglow colors of blue, cyan and green. Additionally, the 212, 421 and 461 inks emitted blue, cyan and green light under UV excitation at 365 nm and showed afterglow colors of blue, cyan and green. These observations demonstrate a slight difference from the powder luminescence phenomenon, which may have been due to the influence of the polyvinyl chloride. Then, the prepared transparent luminescent inks were used to design and prepare a demonstration of multi-mode luminescent images for information encryption and anti-counterfeiting using screen-printing techniques.
Figure 7 shows the flow of the preparation and pattern printing of the transparent luminescent inks with different proportions of the mixed phosphors.
Figure 8a shows the appearance of the emissions and afterglow signals for the “Steam Train” pattern, which was printed using monochrome transparent luminescent ink onto black cardstock as a reference. For the “Steam Train” pattern, the train roofs were printed with red monochrome ink, the railway carriages were printed with blue monochrome ink and the train wheels were printed with green monochrome ink. Under UV excitation at 254 nm, every part of the “Steam Train”, including the red train roofs, blue railway carriages and green train wheels, could be clearly observed. When the 254 nm excitation source was removed, it could be observed that the red train roofs disappeared immediately, while the blue railway carriages and green train wheels remained visible for more than 15 s, indicating the characteristic of a long afterglow, which matches well with previous research. Additionally, under UV excitation at 365 nm, every part of the “Steam Train” showed similar colors to those in the results under excitation at 254 nm, but the afterglow of the green and blue ink lasted longer than the afterglow after their excitation using 254 nm UV light, mainly due to the optimal excitation wavelengths for green and blue phosphor being much closer to 365 nm UV light than 254 nm UV light. Obviously, with the monochrome transparent luminescent ink, the sample showed limited luminescent behavior, which was unsafe and easy to copy.
Figure 8b displays the appearance of the emissions and afterglow signals for the “Giraffe” pattern, which was printed with multi-mode transparent fluorescent ink onto black cardstock. The pattern presents four levels of security under different conditions, controlled by different proportions, excitation sources and durations. As shown in Figure 8b, under real-time excitation with 254 nm UV light, the different parts of the “Giraffe”, including its pink body (R:G:B = 4:2:1), purple spots and horns (R:G:B = 2:1:2) and green bristles and eyes (R:G:B = 4:6:1), could be distinguished by visual observation, representing the first level of security. When the 254 nm excitation source was removed, the red phosphor in the mixed phosphors ceased to emit light, while the afterglow of the green and blue phosphors persisted. It could be observed that the pink body and green bristles and eyes of the “Giraffe” quickly disappeared, but the blue afterglow of the spots and horns remained visible for more than 15 s, representing the second level of security. Then, under real-time excitation at 365 nm, every part of the “Giraffe” was a different color compared to the previous color scheme. The bristles and eyes of the “Giraffe” were green, the body were cyan and the spots and horns were blue. This can be deemed the third level of security. With the 365 nm excitation source removed, the body of the “Giraffe” showed an afterglow of a cyan color, which lasted for more than 20 s, significantly longer than the afterglow observed after excitation using 254 nm UV light. Additionally, the bristles and eyes of the “Giraffe” presented a green afterglow, which lasted for more than 15 s, while the spots and horns of the “Giraffe” displayed a blue afterglow, lasting more than 25 s. This can be considered the fourth level of security. Collectively, the results from the application confirmed that the prepared material exhibited multi-mode luminescent behavior, indicating its potential utility as an advanced anti-counterfeit material.

4. Conclusions

In this work, based on RGB building blocks, a type of excitation-wavelength- and time-dependent fluorescent ink for advanced anti-counterfeiting was developed. Red, green and blue phosphors were synthesized using the high-temperature solid-state method, and three proportions of the mixed phosphors were selected (R:G:B = 2:1:2, R:G:B = 4:2:1, R:G:B = 4:6:1), which were characterized using a series of techniques, including XRD, TEM, SAED, SEM, PLE/PL spectroscopy and analysis of their persistent luminescence decay curves. Subsequently, three proportions of fluorescent ink were created by blending the mixed phosphors with transparent screen-printing ink (commercially polyvinyl chloride). Upon UV excitation at 254 nm, the 212, 421 and 461 inks appeared purple, pink and green, respectively, and showed blue, cyan and green afterglows after the excitation source was removed. Under UV excitation at 365 nm, the 212, 421 and 461 inks emitted blue, cyan and green light. Upon the removal of the excitation source, the 212, 421 and 461 inks had blue, cyan and green afterglows, respectively. With different proportions of the mixed phosphors, the emission light and afterglow of the fluorescent inks exhibited diversity, demonstrating the characteristic of dynamic multi-mode luminescence depending on the time and excitation wavelength due to the different optimal excitation wavelengths and long afterglow properties of the different monochromatic phosphors. Owing to the excitation-wavelength- and time-dependent multi-mode luminescence of the prepared samples, they were applied in anti-counterfeiting patterns. The results indicated that the samples are potential fluorescent inks for information encryption and anti-counterfeiting purposes.

Author Contributions

C.L.: data curation, formal analysis, writing—original draft. C.K.: data curation, formal analysis, writing—original draft. X.H.: data curation, formal analysis. J.Y.: data curation, formal analysis. Q.Z.: resources, supervision, conceptualization, writing—review and editing, conceptualization. All authors have read and agreed to the published version of the manuscript.

Funding

This work was supported in part by the Fundamental Research Funds for the Central Universities (Grant N2302004) and the National Natural Science Foundation of China (Grant 52371057).

Institutional Review Board Statement

Not applicable.

Informed Consent Statement

Not applicable.

Data Availability Statement

Data available on request from the authors.

Conflicts of Interest

The authors declare no conflict of interest.

References

  1. Si, T.; Zhu, Q.; Sun, X.D.; Li, J.G. Co-doping Mn2+/Cr3+ in ZnGa2O4 to fabricate chameleon-like phosphors for multi-mode dynamic anti-counterfeiting. Chem. Eng. J. 2021, 426, 131744. [Google Scholar] [CrossRef]
  2. Fan, X.F.; Gu, L.Q.; Hu, Y.L.; Zhu, Q. Wearing an organic “coat” on nanocrystals of LaF3:Eu3+ to generate dynamic luminescence for optical anti-counterfeit. Adv. Powder Technol. 2021, 32, 2645–2653. [Google Scholar] [CrossRef]
  3. Li, L.; Li, Q.; Chu, J.G.; Xi, P.; Wang, C.H.; Liu, R.; Wang, X.Q.; Cheng, B.W. Dual-mode luminescent multilayer core-shell UCNPs@SiO2@TEuTbB nanospheres for high-level anti-counterfeiting and recognition of latent fingerprints. Appl. Surf. Sci. 2022, 581, 152395. [Google Scholar] [CrossRef]
  4. Zhang, J.W.; Wang, Z.J.; Liu, P.X.; Huo, X.X.; Wang, Y.; Suo, H.; Li, L.P.; Li, P.L. Dual-mode luminous and afterglow Ca3Al2Ge3O12:Yb3+, Er3+ phosphors for anti-counterfeiting and fingerprint verification. Ceram. Int. 2024, 50, 2436–2442. [Google Scholar] [CrossRef]
  5. Li, Y.X.; Chen, C.H.; Jin, M.K.; Xiang, J.M.; Tang, J.J.; Zhao, X.Q.; Zheng, J.M.; Guo, C.F. Multi-mode excited Cs2NaBiCl6 Based Double Perovskite Phosphor for Anti-counterfeiting. J. Lumin. 2022, 247, 118915. [Google Scholar] [CrossRef]
  6. Wu, Y.P.; Wu, M.; Yu, J.J.; Wang, Y.R.; Wang, J.L.; Xu, Y.W.; Zhang, Y.J. Trap engineering in ZnGa2O4:Tb3+ through Bi3+ doping for multi-modal luminescence and advanced anti-counterfeiting strategy. Ceram. Int. 2023, 49, 31607–31617. [Google Scholar] [CrossRef]
  7. Shi, Y.; Cui, R.; Gong, X.; Deng, C. A novel red phosphor Ca2YNbO6:Eu3+ for WLEDs. J. Biol. Chem. Lumin. 2022, 37, 1343–1351. [Google Scholar] [CrossRef] [PubMed]
  8. Yamamoto, H.; Matsuzawa, T. Mechanism of long phosphorescence of SrAl2O4:Eu2+, Dy3+ and CaAl2O4:Eu2+, Nd3+. J. Lumin. 1997, 72–74, 287–289. [Google Scholar] [CrossRef]
  9. Du, H.Y.; Li, G.S.; Su, J.Y. Preparation of Non-Grinding Long Afterglow SrAl2O4: Eu2+, Dy3+ Material by Microwave Combustion Method. J. Rare Earths 2007, 25, 19–22. [Google Scholar] [CrossRef]
  10. Feng, W.L. Preparation and luminescent properties of green SrAl2O4: Eu2+ and blue SrAl2O4: Eu2+, Gd3+ phosphors. Mater. Lett. 2013, 110, 91–93. [Google Scholar] [CrossRef]
  11. Zhang, Y.; Chen, J.; Xu, C.Y.; Li, Y.D.; Seo, H.J. Photoluminescence and abnormal reduction of Eu3+ ions in CaAl2O4:EU nanophosphors calcined in air atmosphere. Phys. B Condens. Matter 2015, 472, 6–10. [Google Scholar] [CrossRef]
  12. Zhang, M.X.; Li, F.F.; Lin, Y.C.; Li, Y.; Shen, Y. Enhanced afterglow performance of CaAl2O4:Eu2+, Nd3+ phosphors by co-doping Gd3+. J. Rare Earths 2021, 39, 930–937. [Google Scholar] [CrossRef]
  13. Yuan, G.F.; Cui, R.R.; Zhang, J.; Qi, X.S.; Deng, C.Y. A novel composite perovskite Ba3ZnNb2O9: Eu3+ orange red-emitting phosphor: Crystal structure, luminescence properties and high thermal stability. Optik 2021, 232, 166513. [Google Scholar] [CrossRef]
  14. Ha, M.G.; Jeong, J.S.; Han, K.R.; Kim, Y.; Yang, H.S.; Jeong, E.D.; Hong, K.S. Characterizations and optical properties of Sm3+-doped Sr2SiO4 phosphors. Ceram. Int. 2012, 38, 5521–5526. [Google Scholar] [CrossRef]
  15. Gencel, O.; Danish, A.; Yilmaz, M.; Erdogmus, E.; Sutcu, M.; Ozbakkaloglu, T.; Gholampour, A. Experimental evaluation of the luminescence performance of fired clay brick coated with SrAl2O4: Eu/Dy phosphor. Ceram. Int. 2022, 48, 33167–33176. [Google Scholar] [CrossRef]
  16. Matsuzawa, T.; Aoki, Y.; Takeuchi, N.; Murayama, Y. A new long phosphorescent phosphor with high brightness, SrAl2O4:Eu2+, Dy3+. J. Electrochem. Soc. 1996, 143, 2670. [Google Scholar] [CrossRef]
  17. Yu, Y.; Wang, J.; Wang, J.D.; Li, J.; Zhu, Y.N.; Li, X.Q.; Song, X.; Ge, M. Structural characterization and optical properties of long-lasting CaAl2O4: Eu2+, Dy3+ phosphors synthesized by microwave-assisted chemical co-precipitation. J. Rare Earths 2017, 35, 652–657. [Google Scholar] [CrossRef]
  18. Li, Y.; Wan, Y.P.; Huang, Y.L.; Wang, X.G.; Cheng, H.; Seo, H.J. Efficient blue luminescence of Mg3(BO3)F3:Eu2+ phosphor with peculiar 4f65d1→4f7(8S7/2) transition. Mater. Lett. 2016, 172, 23–26. [Google Scholar] [CrossRef]
  19. Lu, X.D.; Shu, W.G.; Fang, Q.; Yu, Q.M.; Xiong, X.Q. Roles of doping ions in persistent luminescence of SrAl2O4:Eu2+, RE3+ phosphors. J. Mater. Sci. 2007, 42, 6240–6245. [Google Scholar] [CrossRef]
  20. Qu, B.Y.; Zhang, B.; Wang, L.; Zhou, R.L.; Zeng, X.C. Mechanistic Study of the Persistent Luminescence of CaAl2O4:Eu, Nd. Chem. Mater. 2015, 27, 2195–2202. [Google Scholar] [CrossRef]
  21. Zhu, Y.N.; Ge, M.Q. Effect of y/x ratio on luminescence properties of xSrO·yAl2O3: Eu2+, Dy3+ luminous fiber. J. Rare Earths 2014, 32, 598–602. [Google Scholar] [CrossRef]
Figure 1. XRD patterns of Ca2YNbO6:0.4Eu3+ (a), SrAl2O4:0.01Eu2+, 0.02Dy3+ (b) and CaAl2O4:0.012Eu2+, 0.06Nd3+, 0.036Gd3+ (c).
Coatings 14 00506 g001
Figure 2. TEM images, corresponding HR-TEM images, SAED patterns of Ca2YNbO6:0.4Eu3+ (a1a3), SrAl2O4:0.01Eu2+, 0.02Dy3+ (b1b3) and CaAl2O4:0.012Eu2+, 0.06Nd3+, 0.036Gd3+ (c1c3).
Coatings 14 00506 g002
Figure 3. SEM micrographs and element mapping images of the tricolor mixed phosphors (R:G:B = 4:2:1).
Coatings 14 00506 g003
Figure 4. PL and PLE spectra of Ca2YNbO6:0.4Eu3+ (a1,a2), SrAl2O4:0.01Eu2+, 0.02Dy3+ (b1,b2) and CaAl2O4:0.012Eu2+, 0.06Nd3+, 0.036Gd3+ (c1,c2). Persistent luminescence decay curve of (d) SrAl2O4:0.01Eu2+, 0.02Dy3+ (monitored at 514 nm after 254 nm UV light illumination for 5 min) and (e) CaAl2O4:0.012Eu2+, 0.06Nd3+, 0.036Gd3+ (monitored at 444 nm after 254 nm UV light illumination for 5 min). The corresponding CIE coordinates of Ca2YNbO6:0.4Eu3+ (f), SrAl2O4:0.01Eu2+, 0.02Dy3+ (g) and CaAl2O4:0.012Eu2+, 0.06Nd3+, 0.036Gd3+ (h) under their optimal excitation wavelengths.
Coatings 14 00506 g004aCoatings 14 00506 g004b
Figure 5. PL spectra (a1,a2,b1,b2,c1,c2) of different proportions of mixed phosphors and the corresponding CIE coordinates (df) of mixed phosphors under 254 nm and 365 nm excitations. (g1,g2) Appearances of the emissions and afterglow signals for mixed phosphors.
Coatings 14 00506 g005aCoatings 14 00506 g005bCoatings 14 00506 g005c
Figure 6. Appearances of the emissions and afterglow signals for transparent luminescent inks.
Coatings 14 00506 g006
Figure 7. Flow chart of the preparation and pattern printing of transparent luminescent inks.
Coatings 14 00506 g007
Figure 8. Appearances of the emission sand afterglow signals for the “Steam Train” pattern printed with monochrome transparent luminescent ink onto commercial paper (a) and the “Giraffe” pattern printed with multi-mode transparent fluorescent ink onto commercial paper (b).
Coatings 14 00506 g008
Disclaimer/Publisher’s Note: The statements, opinions and data contained in all publications are solely those of the individual author(s) and contributor(s) and not of MDPI and/or the editor(s). MDPI and/or the editor(s) disclaim responsibility for any injury to people or property resulting from any ideas, methods, instructions or products referred to in the content.

