Abstract
Porosity poses a challenge to the mechanical properties of cold sprayed coatings, especially when it is open or surface-connected, limiting the coatings’ capabilities to act as a barrier. The porosity formation is dependent on the feedstock powder characteristics and the cold spray process parameters. We present a machine learning-based approach to predict porosity based on the above-mentioned factors. Nine different machine learning models based on linear regression (LR), decision trees, random forests, gradient boosting, support vector machine (SVM), and neural networks were explored. Considering the excellent properties of high entropy alloys, Cantor alloy was taken as the consumable. Our dataset, derived from the literature and experiments, identified SVM with a linear kernel and LR as the top-performing models based on the Pearson correlation coefficient (PCC) and root mean square error, where the PCC values exceeded 0.8. The SHapley Additive exPlanations method helped in identifying that the type of gas and powder are the top two factors in pore formation.
1. Introduction
Cold spray (CS) is a solid-state materials deposition process that has attracted attention due to its relatively low operating temperatures [1]. CS can be used for depositing protective coatings [2], as well as for depositing bulk components [3]. The deposition is made by accelerating micron-sized powder to supersonic velocities with the help of a pressurised and hot gas, expanding through a de Laval (converging-diverging) nozzle [4]. The high-velocity particles bond cohesively or adhesively due to severe plastic deformation upon impact [5]. In the process of deposition, porosity may form due to geometrical effects at the particle/particle interfaces, called interface porosities, and due to variations in the number density of particles in the gas flow, called stack porosities [6]. These porosities are detrimental to the mechanical properties and corrosion mitigation behaviour of the deposited coating [7]. The formation of porosity is affected by powder characteristics (powder morphology and size), and CS process parameters (gas temperature, gas pressure, stand-off distance, etc.) [8,9]. Hence, the prediction of porosity as a function of the powder characteristics and process parameters becomes important to avoid any premature failure and to optimise the process parameters.
High entropy alloys (HEA) have been recently getting a lot of attention due to their attractive properties compared to conventional alloys [10,11]. The first few publications on high entropy alloys date back to 2004 [12,13], where the alloy reported by Cantor et al. [13], with the composition of Fe20Cr20Mn20Ni20Co20, has been called Cantor alloy. Several studies [14,15,16,17,18,19,20] have deposited Cantor alloy using the CS process. Akisin et al. [14] provided an understanding of the deformation behaviour and the microstructure development for Cantor alloy during cold spraying. Ahn et al. [15] performed heat treatments on the Cantor alloy coatings to understand the microstructure development and its impact on the nano-indentation hardness. Xu et al. [16] understood the high-temperature (700–900 °C) oxidation behaviour of Cantor alloy deposited using the CS process. Silvello et al. [17] optimised the deposition efficiency and the porosity for Cantor alloy coatings deposited via the CS process, via the trial and error method. They also understood the corrosion and erosion behaviour of the optimised coatings. Cavaliere et al. [18] measured the hardness and the residual stress profiles for Cantor alloy coatings. They also understood the cyclic deformation behaviour of the coatings. Feng et al. [19] also reported the influence of heat treatments on the microstructure and the mechanical properties so that the thermal stability of Cantor alloy coatings could be understood. Wu et al. [20] optimised the deposition window for cold spray additive manufacturing via the trial and error method. Although much work has been done to understand the evolution of microstructure and mechanical properties for CS deposits, and some work has considered parameter optimisation via the trial and error method, there is a need for a framework that can account for the CS deposition of HEAs and can predict porosity without spending much cost on experimentation.
Machine learning (ML) has been previously used to perform optimisation and prediction tasks, e.g., Yang et al. [21] used ML to design high entropy-based alloy compositions and Sai et al. [22] predicted the fatigue life for multi-principal element alloys. ML is especially attractive due to its ability to identify patterns and relationships in the data that may not be immediately evident [23]. There are several ML approaches—such as probabilistic modelling, decision trees (DT), random forests (RF), gradient boosting (GBOOST) machines, Kernal methods, and neural networks—that can be used to analyse the data at hand [24]. Roy et al. [25] used different ML approaches to predict porosity in different alloys such as Al, Ti, Ni, and steel for CS deposition. Liu et al. [26] used artificial neural networks (ANN) to predict the porosity development in Cr3C2–25NiCr coating. No such approach was found in the literature for CS deposition of high entropy alloys. Hence, we have used different ML models, based on linear regression (LR), DT, RF, GBOOST, extreme GBOOST (XGBOOST), support vector machine regression (SVR/SVM), and ANN, to predict the porosity during CS deposition of Cantor alloy.
In LR, a linear relationship is obtained between the features and the output variables by using the least square method. Here, the sum of the difference between actual and predicted values is minimised. The DT learning method generates the model in the form of a tree. Each node in the DT model represents a feature variable. The output is predicted based on the feature variables. The output is predicted by tracing the path that starts from the root and is guided by the values of the feature variables. The RF is an ensemble algorithm where large numbers of decision trees are combined. The large number of trees are combined in the RF model so that each tree can be trained enough such that each feature contributes to the number of models. The output is predicted by averaging the output from individual trees. GBOOST is also an ensemble algorithm. In GBOOST models, the weak learners are converted into strong learners. The model is trained to minimise the loss function of the previous model using gradient descent. During every iteration, the algorithm computes the gradient loss for the predictions from the current model and then trains the weak model to minimise the gradient loss. The obtained predictions from the new model are then added to the ensemble. This process is repeated until the required criteria are achieved. XGBOOST is an advanced version of the GBOOST models. The trees here are called the XGBOOST trees, not the DTs. XGBOOST is known to improve execution speed and model performance. In SVM models, the closest fitted line or the hyperplane is figured out in a way that the hyperplane has the maximum number of support vectors across it. A support vector refers to the data point that is closest to the hyperplane. The SVM models use kernels such as linear, polynomial, and radial basis functions, which can bring linearity and non-linearity into the model. The artificial neural networks are inspired by the human brain. The ANNs consist of very well-connected nodes that are arranged in different layers. The input data passes through the nodes in the hidden layer to predict the output. The activation functions are used to figure out which node to fire up for feature extraction. The weights in the models are adjusted to minimise the loss function via the gradient descent approach before the final output is achieved. The current work employs the SHapley Additive exPlanations (SHAP) method to elucidate the key factors influencing porosity formation, advancing our understanding of the relationship between process parameters and coating quality. The focus on high entropy alloy (HEA) coatings underscores the potential of machine learning in optimizing HEA-based coatings by mitigating porosity.
Optimising cold spray parameters to control porosity can lead to the development of tailored coatings with specific properties for various industrial applications. For instance, in corrosion protection applications, coatings with minimal surface-connected porosity are highly desirable as they provide an effective barrier against corrosive media [27]. By utilising machine learning algorithms to predict and control porosity formation, manufacturers can produce coatings with superior corrosion resistance, thereby extending the lifespan of critical components in infrastructure, transportation, and marine industries [28]. Moreover, engineered porosity in coatings can also be advantageous in catalytic applications [29]. By strategically introducing controlled porosity, the active surface area of catalytic coatings can be increased, leading to enhanced catalytic performance. This has wide-ranging implications across industries such as automotive, chemical processing, and environmental remediation, where catalytic coatings play a pivotal role in promoting efficient chemical reactions for emissions control, pollution abatement, and energy conversion.
The ability to accurately predict porosity formation based on CS parameters and feedstock characteristics has broader implications for advanced materials research and development. By leveraging machine learning techniques, researchers and manufacturers can expedite the discovery and optimisation of novel coating materials with tailored properties, leading to innovations in areas such as wear resistance, thermal insulation, and electrical conductivity.
2. Methods
2.1. Data Collection
Some of the data points in the dataset, used in this work, were collected from the literature [14,15,16,17,19,20]. Only 22 data points could be found in the literature on the CS deposition of Cantor alloy. A total of 13 data points were collected through experimental work. Therefore, in total, the final dataset contained 35 data points. The complete dataset is presented in Table 1. Each data point contained five input features: 1. gas temperature (T, in °C), 2. gas pressure (P, in MPa), 3. type of gas (G, as He and N2), 4. type of powder (Pdr, as gas atomised (GA) and mechanically alloyed (MA)), and 5. stand-off distance (D, in mm). Porosity (in %) was considered as the target or the output variable for all the ML algorithms. The distribution of data can be seen in Figure 1.

Table 1.
The complete dataset used in this work to predict the porosity, using ML models, for depositing the Cantor alloy using the cold spray process.
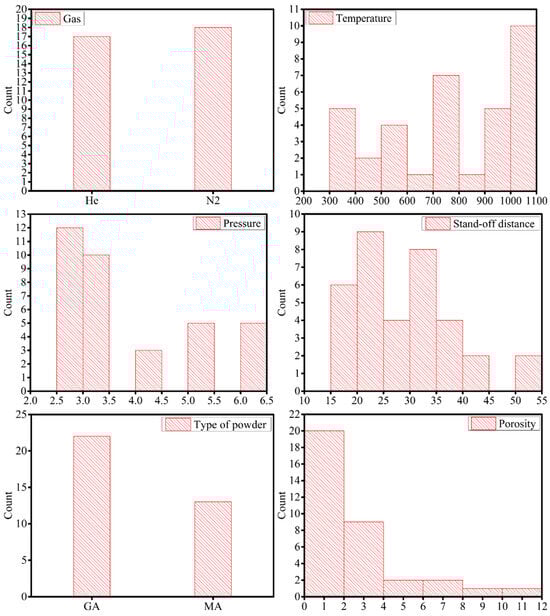
Figure 1.
The distribution of the input features (type of gas, gas temperature, gas pressure, stand-off distance, and type of powder), and the distribution of target or the output variable—which is porosity here.
The experimental work on CS deposition of Cantor alloy was carried out using the Impact Innovation GmbH 5/11 CS system, where the CS gun was manipulated with the help of an OTC robotic FD-V50 6-axis robot. The deposition was made on small steel (S275) coupons with the dimensions of 30 mm × 30 mm × 5 mm. The porosity was calculated from the optical micrographs using the ImageJ software [30] as per ASTM E2109. The porosity values, for the experimental data presented in Table 1, are the average values from 10 optical micrographs. Image thresholding was performed in ImageJ to highlight the pores, and then the area fraction was calculated. This area fraction here is called porosity. The process parameters for the experimental work were chosen in a way that a new combination of parameters could be developed compared to what was available in the literature. This is useful for creating a better data distribution for the ML models. All the experimental process parameters and the porosity values are presented in Table 1.
2.2. Machine Learning
We used different ML models, based on LR, DT, RF, GBOOST, XGBOOST, SVR, and ANN, to predict the porosity. Different kernels, such as linear (lin), polynomial (poly), and radial basis function (rbf), in the SVR algorithms, were tried in this work to bring the linearity and non-linearity into the model. The architecture of the ANN model was decided based on the optimised accuracy after changing the number of hidden layers, nodes, and other parameters using the grid search method. The dataset was divided into training and test sets with a ratio of 8:2. A fixed “random_state” was used to split the data into training and test sets. As the random state was chosen for data division for training and testing, the dataset for both had the combination of the literature and the experimental data. The algorithms were developed in Python using PyCharm as an integrated development environment. All the hyperparameter values for each algorithm were tuned using the grid search method [31]. Five-fold cross-validation was used during the grid search method to generalise the prediction capability of the models; five-fold cross-validation improved the efficiency slightly when compared to two-fold and ten-fold cross-validation. The tuned hyperparameter values for all the models are presented in the supplementary file (from Tables S1–S9). The performance of the ML models was evaluated with the following three parameters: 1. Pearson correlation coefficient (PCC, Equation (1)), 2. mean absolute error (MAE, Equation (2)), and 3. root mean square error (RMSE, Equation (3)).
Here, is the actual value of porosity, is the predicted value of porosity by ML algorithms, is the average value of the available porosity values, and is the total number of data points, which was 35 in this work. To obtain the best predictions from the algorithms, value should be higher whilst and values should be lower.
3. Results and Discussion
3.1. Performance of All Models
The PCC, MAE, and RMSE values obtained from all the ML models are plotted in Figure 2. The PCC values for all the models increased in the following sequence: SVR_poly < ANN < SVR_rbf < GBOOST < XGBOOST = DT < RF < LR < SVR_lin. The MAE values decreased in the following sequence: SVR_poly > ANN > GBOOST > SVR_rbf > RF = LR > SVR_lin > XGBOOST > DT, whilst the RMSE values decreased as: SVR_poly > ANN > SVR_rbf > GBOOST > RF > XGBOOST = DT > SVR_lin > LR. It is clear from the above sequences that the non-linear SVR models did not perform well on the given dataset—they were among the least-performing models, based on the PCC and RMSE values. ANN model was also among the least-performing models. It was reported that the ANN model performed well for large datasets [32], hence, because of the smaller dataset, the ANN model did not perform better than other ML models, except for SVR_poly. There was no consensus in the PCC, MAE, and RMSE values for the top-performing model. However, the above-mentioned sequences suggested that the top five models were: 1. SVR_lin, 2. LR, 3. RF, 4. DT, and 5. XGBOOST.
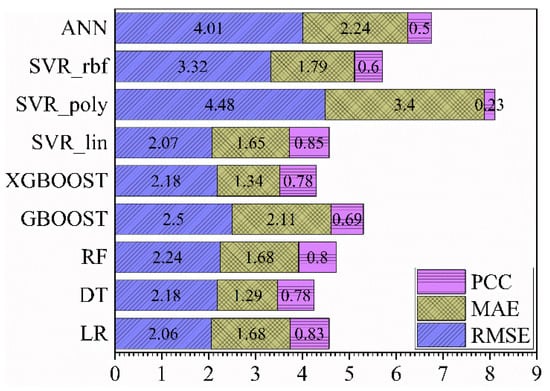
Figure 2.
The Pearson correlation coefficient (PCC), mean absolute error (MAE), and root mean square error (RMSE) values for all the employed ML models: LR, DT, RF, GBOOST, XGBOOST, SVR_lin, SVR_poly, SVR_rbf, and ANN.
It is important to highlight the advantages and disadvantages of the models used in this work to better understand the outcomes of the models. The LR model is useful when it is clear that there is a linear relationship between the independent and the dependent variables; this model is quite simple and easy to interpret. However, this model comes with an assumption that there is a linearity between the variables, making it disadvantageous where the data might not have linearity. This model is also prone to outliers, noise, and overfitting. The DT model is also simple and easy to understand, and does not require a lot of data preparation. In addition, it can handle the numerical as well as the categorical data. However, the trees can be highly non-robust, and a little change in the training data might lead to a bigger change in the predictions. In addition, the over-complex tree might lead to generalisation issues. The RF model reduces overfitting in decision trees and helps to improve accuracy. It is quite versatile and can be used for regression and classification tasks. However, the complexity of the trees, in comparison to trees in DT, makes it a little bit hard to interpret, leading to a longer training time. The GBOOST model often provides better accuracy. This model is found to be flexible as it provides several hyperparameter tuning options and can be optimised on different loss functions. No preprocessing of the data is needed for this model, however, the computation can be highly expensive and time-consuming. This model has been found to increase the complexity of the classification problems. Most of the advantages and disadvantages of the XGBOOST model are the same as for the GBOOST model, however, XGBOOST has higher performance than GBOOST, and the training period is lower than that of GBOOST. The SVM models are useful when we are unaware of the nature of the data, as they work well with the unstructured as well as the structured data. The risk of overfitting is lower in the SVM models, however, choosing the best Kernel function is not easy. It takes a longer time to train these models and sometimes becomes difficult to interpret the final model and the individual parameter impact. The ANN model is generally efficient when there is a large dataset available for training. These models can provide a deeper relationship between the input and the output variables; hence, enhancing the accuracy of the model. However, a smaller dataset reduces the accuracy.
The actual and the predicted values of porosity for the LR, DT, RF, XGBOOST, and SVR_lin models are plotted in Figure 3. The actual and the predicted values of porosity for GBOOST, SVR_poly, SVR_rbf, and ANN models are plotted in Figure 4. The 40% prediction band on the fitted line is also shown in all the plots. The number of outliers to the 40% prediction band were found to be 1, 1, 2, 2, 2, 2, 3, 3, and 4 for XGBOOST, RF, LR, DT, SVR_lin, ANN, SVR_poly, SVR_rbf, and GBOOST, respectively. This observation was in line with the top five models as understood from Figure 2. However, the ANN model also showed a better fit here.
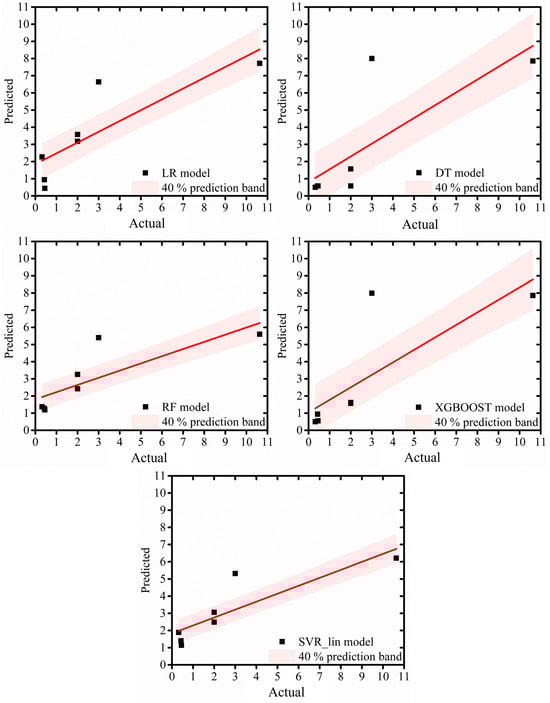
Figure 3.
The actual and the predicted values of porosity for the LR, DT, RF, XGBOOST, and SVR_lin models. The 40% prediction band on the fitted line is also shown in all the plots.
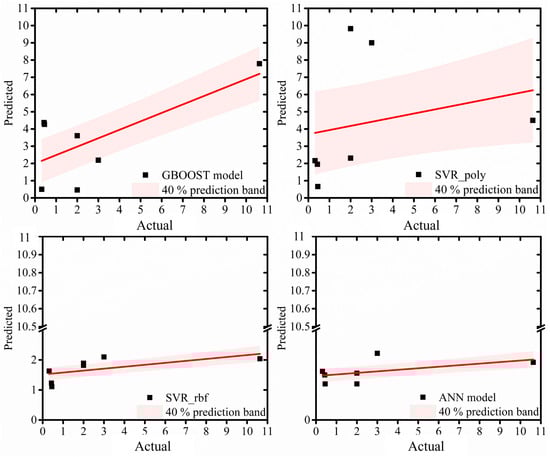
Figure 4.
The actual and the predicted values of porosity for the GBOOST, SVR_poly, SVR_rbf, and ANN models. The 40% prediction band on the fitted line is also shown in all the plots.
3.2. Hierarchical Impact of Input Features
To further optimise the ML algorithms, the SHapley Additive exPlanations (SHAP) method [33] was used to downselect the most important input features. The SHAP method was performed for the top five models and the obtained results are shown in Figure 5. In the SHAP analysis, each data point of an input feature was assigned with a SHAP value. The higher the magnitude of the SHAP value for the input feature, the higher its importance. It can be seen in Figure 5 that the type of gas (G) and the type of powder (Pdr) were found to be the top two input features, meaning that they contributed the most to the formation of porosity during CS deposition. The sequence for the importance of the remaining input features for LR, DT, RF, XGBOOST, and SVR_lin models was: T > D > P, D > T > P, D > P > T, D > T > P, and T > P > D, respectively. Here T, D, and P refer to temperature, stand-off distance, and pressure, respectively.
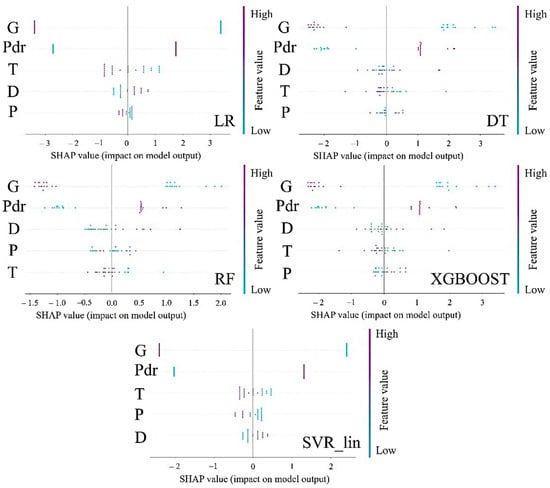
Figure 5.
The figure showcases the hierarchical importance of the input features obtained from the SHAP method for the top five models: LR, DT, RF, XGBOOST, and SVR_lin. The hierarchical importance indicates which factor contributes the most to the formation of porosity during cold spray deposition of the Cantor alloy.
Because the dominance in the importance level was for the type of gas (G) and the type of powder (Pdr) input features and the dataset only had two types of values for these features, to check for bias in the data, data from only three input features (gas temperature, gas pressure, and stand-off distance) were passed through all the ML models. The PCC, MAE, and RMSE worsened when compared to the models with five input features. These values are presented in Table 2. This suggested that the type of gas and the type of powder did have an impact on the porosity formation. It has been reported that it is the particle velocity that predominantly controls the deposition characteristics [34]. The lighter gas will impart higher velocity to the particles during the nozzle travel and hence, will reduce the coating porosity [35]. The MA powder has irregular morphology which leads to higher particle velocity through a heightened drag effect. This irregular shape accelerates particles more effectively than the spherical powders, resulting in denser coatings [9].
Table 2.
The Pearson correlation coefficient (PCC), mean absolute error (MAE), and root mean square error (RMSE) values for all the employed ML models: LR, DT, RF, GBOOST, XGBOOST, SVR_lin, SVR_poly, SVR_rbf, and ANN, with only three input features (gas temperature, gas pressure, and stand-off distance).
Apart from the type of gas and the type of powder as the top two input features, gas temperature, and stand-off distance can be considered to be the next two important features, although a consensus was hard to see from Figure 5. However, of the top five models, three models (DT, RF, and XGBOOST) showed that the stand-off distance (D) was the third most important input feature, whilst LR and SVR_lin models showcased that the temperature (T) was the third most important input feature. Pressure (P) was ranked in fifth position by three models (LR, DT, and XGBOOST). It has been seen that the increase in the temperature will lead to the expansion of the gas in the nozzle leading to an increase in the gas velocity [35]. An increase in pressure will lead to an increase in the acceleration of the particles during their travel through the nozzle [35]. However, it has been reported that temperature has more impact on the particle velocity than the pressure [36]. The critical standoff distance also affects the particle velocity, e.g., helium will create a lower drag force on the particles compared to nitrogen or air at a given velocity, hence, the stand-off distance will be greater for helium [37]. Therefore, based on the above understanding, the data for the top four input features (type of gas, type of powder, stand-off distance, and gas temperature) were passed through the top five models.
3.3. Performance of Top Five Models with Top Four Input Features
The PCC, MAE, and RMSE values after this are shown in Figure 6. The PCC values increased in the following sequence: RF < XGBOOST = DT < SVR_lin = LR. The MAE values decreased in the following sequence: LR = RF > SVR_lin > XGBOOST > DT, whilst the RMSE values decreased as: RF > XGBOOST = DT > LR = SVR_lin. There was no clear agreement between all the evaluation parameters, however, if PCC and RMSE values were compared then it can be said that SVR_lin and LR models performed the best with the top four input parameters. On a closer look, it was observed that the PCC values for LR, RF, and SVR_lin models, with the top four input features, decreased when compared to the PCC values with five input features (Figure 2). The PCC values remained the same for the DT and the XGBOOST models. The MAE and RMSE values increased for LR and RF models when compared to the outputs with five input features, whilst these values decreased slightly for the XGBOOST model. The MAE value decreased slightly for the SVR_lin model, whilst the RMSE value increased for the SVR_lin model. The MAE values remained the same for the DT model, but the RMSE value decreased very slightly for the DT model. These observations suggested that all five input features were important for porosity control. However, it will be interesting to see the experimental results for the hierarchical impact of these features on porosity formation. This was not within the scope of the current work.
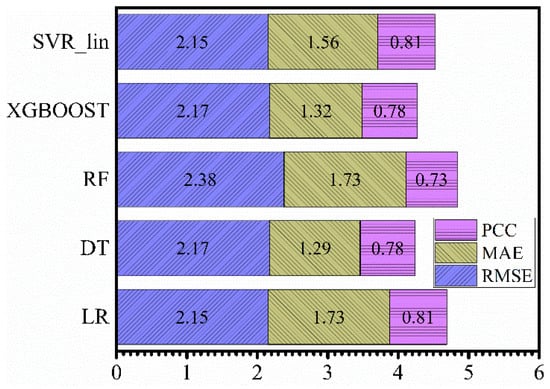
Figure 6.
The Pearson correlation coefficient (PCC), mean absolute error (MAE), and root mean square error (RMSE) values for the top five ML models: LR, DT, RF, XGBOOST, and SVR_lin.
3.4. Best Models
All five input features were important for controlling the formation of porosity during CS deposition of Cantor alloy. Therefore, from Figure 2, it can be stated that SVR_lin and LR models were the best-performing ML models, based on the PCC (0.85 and 0.83 for SVR_lin and LR models, respectively) and RMSE values (2.07 and 2.06 for SVR_lin and LR models, respectively). The accuracy of the models is also dependent on the number of data points [38]. In addition, there are other CS process parameters, such as the gun traverse speed and the track spacing or increment that influence the formation of porosity [39]. Therefore, the accuracy of the current models can be further improved by analysing more data points and by incorporating other input features. Although limited data points were available for the current work, the top two models, i.e., SVR_lin and LR models performed reasonably well, with the PCC values > 0.8.
4. Conclusions
Nine machine learning models, such as linear regression (LR), decision trees, random forests, gradient boosting, support vector machine (SVM), and neural networks, were explored to predict the formation of porosity during cold spray deposition of Cantor alloy. Among the nine machine learning models examined, SVM with linear kernel and LR models demonstrated reasonable performance, boasting PCC values exceeding 0.8. All the input features, namely: type of gas, type of powder, gas temperature, stand-off distance, and gas pressure proved crucial for minimising porosity. The SHapley Additive exPlanations analysis highlighted the hierarchical influence of gas type and power as the top factors contributing significantly to porosity formation during the deposition of Cantor alloy via the cold spray process. This underscored the importance of these key input features in optimising the process and minimising porosity in coatings.
Supplementary Materials
The following supporting information can be downloaded at: https://www.mdpi.com/article/10.3390/coatings14040404/s1, Table S1: the tuned coefficients and intercept values were obtained from the linear regression model; Table S2: the tuned hyperparameter values for the decision trees model; Table S3: the tuned hyperparameter values for the random forests model; Table S4: the tuned hyperparameter values for the GBOOST model; Table S5: the tuned hyperparameter values for the XGBOOST model; Table S6: the tuned hyperparameter values for the SVR_lin model; Table S7: the tuned hyperparameter values for the SVR_poly model; Table S8: the tuned hyperparameter values for the SVR_rbf model; Table S9: the tuned hyperparameter values for the ANN model.
Author Contributions
Conceptualization, D.S. and S.P.; methodology, D.S.; formal analysis, D.S.; investigation, D.B.; data curation, D.S., A.A.B. and A.A.; writing—original draft preparation, D.S.; writing—review and editing, S.P., D.B., A.A.B. and A.A.; supervision, S.P.; funding acquisition, S.P. All authors have read and agreed to the published version of the manuscript.
Funding
This research has received funding from the European Union’s Horizon 2020 research and innovation programme under grant agreement No. 958457.
Institutional Review Board Statement
Not applicable.
Informed Consent Statement
Not applicable.
Data Availability Statement
The data presented in this study are available on request from the corresponding author.
Acknowledgments
D.S. is grateful to Zihui Dong, a Visiting Fellow at the University of Leicester, for the detailed discussion on the machine learning models. The authors would also like to thank the FORGE consortium for its support.
Conflicts of Interest
Author Dibakor Boruah was employed by the company Materials Performance and Integrity Technology Group, TWI Ltd. The remaining authors declare that the research was conducted in the absence of any commercial or financial relationships that could be construed as a potential conflict of interest.
References
- Assadi, H.; Kreye, H.; Gärtner, F.; Klassen, T. Cold spraying—A materials perspective. Acta Mater. 2016, 116, 382–407. [Google Scholar] [CrossRef]
- Tam, J.; Yu, B.; Li, W.; Poirier, D.; Legoux, J.G.; Giallonardo, J.D.; Howe, J.; Erb, U. The effect of annealing on trapped copper oxides in particle-particle interfaces of cold-sprayed Cu coatings. Scr. Mater. 2022, 208, 114333. [Google Scholar] [CrossRef]
- Zou, Y. Cold Spray Additive Manufacturing: Microstructure Evolution and Bonding Features. Acc. Mater. Res. 2021, 2, 1071–1081. [Google Scholar] [CrossRef]
- Poza, P.; Garrido-Maneiro, M.Á. Cold-sprayed coatings: Microstructure, mechanical properties, and wear behaviour. Prog. Mater. Sci. 2022, 123, 100839. [Google Scholar] [CrossRef]
- Hassani-Gangaraj, M.; Veysset, D.; Champagne, V.K.; Nelson, K.A.; Schuh, C.A. Adiabatic shear instability is not necessary for adhesion in cold spray. Acta Mater. 2018, 158, 430–439. [Google Scholar] [CrossRef]
- Weiller, S.; Delloro, F. A numerical study of pore formation mechanisms in aluminium cold spray coatings. Addit. Manuf. 2022, 60, 103193. [Google Scholar] [CrossRef]
- Oladijo, O.P.; Obadele, B.A.; Venter, A.M.; Cornish, L.A. Investigating the Effect of Porosity on Corrosion Resistance and Hardness of WC-Co Coatings on Metal Substrates. Afr. Corros. J. 2016, 2, 37–44. [Google Scholar]
- Alonso, L.; Poza, P. A study of the parameters affecting the particle velocity in cold-spray: Theoretical results and comparison with experimental data. Addit. Manuf. 2023, 67, 103479. [Google Scholar] [CrossRef]
- Satish, V.; Johnson, K.W.; Ozdemir, O.C.; Crawford, G.A. Influence of feedstock powder and cold spray processing parameters on microstructure and mechanical properties of Ti-6Al-4V cold spray depositions. Surf. Coat. Technol. 2018, 335, 1–12. [Google Scholar]
- Miracle, D.B.; Senkov, O.N. A critical review of high entropy alloys and related concepts. Acta Mater. 2017, 122, 448–511. [Google Scholar] [CrossRef]
- Zeng, Z.; Xiang, M.; Zhang, D.; Shi, J.; Wang, W.; Tang, X.; Tang, W.; Wang, Y.; Ma, X.; Chen, Z.; et al. Mechanical properties of Cantor alloys driven by additional elements: A review. J. Mater. Res. Technol. 2021, 15, 1920–1934. [Google Scholar] [CrossRef]
- Chen, T.K.; Shun, T.T.; Yeh, J.W.; Wong, M.S. Nanostructured nitride films of multi-element high-entropy alloys by reactive DC sputtering. Surf. Coat. Technol. 2004, 188–189, 193–200. [Google Scholar] [CrossRef]
- Cantor, B.; Chang, I.T.H.; Knight, P.; Vincent, A.J.B. Microstructural development in equiatomic multicomponent alloys. Mater. Sci. Eng. A. 2004, 375–377, 213–218. [Google Scholar] [CrossRef]
- Akisin, C.J.; Dovgyy, B.; Bennett, C.J.; Pham, M.S.; Venturi, F.; Hussain, T. Microstructural Study of Cold-Sprayed CoCrFeNiMn High Entropy Alloy. J. Therm. Spray Technol. 2023, 32, 2539–2562. [Google Scholar] [CrossRef]
- Ahn, J.E.; Kim, Y.K.; Yoon, S.H.; Lee, K.A. Tuning the Microstructure and Mechanical Properties of Cold Sprayed Equiatomic CoCrFeMnNi High-Entropy Alloy Coating Layer. Met. Mater. Int. 2021, 27, 2406–2415. [Google Scholar] [CrossRef]
- Xu, Y.; Li, W.; Qu, L.; Yang, X.; Song, B.; Lupoi, R.; Yin, S. Solid-state cold spraying of FeCoCrNiMn high-entropy alloy: An insight into microstructure evolution and oxidation behavior at 700–900 °C. J. Mater. Sci. Technol. 2021, 68, 172–183. [Google Scholar] [CrossRef]
- Silvello, A.; Cavaliere, P.; Yin, S.; Lupoi, R.; Garcia Cano, I.; Dosta, S. Microstructural, Mechanical and Wear Behavior of HVOF and Cold-Sprayed High-Entropy Alloys (HEAs) Coatings. J. Therm. Spray Technol. 2022, 31, 1184–1206. [Google Scholar] [CrossRef]
- Cavaliere, P.; Perrone, A.; Silvello, A.; Laska, A.; Blasi, G.; Cano, I.G. Fatigue Bending of V-Notched Cold-Sprayed FeCoCrNiMn Coatings. Metals 2022, 12, 780. [Google Scholar] [CrossRef]
- Feng, S.; Guan, S.; Story, W.A.; Ren, J.; Zhang, S.; Te, A.; Gleason, M.A.; Heelan, J.; Walde, C.; Birt, A.; et al. Cold Spray Additive Manufacturing of CoCrFeNiMn High-Entropy Alloy: Process Development, Microstructure, and Mechanical Properties. J. Therm. Spray Technol. 2022, 31, 1222–1231. [Google Scholar] [CrossRef]
- Wu, D.; Xu, Y.; Li, W.; Yang, Y.; Liu, K.; Wan, W.; Qi, Z. Process optimisation of cold spray additive manufacturing of FeCoNiCrMn high-entropy alloy. Sci. Technol. Weld. Join. 2023, 8, 540–547. [Google Scholar] [CrossRef]
- Yang, C.; Ren, C.; Jia, Y.; Wang, G.; Li, M.; Lu, W. A machine learning-based alloy design system to facilitate the rational design of high entropy alloys with enhanced hardness. Acta Mater. 2022, 222, 117431. [Google Scholar] [CrossRef]
- Sai, N.J.; Rathore, P.; Chauhan, A. Machine learning-based predictions of fatigue life for multi-principal element alloys. Scr. Mater. 2023, 226, 115214. [Google Scholar] [CrossRef]
- Wieczerzak, K.; Groetsch, A.; Pajor, K.; Jain, M.; Müller, A.M.; Vockenhuber, C.; Schwiedrzik, J.; Sharma, A.; Klimashin, F.F.; Michler, J. Unlocking the potential of CuAgZr metallic glasses: A comprehensive exploration with combinatorial synthesis, high-throughput characterization, and machine learning. Adv. Sci. 2023, 10, 2302997. [Google Scholar] [CrossRef] [PubMed]
- Chollet, F. Deep Learning with Python; Manning Shelter Island: New York, NY, USA, 2021. [Google Scholar]
- Roy, S.; Ravi, K. A Machine Learning Based Approach for Cold Spray Deposition Porosity Prediction from Processing Parameters. In Proceedings of the Thermal Spray 2022: Proceedings from the International Thermal Spray Conference, Vienna, Austria, 4–6 May 2022; pp. 961–976. [Google Scholar]
- Liu, M.; Yu, Z.; Zhang, Y.; Wu, H.; Liao, H.; Deng, S. Prediction and analysis of high velocity oxy fuel (HVOF) sprayed coating using artificial neural network. Surf. Coat. Technol. 2019, 378, 124988. [Google Scholar] [CrossRef]
- Fukumoto, M.; Wada, Y.; Umemoto, M.; Okane, I. Effect of connected pores on the corrosion behavior of plasma sprayed alumina coatings. Surf. Coat. Technol. 1989, 39–40, 711–720. [Google Scholar] [CrossRef]
- Hansson, C.M. The impact of corrosion on society. Metall. Mater. Trans. A 2011, 42, 2952–2962. [Google Scholar] [CrossRef]
- Gallagher, J. The importance of being porous. Nat. Energy 2019, 4, 630. [Google Scholar] [CrossRef]
- Schneider, C.A.; Rasband, W.S.; Eliceiri, K.W. Historical commentary NIH Image to ImageJ: 25 years of image analysis. Nat. Methods 2012, 9, 671–675. [Google Scholar] [CrossRef] [PubMed]
- Muller, A.C.; Guido, S. Introduction to Machine Learning with Python: A Guide for Data Scientists; O’Reilly Media: Sebastopol, CA, USA, 2016. [Google Scholar]
- Sarker, I.H. Deep Learning: A Comprehensive Overview on Techniques, Taxonomy, Applications and Research Directions. SN Comput. Sci. 2021, 2, 420. [Google Scholar] [CrossRef]
- Gramegna, A.; Giudici, P. SHAP and LIME: An Evaluation of Discriminative Power in Credit Risk. Front. Artif. Intell. 2021, 4, 752558. [Google Scholar] [CrossRef]
- Silvello, A.; Cavaliere, P.D.; Albaladejo, V.; Martos, A.; Dosta, S.; Cano, I.G. Powder properties and processing conditions affecting cold spray deposition. Coatings 2020, 10, 91. [Google Scholar] [CrossRef]
- Villafuerte, J. Modern Cold Spray Materials, Process, and Applications; Springer: Cham, Switzerland, 2020. [Google Scholar]
- Zahiri, S.H.; Fraser, D.; Gulizia, S.; Jahedi, M. Effect of processing conditions on porosity formation in cold gas dynamic spraying of copper. J. Therm. Spray Technol. 2006, 15, 422–430. [Google Scholar] [CrossRef]
- Gilmore, D.L.; Dykhuizen, R.C.; Neiser, R.A.; Roemer, T.J.; Smith, M.F. Particle velocity and deposition efficiency in the cold spray process. J. Therm. Spray Technol. 1999, 8, 576–582. [Google Scholar] [CrossRef]
- Zhan, Z.; Li, H. Machine learning based fatigue life prediction with effects of additive manufacturing process parameters for printed SS 316L. Int. J. Fatigue 2021, 142, 105941. [Google Scholar] [CrossRef]
- Tan, A.W.Y.; Sun, W.; Phang, Y.P.; Dai, M.; Marinescu, I.; Dong, Z.; Liu, E. Effects of traverse scanning speed of spray nozzle on the microstructure and mechanical properties of cold-sprayed Ti6Al4V coatings. J. Therm. Spray Technol. 2017, 26, 1484–1497. [Google Scholar] [CrossRef]
Disclaimer/Publisher’s Note: The statements, opinions and data contained in all publications are solely those of the individual author(s) and contributor(s) and not of MDPI and/or the editor(s). MDPI and/or the editor(s) disclaim responsibility for any injury to people or property resulting from any ideas, methods, instructions or products referred to in the content. |
© 2024 by the authors. Licensee MDPI, Basel, Switzerland. This article is an open access article distributed under the terms and conditions of the Creative Commons Attribution (CC BY) license (https://creativecommons.org/licenses/by/4.0/).